Zip Codes with the Highest Percentage of Population Employed in Cleaning & Maintenance in Connecticut
RELATED REPORTS & OPTIONS
Cleaning & Maintenance
Connecticut
Compare Zip Codes
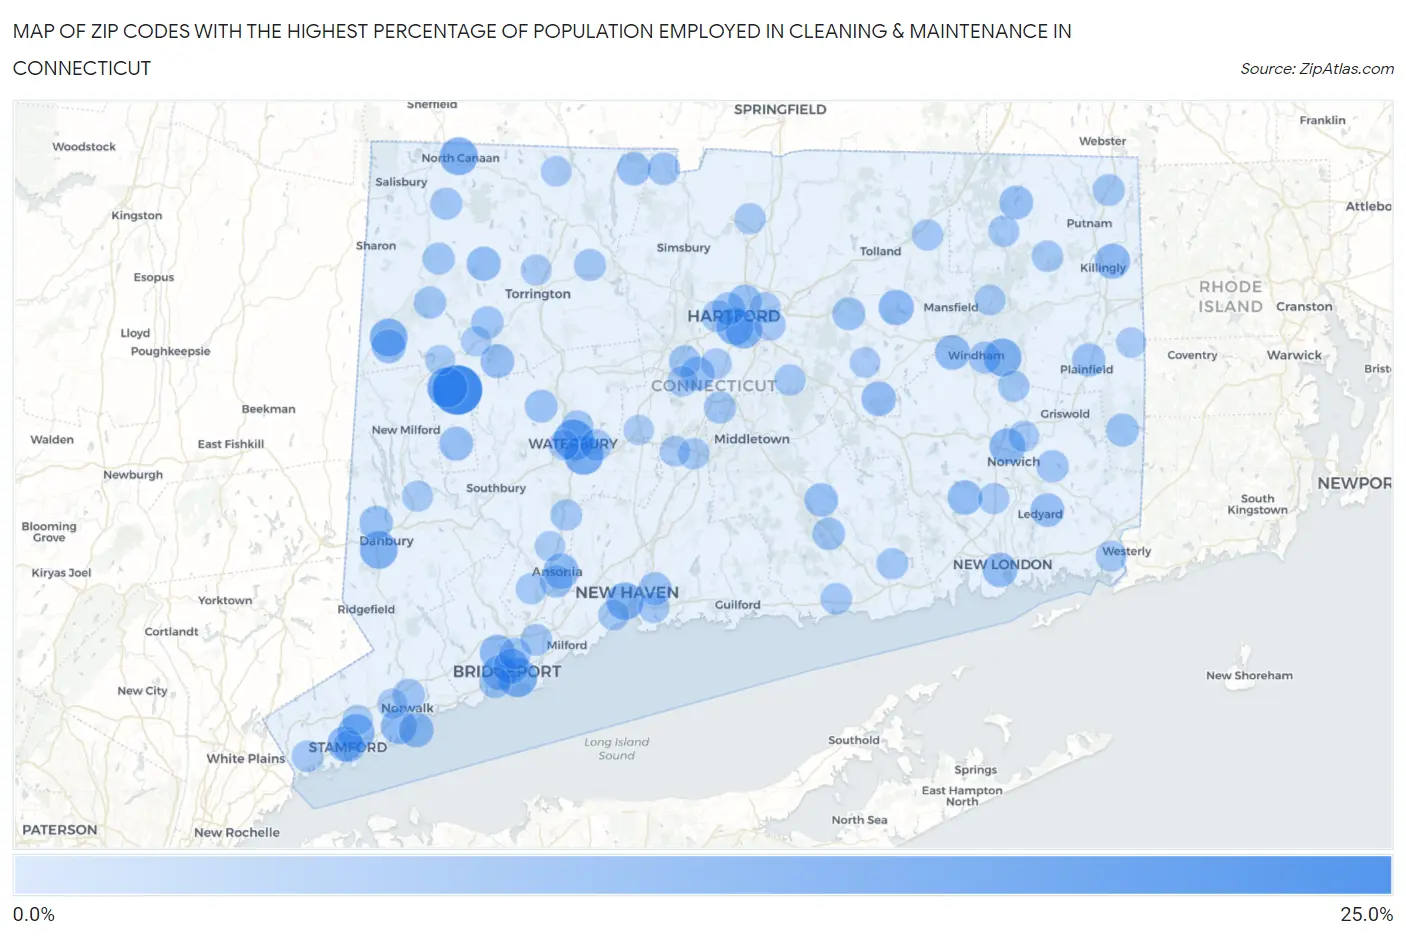
Map of Zip Codes with the Highest Percentage of Population Employed in Cleaning & Maintenance in Connecticut
0.0%
25.0%
Zip Codes with the Highest Percentage of Population Employed in Cleaning & Maintenance in Connecticut
| Zip Code | % Employed | vs State | vs National | |
| 1. | 06793 | 20.1% | 3.5%(+16.6)#1 | 3.5%(+16.7)#398 |
| 2. | 06702 | 12.3% | 3.5%(+8.77)#2 | 3.5%(+8.83)#1,140 |
| 3. | 06794 | 12.1% | 3.5%(+8.55)#3 | 3.5%(+8.60)#1,185 |
| 4. | 06706 | 11.3% | 3.5%(+7.75)#4 | 3.5%(+7.81)#1,399 |
| 5. | 06607 | 11.1% | 3.5%(+7.51)#5 | 3.5%(+7.57)#1,471 |
| 6. | 06018 | 9.9% | 3.5%(+6.37)#6 | 3.5%(+6.43)#1,843 |
| 7. | 06264 | 9.9% | 3.5%(+6.35)#7 | 3.5%(+6.41)#1,856 |
| 8. | 06757 | 9.8% | 3.5%(+6.24)#8 | 3.5%(+6.30)#1,913 |
| 9. | 06810 | 9.7% | 3.5%(+6.20)#9 | 3.5%(+6.25)#1,934 |
| 10. | 06519 | 9.5% | 3.5%(+5.96)#10 | 3.5%(+6.02)#2,045 |
| 11. | 06106 | 9.4% | 3.5%(+5.84)#11 | 3.5%(+5.90)#2,098 |
| 12. | 06114 | 9.1% | 3.5%(+5.54)#12 | 3.5%(+5.60)#2,255 |
| 13. | 06906 | 9.0% | 3.5%(+5.45)#13 | 3.5%(+5.50)#2,308 |
| 14. | 06360 | 8.2% | 3.5%(+4.64)#14 | 3.5%(+4.70)#2,880 |
| 15. | 06854 | 8.2% | 3.5%(+4.64)#15 | 3.5%(+4.70)#2,883 |
| 16. | 06606 | 7.7% | 3.5%(+4.20)#16 | 3.5%(+4.26)#3,280 |
| 17. | 06604 | 7.7% | 3.5%(+4.17)#17 | 3.5%(+4.23)#3,316 |
| 18. | 06238 | 7.7% | 3.5%(+4.14)#18 | 3.5%(+4.20)#3,340 |
| 19. | 06401 | 7.7% | 3.5%(+4.14)#19 | 3.5%(+4.20)#3,342 |
| 20. | 06608 | 7.6% | 3.5%(+4.10)#20 | 3.5%(+4.16)#3,385 |
| 21. | 06902 | 7.6% | 3.5%(+4.08)#21 | 3.5%(+4.14)#3,413 |
| 22. | 06241 | 7.6% | 3.5%(+4.01)#22 | 3.5%(+4.07)#3,483 |
| 23. | 06226 | 7.2% | 3.5%(+3.69)#23 | 3.5%(+3.75)#3,819 |
| 24. | 06855 | 7.2% | 3.5%(+3.68)#24 | 3.5%(+3.74)#3,828 |
| 25. | 06320 | 7.1% | 3.5%(+3.57)#25 | 3.5%(+3.63)#3,949 |
| 26. | 06231 | 7.0% | 3.5%(+3.42)#26 | 3.5%(+3.48)#4,113 |
| 27. | 06370 | 6.9% | 3.5%(+3.40)#27 | 3.5%(+3.46)#4,133 |
| 28. | 06756 | 6.6% | 3.5%(+3.10)#28 | 3.5%(+3.16)#4,571 |
| 29. | 06785 | 6.5% | 3.5%(+3.00)#29 | 3.5%(+3.06)#4,700 |
| 30. | 06783 | 6.5% | 3.5%(+2.92)#30 | 3.5%(+2.98)#4,839 |
| 31. | 06051 | 6.4% | 3.5%(+2.89)#31 | 3.5%(+2.95)#4,880 |
| 32. | 06282 | 6.4% | 3.5%(+2.88)#32 | 3.5%(+2.93)#4,909 |
| 33. | 06763 | 6.4% | 3.5%(+2.85)#33 | 3.5%(+2.91)#4,950 |
| 34. | 06339 | 6.3% | 3.5%(+2.78)#34 | 3.5%(+2.84)#5,070 |
| 35. | 06438 | 6.2% | 3.5%(+2.62)#35 | 3.5%(+2.68)#5,346 |
| 36. | 06120 | 6.1% | 3.5%(+2.52)#36 | 3.5%(+2.58)#5,538 |
| 37. | 06374 | 6.0% | 3.5%(+2.45)#37 | 3.5%(+2.50)#5,670 |
| 38. | 06811 | 6.0% | 3.5%(+2.43)#38 | 3.5%(+2.48)#5,715 |
| 39. | 06027 | 5.9% | 3.5%(+2.38)#39 | 3.5%(+2.44)#5,806 |
| 40. | 06513 | 5.7% | 3.5%(+2.17)#40 | 3.5%(+2.23)#6,248 |
| 41. | 06043 | 5.7% | 3.5%(+2.16)#41 | 3.5%(+2.21)#6,271 |
| 42. | 06384 | 5.7% | 3.5%(+2.12)#42 | 3.5%(+2.18)#6,349 |
| 43. | 06105 | 5.6% | 3.5%(+2.11)#43 | 3.5%(+2.17)#6,376 |
| 44. | 06795 | 5.6% | 3.5%(+2.03)#44 | 3.5%(+2.08)#6,549 |
| 45. | 06060 | 5.4% | 3.5%(+1.83)#45 | 3.5%(+1.89)#7,003 |
| 46. | 06418 | 5.4% | 3.5%(+1.81)#46 | 3.5%(+1.87)#7,042 |
| 47. | 06851 | 5.2% | 3.5%(+1.67)#47 | 3.5%(+1.73)#7,348 |
| 48. | 06412 | 5.2% | 3.5%(+1.64)#48 | 3.5%(+1.70)#7,435 |
| 49. | 06365 | 5.2% | 3.5%(+1.61)#49 | 3.5%(+1.67)#7,537 |
| 50. | 06759 | 5.1% | 3.5%(+1.60)#50 | 3.5%(+1.66)#7,554 |
| 51. | 06754 | 5.1% | 3.5%(+1.52)#51 | 3.5%(+1.58)#7,795 |
| 52. | 06023 | 5.0% | 3.5%(+1.46)#52 | 3.5%(+1.52)#7,974 |
| 53. | 06901 | 4.9% | 3.5%(+1.36)#53 | 3.5%(+1.42)#8,212 |
| 54. | 06031 | 4.9% | 3.5%(+1.36)#54 | 3.5%(+1.42)#8,234 |
| 55. | 06796 | 4.9% | 3.5%(+1.35)#55 | 3.5%(+1.41)#8,269 |
| 56. | 06280 | 4.9% | 3.5%(+1.31)#56 | 3.5%(+1.37)#8,371 |
| 57. | 06057 | 4.8% | 3.5%(+1.30)#57 | 3.5%(+1.35)#8,411 |
| 58. | 06119 | 4.8% | 3.5%(+1.29)#58 | 3.5%(+1.34)#8,438 |
| 59. | 06277 | 4.8% | 3.5%(+1.25)#59 | 3.5%(+1.31)#8,551 |
| 60. | 06610 | 4.8% | 3.5%(+1.24)#60 | 3.5%(+1.30)#8,557 |
| 61. | 06704 | 4.7% | 3.5%(+1.18)#61 | 3.5%(+1.24)#8,760 |
| 62. | 06614 | 4.7% | 3.5%(+1.14)#62 | 3.5%(+1.20)#8,871 |
| 63. | 06705 | 4.6% | 3.5%(+1.08)#63 | 3.5%(+1.14)#9,075 |
| 64. | 06605 | 4.6% | 3.5%(+1.04)#64 | 3.5%(+1.09)#9,220 |
| 65. | 06053 | 4.6% | 3.5%(+1.03)#65 | 3.5%(+1.09)#9,244 |
| 66. | 06498 | 4.5% | 3.5%(+0.958)#66 | 3.5%(+1.02)#9,505 |
| 67. | 06830 | 4.5% | 3.5%(+0.948)#67 | 3.5%(+1.01)#9,532 |
| 68. | 06259 | 4.4% | 3.5%(+0.881)#68 | 3.5%(+0.939)#9,741 |
| 69. | 06118 | 4.4% | 3.5%(+0.840)#69 | 3.5%(+0.898)#9,881 |
| 70. | 06073 | 4.4% | 3.5%(+0.811)#70 | 3.5%(+0.870)#9,987 |
| 71. | 06403 | 4.3% | 3.5%(+0.798)#71 | 3.5%(+0.856)#10,049 |
| 72. | 06330 | 4.3% | 3.5%(+0.721)#72 | 3.5%(+0.779)#10,310 |
| 73. | 06371 | 4.3% | 3.5%(+0.721)#73 | 3.5%(+0.779)#10,313 |
| 74. | 06450 | 4.2% | 3.5%(+0.672)#74 | 3.5%(+0.730)#10,499 |
| 75. | 06512 | 4.2% | 3.5%(+0.647)#75 | 3.5%(+0.705)#10,593 |
| 76. | 06279 | 4.2% | 3.5%(+0.640)#76 | 3.5%(+0.698)#10,619 |
| 77. | 06242 | 4.2% | 3.5%(+0.639)#77 | 3.5%(+0.697)#10,623 |
| 78. | 06096 | 4.1% | 3.5%(+0.582)#78 | 3.5%(+0.641)#10,854 |
| 79. | 06382 | 4.1% | 3.5%(+0.579)#79 | 3.5%(+0.637)#10,873 |
| 80. | 06108 | 4.1% | 3.5%(+0.548)#80 | 3.5%(+0.606)#10,987 |
| 81. | 06379 | 4.1% | 3.5%(+0.537)#81 | 3.5%(+0.595)#11,034 |
| 82. | 06804 | 4.0% | 3.5%(+0.490)#82 | 3.5%(+0.548)#11,225 |
| 83. | 06380 | 4.0% | 3.5%(+0.462)#83 | 3.5%(+0.521)#11,334 |
| 84. | 06484 | 3.9% | 3.5%(+0.397)#84 | 3.5%(+0.455)#11,571 |
| 85. | 06235 | 3.9% | 3.5%(+0.350)#85 | 3.5%(+0.408)#11,757 |
| 86. | 06516 | 3.9% | 3.5%(+0.317)#86 | 3.5%(+0.375)#11,884 |
| 87. | 06790 | 3.8% | 3.5%(+0.290)#87 | 3.5%(+0.349)#12,013 |
| 88. | 06111 | 3.8% | 3.5%(+0.283)#88 | 3.5%(+0.342)#12,043 |
| 89. | 06451 | 3.8% | 3.5%(+0.227)#89 | 3.5%(+0.285)#12,298 |
| 90. | 06708 | 3.7% | 3.5%(+0.167)#90 | 3.5%(+0.225)#12,509 |
| 91. | 06052 | 3.7% | 3.5%(+0.140)#91 | 3.5%(+0.198)#12,641 |
| 92. | 06021 | 3.7% | 3.5%(+0.128)#92 | 3.5%(+0.186)#12,684 |
| 93. | 06248 | 3.6% | 3.5%(+0.022)#93 | 3.5%(+0.080)#13,163 |
| 94. | 06750 | 3.5% | 3.5%(-0.024)#94 | 3.5%(+0.034)#13,360 |
| 95. | 06907 | 3.5% | 3.5%(-0.046)#95 | 3.5%(+0.012)#13,456 |
| 96. | 06850 | 3.5% | 3.5%(-0.055)#96 | 3.5%(+0.003)#13,497 |
| 97. | 06483 | 3.5% | 3.5%(-0.063)#97 | 3.5%(-0.005)#13,537 |
| 98. | 06377 | 3.4% | 3.5%(-0.164)#98 | 3.5%(-0.106)#13,988 |
| 99. | 06479 | 3.4% | 3.5%(-0.183)#99 | 3.5%(-0.125)#14,082 |
| 100. | 06777 | 3.3% | 3.5%(-0.207)#100 | 3.5%(-0.149)#14,185 |
Common Questions
What are the Top 10 Zip Codes with the Highest Percentage of Population Employed in Cleaning & Maintenance in Connecticut?
Top 10 Zip Codes with the Highest Percentage of Population Employed in Cleaning & Maintenance in Connecticut are:
What zip code has the Highest Percentage of Population Employed in Cleaning & Maintenance in Connecticut?
06793 has the Highest Percentage of Population Employed in Cleaning & Maintenance in Connecticut with 20.1%.
What is the Percentage of Population Employed in Cleaning & Maintenance in the State of Connecticut?
Percentage of Population Employed in Cleaning & Maintenance in Connecticut is 3.5%.
What is the Percentage of Population Employed in Cleaning & Maintenance in the United States?
Percentage of Population Employed in Cleaning & Maintenance in the United States is 3.5%.