Zip Codes with the Highest Poverty Level Among Children Under the Age of 5 in Connecticut
RELATED REPORTS & OPTIONS
Highest Poverty | Child 0-5
Connecticut
Compare Zip Codes
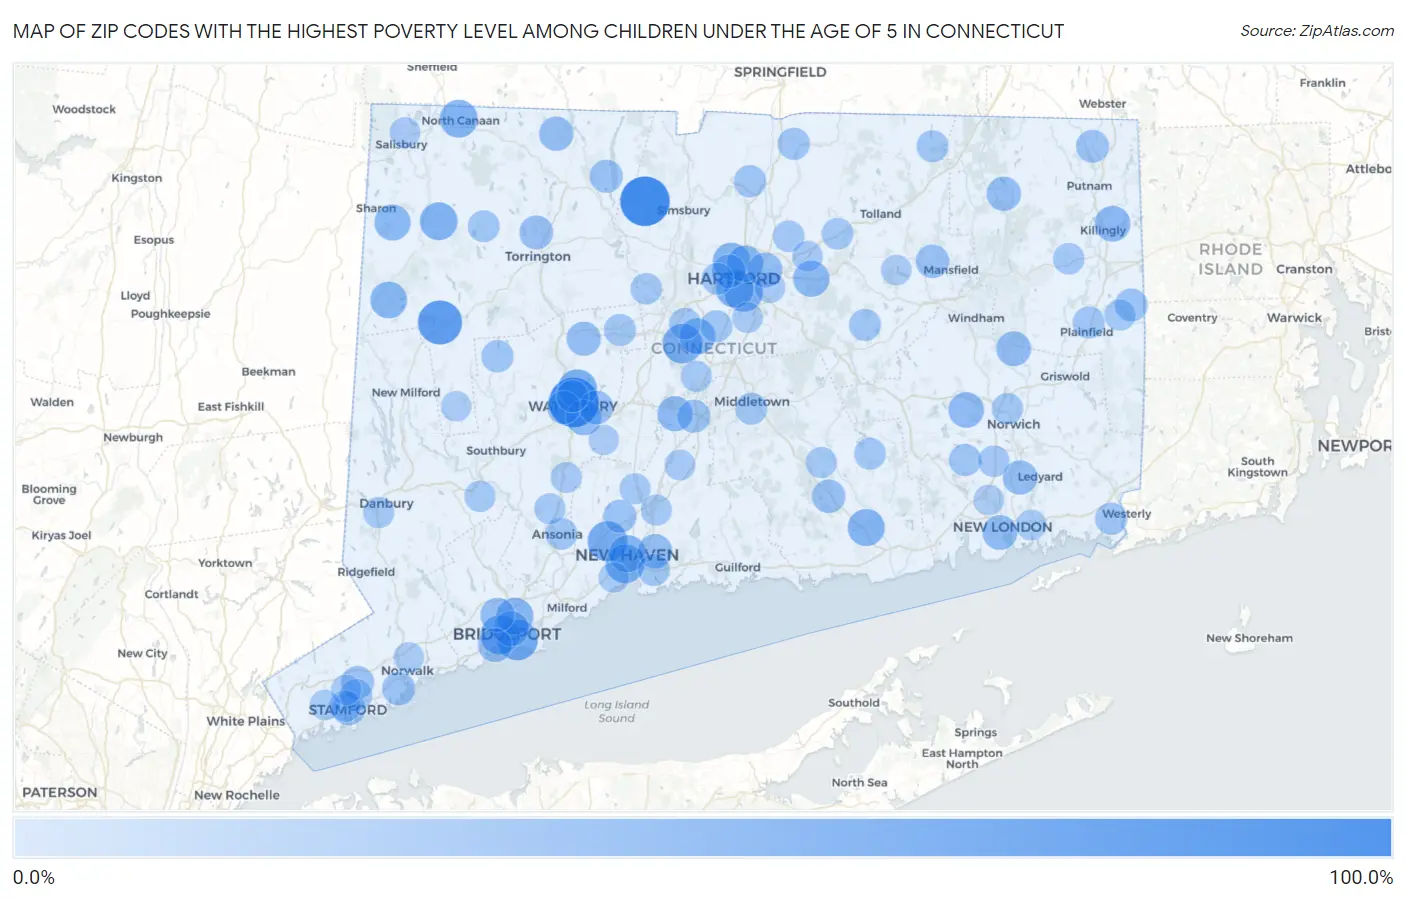
Map of Zip Codes with the Highest Poverty Level Among Children Under the Age of 5 in Connecticut
0.0%
100.0%
Zip Codes with the Highest Poverty Level Among Children Under the Age of 5 in Connecticut
| Zip Code | Child Poverty | vs State | vs National | |
| 1. | 06702 | 100.0% | 14.1%(+85.9)#1 | 18.1%(+81.9)#11 |
| 2. | 06059 | 100.0% | 14.1%(+85.9)#2 | 18.1%(+81.9)#387 |
| 3. | 06777 | 73.7% | 14.1%(+59.7)#3 | 18.1%(+55.7)#1,018 |
| 4. | 06607 | 57.1% | 14.1%(+43.0)#4 | 18.1%(+39.1)#1,897 |
| 5. | 06515 | 53.3% | 14.1%(+39.2)#5 | 18.1%(+35.2)#2,228 |
| 6. | 06052 | 52.5% | 14.1%(+38.4)#6 | 18.1%(+34.5)#2,296 |
| 7. | 06604 | 49.1% | 14.1%(+35.1)#7 | 18.1%(+31.1)#2,677 |
| 8. | 06704 | 48.7% | 14.1%(+34.6)#8 | 18.1%(+30.6)#2,732 |
| 9. | 06519 | 48.3% | 14.1%(+34.3)#9 | 18.1%(+30.3)#2,776 |
| 10. | 06114 | 46.4% | 14.1%(+32.3)#10 | 18.1%(+28.3)#2,991 |
| 11. | 06106 | 44.5% | 14.1%(+30.4)#11 | 18.1%(+26.4)#3,248 |
| 12. | 06018 | 44.2% | 14.1%(+30.1)#12 | 18.1%(+26.1)#3,310 |
| 13. | 06796 | 42.9% | 14.1%(+28.8)#13 | 18.1%(+24.8)#3,509 |
| 14. | 06511 | 40.0% | 14.1%(+25.9)#14 | 18.1%(+21.9)#4,046 |
| 15. | 06426 | 39.9% | 14.1%(+25.8)#15 | 18.1%(+21.8)#4,055 |
| 16. | 06112 | 39.7% | 14.1%(+25.6)#16 | 18.1%(+21.6)#4,087 |
| 17. | 06610 | 39.2% | 14.1%(+25.1)#17 | 18.1%(+21.1)#4,177 |
| 18. | 06757 | 38.4% | 14.1%(+24.3)#18 | 18.1%(+20.3)#4,335 |
| 19. | 06120 | 37.5% | 14.1%(+23.4)#19 | 18.1%(+19.5)#4,485 |
| 20. | 06040 | 35.9% | 14.1%(+21.8)#20 | 18.1%(+17.8)#4,846 |
| 21. | 06069 | 35.4% | 14.1%(+21.4)#21 | 18.1%(+17.4)#4,966 |
| 22. | 06051 | 35.0% | 14.1%(+20.9)#22 | 18.1%(+17.0)#5,056 |
| 23. | 06241 | 33.8% | 14.1%(+19.7)#23 | 18.1%(+15.7)#5,356 |
| 24. | 06334 | 33.3% | 14.1%(+19.3)#24 | 18.1%(+15.3)#5,445 |
| 25. | 06706 | 32.9% | 14.1%(+18.8)#25 | 18.1%(+14.8)#5,621 |
| 26. | 06608 | 31.8% | 14.1%(+17.8)#26 | 18.1%(+13.8)#5,874 |
| 27. | 06451 | 30.7% | 14.1%(+16.6)#27 | 18.1%(+12.7)#6,164 |
| 28. | 06320 | 29.8% | 14.1%(+15.7)#28 | 18.1%(+11.7)#6,413 |
| 29. | 06330 | 29.7% | 14.1%(+15.7)#29 | 18.1%(+11.7)#6,437 |
| 30. | 06108 | 29.6% | 14.1%(+15.5)#30 | 18.1%(+11.5)#6,483 |
| 31. | 06513 | 27.8% | 14.1%(+13.7)#31 | 18.1%(+9.73)#7,020 |
| 32. | 06606 | 27.5% | 14.1%(+13.4)#32 | 18.1%(+9.41)#7,139 |
| 33. | 06021 | 27.4% | 14.1%(+13.3)#33 | 18.1%(+9.36)#7,158 |
| 34. | 06242 | 27.3% | 14.1%(+13.2)#34 | 18.1%(+9.21)#7,214 |
| 35. | 06335 | 26.8% | 14.1%(+12.8)#35 | 18.1%(+8.77)#7,358 |
| 36. | 06786 | 26.7% | 14.1%(+12.6)#36 | 18.1%(+8.66)#7,393 |
| 37. | 06605 | 25.8% | 14.1%(+11.7)#37 | 18.1%(+7.70)#7,720 |
| 38. | 06790 | 25.4% | 14.1%(+11.3)#38 | 18.1%(+7.30)#7,863 |
| 39. | 06705 | 25.0% | 14.1%(+10.9)#39 | 18.1%(+6.92)#8,047 |
| 40. | 06105 | 23.8% | 14.1%(+9.76)#40 | 18.1%(+5.77)#8,417 |
| 41. | 06268 | 23.3% | 14.1%(+9.18)#41 | 18.1%(+5.19)#8,657 |
| 42. | 06412 | 23.0% | 14.1%(+8.90)#42 | 18.1%(+4.92)#8,775 |
| 43. | 06708 | 22.8% | 14.1%(+8.76)#43 | 18.1%(+4.78)#8,822 |
| 44. | 06450 | 22.0% | 14.1%(+7.96)#44 | 18.1%(+3.97)#9,182 |
| 45. | 06063 | 21.6% | 14.1%(+7.47)#45 | 18.1%(+3.49)#9,363 |
| 46. | 06854 | 21.6% | 14.1%(+7.47)#46 | 18.1%(+3.49)#9,365 |
| 47. | 06514 | 21.4% | 14.1%(+7.31)#47 | 18.1%(+3.33)#9,443 |
| 48. | 06907 | 21.3% | 14.1%(+7.27)#48 | 18.1%(+3.28)#9,459 |
| 49. | 06901 | 21.3% | 14.1%(+7.23)#49 | 18.1%(+3.24)#9,481 |
| 50. | 06377 | 21.1% | 14.1%(+7.02)#50 | 18.1%(+3.03)#9,554 |
| 51. | 06255 | 20.4% | 14.1%(+6.36)#51 | 18.1%(+2.38)#9,832 |
| 52. | 06751 | 18.2% | 14.1%(+4.10)#52 | 18.1%(+0.119)#10,855 |
| 53. | 06096 | 18.0% | 14.1%(+3.95)#53 | 18.1%(-0.039)#10,950 |
| 54. | 06710 | 17.7% | 14.1%(+3.64)#54 | 18.1%(-0.343)#11,094 |
| 55. | 06370 | 17.6% | 14.1%(+3.52)#55 | 18.1%(-0.468)#11,156 |
| 56. | 06082 | 17.3% | 14.1%(+3.18)#56 | 18.1%(-0.802)#11,292 |
| 57. | 06379 | 17.0% | 14.1%(+2.97)#57 | 18.1%(-1.02)#11,409 |
| 58. | 06111 | 16.6% | 14.1%(+2.50)#58 | 18.1%(-1.49)#11,604 |
| 59. | 06512 | 16.6% | 14.1%(+2.48)#59 | 18.1%(-1.50)#11,611 |
| 60. | 06374 | 16.5% | 14.1%(+2.47)#60 | 18.1%(-1.52)#11,617 |
| 61. | 06010 | 16.5% | 14.1%(+2.42)#61 | 18.1%(-1.56)#11,643 |
| 62. | 06248 | 16.3% | 14.1%(+2.21)#62 | 18.1%(-1.77)#11,758 |
| 63. | 06457 | 16.2% | 14.1%(+2.10)#63 | 18.1%(-1.88)#11,820 |
| 64. | 06401 | 16.2% | 14.1%(+2.10)#64 | 18.1%(-1.89)#11,823 |
| 65. | 06906 | 15.9% | 14.1%(+1.83)#65 | 18.1%(-2.15)#11,955 |
| 66. | 06756 | 15.5% | 14.1%(+1.40)#66 | 18.1%(-2.59)#12,181 |
| 67. | 06076 | 15.4% | 14.1%(+1.32)#67 | 18.1%(-2.66)#12,214 |
| 68. | 06119 | 15.3% | 14.1%(+1.24)#68 | 18.1%(-2.75)#12,285 |
| 69. | 06423 | 14.9% | 14.1%(+0.787)#69 | 18.1%(-3.20)#12,545 |
| 70. | 06053 | 14.9% | 14.1%(+0.780)#70 | 18.1%(-3.20)#12,552 |
| 71. | 06066 | 14.2% | 14.1%(+0.161)#71 | 18.1%(-3.82)#12,915 |
| 72. | 06074 | 14.0% | 14.1%(-0.052)#72 | 18.1%(-4.04)#13,022 |
| 73. | 06234 | 13.9% | 14.1%(-0.221)#73 | 18.1%(-4.21)#13,114 |
| 74. | 06902 | 13.8% | 14.1%(-0.322)#74 | 18.1%(-4.31)#13,187 |
| 75. | 06085 | 13.7% | 14.1%(-0.417)#75 | 18.1%(-4.40)#13,230 |
| 76. | 06382 | 13.6% | 14.1%(-0.513)#76 | 18.1%(-4.50)#13,292 |
| 77. | 06360 | 13.5% | 14.1%(-0.620)#77 | 18.1%(-4.61)#13,351 |
| 78. | 06354 | 13.3% | 14.1%(-0.803)#78 | 18.1%(-4.79)#13,473 |
| 79. | 06482 | 13.0% | 14.1%(-1.10)#79 | 18.1%(-5.09)#13,642 |
| 80. | 06037 | 12.3% | 14.1%(-1.76)#80 | 18.1%(-5.75)#14,030 |
| 81. | 06810 | 12.1% | 14.1%(-1.98)#81 | 18.1%(-5.96)#14,148 |
| 82. | 06438 | 12.0% | 14.1%(-2.08)#82 | 18.1%(-6.06)#14,205 |
| 83. | 06518 | 12.0% | 14.1%(-2.08)#83 | 18.1%(-6.07)#14,224 |
| 84. | 06473 | 12.0% | 14.1%(-2.11)#84 | 18.1%(-6.09)#14,232 |
| 85. | 06483 | 11.9% | 14.1%(-2.16)#85 | 18.1%(-6.14)#14,262 |
| 86. | 06403 | 11.3% | 14.1%(-2.79)#86 | 18.1%(-6.78)#14,656 |
| 87. | 06492 | 10.6% | 14.1%(-3.45)#87 | 18.1%(-7.44)#15,040 |
| 88. | 06109 | 10.5% | 14.1%(-3.55)#88 | 18.1%(-7.53)#15,092 |
| 89. | 06118 | 10.5% | 14.1%(-3.62)#89 | 18.1%(-7.61)#15,148 |
| 90. | 06042 | 10.4% | 14.1%(-3.71)#90 | 18.1%(-7.69)#15,183 |
| 91. | 06340 | 9.9% | 14.1%(-4.17)#91 | 18.1%(-8.15)#15,482 |
| 92. | 06068 | 9.8% | 14.1%(-4.26)#92 | 18.1%(-8.24)#15,525 |
| 93. | 06905 | 9.5% | 14.1%(-4.63)#93 | 18.1%(-8.61)#15,761 |
| 94. | 06807 | 9.4% | 14.1%(-4.72)#94 | 18.1%(-8.71)#15,818 |
| 95. | 06851 | 9.3% | 14.1%(-4.74)#95 | 18.1%(-8.72)#15,827 |
| 96. | 06238 | 9.1% | 14.1%(-4.94)#96 | 18.1%(-8.92)#15,956 |
| 97. | 06375 | 9.0% | 14.1%(-5.10)#97 | 18.1%(-9.09)#16,072 |
| 98. | 06783 | 8.9% | 14.1%(-5.15)#98 | 18.1%(-9.13)#16,118 |
| 99. | 06516 | 8.9% | 14.1%(-5.21)#99 | 18.1%(-9.19)#16,149 |
| 100. | 06712 | 8.8% | 14.1%(-5.29)#100 | 18.1%(-9.27)#16,208 |
Common Questions
What are the Top 10 Zip Codes with the Highest Poverty Level Among Children Under the Age of 5 in Connecticut?
Top 10 Zip Codes with the Highest Poverty Level Among Children Under the Age of 5 in Connecticut are:
What zip code has the Highest Poverty Level Among Children Under the Age of 5 in Connecticut?
06702 has the Highest Poverty Level Among Children Under the Age of 5 in Connecticut with 100.0%.
What is the Poverty Level Among Children Under the Age of 5 in the State of Connecticut?
Poverty Level Among Children Under the Age of 5 in Connecticut is 14.1%.
What is the Poverty Level Among Children Under the Age of 5 in the United States?
Poverty Level Among Children Under the Age of 5 in the United States is 18.1%.