Bull Run Mountain Estates, VA Map & Demographics
Bull Run Mountain Estates Map
Bull Run Mountain Estates Overview
$52,523
PER CAPITA INCOME
$185,662
AVG FAMILY INCOME
$178,462
AVG HOUSEHOLD INCOME
67.1%
WAGE / INCOME GAP [ % ]
32.9¢/ $1
WAGE / INCOME GAP [ $ ]
0.22
INEQUALITY / GINI INDEX
1,525
TOTAL POPULATION
768
MALE POPULATION
757
FEMALE POPULATION
101.45
MALES / 100 FEMALES
98.57
FEMALES / 100 MALES
22.4
MEDIAN AGE
4.3
AVG FAMILY SIZE
3.5
AVG HOUSEHOLD SIZE
660
LABOR FORCE [ PEOPLE ]
78.4%
PERCENT IN LABOR FORCE
8.2%
UNEMPLOYMENT RATE
Income in Bull Run Mountain Estates
Income Overview in Bull Run Mountain Estates
Per Capita Income in Bull Run Mountain Estates is $52,523, while median incomes of families and households are $185,662 and $178,462 respectively.
| Characteristic | Number | Measure |
| Per Capita Income | 1,525 | $52,523 |
| Median Family Income | 327 | $185,662 |
| Mean Family Income | 327 | $206,549 |
| Median Household Income | 434 | $178,462 |
| Mean Household Income | 434 | $185,606 |
| Income Deficit | 327 | $0 |
| Wage / Income Gap (%) | 1,525 | 67.11% |
| Wage / Income Gap ($) | 1,525 | 32.89¢ per $1 |
| Gini / Inequality Index | 1,525 | 0.22 |
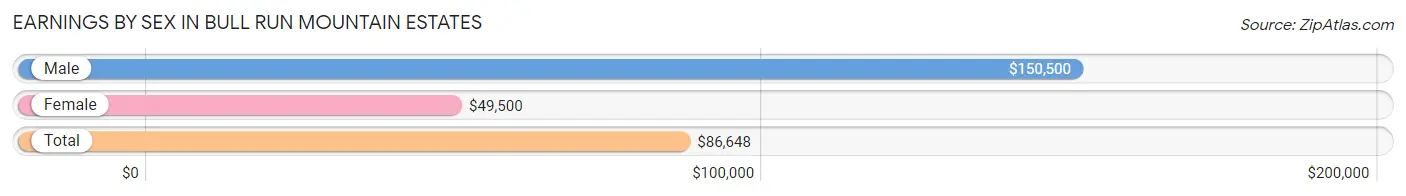
Earnings by Sex in Bull Run Mountain Estates
Average Earnings in Bull Run Mountain Estates are $86,648, $150,500 for men and $49,500 for women, a difference of 67.1%.
| Sex | Number | Average Earnings |
| Male | 336 (55.4%) | $150,500 |
| Female | 270 (44.6%) | $49,500 |
| Total | 606 (100.0%) | $86,648 |
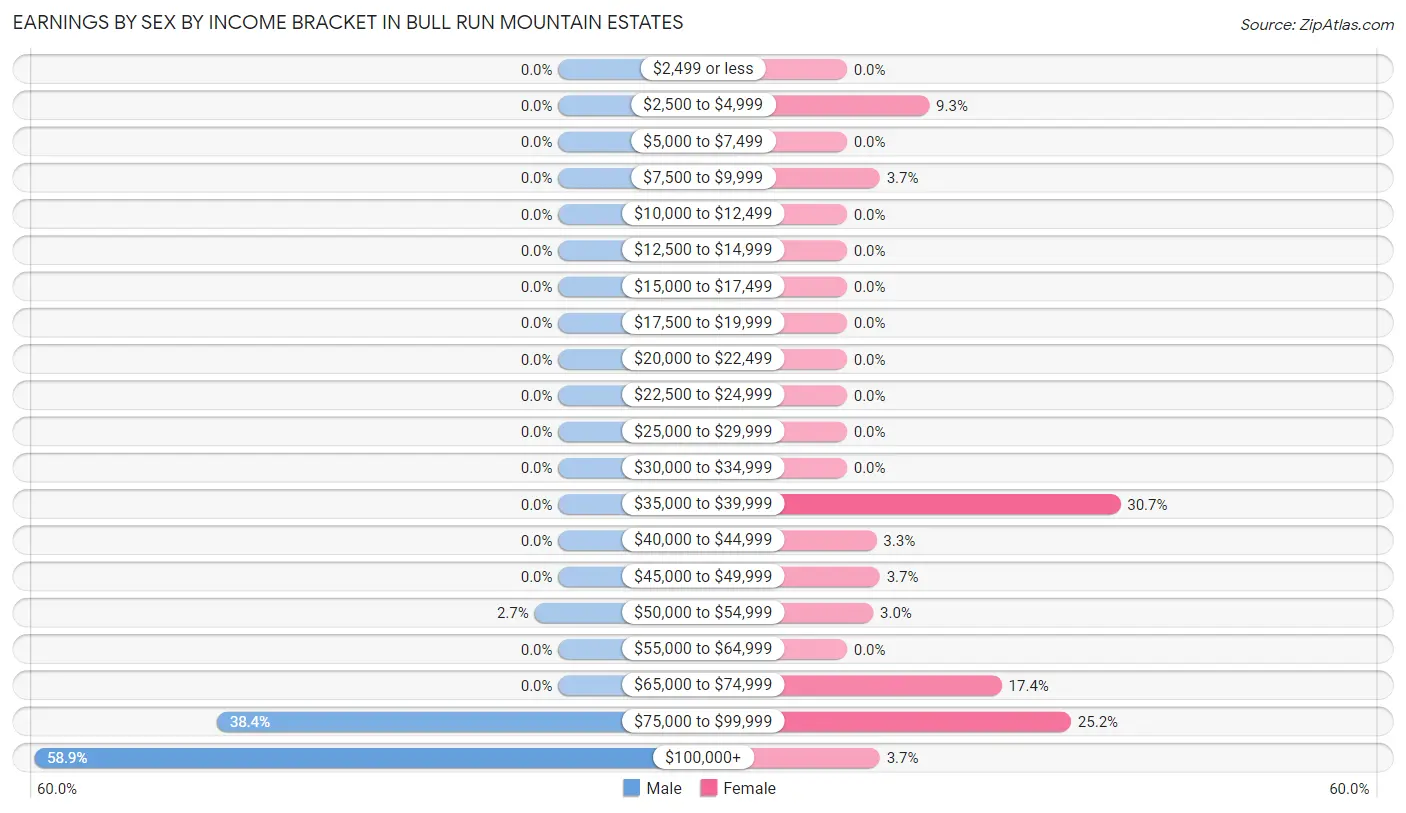
Earnings by Sex by Income Bracket in Bull Run Mountain Estates
The most common earnings brackets in Bull Run Mountain Estates are $100,000+ for men (198 | 58.9%) and $35,000 to $39,999 for women (83 | 30.7%).
| Income | Male | Female |
| $2,499 or less | 0 (0.0%) | 0 (0.0%) |
| $2,500 to $4,999 | 0 (0.0%) | 25 (9.3%) |
| $5,000 to $7,499 | 0 (0.0%) | 0 (0.0%) |
| $7,500 to $9,999 | 0 (0.0%) | 10 (3.7%) |
| $10,000 to $12,499 | 0 (0.0%) | 0 (0.0%) |
| $12,500 to $14,999 | 0 (0.0%) | 0 (0.0%) |
| $15,000 to $17,499 | 0 (0.0%) | 0 (0.0%) |
| $17,500 to $19,999 | 0 (0.0%) | 0 (0.0%) |
| $20,000 to $22,499 | 0 (0.0%) | 0 (0.0%) |
| $22,500 to $24,999 | 0 (0.0%) | 0 (0.0%) |
| $25,000 to $29,999 | 0 (0.0%) | 0 (0.0%) |
| $30,000 to $34,999 | 0 (0.0%) | 0 (0.0%) |
| $35,000 to $39,999 | 0 (0.0%) | 83 (30.7%) |
| $40,000 to $44,999 | 0 (0.0%) | 9 (3.3%) |
| $45,000 to $49,999 | 0 (0.0%) | 10 (3.7%) |
| $50,000 to $54,999 | 9 (2.7%) | 8 (3.0%) |
| $55,000 to $64,999 | 0 (0.0%) | 0 (0.0%) |
| $65,000 to $74,999 | 0 (0.0%) | 47 (17.4%) |
| $75,000 to $99,999 | 129 (38.4%) | 68 (25.2%) |
| $100,000+ | 198 (58.9%) | 10 (3.7%) |
| Total | 336 (100.0%) | 270 (100.0%) |
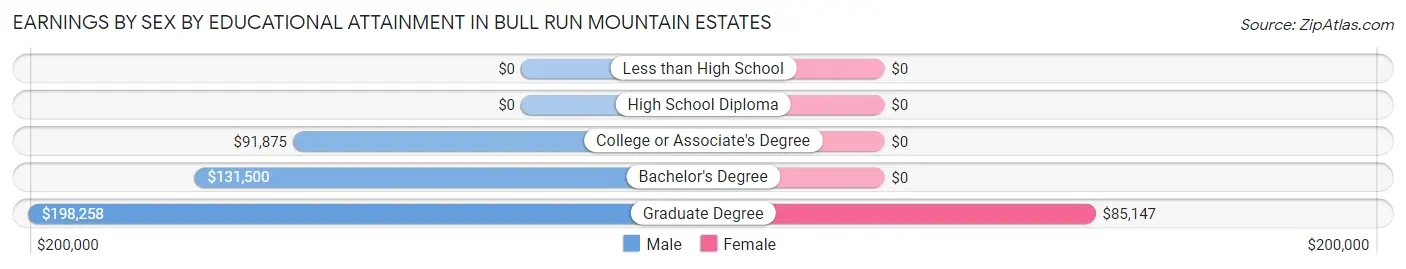
Earnings by Sex by Educational Attainment in Bull Run Mountain Estates
Average earnings in Bull Run Mountain Estates are $150,500 for men and $67,596 for women, a difference of 55.1%. Men with an educational attainment of graduate degree enjoy the highest average annual earnings of $198,258, while those with college or associate's degree education earn the least with $91,875. Women with an educational attainment of graduate degree earn the most with the average annual earnings of $85,147, while those with graduate degree education have the smallest earnings of $85,147.
| Educational Attainment | Male Income | Female Income |
| Less than High School | - | - |
| High School Diploma | - | - |
| College or Associate's Degree | $91,875 | $0 |
| Bachelor's Degree | $131,500 | $0 |
| Graduate Degree | $198,258 | $85,147 |
| Total | $150,500 | $67,596 |
Family Income in Bull Run Mountain Estates
Family Income Brackets in Bull Run Mountain Estates
According to the Bull Run Mountain Estates family income data, there are 151 families falling into the $200,000+ income range, which is the most common income bracket and makes up 46.2% of all families.
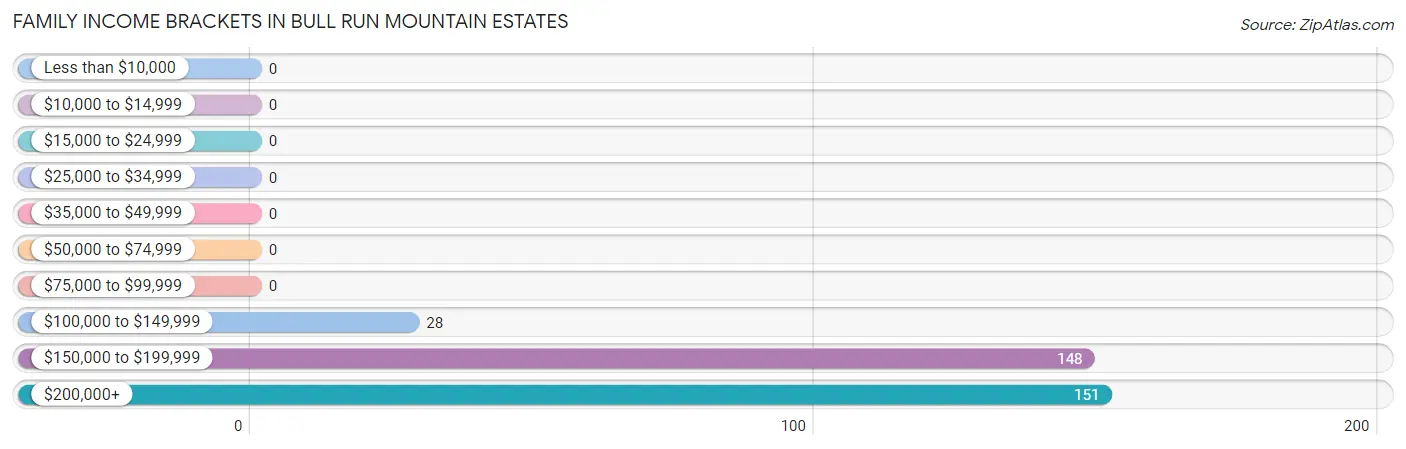
| Income Bracket | # Families | % Families |
| Less than $10,000 | 0 | 0.0% |
| $10,000 to $14,999 | 0 | 0.0% |
| $15,000 to $24,999 | 0 | 0.0% |
| $25,000 to $34,999 | 0 | 0.0% |
| $35,000 to $49,999 | 0 | 0.0% |
| $50,000 to $74,999 | 0 | 0.0% |
| $75,000 to $99,999 | 0 | 0.0% |
| $100,000 to $149,999 | 28 | 8.6% |
| $150,000 to $199,999 | 148 | 45.3% |
| $200,000+ | 151 | 46.2% |
Family Income by Famaliy Size in Bull Run Mountain Estates
2-person families (71 | 21.7%) account for the highest median family income in Bull Run Mountain Estates with $185,809 per family, while 2-person families (71 | 21.7%) have the highest median income of $92,904 per family member.
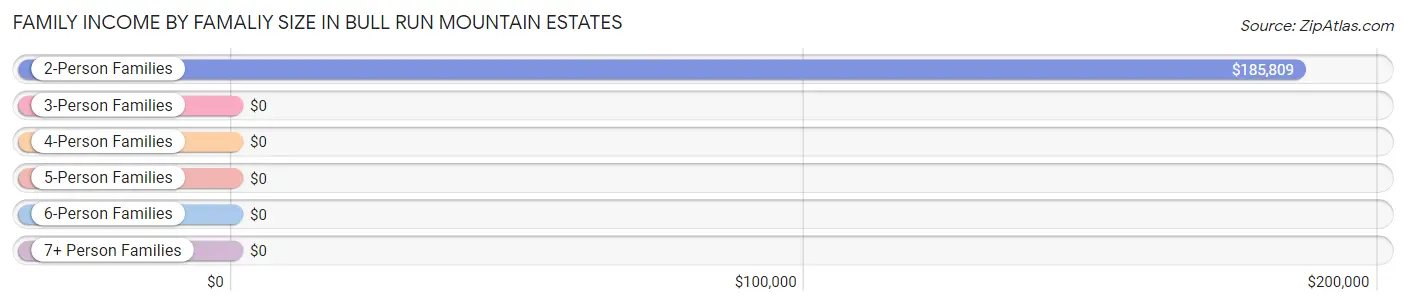
| Income Bracket | # Families | Median Income |
| 2-Person Families | 71 (21.7%) | $185,809 |
| 3-Person Families | 26 (8.0%) | $0 |
| 4-Person Families | 166 (50.8%) | $0 |
| 5-Person Families | 0 (0.0%) | $0 |
| 6-Person Families | 0 (0.0%) | $0 |
| 7+ Person Families | 64 (19.6%) | $0 |
| Total | 327 (100.0%) | $185,662 |
Family Income by Number of Earners in Bull Run Mountain Estates
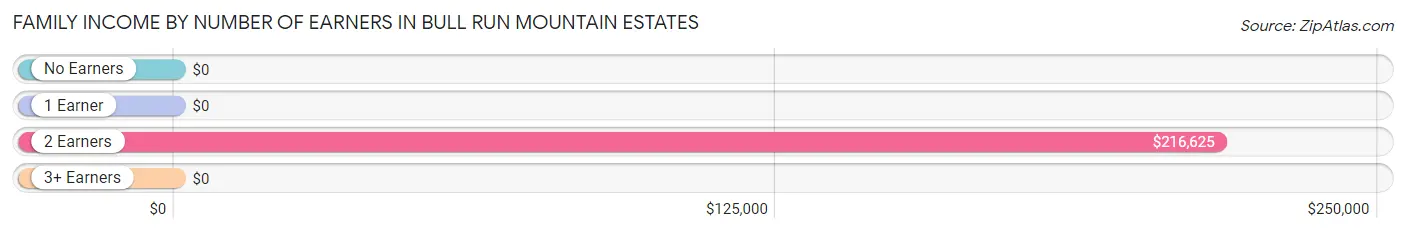
| Number of Earners | # Families | Median Income |
| No Earners | 20 (6.1%) | $0 |
| 1 Earner | 18 (5.5%) | $0 |
| 2 Earners | 289 (88.4%) | $216,625 |
| 3+ Earners | 0 (0.0%) | $0 |
| Total | 327 (100.0%) | $185,662 |
Household Income in Bull Run Mountain Estates
Household Income Brackets in Bull Run Mountain Estates
With 176 households falling in the category, the $200,000+ income range is the most frequent in Bull Run Mountain Estates, accounting for 40.6% of all households.
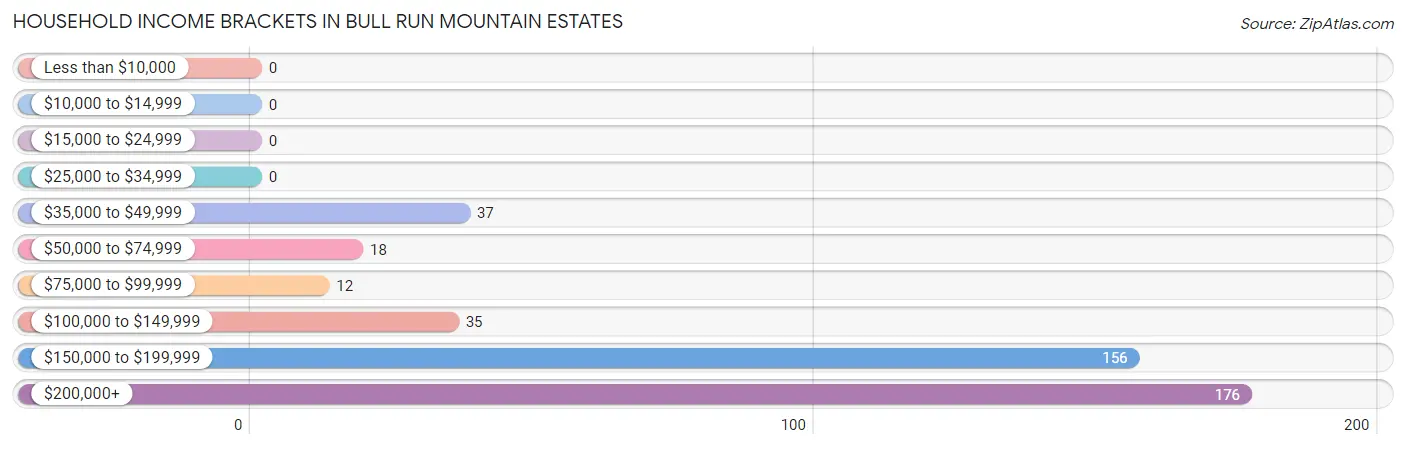
| Income Bracket | # Households | % Households |
| Less than $10,000 | 0 | 0.0% |
| $10,000 to $14,999 | 0 | 0.0% |
| $15,000 to $24,999 | 0 | 0.0% |
| $25,000 to $34,999 | 0 | 0.0% |
| $35,000 to $49,999 | 37 | 8.5% |
| $50,000 to $74,999 | 18 | 4.1% |
| $75,000 to $99,999 | 12 | 2.8% |
| $100,000 to $149,999 | 35 | 8.1% |
| $150,000 to $199,999 | 156 | 35.9% |
| $200,000+ | 176 | 40.6% |
Household Income by Householder Age in Bull Run Mountain Estates
The median household income in Bull Run Mountain Estates is $178,462, with the highest median household income of $237,766 found in the 45 to 64 years age bracket for the primary householder. A total of 247 households (56.9%) fall into this category.
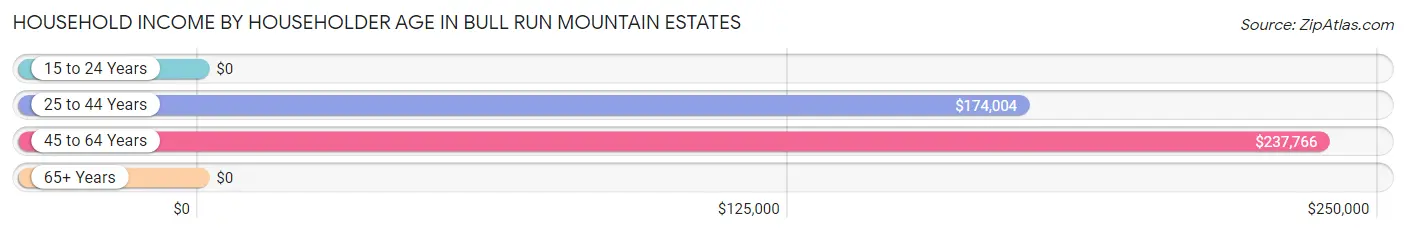
| Income Bracket | # Households | Median Income |
| 15 to 24 Years | 0 (0.0%) | $0 |
| 25 to 44 Years | 97 (22.4%) | $174,004 |
| 45 to 64 Years | 247 (56.9%) | $237,766 |
| 65+ Years | 90 (20.7%) | $0 |
| Total | 434 (100.0%) | $178,462 |
Poverty in Bull Run Mountain Estates
Income Below Poverty by Sex and Age in Bull Run Mountain Estates
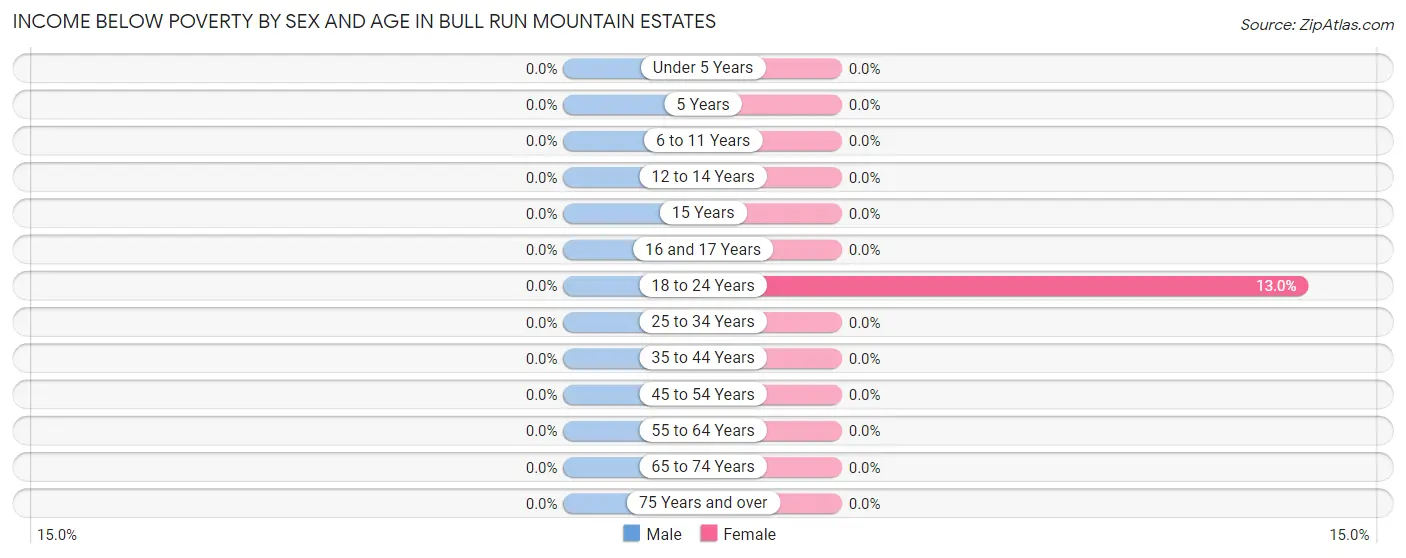
| Age Bracket | Male | Female |
| Under 5 Years | 0 (0.0%) | 0 (0.0%) |
| 5 Years | 0 (0.0%) | 0 (0.0%) |
| 6 to 11 Years | 0 (0.0%) | 0 (0.0%) |
| 12 to 14 Years | 0 (0.0%) | 0 (0.0%) |
| 15 Years | 0 (0.0%) | 0 (0.0%) |
| 16 and 17 Years | 0 (0.0%) | 0 (0.0%) |
| 18 to 24 Years | 0 (0.0%) | 10 (13.0%) |
| 25 to 34 Years | 0 (0.0%) | 0 (0.0%) |
| 35 to 44 Years | 0 (0.0%) | 0 (0.0%) |
| 45 to 54 Years | 0 (0.0%) | 0 (0.0%) |
| 55 to 64 Years | 0 (0.0%) | 0 (0.0%) |
| 65 to 74 Years | 0 (0.0%) | 0 (0.0%) |
| 75 Years and over | 0 (0.0%) | 0 (0.0%) |
| Total | 0 (0.0%) | 10 (1.3%) |
Income Above Poverty by Sex and Age in Bull Run Mountain Estates
According to the poverty statistics in Bull Run Mountain Estates, males aged 5 years and females aged 6 to 11 years are the age groups that are most secure financially, with 100.0% of males and 100.0% of females in these age groups living above the poverty line.
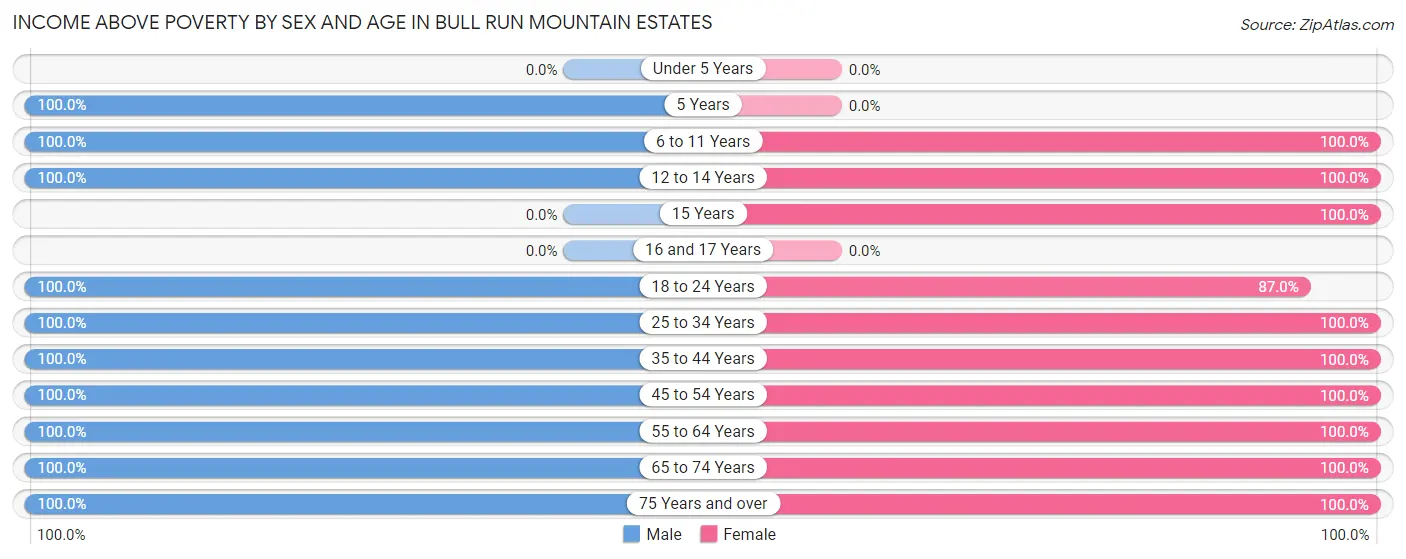
| Age Bracket | Male | Female |
| Under 5 Years | 0 (0.0%) | 0 (0.0%) |
| 5 Years | 93 (100.0%) | 0 (0.0%) |
| 6 to 11 Years | 54 (100.0%) | 142 (100.0%) |
| 12 to 14 Years | 175 (100.0%) | 159 (100.0%) |
| 15 Years | 0 (0.0%) | 60 (100.0%) |
| 16 and 17 Years | 0 (0.0%) | 0 (0.0%) |
| 18 to 24 Years | 25 (100.0%) | 67 (87.0%) |
| 25 to 34 Years | 20 (100.0%) | 31 (100.0%) |
| 35 to 44 Years | 78 (100.0%) | 68 (100.0%) |
| 45 to 54 Years | 185 (100.0%) | 130 (100.0%) |
| 55 to 64 Years | 56 (100.0%) | 36 (100.0%) |
| 65 to 74 Years | 63 (100.0%) | 27 (100.0%) |
| 75 Years and over | 19 (100.0%) | 27 (100.0%) |
| Total | 768 (100.0%) | 747 (98.7%) |
Income Below Poverty Among Married-Couple Families in Bull Run Mountain Estates
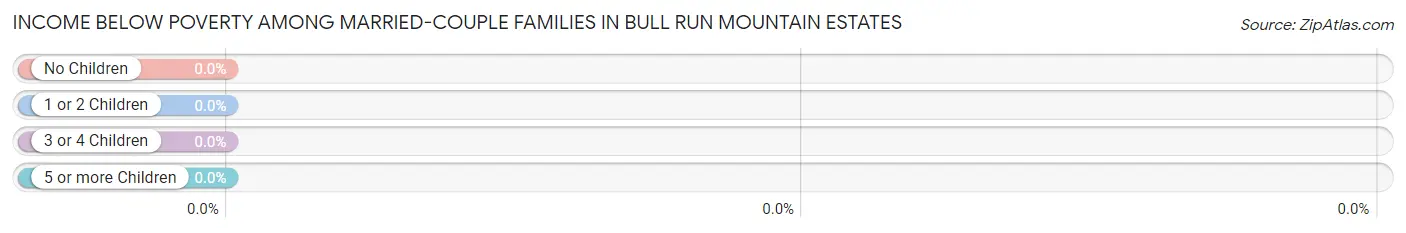
| Children | Above Poverty | Below Poverty |
| No Children | 87 (100.0%) | 0 (0.0%) |
| 1 or 2 Children | 166 (100.0%) | 0 (0.0%) |
| 3 or 4 Children | 0 (0.0%) | 0 (0.0%) |
| 5 or more Children | 64 (100.0%) | 0 (0.0%) |
| Total | 317 (100.0%) | 0 (0.0%) |
Income Below Poverty Among Single-Parent Households in Bull Run Mountain Estates
| Children | Single Father | Single Mother |
| No Children | 0 (0.0%) | 0 (0.0%) |
| 1 or 2 Children | 0 (0.0%) | 0 (0.0%) |
| 3 or 4 Children | 0 (0.0%) | 0 (0.0%) |
| 5 or more Children | 0 (0.0%) | 0 (0.0%) |
| Total | 0 (0.0%) | 0 (0.0%) |
Income Below Poverty Among Married-Couple vs Single-Parent Households in Bull Run Mountain Estates
| Children | Married-Couple Families | Single-Parent Households |
| No Children | 0 (0.0%) | 0 (0.0%) |
| 1 or 2 Children | 0 (0.0%) | 0 (0.0%) |
| 3 or 4 Children | 0 (0.0%) | 0 (0.0%) |
| 5 or more Children | 0 (0.0%) | 0 (0.0%) |
| Total | 0 (0.0%) | 0 (0.0%) |
Race in Bull Run Mountain Estates
The most populous races in Bull Run Mountain Estates are White / Caucasian (1,253 | 82.2%), Black / African American (190 | 12.5%), and Two or more Races (62 | 4.1%).
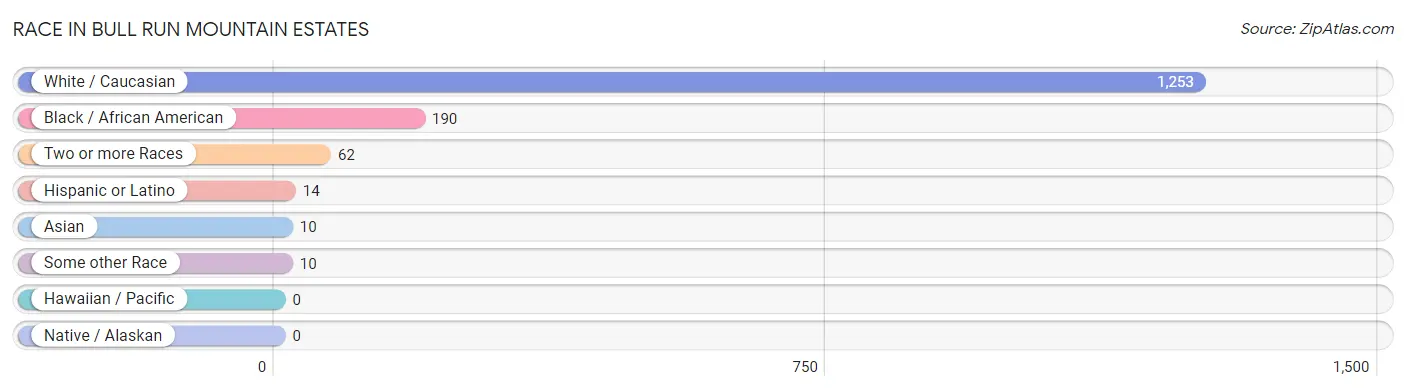
| Race | # Population | % Population |
| Asian | 10 | 0.7% |
| Black / African American | 190 | 12.5% |
| Hawaiian / Pacific | 0 | 0.0% |
| Hispanic or Latino | 14 | 0.9% |
| Native / Alaskan | 0 | 0.0% |
| White / Caucasian | 1,253 | 82.2% |
| Two or more Races | 62 | 4.1% |
| Some other Race | 10 | 0.7% |
| Total | 1,525 | 100.0% |
Ancestry in Bull Run Mountain Estates
The most populous ancestries reported in Bull Run Mountain Estates are American (419 | 27.5%), Irish (368 | 24.1%), German (107 | 7.0%), English (97 | 6.4%), and European (83 | 5.4%), together accounting for 70.4% of all Bull Run Mountain Estates residents.
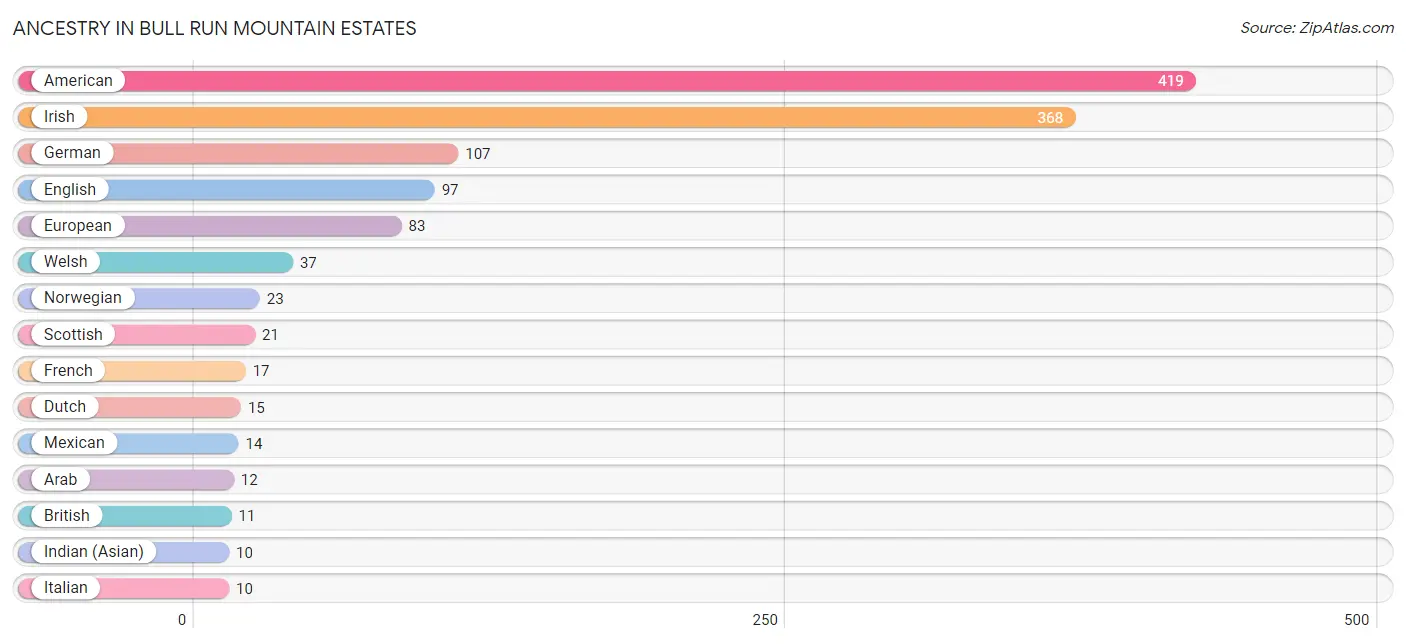
| Ancestry | # Population | % Population |
| American | 419 | 27.5% |
| Arab | 12 | 0.8% |
| British | 11 | 0.7% |
| Danish | 9 | 0.6% |
| Dutch | 15 | 1.0% |
| English | 97 | 6.4% |
| European | 83 | 5.4% |
| French | 17 | 1.1% |
| German | 107 | 7.0% |
| Indian (Asian) | 10 | 0.7% |
| Irish | 368 | 24.1% |
| Italian | 10 | 0.7% |
| Mexican | 14 | 0.9% |
| Norwegian | 23 | 1.5% |
| Scottish | 21 | 1.4% |
| Welsh | 37 | 2.4% | View All 16 Rows |
Immigrants in Bull Run Mountain Estates
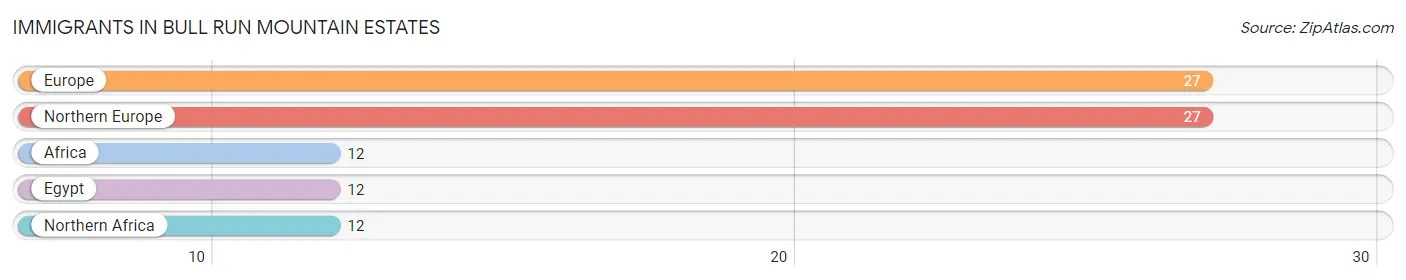
The most numerous immigrant groups reported in Bull Run Mountain Estates came from Europe (27 | 1.8%), Northern Europe (27 | 1.8%), Africa (12 | 0.8%), Egypt (12 | 0.8%), and Northern Africa (12 | 0.8%), together accounting for 5.9% of all Bull Run Mountain Estates residents.
| Immigration Origin | # Population | % Population |
| Africa | 12 | 0.8% |
| Egypt | 12 | 0.8% |
| Europe | 27 | 1.8% |
| Northern Africa | 12 | 0.8% |
| Northern Europe | 27 | 1.8% | View All 5 Rows |
Sex and Age in Bull Run Mountain Estates
Sex and Age in Bull Run Mountain Estates
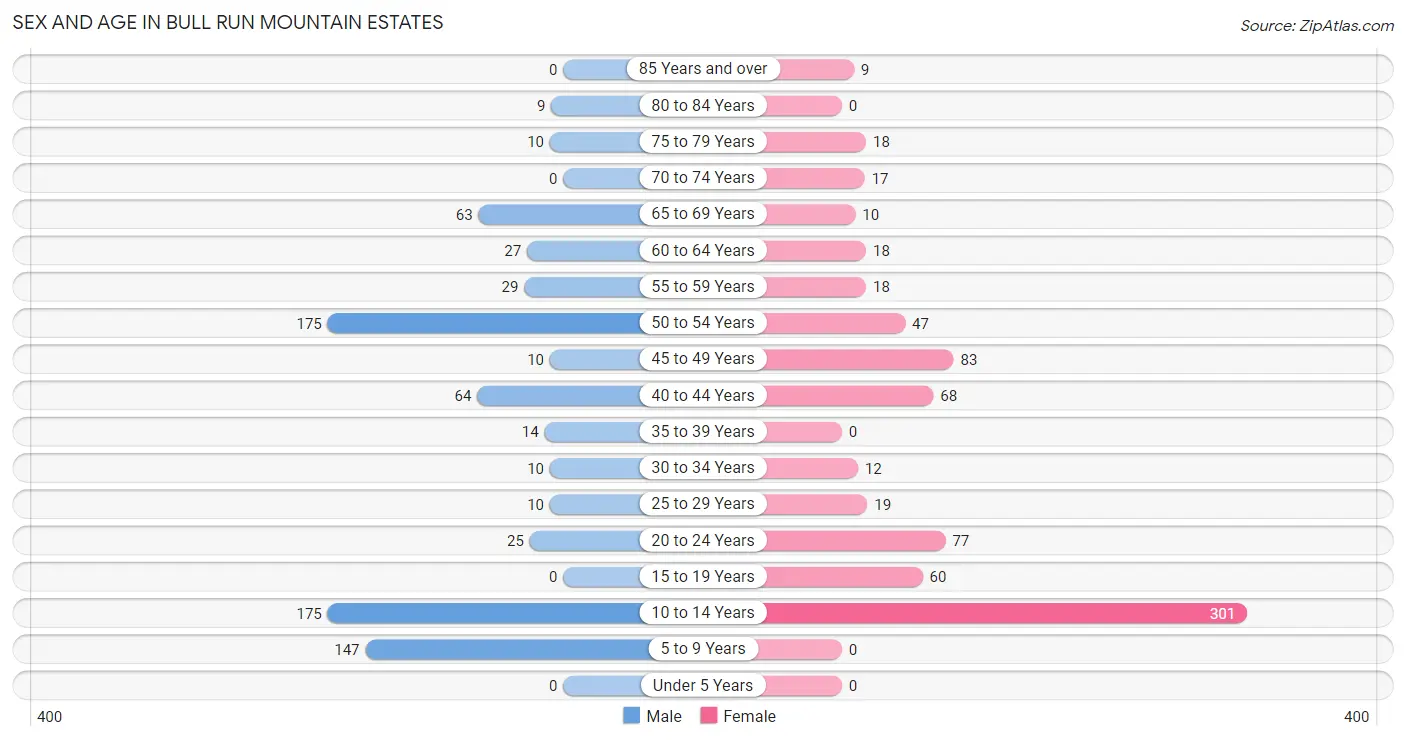
The most populous age groups in Bull Run Mountain Estates are 10 to 14 Years (175 | 22.8%) for men and 10 to 14 Years (301 | 39.8%) for women.
| Age Bracket | Male | Female |
| Under 5 Years | 0 (0.0%) | 0 (0.0%) |
| 5 to 9 Years | 147 (19.1%) | 0 (0.0%) |
| 10 to 14 Years | 175 (22.8%) | 301 (39.8%) |
| 15 to 19 Years | 0 (0.0%) | 60 (7.9%) |
| 20 to 24 Years | 25 (3.3%) | 77 (10.2%) |
| 25 to 29 Years | 10 (1.3%) | 19 (2.5%) |
| 30 to 34 Years | 10 (1.3%) | 12 (1.6%) |
| 35 to 39 Years | 14 (1.8%) | 0 (0.0%) |
| 40 to 44 Years | 64 (8.3%) | 68 (9.0%) |
| 45 to 49 Years | 10 (1.3%) | 83 (11.0%) |
| 50 to 54 Years | 175 (22.8%) | 47 (6.2%) |
| 55 to 59 Years | 29 (3.8%) | 18 (2.4%) |
| 60 to 64 Years | 27 (3.5%) | 18 (2.4%) |
| 65 to 69 Years | 63 (8.2%) | 10 (1.3%) |
| 70 to 74 Years | 0 (0.0%) | 17 (2.2%) |
| 75 to 79 Years | 10 (1.3%) | 18 (2.4%) |
| 80 to 84 Years | 9 (1.2%) | 0 (0.0%) |
| 85 Years and over | 0 (0.0%) | 9 (1.2%) |
| Total | 768 (100.0%) | 757 (100.0%) |
Families and Households in Bull Run Mountain Estates
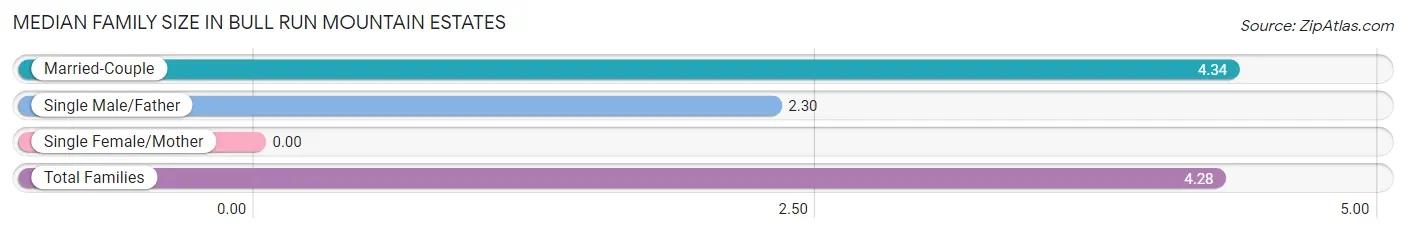
Median Family Size in Bull Run Mountain Estates
| Family Type | # Families | Family Size |
| Married-Couple | 317 (96.9%) | 4.34 |
| Single Male/Father | 10 (3.1%) | 2.30 |
| Single Female/Mother | 0 (0.0%) | - |
| Total Families | 327 (100.0%) | 4.28 |
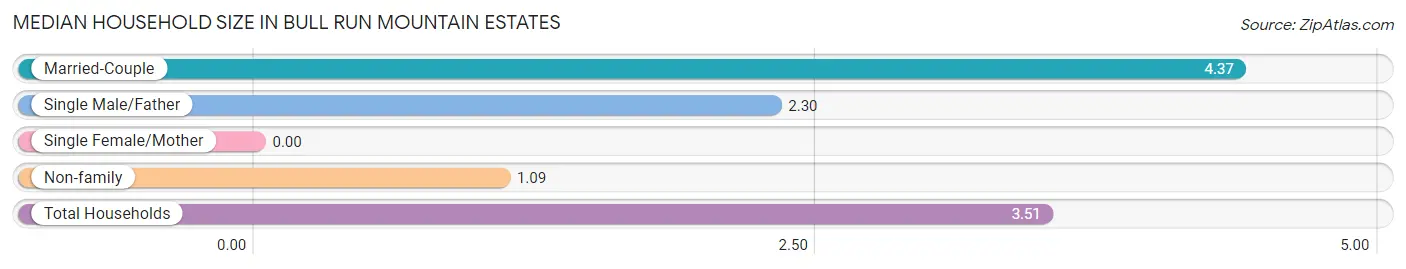
Median Household Size in Bull Run Mountain Estates
| Household Type | # Households | Household Size |
| Married-Couple | 317 (73.0%) | 4.37 |
| Single Male/Father | 10 (2.3%) | 2.30 |
| Single Female/Mother | 0 (0.0%) | - |
| Non-family | 107 (24.6%) | 1.09 |
| Total Households | 434 (100.0%) | 3.51 |
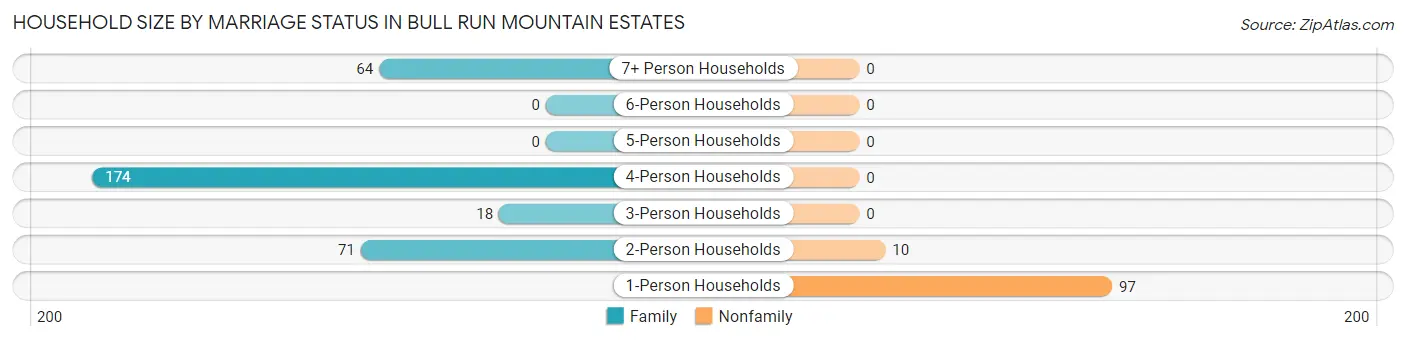
Household Size by Marriage Status in Bull Run Mountain Estates
Out of a total of 434 households in Bull Run Mountain Estates, 327 (75.3%) are family households, while 107 (24.6%) are nonfamily households. The most numerous type of family households are 4-person households, comprising 174, and the most common type of nonfamily households are 1-person households, comprising 97.
| Household Size | Family Households | Nonfamily Households |
| 1-Person Households | - | 97 (22.4%) |
| 2-Person Households | 71 (16.4%) | 10 (2.3%) |
| 3-Person Households | 18 (4.2%) | 0 (0.0%) |
| 4-Person Households | 174 (40.1%) | 0 (0.0%) |
| 5-Person Households | 0 (0.0%) | 0 (0.0%) |
| 6-Person Households | 0 (0.0%) | 0 (0.0%) |
| 7+ Person Households | 64 (14.7%) | 0 (0.0%) |
| Total | 327 (75.3%) | 107 (24.6%) |
Female Fertility in Bull Run Mountain Estates
Fertility by Age in Bull Run Mountain Estates
| Age Bracket | Women with Births | Births / 1,000 Women |
| 15 to 19 years | 0 (0.0%) | 0.0 |
| 20 to 34 years | 0 (0.0%) | 0.0 |
| 35 to 50 years | 0 (0.0%) | 0.0 |
| Total | 0 (0.0%) | 0.0 |
Fertility by Age by Marriage Status in Bull Run Mountain Estates
| Age Bracket | Married | Unmarried |
| 15 to 19 years | 0 (0.0%) | 0 (0.0%) |
| 20 to 34 years | 0 (0.0%) | 0 (0.0%) |
| 35 to 50 years | 0 (0.0%) | 0 (0.0%) |
| Total | 0 (0.0%) | 0 (0.0%) |
Fertility by Education in Bull Run Mountain Estates
| Educational Attainment | Women with Births | Births / 1,000 Women |
| Less than High School | 0 (0.0%) | 0.0 |
| High School Diploma | 0 (0.0%) | 0.0 |
| College or Associate's Degree | 0 (0.0%) | 0.0 |
| Bachelor's Degree | 0 (0.0%) | 0.0 |
| Graduate Degree | 0 (0.0%) | 0.0 |
| Total | 0 (0.0%) | 0.0 |
Fertility by Education by Marriage Status in Bull Run Mountain Estates
| Educational Attainment | Married | Unmarried |
| Less than High School | 0 (0.0%) | 0 (0.0%) |
| High School Diploma | 0 (0.0%) | 0 (0.0%) |
| College or Associate's Degree | 0 (0.0%) | 0 (0.0%) |
| Bachelor's Degree | 0 (0.0%) | 0 (0.0%) |
| Graduate Degree | 0 (0.0%) | 0 (0.0%) |
| Total | 0 (0.0%) | 0 (0.0%) |
Employment Characteristics in Bull Run Mountain Estates
Employment by Class of Employer in Bull Run Mountain Estates
Among the 606 employed individuals in Bull Run Mountain Estates, private company employees (338 | 55.8%), self-employed (not incorporated) (141 | 23.3%), and local government employees (79 | 13.0%) make up the most common classes of employment.
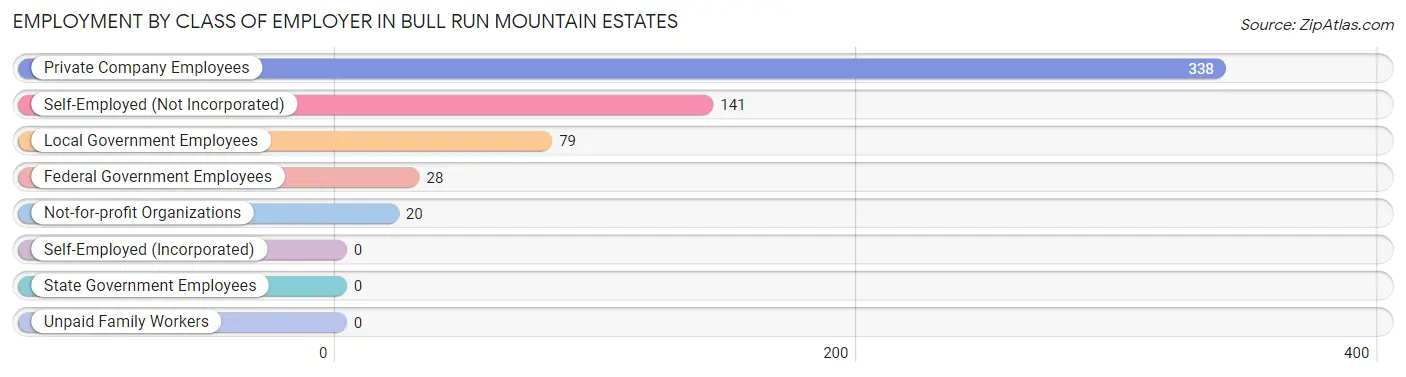
| Employer Class | # Employees | % Employees |
| Private Company Employees | 338 | 55.8% |
| Self-Employed (Incorporated) | 0 | 0.0% |
| Self-Employed (Not Incorporated) | 141 | 23.3% |
| Not-for-profit Organizations | 20 | 3.3% |
| Local Government Employees | 79 | 13.0% |
| State Government Employees | 0 | 0.0% |
| Federal Government Employees | 28 | 4.6% |
| Unpaid Family Workers | 0 | 0.0% |
| Total | 606 | 100.0% |
Employment Status by Age in Bull Run Mountain Estates
According to the labor force statistics for Bull Run Mountain Estates, out of the total population over 16 years of age (842), 78.4% or 660 individuals are in the labor force, with 8.2% or 54 of them unemployed. The age group with the highest labor force participation rate is 25 to 29 years, with 100.0% or 29 individuals in the labor force. Within the labor force, the 20 to 24 years age range has the highest percentage of unemployed individuals, with 70.1% or 54 of them being unemployed.
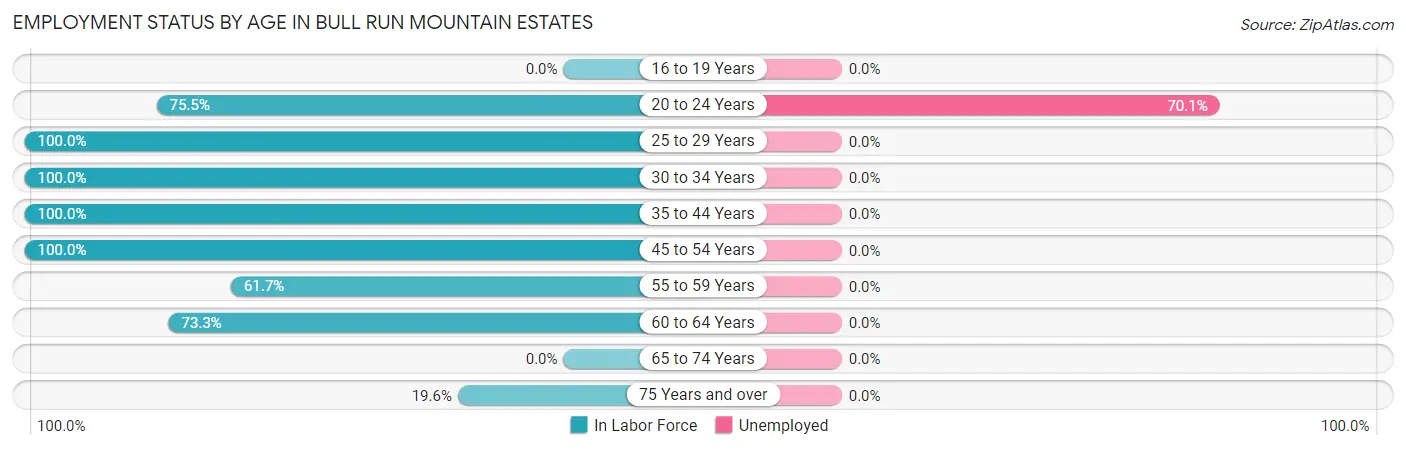
| Age Bracket | In Labor Force | Unemployed |
| 16 to 19 Years | 0 (0.0%) | 0 (0.0%) |
| 20 to 24 Years | 77 (75.5%) | 54 (70.1%) |
| 25 to 29 Years | 29 (100.0%) | 0 (0.0%) |
| 30 to 34 Years | 22 (100.0%) | 0 (0.0%) |
| 35 to 44 Years | 146 (100.0%) | 0 (0.0%) |
| 45 to 54 Years | 315 (100.0%) | 0 (0.0%) |
| 55 to 59 Years | 29 (61.7%) | 0 (0.0%) |
| 60 to 64 Years | 33 (73.3%) | 0 (0.0%) |
| 65 to 74 Years | 0 (0.0%) | 0 (0.0%) |
| 75 Years and over | 9 (19.6%) | 0 (0.0%) |
| Total | 660 (78.4%) | 54 (8.2%) |
Employment Status by Educational Attainment in Bull Run Mountain Estates
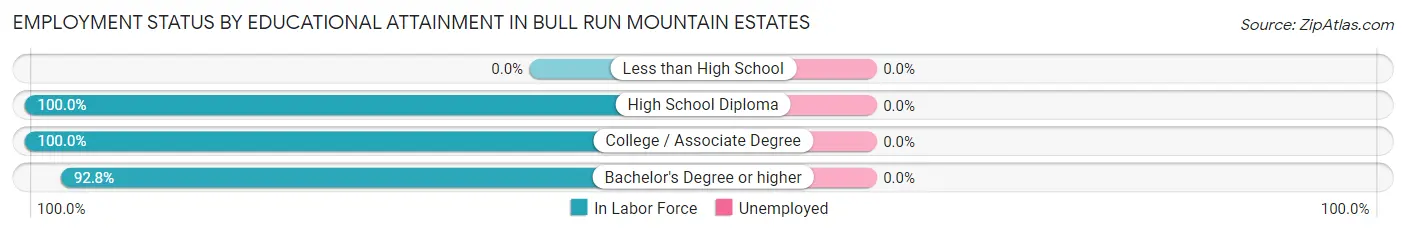
| Educational Attainment | In Labor Force | Unemployed |
| Less than High School | 0 (0.0%) | 0 (0.0%) |
| High School Diploma | 33 (100.0%) | 0 (0.0%) |
| College / Associate Degree | 153 (100.0%) | 0 (0.0%) |
| Bachelor's Degree or higher | 388 (92.8%) | 0 (0.0%) |
| Total | 574 (95.0%) | 0 (0.0%) |
Employment Occupations by Sex in Bull Run Mountain Estates
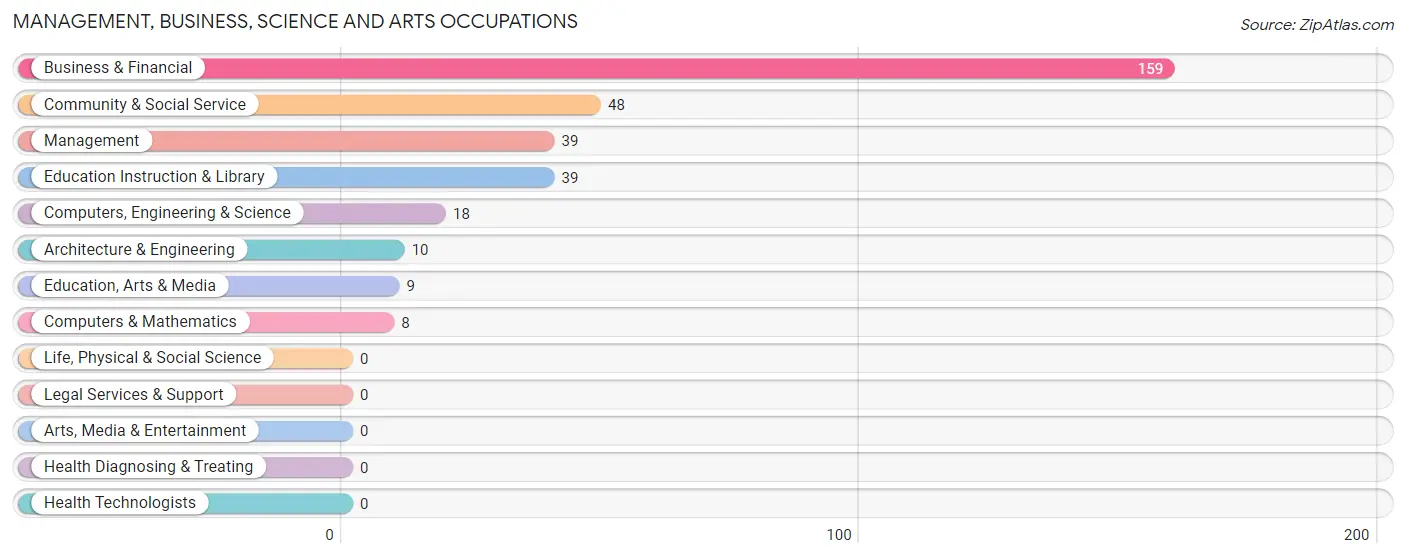
Management, Business, Science and Arts Occupations
The most common Management, Business, Science and Arts occupations in Bull Run Mountain Estates are Business & Financial (159 | 26.2%), Community & Social Service (48 | 7.9%), Management (39 | 6.4%), Education Instruction & Library (39 | 6.4%), and Computers, Engineering & Science (18 | 3.0%).
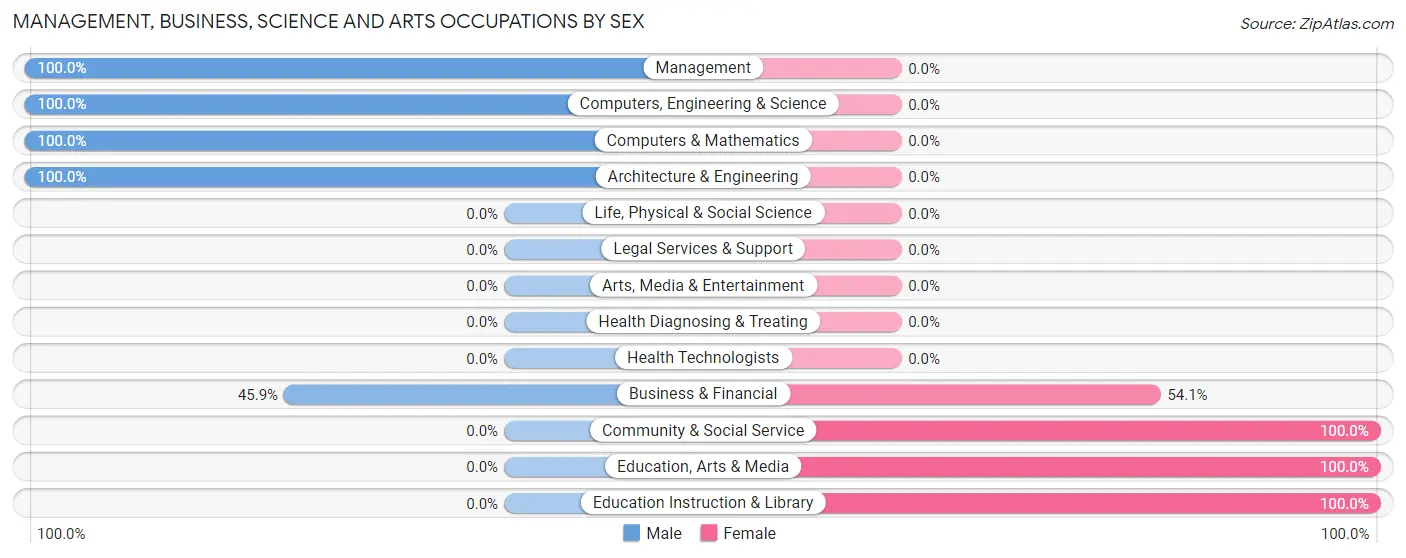
Management, Business, Science and Arts Occupations by Sex
Within the Management, Business, Science and Arts occupations in Bull Run Mountain Estates, the most male-oriented occupations are Management (100.0%), Computers, Engineering & Science (100.0%), and Computers & Mathematics (100.0%), while the most female-oriented occupations are Community & Social Service (100.0%), Education, Arts & Media (100.0%), and Education Instruction & Library (100.0%).
| Occupation | Male | Female |
| Management | 39 (100.0%) | 0 (0.0%) |
| Business & Financial | 73 (45.9%) | 86 (54.1%) |
| Computers, Engineering & Science | 18 (100.0%) | 0 (0.0%) |
| Computers & Mathematics | 8 (100.0%) | 0 (0.0%) |
| Architecture & Engineering | 10 (100.0%) | 0 (0.0%) |
| Life, Physical & Social Science | 0 (0.0%) | 0 (0.0%) |
| Community & Social Service | 0 (0.0%) | 48 (100.0%) |
| Education, Arts & Media | 0 (0.0%) | 9 (100.0%) |
| Legal Services & Support | 0 (0.0%) | 0 (0.0%) |
| Education Instruction & Library | 0 (0.0%) | 39 (100.0%) |
| Arts, Media & Entertainment | 0 (0.0%) | 0 (0.0%) |
| Health Diagnosing & Treating | 0 (0.0%) | 0 (0.0%) |
| Health Technologists | 0 (0.0%) | 0 (0.0%) |
| Total (Category) | 130 (49.2%) | 134 (50.8%) |
| Total (Overall) | 336 (55.4%) | 270 (44.6%) |
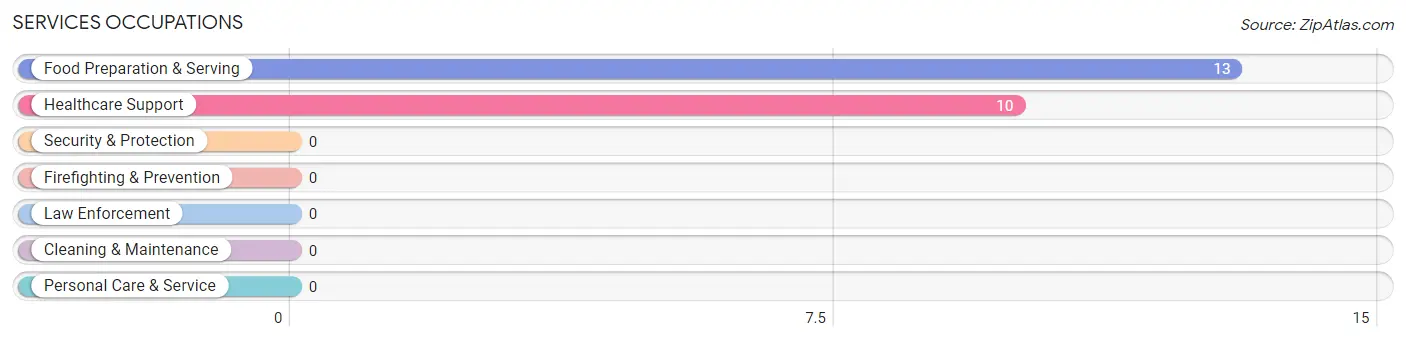
Services Occupations
The most common Services occupations in Bull Run Mountain Estates are Food Preparation & Serving (13 | 2.1%), and Healthcare Support (10 | 1.7%).
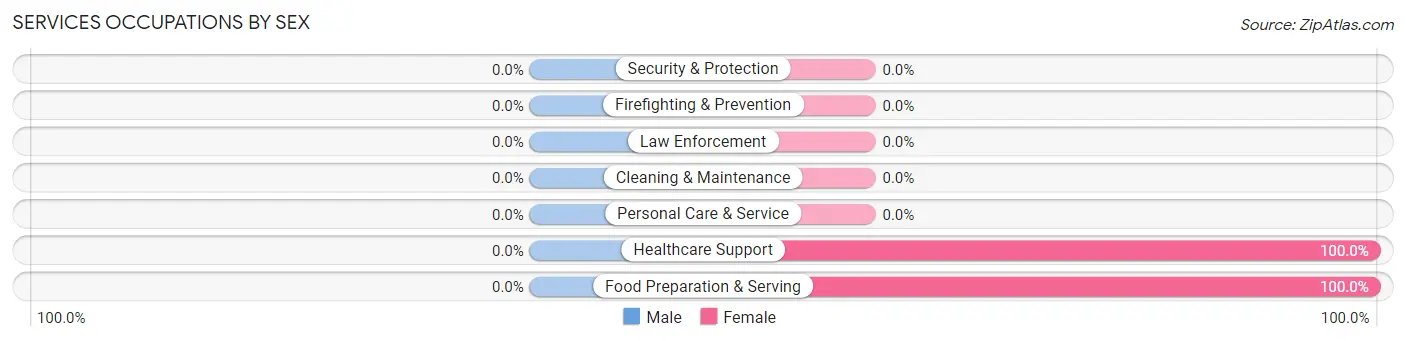
Services Occupations by Sex
| Occupation | Male | Female |
| Healthcare Support | 0 (0.0%) | 10 (100.0%) |
| Security & Protection | 0 (0.0%) | 0 (0.0%) |
| Firefighting & Prevention | 0 (0.0%) | 0 (0.0%) |
| Law Enforcement | 0 (0.0%) | 0 (0.0%) |
| Food Preparation & Serving | 0 (0.0%) | 13 (100.0%) |
| Cleaning & Maintenance | 0 (0.0%) | 0 (0.0%) |
| Personal Care & Service | 0 (0.0%) | 0 (0.0%) |
| Total (Category) | 0 (0.0%) | 23 (100.0%) |
| Total (Overall) | 336 (55.4%) | 270 (44.6%) |
Sales and Office Occupations
The most common Sales and Office occupations in Bull Run Mountain Estates are Office & Administration (103 | 17.0%), and Sales & Related (14 | 2.3%).
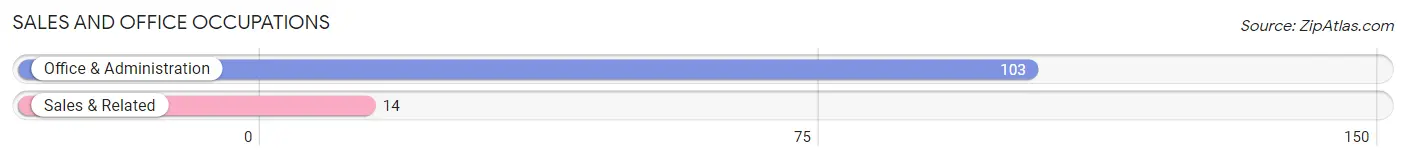
Sales and Office Occupations by Sex

| Occupation | Male | Female |
| Sales & Related | 14 (100.0%) | 0 (0.0%) |
| Office & Administration | 0 (0.0%) | 103 (100.0%) |
| Total (Category) | 14 (12.0%) | 103 (88.0%) |
| Total (Overall) | 336 (55.4%) | 270 (44.6%) |
Natural Resources, Construction and Maintenance Occupations
The most common Natural Resources, Construction and Maintenance occupations in Bull Run Mountain Estates are , and Installation, Maintenance & Repair (50 | 8.3%).
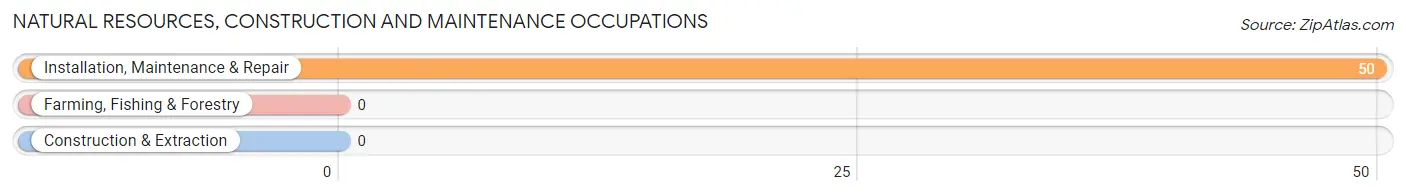
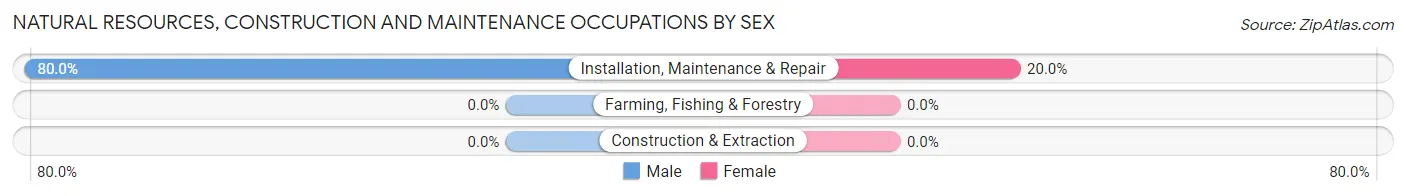
Natural Resources, Construction and Maintenance Occupations by Sex
| Occupation | Male | Female |
| Farming, Fishing & Forestry | 0 (0.0%) | 0 (0.0%) |
| Construction & Extraction | 0 (0.0%) | 0 (0.0%) |
| Installation, Maintenance & Repair | 40 (80.0%) | 10 (20.0%) |
| Total (Category) | 40 (80.0%) | 10 (20.0%) |
| Total (Overall) | 336 (55.4%) | 270 (44.6%) |
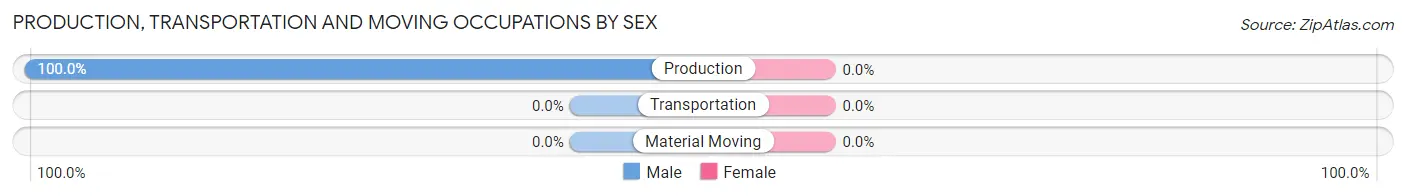
Production, Transportation and Moving Occupations
The most common Production, Transportation and Moving occupations in Bull Run Mountain Estates are , and Production (152 | 25.1%).
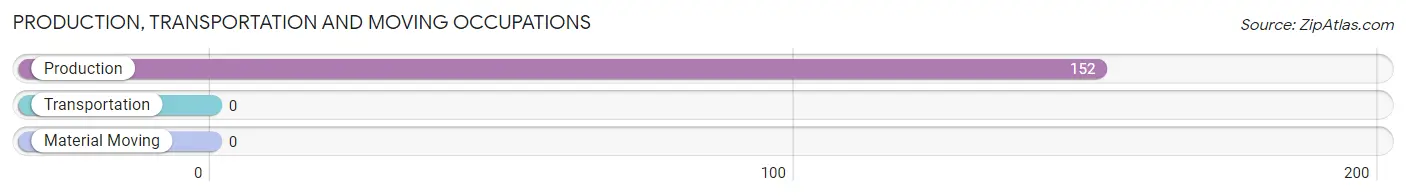
Production, Transportation and Moving Occupations by Sex
| Occupation | Male | Female |
| Production | 152 (100.0%) | 0 (0.0%) |
| Transportation | 0 (0.0%) | 0 (0.0%) |
| Material Moving | 0 (0.0%) | 0 (0.0%) |
| Total (Category) | 152 (100.0%) | 0 (0.0%) |
| Total (Overall) | 336 (55.4%) | 270 (44.6%) |
Employment Industries by Sex in Bull Run Mountain Estates
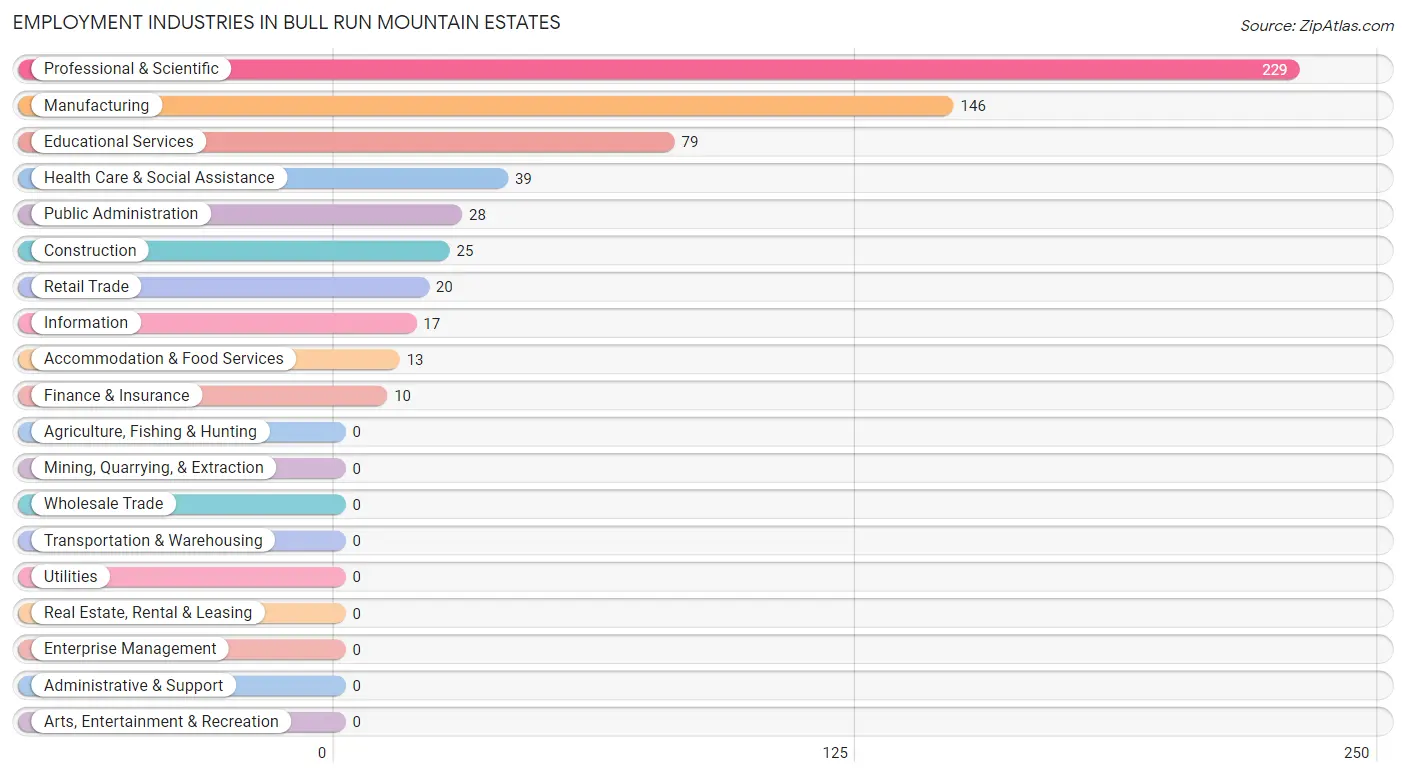
Employment Industries in Bull Run Mountain Estates
The major employment industries in Bull Run Mountain Estates include Professional & Scientific (229 | 37.8%), Manufacturing (146 | 24.1%), Educational Services (79 | 13.0%), Health Care & Social Assistance (39 | 6.4%), and Public Administration (28 | 4.6%).
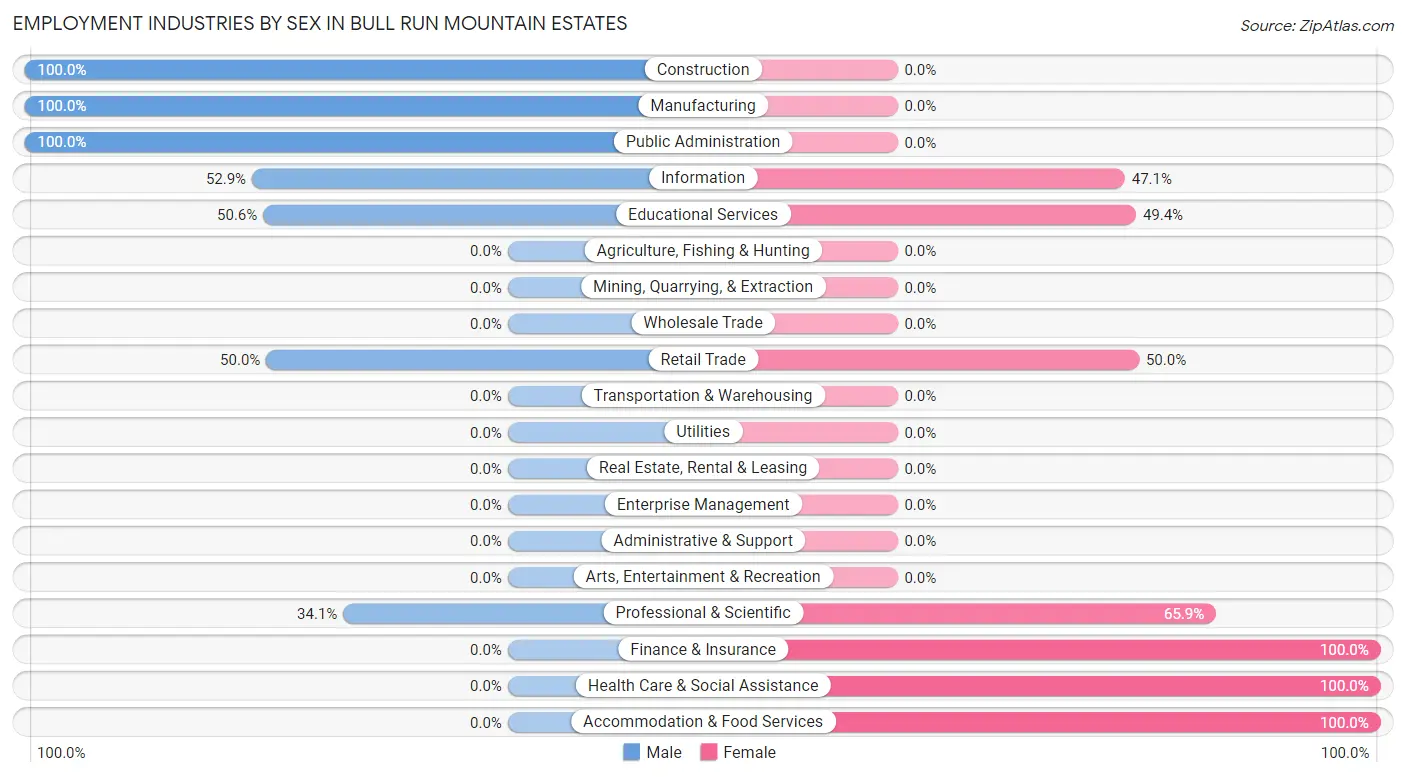
Employment Industries by Sex in Bull Run Mountain Estates
The Bull Run Mountain Estates industries that see more men than women are Construction (100.0%), Manufacturing (100.0%), and Public Administration (100.0%), whereas the industries that tend to have a higher number of women are Finance & Insurance (100.0%), Health Care & Social Assistance (100.0%), and Accommodation & Food Services (100.0%).
| Industry | Male | Female |
| Agriculture, Fishing & Hunting | 0 (0.0%) | 0 (0.0%) |
| Mining, Quarrying, & Extraction | 0 (0.0%) | 0 (0.0%) |
| Construction | 25 (100.0%) | 0 (0.0%) |
| Manufacturing | 146 (100.0%) | 0 (0.0%) |
| Wholesale Trade | 0 (0.0%) | 0 (0.0%) |
| Retail Trade | 10 (50.0%) | 10 (50.0%) |
| Transportation & Warehousing | 0 (0.0%) | 0 (0.0%) |
| Utilities | 0 (0.0%) | 0 (0.0%) |
| Information | 9 (52.9%) | 8 (47.1%) |
| Finance & Insurance | 0 (0.0%) | 10 (100.0%) |
| Real Estate, Rental & Leasing | 0 (0.0%) | 0 (0.0%) |
| Professional & Scientific | 78 (34.1%) | 151 (65.9%) |
| Enterprise Management | 0 (0.0%) | 0 (0.0%) |
| Administrative & Support | 0 (0.0%) | 0 (0.0%) |
| Educational Services | 40 (50.6%) | 39 (49.4%) |
| Health Care & Social Assistance | 0 (0.0%) | 39 (100.0%) |
| Arts, Entertainment & Recreation | 0 (0.0%) | 0 (0.0%) |
| Accommodation & Food Services | 0 (0.0%) | 13 (100.0%) |
| Public Administration | 28 (100.0%) | 0 (0.0%) |
| Total | 336 (55.4%) | 270 (44.6%) |
Education in Bull Run Mountain Estates
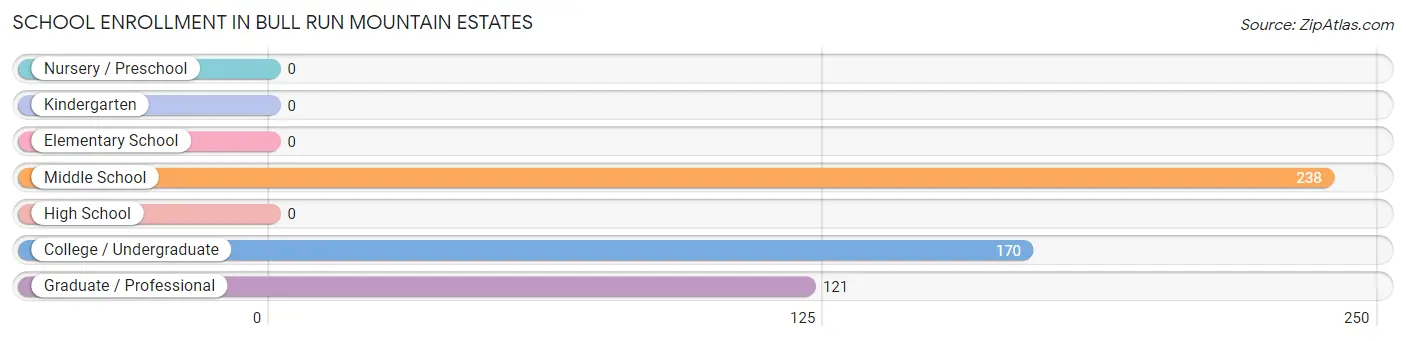
School Enrollment in Bull Run Mountain Estates
The most common levels of schooling among the 529 students in Bull Run Mountain Estates are middle school (238 | 45.0%), college / undergraduate (170 | 32.1%), and graduate / professional (121 | 22.9%).
| School Level | # Students | % Students |
| Nursery / Preschool | 0 | 0.0% |
| Kindergarten | 0 | 0.0% |
| Elementary School | 0 | 0.0% |
| Middle School | 238 | 45.0% |
| High School | 0 | 0.0% |
| College / Undergraduate | 170 | 32.1% |
| Graduate / Professional | 121 | 22.9% |
| Total | 529 | 100.0% |
School Enrollment by Age by Funding Source in Bull Run Mountain Estates
Out of a total of 529 students who are enrolled in schools in Bull Run Mountain Estates, 167 (31.6%) attend a private institution, while the remaining 362 (68.4%) are enrolled in public schools. The age group of 35 years and over has the highest likelihood of being enrolled in private schools, with 155 (92.8% in the age bracket) enrolled. Conversely, the age group of 10 to 14 year olds has the lowest likelihood of being enrolled in a private school, with 238 (100.0% in the age bracket) attending a public institution.
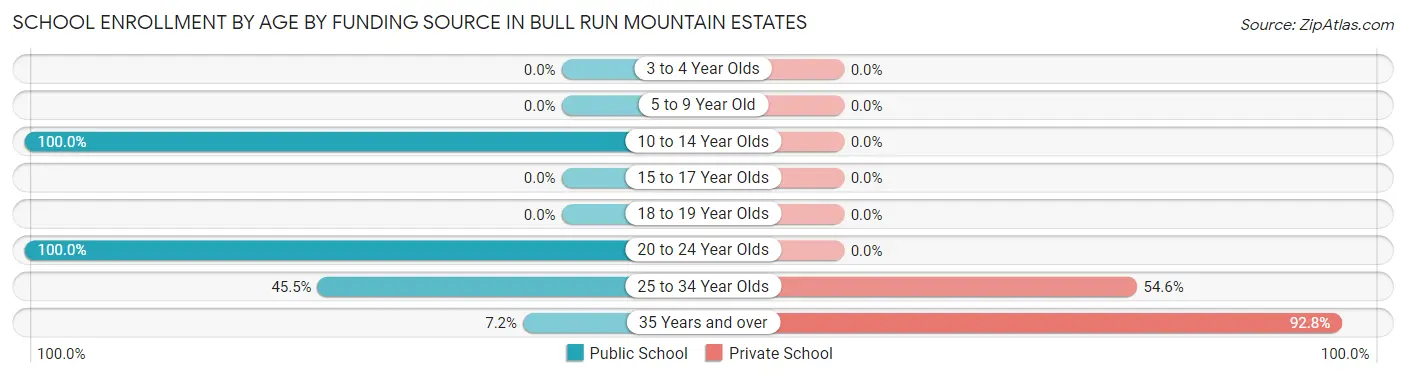
| Age Bracket | Public School | Private School |
| 3 to 4 Year Olds | 0 (0.0%) | 0 (0.0%) |
| 5 to 9 Year Old | 0 (0.0%) | 0 (0.0%) |
| 10 to 14 Year Olds | 238 (100.0%) | 0 (0.0%) |
| 15 to 17 Year Olds | 0 (0.0%) | 0 (0.0%) |
| 18 to 19 Year Olds | 0 (0.0%) | 0 (0.0%) |
| 20 to 24 Year Olds | 102 (100.0%) | 0 (0.0%) |
| 25 to 34 Year Olds | 10 (45.5%) | 12 (54.5%) |
| 35 Years and over | 12 (7.2%) | 155 (92.8%) |
| Total | 362 (68.4%) | 167 (31.6%) |
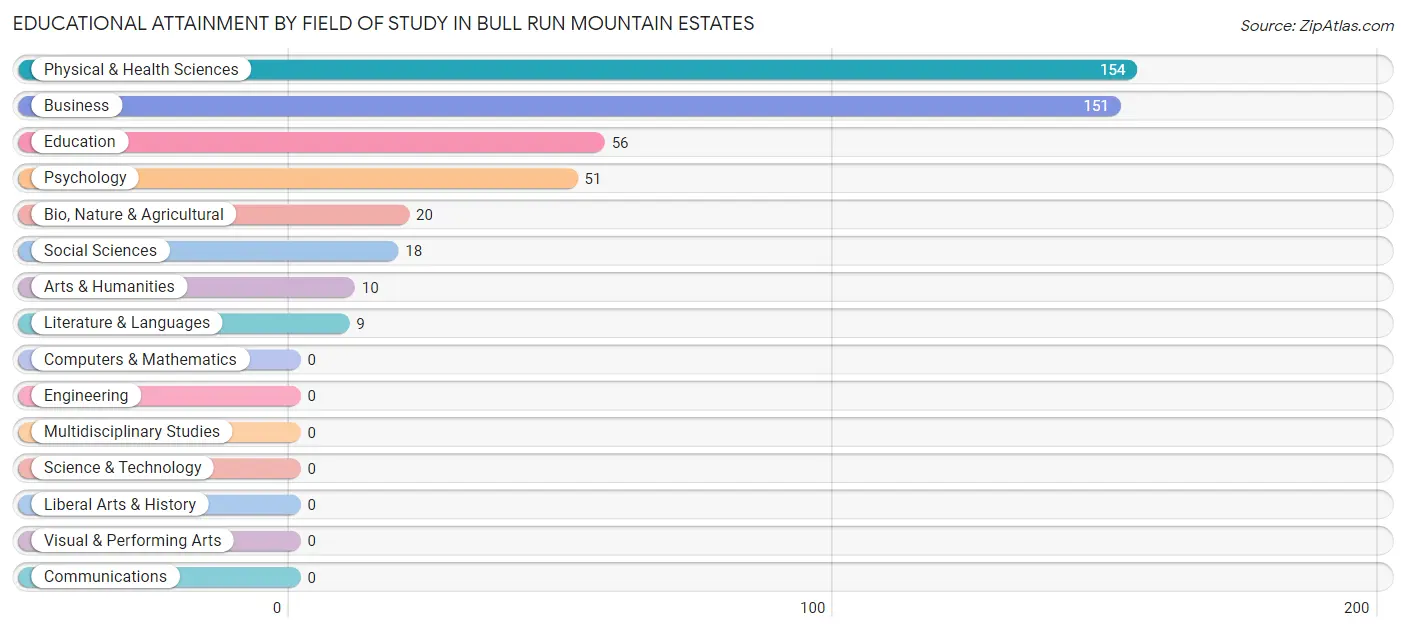
Educational Attainment by Field of Study in Bull Run Mountain Estates
Physical & health sciences (154 | 32.8%), business (151 | 32.2%), education (56 | 11.9%), psychology (51 | 10.9%), and bio, nature & agricultural (20 | 4.3%) are the most common fields of study among 469 individuals in Bull Run Mountain Estates who have obtained a bachelor's degree or higher.
| Field of Study | # Graduates | % Graduates |
| Computers & Mathematics | 0 | 0.0% |
| Bio, Nature & Agricultural | 20 | 4.3% |
| Physical & Health Sciences | 154 | 32.8% |
| Psychology | 51 | 10.9% |
| Social Sciences | 18 | 3.8% |
| Engineering | 0 | 0.0% |
| Multidisciplinary Studies | 0 | 0.0% |
| Science & Technology | 0 | 0.0% |
| Business | 151 | 32.2% |
| Education | 56 | 11.9% |
| Literature & Languages | 9 | 1.9% |
| Liberal Arts & History | 0 | 0.0% |
| Visual & Performing Arts | 0 | 0.0% |
| Communications | 0 | 0.0% |
| Arts & Humanities | 10 | 2.1% |
| Total | 469 | 100.0% |
Transportation & Commute in Bull Run Mountain Estates
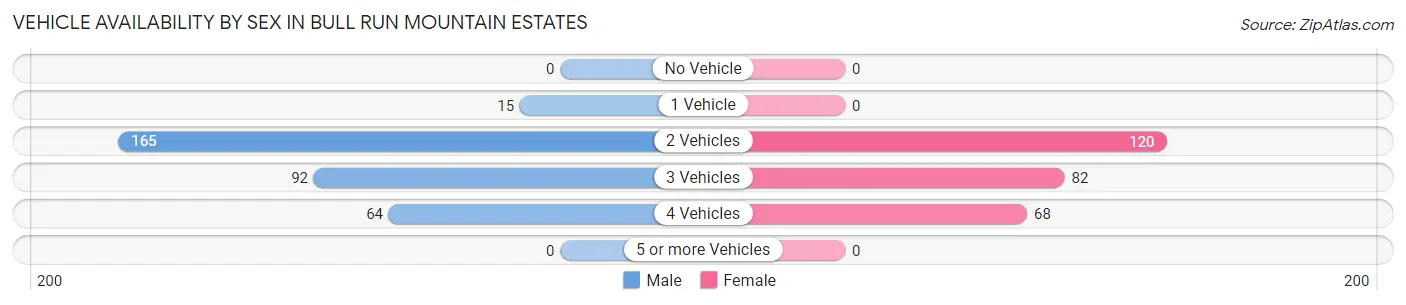
Vehicle Availability by Sex in Bull Run Mountain Estates
The most prevalent vehicle ownership categories in Bull Run Mountain Estates are males with 2 vehicles (165, accounting for 49.1%) and females with 2 vehicles (120, making up 61.1%).
| Vehicles Available | Male | Female |
| No Vehicle | 0 (0.0%) | 0 (0.0%) |
| 1 Vehicle | 15 (4.5%) | 0 (0.0%) |
| 2 Vehicles | 165 (49.1%) | 120 (44.4%) |
| 3 Vehicles | 92 (27.4%) | 82 (30.4%) |
| 4 Vehicles | 64 (19.1%) | 68 (25.2%) |
| 5 or more Vehicles | 0 (0.0%) | 0 (0.0%) |
| Total | 336 (100.0%) | 270 (100.0%) |
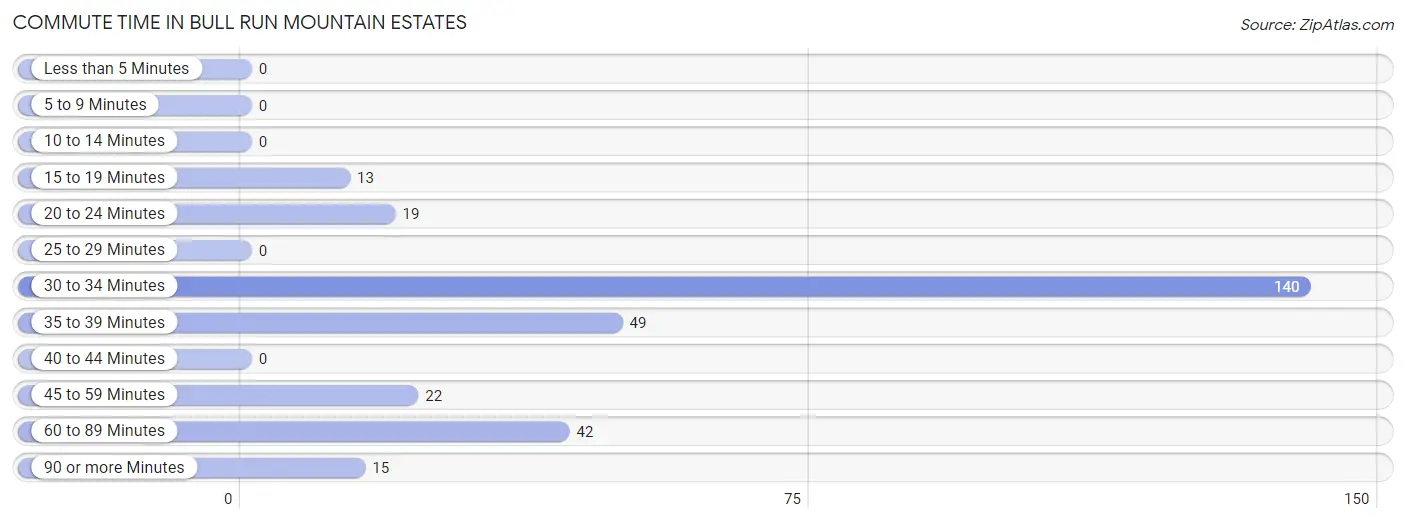
Commute Time in Bull Run Mountain Estates
The most frequently occuring commute durations in Bull Run Mountain Estates are 30 to 34 minutes (140 commuters, 46.7%), 35 to 39 minutes (49 commuters, 16.3%), and 60 to 89 minutes (42 commuters, 14.0%).
| Commute Time | # Commuters | % Commuters |
| Less than 5 Minutes | 0 | 0.0% |
| 5 to 9 Minutes | 0 | 0.0% |
| 10 to 14 Minutes | 0 | 0.0% |
| 15 to 19 Minutes | 13 | 4.3% |
| 20 to 24 Minutes | 19 | 6.3% |
| 25 to 29 Minutes | 0 | 0.0% |
| 30 to 34 Minutes | 140 | 46.7% |
| 35 to 39 Minutes | 49 | 16.3% |
| 40 to 44 Minutes | 0 | 0.0% |
| 45 to 59 Minutes | 22 | 7.3% |
| 60 to 89 Minutes | 42 | 14.0% |
| 90 or more Minutes | 15 | 5.0% |
Commute Time by Sex in Bull Run Mountain Estates
The most common commute times in Bull Run Mountain Estates are 30 to 34 minutes (49 commuters, 38.9%) for males and 30 to 34 minutes (91 commuters, 52.3%) for females.
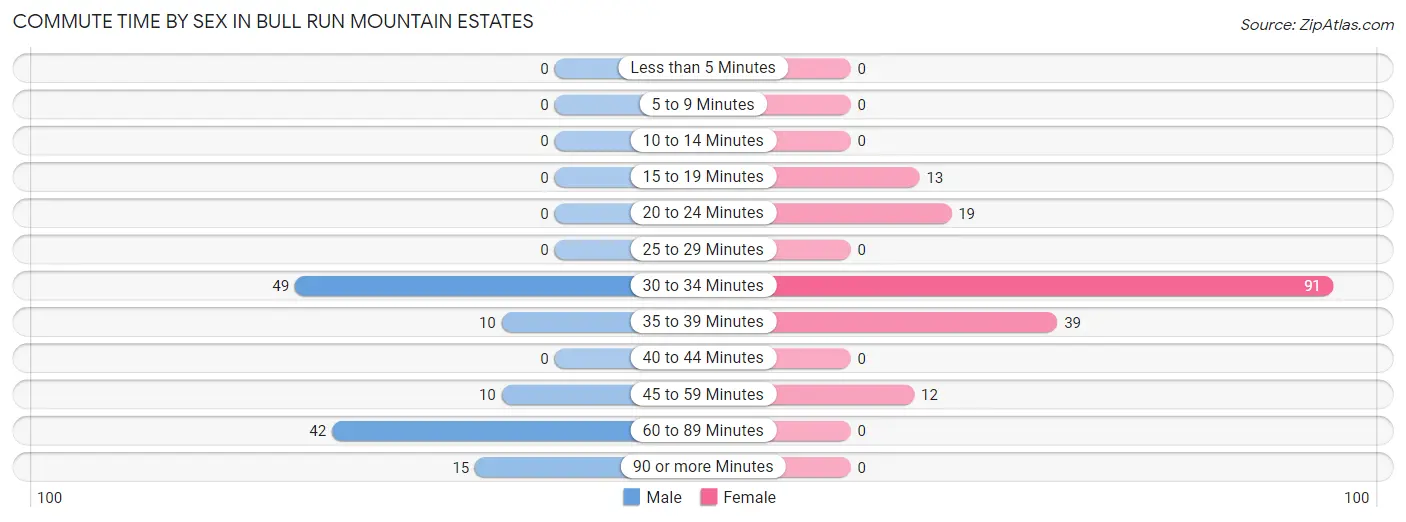
| Commute Time | Male | Female |
| Less than 5 Minutes | 0 (0.0%) | 0 (0.0%) |
| 5 to 9 Minutes | 0 (0.0%) | 0 (0.0%) |
| 10 to 14 Minutes | 0 (0.0%) | 0 (0.0%) |
| 15 to 19 Minutes | 0 (0.0%) | 13 (7.5%) |
| 20 to 24 Minutes | 0 (0.0%) | 19 (10.9%) |
| 25 to 29 Minutes | 0 (0.0%) | 0 (0.0%) |
| 30 to 34 Minutes | 49 (38.9%) | 91 (52.3%) |
| 35 to 39 Minutes | 10 (7.9%) | 39 (22.4%) |
| 40 to 44 Minutes | 0 (0.0%) | 0 (0.0%) |
| 45 to 59 Minutes | 10 (7.9%) | 12 (6.9%) |
| 60 to 89 Minutes | 42 (33.3%) | 0 (0.0%) |
| 90 or more Minutes | 15 (11.9%) | 0 (0.0%) |
Time of Departure to Work by Sex in Bull Run Mountain Estates
The most frequent times of departure to work in Bull Run Mountain Estates are 6:00 AM to 6:29 AM (40, 31.8%) for males and 8:00 AM to 8:29 AM (93, 53.4%) for females.
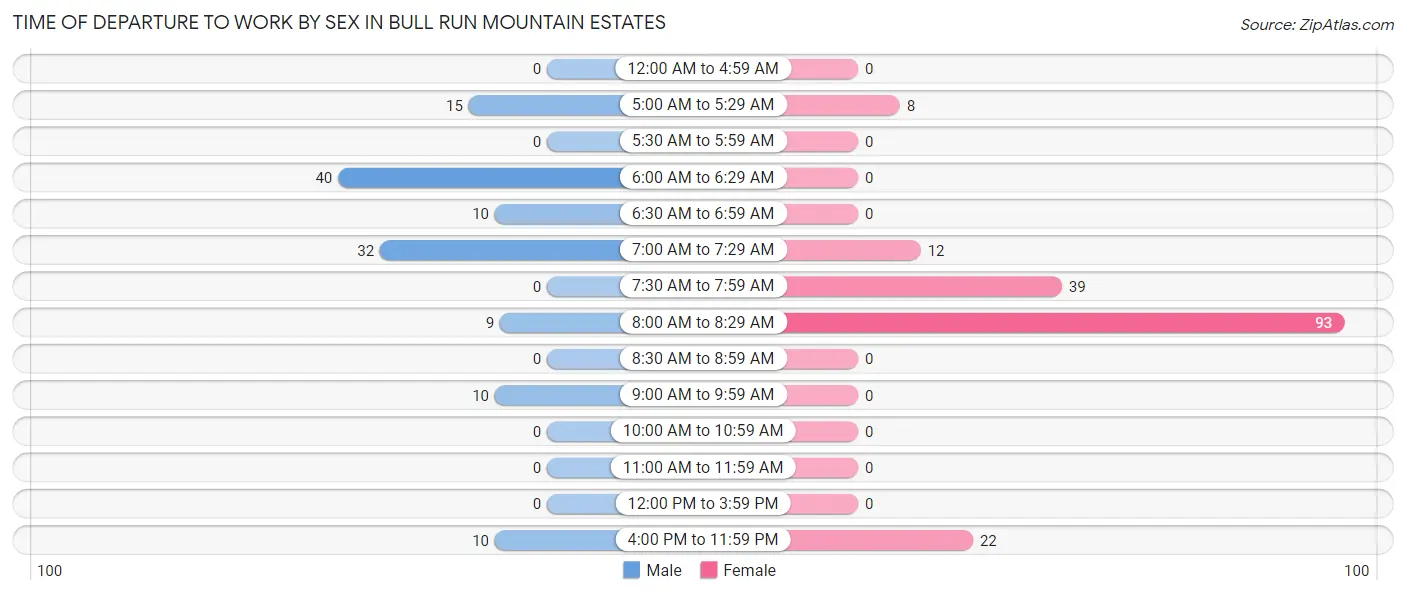
| Time of Departure | Male | Female |
| 12:00 AM to 4:59 AM | 0 (0.0%) | 0 (0.0%) |
| 5:00 AM to 5:29 AM | 15 (11.9%) | 8 (4.6%) |
| 5:30 AM to 5:59 AM | 0 (0.0%) | 0 (0.0%) |
| 6:00 AM to 6:29 AM | 40 (31.8%) | 0 (0.0%) |
| 6:30 AM to 6:59 AM | 10 (7.9%) | 0 (0.0%) |
| 7:00 AM to 7:29 AM | 32 (25.4%) | 12 (6.9%) |
| 7:30 AM to 7:59 AM | 0 (0.0%) | 39 (22.4%) |
| 8:00 AM to 8:29 AM | 9 (7.1%) | 93 (53.4%) |
| 8:30 AM to 8:59 AM | 0 (0.0%) | 0 (0.0%) |
| 9:00 AM to 9:59 AM | 10 (7.9%) | 0 (0.0%) |
| 10:00 AM to 10:59 AM | 0 (0.0%) | 0 (0.0%) |
| 11:00 AM to 11:59 AM | 0 (0.0%) | 0 (0.0%) |
| 12:00 PM to 3:59 PM | 0 (0.0%) | 0 (0.0%) |
| 4:00 PM to 11:59 PM | 10 (7.9%) | 22 (12.6%) |
| Total | 126 (100.0%) | 174 (100.0%) |
Housing Occupancy in Bull Run Mountain Estates
Occupancy by Ownership in Bull Run Mountain Estates
Of the total 434 dwellings in Bull Run Mountain Estates, owner-occupied units account for 434 (100.0%), while renter-occupied units make up 0 (0.0%).
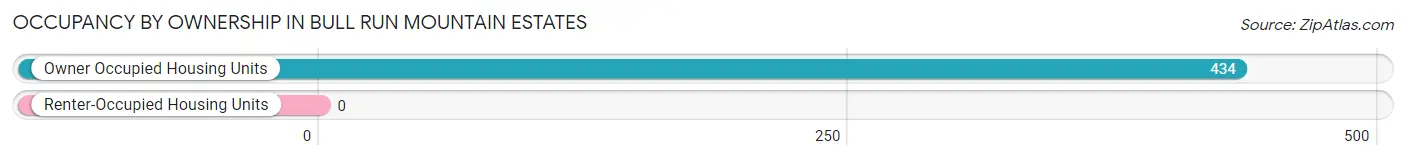
| Occupancy | # Housing Units | % Housing Units |
| Owner Occupied Housing Units | 434 | 100.0% |
| Renter-Occupied Housing Units | 0 | 0.0% |
| Total Occupied Housing Units | 434 | 100.0% |
Occupancy by Household Size in Bull Run Mountain Estates
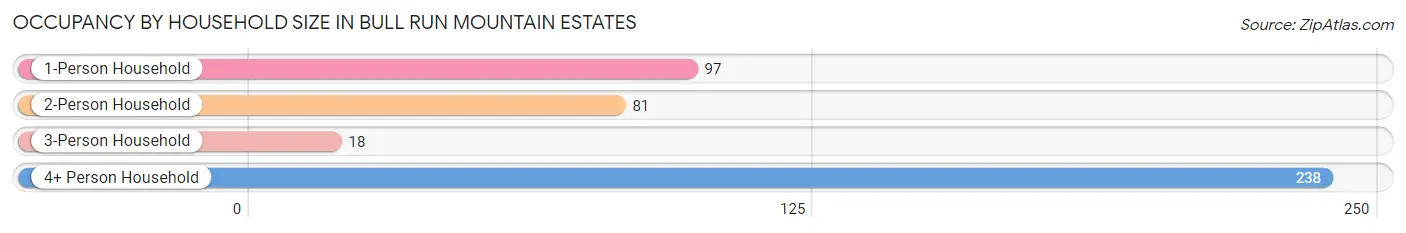
| Household Size | # Housing Units | % Housing Units |
| 1-Person Household | 97 | 22.4% |
| 2-Person Household | 81 | 18.7% |
| 3-Person Household | 18 | 4.2% |
| 4+ Person Household | 238 | 54.8% |
| Total Housing Units | 434 | 100.0% |
Occupancy by Ownership by Household Size in Bull Run Mountain Estates
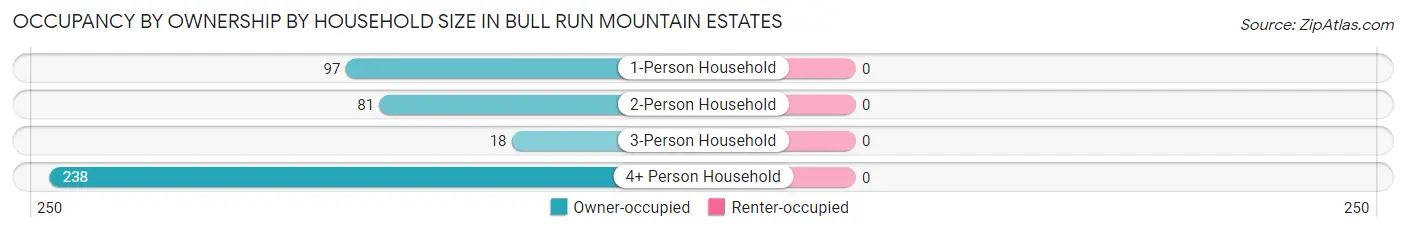
| Household Size | Owner-occupied | Renter-occupied |
| 1-Person Household | 97 (100.0%) | 0 (0.0%) |
| 2-Person Household | 81 (100.0%) | 0 (0.0%) |
| 3-Person Household | 18 (100.0%) | 0 (0.0%) |
| 4+ Person Household | 238 (100.0%) | 0 (0.0%) |
| Total Housing Units | 434 (100.0%) | 0 (0.0%) |
Occupancy by Educational Attainment in Bull Run Mountain Estates
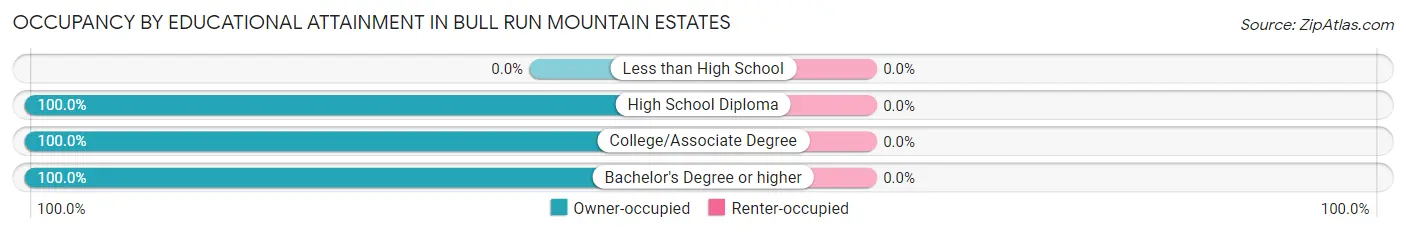
| Household Size | Owner-occupied | Renter-occupied |
| Less than High School | 0 (0.0%) | 0 (0.0%) |
| High School Diploma | 60 (100.0%) | 0 (0.0%) |
| College/Associate Degree | 48 (100.0%) | 0 (0.0%) |
| Bachelor's Degree or higher | 326 (100.0%) | 0 (0.0%) |
Occupancy by Age of Householder in Bull Run Mountain Estates
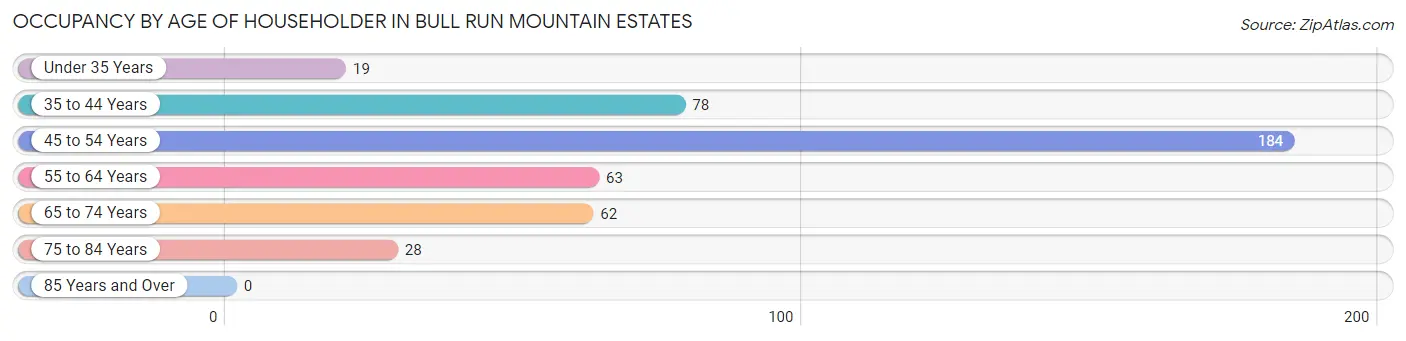
| Age Bracket | # Households | % Households |
| Under 35 Years | 19 | 4.4% |
| 35 to 44 Years | 78 | 18.0% |
| 45 to 54 Years | 184 | 42.4% |
| 55 to 64 Years | 63 | 14.5% |
| 65 to 74 Years | 62 | 14.3% |
| 75 to 84 Years | 28 | 6.5% |
| 85 Years and Over | 0 | 0.0% |
| Total | 434 | 100.0% |
Housing Finances in Bull Run Mountain Estates
Median Income by Occupancy in Bull Run Mountain Estates
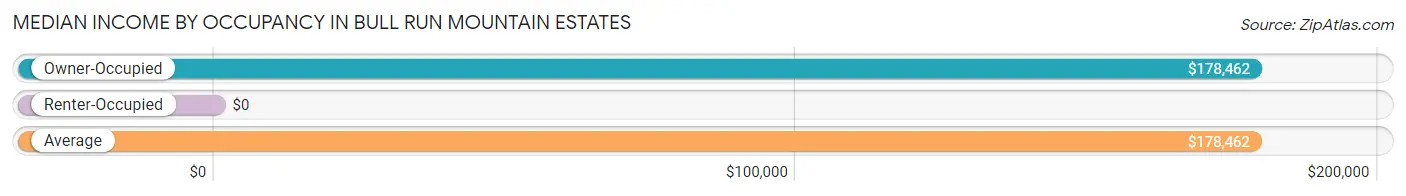
| Occupancy Type | # Households | Median Income |
| Owner-Occupied | 434 (100.0%) | $178,462 |
| Renter-Occupied | 0 (0.0%) | $0 |
| Average | 434 (100.0%) | $178,462 |
Occupancy by Householder Income Bracket in Bull Run Mountain Estates
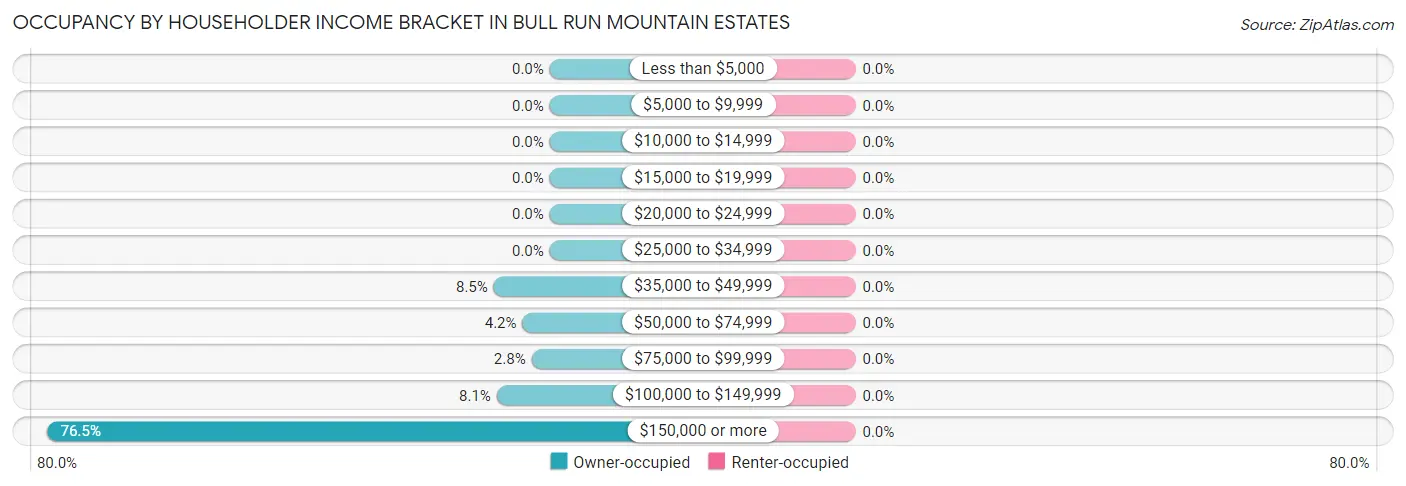
| Income Bracket | Owner-occupied | Renter-occupied |
| Less than $5,000 | 0 (0.0%) | 0 (0.0%) |
| $5,000 to $9,999 | 0 (0.0%) | 0 (0.0%) |
| $10,000 to $14,999 | 0 (0.0%) | 0 (0.0%) |
| $15,000 to $19,999 | 0 (0.0%) | 0 (0.0%) |
| $20,000 to $24,999 | 0 (0.0%) | 0 (0.0%) |
| $25,000 to $34,999 | 0 (0.0%) | 0 (0.0%) |
| $35,000 to $49,999 | 37 (8.5%) | 0 (0.0%) |
| $50,000 to $74,999 | 18 (4.2%) | 0 (0.0%) |
| $75,000 to $99,999 | 12 (2.8%) | 0 (0.0%) |
| $100,000 to $149,999 | 35 (8.1%) | 0 (0.0%) |
| $150,000 or more | 332 (76.5%) | 0 (0.0%) |
| Total | 434 (100.0%) | 0 (0.0%) |
Monthly Housing Cost Tiers in Bull Run Mountain Estates
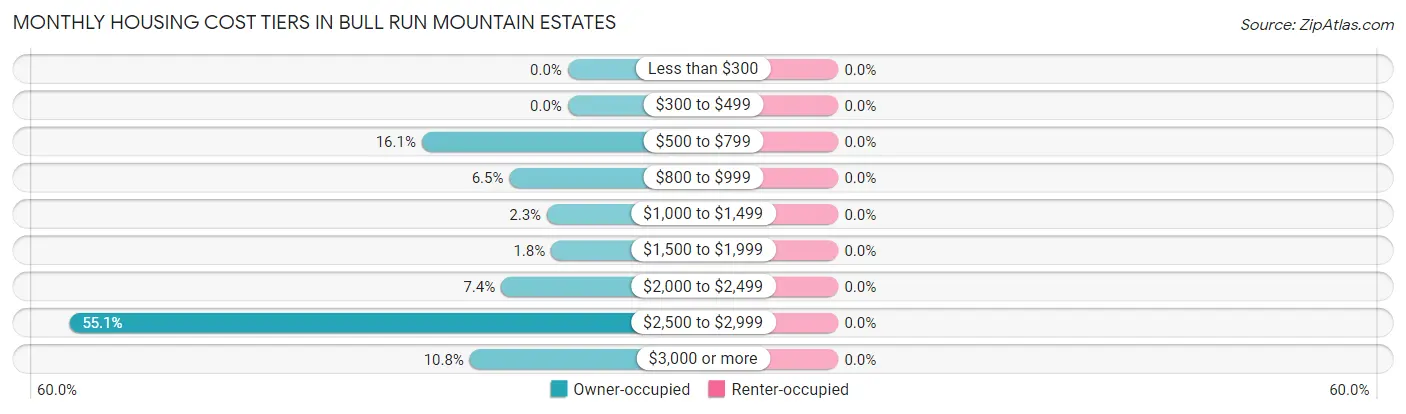
| Monthly Cost | Owner-occupied | Renter-occupied |
| Less than $300 | 0 (0.0%) | 0 (0.0%) |
| $300 to $499 | 0 (0.0%) | 0 (0.0%) |
| $500 to $799 | 70 (16.1%) | 0 (0.0%) |
| $800 to $999 | 28 (6.5%) | 0 (0.0%) |
| $1,000 to $1,499 | 10 (2.3%) | 0 (0.0%) |
| $1,500 to $1,999 | 8 (1.8%) | 0 (0.0%) |
| $2,000 to $2,499 | 32 (7.4%) | 0 (0.0%) |
| $2,500 to $2,999 | 239 (55.1%) | 0 (0.0%) |
| $3,000 or more | 47 (10.8%) | 0 (0.0%) |
| Total | 434 (100.0%) | 0 (0.0%) |
Physical Housing Characteristics in Bull Run Mountain Estates
Housing Structures in Bull Run Mountain Estates
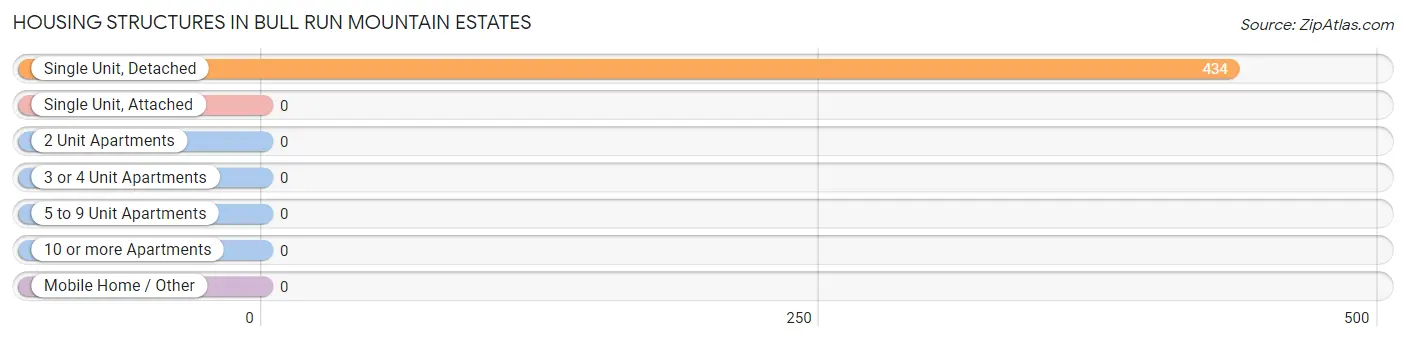
| Structure Type | # Housing Units | % Housing Units |
| Single Unit, Detached | 434 | 100.0% |
| Single Unit, Attached | 0 | 0.0% |
| 2 Unit Apartments | 0 | 0.0% |
| 3 or 4 Unit Apartments | 0 | 0.0% |
| 5 to 9 Unit Apartments | 0 | 0.0% |
| 10 or more Apartments | 0 | 0.0% |
| Mobile Home / Other | 0 | 0.0% |
| Total | 434 | 100.0% |
Housing Structures by Occupancy in Bull Run Mountain Estates
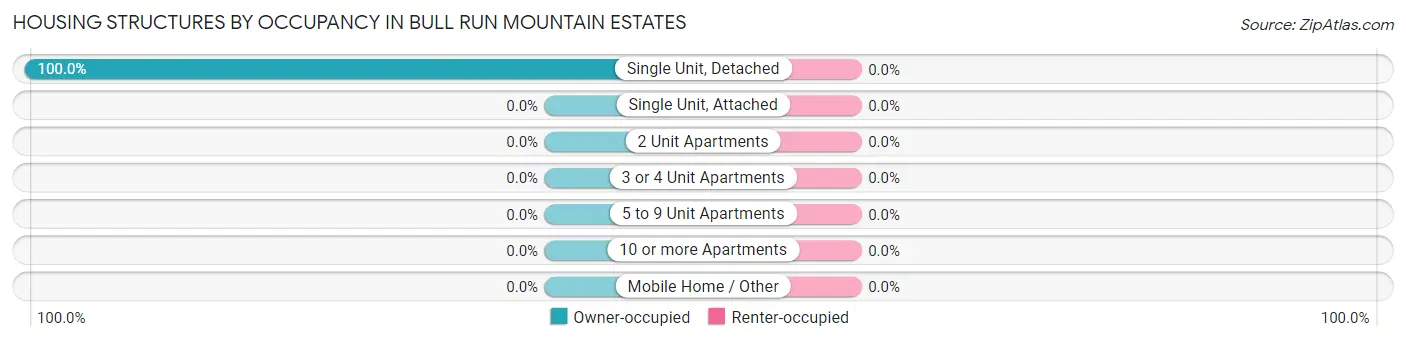
| Structure Type | Owner-occupied | Renter-occupied |
| Single Unit, Detached | 434 (100.0%) | 0 (0.0%) |
| Single Unit, Attached | 0 (0.0%) | 0 (0.0%) |
| 2 Unit Apartments | 0 (0.0%) | 0 (0.0%) |
| 3 or 4 Unit Apartments | 0 (0.0%) | 0 (0.0%) |
| 5 to 9 Unit Apartments | 0 (0.0%) | 0 (0.0%) |
| 10 or more Apartments | 0 (0.0%) | 0 (0.0%) |
| Mobile Home / Other | 0 (0.0%) | 0 (0.0%) |
| Total | 434 (100.0%) | 0 (0.0%) |
Housing Structures by Number of Rooms in Bull Run Mountain Estates
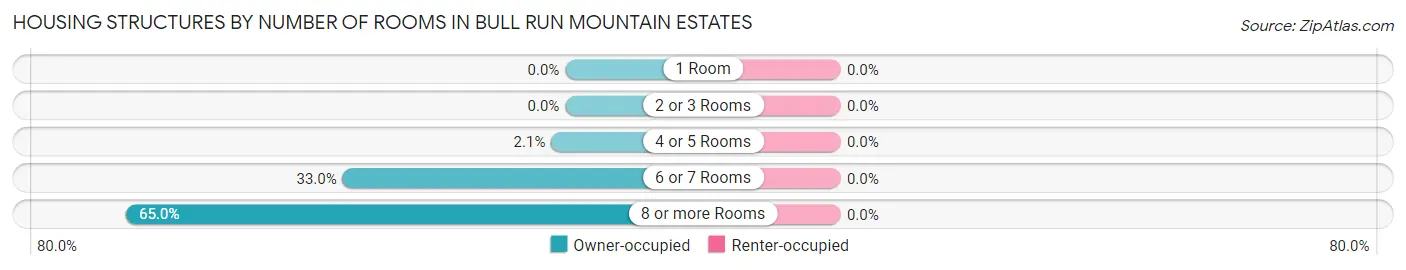
| Number of Rooms | Owner-occupied | Renter-occupied |
| 1 Room | 0 (0.0%) | 0 (0.0%) |
| 2 or 3 Rooms | 0 (0.0%) | 0 (0.0%) |
| 4 or 5 Rooms | 9 (2.1%) | 0 (0.0%) |
| 6 or 7 Rooms | 143 (33.0%) | 0 (0.0%) |
| 8 or more Rooms | 282 (65.0%) | 0 (0.0%) |
| Total | 434 (100.0%) | 0 (0.0%) |
Housing Structure by Heating Type in Bull Run Mountain Estates
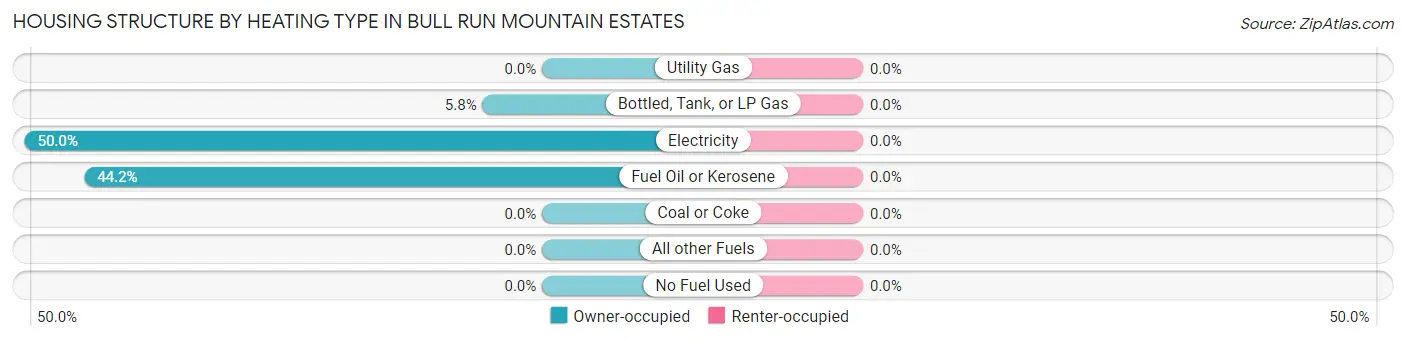
| Heating Type | Owner-occupied | Renter-occupied |
| Utility Gas | 0 (0.0%) | 0 (0.0%) |
| Bottled, Tank, or LP Gas | 25 (5.8%) | 0 (0.0%) |
| Electricity | 217 (50.0%) | 0 (0.0%) |
| Fuel Oil or Kerosene | 192 (44.2%) | 0 (0.0%) |
| Coal or Coke | 0 (0.0%) | 0 (0.0%) |
| All other Fuels | 0 (0.0%) | 0 (0.0%) |
| No Fuel Used | 0 (0.0%) | 0 (0.0%) |
| Total | 434 (100.0%) | 0 (0.0%) |
Household Vehicle Usage in Bull Run Mountain Estates
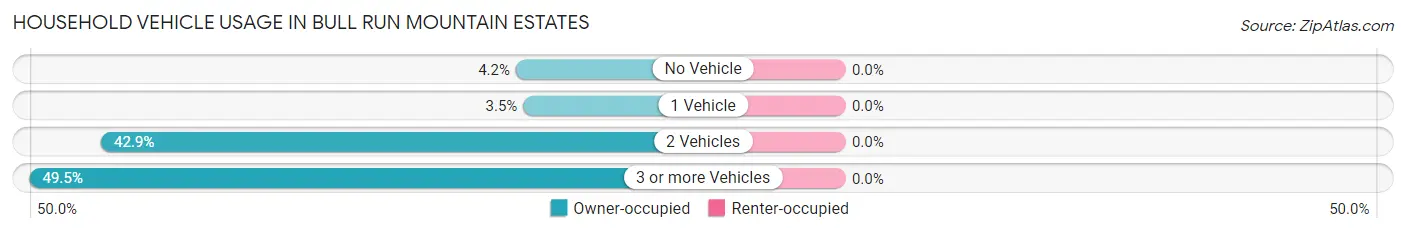
| Vehicles per Household | Owner-occupied | Renter-occupied |
| No Vehicle | 18 (4.2%) | 0 (0.0%) |
| 1 Vehicle | 15 (3.5%) | 0 (0.0%) |
| 2 Vehicles | 186 (42.9%) | 0 (0.0%) |
| 3 or more Vehicles | 215 (49.5%) | 0 (0.0%) |
| Total | 434 (100.0%) | 0 (0.0%) |
Real Estate & Mortgages in Bull Run Mountain Estates
Real Estate and Mortgage Overview in Bull Run Mountain Estates
| Characteristic | Without Mortgage | With Mortgage |
| Housing Units | 108 | 326 |
| Median Property Value | $430,400 | $622,100 |
| Median Household Income | - | - |
| Monthly Housing Costs | $777 | $47 |
| Real Estate Taxes | $5,500 | $0 |
Property Value by Mortgage Status in Bull Run Mountain Estates
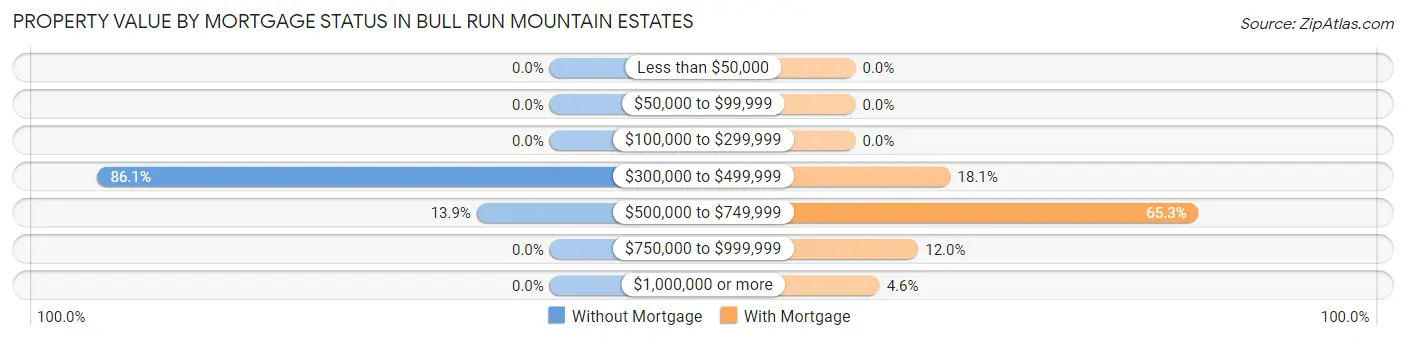
| Property Value | Without Mortgage | With Mortgage |
| Less than $50,000 | 0 (0.0%) | 0 (0.0%) |
| $50,000 to $99,999 | 0 (0.0%) | 0 (0.0%) |
| $100,000 to $299,999 | 0 (0.0%) | 0 (0.0%) |
| $300,000 to $499,999 | 93 (86.1%) | 59 (18.1%) |
| $500,000 to $749,999 | 15 (13.9%) | 213 (65.3%) |
| $750,000 to $999,999 | 0 (0.0%) | 39 (12.0%) |
| $1,000,000 or more | 0 (0.0%) | 15 (4.6%) |
| Total | 108 (100.0%) | 326 (100.0%) |
Household Income by Mortgage Status in Bull Run Mountain Estates
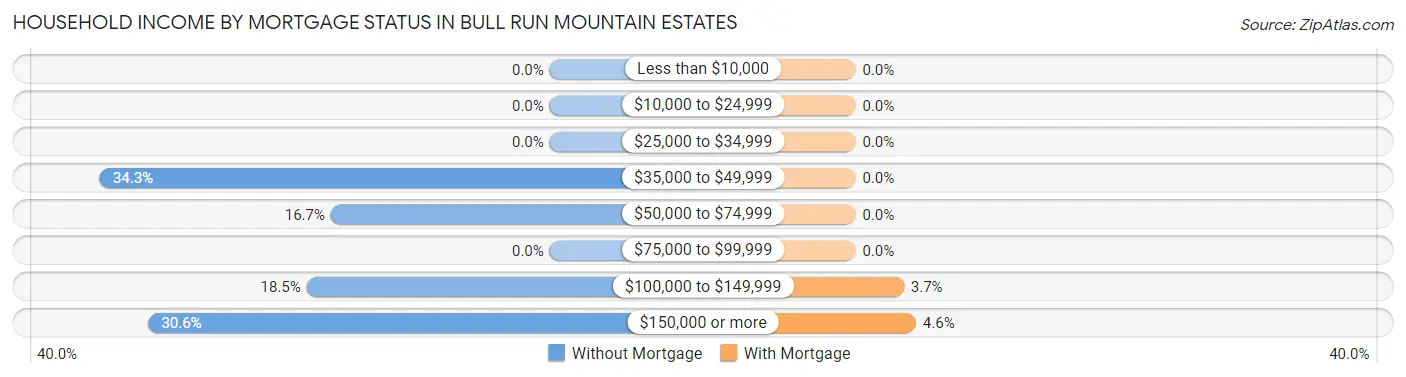
| Household Income | Without Mortgage | With Mortgage |
| Less than $10,000 | 0 (0.0%) | 0 (0.0%) |
| $10,000 to $24,999 | 0 (0.0%) | 0 (0.0%) |
| $25,000 to $34,999 | 0 (0.0%) | 0 (0.0%) |
| $35,000 to $49,999 | 37 (34.3%) | 0 (0.0%) |
| $50,000 to $74,999 | 18 (16.7%) | 0 (0.0%) |
| $75,000 to $99,999 | 0 (0.0%) | 0 (0.0%) |
| $100,000 to $149,999 | 20 (18.5%) | 12 (3.7%) |
| $150,000 or more | 33 (30.6%) | 15 (4.6%) |
| Total | 108 (100.0%) | 326 (100.0%) |
Property Value to Household Income Ratio in Bull Run Mountain Estates
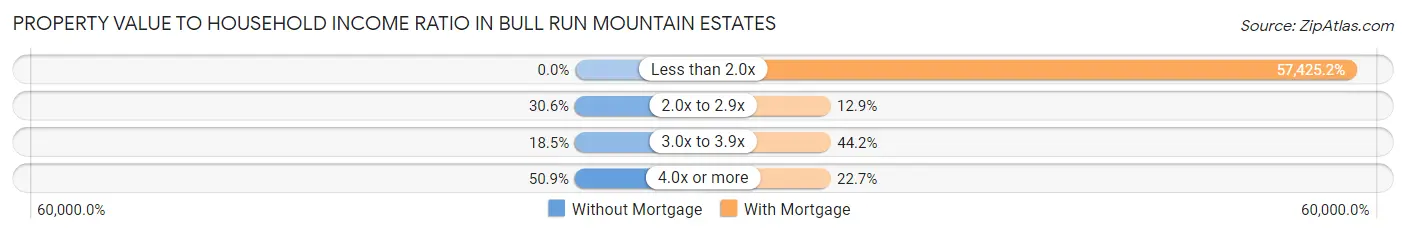
| Value-to-Income Ratio | Without Mortgage | With Mortgage |
| Less than 2.0x | 0 (0.0%) | 187,206 (57,425.1%) |
| 2.0x to 2.9x | 33 (30.6%) | 42 (12.9%) |
| 3.0x to 3.9x | 20 (18.5%) | 144 (44.2%) |
| 4.0x or more | 55 (50.9%) | 74 (22.7%) |
| Total | 108 (100.0%) | 326 (100.0%) |
Real Estate Taxes by Mortgage Status in Bull Run Mountain Estates
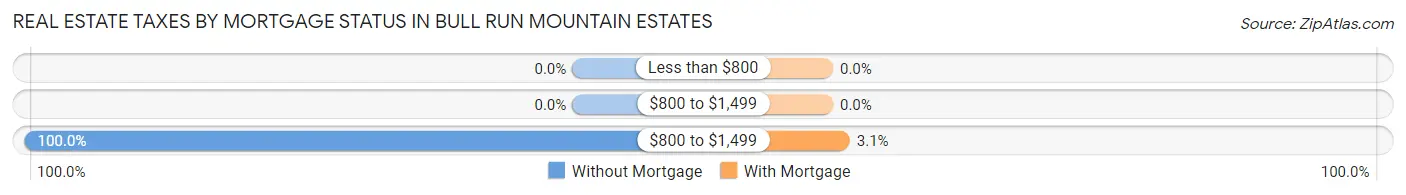
| Property Taxes | Without Mortgage | With Mortgage |
| Less than $800 | 0 (0.0%) | 0 (0.0%) |
| $800 to $1,499 | 0 (0.0%) | 0 (0.0%) |
| $800 to $1,499 | 108 (100.0%) | 10 (3.1%) |
| Total | 108 (100.0%) | 326 (100.0%) |
Health & Disability in Bull Run Mountain Estates
Health Insurance Coverage by Age in Bull Run Mountain Estates
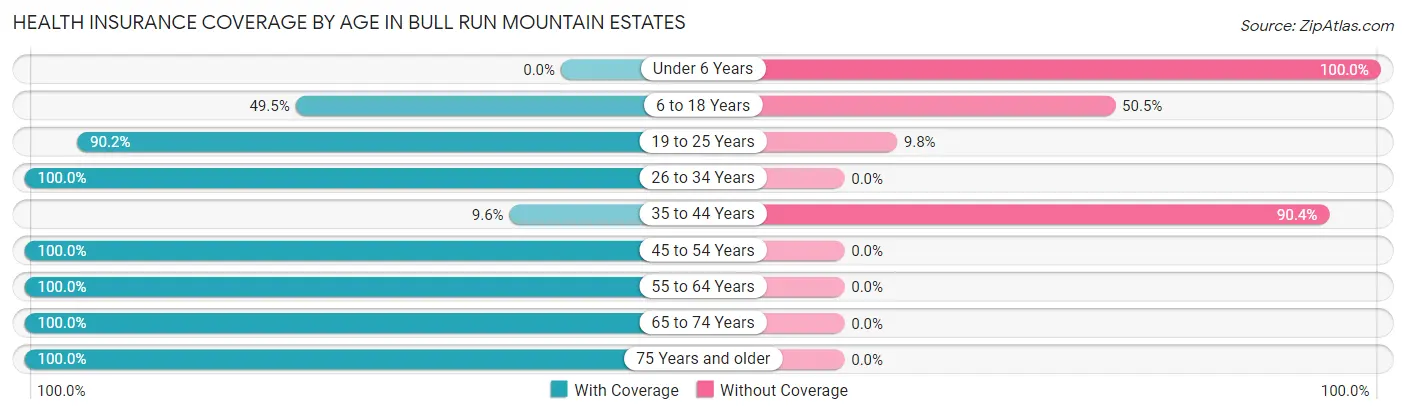
| Age Bracket | With Coverage | Without Coverage |
| Under 6 Years | 0 (0.0%) | 93 (100.0%) |
| 6 to 18 Years | 292 (49.5%) | 298 (50.5%) |
| 19 to 25 Years | 92 (90.2%) | 10 (9.8%) |
| 26 to 34 Years | 51 (100.0%) | 0 (0.0%) |
| 35 to 44 Years | 14 (9.6%) | 132 (90.4%) |
| 45 to 54 Years | 315 (100.0%) | 0 (0.0%) |
| 55 to 64 Years | 92 (100.0%) | 0 (0.0%) |
| 65 to 74 Years | 90 (100.0%) | 0 (0.0%) |
| 75 Years and older | 46 (100.0%) | 0 (0.0%) |
| Total | 992 (65.0%) | 533 (34.9%) |
Health Insurance Coverage by Citizenship Status in Bull Run Mountain Estates
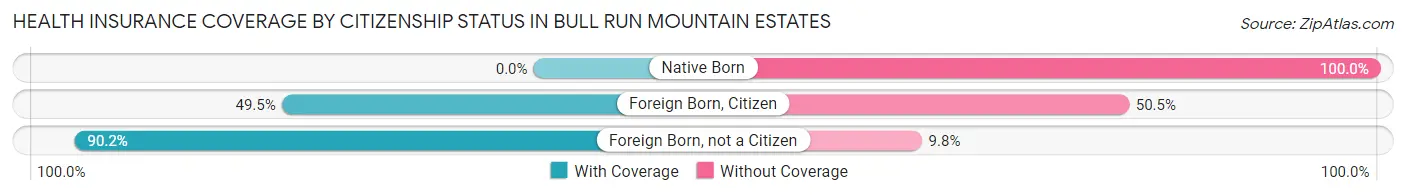
| Citizenship Status | With Coverage | Without Coverage |
| Native Born | 0 (0.0%) | 93 (100.0%) |
| Foreign Born, Citizen | 292 (49.5%) | 298 (50.5%) |
| Foreign Born, not a Citizen | 92 (90.2%) | 10 (9.8%) |
Health Insurance Coverage by Household Income in Bull Run Mountain Estates
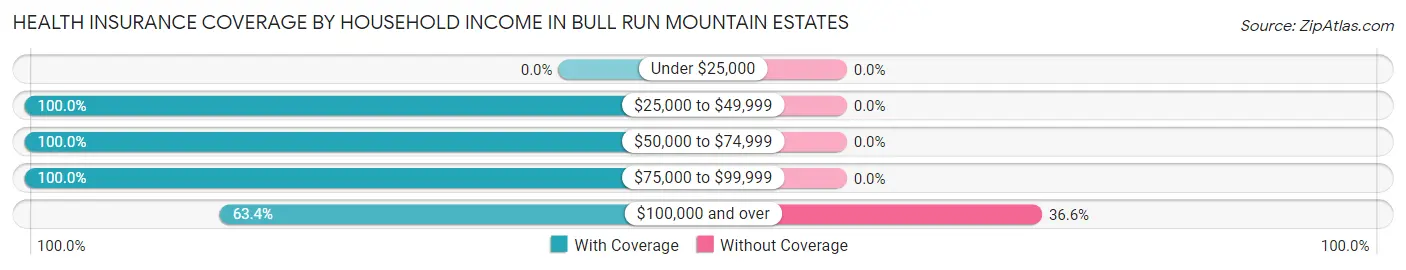
| Household Income | With Coverage | Without Coverage |
| Under $25,000 | 0 (0.0%) | 0 (0.0%) |
| $25,000 to $49,999 | 37 (100.0%) | 0 (0.0%) |
| $50,000 to $74,999 | 18 (100.0%) | 0 (0.0%) |
| $75,000 to $99,999 | 12 (100.0%) | 0 (0.0%) |
| $100,000 and over | 925 (63.4%) | 533 (36.6%) |
Public vs Private Health Insurance Coverage by Age in Bull Run Mountain Estates
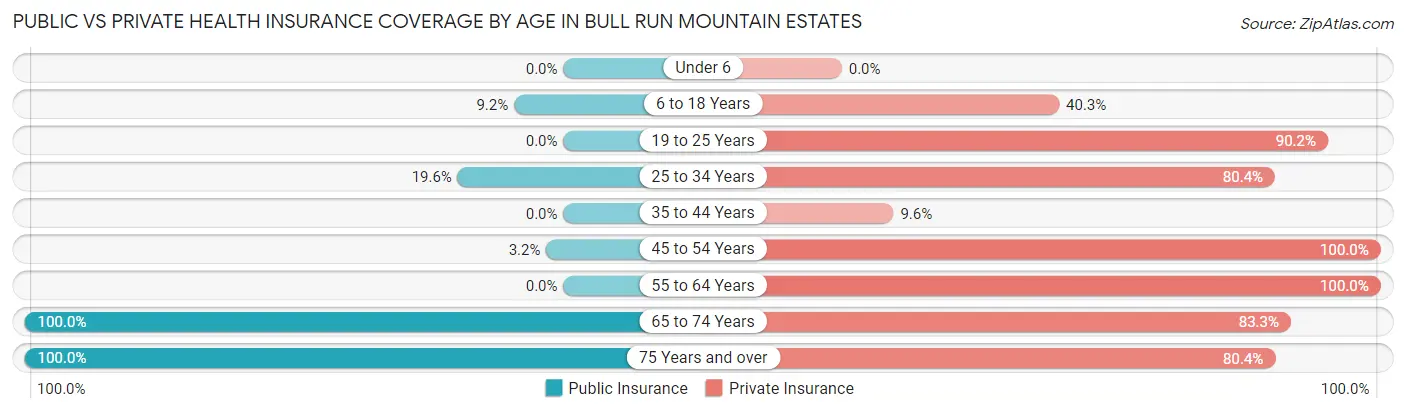
| Age Bracket | Public Insurance | Private Insurance |
| Under 6 | 0 (0.0%) | 0 (0.0%) |
| 6 to 18 Years | 54 (9.1%) | 238 (40.3%) |
| 19 to 25 Years | 0 (0.0%) | 92 (90.2%) |
| 25 to 34 Years | 10 (19.6%) | 41 (80.4%) |
| 35 to 44 Years | 0 (0.0%) | 14 (9.6%) |
| 45 to 54 Years | 10 (3.2%) | 315 (100.0%) |
| 55 to 64 Years | 0 (0.0%) | 92 (100.0%) |
| 65 to 74 Years | 90 (100.0%) | 75 (83.3%) |
| 75 Years and over | 46 (100.0%) | 37 (80.4%) |
| Total | 210 (13.8%) | 904 (59.3%) |
Disability Status by Sex by Age in Bull Run Mountain Estates
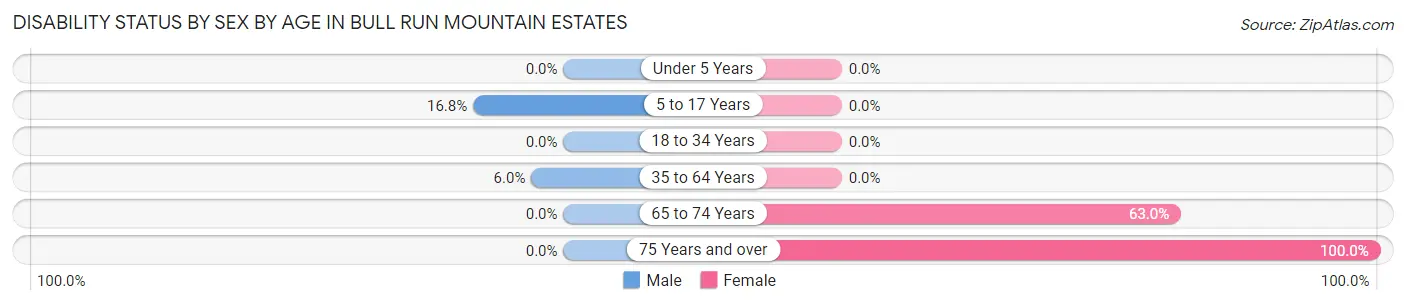
| Age Bracket | Male | Female |
| Under 5 Years | 0 (0.0%) | 0 (0.0%) |
| 5 to 17 Years | 54 (16.8%) | 0 (0.0%) |
| 18 to 34 Years | 0 (0.0%) | 0 (0.0%) |
| 35 to 64 Years | 19 (6.0%) | 0 (0.0%) |
| 65 to 74 Years | 0 (0.0%) | 17 (63.0%) |
| 75 Years and over | 0 (0.0%) | 27 (100.0%) |
Disability Class by Sex by Age in Bull Run Mountain Estates
Disability Class: Hearing Difficulty
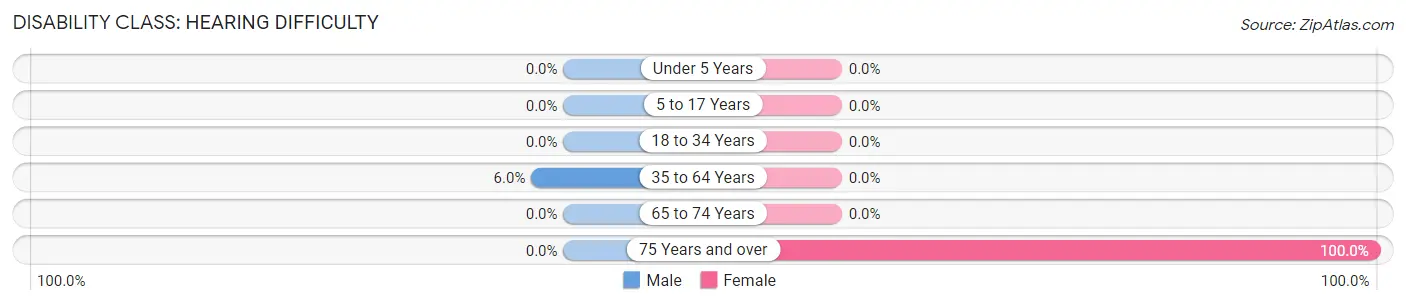
| Age Bracket | Male | Female |
| Under 5 Years | 0 (0.0%) | 0 (0.0%) |
| 5 to 17 Years | 0 (0.0%) | 0 (0.0%) |
| 18 to 34 Years | 0 (0.0%) | 0 (0.0%) |
| 35 to 64 Years | 19 (6.0%) | 0 (0.0%) |
| 65 to 74 Years | 0 (0.0%) | 0 (0.0%) |
| 75 Years and over | 0 (0.0%) | 27 (100.0%) |
Disability Class: Vision Difficulty
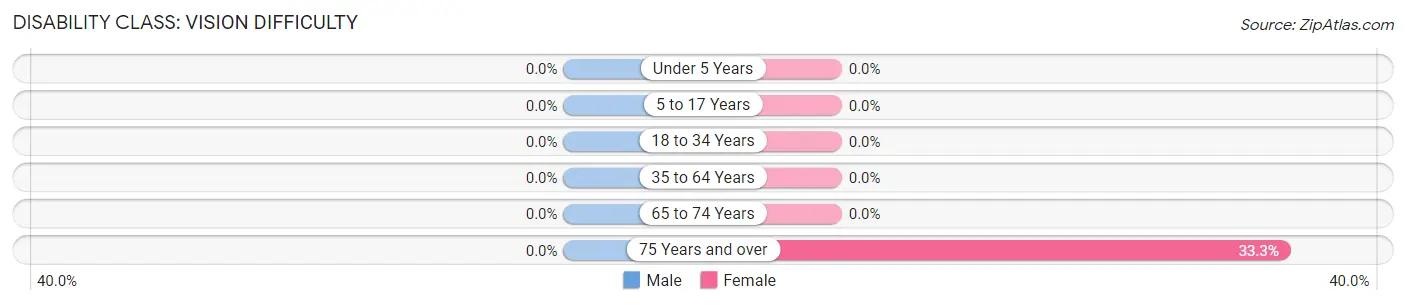
| Age Bracket | Male | Female |
| Under 5 Years | 0 (0.0%) | 0 (0.0%) |
| 5 to 17 Years | 0 (0.0%) | 0 (0.0%) |
| 18 to 34 Years | 0 (0.0%) | 0 (0.0%) |
| 35 to 64 Years | 0 (0.0%) | 0 (0.0%) |
| 65 to 74 Years | 0 (0.0%) | 0 (0.0%) |
| 75 Years and over | 0 (0.0%) | 9 (33.3%) |
Disability Class: Cognitive Difficulty
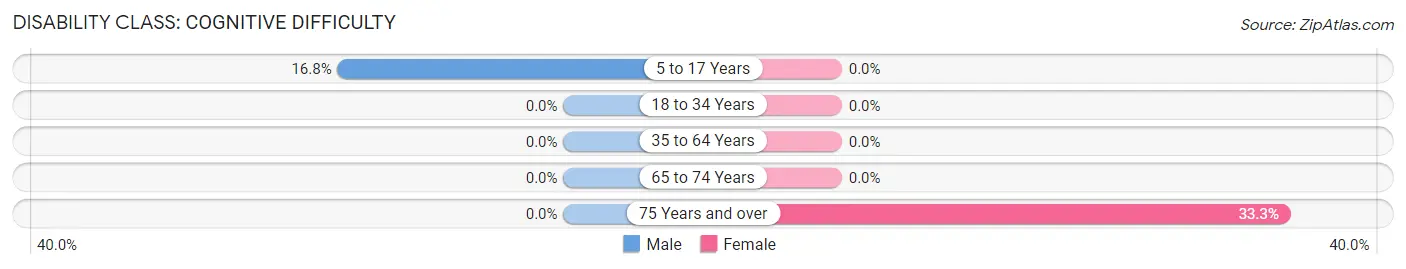
| Age Bracket | Male | Female |
| 5 to 17 Years | 54 (16.8%) | 0 (0.0%) |
| 18 to 34 Years | 0 (0.0%) | 0 (0.0%) |
| 35 to 64 Years | 0 (0.0%) | 0 (0.0%) |
| 65 to 74 Years | 0 (0.0%) | 0 (0.0%) |
| 75 Years and over | 0 (0.0%) | 9 (33.3%) |
Disability Class: Ambulatory Difficulty
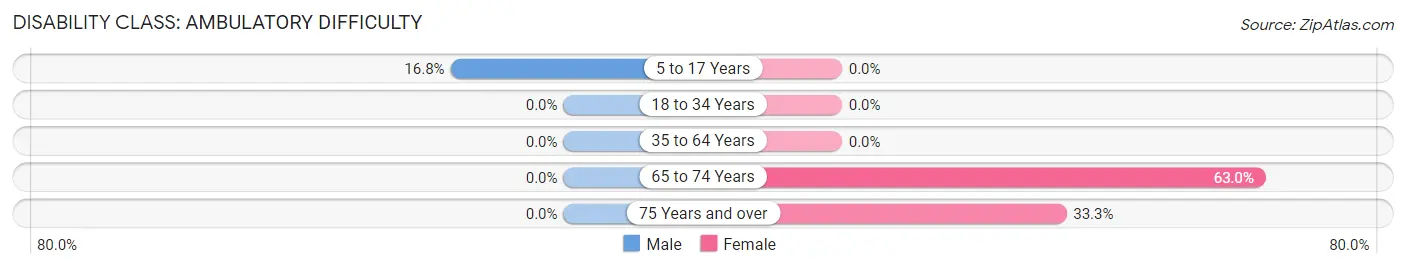
| Age Bracket | Male | Female |
| 5 to 17 Years | 54 (16.8%) | 0 (0.0%) |
| 18 to 34 Years | 0 (0.0%) | 0 (0.0%) |
| 35 to 64 Years | 0 (0.0%) | 0 (0.0%) |
| 65 to 74 Years | 0 (0.0%) | 17 (63.0%) |
| 75 Years and over | 0 (0.0%) | 9 (33.3%) |
Disability Class: Self-Care Difficulty
| Age Bracket | Male | Female |
| 5 to 17 Years | 0 (0.0%) | 0 (0.0%) |
| 18 to 34 Years | 0 (0.0%) | 0 (0.0%) |
| 35 to 64 Years | 0 (0.0%) | 0 (0.0%) |
| 65 to 74 Years | 0 (0.0%) | 0 (0.0%) |
| 75 Years and over | 0 (0.0%) | 0 (0.0%) |
Technology Access in Bull Run Mountain Estates
Computing Device Access in Bull Run Mountain Estates
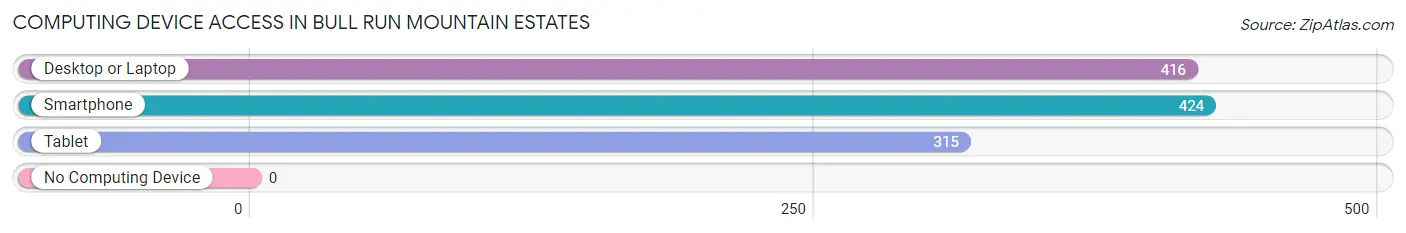
| Device Type | # Households | % Households |
| Desktop or Laptop | 416 | 95.9% |
| Smartphone | 424 | 97.7% |
| Tablet | 315 | 72.6% |
| No Computing Device | 0 | 0.0% |
| Total | 434 | 100.0% |
Internet Access in Bull Run Mountain Estates
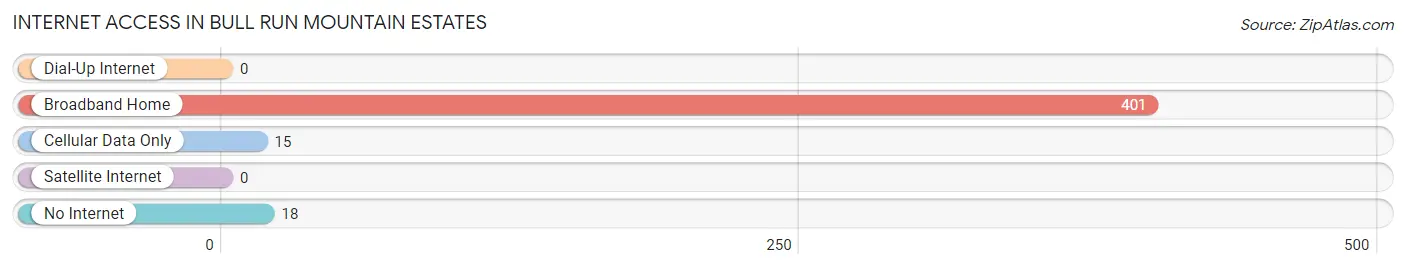
| Internet Type | # Households | % Households |
| Dial-Up Internet | 0 | 0.0% |
| Broadband Home | 401 | 92.4% |
| Cellular Data Only | 15 | 3.5% |
| Satellite Internet | 0 | 0.0% |
| No Internet | 18 | 4.2% |
| Total | 434 | 100.0% |
Bull Run Mountain Estates Summary
Introduction
Bull Run Mountain Estates is a small, unincorporated community located in Fauquier County, Virginia. It is situated in the foothills of the Blue Ridge Mountains, approximately 25 miles west of Washington, D.C. The community is home to a diverse population of approximately 1,000 people, and is known for its rural charm and scenic beauty.
History
The area that is now Bull Run Mountain Estates was first settled in the late 1700s by German and Scots-Irish immigrants. The community was originally known as “Bull Run”, after the nearby Bull Run Creek. The creek was named after a battle that took place during the Civil War, in which Union forces defeated Confederate forces.
In the early 1900s, the area began to develop as a rural residential community. The community was officially established in the 1950s, when the Bull Run Mountain Estates subdivision was created. The subdivision was developed by the Bull Run Mountain Estates Corporation, which was founded by local businessman and philanthropist, William H. Smith.
Geography
Bull Run Mountain Estates is located in the foothills of the Blue Ridge Mountains, approximately 25 miles west of Washington, D.C. The community is situated in a rural area, surrounded by rolling hills and forests. The area is known for its scenic beauty, and is home to a variety of wildlife, including deer, foxes, and wild turkeys.
The climate in Bull Run Mountain Estates is temperate, with hot summers and cold winters. The average annual temperature is around 55 degrees Fahrenheit. The average annual precipitation is around 40 inches.
Economy
The economy of Bull Run Mountain Estates is largely based on agriculture and tourism. The area is home to several farms, which produce a variety of crops, including corn, soybeans, and hay. The community is also home to several wineries, which produce a variety of wines.
Tourism is an important part of the local economy. The area is home to several popular attractions, including the Bull Run Mountain Estates Winery, the Bull Run Mountain Estates Golf Course, and the Bull Run Mountain Estates Nature Center.
Demographics
As of the 2010 census, the population of Bull Run Mountain Estates was 1,000. The racial makeup of the community was 94.2% White, 2.2% African American, 0.7% Asian, 0.3% Native American, and 2.6% from other races. The median household income was $68,750, and the median age was 44.
Conclusion
Bull Run Mountain Estates is a small, unincorporated community located in Fauquier County, Virginia. It is situated in the foothills of the Blue Ridge Mountains, approximately 25 miles west of Washington, D.C. The community is home to a diverse population of approximately 1,000 people, and is known for its rural charm and scenic beauty. The economy of Bull Run Mountain Estates is largely based on agriculture and tourism, and the area is home to several popular attractions.
Common Questions
What is Per Capita Income in Bull Run Mountain Estates?
Per Capita income in Bull Run Mountain Estates is $52,523.
What is the Median Family Income in Bull Run Mountain Estates?
Median Family Income in Bull Run Mountain Estates is $185,662.
What is the Median Household income in Bull Run Mountain Estates?
Median Household Income in Bull Run Mountain Estates is $178,462.
What is Income or Wage Gap in Bull Run Mountain Estates?
Income or Wage Gap in Bull Run Mountain Estates is 67.1%.
Women in Bull Run Mountain Estates earn 32.9 cents for every dollar earned by a man.
What is Inequality or Gini Index in Bull Run Mountain Estates?
Inequality or Gini Index in Bull Run Mountain Estates is 0.22.
What is the Total Population of Bull Run Mountain Estates?
Total Population of Bull Run Mountain Estates is 1,525.
What is the Total Male Population of Bull Run Mountain Estates?
Total Male Population of Bull Run Mountain Estates is 768.
What is the Total Female Population of Bull Run Mountain Estates?
Total Female Population of Bull Run Mountain Estates is 757.
What is the Ratio of Males per 100 Females in Bull Run Mountain Estates?
There are 101.45 Males per 100 Females in Bull Run Mountain Estates.
What is the Ratio of Females per 100 Males in Bull Run Mountain Estates?
There are 98.57 Females per 100 Males in Bull Run Mountain Estates.
What is the Median Population Age in Bull Run Mountain Estates?
Median Population Age in Bull Run Mountain Estates is 22.4 Years.
What is the Average Family Size in Bull Run Mountain Estates
Average Family Size in Bull Run Mountain Estates is 4.3 People.
What is the Average Household Size in Bull Run Mountain Estates
Average Household Size in Bull Run Mountain Estates is 3.5 People.
How Large is the Labor Force in Bull Run Mountain Estates?
There are 660 People in the Labor Forcein in Bull Run Mountain Estates.
What is the Percentage of People in the Labor Force in Bull Run Mountain Estates?
78.4% of People are in the Labor Force in Bull Run Mountain Estates.
What is the Unemployment Rate in Bull Run Mountain Estates?
Unemployment Rate in Bull Run Mountain Estates is 8.2%.