Nokesville, VA Map & Demographics
Nokesville Map
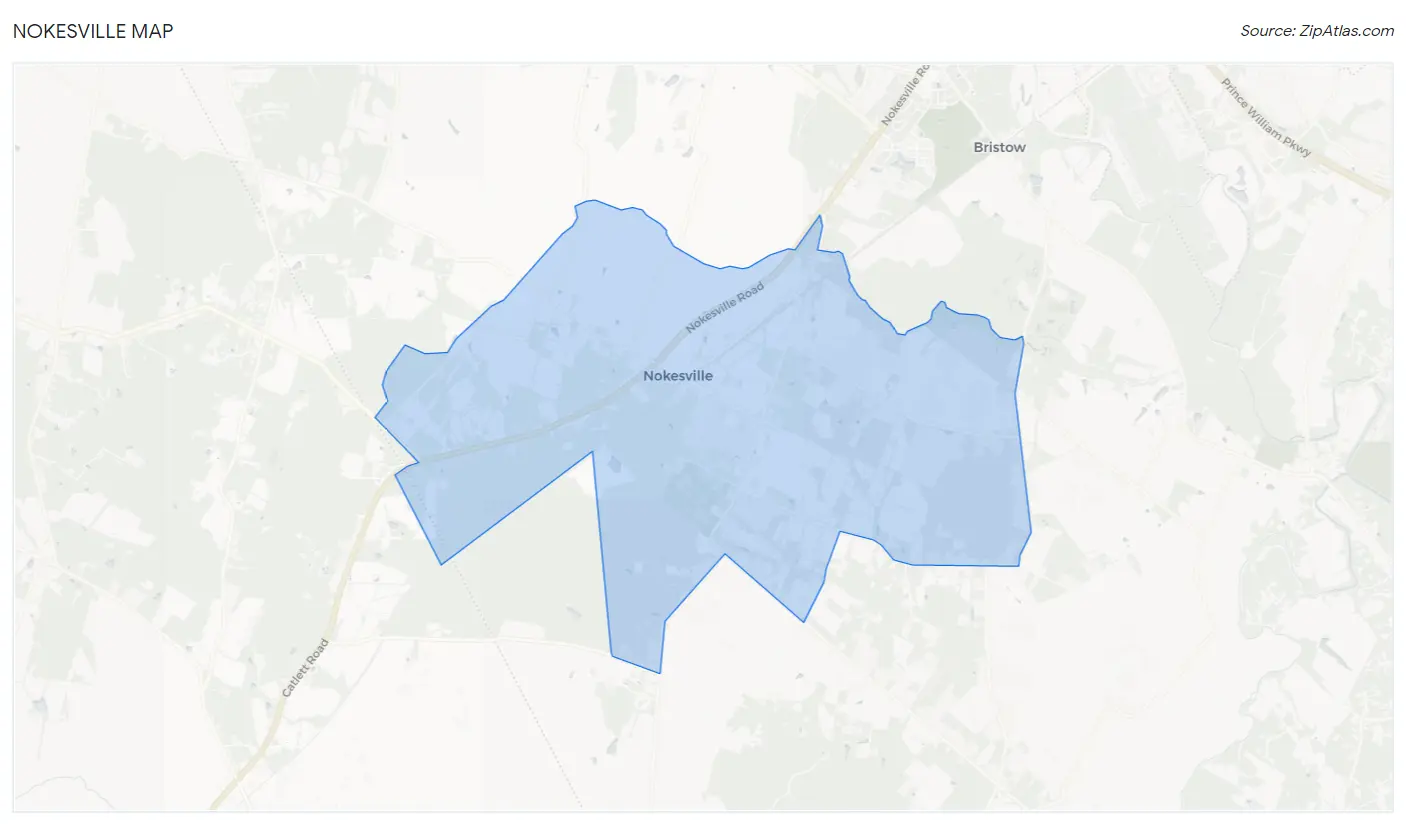
Nokesville Overview
$63,944
PER CAPITA INCOME
$210,833
AVG FAMILY INCOME
69.7%
WAGE / INCOME GAP [ % ]
30.3¢/ $1
WAGE / INCOME GAP [ $ ]
0.45
INEQUALITY / GINI INDEX
1,452
TOTAL POPULATION
664
MALE POPULATION
788
FEMALE POPULATION
84.26
MALES / 100 FEMALES
118.67
FEMALES / 100 MALES
48.1
MEDIAN AGE
3.0
AVG FAMILY SIZE
2.4
AVG HOUSEHOLD SIZE
894
LABOR FORCE [ PEOPLE ]
69.0%
PERCENT IN LABOR FORCE
4.1%
UNEMPLOYMENT RATE
Nokesville Zip Codes
Income in Nokesville
Income Overview in Nokesville
| Characteristic | Number | Measure |
| Per Capita Income | 1,452 | $63,944 |
| Median Family Income | 416 | $210,833 |
| Mean Family Income | 416 | $178,409 |
| Median Household Income | 607 | $0 |
| Mean Household Income | 607 | $144,217 |
| Income Deficit | 416 | $0 |
| Wage / Income Gap (%) | 1,452 | 69.74% |
| Wage / Income Gap ($) | 1,452 | 30.26¢ per $1 |
| Gini / Inequality Index | 1,452 | 0.45 |
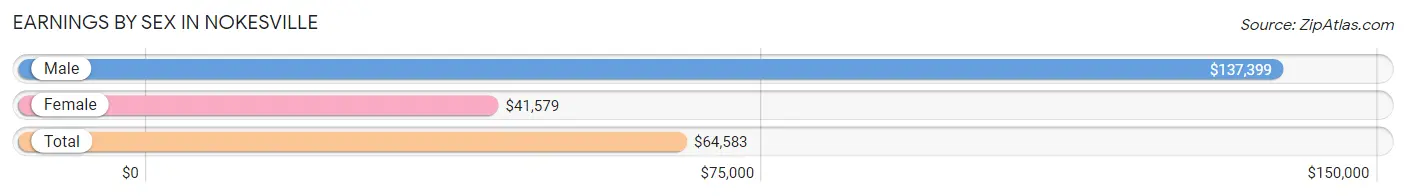
Earnings by Sex in Nokesville
Average Earnings in Nokesville are $64,583, $137,399 for men and $41,579 for women, a difference of 69.7%.
| Sex | Number | Average Earnings |
| Male | 415 (46.7%) | $137,399 |
| Female | 474 (53.3%) | $41,579 |
| Total | 889 (100.0%) | $64,583 |
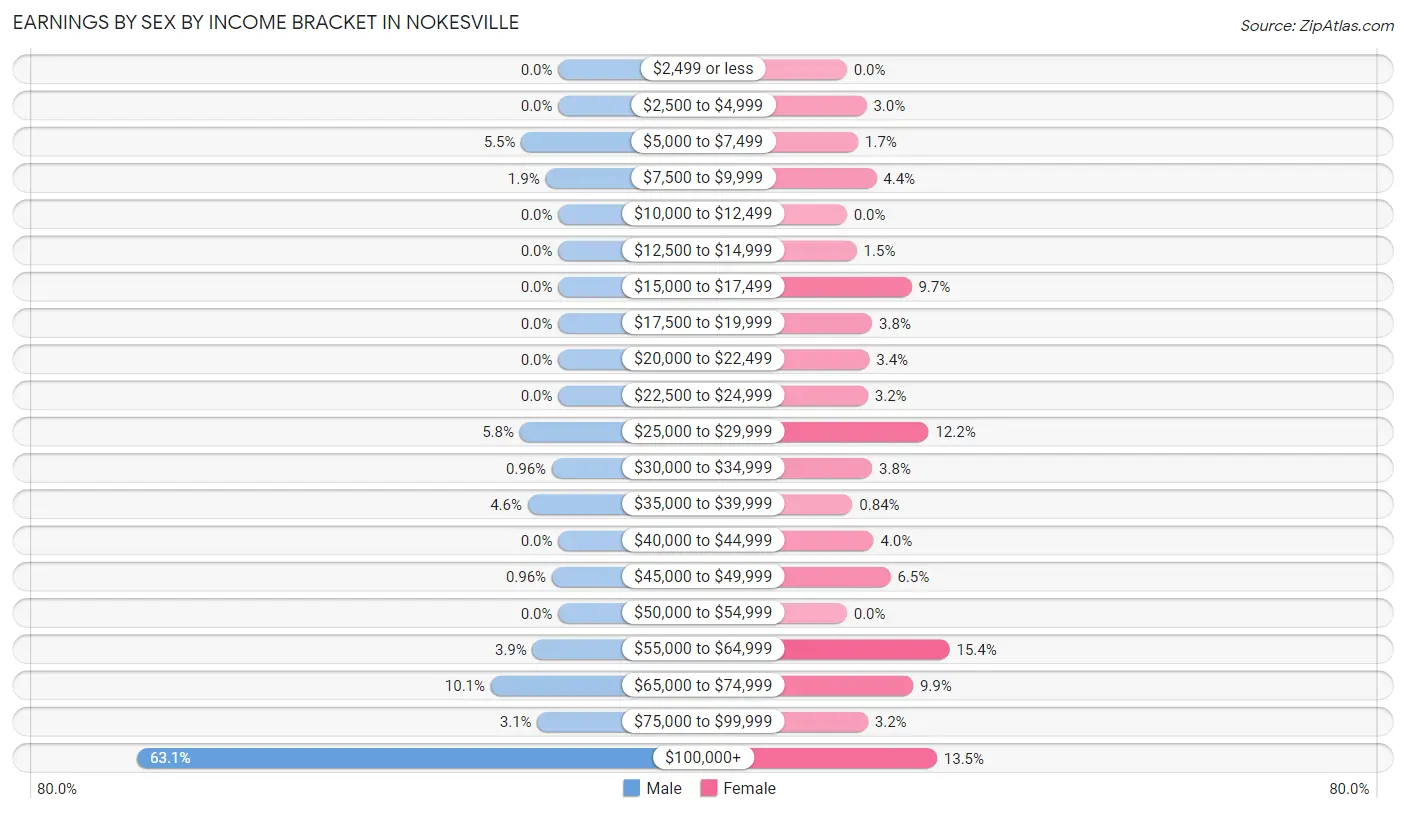
Earnings by Sex by Income Bracket in Nokesville
The most common earnings brackets in Nokesville are $100,000+ for men (262 | 63.1%) and $55,000 to $64,999 for women (73 | 15.4%).
| Income | Male | Female |
| $2,499 or less | 0 (0.0%) | 0 (0.0%) |
| $2,500 to $4,999 | 0 (0.0%) | 14 (2.9%) |
| $5,000 to $7,499 | 23 (5.5%) | 8 (1.7%) |
| $7,500 to $9,999 | 8 (1.9%) | 21 (4.4%) |
| $10,000 to $12,499 | 0 (0.0%) | 0 (0.0%) |
| $12,500 to $14,999 | 0 (0.0%) | 7 (1.5%) |
| $15,000 to $17,499 | 0 (0.0%) | 46 (9.7%) |
| $17,500 to $19,999 | 0 (0.0%) | 18 (3.8%) |
| $20,000 to $22,499 | 0 (0.0%) | 16 (3.4%) |
| $22,500 to $24,999 | 0 (0.0%) | 15 (3.2%) |
| $25,000 to $29,999 | 24 (5.8%) | 58 (12.2%) |
| $30,000 to $34,999 | 4 (1.0%) | 18 (3.8%) |
| $35,000 to $39,999 | 19 (4.6%) | 4 (0.8%) |
| $40,000 to $44,999 | 0 (0.0%) | 19 (4.0%) |
| $45,000 to $49,999 | 4 (1.0%) | 31 (6.5%) |
| $50,000 to $54,999 | 0 (0.0%) | 0 (0.0%) |
| $55,000 to $64,999 | 16 (3.9%) | 73 (15.4%) |
| $65,000 to $74,999 | 42 (10.1%) | 47 (9.9%) |
| $75,000 to $99,999 | 13 (3.1%) | 15 (3.2%) |
| $100,000+ | 262 (63.1%) | 64 (13.5%) |
| Total | 415 (100.0%) | 474 (100.0%) |
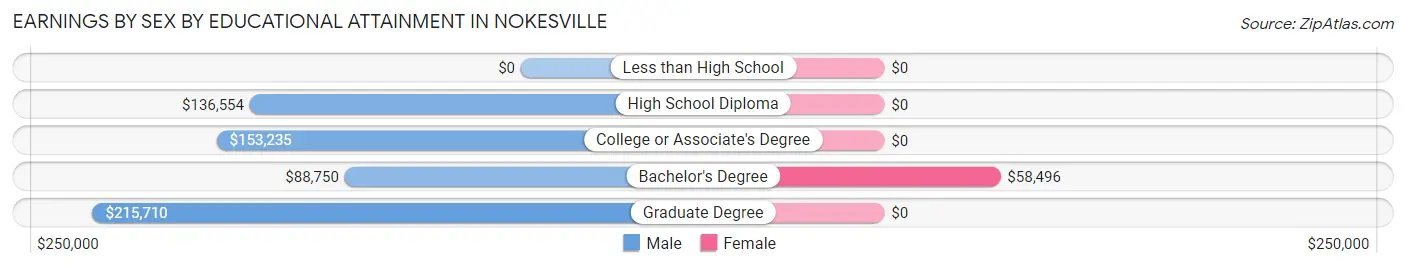
Earnings by Sex by Educational Attainment in Nokesville
Average earnings in Nokesville are $148,304 for men and $46,250 for women, a difference of 68.8%. Men with an educational attainment of graduate degree enjoy the highest average annual earnings of $215,710, while those with bachelor's degree education earn the least with $88,750. Women with an educational attainment of bachelor's degree earn the most with the average annual earnings of $58,496, while those with bachelor's degree education have the smallest earnings of $58,496.
| Educational Attainment | Male Income | Female Income |
| Less than High School | - | - |
| High School Diploma | $136,554 | $0 |
| College or Associate's Degree | $153,235 | $0 |
| Bachelor's Degree | $88,750 | $58,496 |
| Graduate Degree | $215,710 | $0 |
| Total | $148,304 | $46,250 |
Family Income in Nokesville
Family Income Brackets in Nokesville
According to the Nokesville family income data, there are 217 families falling into the $200,000+ income range, which is the most common income bracket and makes up 52.2% of all families.
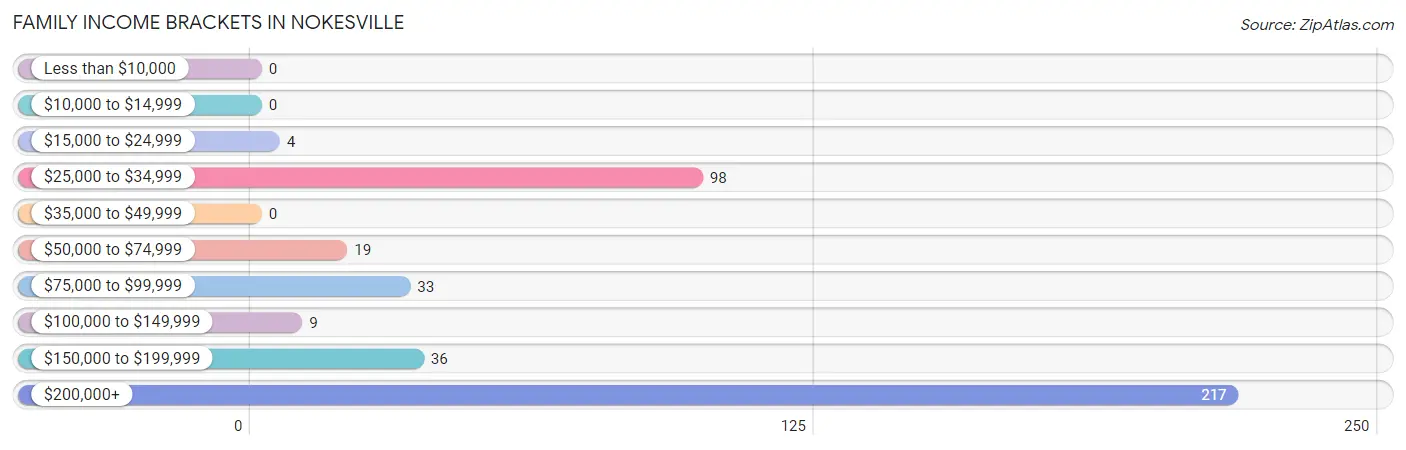
| Income Bracket | # Families | % Families |
| Less than $10,000 | 0 | 0.0% |
| $10,000 to $14,999 | 0 | 0.0% |
| $15,000 to $24,999 | 4 | 1.0% |
| $25,000 to $34,999 | 98 | 23.6% |
| $35,000 to $49,999 | 0 | 0.0% |
| $50,000 to $74,999 | 19 | 4.6% |
| $75,000 to $99,999 | 33 | 7.9% |
| $100,000 to $149,999 | 9 | 2.2% |
| $150,000 to $199,999 | 36 | 8.7% |
| $200,000+ | 217 | 52.2% |
Family Income by Famaliy Size in Nokesville
4-person families (27 | 6.5%) account for the highest median family income in Nokesville with $250,001 per family, while 2-person families (251 | 60.3%) have the highest median income of $105,070 per family member.
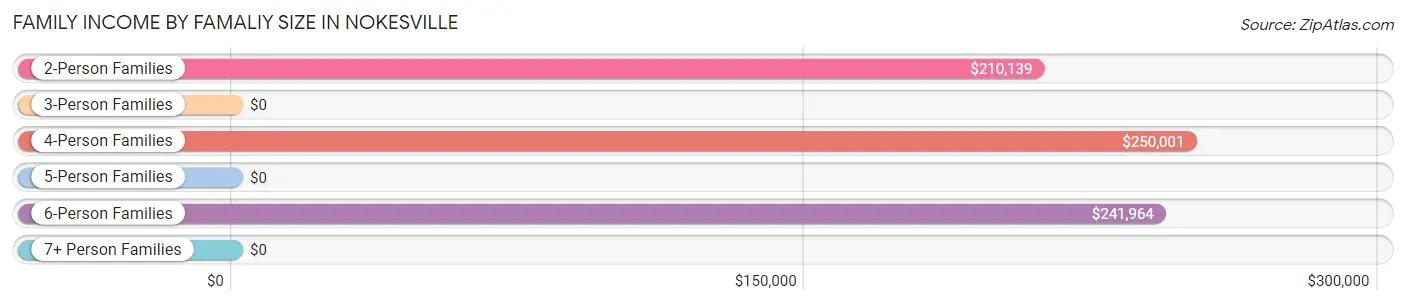
| Income Bracket | # Families | Median Income |
| 2-Person Families | 251 (60.3%) | $210,139 |
| 3-Person Families | 78 (18.8%) | $0 |
| 4-Person Families | 27 (6.5%) | $250,001 |
| 5-Person Families | 5 (1.2%) | $0 |
| 6-Person Families | 42 (10.1%) | $241,964 |
| 7+ Person Families | 13 (3.1%) | $0 |
| Total | 416 (100.0%) | $210,833 |
Family Income by Number of Earners in Nokesville
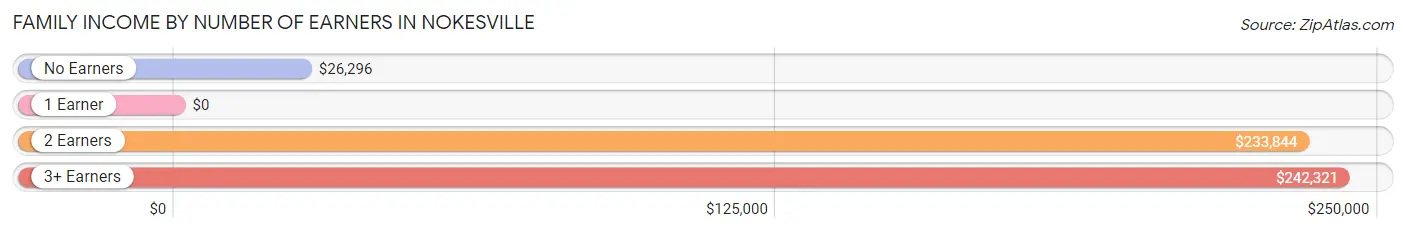
| Number of Earners | # Families | Median Income |
| No Earners | 36 (8.6%) | $26,296 |
| 1 Earner | 135 (32.5%) | $0 |
| 2 Earners | 189 (45.4%) | $233,844 |
| 3+ Earners | 56 (13.5%) | $242,321 |
| Total | 416 (100.0%) | $210,833 |
Household Income in Nokesville
Household Income Brackets in Nokesville
With 238 households falling in the category, the $200,000+ income range is the most frequent in Nokesville, accounting for 39.2% of all households. In contrast, only 4 households (0.7%) fall into the $15,000 to $24,999 income bracket, making it the least populous group.
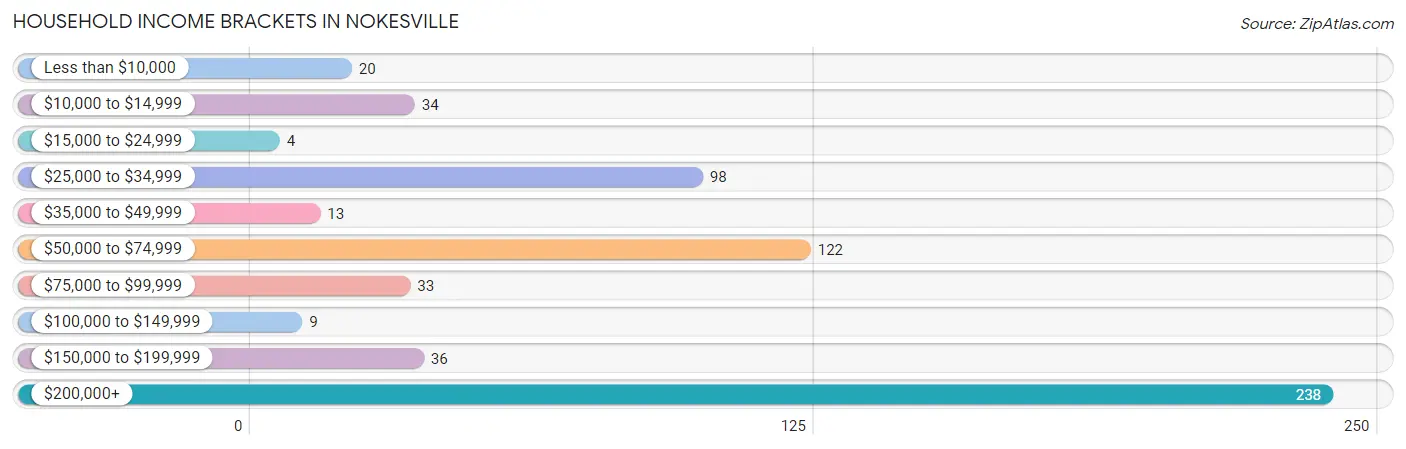
| Income Bracket | # Households | % Households |
| Less than $10,000 | 20 | 3.3% |
| $10,000 to $14,999 | 34 | 5.6% |
| $15,000 to $24,999 | 4 | 0.7% |
| $25,000 to $34,999 | 98 | 16.1% |
| $35,000 to $49,999 | 13 | 2.1% |
| $50,000 to $74,999 | 122 | 20.1% |
| $75,000 to $99,999 | 33 | 5.4% |
| $100,000 to $149,999 | 9 | 1.5% |
| $150,000 to $199,999 | 36 | 5.9% |
| $200,000+ | 238 | 39.2% |
Household Income by Householder Age in Nokesville
The median household income in Nokesville is $0, with the highest median household income of $212,222 found in the 45 to 64 years age bracket for the primary householder. A total of 344 households (56.7%) fall into this category.
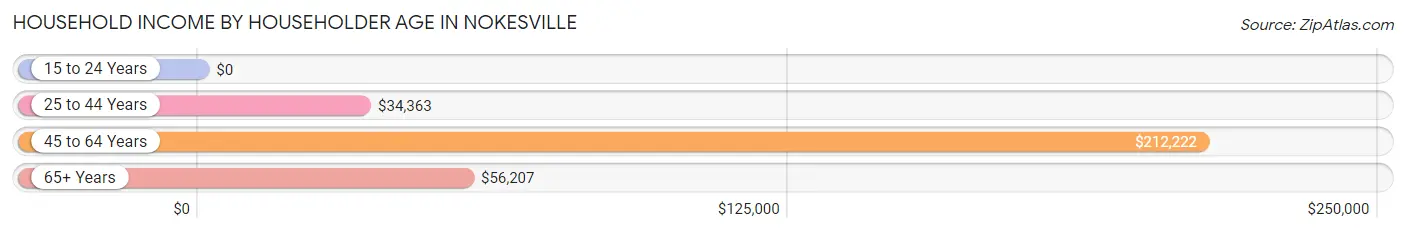
| Income Bracket | # Households | Median Income |
| 15 to 24 Years | 0 (0.0%) | $0 |
| 25 to 44 Years | 95 (15.7%) | $34,363 |
| 45 to 64 Years | 344 (56.7%) | $212,222 |
| 65+ Years | 168 (27.7%) | $56,207 |
| Total | 607 (100.0%) | $0 |
Poverty in Nokesville
Income Below Poverty by Sex and Age in Nokesville
With 10.7% poverty level for males and 8.6% for females among the residents of Nokesville, 6 to 11 year old males and 12 to 14 year old females are the most vulnerable to poverty, with 25 males (62.5%) and 12 females (63.2%) in their respective age groups living below the poverty level.
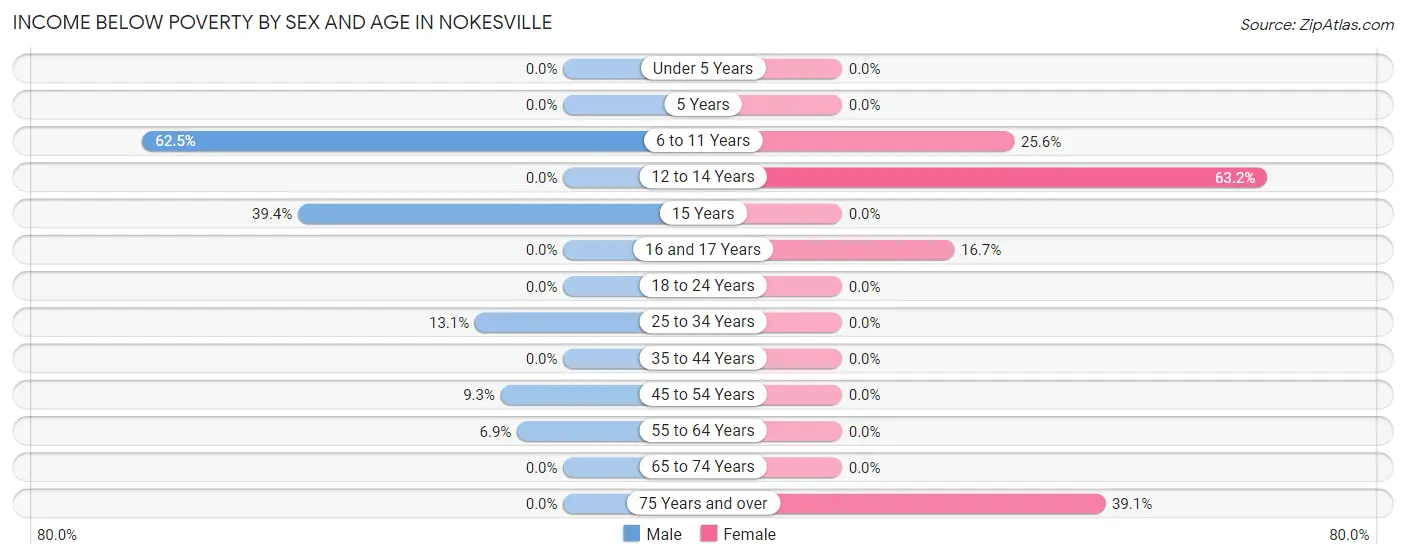
| Age Bracket | Male | Female |
| Under 5 Years | 0 (0.0%) | 0 (0.0%) |
| 5 Years | 0 (0.0%) | 0 (0.0%) |
| 6 to 11 Years | 25 (62.5%) | 11 (25.6%) |
| 12 to 14 Years | 0 (0.0%) | 12 (63.2%) |
| 15 Years | 13 (39.4%) | 0 (0.0%) |
| 16 and 17 Years | 0 (0.0%) | 11 (16.7%) |
| 18 to 24 Years | 0 (0.0%) | 0 (0.0%) |
| 25 to 34 Years | 8 (13.1%) | 0 (0.0%) |
| 35 to 44 Years | 0 (0.0%) | 0 (0.0%) |
| 45 to 54 Years | 13 (9.3%) | 0 (0.0%) |
| 55 to 64 Years | 12 (6.9%) | 0 (0.0%) |
| 65 to 74 Years | 0 (0.0%) | 0 (0.0%) |
| 75 Years and over | 0 (0.0%) | 34 (39.1%) |
| Total | 71 (10.7%) | 68 (8.6%) |
Income Above Poverty by Sex and Age in Nokesville
According to the poverty statistics in Nokesville, males aged 16 and 17 years and females aged 5 years are the age groups that are most secure financially, with 100.0% of males and 100.0% of females in these age groups living above the poverty line.
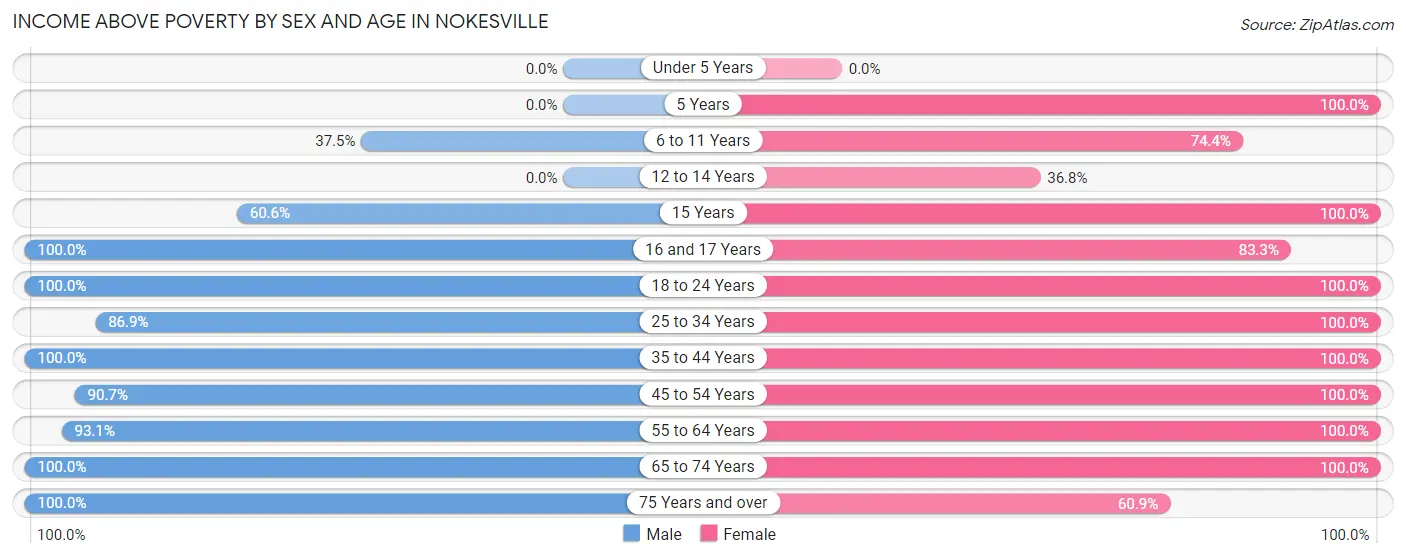
| Age Bracket | Male | Female |
| Under 5 Years | 0 (0.0%) | 0 (0.0%) |
| 5 Years | 0 (0.0%) | 4 (100.0%) |
| 6 to 11 Years | 15 (37.5%) | 32 (74.4%) |
| 12 to 14 Years | 0 (0.0%) | 7 (36.8%) |
| 15 Years | 20 (60.6%) | 17 (100.0%) |
| 16 and 17 Years | 34 (100.0%) | 55 (83.3%) |
| 18 to 24 Years | 63 (100.0%) | 108 (100.0%) |
| 25 to 34 Years | 53 (86.9%) | 53 (100.0%) |
| 35 to 44 Years | 30 (100.0%) | 43 (100.0%) |
| 45 to 54 Years | 127 (90.7%) | 202 (100.0%) |
| 55 to 64 Years | 163 (93.1%) | 107 (100.0%) |
| 65 to 74 Years | 59 (100.0%) | 39 (100.0%) |
| 75 Years and over | 29 (100.0%) | 53 (60.9%) |
| Total | 593 (89.3%) | 720 (91.4%) |
Income Below Poverty Among Married-Couple Families in Nokesville
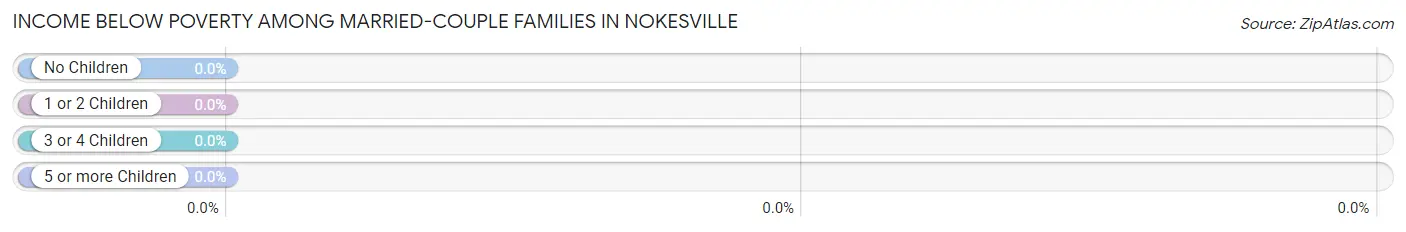
| Children | Above Poverty | Below Poverty |
| No Children | 207 (100.0%) | 0 (0.0%) |
| 1 or 2 Children | 101 (100.0%) | 0 (0.0%) |
| 3 or 4 Children | 0 (0.0%) | 0 (0.0%) |
| 5 or more Children | 0 (0.0%) | 0 (0.0%) |
| Total | 308 (100.0%) | 0 (0.0%) |
Income Below Poverty Among Single-Parent Households in Nokesville
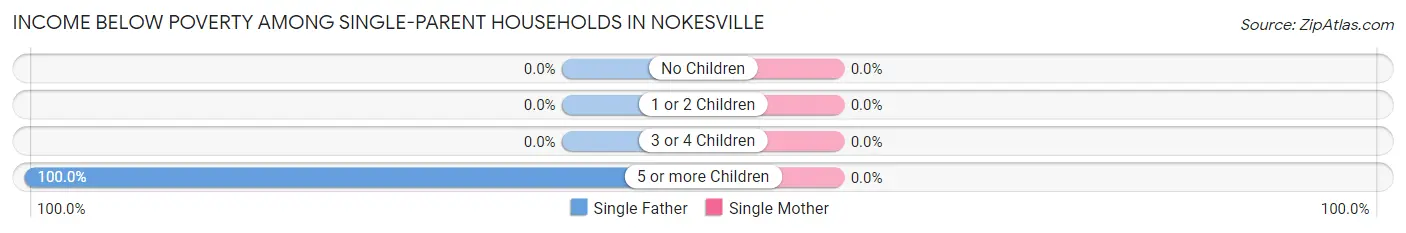
| Children | Single Father | Single Mother |
| No Children | 0 (0.0%) | 0 (0.0%) |
| 1 or 2 Children | 0 (0.0%) | 0 (0.0%) |
| 3 or 4 Children | 0 (0.0%) | 0 (0.0%) |
| 5 or more Children | 13 (100.0%) | 0 (0.0%) |
| Total | 13 (46.4%) | 0 (0.0%) |
Income Below Poverty Among Married-Couple vs Single-Parent Households in Nokesville
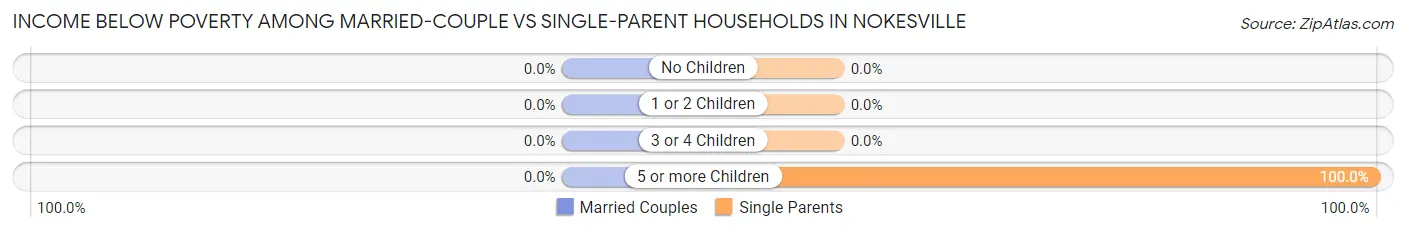
| Children | Married-Couple Families | Single-Parent Households |
| No Children | 0 (0.0%) | 0 (0.0%) |
| 1 or 2 Children | 0 (0.0%) | 0 (0.0%) |
| 3 or 4 Children | 0 (0.0%) | 0 (0.0%) |
| 5 or more Children | 0 (0.0%) | 13 (100.0%) |
| Total | 0 (0.0%) | 13 (12.0%) |
Race in Nokesville
The most populous races in Nokesville are White / Caucasian (1,159 | 79.8%), Hispanic or Latino (265 | 18.2%), and Two or more Races (159 | 11.0%).
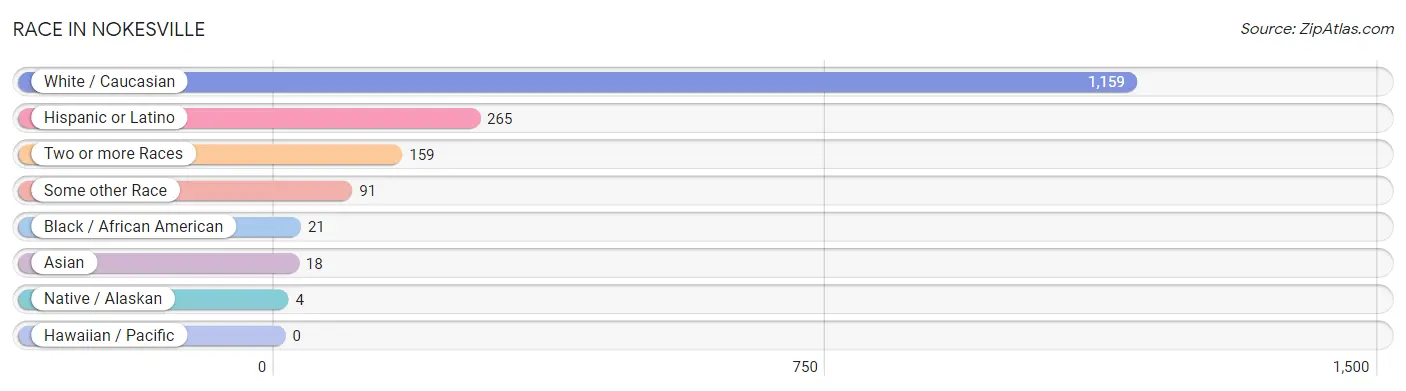
| Race | # Population | % Population |
| Asian | 18 | 1.2% |
| Black / African American | 21 | 1.5% |
| Hawaiian / Pacific | 0 | 0.0% |
| Hispanic or Latino | 265 | 18.2% |
| Native / Alaskan | 4 | 0.3% |
| White / Caucasian | 1,159 | 79.8% |
| Two or more Races | 159 | 11.0% |
| Some other Race | 91 | 6.3% |
| Total | 1,452 | 100.0% |
Ancestry in Nokesville
The most populous ancestries reported in Nokesville are English (218 | 15.0%), European (152 | 10.5%), Irish (139 | 9.6%), American (134 | 9.2%), and German (114 | 7.9%), together accounting for 52.1% of all Nokesville residents.
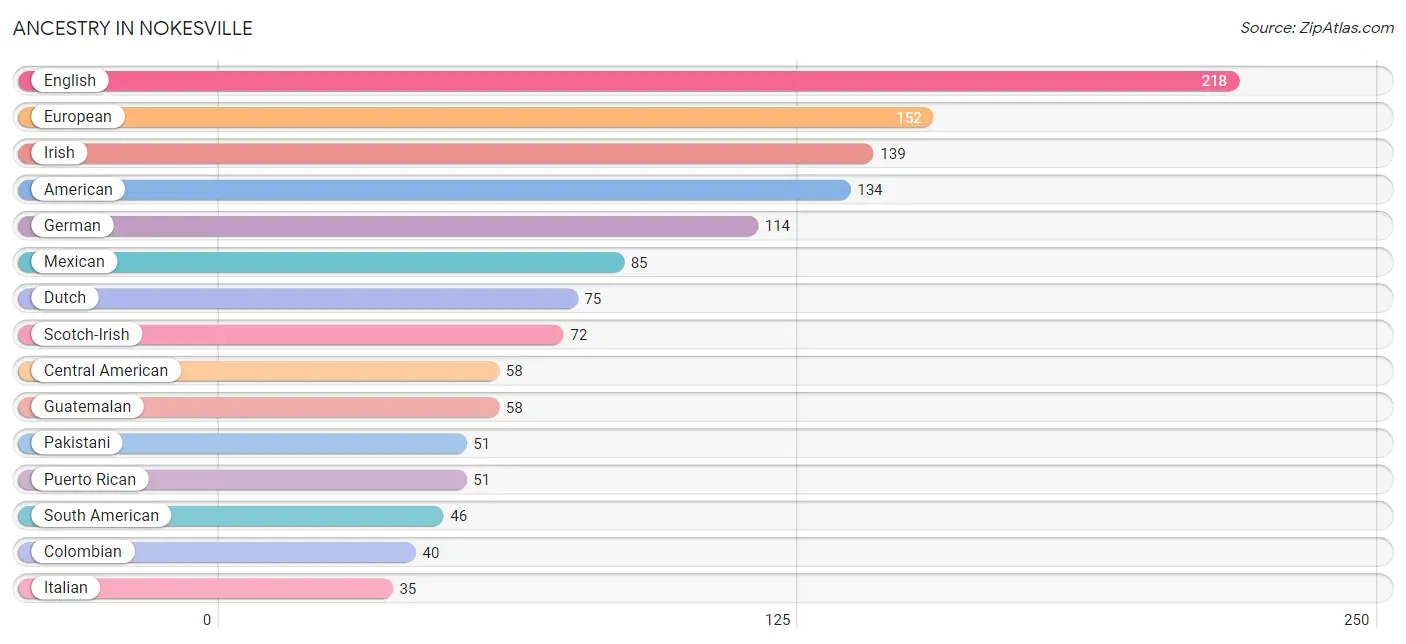
| Ancestry | # Population | % Population |
| American | 134 | 9.2% |
| Argentinean | 6 | 0.4% |
| Armenian | 8 | 0.5% |
| British | 5 | 0.3% |
| Central American | 58 | 4.0% |
| Colombian | 40 | 2.8% |
| Dutch | 75 | 5.2% |
| Eastern European | 5 | 0.3% |
| English | 218 | 15.0% |
| European | 152 | 10.5% |
| German | 114 | 7.9% |
| Guatemalan | 58 | 4.0% |
| Irish | 139 | 9.6% |
| Iroquois | 7 | 0.5% |
| Italian | 35 | 2.4% |
| Mexican | 85 | 5.9% |
| Pakistani | 51 | 3.5% |
| Polish | 23 | 1.6% |
| Puerto Rican | 51 | 3.5% |
| Russian | 11 | 0.8% |
| Scotch-Irish | 72 | 5.0% |
| Scottish | 34 | 2.3% |
| South American | 46 | 3.2% |
| Spanish | 16 | 1.1% |
| Swedish | 15 | 1.0% |
| Welsh | 6 | 0.4% | View All 26 Rows |
Immigrants in Nokesville
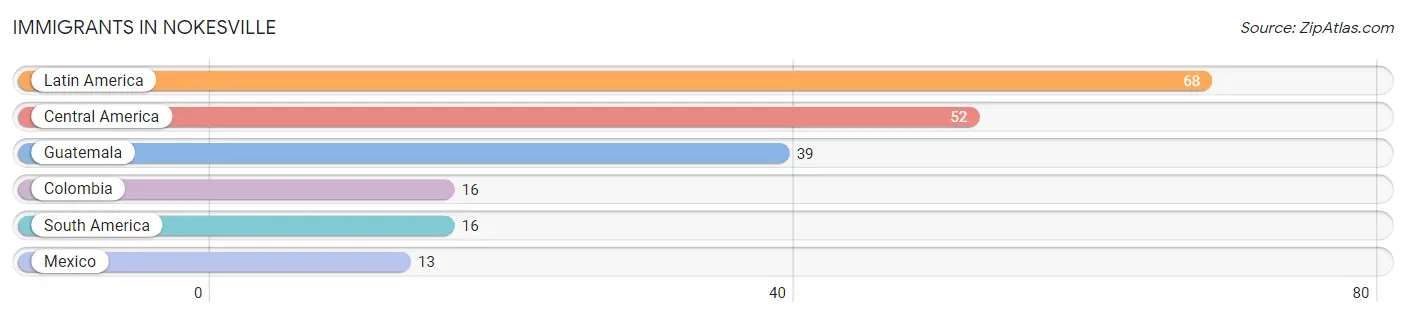
The most numerous immigrant groups reported in Nokesville came from Latin America (68 | 4.7%), Central America (52 | 3.6%), Guatemala (39 | 2.7%), Colombia (16 | 1.1%), and South America (16 | 1.1%), together accounting for 13.2% of all Nokesville residents.
| Immigration Origin | # Population | % Population |
| Central America | 52 | 3.6% |
| Colombia | 16 | 1.1% |
| Guatemala | 39 | 2.7% |
| Latin America | 68 | 4.7% |
| Mexico | 13 | 0.9% |
| South America | 16 | 1.1% | View All 6 Rows |
Sex and Age in Nokesville
Sex and Age in Nokesville
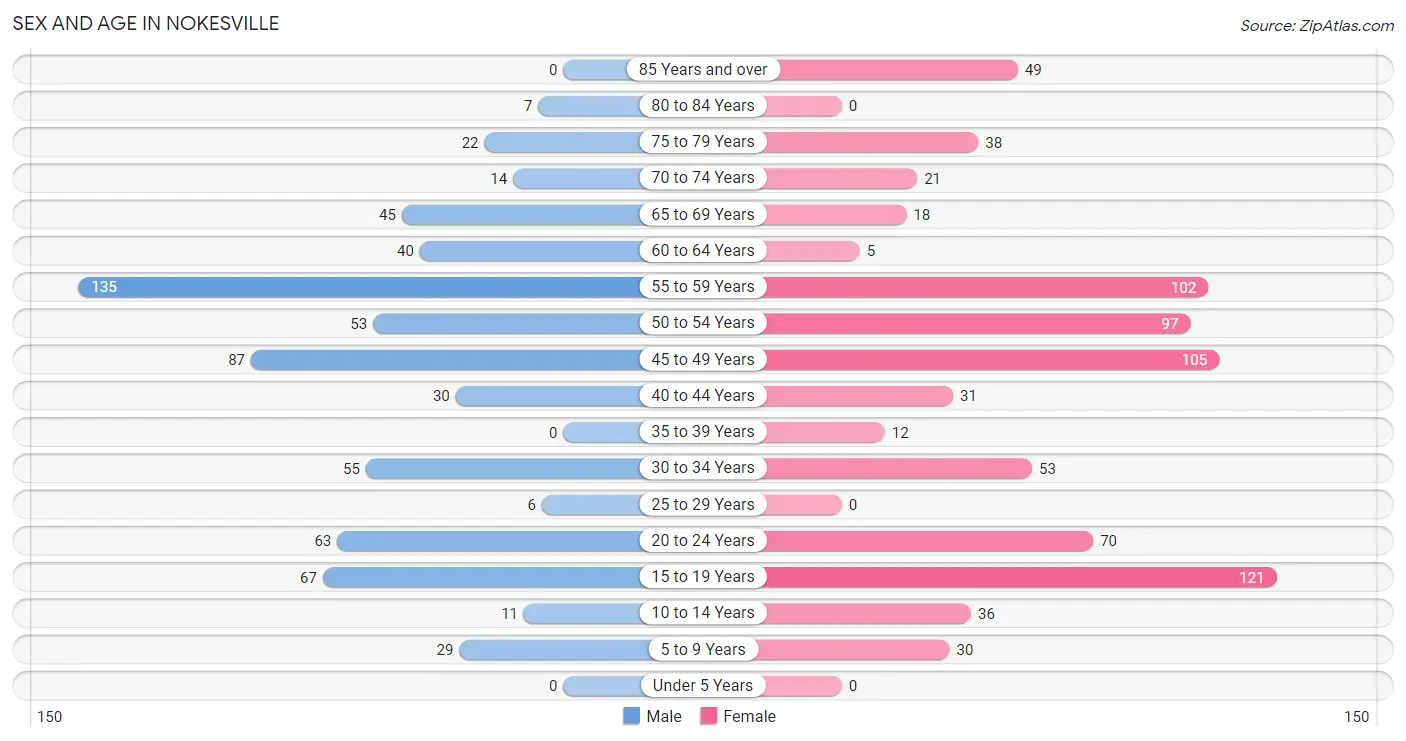
The most populous age groups in Nokesville are 55 to 59 Years (135 | 20.3%) for men and 15 to 19 Years (121 | 15.4%) for women.
| Age Bracket | Male | Female |
| Under 5 Years | 0 (0.0%) | 0 (0.0%) |
| 5 to 9 Years | 29 (4.4%) | 30 (3.8%) |
| 10 to 14 Years | 11 (1.7%) | 36 (4.6%) |
| 15 to 19 Years | 67 (10.1%) | 121 (15.4%) |
| 20 to 24 Years | 63 (9.5%) | 70 (8.9%) |
| 25 to 29 Years | 6 (0.9%) | 0 (0.0%) |
| 30 to 34 Years | 55 (8.3%) | 53 (6.7%) |
| 35 to 39 Years | 0 (0.0%) | 12 (1.5%) |
| 40 to 44 Years | 30 (4.5%) | 31 (3.9%) |
| 45 to 49 Years | 87 (13.1%) | 105 (13.3%) |
| 50 to 54 Years | 53 (8.0%) | 97 (12.3%) |
| 55 to 59 Years | 135 (20.3%) | 102 (12.9%) |
| 60 to 64 Years | 40 (6.0%) | 5 (0.6%) |
| 65 to 69 Years | 45 (6.8%) | 18 (2.3%) |
| 70 to 74 Years | 14 (2.1%) | 21 (2.7%) |
| 75 to 79 Years | 22 (3.3%) | 38 (4.8%) |
| 80 to 84 Years | 7 (1.1%) | 0 (0.0%) |
| 85 Years and over | 0 (0.0%) | 49 (6.2%) |
| Total | 664 (100.0%) | 788 (100.0%) |
Families and Households in Nokesville
Median Family Size in Nokesville
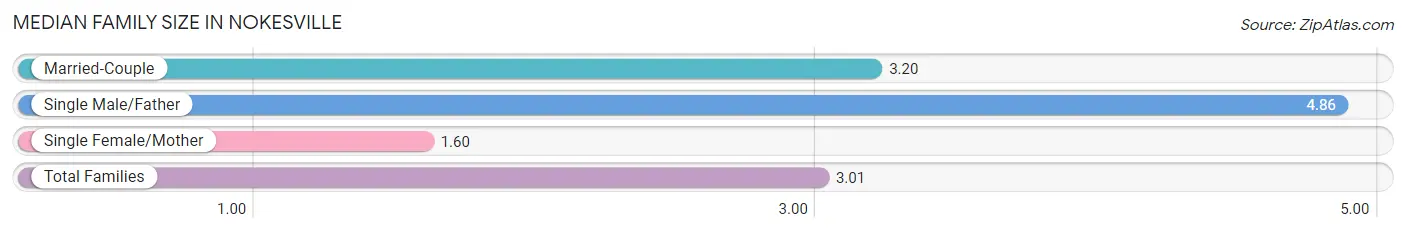
The median family size in Nokesville is 3.01 persons per family, with single male/father families (28 | 6.7%) accounting for the largest median family size of 4.86 persons per family. On the other hand, single female/mother families (80 | 19.2%) represent the smallest median family size with 1.60 persons per family.
| Family Type | # Families | Family Size |
| Married-Couple | 308 (74.0%) | 3.20 |
| Single Male/Father | 28 (6.7%) | 4.86 |
| Single Female/Mother | 80 (19.2%) | 1.60 |
| Total Families | 416 (100.0%) | 3.01 |
Median Household Size in Nokesville
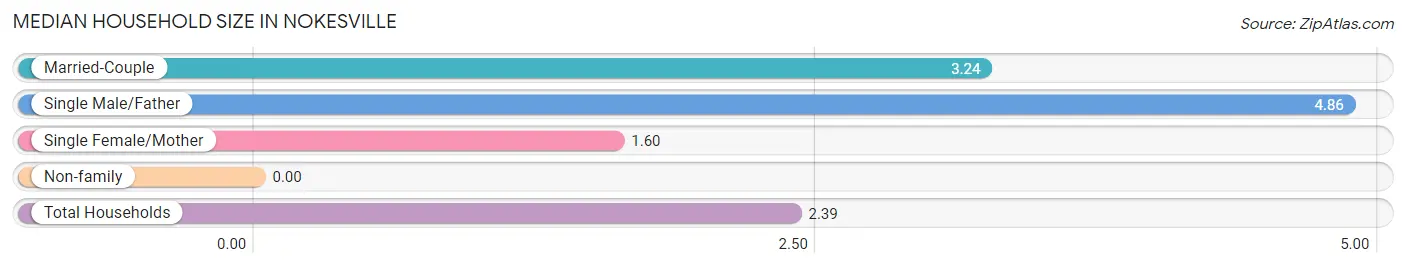
| Household Type | # Households | Household Size |
| Married-Couple | 308 (50.7%) | 3.24 |
| Single Male/Father | 28 (4.6%) | 4.86 |
| Single Female/Mother | 80 (13.2%) | 1.60 |
| Non-family | 191 (31.5%) | - |
| Total Households | 607 (100.0%) | 2.39 |
Household Size by Marriage Status in Nokesville
Out of a total of 607 households in Nokesville, 416 (68.5%) are family households, while 191 (31.5%) are nonfamily households. The most numerous type of family households are 2-person households, comprising 251, and the most common type of nonfamily households are 1-person households, comprising 191.
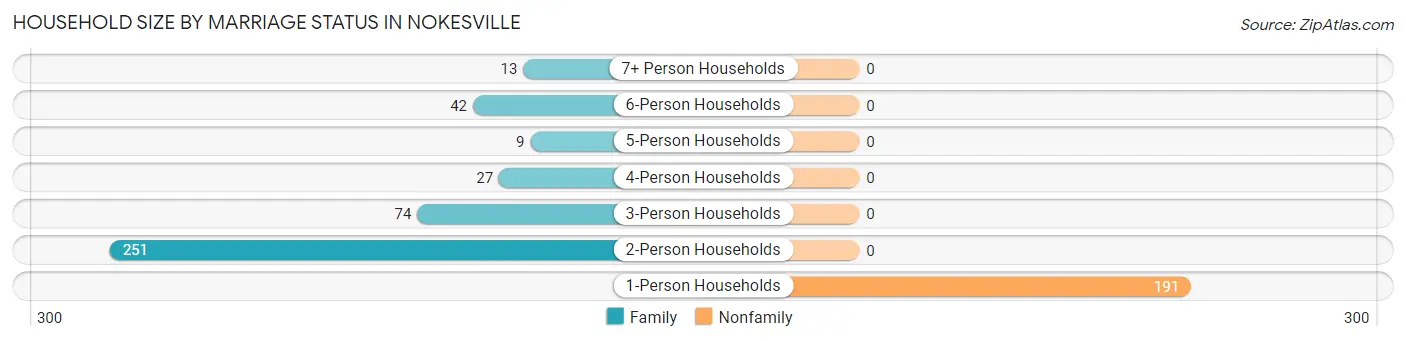
| Household Size | Family Households | Nonfamily Households |
| 1-Person Households | - | 191 (31.5%) |
| 2-Person Households | 251 (41.3%) | 0 (0.0%) |
| 3-Person Households | 74 (12.2%) | 0 (0.0%) |
| 4-Person Households | 27 (4.4%) | 0 (0.0%) |
| 5-Person Households | 9 (1.5%) | 0 (0.0%) |
| 6-Person Households | 42 (6.9%) | 0 (0.0%) |
| 7+ Person Households | 13 (2.1%) | 0 (0.0%) |
| Total | 416 (68.5%) | 191 (31.5%) |
Female Fertility in Nokesville
Fertility by Age in Nokesville
Average fertility rate in Nokesville is 22.0 births per 1,000 women. Women in the age bracket of 35 to 50 years have the highest fertility rate with 56.0 births per 1,000 women. Women in the age bracket of 35 to 50 years acount for 100.0% of all women with births.
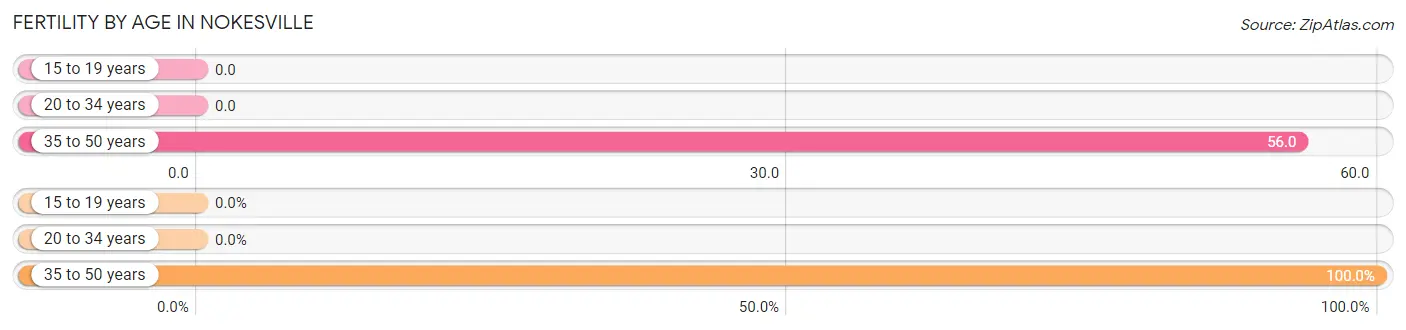
| Age Bracket | Women with Births | Births / 1,000 Women |
| 15 to 19 years | 0 (0.0%) | 0.0 |
| 20 to 34 years | 0 (0.0%) | 0.0 |
| 35 to 50 years | 9 (100.0%) | 56.0 |
| Total | 9 (100.0%) | 22.0 |
Fertility by Age by Marriage Status in Nokesville
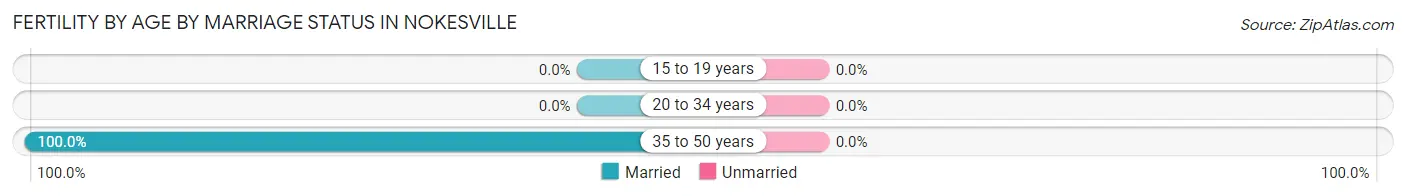
| Age Bracket | Married | Unmarried |
| 15 to 19 years | 0 (0.0%) | 0 (0.0%) |
| 20 to 34 years | 0 (0.0%) | 0 (0.0%) |
| 35 to 50 years | 9 (100.0%) | 0 (0.0%) |
| Total | 9 (100.0%) | 0 (0.0%) |
Fertility by Education in Nokesville
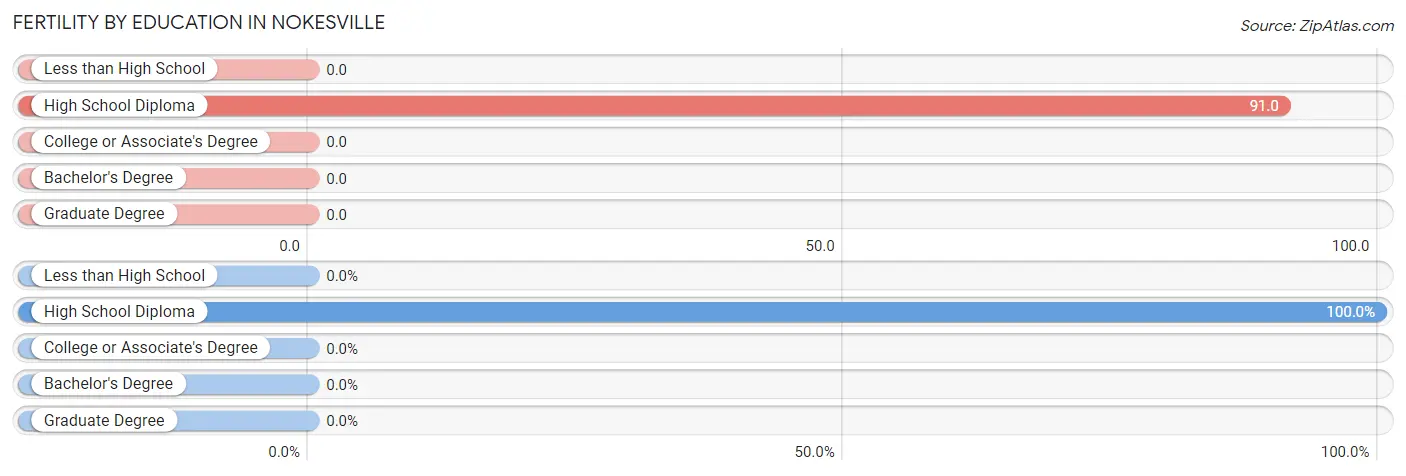
| Educational Attainment | Women with Births | Births / 1,000 Women |
| Less than High School | 0 (0.0%) | 0.0 |
| High School Diploma | 9 (100.0%) | 91.0 |
| College or Associate's Degree | 0 (0.0%) | 0.0 |
| Bachelor's Degree | 0 (0.0%) | 0.0 |
| Graduate Degree | 0 (0.0%) | 0.0 |
| Total | 9 (100.0%) | 22.0 |
Fertility by Education by Marriage Status in Nokesville
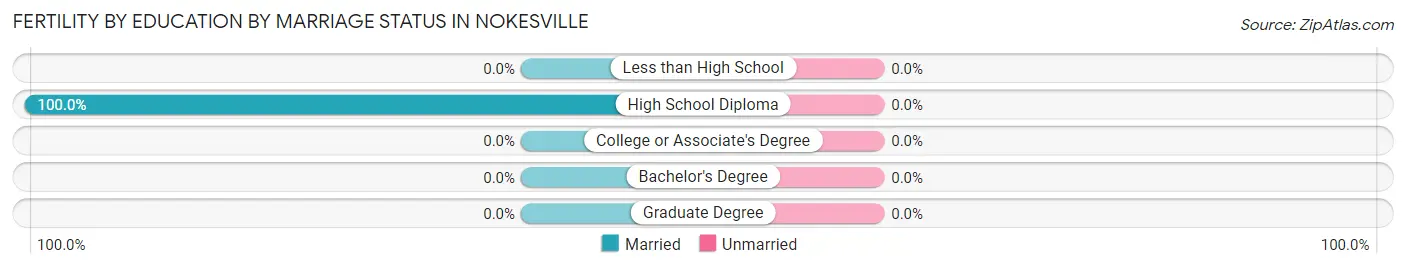
| Educational Attainment | Married | Unmarried |
| Less than High School | 0 (0.0%) | 0 (0.0%) |
| High School Diploma | 9 (100.0%) | 0 (0.0%) |
| College or Associate's Degree | 0 (0.0%) | 0 (0.0%) |
| Bachelor's Degree | 0 (0.0%) | 0 (0.0%) |
| Graduate Degree | 0 (0.0%) | 0 (0.0%) |
| Total | 9 (100.0%) | 0 (0.0%) |
Employment Characteristics in Nokesville
Employment by Class of Employer in Nokesville
Among the 804 employed individuals in Nokesville, private company employees (461 | 57.3%), local government employees (98 | 12.2%), and federal government employees (79 | 9.8%) make up the most common classes of employment.
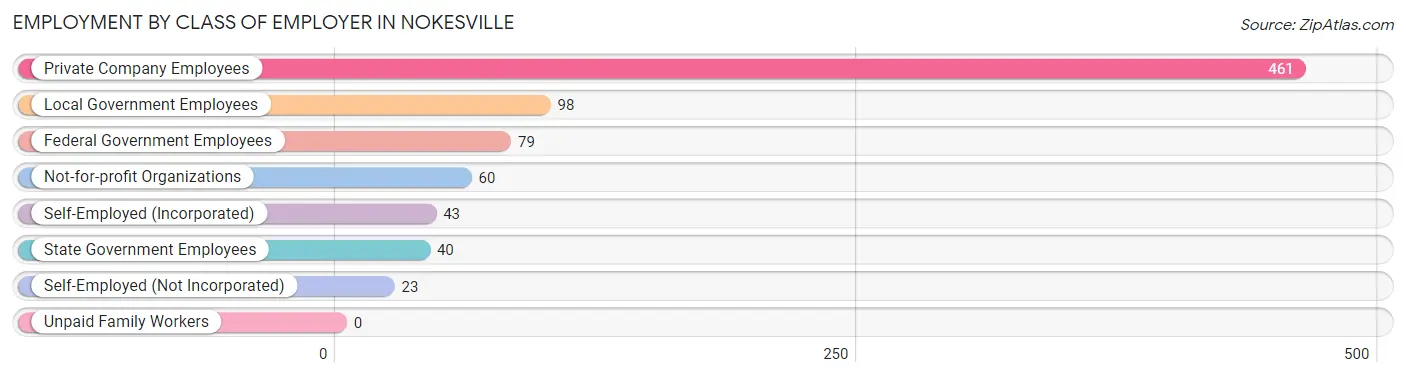
| Employer Class | # Employees | % Employees |
| Private Company Employees | 461 | 57.3% |
| Self-Employed (Incorporated) | 43 | 5.3% |
| Self-Employed (Not Incorporated) | 23 | 2.9% |
| Not-for-profit Organizations | 60 | 7.5% |
| Local Government Employees | 98 | 12.2% |
| State Government Employees | 40 | 5.0% |
| Federal Government Employees | 79 | 9.8% |
| Unpaid Family Workers | 0 | 0.0% |
| Total | 804 | 100.0% |
Employment Status by Age in Nokesville
According to the labor force statistics for Nokesville, out of the total population over 16 years of age (1,296), 69.0% or 894 individuals are in the labor force, with 4.1% or 37 of them unemployed. The age group with the highest labor force participation rate is 25 to 29 years, with 100.0% or 6 individuals in the labor force. Within the labor force, the 35 to 44 years age range has the highest percentage of unemployed individuals, with 28.8% or 21 of them being unemployed.
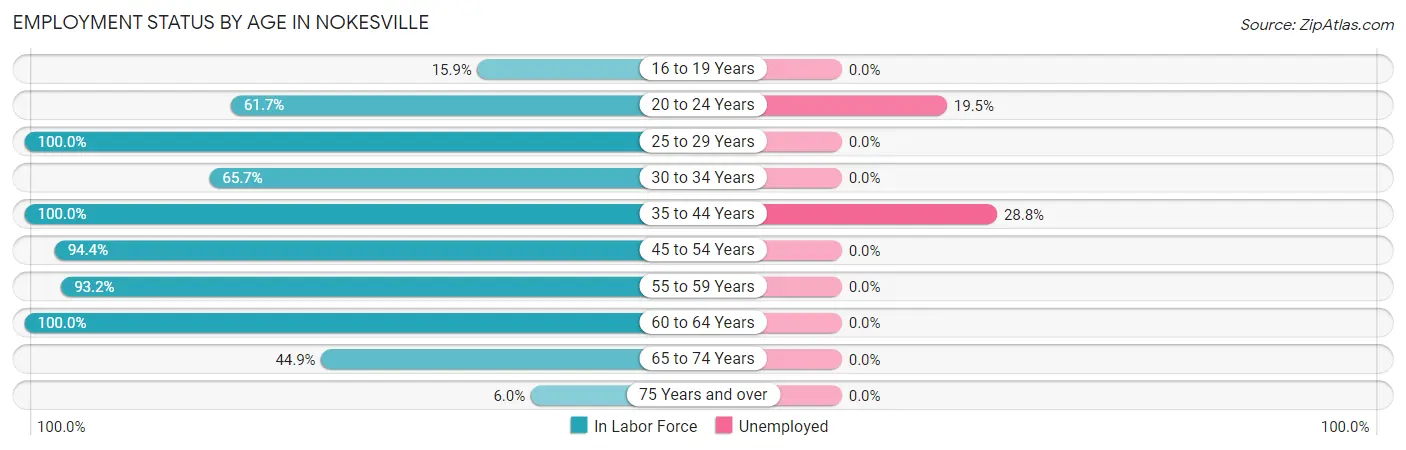
| Age Bracket | In Labor Force | Unemployed |
| 16 to 19 Years | 22 (15.9%) | 0 (0.0%) |
| 20 to 24 Years | 82 (61.7%) | 16 (19.5%) |
| 25 to 29 Years | 6 (100.0%) | 0 (0.0%) |
| 30 to 34 Years | 71 (65.7%) | 0 (0.0%) |
| 35 to 44 Years | 73 (100.0%) | 21 (28.8%) |
| 45 to 54 Years | 323 (94.4%) | 0 (0.0%) |
| 55 to 59 Years | 221 (93.2%) | 0 (0.0%) |
| 60 to 64 Years | 45 (100.0%) | 0 (0.0%) |
| 65 to 74 Years | 44 (44.9%) | 0 (0.0%) |
| 75 Years and over | 7 (6.0%) | 0 (0.0%) |
| Total | 894 (69.0%) | 37 (4.1%) |
Employment Status by Educational Attainment in Nokesville
According to labor force statistics for Nokesville, 91.1% of individuals (739) out of the total population between 25 and 64 years of age (811) are in the labor force, with 2.8% or 21 of them being unemployed. The group with the highest labor force participation rate are those with the educational attainment of less than high school, with 100.0% or 20 individuals in the labor force. Within the labor force, individuals with college / associate degree education have the highest percentage of unemployment, with 10.7% or 21 of them being unemployed.
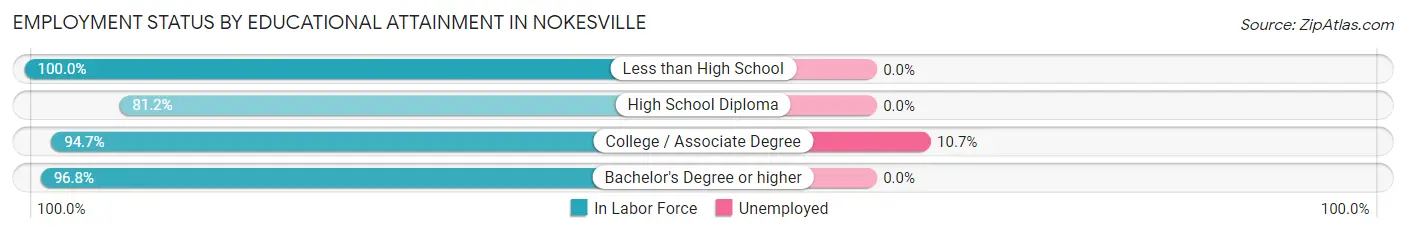
| Educational Attainment | In Labor Force | Unemployed |
| Less than High School | 20 (100.0%) | 0 (0.0%) |
| High School Diploma | 220 (81.2%) | 0 (0.0%) |
| College / Associate Degree | 197 (94.7%) | 22 (10.7%) |
| Bachelor's Degree or higher | 302 (96.8%) | 0 (0.0%) |
| Total | 739 (91.1%) | 23 (2.8%) |
Employment Occupations by Sex in Nokesville
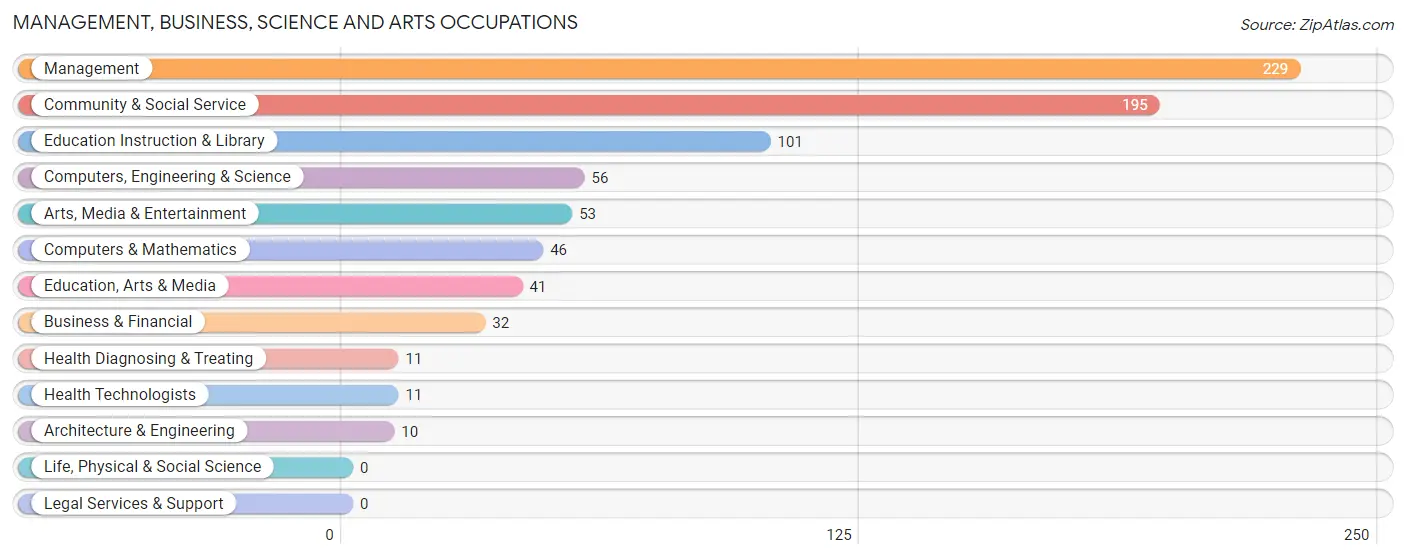
Management, Business, Science and Arts Occupations
The most common Management, Business, Science and Arts occupations in Nokesville are Management (229 | 26.7%), Community & Social Service (195 | 22.8%), Education Instruction & Library (101 | 11.8%), Computers, Engineering & Science (56 | 6.5%), and Arts, Media & Entertainment (53 | 6.2%).
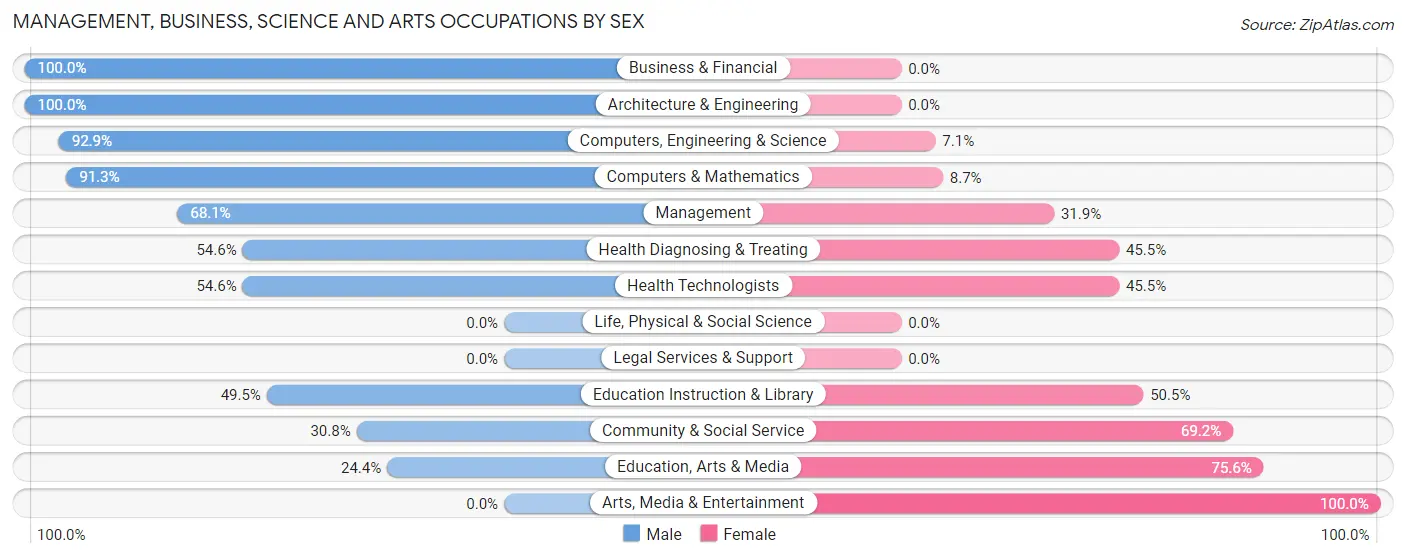
Management, Business, Science and Arts Occupations by Sex
Within the Management, Business, Science and Arts occupations in Nokesville, the most male-oriented occupations are Business & Financial (100.0%), Architecture & Engineering (100.0%), and Computers, Engineering & Science (92.9%), while the most female-oriented occupations are Arts, Media & Entertainment (100.0%), Education, Arts & Media (75.6%), and Community & Social Service (69.2%).
| Occupation | Male | Female |
| Management | 156 (68.1%) | 73 (31.9%) |
| Business & Financial | 32 (100.0%) | 0 (0.0%) |
| Computers, Engineering & Science | 52 (92.9%) | 4 (7.1%) |
| Computers & Mathematics | 42 (91.3%) | 4 (8.7%) |
| Architecture & Engineering | 10 (100.0%) | 0 (0.0%) |
| Life, Physical & Social Science | 0 (0.0%) | 0 (0.0%) |
| Community & Social Service | 60 (30.8%) | 135 (69.2%) |
| Education, Arts & Media | 10 (24.4%) | 31 (75.6%) |
| Legal Services & Support | 0 (0.0%) | 0 (0.0%) |
| Education Instruction & Library | 50 (49.5%) | 51 (50.5%) |
| Arts, Media & Entertainment | 0 (0.0%) | 53 (100.0%) |
| Health Diagnosing & Treating | 6 (54.5%) | 5 (45.5%) |
| Health Technologists | 6 (54.5%) | 5 (45.5%) |
| Total (Category) | 306 (58.5%) | 217 (41.5%) |
| Total (Overall) | 404 (47.1%) | 453 (52.9%) |
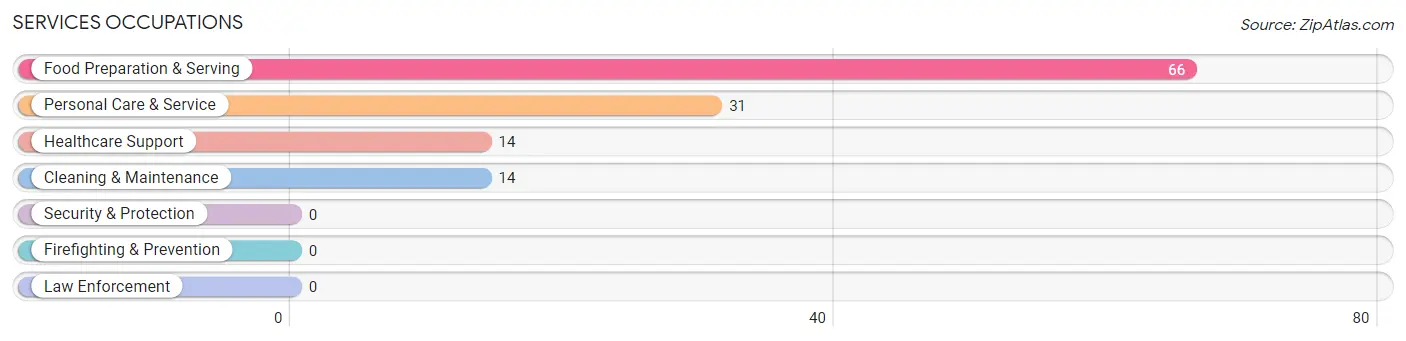
Services Occupations
The most common Services occupations in Nokesville are Food Preparation & Serving (66 | 7.7%), Personal Care & Service (31 | 3.6%), Healthcare Support (14 | 1.6%), and Cleaning & Maintenance (14 | 1.6%).
Services Occupations by Sex
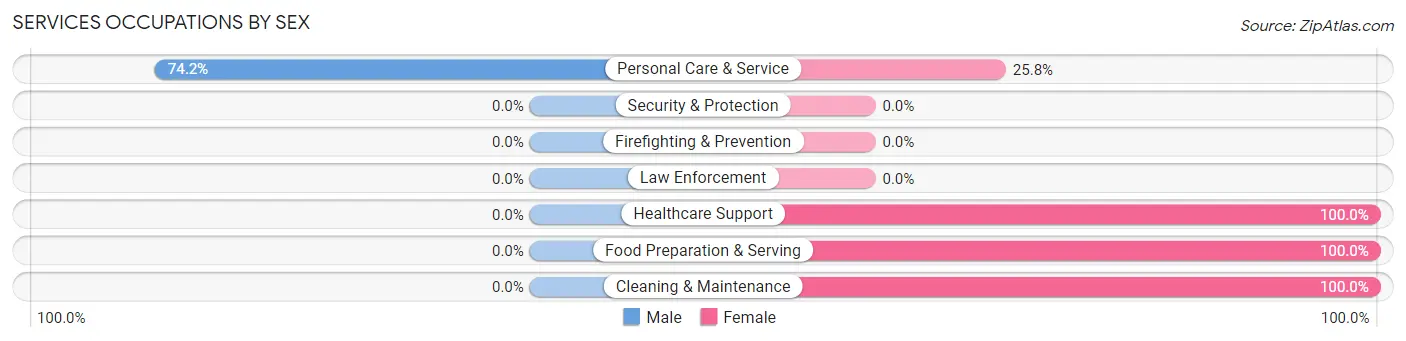
| Occupation | Male | Female |
| Healthcare Support | 0 (0.0%) | 14 (100.0%) |
| Security & Protection | 0 (0.0%) | 0 (0.0%) |
| Firefighting & Prevention | 0 (0.0%) | 0 (0.0%) |
| Law Enforcement | 0 (0.0%) | 0 (0.0%) |
| Food Preparation & Serving | 0 (0.0%) | 66 (100.0%) |
| Cleaning & Maintenance | 0 (0.0%) | 14 (100.0%) |
| Personal Care & Service | 23 (74.2%) | 8 (25.8%) |
| Total (Category) | 23 (18.4%) | 102 (81.6%) |
| Total (Overall) | 404 (47.1%) | 453 (52.9%) |
Sales and Office Occupations
The most common Sales and Office occupations in Nokesville are Office & Administration (60 | 7.0%), and Sales & Related (41 | 4.8%).
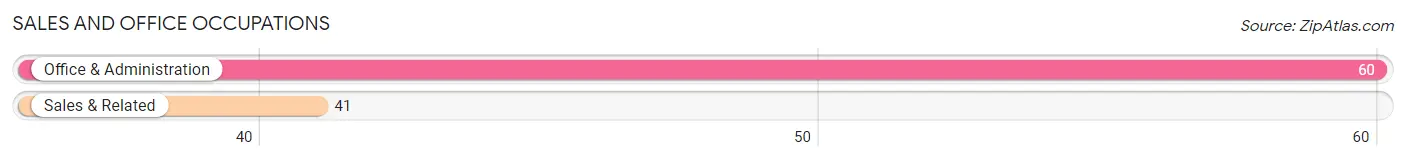
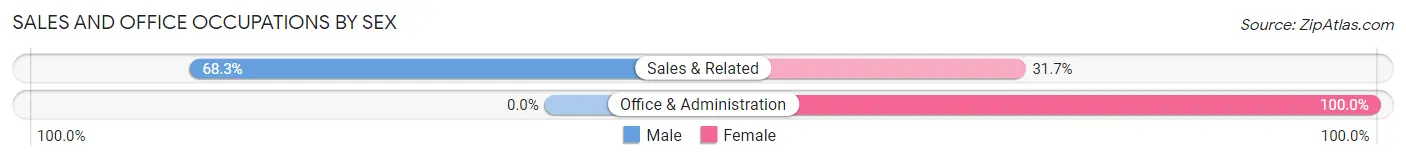
Sales and Office Occupations by Sex
| Occupation | Male | Female |
| Sales & Related | 28 (68.3%) | 13 (31.7%) |
| Office & Administration | 0 (0.0%) | 60 (100.0%) |
| Total (Category) | 28 (27.7%) | 73 (72.3%) |
| Total (Overall) | 404 (47.1%) | 453 (52.9%) |
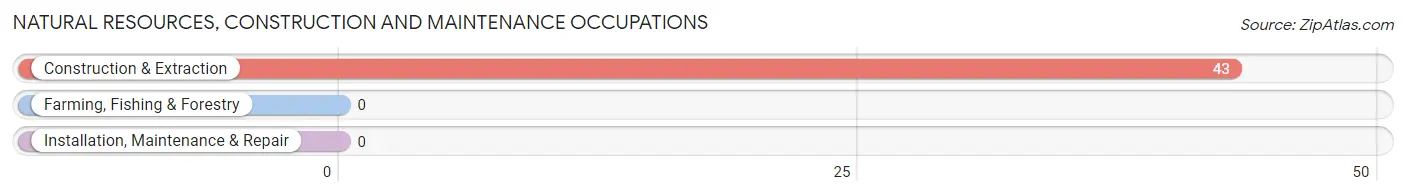
Natural Resources, Construction and Maintenance Occupations
The most common Natural Resources, Construction and Maintenance occupations in Nokesville are , and Construction & Extraction (43 | 5.0%).
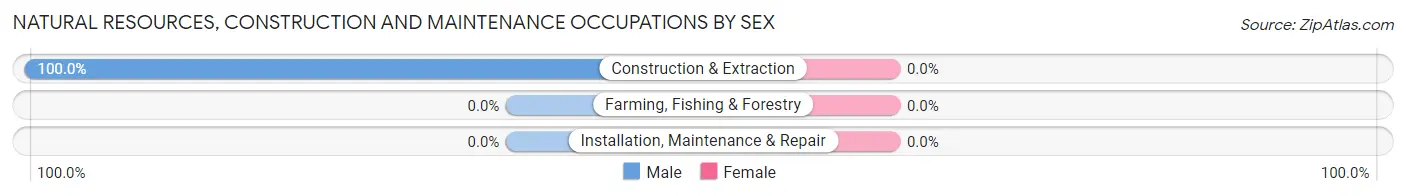
Natural Resources, Construction and Maintenance Occupations by Sex
| Occupation | Male | Female |
| Farming, Fishing & Forestry | 0 (0.0%) | 0 (0.0%) |
| Construction & Extraction | 43 (100.0%) | 0 (0.0%) |
| Installation, Maintenance & Repair | 0 (0.0%) | 0 (0.0%) |
| Total (Category) | 43 (100.0%) | 0 (0.0%) |
| Total (Overall) | 404 (47.1%) | 453 (52.9%) |
Production, Transportation and Moving Occupations
The most common Production, Transportation and Moving occupations in Nokesville are Transportation (53 | 6.2%), Production (8 | 0.9%), and Material Moving (4 | 0.5%).
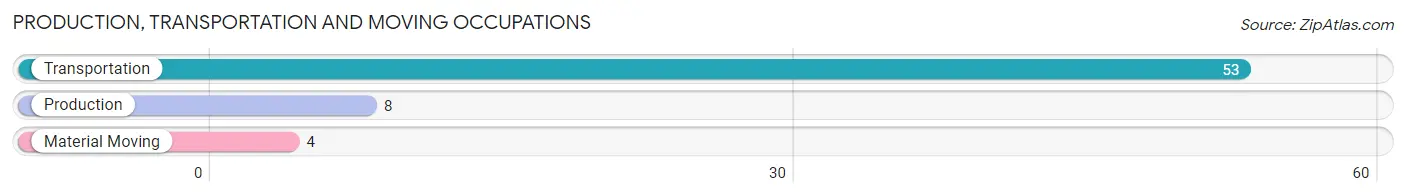
Production, Transportation and Moving Occupations by Sex
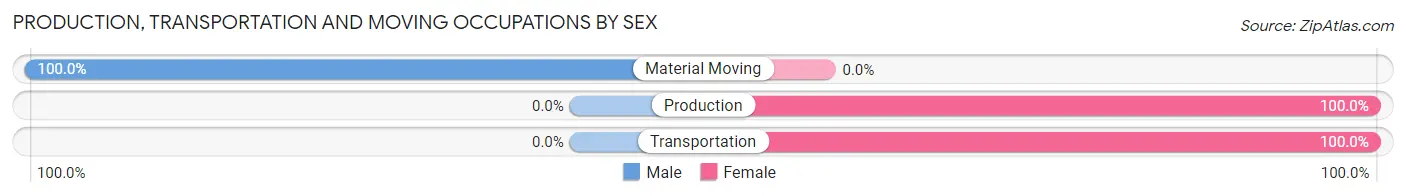
| Occupation | Male | Female |
| Production | 0 (0.0%) | 8 (100.0%) |
| Transportation | 0 (0.0%) | 53 (100.0%) |
| Material Moving | 4 (100.0%) | 0 (0.0%) |
| Total (Category) | 4 (6.1%) | 61 (93.9%) |
| Total (Overall) | 404 (47.1%) | 453 (52.9%) |
Employment Industries by Sex in Nokesville
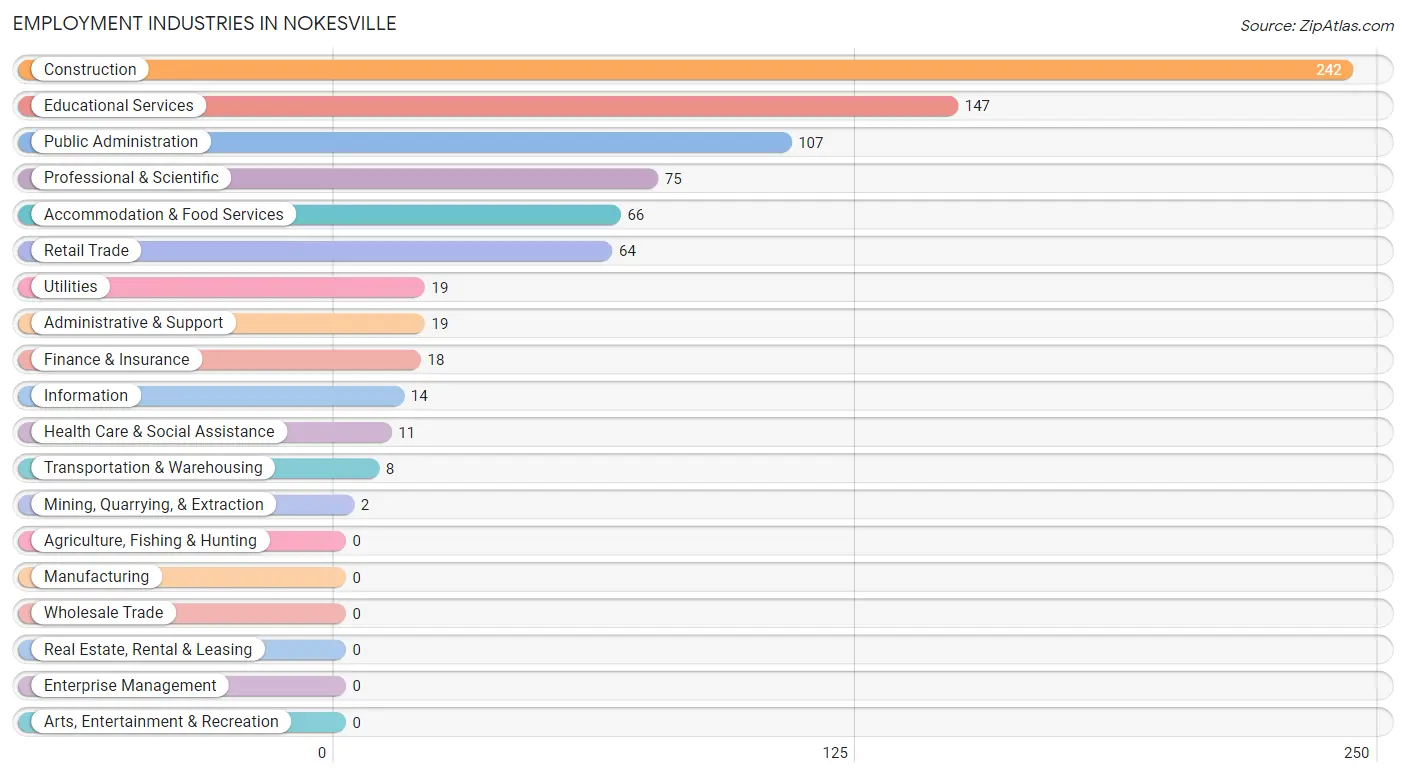
Employment Industries in Nokesville
The major employment industries in Nokesville include Construction (242 | 28.2%), Educational Services (147 | 17.2%), Public Administration (107 | 12.5%), Professional & Scientific (75 | 8.7%), and Accommodation & Food Services (66 | 7.7%).
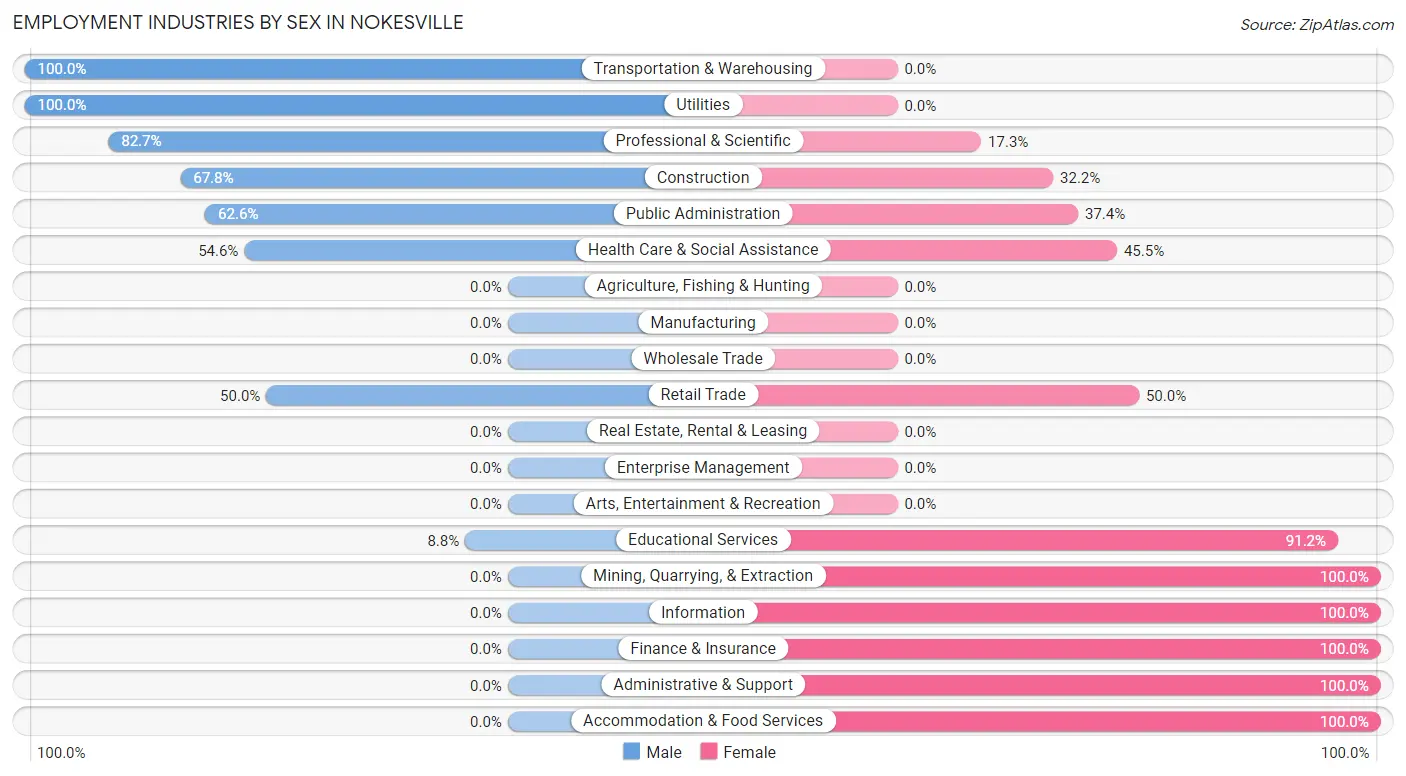
Employment Industries by Sex in Nokesville
The Nokesville industries that see more men than women are Transportation & Warehousing (100.0%), Utilities (100.0%), and Professional & Scientific (82.7%), whereas the industries that tend to have a higher number of women are Mining, Quarrying, & Extraction (100.0%), Information (100.0%), and Finance & Insurance (100.0%).
| Industry | Male | Female |
| Agriculture, Fishing & Hunting | 0 (0.0%) | 0 (0.0%) |
| Mining, Quarrying, & Extraction | 0 (0.0%) | 2 (100.0%) |
| Construction | 164 (67.8%) | 78 (32.2%) |
| Manufacturing | 0 (0.0%) | 0 (0.0%) |
| Wholesale Trade | 0 (0.0%) | 0 (0.0%) |
| Retail Trade | 32 (50.0%) | 32 (50.0%) |
| Transportation & Warehousing | 8 (100.0%) | 0 (0.0%) |
| Utilities | 19 (100.0%) | 0 (0.0%) |
| Information | 0 (0.0%) | 14 (100.0%) |
| Finance & Insurance | 0 (0.0%) | 18 (100.0%) |
| Real Estate, Rental & Leasing | 0 (0.0%) | 0 (0.0%) |
| Professional & Scientific | 62 (82.7%) | 13 (17.3%) |
| Enterprise Management | 0 (0.0%) | 0 (0.0%) |
| Administrative & Support | 0 (0.0%) | 19 (100.0%) |
| Educational Services | 13 (8.8%) | 134 (91.2%) |
| Health Care & Social Assistance | 6 (54.5%) | 5 (45.5%) |
| Arts, Entertainment & Recreation | 0 (0.0%) | 0 (0.0%) |
| Accommodation & Food Services | 0 (0.0%) | 66 (100.0%) |
| Public Administration | 67 (62.6%) | 40 (37.4%) |
| Total | 404 (47.1%) | 453 (52.9%) |
Education in Nokesville
School Enrollment in Nokesville
The most common levels of schooling among the 370 students in Nokesville are high school (147 | 39.7%), college / undergraduate (102 | 27.6%), and middle school (56 | 15.1%).
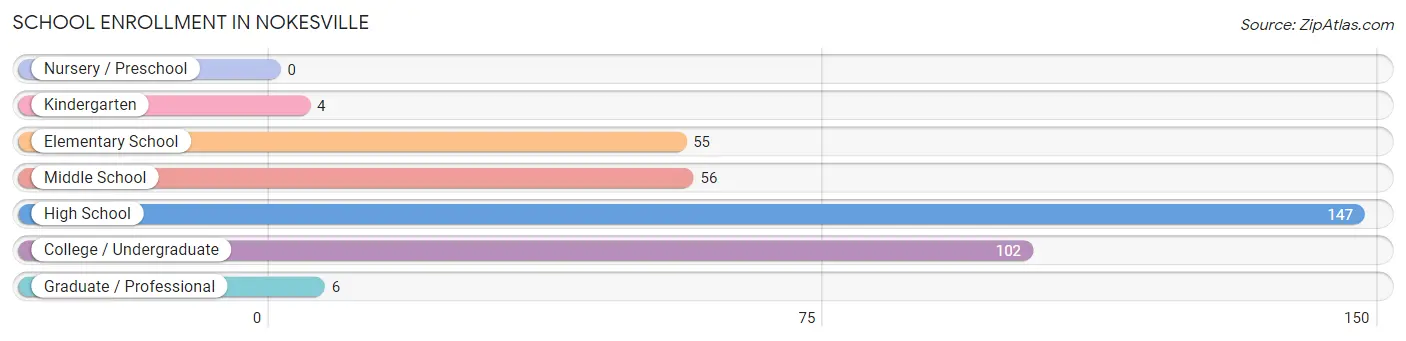
| School Level | # Students | % Students |
| Nursery / Preschool | 0 | 0.0% |
| Kindergarten | 4 | 1.1% |
| Elementary School | 55 | 14.9% |
| Middle School | 56 | 15.1% |
| High School | 147 | 39.7% |
| College / Undergraduate | 102 | 27.6% |
| Graduate / Professional | 6 | 1.6% |
| Total | 370 | 100.0% |
School Enrollment by Age by Funding Source in Nokesville
Out of a total of 370 students who are enrolled in schools in Nokesville, 37 (10.0%) attend a private institution, while the remaining 333 (90.0%) are enrolled in public schools. The age group of 35 years and over has the highest likelihood of being enrolled in private schools, with 14 (100.0% in the age bracket) enrolled. Conversely, the age group of 5 to 9 year old has the lowest likelihood of being enrolled in a private school, with 59 (100.0% in the age bracket) attending a public institution.
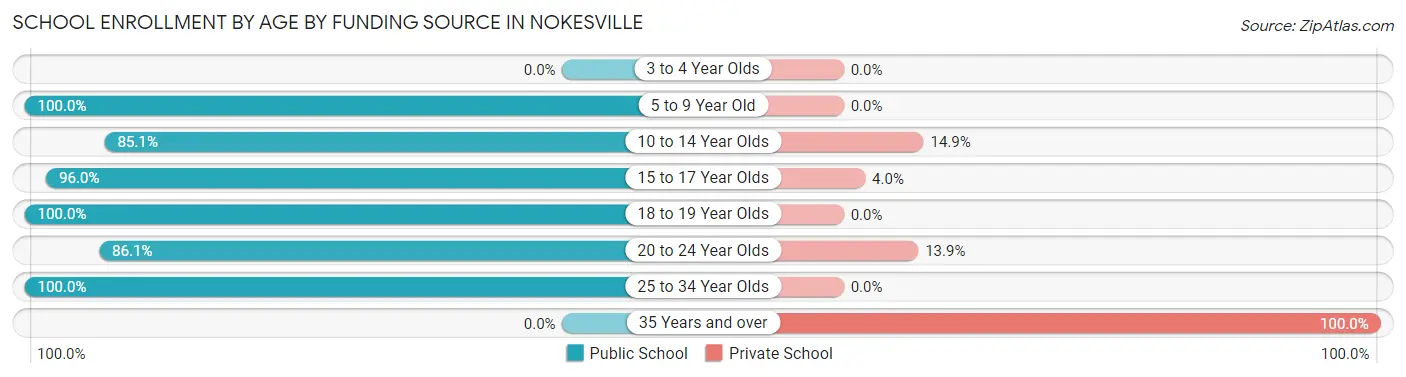
| Age Bracket | Public School | Private School |
| 3 to 4 Year Olds | 0 (0.0%) | 0 (0.0%) |
| 5 to 9 Year Old | 59 (100.0%) | 0 (0.0%) |
| 10 to 14 Year Olds | 40 (85.1%) | 7 (14.9%) |
| 15 to 17 Year Olds | 144 (96.0%) | 6 (4.0%) |
| 18 to 19 Year Olds | 22 (100.0%) | 0 (0.0%) |
| 20 to 24 Year Olds | 62 (86.1%) | 10 (13.9%) |
| 25 to 34 Year Olds | 6 (100.0%) | 0 (0.0%) |
| 35 Years and over | 0 (0.0%) | 14 (100.0%) |
| Total | 333 (90.0%) | 37 (10.0%) |
Educational Attainment by Field of Study in Nokesville
Engineering (93 | 23.3%), bio, nature & agricultural (63 | 15.8%), education (48 | 12.0%), business (37 | 9.2%), and literature & languages (37 | 9.2%) are the most common fields of study among 400 individuals in Nokesville who have obtained a bachelor's degree or higher.
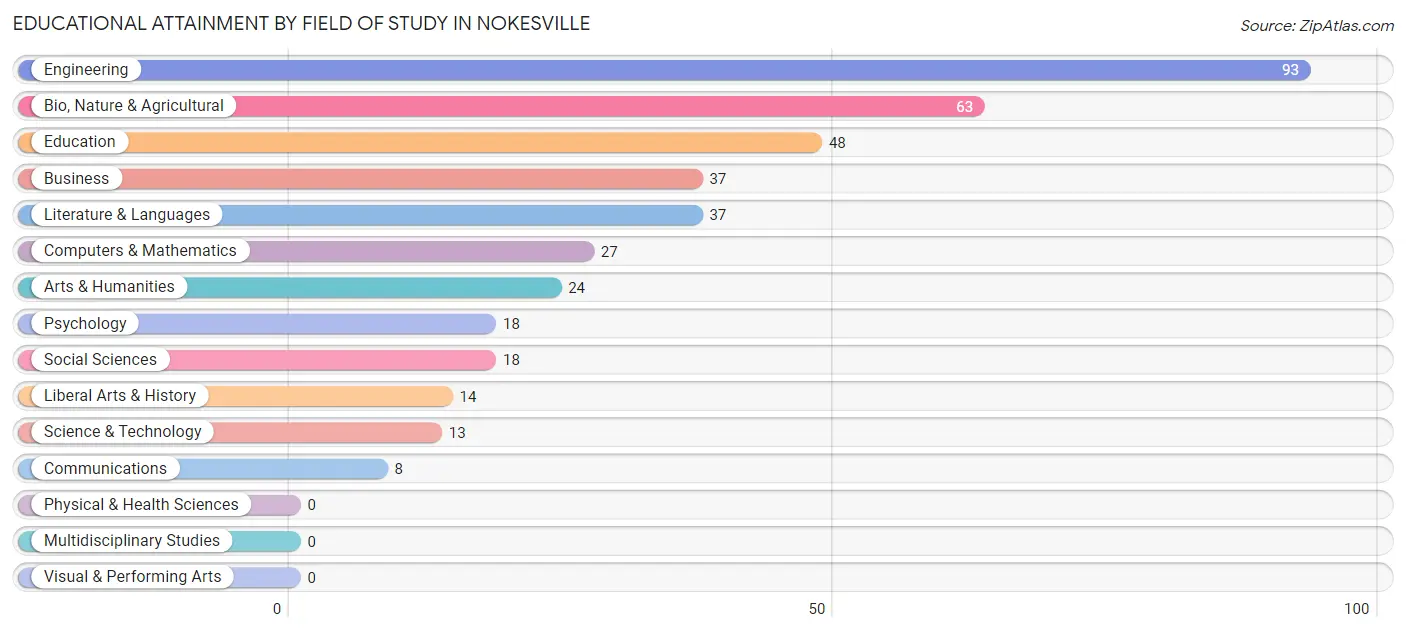
| Field of Study | # Graduates | % Graduates |
| Computers & Mathematics | 27 | 6.8% |
| Bio, Nature & Agricultural | 63 | 15.8% |
| Physical & Health Sciences | 0 | 0.0% |
| Psychology | 18 | 4.5% |
| Social Sciences | 18 | 4.5% |
| Engineering | 93 | 23.3% |
| Multidisciplinary Studies | 0 | 0.0% |
| Science & Technology | 13 | 3.3% |
| Business | 37 | 9.2% |
| Education | 48 | 12.0% |
| Literature & Languages | 37 | 9.2% |
| Liberal Arts & History | 14 | 3.5% |
| Visual & Performing Arts | 0 | 0.0% |
| Communications | 8 | 2.0% |
| Arts & Humanities | 24 | 6.0% |
| Total | 400 | 100.0% |
Transportation & Commute in Nokesville
Vehicle Availability by Sex in Nokesville
The most prevalent vehicle ownership categories in Nokesville are males with 2 vehicles (136, accounting for 33.7%) and females with 2 vehicles (168, making up 34.0%).
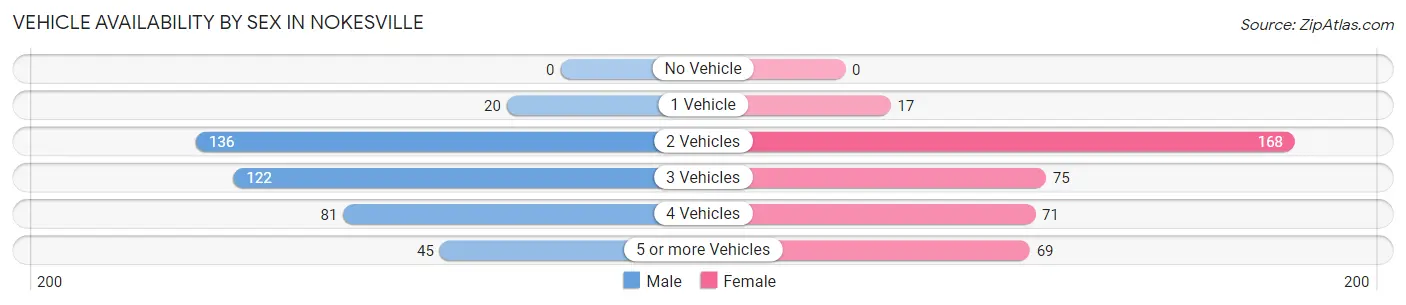
| Vehicles Available | Male | Female |
| No Vehicle | 0 (0.0%) | 0 (0.0%) |
| 1 Vehicle | 20 (5.0%) | 17 (4.3%) |
| 2 Vehicles | 136 (33.7%) | 168 (42.0%) |
| 3 Vehicles | 122 (30.2%) | 75 (18.8%) |
| 4 Vehicles | 81 (20.1%) | 71 (17.7%) |
| 5 or more Vehicles | 45 (11.1%) | 69 (17.2%) |
| Total | 404 (100.0%) | 400 (100.0%) |
Commute Time in Nokesville
The most frequently occuring commute durations in Nokesville are 45 to 59 minutes (97 commuters, 14.3%), 60 to 89 minutes (96 commuters, 14.1%), and 5 to 9 minutes (90 commuters, 13.3%).
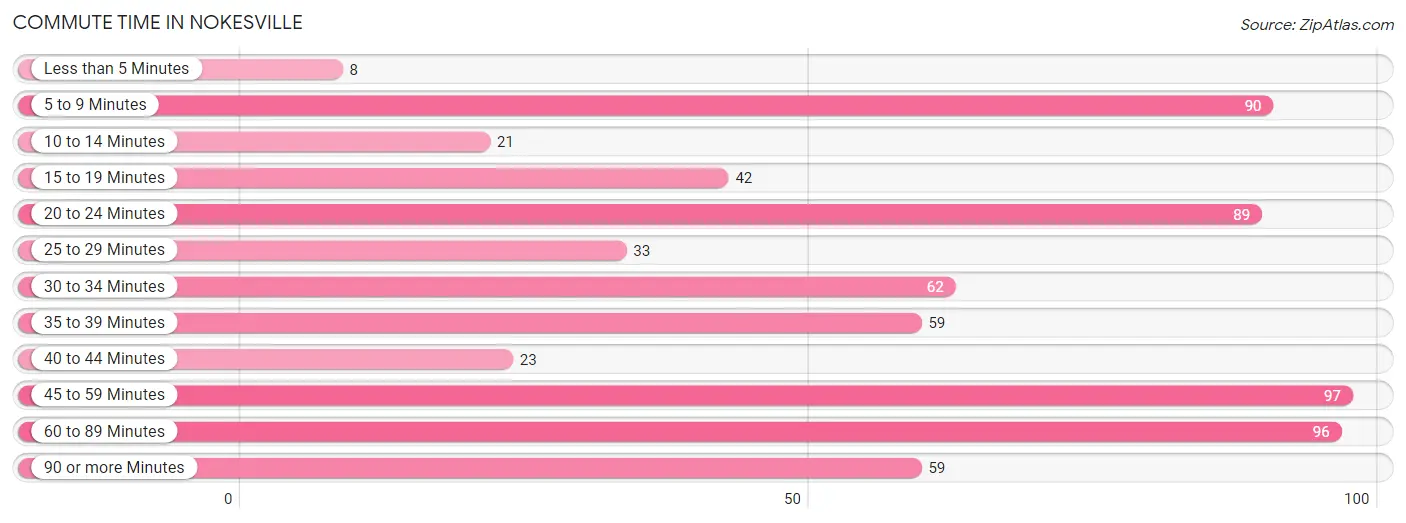
| Commute Time | # Commuters | % Commuters |
| Less than 5 Minutes | 8 | 1.2% |
| 5 to 9 Minutes | 90 | 13.3% |
| 10 to 14 Minutes | 21 | 3.1% |
| 15 to 19 Minutes | 42 | 6.2% |
| 20 to 24 Minutes | 89 | 13.1% |
| 25 to 29 Minutes | 33 | 4.9% |
| 30 to 34 Minutes | 62 | 9.1% |
| 35 to 39 Minutes | 59 | 8.7% |
| 40 to 44 Minutes | 23 | 3.4% |
| 45 to 59 Minutes | 97 | 14.3% |
| 60 to 89 Minutes | 96 | 14.1% |
| 90 or more Minutes | 59 | 8.7% |
Commute Time by Sex in Nokesville
The most common commute times in Nokesville are 60 to 89 minutes (73 commuters, 23.7%) for males and 45 to 59 minutes (72 commuters, 19.4%) for females.
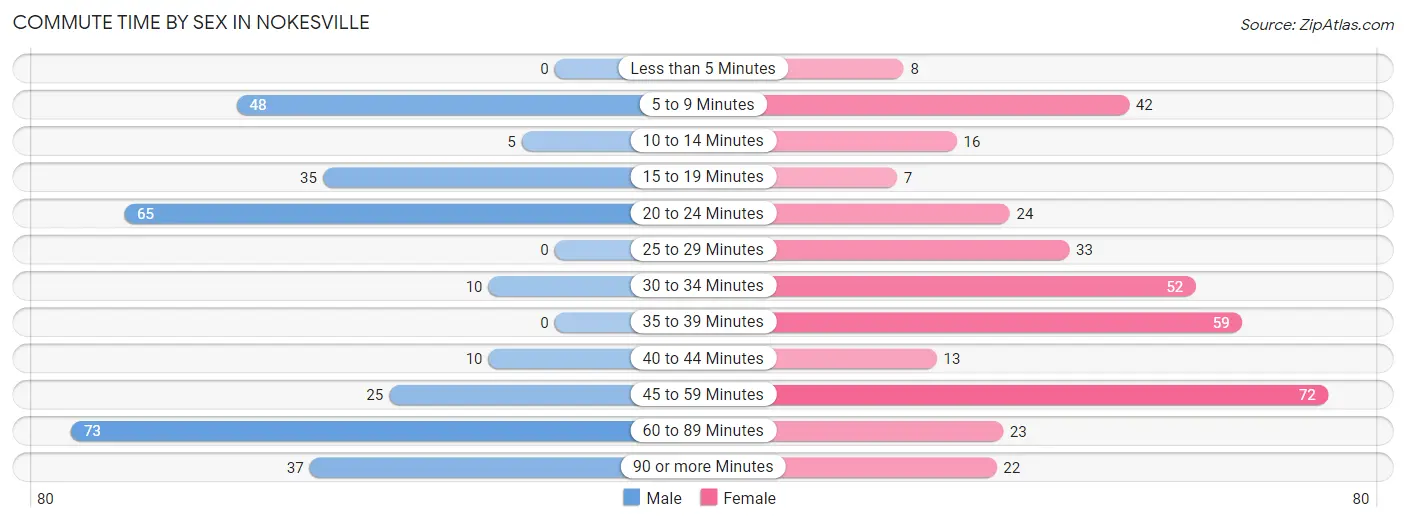
| Commute Time | Male | Female |
| Less than 5 Minutes | 0 (0.0%) | 8 (2.2%) |
| 5 to 9 Minutes | 48 (15.6%) | 42 (11.3%) |
| 10 to 14 Minutes | 5 (1.6%) | 16 (4.3%) |
| 15 to 19 Minutes | 35 (11.4%) | 7 (1.9%) |
| 20 to 24 Minutes | 65 (21.1%) | 24 (6.5%) |
| 25 to 29 Minutes | 0 (0.0%) | 33 (8.9%) |
| 30 to 34 Minutes | 10 (3.3%) | 52 (14.0%) |
| 35 to 39 Minutes | 0 (0.0%) | 59 (15.9%) |
| 40 to 44 Minutes | 10 (3.3%) | 13 (3.5%) |
| 45 to 59 Minutes | 25 (8.1%) | 72 (19.4%) |
| 60 to 89 Minutes | 73 (23.7%) | 23 (6.2%) |
| 90 or more Minutes | 37 (12.0%) | 22 (5.9%) |
Time of Departure to Work by Sex in Nokesville
The most frequent times of departure to work in Nokesville are 7:00 AM to 7:29 AM (91, 29.5%) for males and 4:00 PM to 11:59 PM (87, 23.4%) for females.
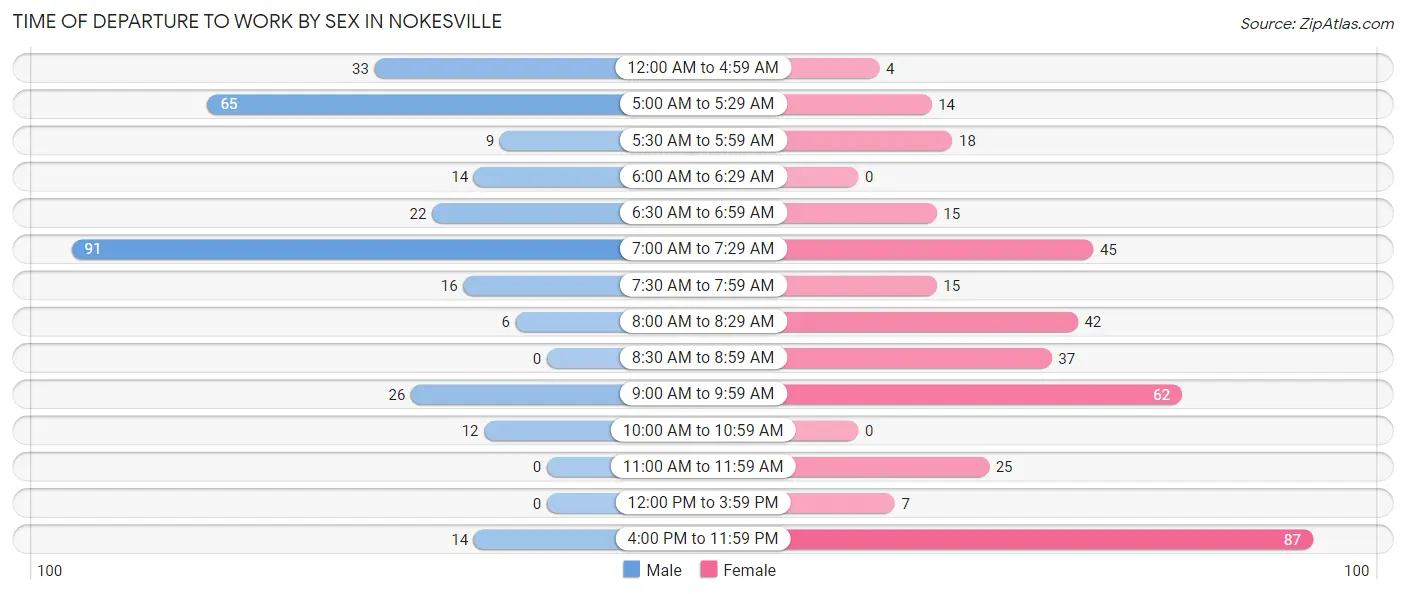
| Time of Departure | Male | Female |
| 12:00 AM to 4:59 AM | 33 (10.7%) | 4 (1.1%) |
| 5:00 AM to 5:29 AM | 65 (21.1%) | 14 (3.8%) |
| 5:30 AM to 5:59 AM | 9 (2.9%) | 18 (4.9%) |
| 6:00 AM to 6:29 AM | 14 (4.5%) | 0 (0.0%) |
| 6:30 AM to 6:59 AM | 22 (7.1%) | 15 (4.0%) |
| 7:00 AM to 7:29 AM | 91 (29.5%) | 45 (12.1%) |
| 7:30 AM to 7:59 AM | 16 (5.2%) | 15 (4.0%) |
| 8:00 AM to 8:29 AM | 6 (1.9%) | 42 (11.3%) |
| 8:30 AM to 8:59 AM | 0 (0.0%) | 37 (10.0%) |
| 9:00 AM to 9:59 AM | 26 (8.4%) | 62 (16.7%) |
| 10:00 AM to 10:59 AM | 12 (3.9%) | 0 (0.0%) |
| 11:00 AM to 11:59 AM | 0 (0.0%) | 25 (6.7%) |
| 12:00 PM to 3:59 PM | 0 (0.0%) | 7 (1.9%) |
| 4:00 PM to 11:59 PM | 14 (4.5%) | 87 (23.4%) |
| Total | 308 (100.0%) | 371 (100.0%) |
Housing Occupancy in Nokesville
Occupancy by Ownership in Nokesville
Of the total 607 dwellings in Nokesville, owner-occupied units account for 457 (75.3%), while renter-occupied units make up 150 (24.7%).
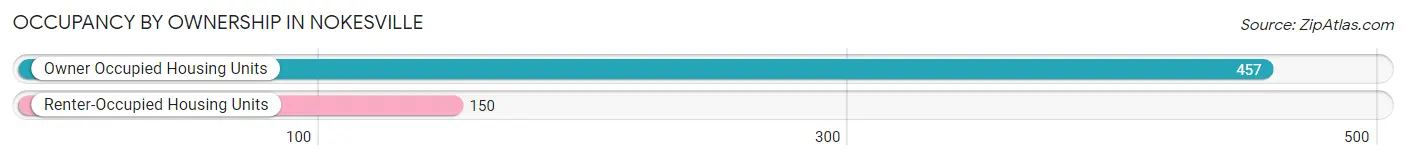
| Occupancy | # Housing Units | % Housing Units |
| Owner Occupied Housing Units | 457 | 75.3% |
| Renter-Occupied Housing Units | 150 | 24.7% |
| Total Occupied Housing Units | 607 | 100.0% |
Occupancy by Household Size in Nokesville
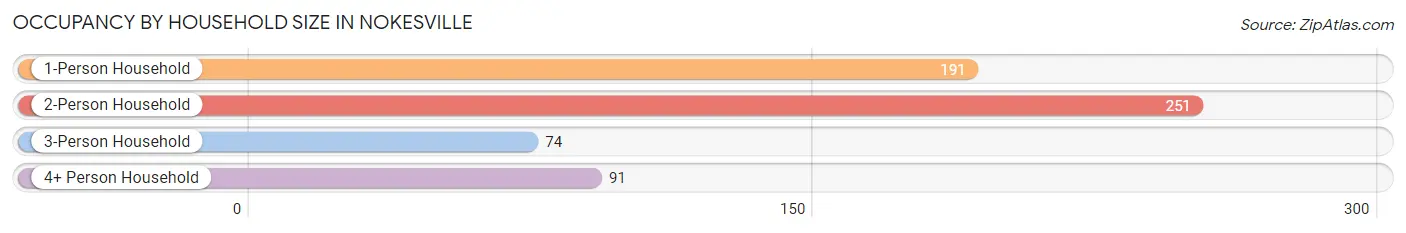
| Household Size | # Housing Units | % Housing Units |
| 1-Person Household | 191 | 31.5% |
| 2-Person Household | 251 | 41.3% |
| 3-Person Household | 74 | 12.2% |
| 4+ Person Household | 91 | 15.0% |
| Total Housing Units | 607 | 100.0% |
Occupancy by Ownership by Household Size in Nokesville
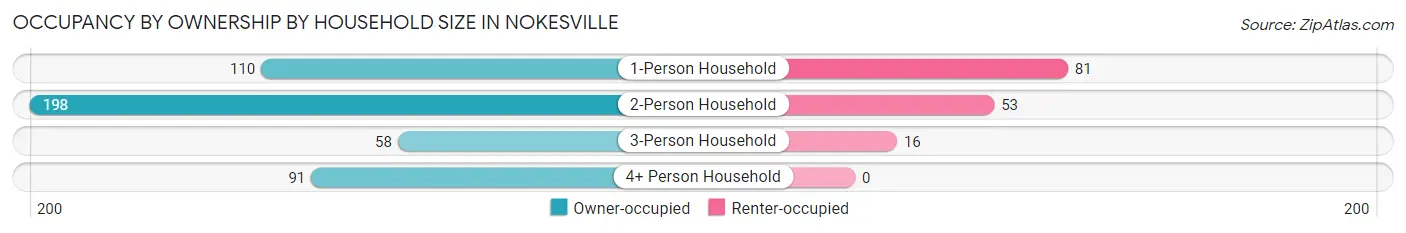
| Household Size | Owner-occupied | Renter-occupied |
| 1-Person Household | 110 (57.6%) | 81 (42.4%) |
| 2-Person Household | 198 (78.9%) | 53 (21.1%) |
| 3-Person Household | 58 (78.4%) | 16 (21.6%) |
| 4+ Person Household | 91 (100.0%) | 0 (0.0%) |
| Total Housing Units | 457 (75.3%) | 150 (24.7%) |
Occupancy by Educational Attainment in Nokesville
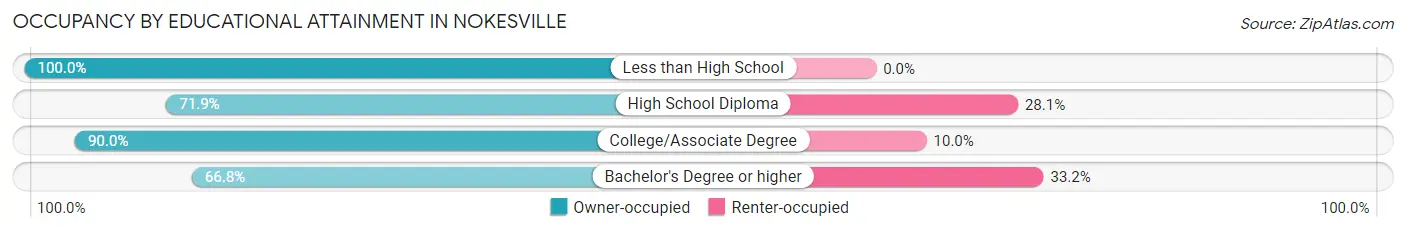
| Household Size | Owner-occupied | Renter-occupied |
| Less than High School | 23 (100.0%) | 0 (0.0%) |
| High School Diploma | 161 (71.9%) | 63 (28.1%) |
| College/Associate Degree | 126 (90.0%) | 14 (10.0%) |
| Bachelor's Degree or higher | 147 (66.8%) | 73 (33.2%) |
Occupancy by Age of Householder in Nokesville
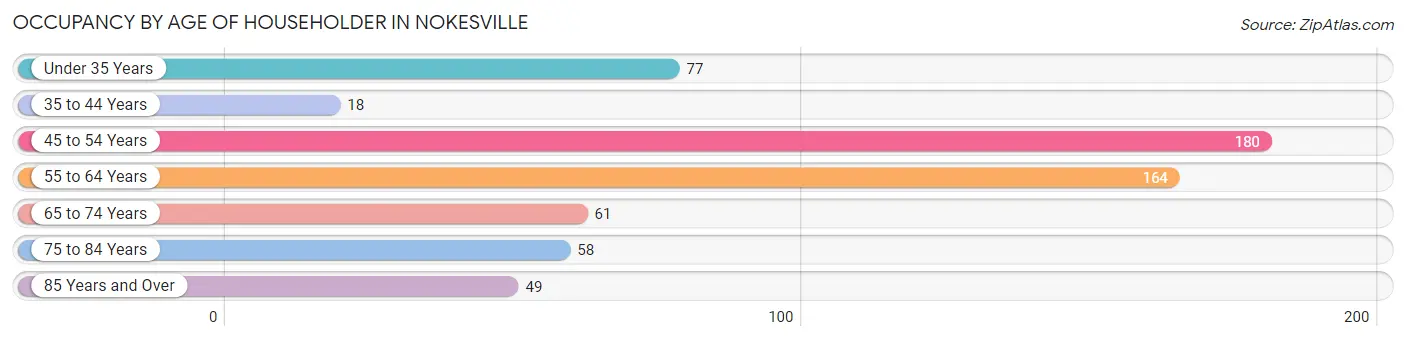
| Age Bracket | # Households | % Households |
| Under 35 Years | 77 | 12.7% |
| 35 to 44 Years | 18 | 3.0% |
| 45 to 54 Years | 180 | 29.6% |
| 55 to 64 Years | 164 | 27.0% |
| 65 to 74 Years | 61 | 10.1% |
| 75 to 84 Years | 58 | 9.6% |
| 85 Years and Over | 49 | 8.1% |
| Total | 607 | 100.0% |
Housing Finances in Nokesville
Median Income by Occupancy in Nokesville
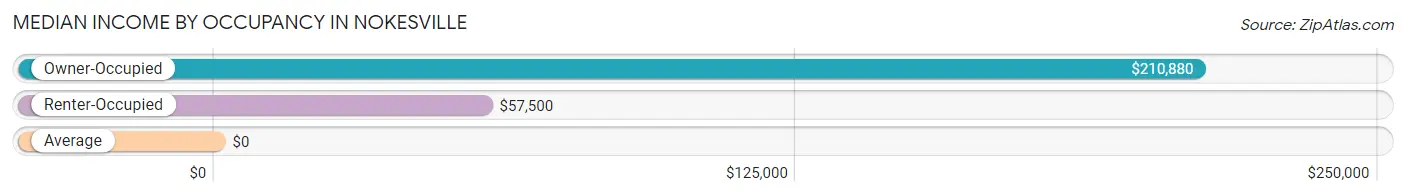
| Occupancy Type | # Households | Median Income |
| Owner-Occupied | 457 (75.3%) | $210,880 |
| Renter-Occupied | 150 (24.7%) | $57,500 |
| Average | 607 (100.0%) | $0 |
Occupancy by Householder Income Bracket in Nokesville
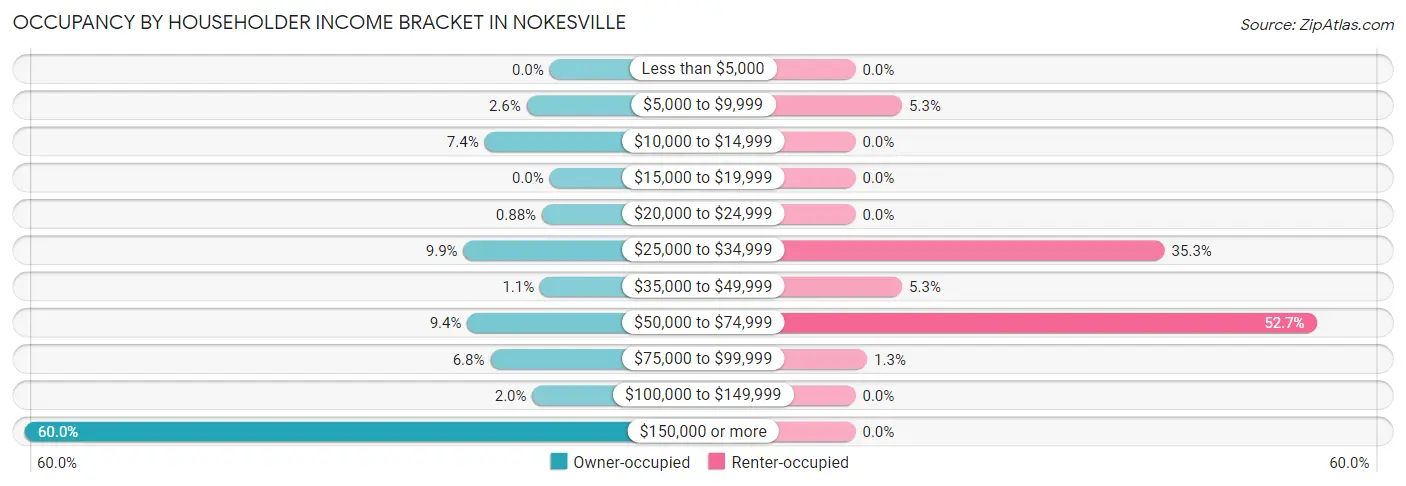
| Income Bracket | Owner-occupied | Renter-occupied |
| Less than $5,000 | 0 (0.0%) | 0 (0.0%) |
| $5,000 to $9,999 | 12 (2.6%) | 8 (5.3%) |
| $10,000 to $14,999 | 34 (7.4%) | 0 (0.0%) |
| $15,000 to $19,999 | 0 (0.0%) | 0 (0.0%) |
| $20,000 to $24,999 | 4 (0.9%) | 0 (0.0%) |
| $25,000 to $34,999 | 45 (9.9%) | 53 (35.3%) |
| $35,000 to $49,999 | 5 (1.1%) | 8 (5.3%) |
| $50,000 to $74,999 | 43 (9.4%) | 79 (52.7%) |
| $75,000 to $99,999 | 31 (6.8%) | 2 (1.3%) |
| $100,000 to $149,999 | 9 (2.0%) | 0 (0.0%) |
| $150,000 or more | 274 (60.0%) | 0 (0.0%) |
| Total | 457 (100.0%) | 150 (100.0%) |
Monthly Housing Cost Tiers in Nokesville
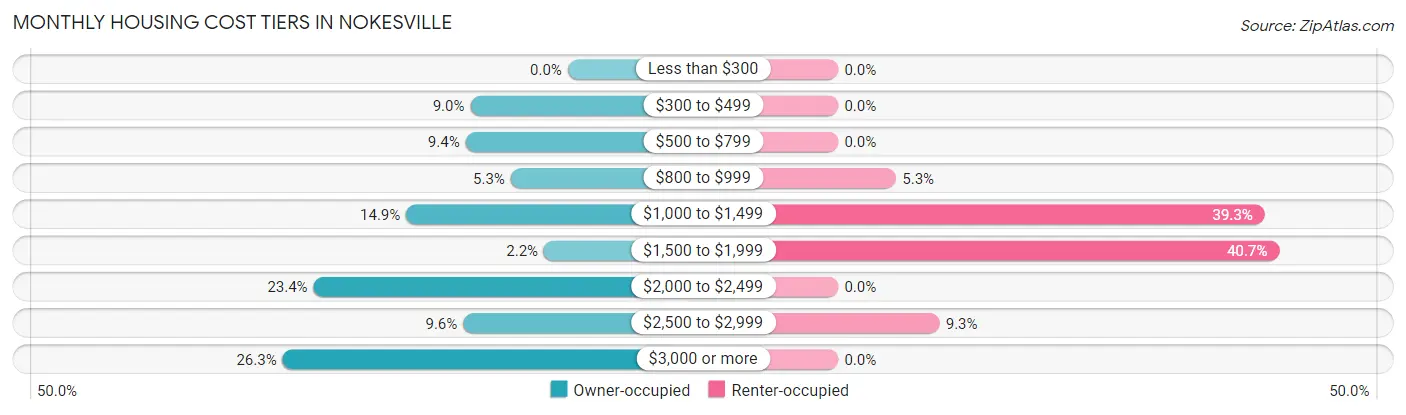
| Monthly Cost | Owner-occupied | Renter-occupied |
| Less than $300 | 0 (0.0%) | 0 (0.0%) |
| $300 to $499 | 41 (9.0%) | 0 (0.0%) |
| $500 to $799 | 43 (9.4%) | 0 (0.0%) |
| $800 to $999 | 24 (5.2%) | 8 (5.3%) |
| $1,000 to $1,499 | 68 (14.9%) | 59 (39.3%) |
| $1,500 to $1,999 | 10 (2.2%) | 61 (40.7%) |
| $2,000 to $2,499 | 107 (23.4%) | 0 (0.0%) |
| $2,500 to $2,999 | 44 (9.6%) | 14 (9.3%) |
| $3,000 or more | 120 (26.3%) | 0 (0.0%) |
| Total | 457 (100.0%) | 150 (100.0%) |
Physical Housing Characteristics in Nokesville
Housing Structures in Nokesville
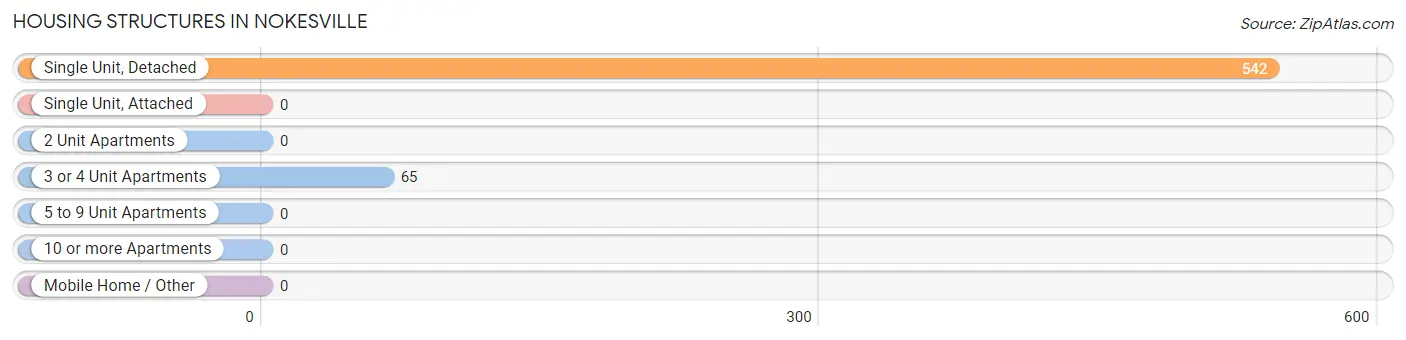
| Structure Type | # Housing Units | % Housing Units |
| Single Unit, Detached | 542 | 89.3% |
| Single Unit, Attached | 0 | 0.0% |
| 2 Unit Apartments | 0 | 0.0% |
| 3 or 4 Unit Apartments | 65 | 10.7% |
| 5 to 9 Unit Apartments | 0 | 0.0% |
| 10 or more Apartments | 0 | 0.0% |
| Mobile Home / Other | 0 | 0.0% |
| Total | 607 | 100.0% |
Housing Structures by Occupancy in Nokesville
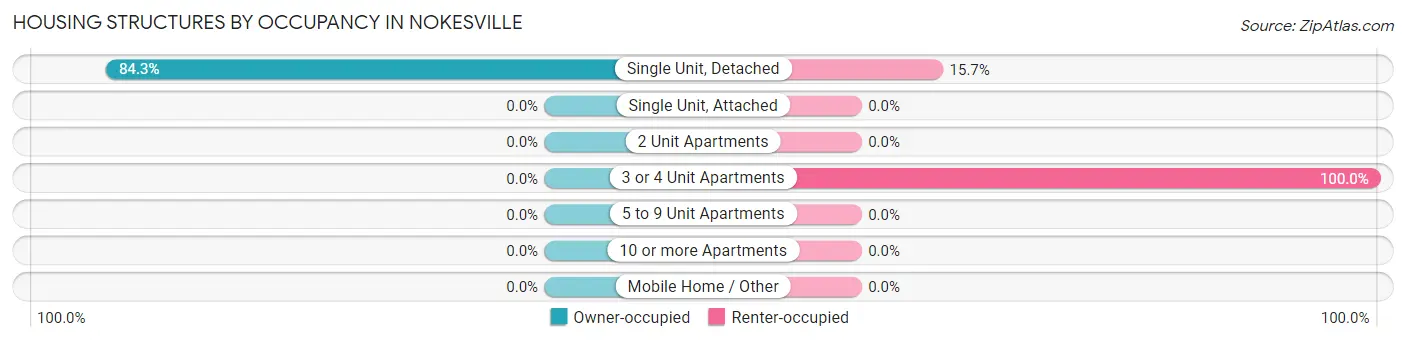
| Structure Type | Owner-occupied | Renter-occupied |
| Single Unit, Detached | 457 (84.3%) | 85 (15.7%) |
| Single Unit, Attached | 0 (0.0%) | 0 (0.0%) |
| 2 Unit Apartments | 0 (0.0%) | 0 (0.0%) |
| 3 or 4 Unit Apartments | 0 (0.0%) | 65 (100.0%) |
| 5 to 9 Unit Apartments | 0 (0.0%) | 0 (0.0%) |
| 10 or more Apartments | 0 (0.0%) | 0 (0.0%) |
| Mobile Home / Other | 0 (0.0%) | 0 (0.0%) |
| Total | 457 (75.3%) | 150 (24.7%) |
Housing Structures by Number of Rooms in Nokesville
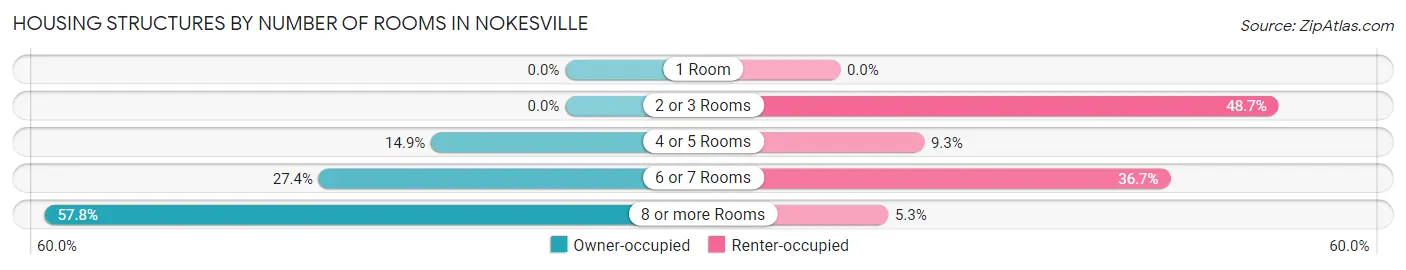
| Number of Rooms | Owner-occupied | Renter-occupied |
| 1 Room | 0 (0.0%) | 0 (0.0%) |
| 2 or 3 Rooms | 0 (0.0%) | 73 (48.7%) |
| 4 or 5 Rooms | 68 (14.9%) | 14 (9.3%) |
| 6 or 7 Rooms | 125 (27.4%) | 55 (36.7%) |
| 8 or more Rooms | 264 (57.8%) | 8 (5.3%) |
| Total | 457 (100.0%) | 150 (100.0%) |
Housing Structure by Heating Type in Nokesville
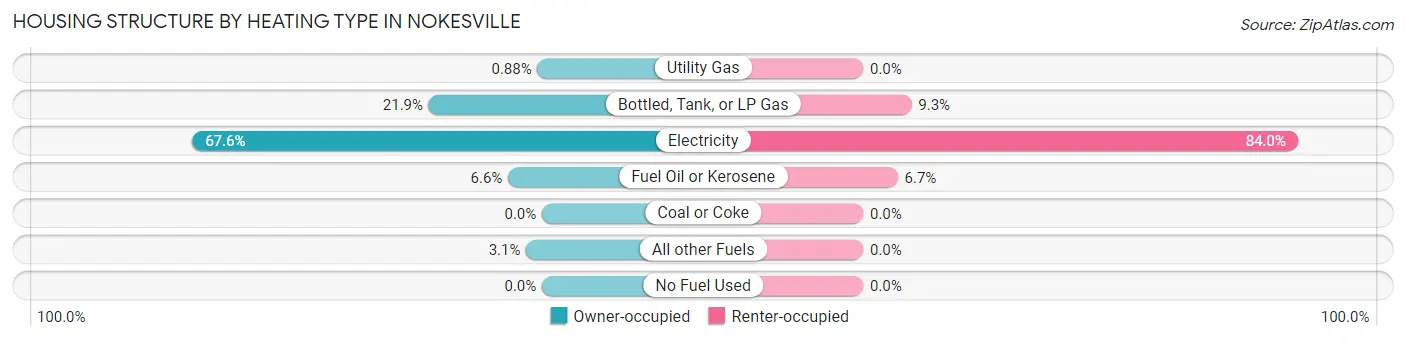
| Heating Type | Owner-occupied | Renter-occupied |
| Utility Gas | 4 (0.9%) | 0 (0.0%) |
| Bottled, Tank, or LP Gas | 100 (21.9%) | 14 (9.3%) |
| Electricity | 309 (67.6%) | 126 (84.0%) |
| Fuel Oil or Kerosene | 30 (6.6%) | 10 (6.7%) |
| Coal or Coke | 0 (0.0%) | 0 (0.0%) |
| All other Fuels | 14 (3.1%) | 0 (0.0%) |
| No Fuel Used | 0 (0.0%) | 0 (0.0%) |
| Total | 457 (100.0%) | 150 (100.0%) |
Household Vehicle Usage in Nokesville
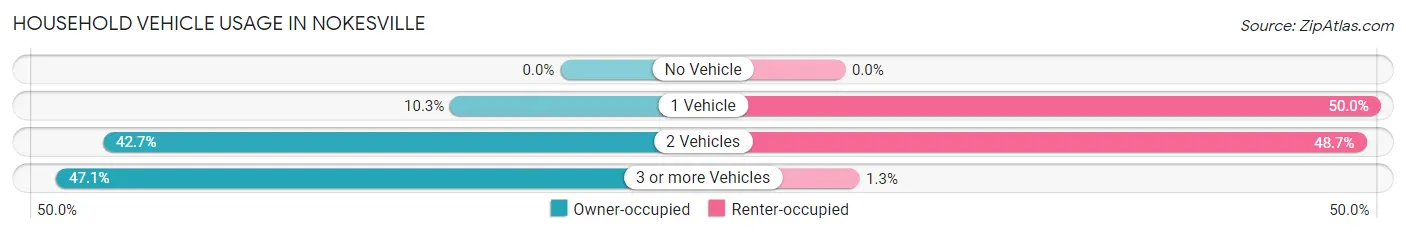
| Vehicles per Household | Owner-occupied | Renter-occupied |
| No Vehicle | 0 (0.0%) | 0 (0.0%) |
| 1 Vehicle | 47 (10.3%) | 75 (50.0%) |
| 2 Vehicles | 195 (42.7%) | 73 (48.7%) |
| 3 or more Vehicles | 215 (47.0%) | 2 (1.3%) |
| Total | 457 (100.0%) | 150 (100.0%) |
Real Estate & Mortgages in Nokesville
Real Estate and Mortgage Overview in Nokesville
| Characteristic | Without Mortgage | With Mortgage |
| Housing Units | 159 | 298 |
| Median Property Value | $569,300 | $575,100 |
| Median Household Income | $56,595 | $236 |
| Monthly Housing Costs | $958 | $120 |
| Real Estate Taxes | $5,732 | $0 |
Property Value by Mortgage Status in Nokesville
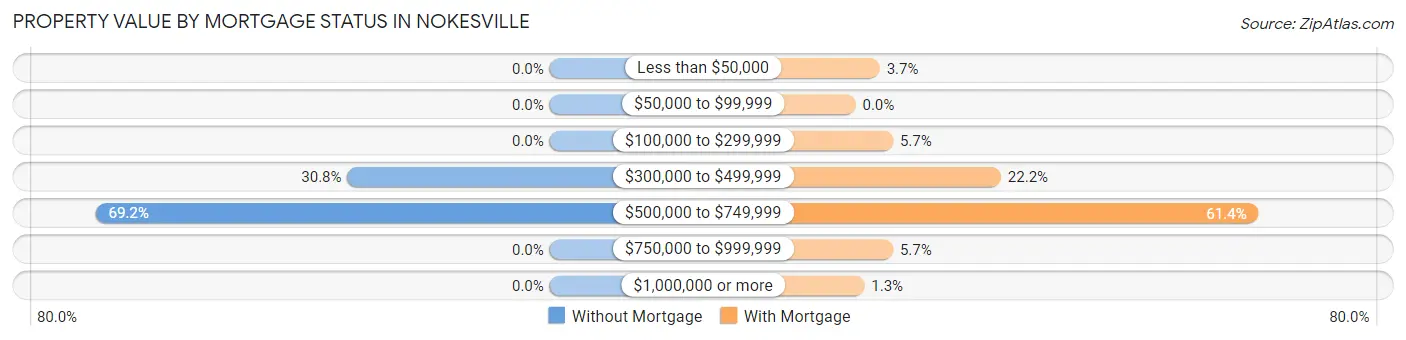
| Property Value | Without Mortgage | With Mortgage |
| Less than $50,000 | 0 (0.0%) | 11 (3.7%) |
| $50,000 to $99,999 | 0 (0.0%) | 0 (0.0%) |
| $100,000 to $299,999 | 0 (0.0%) | 17 (5.7%) |
| $300,000 to $499,999 | 49 (30.8%) | 66 (22.2%) |
| $500,000 to $749,999 | 110 (69.2%) | 183 (61.4%) |
| $750,000 to $999,999 | 0 (0.0%) | 17 (5.7%) |
| $1,000,000 or more | 0 (0.0%) | 4 (1.3%) |
| Total | 159 (100.0%) | 298 (100.0%) |
Household Income by Mortgage Status in Nokesville
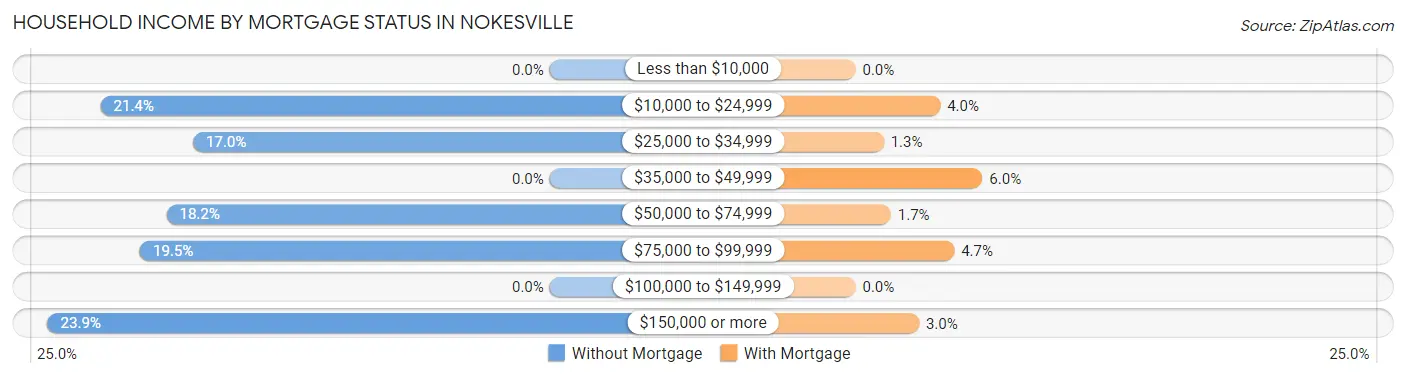
| Household Income | Without Mortgage | With Mortgage |
| Less than $10,000 | 0 (0.0%) | 0 (0.0%) |
| $10,000 to $24,999 | 34 (21.4%) | 12 (4.0%) |
| $25,000 to $34,999 | 27 (17.0%) | 4 (1.3%) |
| $35,000 to $49,999 | 0 (0.0%) | 18 (6.0%) |
| $50,000 to $74,999 | 29 (18.2%) | 5 (1.7%) |
| $75,000 to $99,999 | 31 (19.5%) | 14 (4.7%) |
| $100,000 to $149,999 | 0 (0.0%) | 0 (0.0%) |
| $150,000 or more | 38 (23.9%) | 9 (3.0%) |
| Total | 159 (100.0%) | 298 (100.0%) |
Property Value to Household Income Ratio in Nokesville
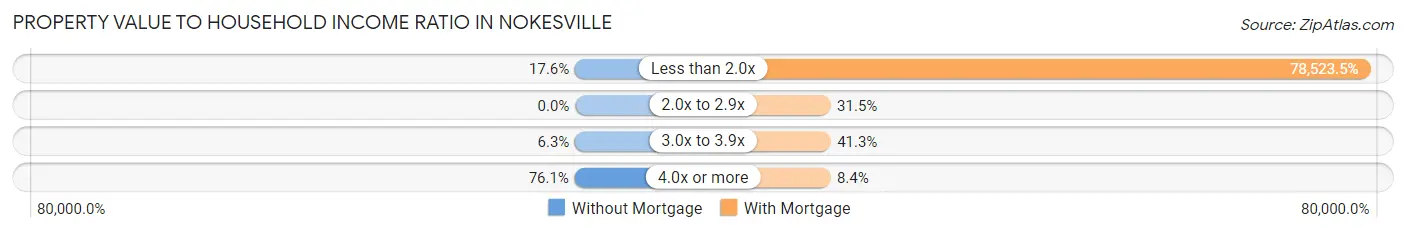
| Value-to-Income Ratio | Without Mortgage | With Mortgage |
| Less than 2.0x | 28 (17.6%) | 234,000 (78,523.5%) |
| 2.0x to 2.9x | 0 (0.0%) | 94 (31.5%) |
| 3.0x to 3.9x | 10 (6.3%) | 123 (41.3%) |
| 4.0x or more | 121 (76.1%) | 25 (8.4%) |
| Total | 159 (100.0%) | 298 (100.0%) |
Real Estate Taxes by Mortgage Status in Nokesville
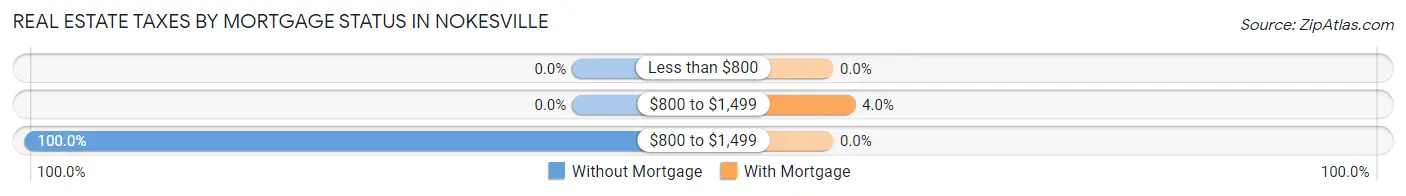
| Property Taxes | Without Mortgage | With Mortgage |
| Less than $800 | 0 (0.0%) | 0 (0.0%) |
| $800 to $1,499 | 0 (0.0%) | 12 (4.0%) |
| $800 to $1,499 | 159 (100.0%) | 0 (0.0%) |
| Total | 159 (100.0%) | 298 (100.0%) |
Health & Disability in Nokesville
Health Insurance Coverage by Age in Nokesville
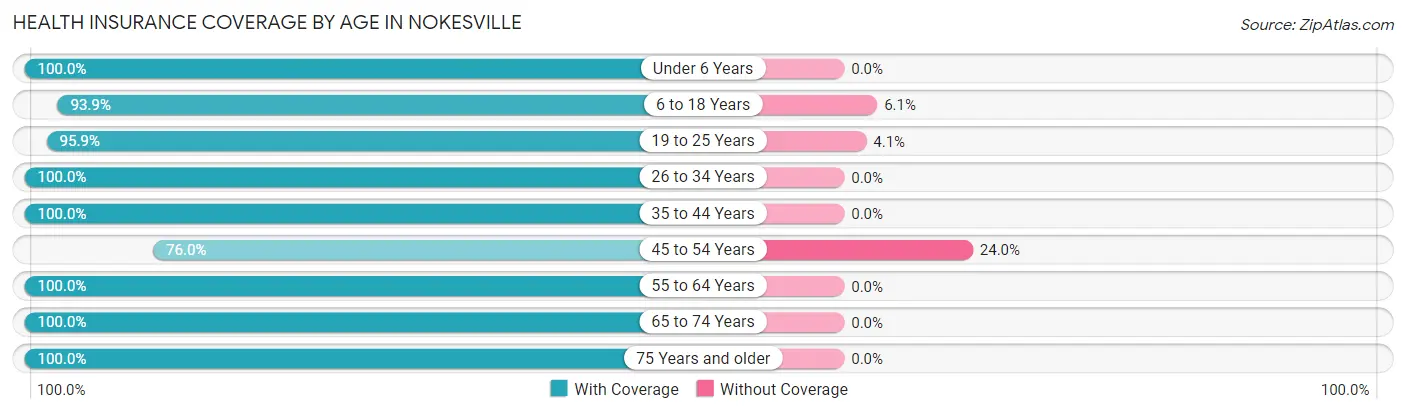
| Age Bracket | With Coverage | Without Coverage |
| Under 6 Years | 4 (100.0%) | 0 (0.0%) |
| 6 to 18 Years | 260 (93.9%) | 17 (6.1%) |
| 19 to 25 Years | 140 (95.9%) | 6 (4.1%) |
| 26 to 34 Years | 114 (100.0%) | 0 (0.0%) |
| 35 to 44 Years | 73 (100.0%) | 0 (0.0%) |
| 45 to 54 Years | 260 (76.0%) | 82 (24.0%) |
| 55 to 64 Years | 282 (100.0%) | 0 (0.0%) |
| 65 to 74 Years | 98 (100.0%) | 0 (0.0%) |
| 75 Years and older | 116 (100.0%) | 0 (0.0%) |
| Total | 1,347 (92.8%) | 105 (7.2%) |
Health Insurance Coverage by Citizenship Status in Nokesville
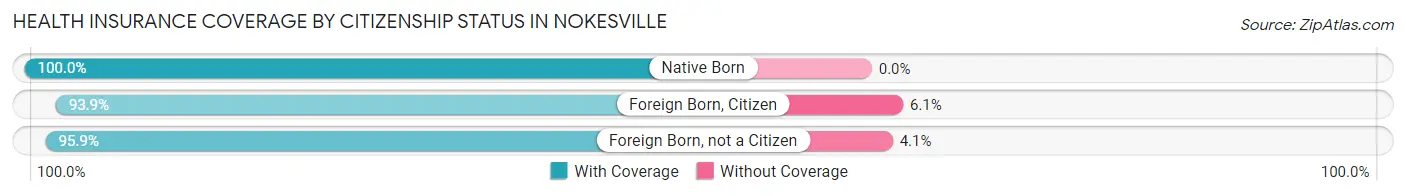
| Citizenship Status | With Coverage | Without Coverage |
| Native Born | 4 (100.0%) | 0 (0.0%) |
| Foreign Born, Citizen | 260 (93.9%) | 17 (6.1%) |
| Foreign Born, not a Citizen | 140 (95.9%) | 6 (4.1%) |
Health Insurance Coverage by Household Income in Nokesville
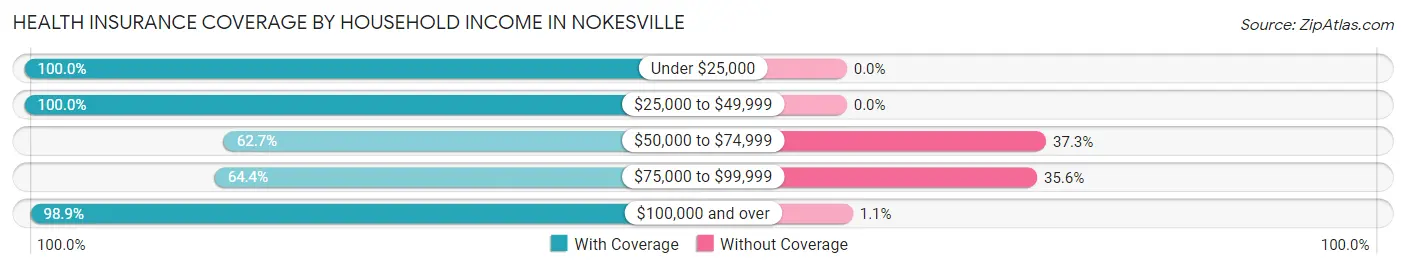
| Household Income | With Coverage | Without Coverage |
| Under $25,000 | 63 (100.0%) | 0 (0.0%) |
| $25,000 to $49,999 | 236 (100.0%) | 0 (0.0%) |
| $50,000 to $74,999 | 99 (62.7%) | 59 (37.3%) |
| $75,000 to $99,999 | 65 (64.4%) | 36 (35.6%) |
| $100,000 and over | 884 (98.9%) | 10 (1.1%) |
Public vs Private Health Insurance Coverage by Age in Nokesville
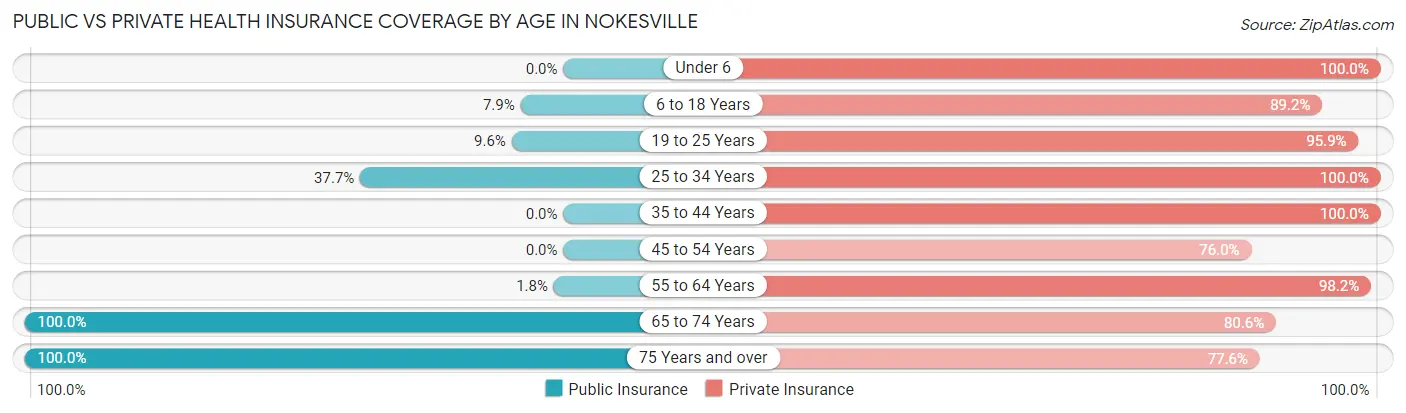
| Age Bracket | Public Insurance | Private Insurance |
| Under 6 | 0 (0.0%) | 4 (100.0%) |
| 6 to 18 Years | 22 (7.9%) | 247 (89.2%) |
| 19 to 25 Years | 14 (9.6%) | 140 (95.9%) |
| 25 to 34 Years | 43 (37.7%) | 114 (100.0%) |
| 35 to 44 Years | 0 (0.0%) | 73 (100.0%) |
| 45 to 54 Years | 0 (0.0%) | 260 (76.0%) |
| 55 to 64 Years | 5 (1.8%) | 277 (98.2%) |
| 65 to 74 Years | 98 (100.0%) | 79 (80.6%) |
| 75 Years and over | 116 (100.0%) | 90 (77.6%) |
| Total | 298 (20.5%) | 1,284 (88.4%) |
Disability Status by Sex by Age in Nokesville
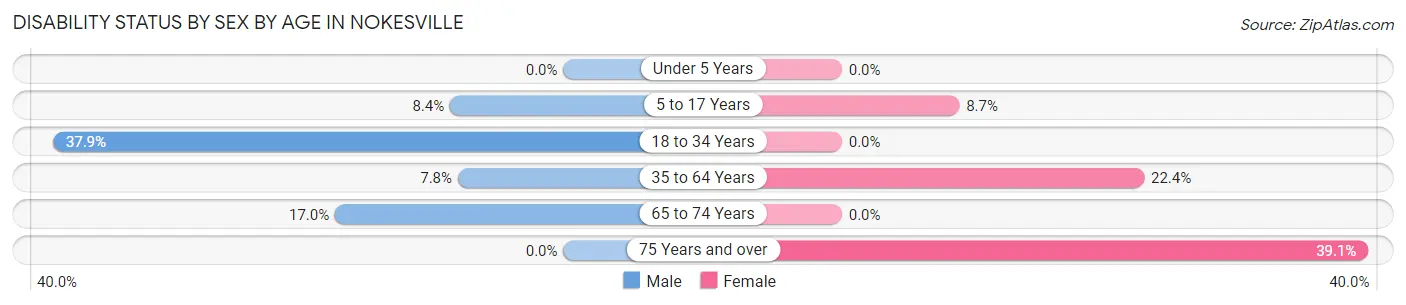
| Age Bracket | Male | Female |
| Under 5 Years | 0 (0.0%) | 0 (0.0%) |
| 5 to 17 Years | 9 (8.4%) | 13 (8.7%) |
| 18 to 34 Years | 47 (37.9%) | 0 (0.0%) |
| 35 to 64 Years | 27 (7.8%) | 79 (22.4%) |
| 65 to 74 Years | 10 (17.0%) | 0 (0.0%) |
| 75 Years and over | 0 (0.0%) | 34 (39.1%) |
Disability Class by Sex by Age in Nokesville
Disability Class: Hearing Difficulty
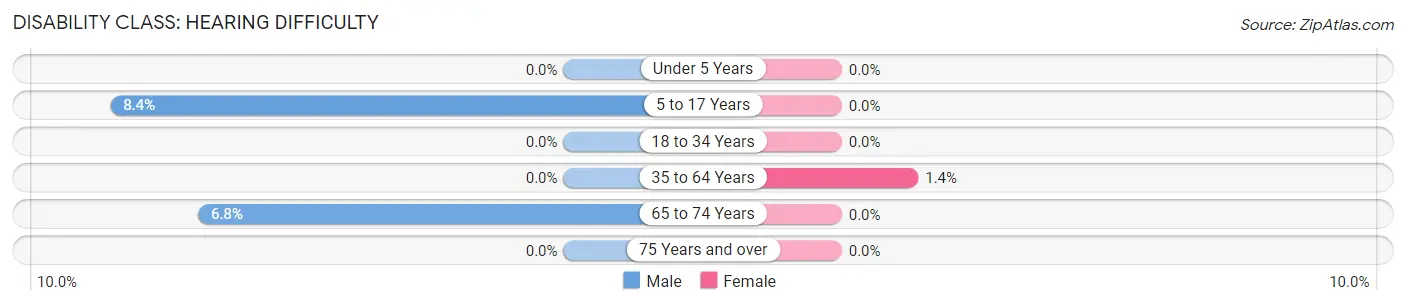
| Age Bracket | Male | Female |
| Under 5 Years | 0 (0.0%) | 0 (0.0%) |
| 5 to 17 Years | 9 (8.4%) | 0 (0.0%) |
| 18 to 34 Years | 0 (0.0%) | 0 (0.0%) |
| 35 to 64 Years | 0 (0.0%) | 5 (1.4%) |
| 65 to 74 Years | 4 (6.8%) | 0 (0.0%) |
| 75 Years and over | 0 (0.0%) | 0 (0.0%) |
Disability Class: Vision Difficulty
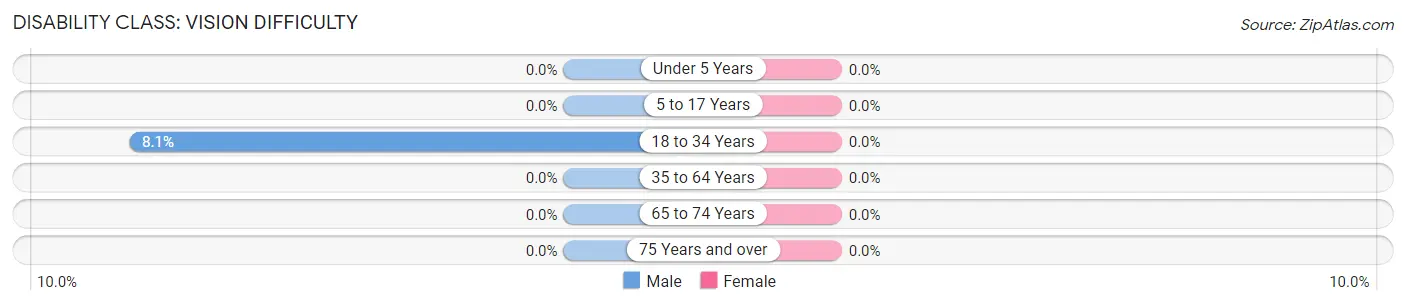
| Age Bracket | Male | Female |
| Under 5 Years | 0 (0.0%) | 0 (0.0%) |
| 5 to 17 Years | 0 (0.0%) | 0 (0.0%) |
| 18 to 34 Years | 10 (8.1%) | 0 (0.0%) |
| 35 to 64 Years | 0 (0.0%) | 0 (0.0%) |
| 65 to 74 Years | 0 (0.0%) | 0 (0.0%) |
| 75 Years and over | 0 (0.0%) | 0 (0.0%) |
Disability Class: Cognitive Difficulty
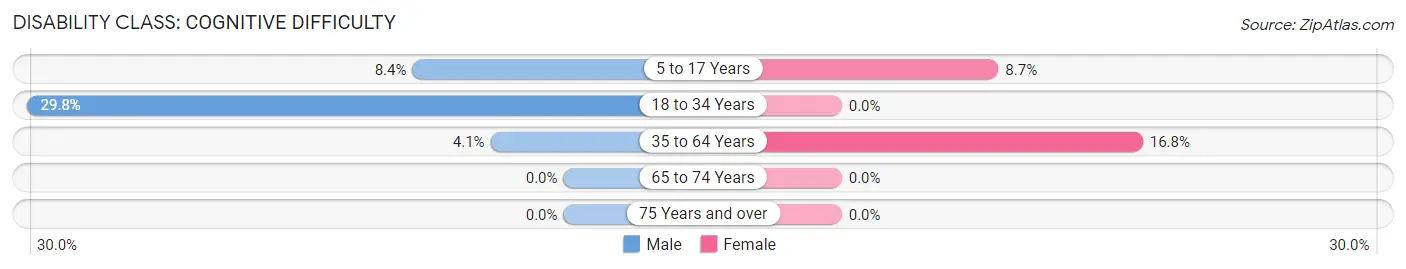
| Age Bracket | Male | Female |
| 5 to 17 Years | 9 (8.4%) | 13 (8.7%) |
| 18 to 34 Years | 37 (29.8%) | 0 (0.0%) |
| 35 to 64 Years | 14 (4.1%) | 59 (16.8%) |
| 65 to 74 Years | 0 (0.0%) | 0 (0.0%) |
| 75 Years and over | 0 (0.0%) | 0 (0.0%) |
Disability Class: Ambulatory Difficulty
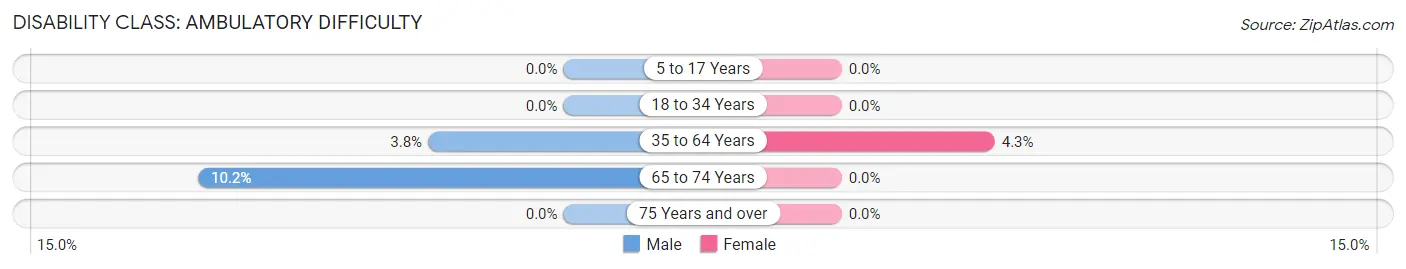
| Age Bracket | Male | Female |
| 5 to 17 Years | 0 (0.0%) | 0 (0.0%) |
| 18 to 34 Years | 0 (0.0%) | 0 (0.0%) |
| 35 to 64 Years | 13 (3.8%) | 15 (4.3%) |
| 65 to 74 Years | 6 (10.2%) | 0 (0.0%) |
| 75 Years and over | 0 (0.0%) | 0 (0.0%) |
Disability Class: Self-Care Difficulty
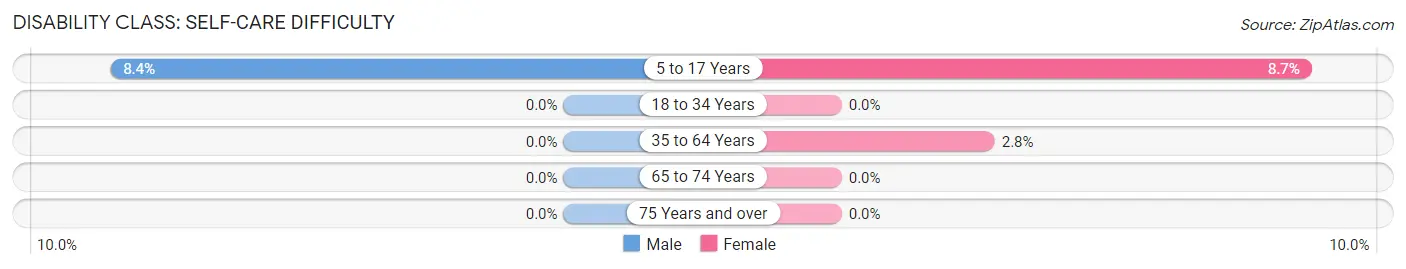
| Age Bracket | Male | Female |
| 5 to 17 Years | 9 (8.4%) | 13 (8.7%) |
| 18 to 34 Years | 0 (0.0%) | 0 (0.0%) |
| 35 to 64 Years | 0 (0.0%) | 10 (2.8%) |
| 65 to 74 Years | 0 (0.0%) | 0 (0.0%) |
| 75 Years and over | 0 (0.0%) | 0 (0.0%) |
Technology Access in Nokesville
Computing Device Access in Nokesville
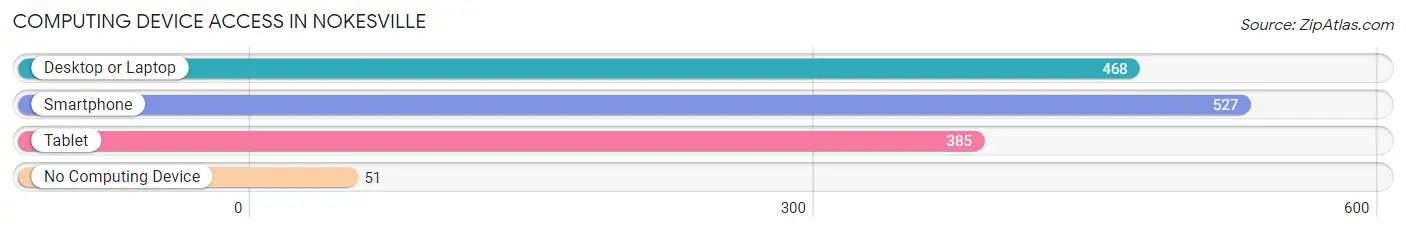
| Device Type | # Households | % Households |
| Desktop or Laptop | 468 | 77.1% |
| Smartphone | 527 | 86.8% |
| Tablet | 385 | 63.4% |
| No Computing Device | 51 | 8.4% |
| Total | 607 | 100.0% |
Internet Access in Nokesville
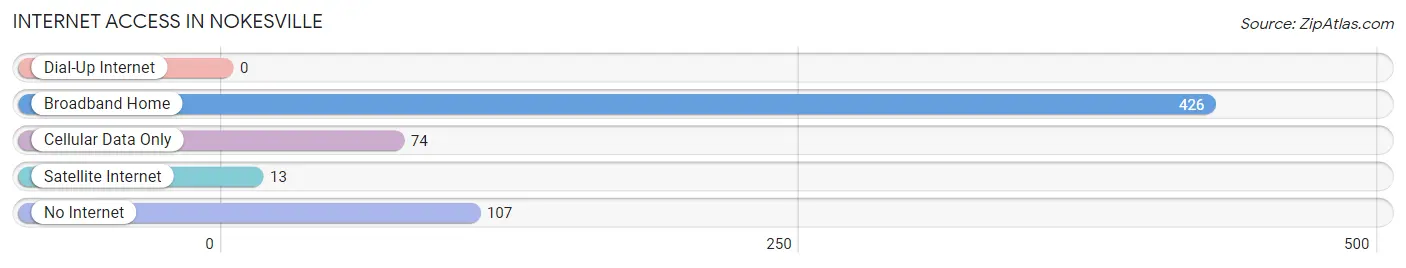
| Internet Type | # Households | % Households |
| Dial-Up Internet | 0 | 0.0% |
| Broadband Home | 426 | 70.2% |
| Cellular Data Only | 74 | 12.2% |
| Satellite Internet | 13 | 2.1% |
| No Internet | 107 | 17.6% |
| Total | 607 | 100.0% |
Nokesville Summary
Nokesville is a small town located in Prince William County, Virginia, United States. It is situated about 30 miles southwest of Washington, D.C. and is part of the Washington metropolitan area. The population of Nokesville was 1,741 at the 2010 census.
History
Nokesville was first settled in the late 1700s by the Nokes family, who were among the first settlers in the area. The town was originally known as Nokesville Station, and was a stop on the Orange and Alexandria Railroad. The town was officially incorporated in 1892.
In the early 1900s, Nokesville was a thriving agricultural community, with many farms and orchards. The town was also home to several businesses, including a general store, a blacksmith shop, and a post office.
In the 1950s, the town began to experience a decline in population as many of its residents moved away to larger cities. However, in recent years, the town has seen a resurgence in population as people have moved back to the area.
Geography
Nokesville is located at 38°41'25" North, 77°37'45" West (38.690278, -77.629167). The town is situated in the northern part of Prince William County, about 30 miles southwest of Washington, D.C.
The town is located in the Piedmont region of Virginia, and is surrounded by rolling hills and forests. The town is situated on the banks of Broad Run, a tributary of the Occoquan River.
Economy
Nokesville is primarily a residential community, with many of its residents commuting to nearby cities for work. The town is home to several small businesses, including a general store, a gas station, and a few restaurants.
The town is also home to several farms, which produce a variety of crops, including corn, soybeans, and hay. The town is also home to several wineries, which produce a variety of wines.
Demographics
As of the 2010 census, the population of Nokesville was 1,741. The racial makeup of the town was 87.3% White, 8.2% African American, 0.3% Native American, 0.7% Asian, 0.1% Pacific Islander, 1.2% from other races, and 2.3% from two or more races. Hispanic or Latino of any race were 3.7% of the population.
The median household income in Nokesville was $87,813, and the median family income was $95,938. The per capita income for the town was $35,945. About 4.3% of families and 5.3% of the population were below the poverty line, including 6.2% of those under age 18 and 4.2% of those age 65 or over.
Common Questions
What is Per Capita Income in Nokesville?
Per Capita income in Nokesville is $63,944.
What is the Median Family Income in Nokesville?
Median Family Income in Nokesville is $210,833.
What is Income or Wage Gap in Nokesville?
Income or Wage Gap in Nokesville is 69.7%.
Women in Nokesville earn 30.3 cents for every dollar earned by a man.
What is Inequality or Gini Index in Nokesville?
Inequality or Gini Index in Nokesville is 0.45.
What is the Total Population of Nokesville?
Total Population of Nokesville is 1,452.
What is the Total Male Population of Nokesville?
Total Male Population of Nokesville is 664.
What is the Total Female Population of Nokesville?
Total Female Population of Nokesville is 788.
What is the Ratio of Males per 100 Females in Nokesville?
There are 84.26 Males per 100 Females in Nokesville.
What is the Ratio of Females per 100 Males in Nokesville?
There are 118.67 Females per 100 Males in Nokesville.
What is the Median Population Age in Nokesville?
Median Population Age in Nokesville is 48.1 Years.
What is the Average Family Size in Nokesville
Average Family Size in Nokesville is 3.0 People.
What is the Average Household Size in Nokesville
Average Household Size in Nokesville is 2.4 People.
How Large is the Labor Force in Nokesville?
There are 894 People in the Labor Forcein in Nokesville.
What is the Percentage of People in the Labor Force in Nokesville?
69.0% of People are in the Labor Force in Nokesville.
What is the Unemployment Rate in Nokesville?
Unemployment Rate in Nokesville is 4.1%.