Loudoun Valley Estates, VA Map & Demographics
Loudoun Valley Estates Map
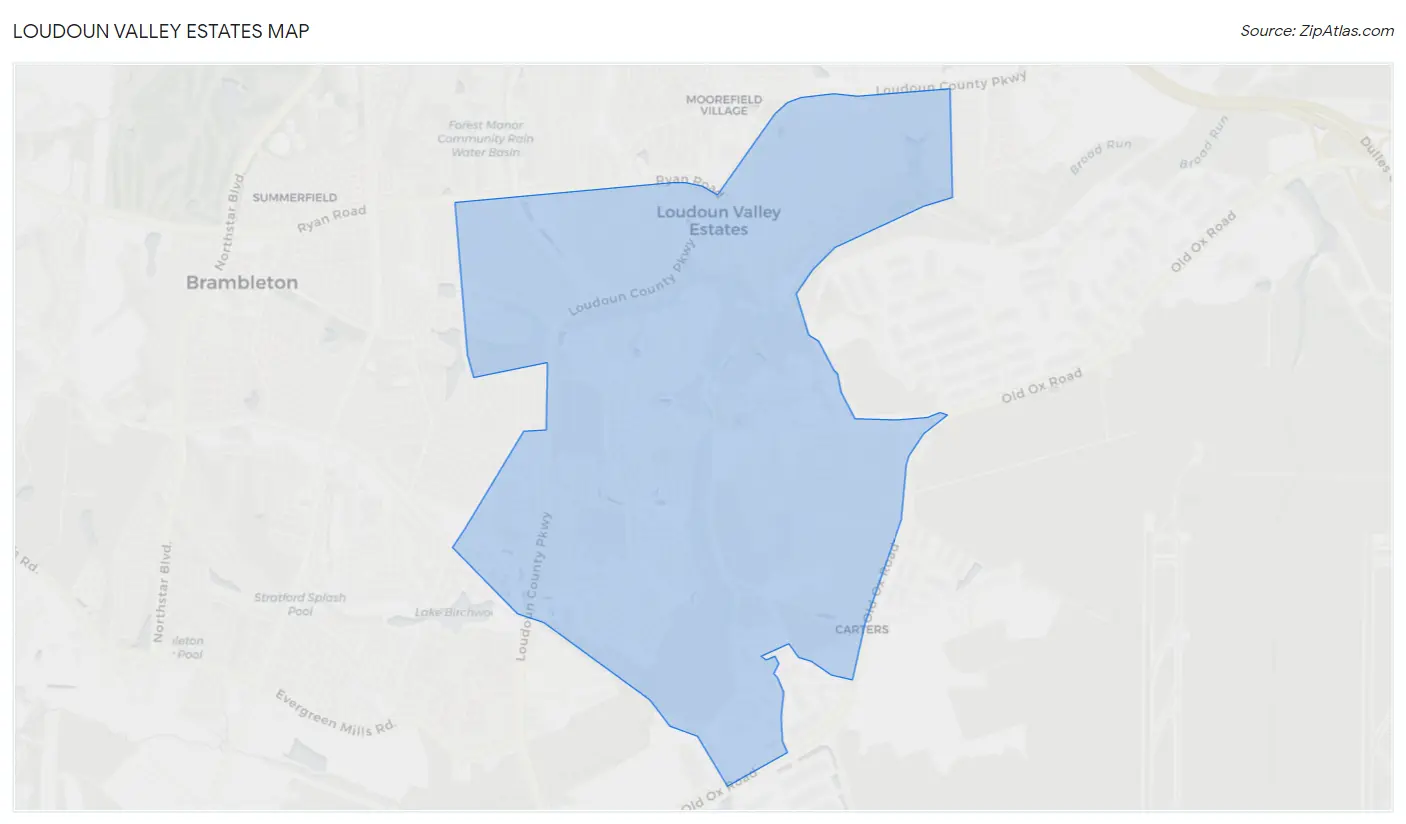
Loudoun Valley Estates Overview
$76,259
PER CAPITA INCOME
$233,750
AVG FAMILY INCOME
$219,388
AVG HOUSEHOLD INCOME
39.0%
WAGE / INCOME GAP [ % ]
61.0¢/ $1
WAGE / INCOME GAP [ $ ]
0.28
INEQUALITY / GINI INDEX
10,514
TOTAL POPULATION
5,209
MALE POPULATION
5,305
FEMALE POPULATION
98.19
MALES / 100 FEMALES
101.84
FEMALES / 100 MALES
37.9
MEDIAN AGE
3.2
AVG FAMILY SIZE
3.0
AVG HOUSEHOLD SIZE
6,248
LABOR FORCE [ PEOPLE ]
79.4%
PERCENT IN LABOR FORCE
1.5%
UNEMPLOYMENT RATE
Income in Loudoun Valley Estates
Income Overview in Loudoun Valley Estates
Per Capita Income in Loudoun Valley Estates is $76,259, while median incomes of families and households are $233,750 and $219,388 respectively.
| Characteristic | Number | Measure |
| Per Capita Income | 10,514 | $76,259 |
| Median Family Income | 3,022 | $233,750 |
| Mean Family Income | 3,022 | $243,604 |
| Median Household Income | 3,504 | $219,388 |
| Mean Household Income | 3,504 | $232,089 |
| Income Deficit | 3,022 | $0 |
| Wage / Income Gap (%) | 10,514 | 39.00% |
| Wage / Income Gap ($) | 10,514 | 61.00¢ per $1 |
| Gini / Inequality Index | 10,514 | 0.28 |
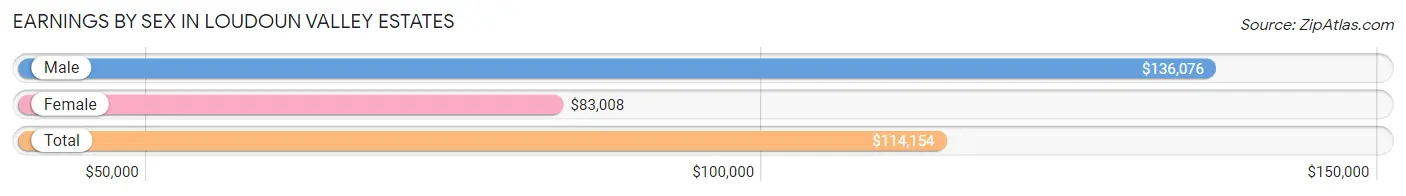
Earnings by Sex in Loudoun Valley Estates
Average Earnings in Loudoun Valley Estates are $114,154, $136,076 for men and $83,008 for women, a difference of 39.0%.
| Sex | Number | Average Earnings |
| Male | 3,418 (52.9%) | $136,076 |
| Female | 3,040 (47.1%) | $83,008 |
| Total | 6,458 (100.0%) | $114,154 |
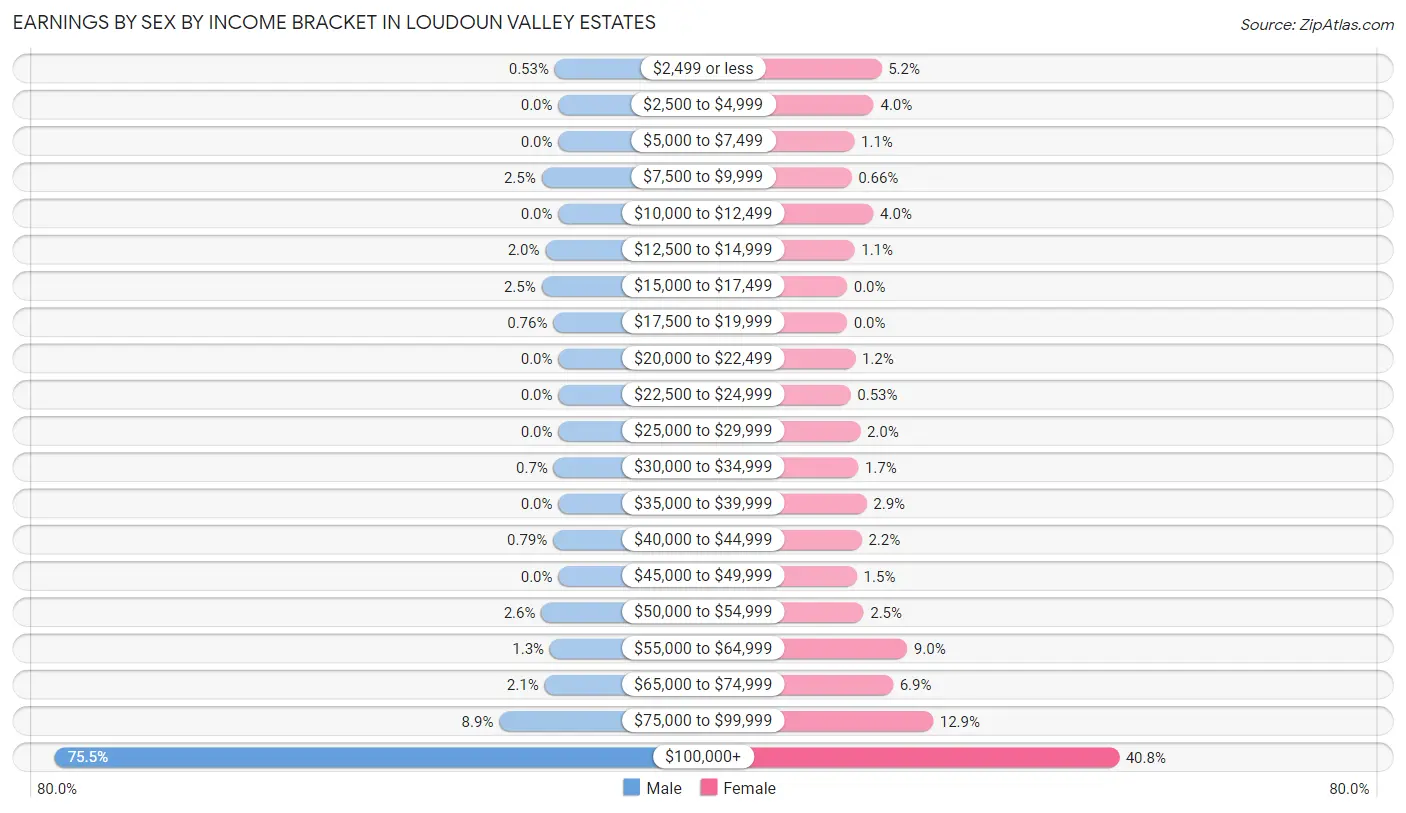
Earnings by Sex by Income Bracket in Loudoun Valley Estates
The most common earnings brackets in Loudoun Valley Estates are $100,000+ for men (2,580 | 75.5%) and $100,000+ for women (1,239 | 40.8%).
| Income | Male | Female |
| $2,499 or less | 18 (0.5%) | 157 (5.2%) |
| $2,500 to $4,999 | 0 (0.0%) | 122 (4.0%) |
| $5,000 to $7,499 | 0 (0.0%) | 33 (1.1%) |
| $7,500 to $9,999 | 86 (2.5%) | 20 (0.7%) |
| $10,000 to $12,499 | 0 (0.0%) | 120 (4.0%) |
| $12,500 to $14,999 | 67 (2.0%) | 34 (1.1%) |
| $15,000 to $17,499 | 86 (2.5%) | 0 (0.0%) |
| $17,500 to $19,999 | 26 (0.8%) | 0 (0.0%) |
| $20,000 to $22,499 | 0 (0.0%) | 37 (1.2%) |
| $22,500 to $24,999 | 0 (0.0%) | 16 (0.5%) |
| $25,000 to $29,999 | 0 (0.0%) | 60 (2.0%) |
| $30,000 to $34,999 | 24 (0.7%) | 51 (1.7%) |
| $35,000 to $39,999 | 0 (0.0%) | 89 (2.9%) |
| $40,000 to $44,999 | 27 (0.8%) | 67 (2.2%) |
| $45,000 to $49,999 | 0 (0.0%) | 45 (1.5%) |
| $50,000 to $54,999 | 87 (2.5%) | 75 (2.5%) |
| $55,000 to $64,999 | 43 (1.3%) | 274 (9.0%) |
| $65,000 to $74,999 | 71 (2.1%) | 209 (6.9%) |
| $75,000 to $99,999 | 303 (8.9%) | 392 (12.9%) |
| $100,000+ | 2,580 (75.5%) | 1,239 (40.8%) |
| Total | 3,418 (100.0%) | 3,040 (100.0%) |
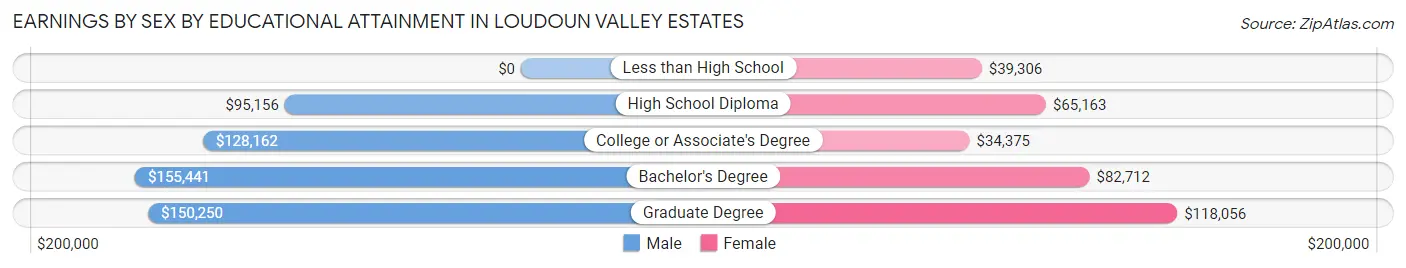
Earnings by Sex by Educational Attainment in Loudoun Valley Estates
Average earnings in Loudoun Valley Estates are $138,163 for men and $90,676 for women, a difference of 34.4%. Men with an educational attainment of bachelor's degree enjoy the highest average annual earnings of $155,441, while those with high school diploma education earn the least with $95,156. Women with an educational attainment of graduate degree earn the most with the average annual earnings of $118,056, while those with college or associate's degree education have the smallest earnings of $34,375.
| Educational Attainment | Male Income | Female Income |
| Less than High School | - | - |
| High School Diploma | $95,156 | $65,163 |
| College or Associate's Degree | $128,162 | $34,375 |
| Bachelor's Degree | $155,441 | $82,712 |
| Graduate Degree | $150,250 | $118,056 |
| Total | $138,163 | $90,676 |
Family Income in Loudoun Valley Estates
Family Income Brackets in Loudoun Valley Estates
According to the Loudoun Valley Estates family income data, there are 1,892 families falling into the $200,000+ income range, which is the most common income bracket and makes up 62.6% of all families.
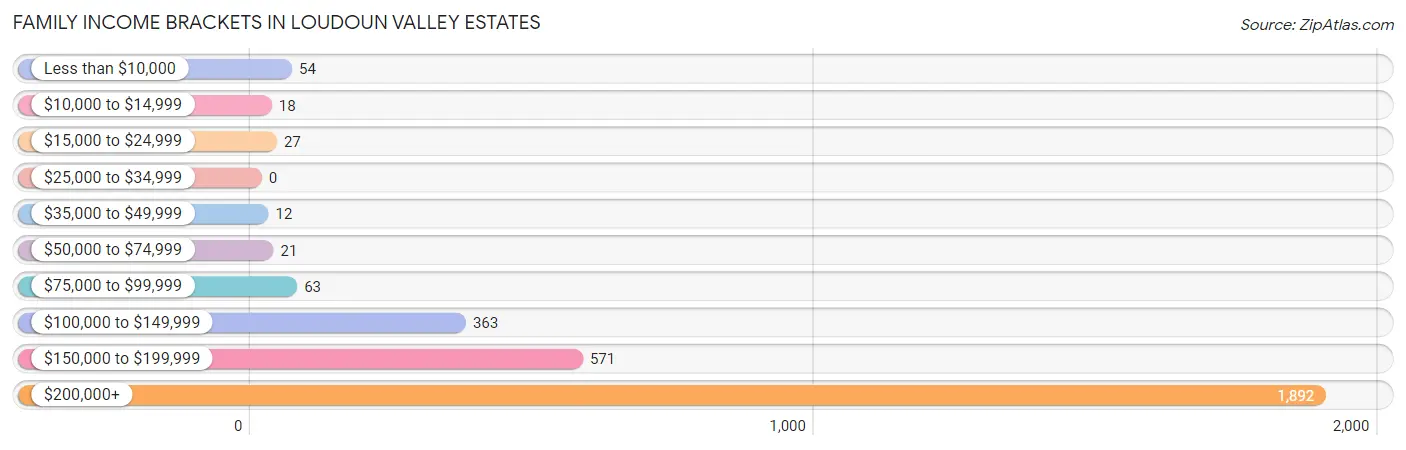
| Income Bracket | # Families | % Families |
| Less than $10,000 | 54 | 1.8% |
| $10,000 to $14,999 | 18 | 0.6% |
| $15,000 to $24,999 | 27 | 0.9% |
| $25,000 to $34,999 | 0 | 0.0% |
| $35,000 to $49,999 | 12 | 0.4% |
| $50,000 to $74,999 | 21 | 0.7% |
| $75,000 to $99,999 | 63 | 2.1% |
| $100,000 to $149,999 | 363 | 12.0% |
| $150,000 to $199,999 | 571 | 18.9% |
| $200,000+ | 1,892 | 62.6% |
Family Income by Famaliy Size in Loudoun Valley Estates
4-person families (1,222 | 40.4%) account for the highest median family income in Loudoun Valley Estates with $250,001 per family, while 2-person families (747 | 24.7%) have the highest median income of $106,013 per family member.
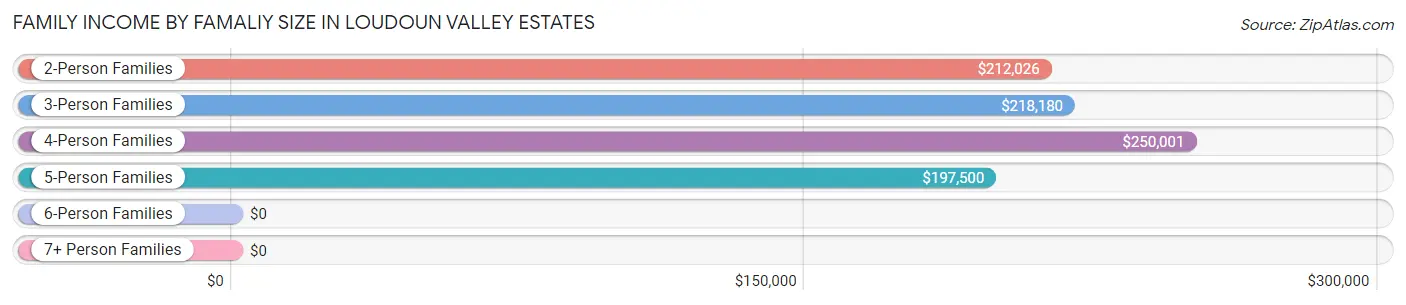
| Income Bracket | # Families | Median Income |
| 2-Person Families | 747 (24.7%) | $212,026 |
| 3-Person Families | 827 (27.4%) | $218,180 |
| 4-Person Families | 1,222 (40.4%) | $250,001 |
| 5-Person Families | 192 (6.4%) | $197,500 |
| 6-Person Families | 22 (0.7%) | $0 |
| 7+ Person Families | 12 (0.4%) | $0 |
| Total | 3,022 (100.0%) | $233,750 |
Family Income by Number of Earners in Loudoun Valley Estates
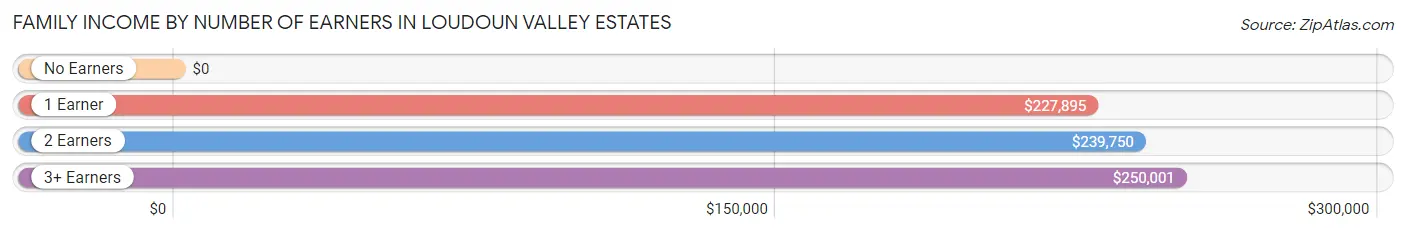
| Number of Earners | # Families | Median Income |
| No Earners | 127 (4.2%) | $0 |
| 1 Earner | 482 (16.0%) | $227,895 |
| 2 Earners | 2,051 (67.9%) | $239,750 |
| 3+ Earners | 362 (12.0%) | $250,001 |
| Total | 3,022 (100.0%) | $233,750 |
Household Income in Loudoun Valley Estates
Household Income Brackets in Loudoun Valley Estates
With 2,046 households falling in the category, the $200,000+ income range is the most frequent in Loudoun Valley Estates, accounting for 58.4% of all households.
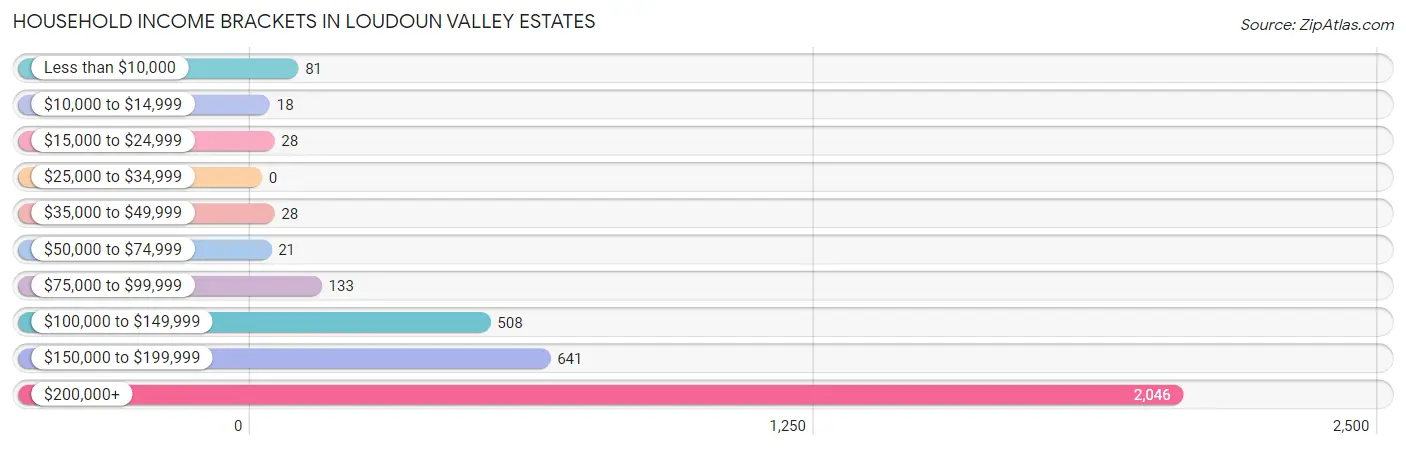
| Income Bracket | # Households | % Households |
| Less than $10,000 | 81 | 2.3% |
| $10,000 to $14,999 | 18 | 0.5% |
| $15,000 to $24,999 | 28 | 0.8% |
| $25,000 to $34,999 | 0 | 0.0% |
| $35,000 to $49,999 | 28 | 0.8% |
| $50,000 to $74,999 | 21 | 0.6% |
| $75,000 to $99,999 | 133 | 3.8% |
| $100,000 to $149,999 | 508 | 14.5% |
| $150,000 to $199,999 | 641 | 18.3% |
| $200,000+ | 2,046 | 58.4% |
Household Income by Householder Age in Loudoun Valley Estates
The median household income in Loudoun Valley Estates is $219,388, with the highest median household income of $229,971 found in the 45 to 64 years age bracket for the primary householder. A total of 1,559 households (44.5%) fall into this category. Meanwhile, the 15 to 24 years age bracket for the primary householder has the lowest median household income of $0, with 53 households (1.5%) in this group.
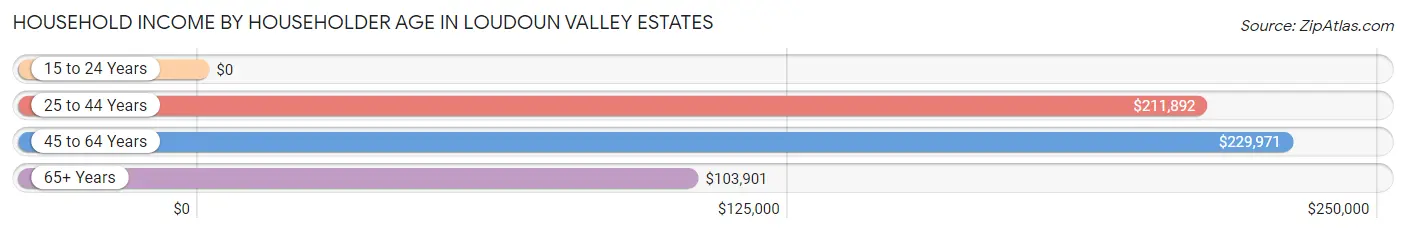
| Income Bracket | # Households | Median Income |
| 15 to 24 Years | 53 (1.5%) | $0 |
| 25 to 44 Years | 1,662 (47.4%) | $211,892 |
| 45 to 64 Years | 1,559 (44.5%) | $229,971 |
| 65+ Years | 230 (6.6%) | $103,901 |
| Total | 3,504 (100.0%) | $219,388 |
Poverty in Loudoun Valley Estates
Income Below Poverty by Sex and Age in Loudoun Valley Estates
With 2.1% poverty level for males and 4.4% for females among the residents of Loudoun Valley Estates, 5 year old males and 18 to 24 year old females are the most vulnerable to poverty, with 33 males (53.2%) and 108 females (28.0%) in their respective age groups living below the poverty level.
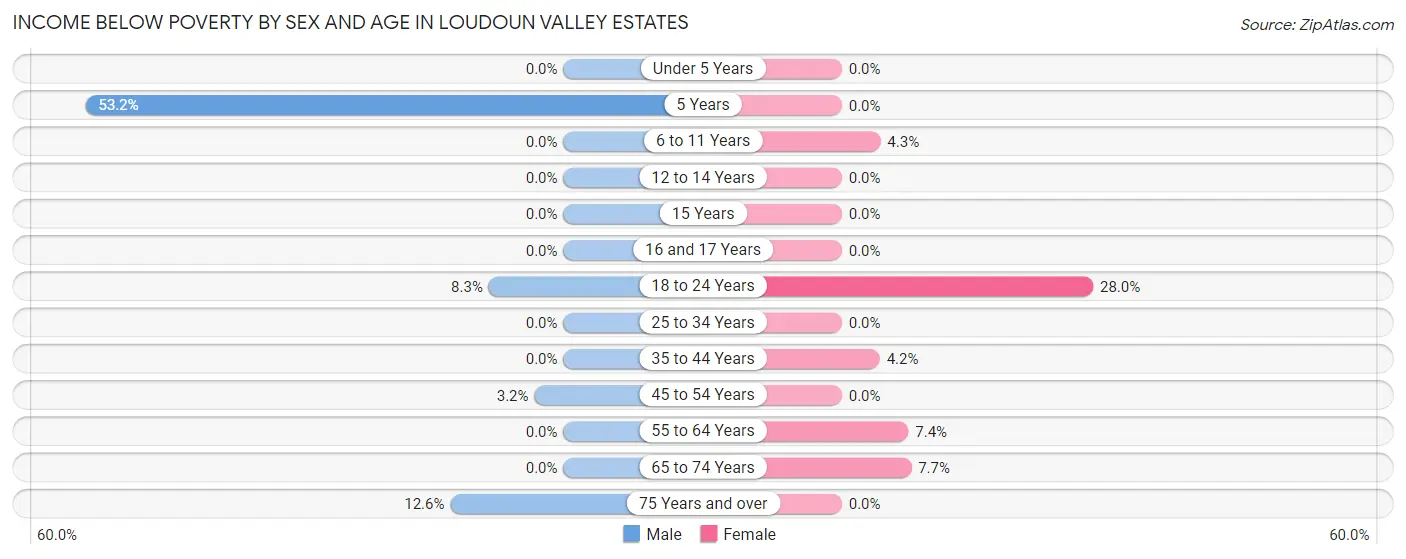
| Age Bracket | Male | Female |
| Under 5 Years | 0 (0.0%) | 0 (0.0%) |
| 5 Years | 33 (53.2%) | 0 (0.0%) |
| 6 to 11 Years | 0 (0.0%) | 30 (4.3%) |
| 12 to 14 Years | 0 (0.0%) | 0 (0.0%) |
| 15 Years | 0 (0.0%) | 0 (0.0%) |
| 16 and 17 Years | 0 (0.0%) | 0 (0.0%) |
| 18 to 24 Years | 25 (8.3%) | 108 (28.0%) |
| 25 to 34 Years | 0 (0.0%) | 0 (0.0%) |
| 35 to 44 Years | 0 (0.0%) | 48 (4.2%) |
| 45 to 54 Years | 33 (3.2%) | 0 (0.0%) |
| 55 to 64 Years | 0 (0.0%) | 34 (7.4%) |
| 65 to 74 Years | 0 (0.0%) | 16 (7.7%) |
| 75 Years and over | 17 (12.6%) | 0 (0.0%) |
| Total | 108 (2.1%) | 236 (4.4%) |
Income Above Poverty by Sex and Age in Loudoun Valley Estates
According to the poverty statistics in Loudoun Valley Estates, males aged under 5 years and females aged under 5 years are the age groups that are most secure financially, with 100.0% of males and 100.0% of females in these age groups living above the poverty line.
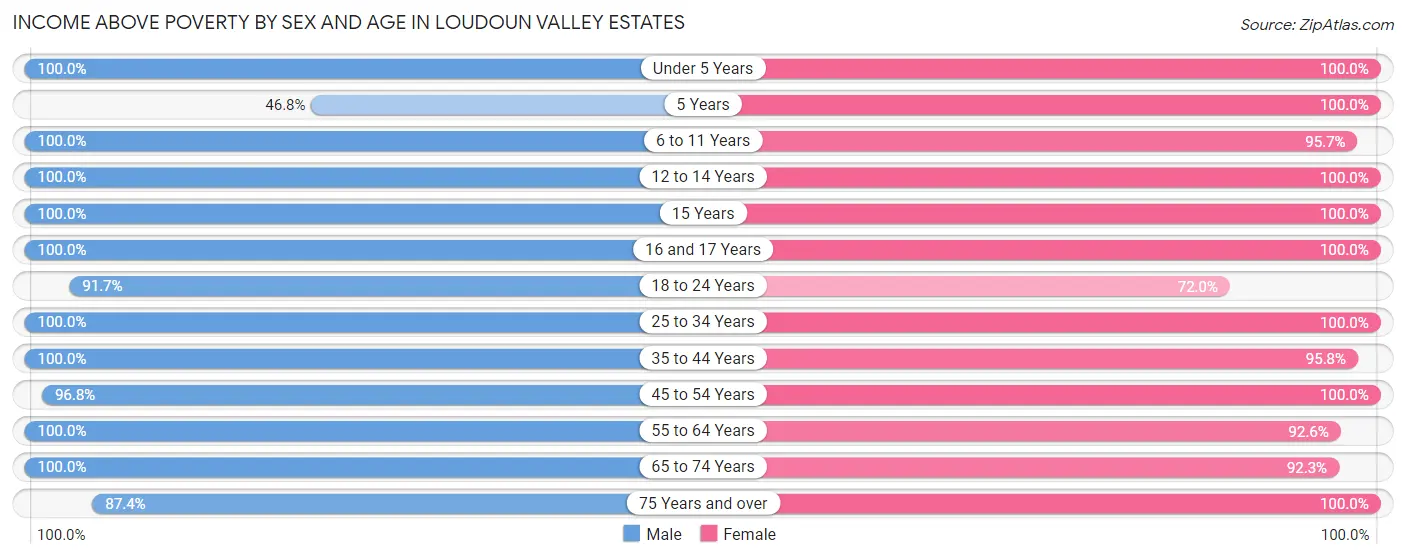
| Age Bracket | Male | Female |
| Under 5 Years | 224 (100.0%) | 365 (100.0%) |
| 5 Years | 29 (46.8%) | 40 (100.0%) |
| 6 to 11 Years | 517 (100.0%) | 668 (95.7%) |
| 12 to 14 Years | 290 (100.0%) | 269 (100.0%) |
| 15 Years | 63 (100.0%) | 117 (100.0%) |
| 16 and 17 Years | 193 (100.0%) | 126 (100.0%) |
| 18 to 24 Years | 276 (91.7%) | 278 (72.0%) |
| 25 to 34 Years | 354 (100.0%) | 516 (100.0%) |
| 35 to 44 Years | 1,364 (100.0%) | 1,090 (95.8%) |
| 45 to 54 Years | 989 (96.8%) | 963 (100.0%) |
| 55 to 64 Years | 459 (100.0%) | 425 (92.6%) |
| 65 to 74 Years | 225 (100.0%) | 191 (92.3%) |
| 75 Years and over | 118 (87.4%) | 21 (100.0%) |
| Total | 5,101 (97.9%) | 5,069 (95.6%) |
Income Below Poverty Among Married-Couple Families in Loudoun Valley Estates
The poverty statistics for married-couple families in Loudoun Valley Estates show that 1.1% or 31 of the total 2,756 families live below the poverty line. Families with 1 or 2 children have the highest poverty rate of 1.8%, comprising of 31 families. On the other hand, families with no children have the lowest poverty rate of 0.0%, which includes 0 families.
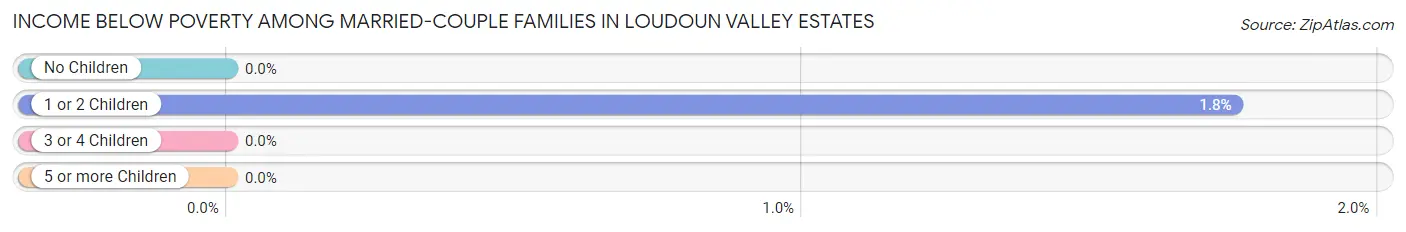
| Children | Above Poverty | Below Poverty |
| No Children | 881 (100.0%) | 0 (0.0%) |
| 1 or 2 Children | 1,740 (98.3%) | 31 (1.8%) |
| 3 or 4 Children | 92 (100.0%) | 0 (0.0%) |
| 5 or more Children | 12 (100.0%) | 0 (0.0%) |
| Total | 2,725 (98.9%) | 31 (1.1%) |
Income Below Poverty Among Single-Parent Households in Loudoun Valley Estates
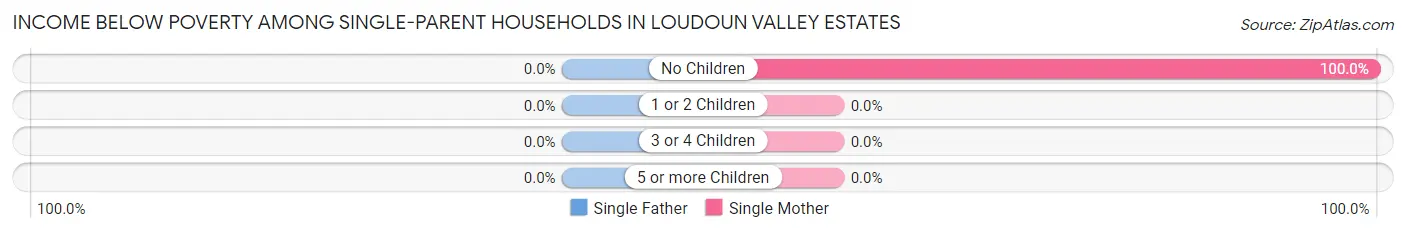
| Children | Single Father | Single Mother |
| No Children | 0 (0.0%) | 67 (100.0%) |
| 1 or 2 Children | 0 (0.0%) | 0 (0.0%) |
| 3 or 4 Children | 0 (0.0%) | 0 (0.0%) |
| 5 or more Children | 0 (0.0%) | 0 (0.0%) |
| Total | 0 (0.0%) | 67 (73.6%) |
Income Below Poverty Among Married-Couple vs Single-Parent Households in Loudoun Valley Estates
The poverty data for Loudoun Valley Estates shows that 31 of the married-couple family households (1.1%) and 67 of the single-parent households (25.2%) are living below the poverty level. Within the married-couple family households, those with 1 or 2 children have the highest poverty rate, with 31 households (1.8%) falling below the poverty line. Among the single-parent households, those with no children have the highest poverty rate, with 67 household (54.5%) living below poverty.
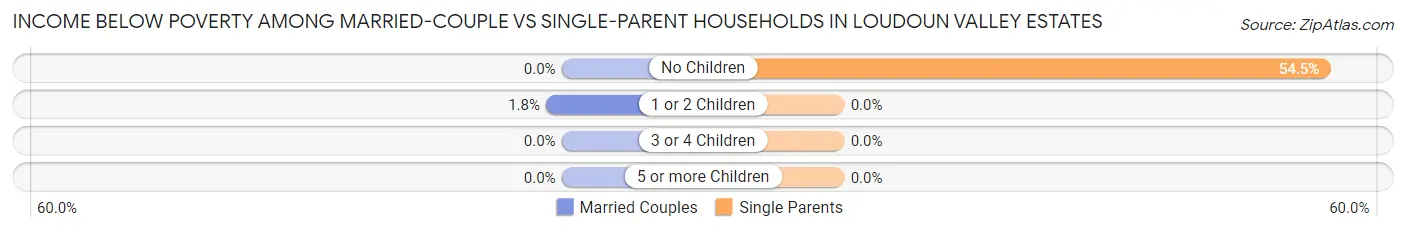
| Children | Married-Couple Families | Single-Parent Households |
| No Children | 0 (0.0%) | 67 (54.5%) |
| 1 or 2 Children | 31 (1.8%) | 0 (0.0%) |
| 3 or 4 Children | 0 (0.0%) | 0 (0.0%) |
| 5 or more Children | 0 (0.0%) | 0 (0.0%) |
| Total | 31 (1.1%) | 67 (25.2%) |
Race in Loudoun Valley Estates
The most populous races in Loudoun Valley Estates are Asian (5,873 | 55.9%), White / Caucasian (3,122 | 29.7%), and Hispanic or Latino (746 | 7.1%).
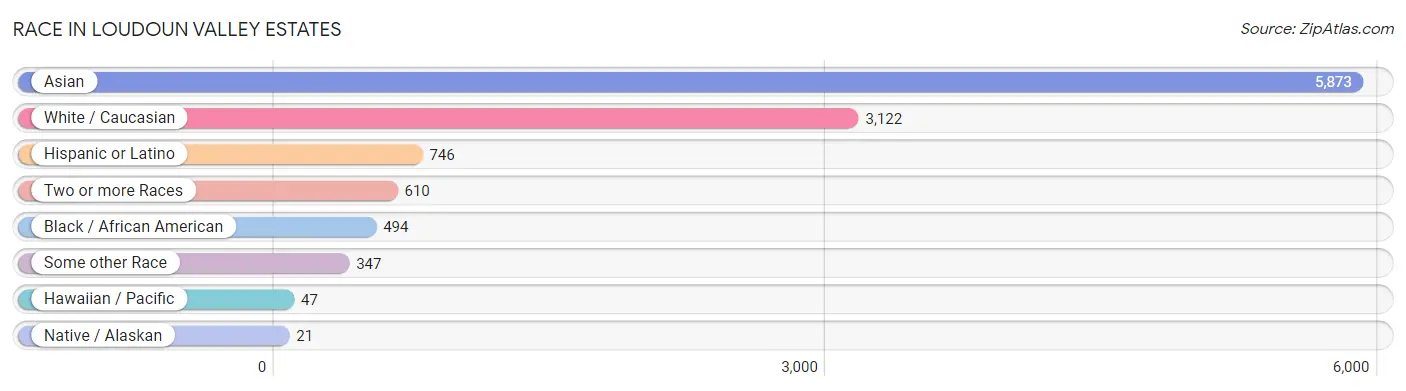
| Race | # Population | % Population |
| Asian | 5,873 | 55.9% |
| Black / African American | 494 | 4.7% |
| Hawaiian / Pacific | 47 | 0.4% |
| Hispanic or Latino | 746 | 7.1% |
| Native / Alaskan | 21 | 0.2% |
| White / Caucasian | 3,122 | 29.7% |
| Two or more Races | 610 | 5.8% |
| Some other Race | 347 | 3.3% |
| Total | 10,514 | 100.0% |
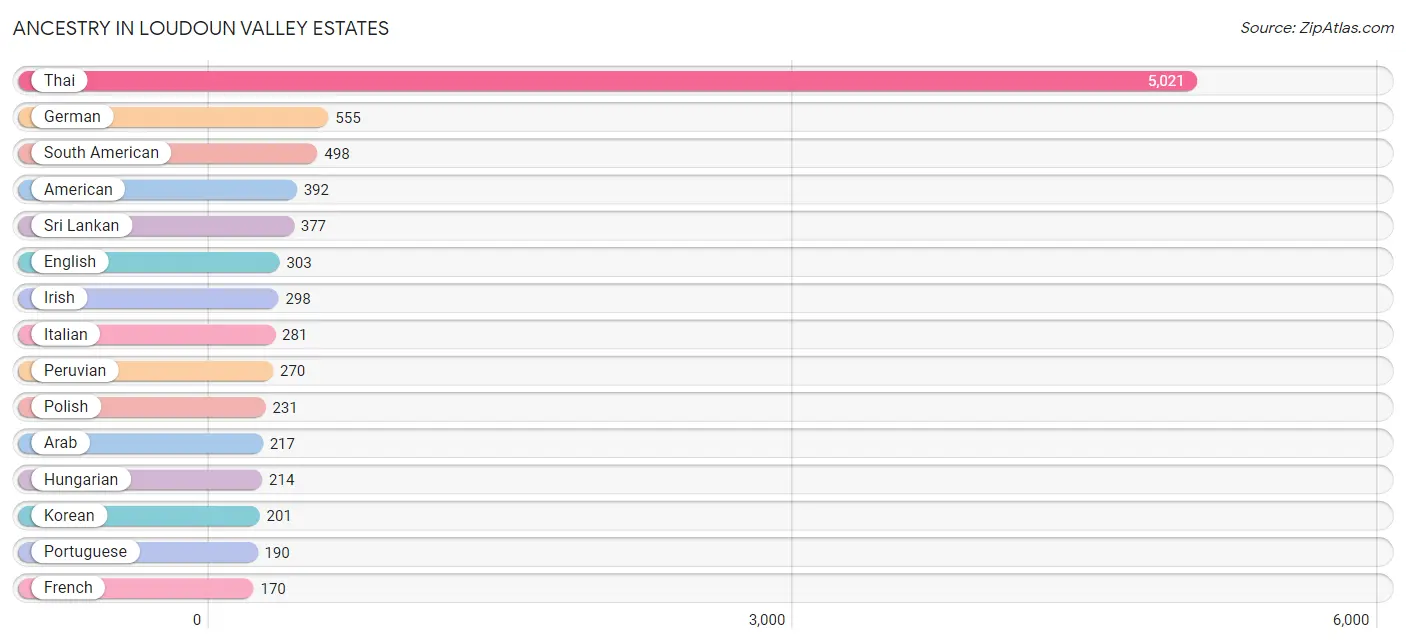
Ancestry in Loudoun Valley Estates
The most populous ancestries reported in Loudoun Valley Estates are Thai (5,021 | 47.8%), German (555 | 5.3%), South American (498 | 4.7%), American (392 | 3.7%), and Sri Lankan (377 | 3.6%), together accounting for 65.1% of all Loudoun Valley Estates residents.
| Ancestry | # Population | % Population |
| African | 32 | 0.3% |
| American | 392 | 3.7% |
| Arab | 217 | 2.1% |
| Austrian | 9 | 0.1% |
| Bhutanese | 52 | 0.5% |
| Bolivian | 24 | 0.2% |
| Brazilian | 69 | 0.7% |
| British | 25 | 0.2% |
| Burmese | 106 | 1.0% |
| Cambodian | 22 | 0.2% |
| Central American | 86 | 0.8% |
| Chickasaw | 10 | 0.1% |
| Colombian | 37 | 0.4% |
| Czech | 11 | 0.1% |
| Eastern European | 17 | 0.2% |
| Ecuadorian | 10 | 0.1% |
| Egyptian | 96 | 0.9% |
| English | 303 | 2.9% |
| European | 30 | 0.3% |
| French | 170 | 1.6% |
| German | 555 | 5.3% |
| Greek | 26 | 0.3% |
| Guamanian / Chamorro | 8 | 0.1% |
| Hungarian | 214 | 2.0% |
| Indian (Asian) | 149 | 1.4% |
| Iranian | 48 | 0.5% |
| Irish | 298 | 2.8% |
| Iroquois | 11 | 0.1% |
| Italian | 281 | 2.7% |
| Jamaican | 3 | 0.0% |
| Jordanian | 121 | 1.1% |
| Korean | 201 | 1.9% |
| Mexican | 67 | 0.6% |
| Mongolian | 48 | 0.5% |
| Nicaraguan | 76 | 0.7% |
| Nigerian | 33 | 0.3% |
| Norwegian | 91 | 0.9% |
| Panamanian | 10 | 0.1% |
| Peruvian | 270 | 2.6% |
| Polish | 231 | 2.2% |
| Portuguese | 190 | 1.8% |
| Puerto Rican | 95 | 0.9% |
| Russian | 35 | 0.3% |
| Samoan | 12 | 0.1% |
| Scandinavian | 75 | 0.7% |
| Scotch-Irish | 11 | 0.1% |
| Scottish | 26 | 0.3% |
| Seminole | 4 | 0.0% |
| South American | 498 | 4.7% |
| Sri Lankan | 377 | 3.6% |
| Subsaharan African | 65 | 0.6% |
| Swedish | 30 | 0.3% |
| Swiss | 12 | 0.1% |
| Thai | 5,021 | 47.8% |
| Turkish | 94 | 0.9% |
| Ukrainian | 21 | 0.2% |
| Venezuelan | 157 | 1.5% |
| Vietnamese | 19 | 0.2% |
| West Indian | 19 | 0.2% | View All 59 Rows |
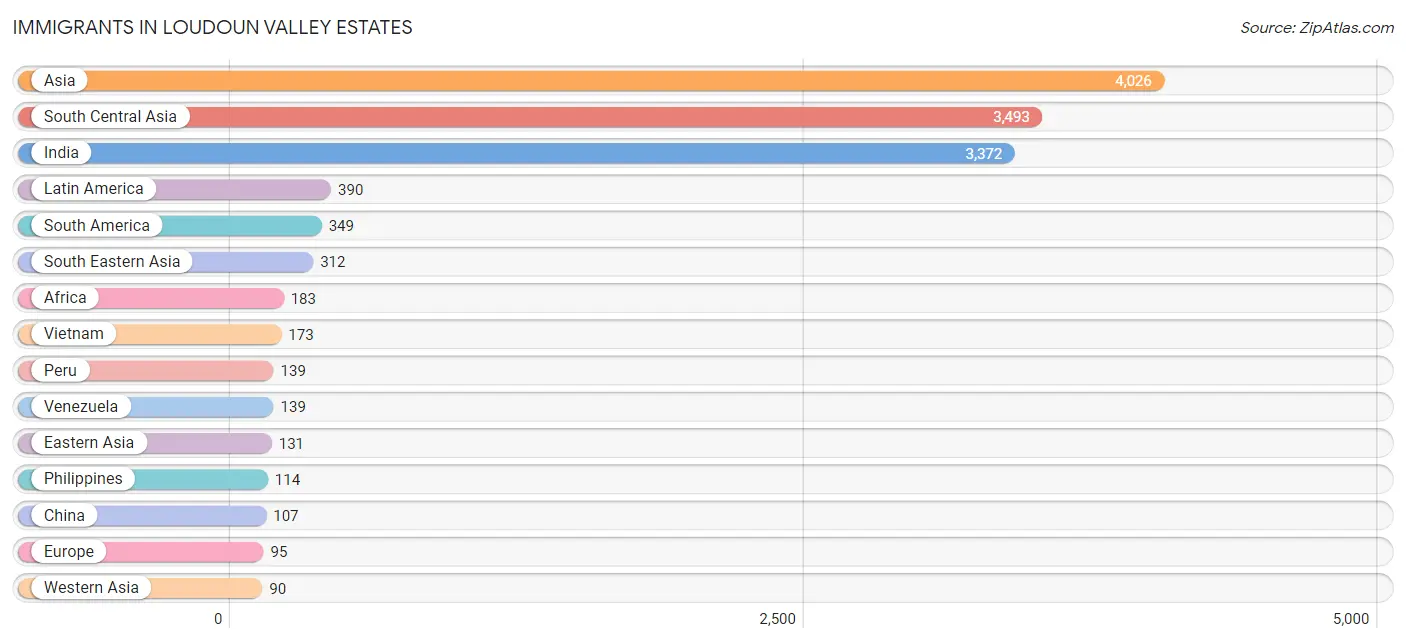
Immigrants in Loudoun Valley Estates
The most numerous immigrant groups reported in Loudoun Valley Estates came from Asia (4,026 | 38.3%), South Central Asia (3,493 | 33.2%), India (3,372 | 32.1%), Latin America (390 | 3.7%), and South America (349 | 3.3%), together accounting for 110.6% of all Loudoun Valley Estates residents.
| Immigration Origin | # Population | % Population |
| Africa | 183 | 1.7% |
| Asia | 4,026 | 38.3% |
| Bangladesh | 19 | 0.2% |
| Bolivia | 24 | 0.2% |
| Canada | 14 | 0.1% |
| Central America | 41 | 0.4% |
| China | 107 | 1.0% |
| Colombia | 37 | 0.4% |
| Eastern Africa | 85 | 0.8% |
| Eastern Asia | 131 | 1.3% |
| Eastern Europe | 38 | 0.4% |
| Ecuador | 10 | 0.1% |
| Egypt | 33 | 0.3% |
| Europe | 95 | 0.9% |
| Fiji | 20 | 0.2% |
| France | 15 | 0.1% |
| Germany | 42 | 0.4% |
| Hungary | 38 | 0.4% |
| India | 3,372 | 32.1% |
| Iran | 52 | 0.5% |
| Iraq | 34 | 0.3% |
| Japan | 11 | 0.1% |
| Jordan | 12 | 0.1% |
| Kenya | 43 | 0.4% |
| Korea | 13 | 0.1% |
| Kuwait | 13 | 0.1% |
| Latin America | 390 | 3.7% |
| Malaysia | 25 | 0.2% |
| Nicaragua | 41 | 0.4% |
| Nigeria | 33 | 0.3% |
| Northern Africa | 33 | 0.3% |
| Oceania | 20 | 0.2% |
| Pakistan | 50 | 0.5% |
| Peru | 139 | 1.3% |
| Philippines | 114 | 1.1% |
| South America | 349 | 3.3% |
| South Central Asia | 3,493 | 33.2% |
| South Eastern Asia | 312 | 3.0% |
| Turkey | 31 | 0.3% |
| Venezuela | 139 | 1.3% |
| Vietnam | 173 | 1.7% |
| Western Africa | 65 | 0.6% |
| Western Asia | 90 | 0.9% |
| Western Europe | 57 | 0.5% | View All 44 Rows |
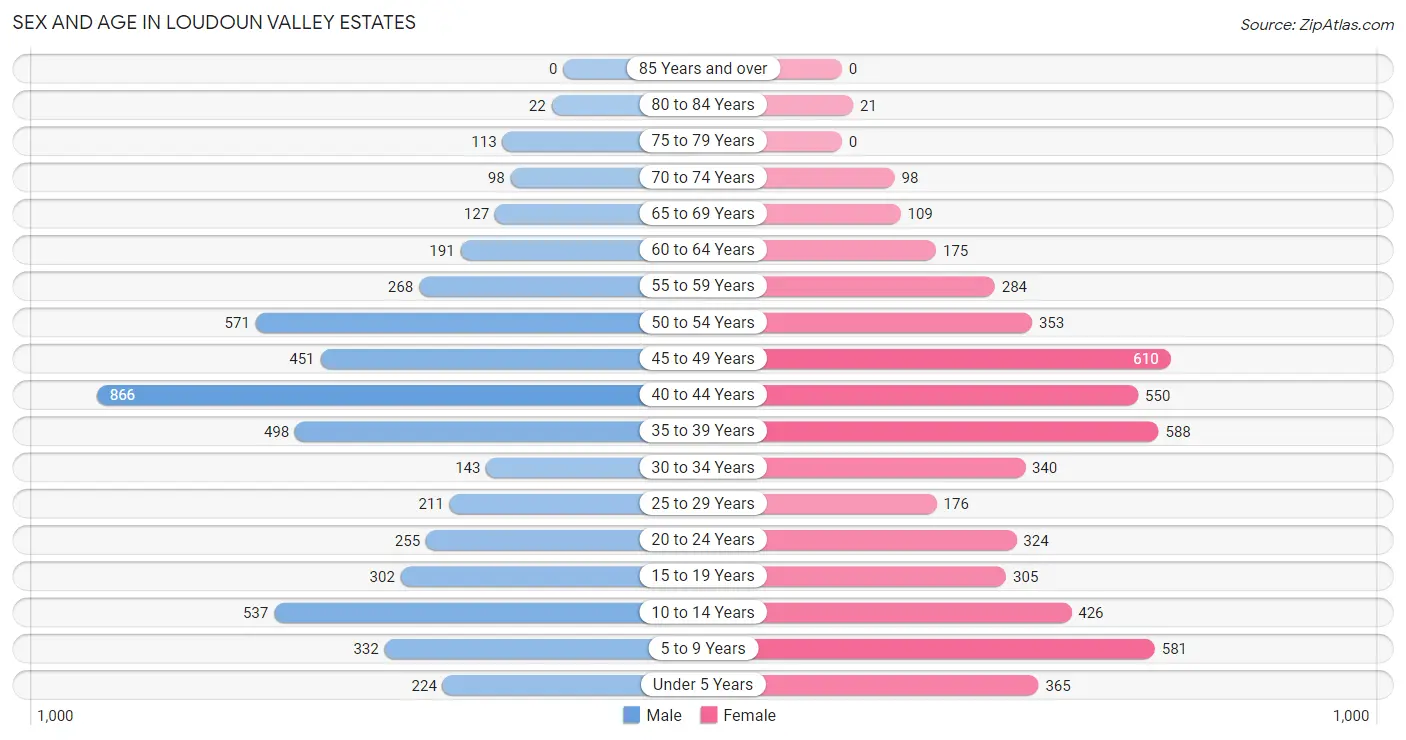
Sex and Age in Loudoun Valley Estates
Sex and Age in Loudoun Valley Estates
The most populous age groups in Loudoun Valley Estates are 40 to 44 Years (866 | 16.6%) for men and 45 to 49 Years (610 | 11.5%) for women.
| Age Bracket | Male | Female |
| Under 5 Years | 224 (4.3%) | 365 (6.9%) |
| 5 to 9 Years | 332 (6.4%) | 581 (11.0%) |
| 10 to 14 Years | 537 (10.3%) | 426 (8.0%) |
| 15 to 19 Years | 302 (5.8%) | 305 (5.8%) |
| 20 to 24 Years | 255 (4.9%) | 324 (6.1%) |
| 25 to 29 Years | 211 (4.1%) | 176 (3.3%) |
| 30 to 34 Years | 143 (2.8%) | 340 (6.4%) |
| 35 to 39 Years | 498 (9.6%) | 588 (11.1%) |
| 40 to 44 Years | 866 (16.6%) | 550 (10.4%) |
| 45 to 49 Years | 451 (8.7%) | 610 (11.5%) |
| 50 to 54 Years | 571 (11.0%) | 353 (6.7%) |
| 55 to 59 Years | 268 (5.1%) | 284 (5.3%) |
| 60 to 64 Years | 191 (3.7%) | 175 (3.3%) |
| 65 to 69 Years | 127 (2.4%) | 109 (2.1%) |
| 70 to 74 Years | 98 (1.9%) | 98 (1.8%) |
| 75 to 79 Years | 113 (2.2%) | 0 (0.0%) |
| 80 to 84 Years | 22 (0.4%) | 21 (0.4%) |
| 85 Years and over | 0 (0.0%) | 0 (0.0%) |
| Total | 5,209 (100.0%) | 5,305 (100.0%) |
Families and Households in Loudoun Valley Estates
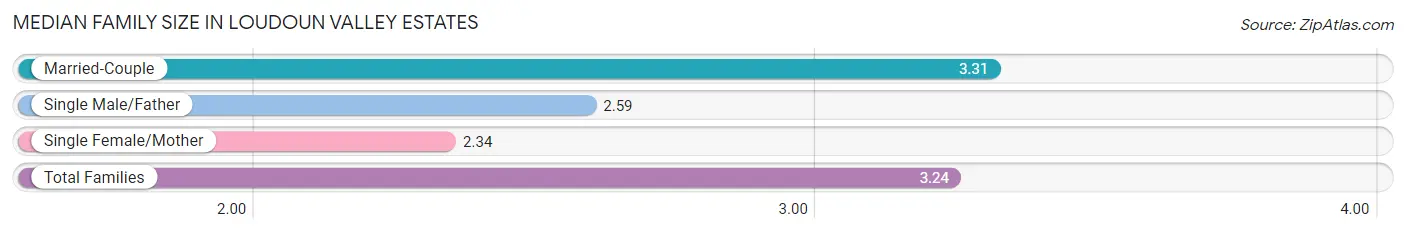
Median Family Size in Loudoun Valley Estates
The median family size in Loudoun Valley Estates is 3.24 persons per family, with married-couple families (2,756 | 91.2%) accounting for the largest median family size of 3.31 persons per family. On the other hand, single female/mother families (91 | 3.0%) represent the smallest median family size with 2.34 persons per family.
| Family Type | # Families | Family Size |
| Married-Couple | 2,756 (91.2%) | 3.31 |
| Single Male/Father | 175 (5.8%) | 2.59 |
| Single Female/Mother | 91 (3.0%) | 2.34 |
| Total Families | 3,022 (100.0%) | 3.24 |
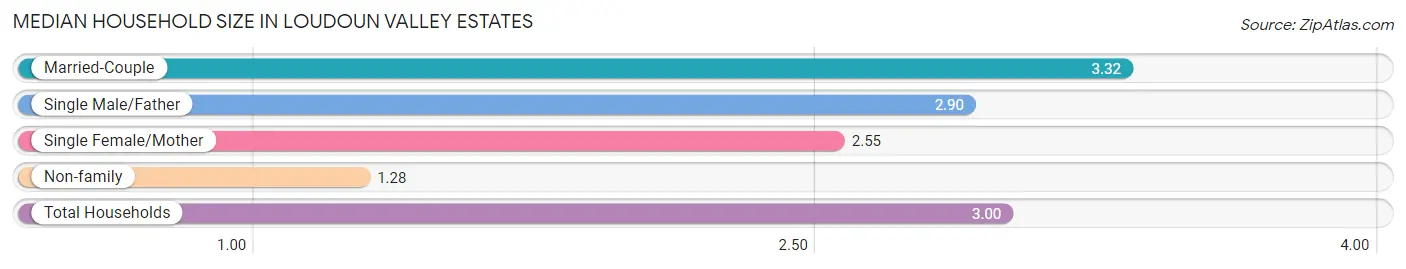
Median Household Size in Loudoun Valley Estates
The median household size in Loudoun Valley Estates is 3.00 persons per household, with married-couple households (2,756 | 78.6%) accounting for the largest median household size of 3.32 persons per household. non-family households (482 | 13.8%) represent the smallest median household size with 1.28 persons per household.
| Household Type | # Households | Household Size |
| Married-Couple | 2,756 (78.6%) | 3.32 |
| Single Male/Father | 175 (5.0%) | 2.90 |
| Single Female/Mother | 91 (2.6%) | 2.55 |
| Non-family | 482 (13.8%) | 1.28 |
| Total Households | 3,504 (100.0%) | 3.00 |
Household Size by Marriage Status in Loudoun Valley Estates
Out of a total of 3,504 households in Loudoun Valley Estates, 3,022 (86.2%) are family households, while 482 (13.8%) are nonfamily households. The most numerous type of family households are 4-person households, comprising 1,207, and the most common type of nonfamily households are 1-person households, comprising 337.
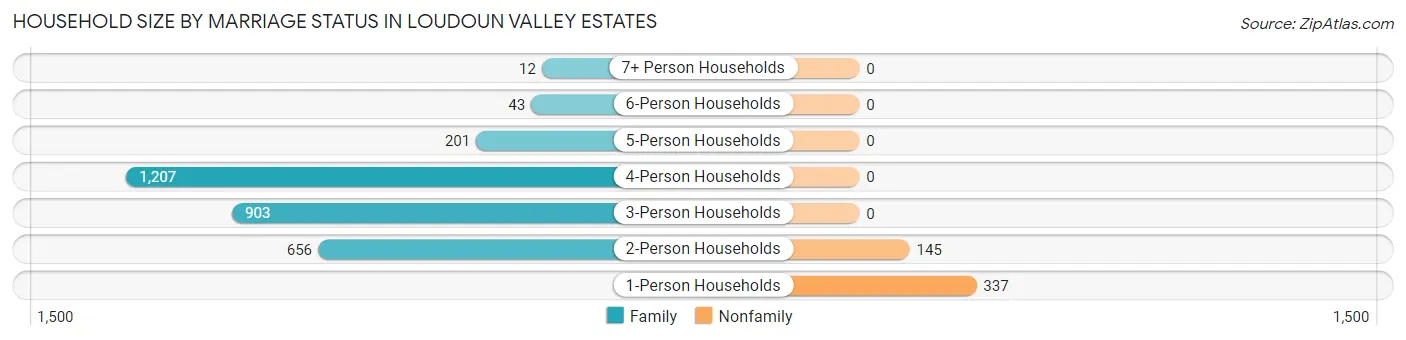
| Household Size | Family Households | Nonfamily Households |
| 1-Person Households | - | 337 (9.6%) |
| 2-Person Households | 656 (18.7%) | 145 (4.1%) |
| 3-Person Households | 903 (25.8%) | 0 (0.0%) |
| 4-Person Households | 1,207 (34.4%) | 0 (0.0%) |
| 5-Person Households | 201 (5.7%) | 0 (0.0%) |
| 6-Person Households | 43 (1.2%) | 0 (0.0%) |
| 7+ Person Households | 12 (0.3%) | 0 (0.0%) |
| Total | 3,022 (86.2%) | 482 (13.8%) |
Female Fertility in Loudoun Valley Estates
Fertility by Age in Loudoun Valley Estates
Average fertility rate in Loudoun Valley Estates is 63.0 births per 1,000 women. Women in the age bracket of 20 to 34 years have the highest fertility rate with 143.0 births per 1,000 women. Women in the age bracket of 20 to 34 years acount for 63.5% of all women with births.
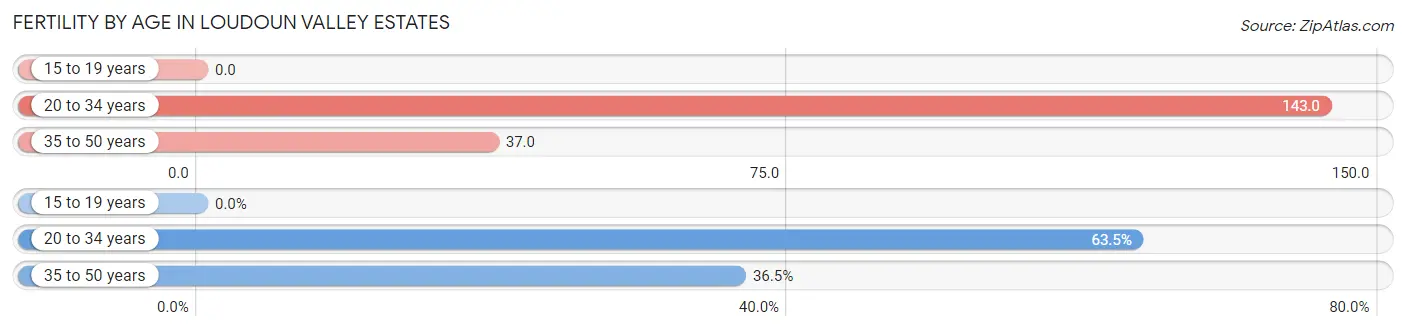
| Age Bracket | Women with Births | Births / 1,000 Women |
| 15 to 19 years | 0 (0.0%) | 0.0 |
| 20 to 34 years | 120 (63.5%) | 143.0 |
| 35 to 50 years | 69 (36.5%) | 37.0 |
| Total | 189 (100.0%) | 63.0 |
Fertility by Age by Marriage Status in Loudoun Valley Estates
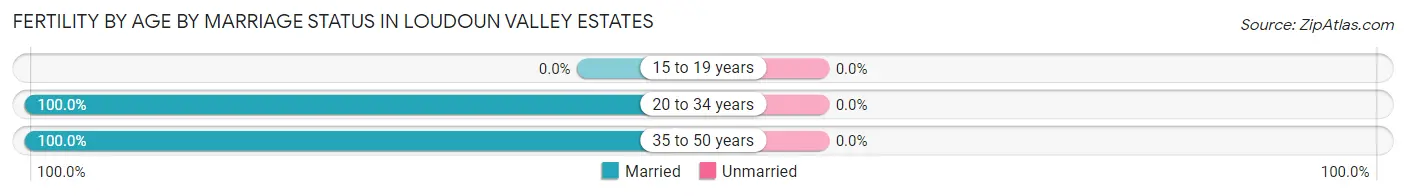
| Age Bracket | Married | Unmarried |
| 15 to 19 years | 0 (0.0%) | 0 (0.0%) |
| 20 to 34 years | 120 (100.0%) | 0 (0.0%) |
| 35 to 50 years | 69 (100.0%) | 0 (0.0%) |
| Total | 189 (100.0%) | 0 (0.0%) |
Fertility by Education in Loudoun Valley Estates
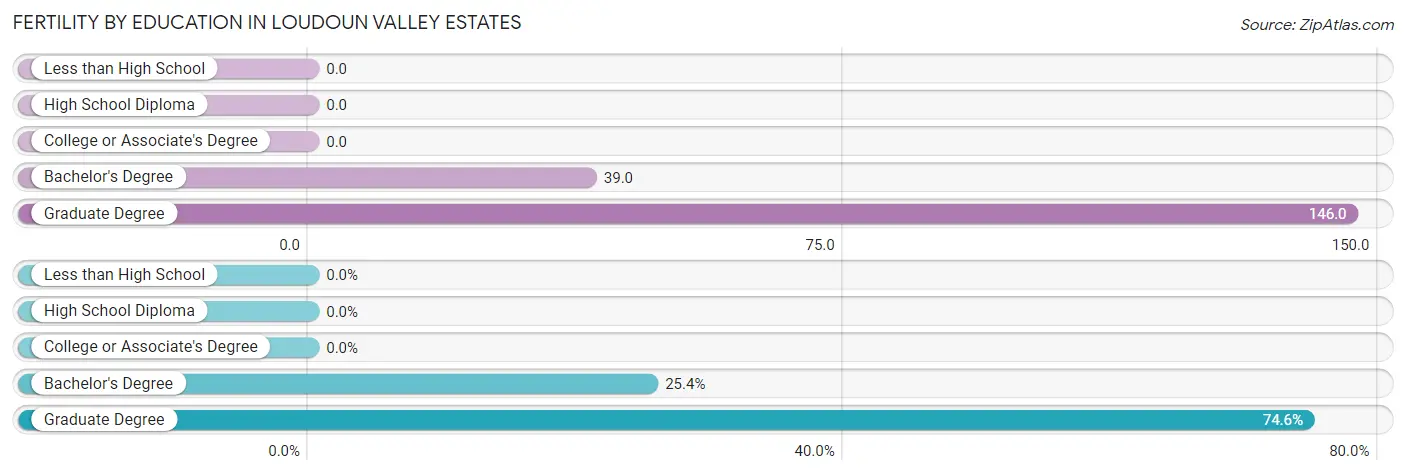
| Educational Attainment | Women with Births | Births / 1,000 Women |
| Less than High School | 0 (0.0%) | 0.0 |
| High School Diploma | 0 (0.0%) | 0.0 |
| College or Associate's Degree | 0 (0.0%) | 0.0 |
| Bachelor's Degree | 48 (25.4%) | 39.0 |
| Graduate Degree | 141 (74.6%) | 146.0 |
| Total | 189 (100.0%) | 63.0 |
Fertility by Education by Marriage Status in Loudoun Valley Estates
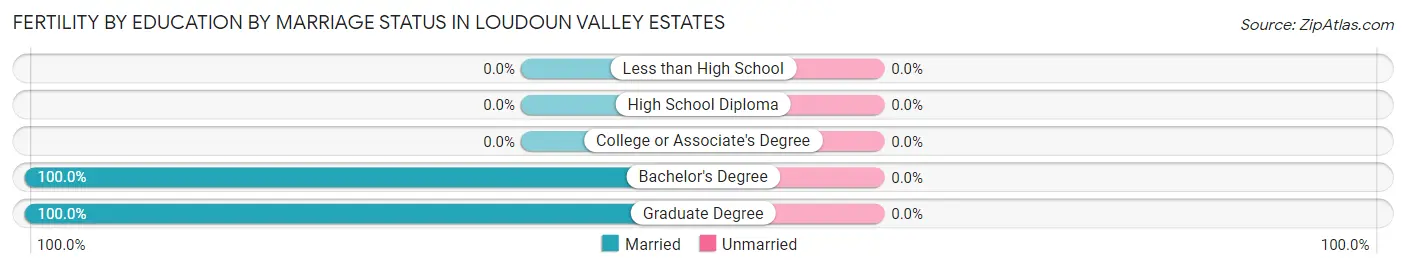
| Educational Attainment | Married | Unmarried |
| Less than High School | 0 (0.0%) | 0 (0.0%) |
| High School Diploma | 0 (0.0%) | 0 (0.0%) |
| College or Associate's Degree | 0 (0.0%) | 0 (0.0%) |
| Bachelor's Degree | 48 (100.0%) | 0 (0.0%) |
| Graduate Degree | 141 (100.0%) | 0 (0.0%) |
| Total | 189 (100.0%) | 0 (0.0%) |
Employment Characteristics in Loudoun Valley Estates
Employment by Class of Employer in Loudoun Valley Estates
Among the 6,118 employed individuals in Loudoun Valley Estates, private company employees (4,503 | 73.6%), not-for-profit organizations (458 | 7.5%), and federal government employees (457 | 7.5%) make up the most common classes of employment.
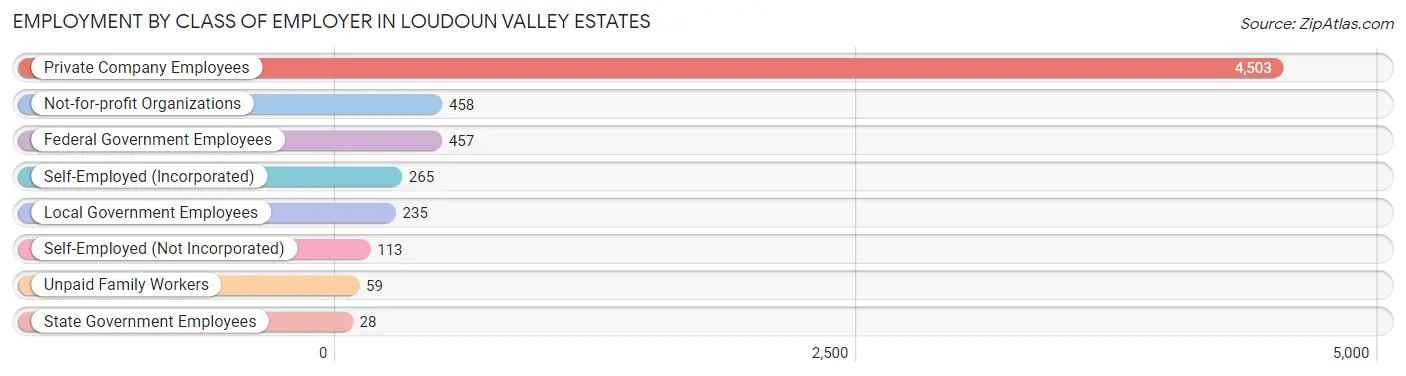
| Employer Class | # Employees | % Employees |
| Private Company Employees | 4,503 | 73.6% |
| Self-Employed (Incorporated) | 265 | 4.3% |
| Self-Employed (Not Incorporated) | 113 | 1.8% |
| Not-for-profit Organizations | 458 | 7.5% |
| Local Government Employees | 235 | 3.8% |
| State Government Employees | 28 | 0.5% |
| Federal Government Employees | 457 | 7.5% |
| Unpaid Family Workers | 59 | 1.0% |
| Total | 6,118 | 100.0% |
Employment Status by Age in Loudoun Valley Estates
According to the labor force statistics for Loudoun Valley Estates, out of the total population over 16 years of age (7,869), 79.4% or 6,248 individuals are in the labor force, with 1.5% or 94 of them unemployed. The age group with the highest labor force participation rate is 30 to 34 years, with 95.2% or 460 individuals in the labor force. Within the labor force, the 20 to 24 years age range has the highest percentage of unemployed individuals, with 6.5% or 26 of them being unemployed.
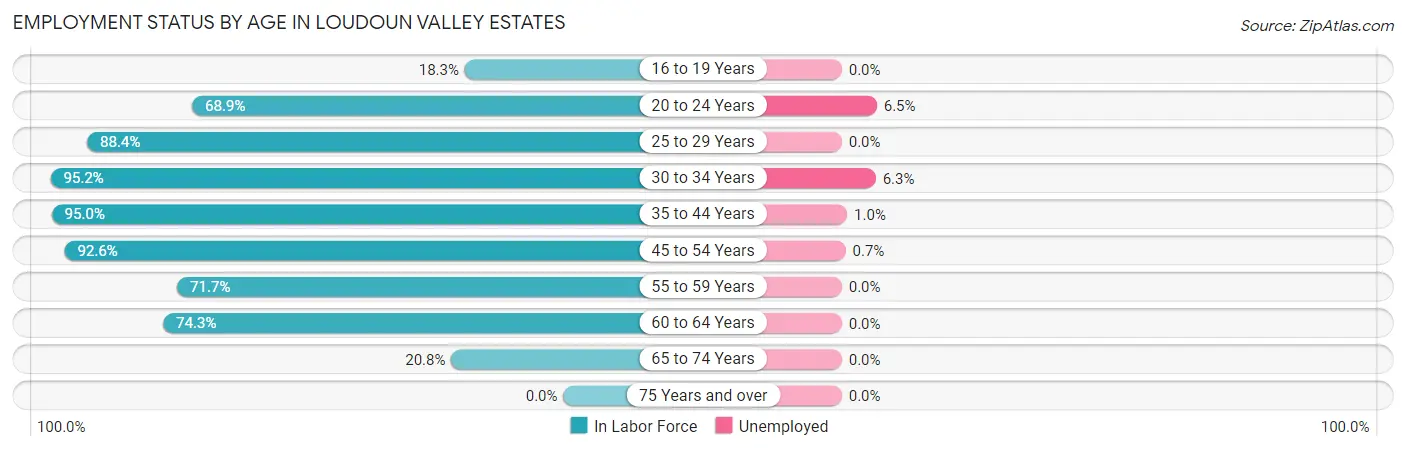
| Age Bracket | In Labor Force | Unemployed |
| 16 to 19 Years | 78 (18.3%) | 0 (0.0%) |
| 20 to 24 Years | 399 (68.9%) | 26 (6.5%) |
| 25 to 29 Years | 342 (88.4%) | 0 (0.0%) |
| 30 to 34 Years | 460 (95.2%) | 29 (6.3%) |
| 35 to 44 Years | 2,377 (95.0%) | 24 (1.0%) |
| 45 to 54 Years | 1,838 (92.6%) | 13 (0.7%) |
| 55 to 59 Years | 396 (71.7%) | 0 (0.0%) |
| 60 to 64 Years | 272 (74.3%) | 0 (0.0%) |
| 65 to 74 Years | 90 (20.8%) | 0 (0.0%) |
| 75 Years and over | 0 (0.0%) | 0 (0.0%) |
| Total | 6,248 (79.4%) | 94 (1.5%) |
Employment Status by Educational Attainment in Loudoun Valley Estates
According to labor force statistics for Loudoun Valley Estates, 90.6% of individuals (5,685) out of the total population between 25 and 64 years of age (6,275) are in the labor force, with 1.2% or 68 of them being unemployed. The group with the highest labor force participation rate are those with the educational attainment of bachelor's degree or higher, with 93.1% or 4,904 individuals in the labor force. Within the labor force, individuals with bachelor's degree or higher education have the highest percentage of unemployment, with 1.3% or 64 of them being unemployed.

| Educational Attainment | In Labor Force | Unemployed |
| Less than High School | 22 (31.0%) | 0 (0.0%) |
| High School Diploma | 216 (82.8%) | 0 (0.0%) |
| College / Associate Degree | 541 (80.0%) | 0 (0.0%) |
| Bachelor's Degree or higher | 4,904 (93.1%) | 68 (1.3%) |
| Total | 5,685 (90.6%) | 75 (1.2%) |
Employment Occupations by Sex in Loudoun Valley Estates
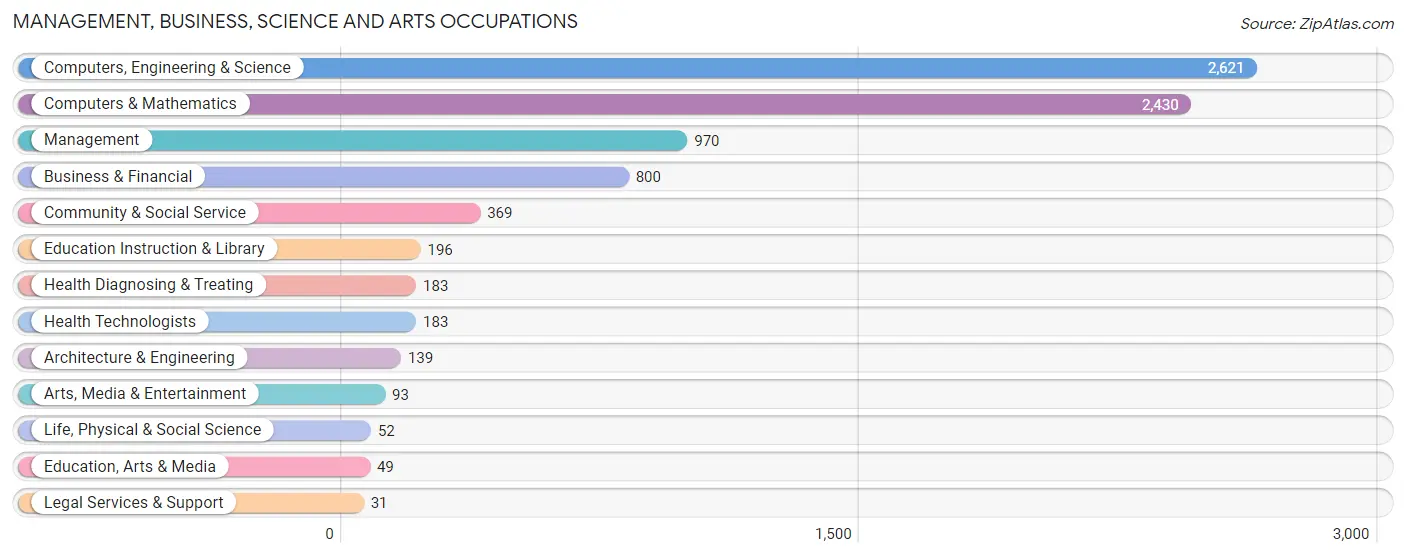
Management, Business, Science and Arts Occupations
The most common Management, Business, Science and Arts occupations in Loudoun Valley Estates are Computers, Engineering & Science (2,621 | 42.6%), Computers & Mathematics (2,430 | 39.5%), Management (970 | 15.8%), Business & Financial (800 | 13.0%), and Community & Social Service (369 | 6.0%).
Management, Business, Science and Arts Occupations by Sex
Within the Management, Business, Science and Arts occupations in Loudoun Valley Estates, the most male-oriented occupations are Education, Arts & Media (100.0%), Legal Services & Support (100.0%), and Architecture & Engineering (71.9%), while the most female-oriented occupations are Education Instruction & Library (80.1%), Business & Financial (68.5%), and Arts, Media & Entertainment (65.6%).
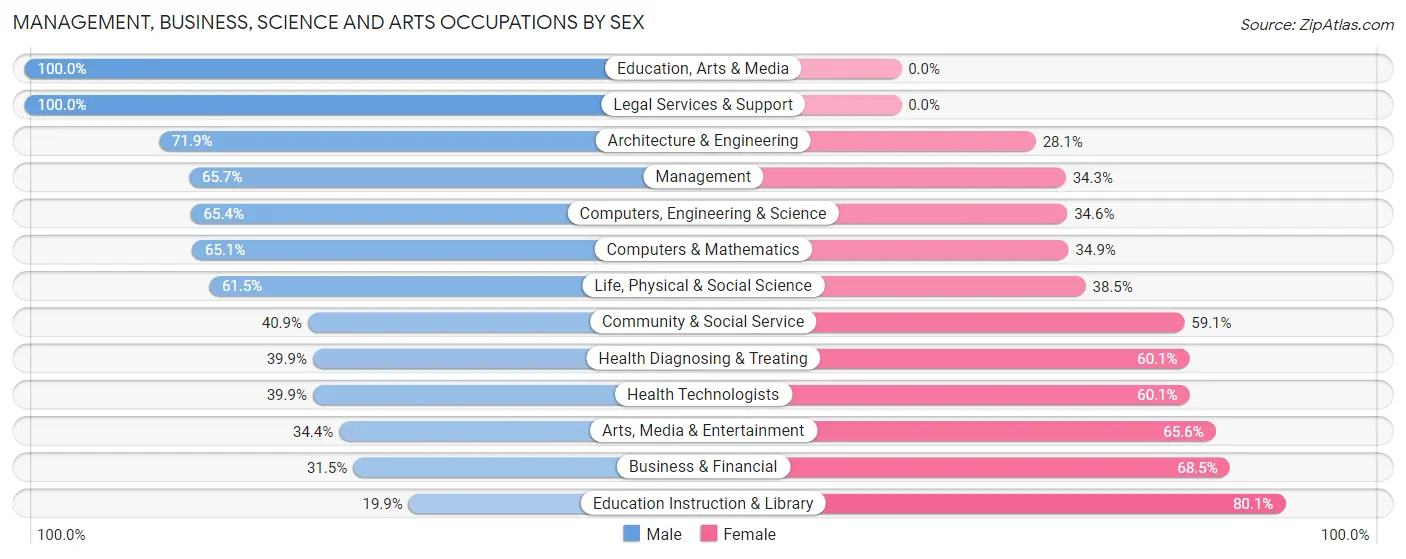
| Occupation | Male | Female |
| Management | 637 (65.7%) | 333 (34.3%) |
| Business & Financial | 252 (31.5%) | 548 (68.5%) |
| Computers, Engineering & Science | 1,713 (65.4%) | 908 (34.6%) |
| Computers & Mathematics | 1,581 (65.1%) | 849 (34.9%) |
| Architecture & Engineering | 100 (71.9%) | 39 (28.1%) |
| Life, Physical & Social Science | 32 (61.5%) | 20 (38.5%) |
| Community & Social Service | 151 (40.9%) | 218 (59.1%) |
| Education, Arts & Media | 49 (100.0%) | 0 (0.0%) |
| Legal Services & Support | 31 (100.0%) | 0 (0.0%) |
| Education Instruction & Library | 39 (19.9%) | 157 (80.1%) |
| Arts, Media & Entertainment | 32 (34.4%) | 61 (65.6%) |
| Health Diagnosing & Treating | 73 (39.9%) | 110 (60.1%) |
| Health Technologists | 73 (39.9%) | 110 (60.1%) |
| Total (Category) | 2,826 (57.2%) | 2,117 (42.8%) |
| Total (Overall) | 3,336 (54.2%) | 2,823 (45.8%) |
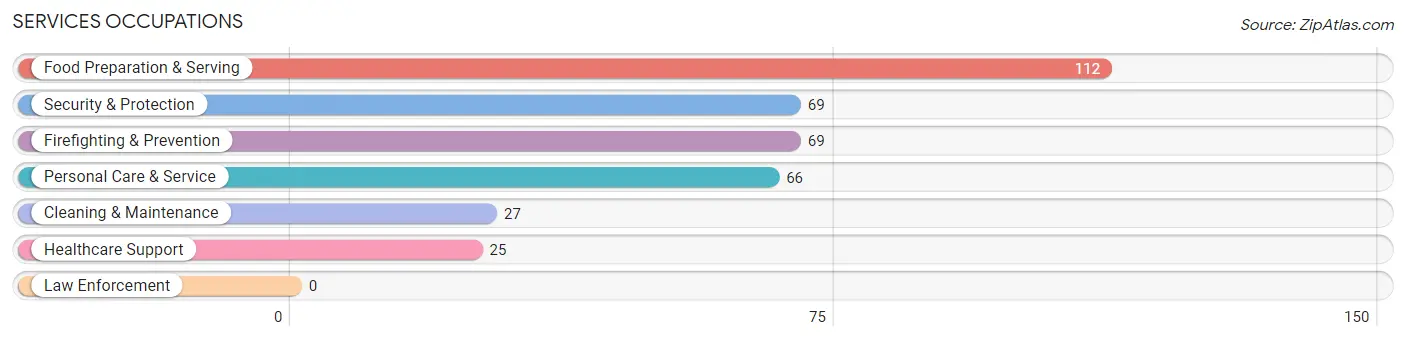
Services Occupations
The most common Services occupations in Loudoun Valley Estates are Food Preparation & Serving (112 | 1.8%), Security & Protection (69 | 1.1%), Firefighting & Prevention (69 | 1.1%), Personal Care & Service (66 | 1.1%), and Cleaning & Maintenance (27 | 0.4%).
Services Occupations by Sex
Within the Services occupations in Loudoun Valley Estates, the most male-oriented occupations are Security & Protection (60.9%), Firefighting & Prevention (60.9%), and Food Preparation & Serving (22.3%), while the most female-oriented occupations are Healthcare Support (100.0%), Cleaning & Maintenance (100.0%), and Personal Care & Service (100.0%).
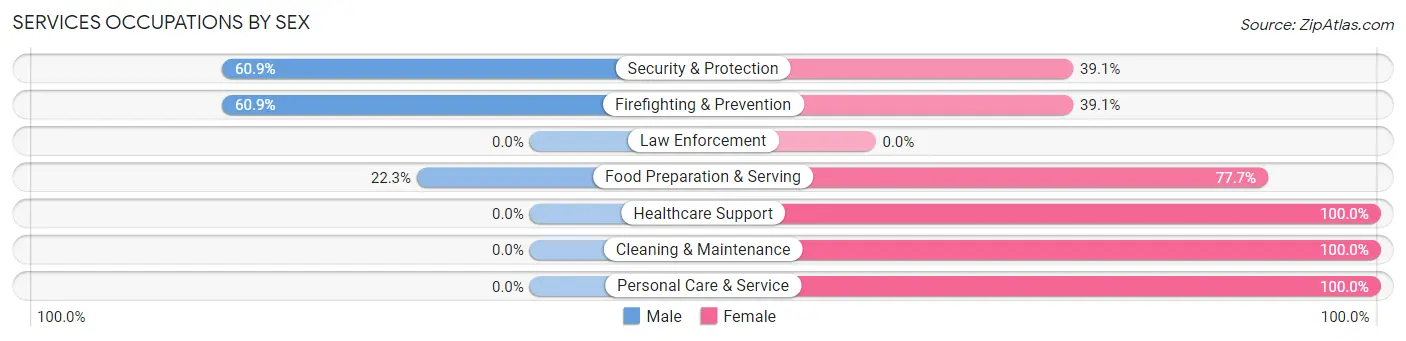
| Occupation | Male | Female |
| Healthcare Support | 0 (0.0%) | 25 (100.0%) |
| Security & Protection | 42 (60.9%) | 27 (39.1%) |
| Firefighting & Prevention | 42 (60.9%) | 27 (39.1%) |
| Law Enforcement | 0 (0.0%) | 0 (0.0%) |
| Food Preparation & Serving | 25 (22.3%) | 87 (77.7%) |
| Cleaning & Maintenance | 0 (0.0%) | 27 (100.0%) |
| Personal Care & Service | 0 (0.0%) | 66 (100.0%) |
| Total (Category) | 67 (22.4%) | 232 (77.6%) |
| Total (Overall) | 3,336 (54.2%) | 2,823 (45.8%) |
Sales and Office Occupations
The most common Sales and Office occupations in Loudoun Valley Estates are Office & Administration (477 | 7.7%), and Sales & Related (204 | 3.3%).

Sales and Office Occupations by Sex

| Occupation | Male | Female |
| Sales & Related | 114 (55.9%) | 90 (44.1%) |
| Office & Administration | 178 (37.3%) | 299 (62.7%) |
| Total (Category) | 292 (42.9%) | 389 (57.1%) |
| Total (Overall) | 3,336 (54.2%) | 2,823 (45.8%) |
Natural Resources, Construction and Maintenance Occupations
The most common Natural Resources, Construction and Maintenance occupations in Loudoun Valley Estates are Farming, Fishing & Forestry (42 | 0.7%), Installation, Maintenance & Repair (39 | 0.6%), and Construction & Extraction (30 | 0.5%).

Natural Resources, Construction and Maintenance Occupations by Sex

| Occupation | Male | Female |
| Farming, Fishing & Forestry | 0 (0.0%) | 42 (100.0%) |
| Construction & Extraction | 30 (100.0%) | 0 (0.0%) |
| Installation, Maintenance & Repair | 39 (100.0%) | 0 (0.0%) |
| Total (Category) | 69 (62.2%) | 42 (37.8%) |
| Total (Overall) | 3,336 (54.2%) | 2,823 (45.8%) |
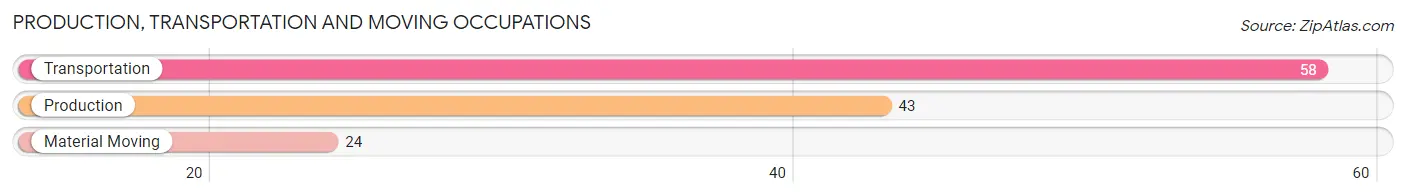
Production, Transportation and Moving Occupations
The most common Production, Transportation and Moving occupations in Loudoun Valley Estates are Transportation (58 | 0.9%), Production (43 | 0.7%), and Material Moving (24 | 0.4%).
Production, Transportation and Moving Occupations by Sex
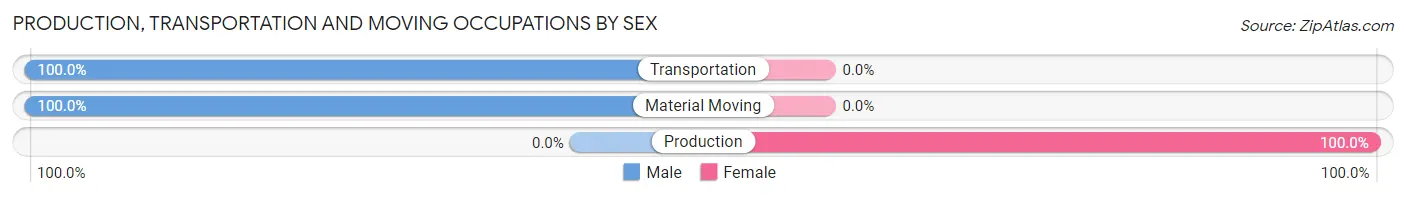
| Occupation | Male | Female |
| Production | 0 (0.0%) | 43 (100.0%) |
| Transportation | 58 (100.0%) | 0 (0.0%) |
| Material Moving | 24 (100.0%) | 0 (0.0%) |
| Total (Category) | 82 (65.6%) | 43 (34.4%) |
| Total (Overall) | 3,336 (54.2%) | 2,823 (45.8%) |
Employment Industries by Sex in Loudoun Valley Estates
Employment Industries in Loudoun Valley Estates
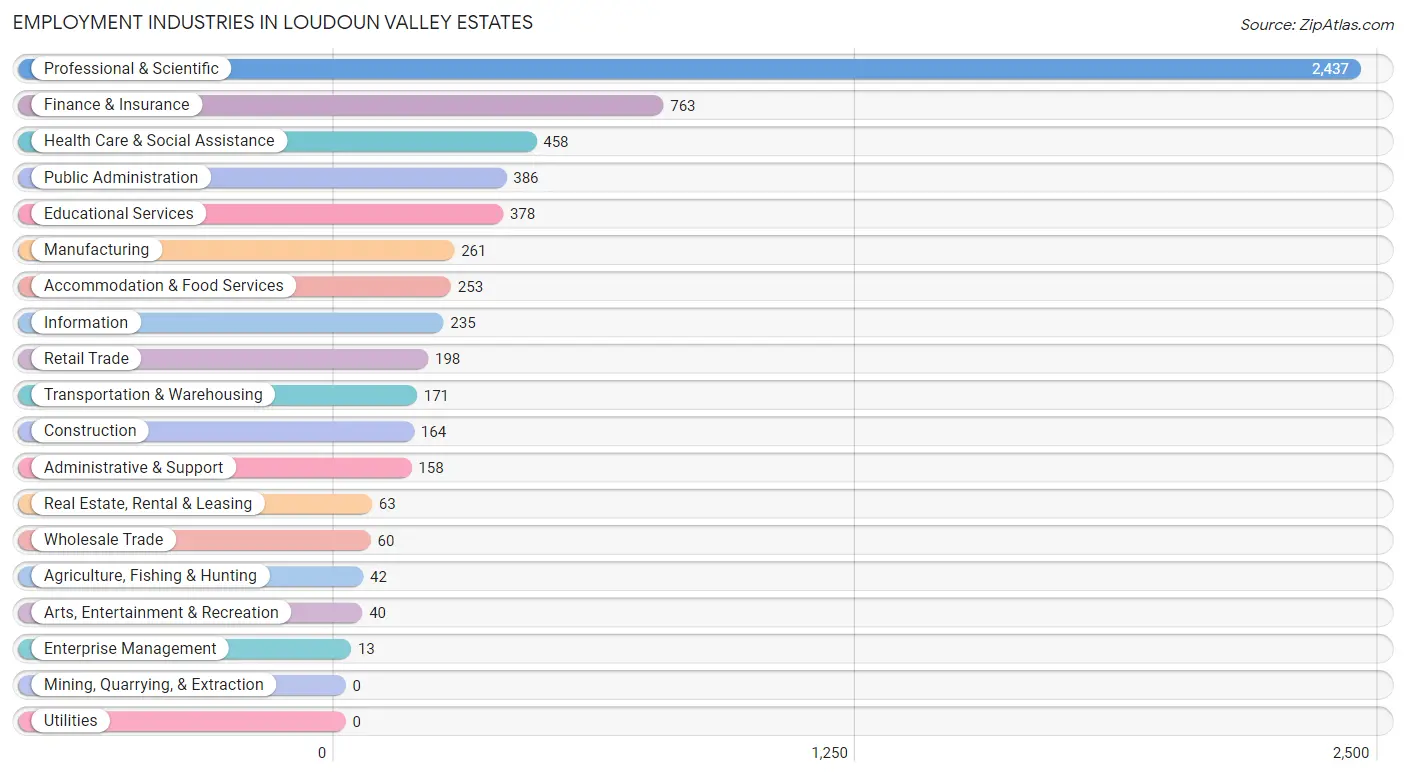
The major employment industries in Loudoun Valley Estates include Professional & Scientific (2,437 | 39.6%), Finance & Insurance (763 | 12.4%), Health Care & Social Assistance (458 | 7.4%), Public Administration (386 | 6.3%), and Educational Services (378 | 6.1%).
Employment Industries by Sex in Loudoun Valley Estates
The Loudoun Valley Estates industries that see more men than women are Enterprise Management (100.0%), Transportation & Warehousing (86.6%), and Information (81.7%), whereas the industries that tend to have a higher number of women are Agriculture, Fishing & Hunting (100.0%), Real Estate, Rental & Leasing (100.0%), and Health Care & Social Assistance (72.3%).
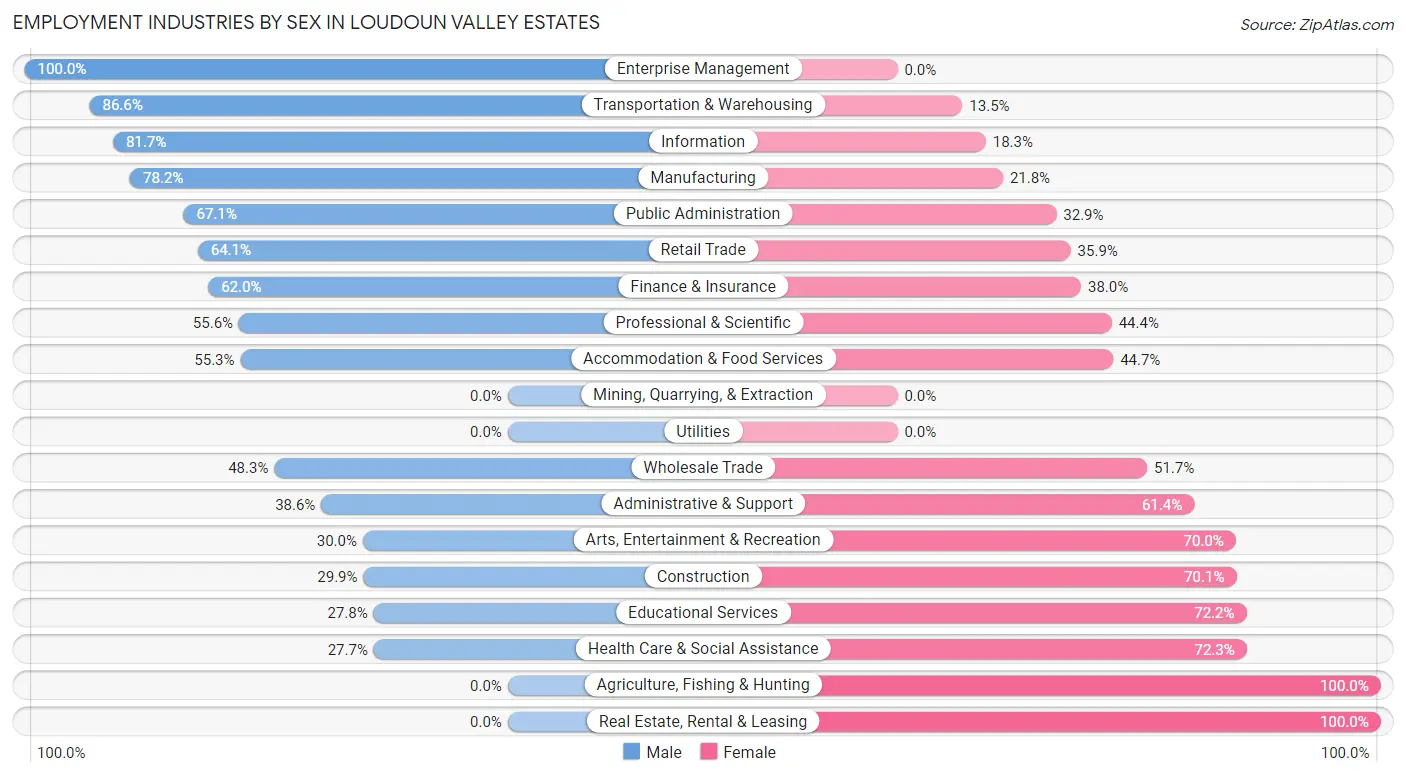
| Industry | Male | Female |
| Agriculture, Fishing & Hunting | 0 (0.0%) | 42 (100.0%) |
| Mining, Quarrying, & Extraction | 0 (0.0%) | 0 (0.0%) |
| Construction | 49 (29.9%) | 115 (70.1%) |
| Manufacturing | 204 (78.2%) | 57 (21.8%) |
| Wholesale Trade | 29 (48.3%) | 31 (51.7%) |
| Retail Trade | 127 (64.1%) | 71 (35.9%) |
| Transportation & Warehousing | 148 (86.6%) | 23 (13.5%) |
| Utilities | 0 (0.0%) | 0 (0.0%) |
| Information | 192 (81.7%) | 43 (18.3%) |
| Finance & Insurance | 473 (62.0%) | 290 (38.0%) |
| Real Estate, Rental & Leasing | 0 (0.0%) | 63 (100.0%) |
| Professional & Scientific | 1,356 (55.6%) | 1,081 (44.4%) |
| Enterprise Management | 13 (100.0%) | 0 (0.0%) |
| Administrative & Support | 61 (38.6%) | 97 (61.4%) |
| Educational Services | 105 (27.8%) | 273 (72.2%) |
| Health Care & Social Assistance | 127 (27.7%) | 331 (72.3%) |
| Arts, Entertainment & Recreation | 12 (30.0%) | 28 (70.0%) |
| Accommodation & Food Services | 140 (55.3%) | 113 (44.7%) |
| Public Administration | 259 (67.1%) | 127 (32.9%) |
| Total | 3,336 (54.2%) | 2,823 (45.8%) |
Education in Loudoun Valley Estates
School Enrollment in Loudoun Valley Estates
The most common levels of schooling among the 3,006 students in Loudoun Valley Estates are middle school (827 | 27.5%), elementary school (753 | 25.1%), and high school (550 | 18.3%).
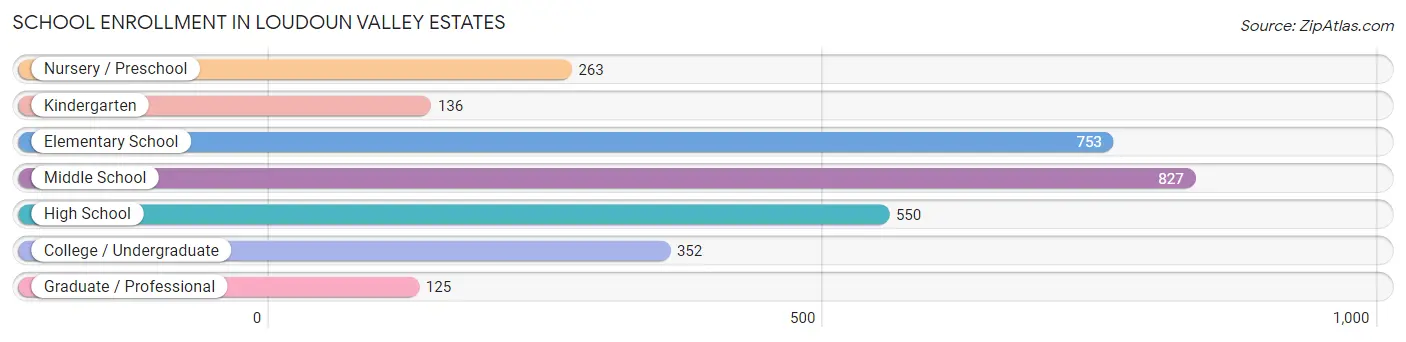
| School Level | # Students | % Students |
| Nursery / Preschool | 263 | 8.7% |
| Kindergarten | 136 | 4.5% |
| Elementary School | 753 | 25.1% |
| Middle School | 827 | 27.5% |
| High School | 550 | 18.3% |
| College / Undergraduate | 352 | 11.7% |
| Graduate / Professional | 125 | 4.2% |
| Total | 3,006 | 100.0% |
School Enrollment by Age by Funding Source in Loudoun Valley Estates
Out of a total of 3,006 students who are enrolled in schools in Loudoun Valley Estates, 649 (21.6%) attend a private institution, while the remaining 2,357 (78.4%) are enrolled in public schools. The age group of 3 to 4 year olds has the highest likelihood of being enrolled in private schools, with 154 (88.0% in the age bracket) enrolled. Conversely, the age group of 15 to 17 year olds has the lowest likelihood of being enrolled in a private school, with 478 (95.8% in the age bracket) attending a public institution.
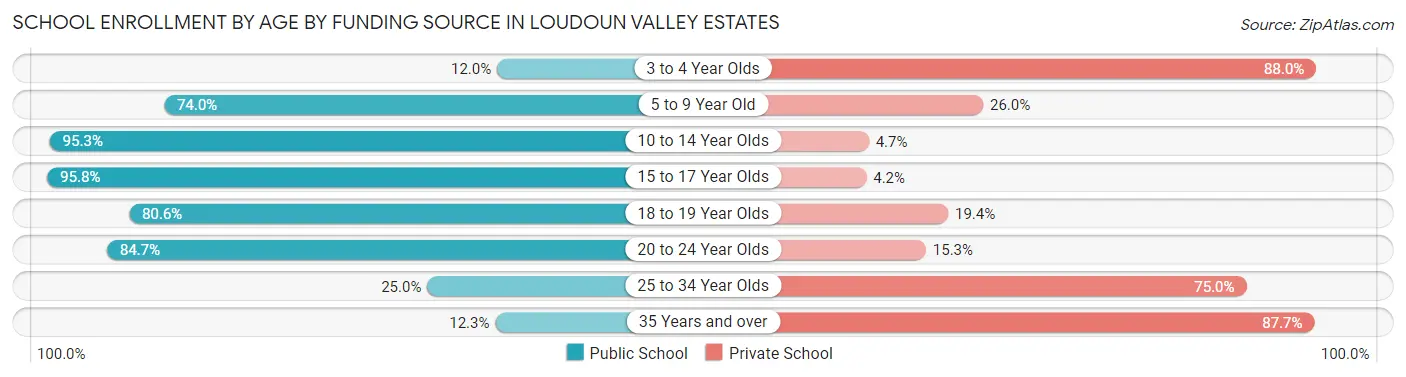
| Age Bracket | Public School | Private School |
| 3 to 4 Year Olds | 21 (12.0%) | 154 (88.0%) |
| 5 to 9 Year Old | 653 (74.0%) | 229 (26.0%) |
| 10 to 14 Year Olds | 918 (95.3%) | 45 (4.7%) |
| 15 to 17 Year Olds | 478 (95.8%) | 21 (4.2%) |
| 18 to 19 Year Olds | 87 (80.6%) | 21 (19.4%) |
| 20 to 24 Year Olds | 177 (84.7%) | 32 (15.3%) |
| 25 to 34 Year Olds | 6 (25.0%) | 18 (75.0%) |
| 35 Years and over | 18 (12.3%) | 128 (87.7%) |
| Total | 2,357 (78.4%) | 649 (21.6%) |
Educational Attainment by Field of Study in Loudoun Valley Estates
Business (1,388 | 23.8%), computers & mathematics (1,099 | 18.9%), engineering (1,073 | 18.4%), science & technology (659 | 11.3%), and social sciences (340 | 5.8%) are the most common fields of study among 5,819 individuals in Loudoun Valley Estates who have obtained a bachelor's degree or higher.
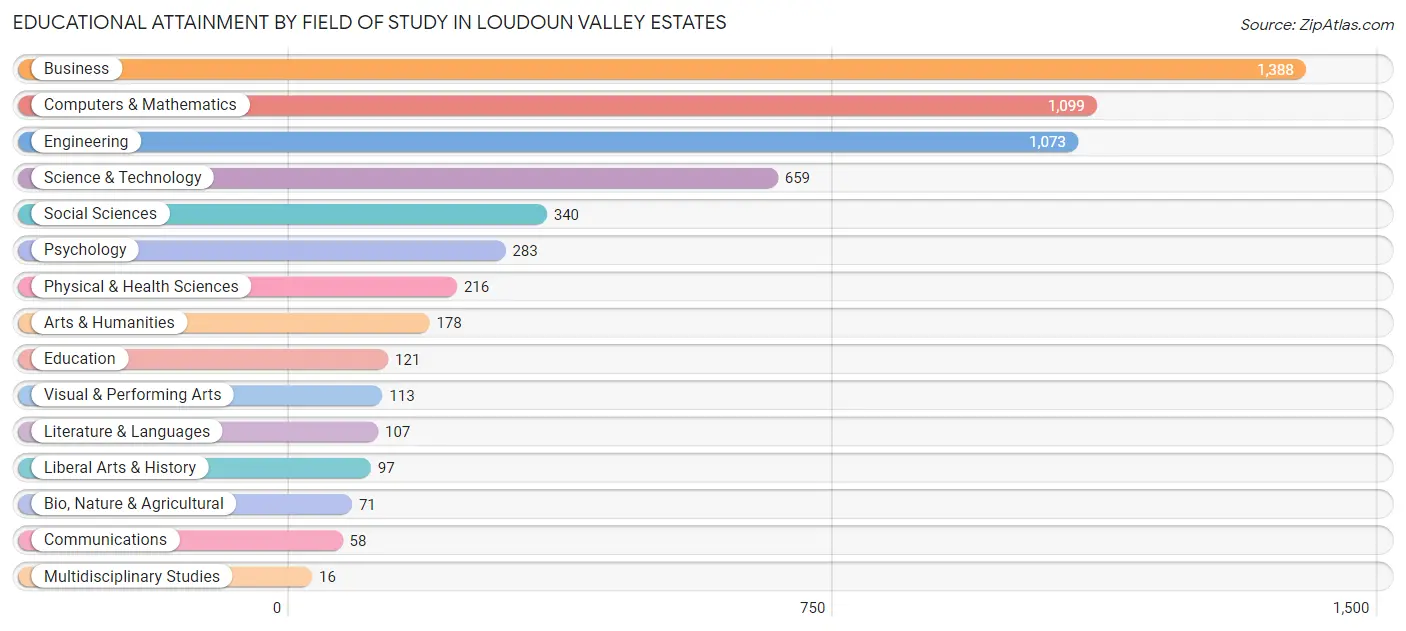
| Field of Study | # Graduates | % Graduates |
| Computers & Mathematics | 1,099 | 18.9% |
| Bio, Nature & Agricultural | 71 | 1.2% |
| Physical & Health Sciences | 216 | 3.7% |
| Psychology | 283 | 4.9% |
| Social Sciences | 340 | 5.8% |
| Engineering | 1,073 | 18.4% |
| Multidisciplinary Studies | 16 | 0.3% |
| Science & Technology | 659 | 11.3% |
| Business | 1,388 | 23.8% |
| Education | 121 | 2.1% |
| Literature & Languages | 107 | 1.8% |
| Liberal Arts & History | 97 | 1.7% |
| Visual & Performing Arts | 113 | 1.9% |
| Communications | 58 | 1.0% |
| Arts & Humanities | 178 | 3.1% |
| Total | 5,819 | 100.0% |
Transportation & Commute in Loudoun Valley Estates
Vehicle Availability by Sex in Loudoun Valley Estates
The most prevalent vehicle ownership categories in Loudoun Valley Estates are males with 2 vehicles (1,990, accounting for 59.9%) and females with 2 vehicles (1,480, making up 71.2%).
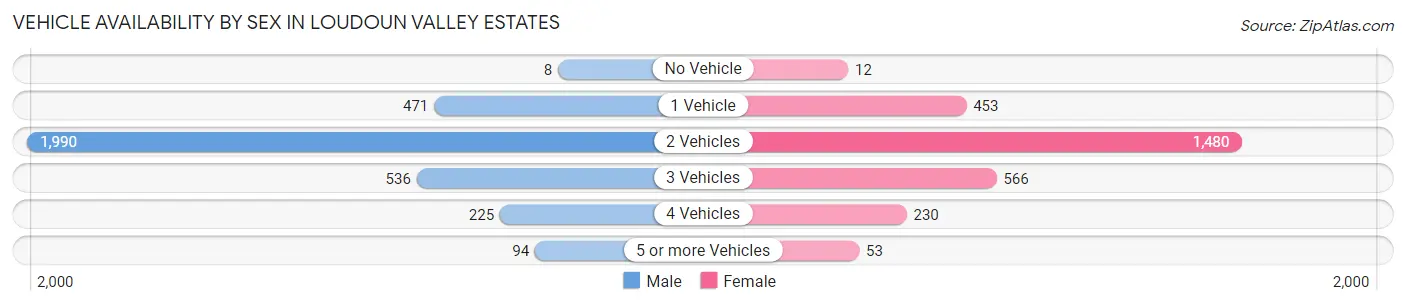
| Vehicles Available | Male | Female |
| No Vehicle | 8 (0.2%) | 12 (0.4%) |
| 1 Vehicle | 471 (14.2%) | 453 (16.2%) |
| 2 Vehicles | 1,990 (59.9%) | 1,480 (53.0%) |
| 3 Vehicles | 536 (16.1%) | 566 (20.3%) |
| 4 Vehicles | 225 (6.8%) | 230 (8.2%) |
| 5 or more Vehicles | 94 (2.8%) | 53 (1.9%) |
| Total | 3,324 (100.0%) | 2,794 (100.0%) |
Commute Time in Loudoun Valley Estates
The most frequently occuring commute durations in Loudoun Valley Estates are 60 to 89 minutes (851 commuters, 20.1%), 45 to 59 minutes (669 commuters, 15.8%), and 30 to 34 minutes (506 commuters, 11.9%).
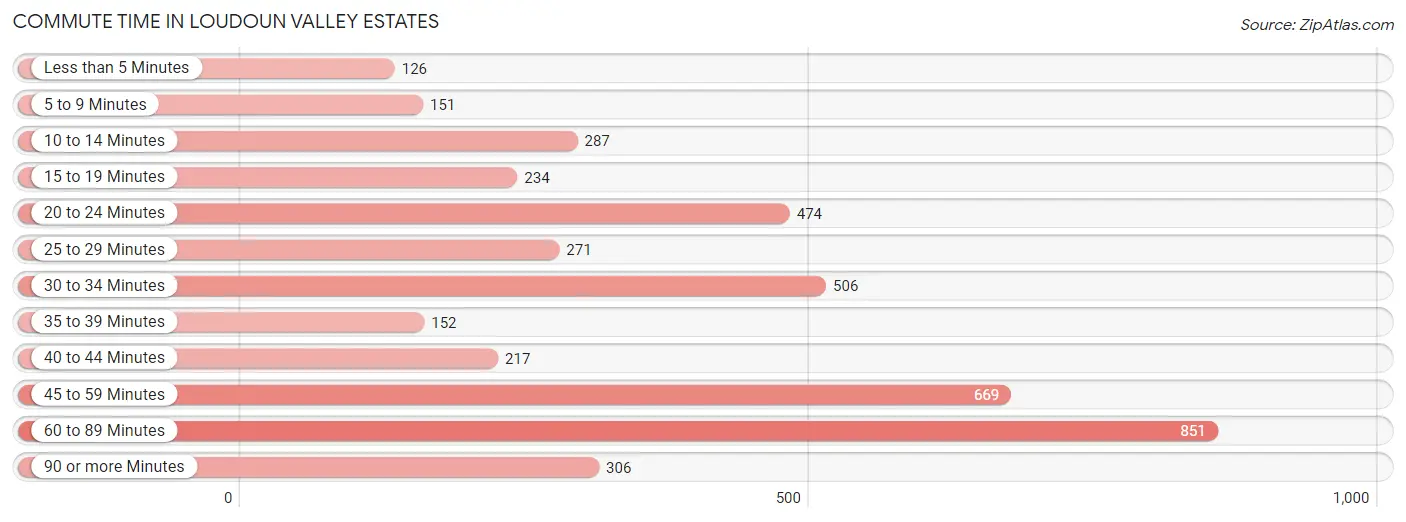
| Commute Time | # Commuters | % Commuters |
| Less than 5 Minutes | 126 | 3.0% |
| 5 to 9 Minutes | 151 | 3.6% |
| 10 to 14 Minutes | 287 | 6.8% |
| 15 to 19 Minutes | 234 | 5.5% |
| 20 to 24 Minutes | 474 | 11.2% |
| 25 to 29 Minutes | 271 | 6.4% |
| 30 to 34 Minutes | 506 | 11.9% |
| 35 to 39 Minutes | 152 | 3.6% |
| 40 to 44 Minutes | 217 | 5.1% |
| 45 to 59 Minutes | 669 | 15.8% |
| 60 to 89 Minutes | 851 | 20.1% |
| 90 or more Minutes | 306 | 7.2% |
Commute Time by Sex in Loudoun Valley Estates
The most common commute times in Loudoun Valley Estates are 60 to 89 minutes (416 commuters, 18.2%) for males and 60 to 89 minutes (435 commuters, 22.2%) for females.
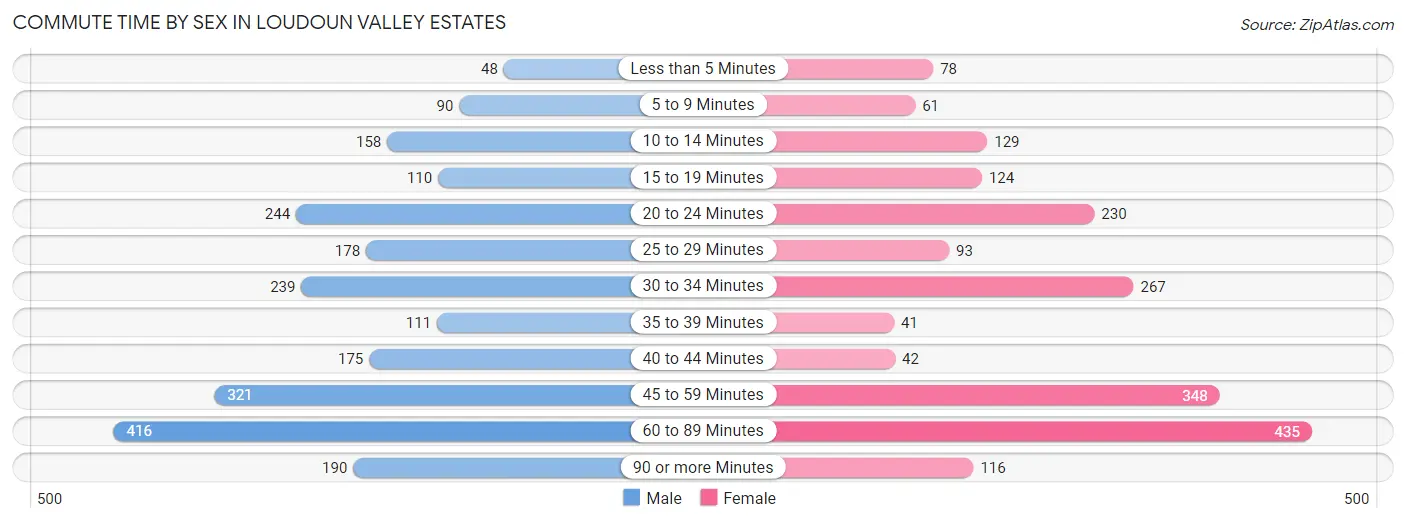
| Commute Time | Male | Female |
| Less than 5 Minutes | 48 (2.1%) | 78 (4.0%) |
| 5 to 9 Minutes | 90 (4.0%) | 61 (3.1%) |
| 10 to 14 Minutes | 158 (6.9%) | 129 (6.6%) |
| 15 to 19 Minutes | 110 (4.8%) | 124 (6.3%) |
| 20 to 24 Minutes | 244 (10.7%) | 230 (11.7%) |
| 25 to 29 Minutes | 178 (7.8%) | 93 (4.7%) |
| 30 to 34 Minutes | 239 (10.5%) | 267 (13.6%) |
| 35 to 39 Minutes | 111 (4.9%) | 41 (2.1%) |
| 40 to 44 Minutes | 175 (7.7%) | 42 (2.1%) |
| 45 to 59 Minutes | 321 (14.1%) | 348 (17.7%) |
| 60 to 89 Minutes | 416 (18.2%) | 435 (22.2%) |
| 90 or more Minutes | 190 (8.3%) | 116 (5.9%) |
Time of Departure to Work by Sex in Loudoun Valley Estates
The most frequent times of departure to work in Loudoun Valley Estates are 9:00 AM to 9:59 AM (386, 16.9%) for males and 9:00 AM to 9:59 AM (544, 27.7%) for females.
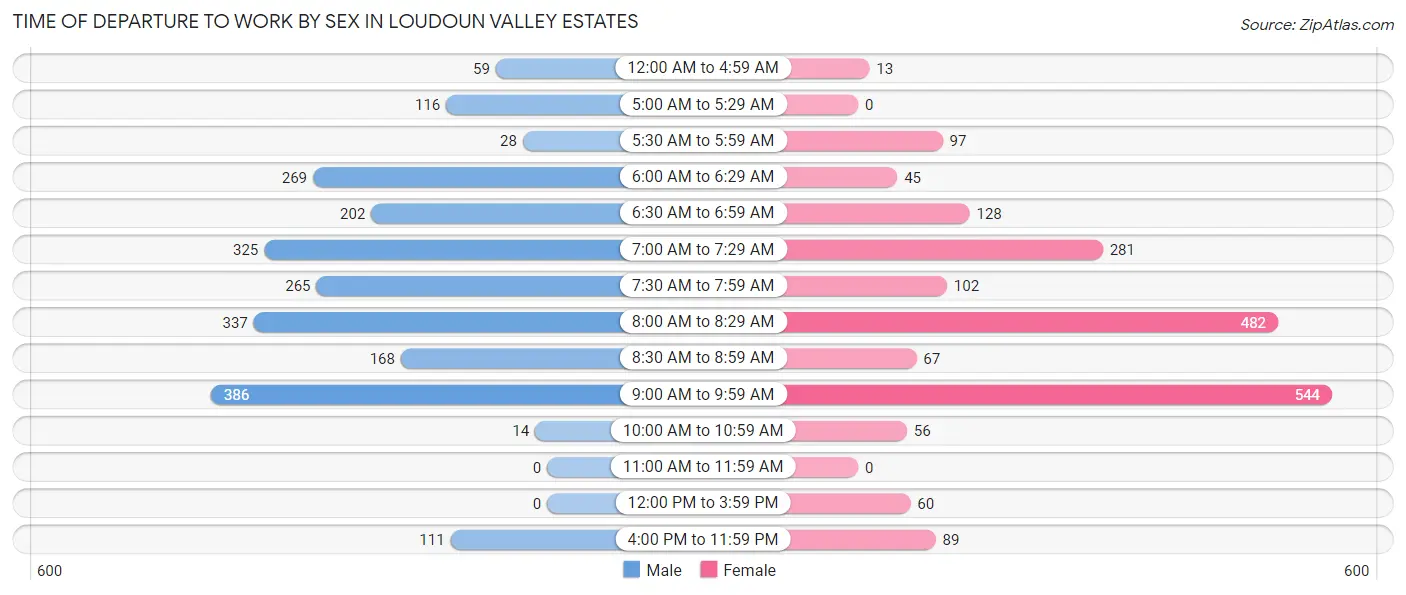
| Time of Departure | Male | Female |
| 12:00 AM to 4:59 AM | 59 (2.6%) | 13 (0.7%) |
| 5:00 AM to 5:29 AM | 116 (5.1%) | 0 (0.0%) |
| 5:30 AM to 5:59 AM | 28 (1.2%) | 97 (4.9%) |
| 6:00 AM to 6:29 AM | 269 (11.8%) | 45 (2.3%) |
| 6:30 AM to 6:59 AM | 202 (8.9%) | 128 (6.5%) |
| 7:00 AM to 7:29 AM | 325 (14.2%) | 281 (14.3%) |
| 7:30 AM to 7:59 AM | 265 (11.6%) | 102 (5.2%) |
| 8:00 AM to 8:29 AM | 337 (14.8%) | 482 (24.5%) |
| 8:30 AM to 8:59 AM | 168 (7.4%) | 67 (3.4%) |
| 9:00 AM to 9:59 AM | 386 (16.9%) | 544 (27.7%) |
| 10:00 AM to 10:59 AM | 14 (0.6%) | 56 (2.9%) |
| 11:00 AM to 11:59 AM | 0 (0.0%) | 0 (0.0%) |
| 12:00 PM to 3:59 PM | 0 (0.0%) | 60 (3.0%) |
| 4:00 PM to 11:59 PM | 111 (4.9%) | 89 (4.5%) |
| Total | 2,280 (100.0%) | 1,964 (100.0%) |
Housing Occupancy in Loudoun Valley Estates
Occupancy by Ownership in Loudoun Valley Estates
Of the total 3,504 dwellings in Loudoun Valley Estates, owner-occupied units account for 3,218 (91.8%), while renter-occupied units make up 286 (8.2%).
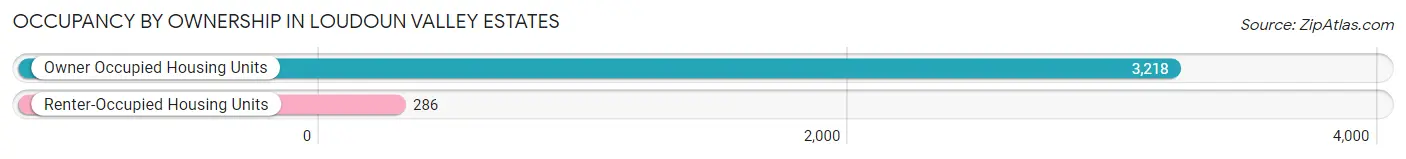
| Occupancy | # Housing Units | % Housing Units |
| Owner Occupied Housing Units | 3,218 | 91.8% |
| Renter-Occupied Housing Units | 286 | 8.2% |
| Total Occupied Housing Units | 3,504 | 100.0% |
Occupancy by Household Size in Loudoun Valley Estates
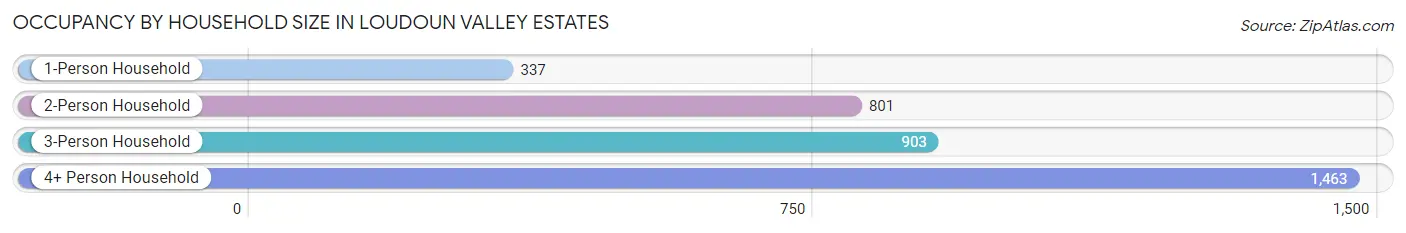
| Household Size | # Housing Units | % Housing Units |
| 1-Person Household | 337 | 9.6% |
| 2-Person Household | 801 | 22.9% |
| 3-Person Household | 903 | 25.8% |
| 4+ Person Household | 1,463 | 41.7% |
| Total Housing Units | 3,504 | 100.0% |
Occupancy by Ownership by Household Size in Loudoun Valley Estates
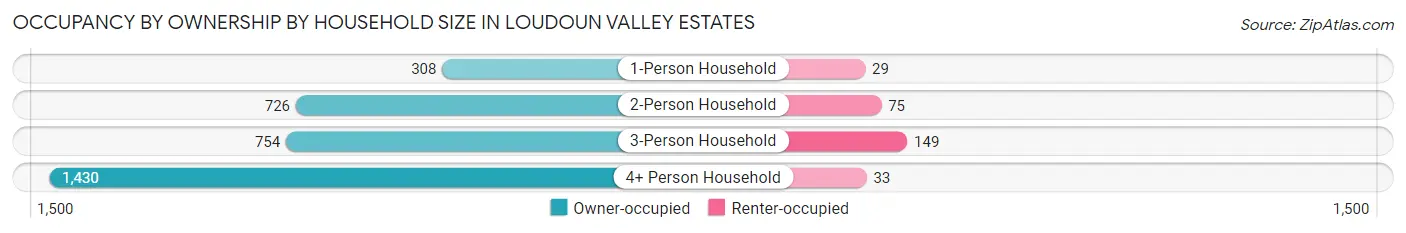
| Household Size | Owner-occupied | Renter-occupied |
| 1-Person Household | 308 (91.4%) | 29 (8.6%) |
| 2-Person Household | 726 (90.6%) | 75 (9.4%) |
| 3-Person Household | 754 (83.5%) | 149 (16.5%) |
| 4+ Person Household | 1,430 (97.7%) | 33 (2.3%) |
| Total Housing Units | 3,218 (91.8%) | 286 (8.2%) |
Occupancy by Educational Attainment in Loudoun Valley Estates
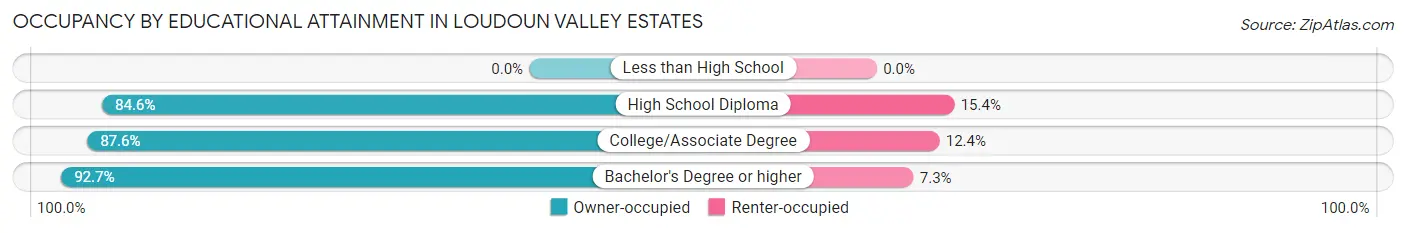
| Household Size | Owner-occupied | Renter-occupied |
| Less than High School | 0 (0.0%) | 0 (0.0%) |
| High School Diploma | 88 (84.6%) | 16 (15.4%) |
| College/Associate Degree | 388 (87.6%) | 55 (12.4%) |
| Bachelor's Degree or higher | 2,742 (92.7%) | 215 (7.3%) |
Occupancy by Age of Householder in Loudoun Valley Estates
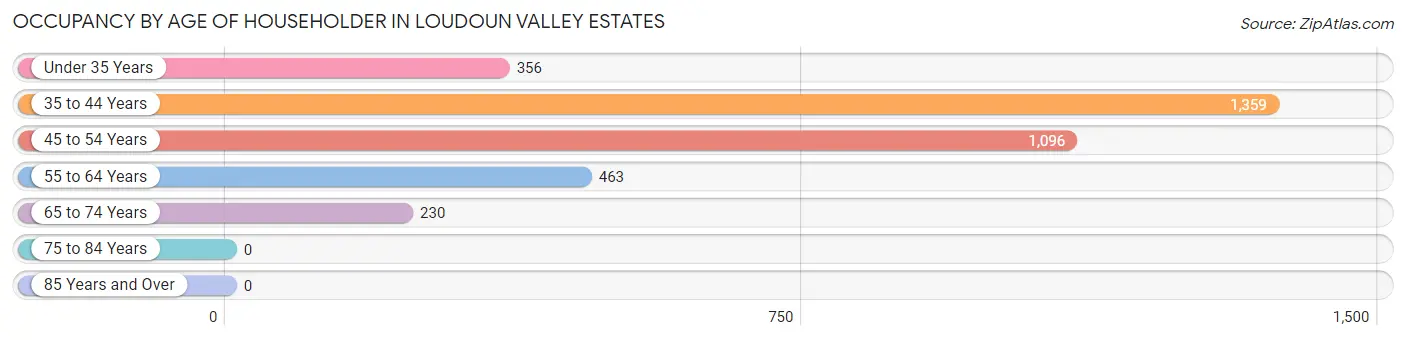
| Age Bracket | # Households | % Households |
| Under 35 Years | 356 | 10.2% |
| 35 to 44 Years | 1,359 | 38.8% |
| 45 to 54 Years | 1,096 | 31.3% |
| 55 to 64 Years | 463 | 13.2% |
| 65 to 74 Years | 230 | 6.6% |
| 75 to 84 Years | 0 | 0.0% |
| 85 Years and Over | 0 | 0.0% |
| Total | 3,504 | 100.0% |
Housing Finances in Loudoun Valley Estates
Median Income by Occupancy in Loudoun Valley Estates
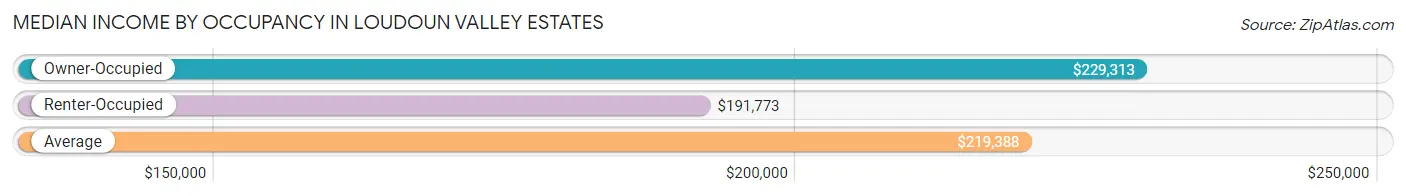
| Occupancy Type | # Households | Median Income |
| Owner-Occupied | 3,218 (91.8%) | $229,313 |
| Renter-Occupied | 286 (8.2%) | $191,773 |
| Average | 3,504 (100.0%) | $219,388 |
Occupancy by Householder Income Bracket in Loudoun Valley Estates
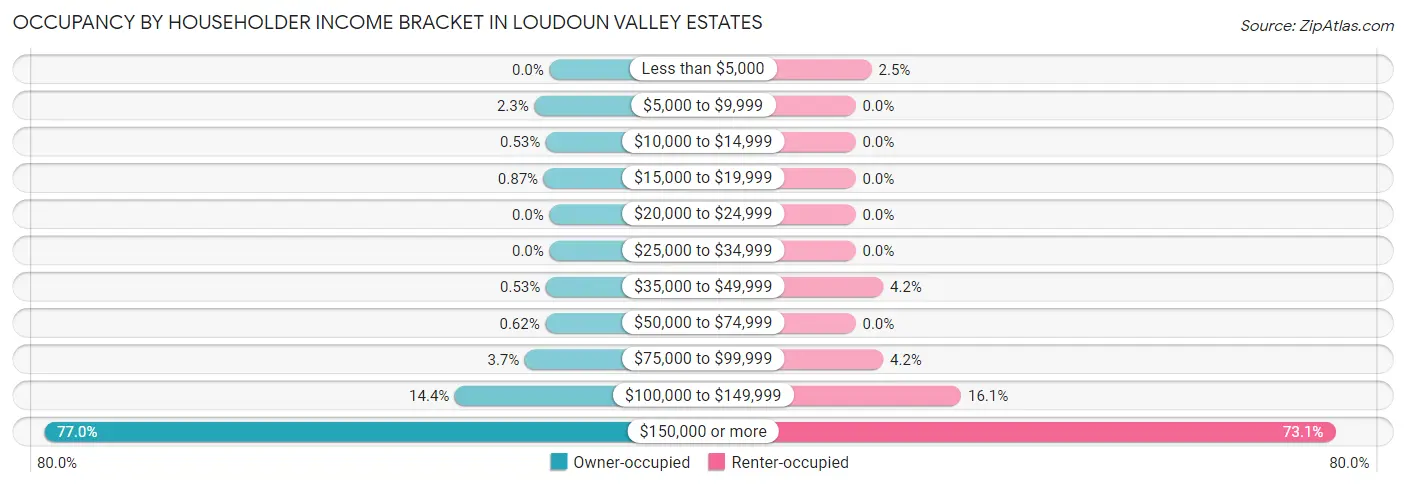
| Income Bracket | Owner-occupied | Renter-occupied |
| Less than $5,000 | 0 (0.0%) | 7 (2.5%) |
| $5,000 to $9,999 | 74 (2.3%) | 0 (0.0%) |
| $10,000 to $14,999 | 17 (0.5%) | 0 (0.0%) |
| $15,000 to $19,999 | 28 (0.9%) | 0 (0.0%) |
| $20,000 to $24,999 | 0 (0.0%) | 0 (0.0%) |
| $25,000 to $34,999 | 0 (0.0%) | 0 (0.0%) |
| $35,000 to $49,999 | 17 (0.5%) | 12 (4.2%) |
| $50,000 to $74,999 | 20 (0.6%) | 0 (0.0%) |
| $75,000 to $99,999 | 120 (3.7%) | 12 (4.2%) |
| $100,000 to $149,999 | 463 (14.4%) | 46 (16.1%) |
| $150,000 or more | 2,479 (77.0%) | 209 (73.1%) |
| Total | 3,218 (100.0%) | 286 (100.0%) |
Monthly Housing Cost Tiers in Loudoun Valley Estates
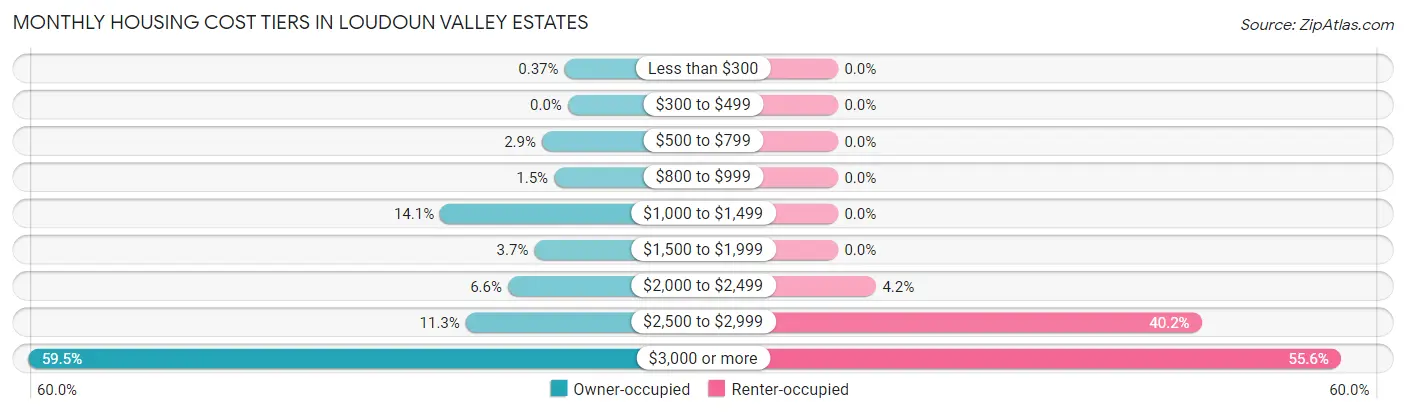
| Monthly Cost | Owner-occupied | Renter-occupied |
| Less than $300 | 12 (0.4%) | 0 (0.0%) |
| $300 to $499 | 0 (0.0%) | 0 (0.0%) |
| $500 to $799 | 92 (2.9%) | 0 (0.0%) |
| $800 to $999 | 49 (1.5%) | 0 (0.0%) |
| $1,000 to $1,499 | 454 (14.1%) | 0 (0.0%) |
| $1,500 to $1,999 | 119 (3.7%) | 0 (0.0%) |
| $2,000 to $2,499 | 213 (6.6%) | 12 (4.2%) |
| $2,500 to $2,999 | 363 (11.3%) | 115 (40.2%) |
| $3,000 or more | 1,916 (59.5%) | 159 (55.6%) |
| Total | 3,218 (100.0%) | 286 (100.0%) |
Physical Housing Characteristics in Loudoun Valley Estates
Housing Structures in Loudoun Valley Estates
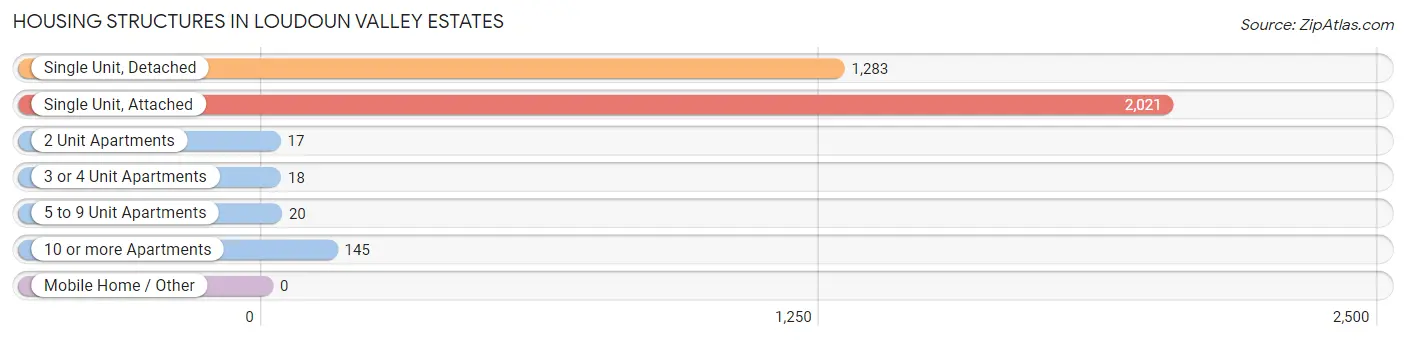
| Structure Type | # Housing Units | % Housing Units |
| Single Unit, Detached | 1,283 | 36.6% |
| Single Unit, Attached | 2,021 | 57.7% |
| 2 Unit Apartments | 17 | 0.5% |
| 3 or 4 Unit Apartments | 18 | 0.5% |
| 5 to 9 Unit Apartments | 20 | 0.6% |
| 10 or more Apartments | 145 | 4.1% |
| Mobile Home / Other | 0 | 0.0% |
| Total | 3,504 | 100.0% |
Housing Structures by Occupancy in Loudoun Valley Estates
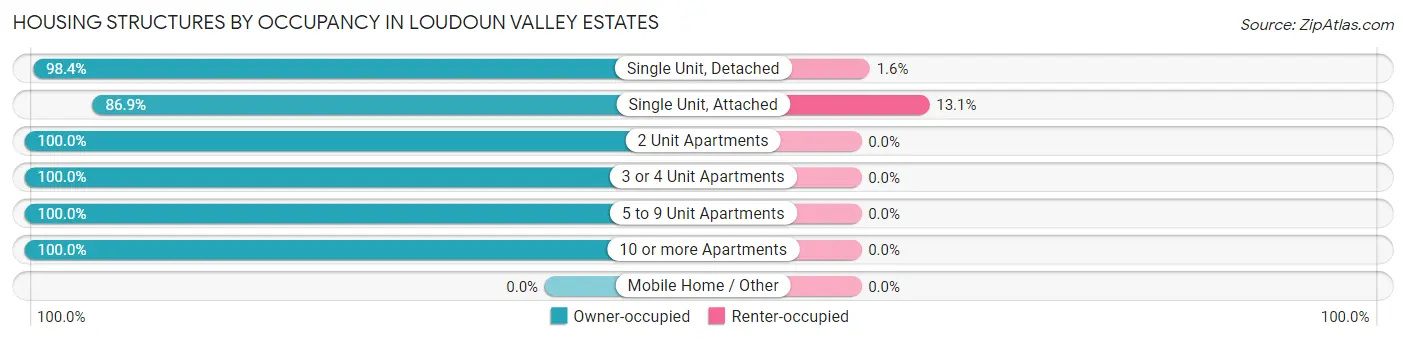
| Structure Type | Owner-occupied | Renter-occupied |
| Single Unit, Detached | 1,262 (98.4%) | 21 (1.6%) |
| Single Unit, Attached | 1,756 (86.9%) | 265 (13.1%) |
| 2 Unit Apartments | 17 (100.0%) | 0 (0.0%) |
| 3 or 4 Unit Apartments | 18 (100.0%) | 0 (0.0%) |
| 5 to 9 Unit Apartments | 20 (100.0%) | 0 (0.0%) |
| 10 or more Apartments | 145 (100.0%) | 0 (0.0%) |
| Mobile Home / Other | 0 (0.0%) | 0 (0.0%) |
| Total | 3,218 (91.8%) | 286 (8.2%) |
Housing Structures by Number of Rooms in Loudoun Valley Estates
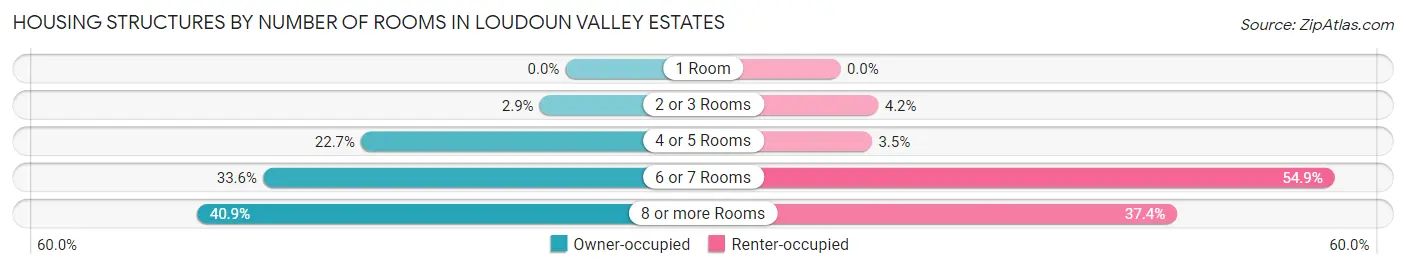
| Number of Rooms | Owner-occupied | Renter-occupied |
| 1 Room | 0 (0.0%) | 0 (0.0%) |
| 2 or 3 Rooms | 92 (2.9%) | 12 (4.2%) |
| 4 or 5 Rooms | 730 (22.7%) | 10 (3.5%) |
| 6 or 7 Rooms | 1,080 (33.6%) | 157 (54.9%) |
| 8 or more Rooms | 1,316 (40.9%) | 107 (37.4%) |
| Total | 3,218 (100.0%) | 286 (100.0%) |
Housing Structure by Heating Type in Loudoun Valley Estates
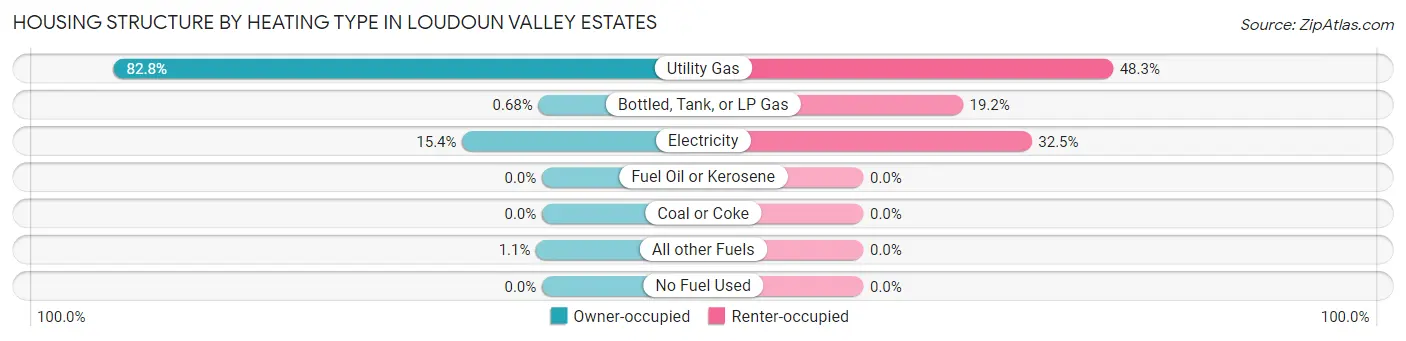
| Heating Type | Owner-occupied | Renter-occupied |
| Utility Gas | 2,664 (82.8%) | 138 (48.2%) |
| Bottled, Tank, or LP Gas | 22 (0.7%) | 55 (19.2%) |
| Electricity | 496 (15.4%) | 93 (32.5%) |
| Fuel Oil or Kerosene | 0 (0.0%) | 0 (0.0%) |
| Coal or Coke | 0 (0.0%) | 0 (0.0%) |
| All other Fuels | 36 (1.1%) | 0 (0.0%) |
| No Fuel Used | 0 (0.0%) | 0 (0.0%) |
| Total | 3,218 (100.0%) | 286 (100.0%) |
Household Vehicle Usage in Loudoun Valley Estates
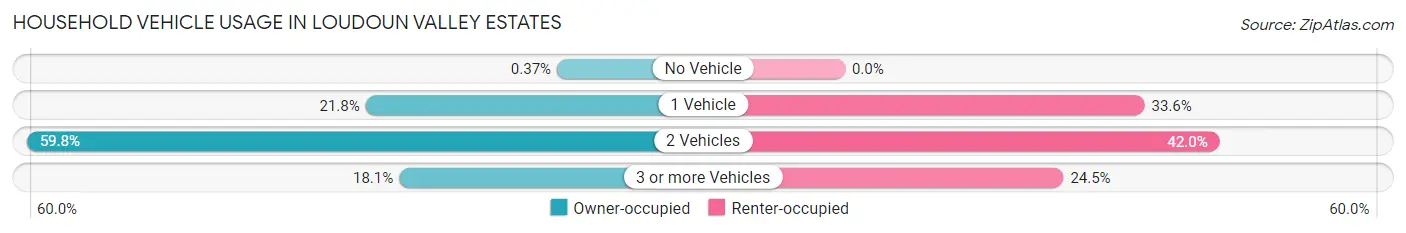
| Vehicles per Household | Owner-occupied | Renter-occupied |
| No Vehicle | 12 (0.4%) | 0 (0.0%) |
| 1 Vehicle | 702 (21.8%) | 96 (33.6%) |
| 2 Vehicles | 1,923 (59.8%) | 120 (42.0%) |
| 3 or more Vehicles | 581 (18.0%) | 70 (24.5%) |
| Total | 3,218 (100.0%) | 286 (100.0%) |
Real Estate & Mortgages in Loudoun Valley Estates
Real Estate and Mortgage Overview in Loudoun Valley Estates
| Characteristic | Without Mortgage | With Mortgage |
| Housing Units | 548 | 2,670 |
| Median Property Value | $742,600 | $714,700 |
| Median Household Income | $250,001 | $2,072 |
| Monthly Housing Costs | $1,103 | $1,916 |
| Real Estate Taxes | $7,666 | $21 |
Property Value by Mortgage Status in Loudoun Valley Estates
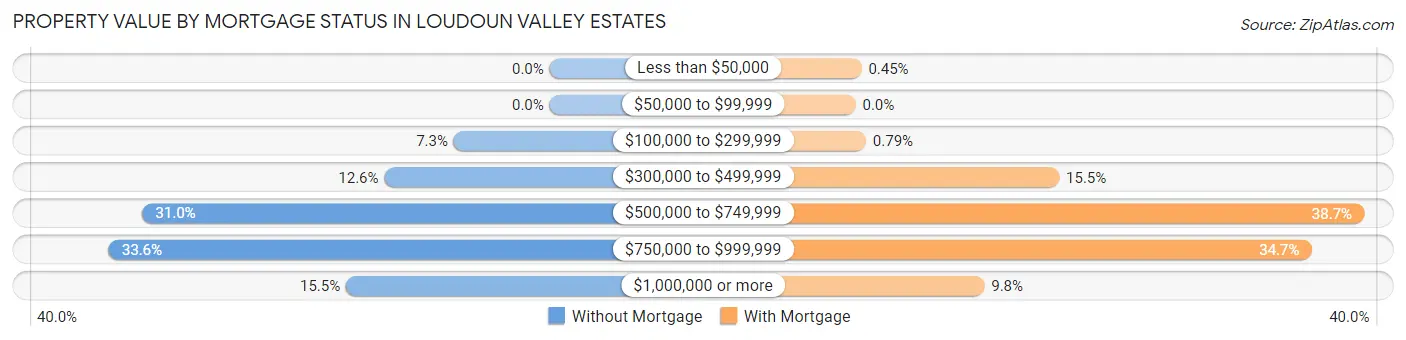
| Property Value | Without Mortgage | With Mortgage |
| Less than $50,000 | 0 (0.0%) | 12 (0.4%) |
| $50,000 to $99,999 | 0 (0.0%) | 0 (0.0%) |
| $100,000 to $299,999 | 40 (7.3%) | 21 (0.8%) |
| $300,000 to $499,999 | 69 (12.6%) | 414 (15.5%) |
| $500,000 to $749,999 | 170 (31.0%) | 1,034 (38.7%) |
| $750,000 to $999,999 | 184 (33.6%) | 927 (34.7%) |
| $1,000,000 or more | 85 (15.5%) | 262 (9.8%) |
| Total | 548 (100.0%) | 2,670 (100.0%) |
Household Income by Mortgage Status in Loudoun Valley Estates
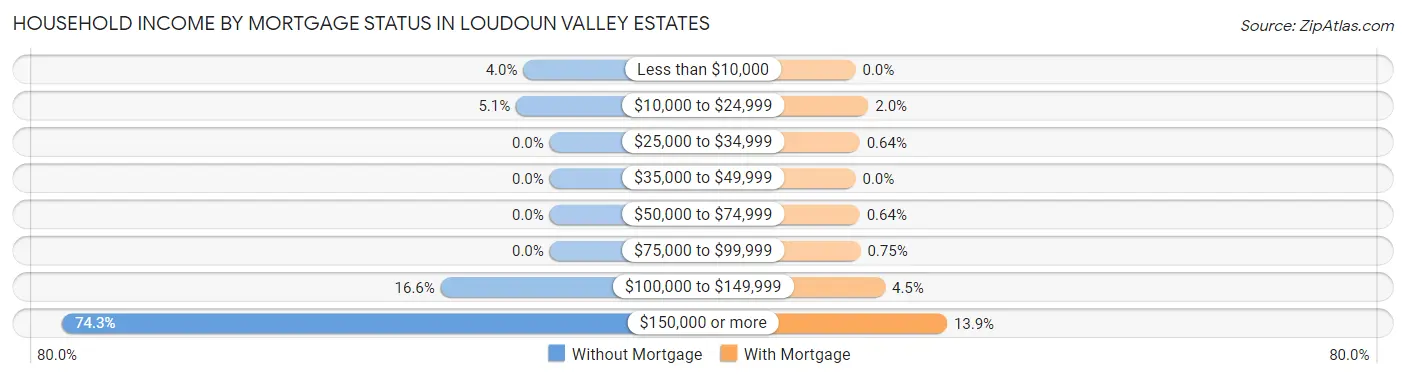
| Household Income | Without Mortgage | With Mortgage |
| Less than $10,000 | 22 (4.0%) | 0 (0.0%) |
| $10,000 to $24,999 | 28 (5.1%) | 52 (1.9%) |
| $25,000 to $34,999 | 0 (0.0%) | 17 (0.6%) |
| $35,000 to $49,999 | 0 (0.0%) | 0 (0.0%) |
| $50,000 to $74,999 | 0 (0.0%) | 17 (0.6%) |
| $75,000 to $99,999 | 0 (0.0%) | 20 (0.7%) |
| $100,000 to $149,999 | 91 (16.6%) | 120 (4.5%) |
| $150,000 or more | 407 (74.3%) | 372 (13.9%) |
| Total | 548 (100.0%) | 2,670 (100.0%) |
Property Value to Household Income Ratio in Loudoun Valley Estates
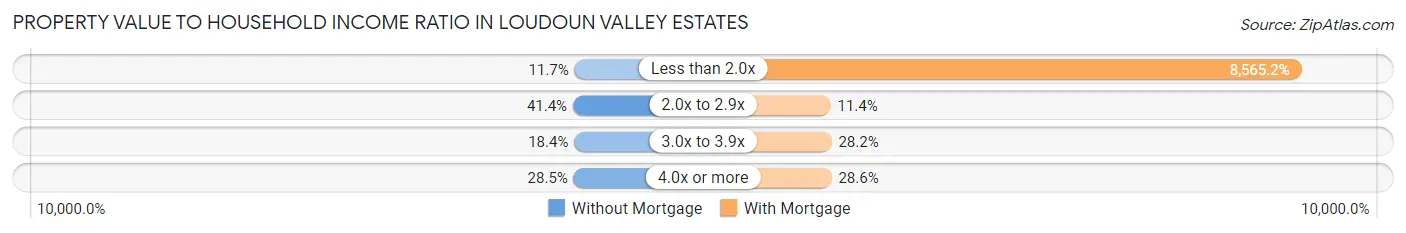
| Value-to-Income Ratio | Without Mortgage | With Mortgage |
| Less than 2.0x | 64 (11.7%) | 228,690 (8,565.2%) |
| 2.0x to 2.9x | 227 (41.4%) | 304 (11.4%) |
| 3.0x to 3.9x | 101 (18.4%) | 753 (28.2%) |
| 4.0x or more | 156 (28.5%) | 763 (28.6%) |
| Total | 548 (100.0%) | 2,670 (100.0%) |
Real Estate Taxes by Mortgage Status in Loudoun Valley Estates

| Property Taxes | Without Mortgage | With Mortgage |
| Less than $800 | 0 (0.0%) | 0 (0.0%) |
| $800 to $1,499 | 40 (7.3%) | 43 (1.6%) |
| $800 to $1,499 | 480 (87.6%) | 0 (0.0%) |
| Total | 548 (100.0%) | 2,670 (100.0%) |
Health & Disability in Loudoun Valley Estates
Health Insurance Coverage by Age in Loudoun Valley Estates
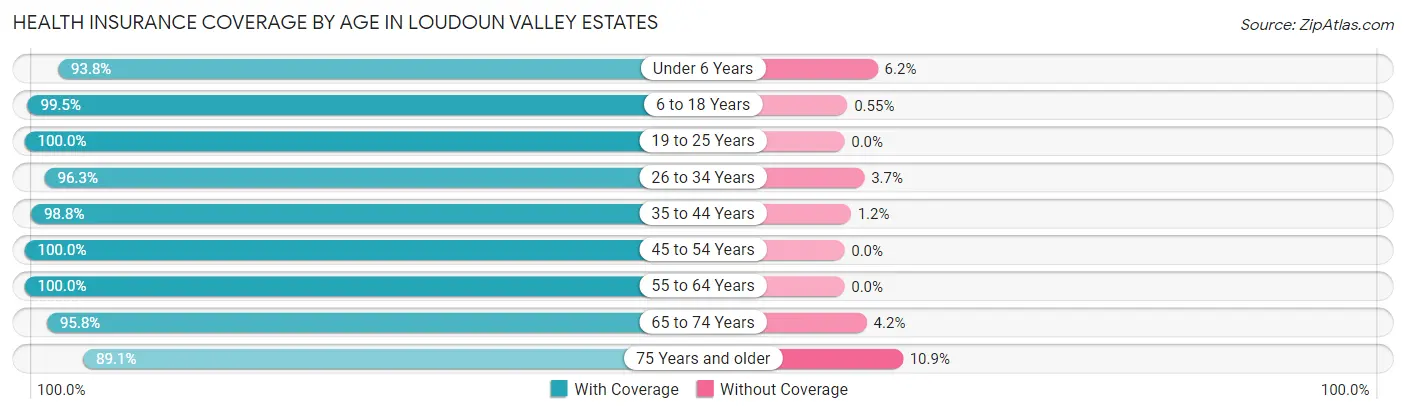
| Age Bracket | With Coverage | Without Coverage |
| Under 6 Years | 648 (93.8%) | 43 (6.2%) |
| 6 to 18 Years | 2,332 (99.5%) | 13 (0.5%) |
| 19 to 25 Years | 679 (100.0%) | 0 (0.0%) |
| 26 to 34 Years | 776 (96.3%) | 30 (3.7%) |
| 35 to 44 Years | 2,472 (98.8%) | 30 (1.2%) |
| 45 to 54 Years | 1,985 (100.0%) | 0 (0.0%) |
| 55 to 64 Years | 918 (100.0%) | 0 (0.0%) |
| 65 to 74 Years | 414 (95.8%) | 18 (4.2%) |
| 75 Years and older | 139 (89.1%) | 17 (10.9%) |
| Total | 10,363 (98.6%) | 151 (1.4%) |
Health Insurance Coverage by Citizenship Status in Loudoun Valley Estates

| Citizenship Status | With Coverage | Without Coverage |
| Native Born | 648 (93.8%) | 43 (6.2%) |
| Foreign Born, Citizen | 2,332 (99.5%) | 13 (0.5%) |
| Foreign Born, not a Citizen | 679 (100.0%) | 0 (0.0%) |
Health Insurance Coverage by Household Income in Loudoun Valley Estates
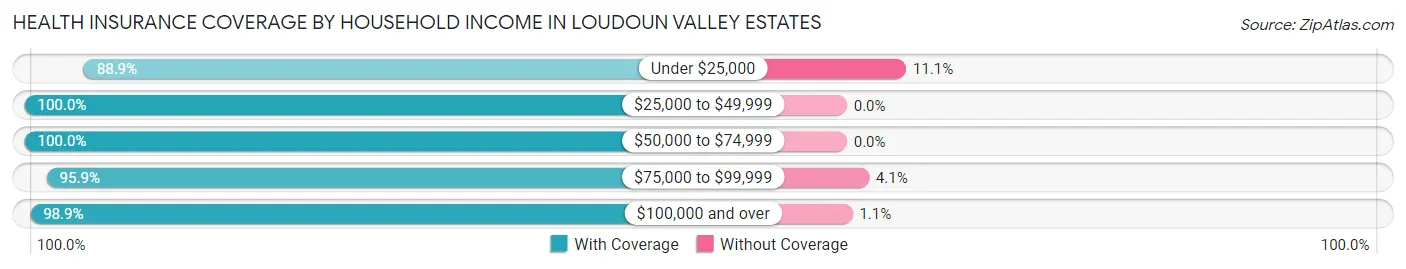
| Household Income | With Coverage | Without Coverage |
| Under $25,000 | 272 (88.9%) | 34 (11.1%) |
| $25,000 to $49,999 | 74 (100.0%) | 0 (0.0%) |
| $50,000 to $74,999 | 30 (100.0%) | 0 (0.0%) |
| $75,000 to $99,999 | 301 (95.9%) | 13 (4.1%) |
| $100,000 and over | 9,686 (98.9%) | 104 (1.1%) |
Public vs Private Health Insurance Coverage by Age in Loudoun Valley Estates
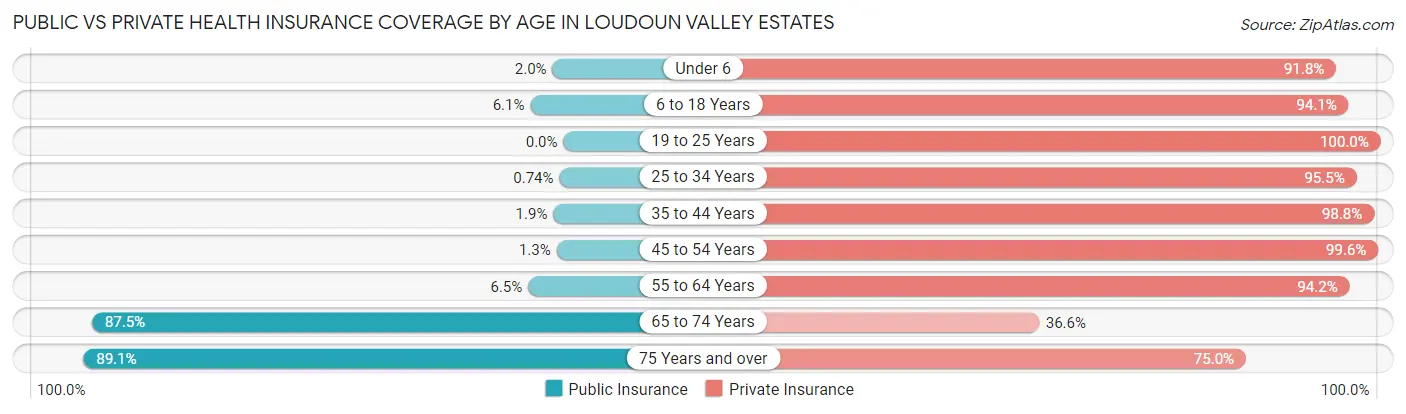
| Age Bracket | Public Insurance | Private Insurance |
| Under 6 | 14 (2.0%) | 634 (91.7%) |
| 6 to 18 Years | 144 (6.1%) | 2,206 (94.1%) |
| 19 to 25 Years | 0 (0.0%) | 679 (100.0%) |
| 25 to 34 Years | 6 (0.7%) | 770 (95.5%) |
| 35 to 44 Years | 47 (1.9%) | 2,472 (98.8%) |
| 45 to 54 Years | 25 (1.3%) | 1,976 (99.6%) |
| 55 to 64 Years | 60 (6.5%) | 865 (94.2%) |
| 65 to 74 Years | 378 (87.5%) | 158 (36.6%) |
| 75 Years and over | 139 (89.1%) | 117 (75.0%) |
| Total | 813 (7.7%) | 9,877 (93.9%) |
Disability Status by Sex by Age in Loudoun Valley Estates
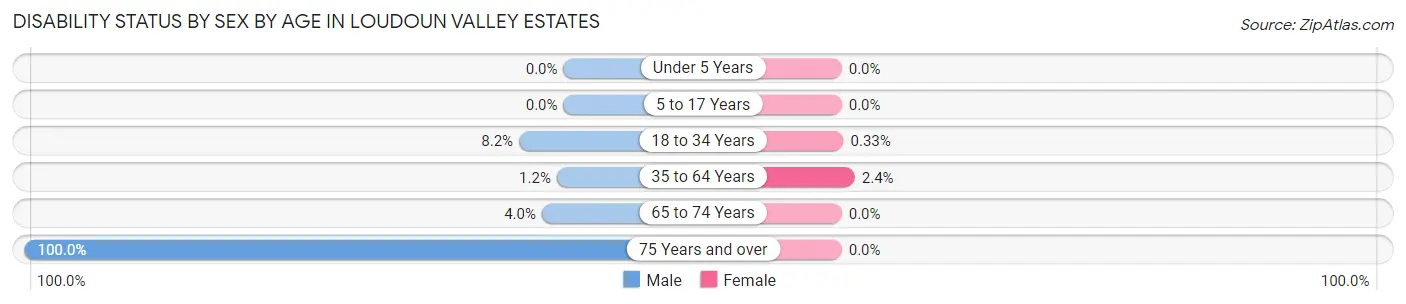
| Age Bracket | Male | Female |
| Under 5 Years | 0 (0.0%) | 0 (0.0%) |
| 5 to 17 Years | 0 (0.0%) | 0 (0.0%) |
| 18 to 34 Years | 54 (8.2%) | 3 (0.3%) |
| 35 to 64 Years | 35 (1.2%) | 62 (2.4%) |
| 65 to 74 Years | 9 (4.0%) | 0 (0.0%) |
| 75 Years and over | 135 (100.0%) | 0 (0.0%) |
Disability Class by Sex by Age in Loudoun Valley Estates
Disability Class: Hearing Difficulty
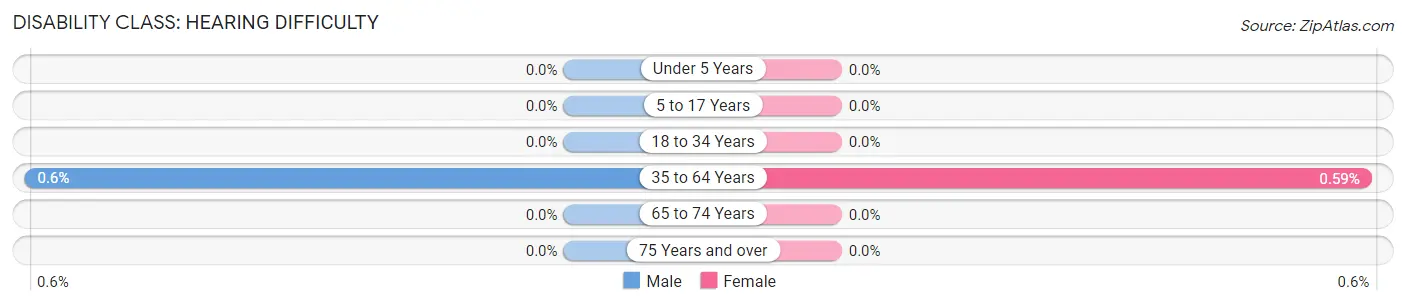
| Age Bracket | Male | Female |
| Under 5 Years | 0 (0.0%) | 0 (0.0%) |
| 5 to 17 Years | 0 (0.0%) | 0 (0.0%) |
| 18 to 34 Years | 0 (0.0%) | 0 (0.0%) |
| 35 to 64 Years | 17 (0.6%) | 15 (0.6%) |
| 65 to 74 Years | 0 (0.0%) | 0 (0.0%) |
| 75 Years and over | 0 (0.0%) | 0 (0.0%) |
Disability Class: Vision Difficulty
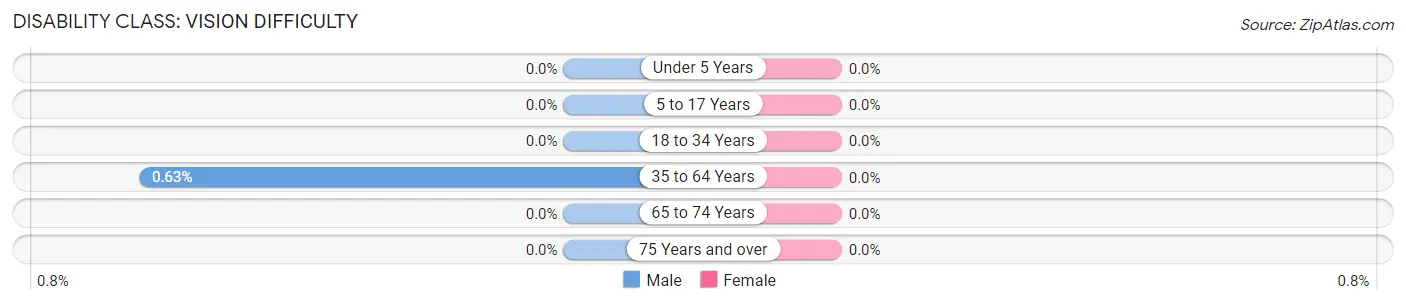
| Age Bracket | Male | Female |
| Under 5 Years | 0 (0.0%) | 0 (0.0%) |
| 5 to 17 Years | 0 (0.0%) | 0 (0.0%) |
| 18 to 34 Years | 0 (0.0%) | 0 (0.0%) |
| 35 to 64 Years | 18 (0.6%) | 0 (0.0%) |
| 65 to 74 Years | 0 (0.0%) | 0 (0.0%) |
| 75 Years and over | 0 (0.0%) | 0 (0.0%) |
Disability Class: Cognitive Difficulty
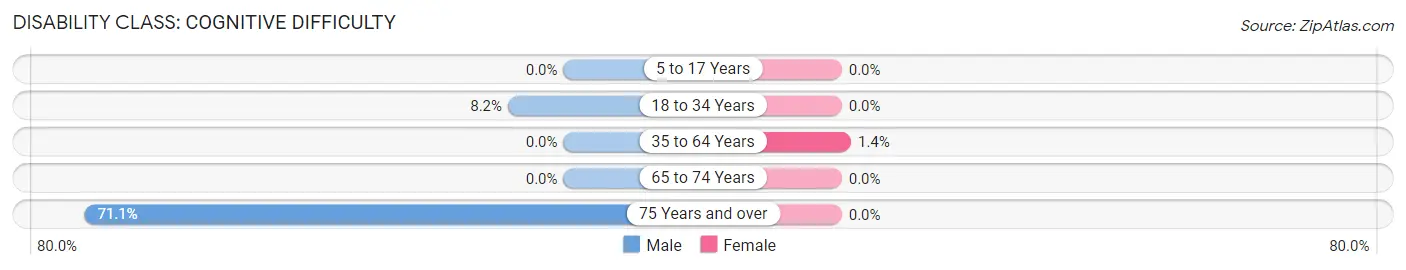
| Age Bracket | Male | Female |
| 5 to 17 Years | 0 (0.0%) | 0 (0.0%) |
| 18 to 34 Years | 54 (8.2%) | 0 (0.0%) |
| 35 to 64 Years | 0 (0.0%) | 35 (1.4%) |
| 65 to 74 Years | 0 (0.0%) | 0 (0.0%) |
| 75 Years and over | 96 (71.1%) | 0 (0.0%) |
Disability Class: Ambulatory Difficulty
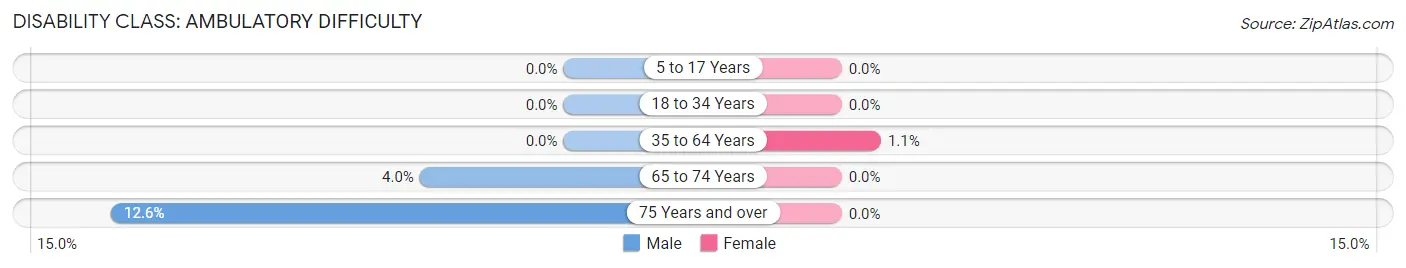
| Age Bracket | Male | Female |
| 5 to 17 Years | 0 (0.0%) | 0 (0.0%) |
| 18 to 34 Years | 0 (0.0%) | 0 (0.0%) |
| 35 to 64 Years | 0 (0.0%) | 28 (1.1%) |
| 65 to 74 Years | 9 (4.0%) | 0 (0.0%) |
| 75 Years and over | 17 (12.6%) | 0 (0.0%) |
Disability Class: Self-Care Difficulty
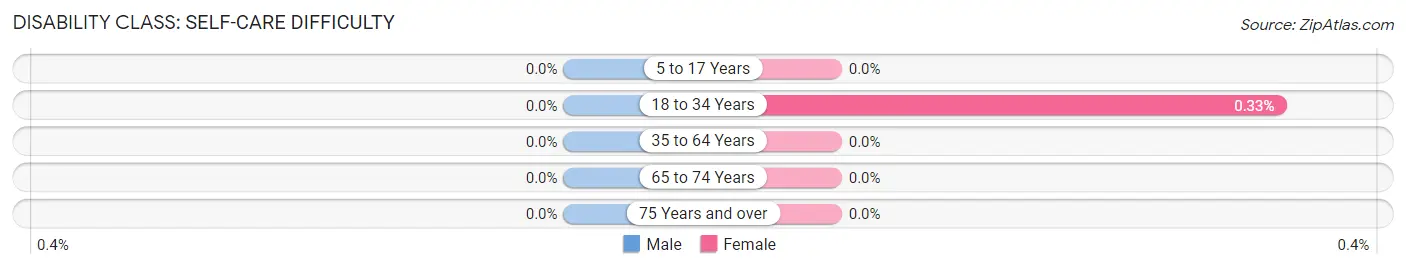
| Age Bracket | Male | Female |
| 5 to 17 Years | 0 (0.0%) | 0 (0.0%) |
| 18 to 34 Years | 0 (0.0%) | 3 (0.3%) |
| 35 to 64 Years | 0 (0.0%) | 0 (0.0%) |
| 65 to 74 Years | 0 (0.0%) | 0 (0.0%) |
| 75 Years and over | 0 (0.0%) | 0 (0.0%) |
Technology Access in Loudoun Valley Estates
Computing Device Access in Loudoun Valley Estates
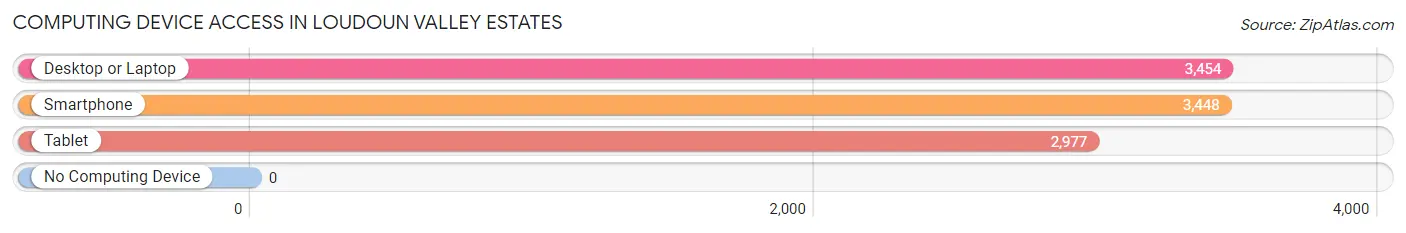
| Device Type | # Households | % Households |
| Desktop or Laptop | 3,454 | 98.6% |
| Smartphone | 3,448 | 98.4% |
| Tablet | 2,977 | 85.0% |
| No Computing Device | 0 | 0.0% |
| Total | 3,504 | 100.0% |
Internet Access in Loudoun Valley Estates
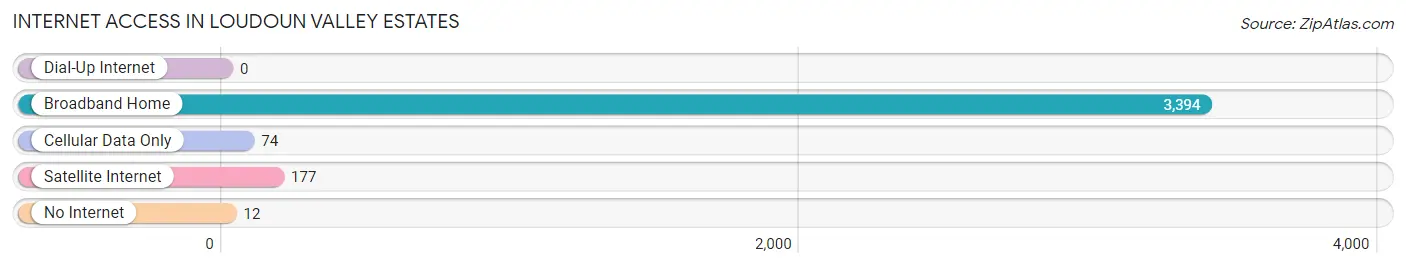
| Internet Type | # Households | % Households |
| Dial-Up Internet | 0 | 0.0% |
| Broadband Home | 3,394 | 96.9% |
| Cellular Data Only | 74 | 2.1% |
| Satellite Internet | 177 | 5.1% |
| No Internet | 12 | 0.3% |
| Total | 3,504 | 100.0% |
Loudoun Valley Estates Summary
Loudoun Valley Estates is a census-designated place (CDP) located in Loudoun County, Virginia. It is situated in the foothills of the Blue Ridge Mountains, approximately 30 miles northwest of Washington, D.C. The CDP has a population of approximately 4,000 people and covers an area of 4.2 square miles.
Geography
Loudoun Valley Estates is located in the foothills of the Blue Ridge Mountains, approximately 30 miles northwest of Washington, D.C. The CDP is situated in the eastern part of Loudoun County, near the town of Purcellville. The terrain is mostly rolling hills, with some flat areas. The area is characterized by its rural setting, with many farms and open spaces. The climate is temperate, with hot summers and cold winters.
The CDP is bordered by the towns of Purcellville and Round Hill to the north, and the towns of Hamilton and Waterford to the south. The CDP is also bordered by the Blue Ridge Mountains to the east and the Catoctin Mountains to the west.
History
Loudoun Valley Estates was first settled in the late 1700s by German and English immigrants. The area was originally known as “Valley View” and was part of the original land grant given to George Washington in 1760. The area was primarily used for farming and was home to several small villages.
In the early 1900s, the area began to experience rapid growth due to the development of the Washington and Old Dominion Railroad. The railroad provided easy access to Washington, D.C. and other nearby cities. This led to the development of several small towns in the area, including Purcellville, Round Hill, Hamilton, and Waterford.
In the 1950s, the area began to experience a population boom due to the development of the Dulles International Airport. This led to the development of several new residential communities, including Loudoun Valley Estates. The community was developed in the late 1950s and early 1960s and was designed to provide affordable housing for families.
Economy
Loudoun Valley Estates is primarily a residential community, with most of its residents employed in nearby towns and cities. The area is home to several small businesses, including restaurants, retail stores, and professional services. The area is also home to several wineries and vineyards, which attract tourists from all over the world.
The area is also home to several large employers, including the Dulles International Airport, which is located just a few miles away. The airport is the largest employer in the area, providing jobs for thousands of people. Other major employers in the area include the Loudoun County Public Schools, the Loudoun County Government, and the Washington and Old Dominion Railroad.
Demographics
As of the 2010 census, the population of Loudoun Valley Estates was 4,000. The population is primarily white (90.2%), with a small percentage of African Americans (3.2%), Asians (2.2%), and Hispanics (2.2%). The median household income is $107,000, and the median home value is $400,000.
The area is home to several churches, including the Purcellville United Methodist Church, the Round Hill Baptist Church, and the Hamilton Presbyterian Church. The area is also home to several schools, including the Loudoun Valley High School, the Round Hill Elementary School, and the Hamilton Middle School.
Conclusion
Loudoun Valley Estates is a census-designated place located in Loudoun County, Virginia. It is situated in the foothills of the Blue Ridge Mountains, approximately 30 miles northwest of Washington, D.C. The CDP has a population of approximately 4,000 people and covers an area of 4.2 square miles. The area is characterized by its rural setting, with many farms and open spaces. The economy is primarily based on residential development, with several small businesses and large employers located in the area. The population is primarily white, with a small percentage of African Americans, Asians, and Hispanics. The area is home to several churches and schools, and is a popular tourist destination due to its proximity to the Dulles International Airport and the nearby wineries and vineyards.
Common Questions
What is Per Capita Income in Loudoun Valley Estates?
Per Capita income in Loudoun Valley Estates is $76,259.
What is the Median Family Income in Loudoun Valley Estates?
Median Family Income in Loudoun Valley Estates is $233,750.
What is the Median Household income in Loudoun Valley Estates?
Median Household Income in Loudoun Valley Estates is $219,388.
What is Income or Wage Gap in Loudoun Valley Estates?
Income or Wage Gap in Loudoun Valley Estates is 39.0%.
Women in Loudoun Valley Estates earn 61.0 cents for every dollar earned by a man.
What is Inequality or Gini Index in Loudoun Valley Estates?
Inequality or Gini Index in Loudoun Valley Estates is 0.28.
What is the Total Population of Loudoun Valley Estates?
Total Population of Loudoun Valley Estates is 10,514.
What is the Total Male Population of Loudoun Valley Estates?
Total Male Population of Loudoun Valley Estates is 5,209.
What is the Total Female Population of Loudoun Valley Estates?
Total Female Population of Loudoun Valley Estates is 5,305.
What is the Ratio of Males per 100 Females in Loudoun Valley Estates?
There are 98.19 Males per 100 Females in Loudoun Valley Estates.
What is the Ratio of Females per 100 Males in Loudoun Valley Estates?
There are 101.84 Females per 100 Males in Loudoun Valley Estates.
What is the Median Population Age in Loudoun Valley Estates?
Median Population Age in Loudoun Valley Estates is 37.9 Years.
What is the Average Family Size in Loudoun Valley Estates
Average Family Size in Loudoun Valley Estates is 3.2 People.
What is the Average Household Size in Loudoun Valley Estates
Average Household Size in Loudoun Valley Estates is 3.0 People.
How Large is the Labor Force in Loudoun Valley Estates?
There are 6,248 People in the Labor Forcein in Loudoun Valley Estates.
What is the Percentage of People in the Labor Force in Loudoun Valley Estates?
79.4% of People are in the Labor Force in Loudoun Valley Estates.
What is the Unemployment Rate in Loudoun Valley Estates?
Unemployment Rate in Loudoun Valley Estates is 1.5%.