New Baltimore, VA Map & Demographics
New Baltimore Map
New Baltimore Overview
$61,454
PER CAPITA INCOME
$176,467
AVG FAMILY INCOME
$167,727
AVG HOUSEHOLD INCOME
41.5%
WAGE / INCOME GAP [ % ]
58.5¢/ $1
WAGE / INCOME GAP [ $ ]
0.31
INEQUALITY / GINI INDEX
11,743
TOTAL POPULATION
6,230
MALE POPULATION
5,513
FEMALE POPULATION
113.01
MALES / 100 FEMALES
88.49
FEMALES / 100 MALES
39.0
MEDIAN AGE
3.5
AVG FAMILY SIZE
3.2
AVG HOUSEHOLD SIZE
6,144
LABOR FORCE [ PEOPLE ]
67.0%
PERCENT IN LABOR FORCE
1.5%
UNEMPLOYMENT RATE
New Baltimore Area Codes
Income in New Baltimore
Income Overview in New Baltimore
Per Capita Income in New Baltimore is $61,454, while median incomes of families and households are $176,467 and $167,727 respectively.
| Characteristic | Number | Measure |
| Per Capita Income | 11,743 | $61,454 |
| Median Family Income | 3,168 | $176,467 |
| Mean Family Income | 3,168 | $200,585 |
| Median Household Income | 3,698 | $167,727 |
| Mean Household Income | 3,698 | $192,160 |
| Income Deficit | 3,168 | $0 |
| Wage / Income Gap (%) | 11,743 | 41.47% |
| Wage / Income Gap ($) | 11,743 | 58.53¢ per $1 |
| Gini / Inequality Index | 11,743 | 0.31 |
Earnings by Sex in New Baltimore
Average Earnings in New Baltimore are $72,022, $94,429 for men and $55,272 for women, a difference of 41.5%.
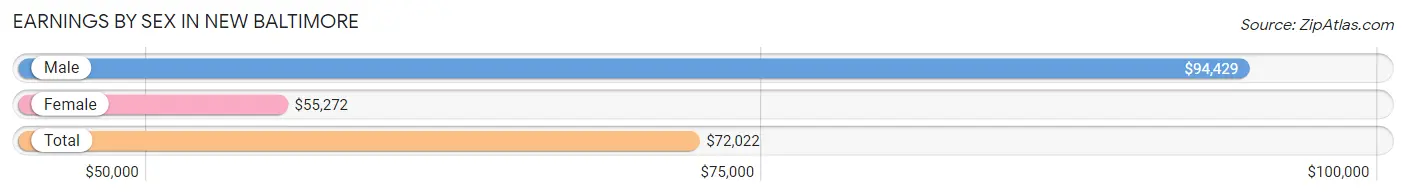
| Sex | Number | Average Earnings |
| Male | 3,587 (53.7%) | $94,429 |
| Female | 3,094 (46.3%) | $55,272 |
| Total | 6,681 (100.0%) | $72,022 |
Earnings by Sex by Income Bracket in New Baltimore
The most common earnings brackets in New Baltimore are $100,000+ for men (1,706 | 47.6%) and $100,000+ for women (824 | 26.6%).
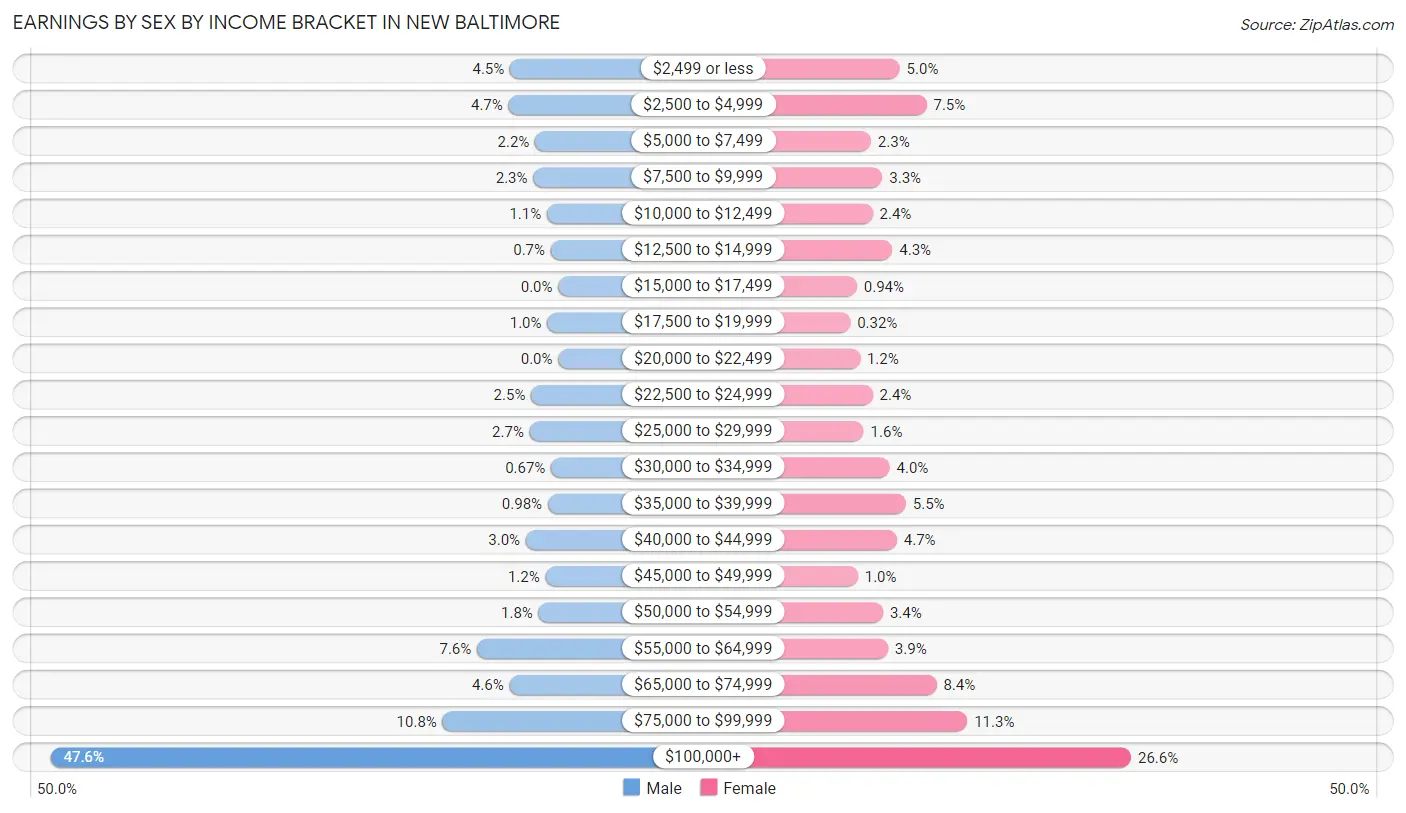
| Income | Male | Female |
| $2,499 or less | 162 (4.5%) | 153 (5.0%) |
| $2,500 to $4,999 | 167 (4.7%) | 231 (7.5%) |
| $5,000 to $7,499 | 78 (2.2%) | 70 (2.3%) |
| $7,500 to $9,999 | 84 (2.3%) | 103 (3.3%) |
| $10,000 to $12,499 | 38 (1.1%) | 75 (2.4%) |
| $12,500 to $14,999 | 25 (0.7%) | 132 (4.3%) |
| $15,000 to $17,499 | 0 (0.0%) | 29 (0.9%) |
| $17,500 to $19,999 | 37 (1.0%) | 10 (0.3%) |
| $20,000 to $22,499 | 0 (0.0%) | 38 (1.2%) |
| $22,500 to $24,999 | 91 (2.5%) | 75 (2.4%) |
| $25,000 to $29,999 | 96 (2.7%) | 49 (1.6%) |
| $30,000 to $34,999 | 24 (0.7%) | 124 (4.0%) |
| $35,000 to $39,999 | 35 (1.0%) | 171 (5.5%) |
| $40,000 to $44,999 | 109 (3.0%) | 145 (4.7%) |
| $45,000 to $49,999 | 43 (1.2%) | 32 (1.0%) |
| $50,000 to $54,999 | 66 (1.8%) | 105 (3.4%) |
| $55,000 to $64,999 | 273 (7.6%) | 119 (3.8%) |
| $65,000 to $74,999 | 164 (4.6%) | 260 (8.4%) |
| $75,000 to $99,999 | 389 (10.8%) | 349 (11.3%) |
| $100,000+ | 1,706 (47.6%) | 824 (26.6%) |
| Total | 3,587 (100.0%) | 3,094 (100.0%) |
Earnings by Sex by Educational Attainment in New Baltimore
Average earnings in New Baltimore are $113,125 for men and $66,849 for women, a difference of 40.9%. Men with an educational attainment of graduate degree enjoy the highest average annual earnings of $148,750, while those with high school diploma education earn the least with $59,044. Women with an educational attainment of bachelor's degree earn the most with the average annual earnings of $82,222, while those with high school diploma education have the smallest earnings of $53,646.
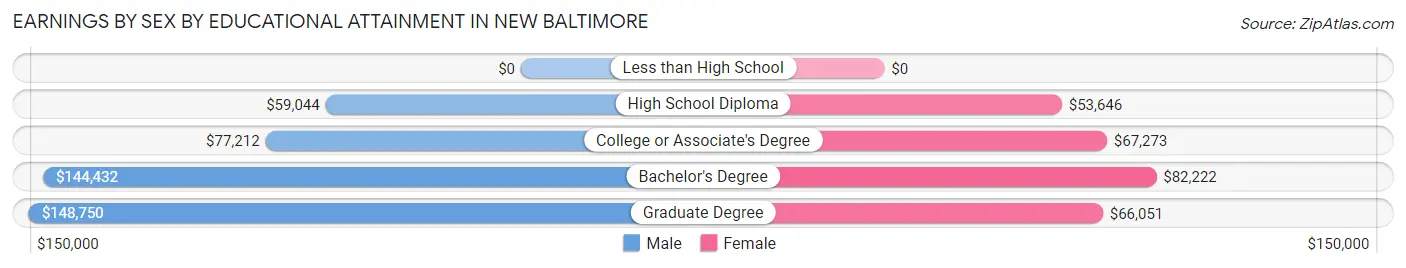
| Educational Attainment | Male Income | Female Income |
| Less than High School | - | - |
| High School Diploma | $59,044 | $53,646 |
| College or Associate's Degree | $77,212 | $67,273 |
| Bachelor's Degree | $144,432 | $82,222 |
| Graduate Degree | $148,750 | $66,051 |
| Total | $113,125 | $66,849 |
Family Income in New Baltimore
Family Income Brackets in New Baltimore
According to the New Baltimore family income data, there are 1,248 families falling into the $200,000+ income range, which is the most common income bracket and makes up 39.4% of all families.
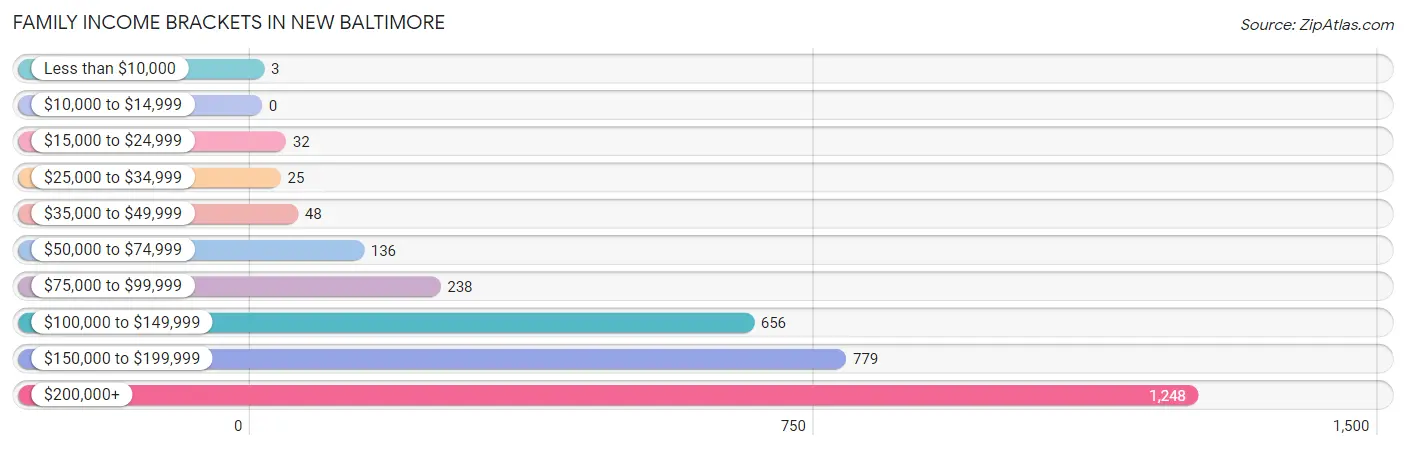
| Income Bracket | # Families | % Families |
| Less than $10,000 | 3 | 0.1% |
| $10,000 to $14,999 | 0 | 0.0% |
| $15,000 to $24,999 | 32 | 1.0% |
| $25,000 to $34,999 | 25 | 0.8% |
| $35,000 to $49,999 | 48 | 1.5% |
| $50,000 to $74,999 | 136 | 4.3% |
| $75,000 to $99,999 | 238 | 7.5% |
| $100,000 to $149,999 | 656 | 20.7% |
| $150,000 to $199,999 | 779 | 24.6% |
| $200,000+ | 1,248 | 39.4% |
Family Income by Famaliy Size in New Baltimore
7+ person families (58 | 1.8%) account for the highest median family income in New Baltimore with $250,001 per family, while 2-person families (970 | 30.6%) have the highest median income of $84,204 per family member.
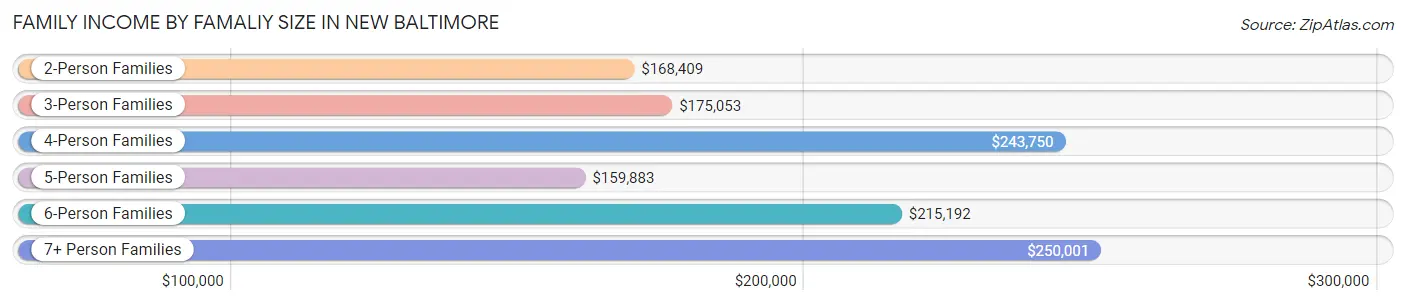
| Income Bracket | # Families | Median Income |
| 2-Person Families | 970 (30.6%) | $168,409 |
| 3-Person Families | 975 (30.8%) | $175,053 |
| 4-Person Families | 677 (21.4%) | $243,750 |
| 5-Person Families | 336 (10.6%) | $159,883 |
| 6-Person Families | 152 (4.8%) | $215,192 |
| 7+ Person Families | 58 (1.8%) | $250,001 |
| Total | 3,168 (100.0%) | $176,467 |
Family Income by Number of Earners in New Baltimore
The median family income in New Baltimore is $176,467, with families comprising 3+ earners (616) having the highest median family income of $236,786, while families with no earners (339) have the lowest median family income of $139,813, accounting for 19.4% and 10.7% of families, respectively.
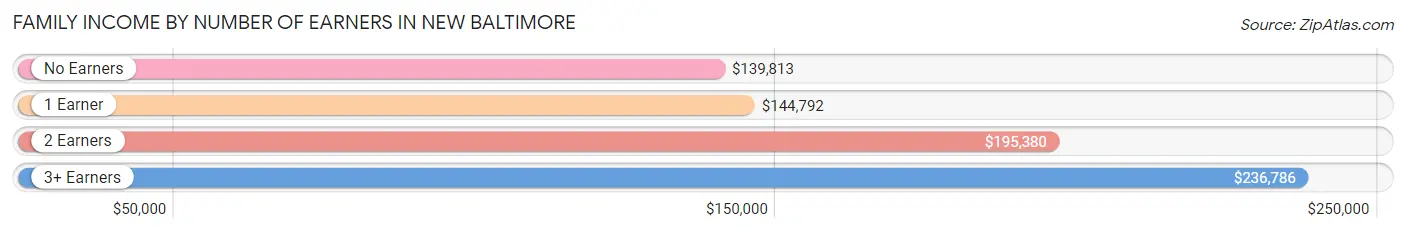
| Number of Earners | # Families | Median Income |
| No Earners | 339 (10.7%) | $139,813 |
| 1 Earner | 671 (21.2%) | $144,792 |
| 2 Earners | 1,542 (48.7%) | $195,380 |
| 3+ Earners | 616 (19.4%) | $236,786 |
| Total | 3,168 (100.0%) | $176,467 |
Household Income in New Baltimore
Household Income Brackets in New Baltimore
With 1,368 households falling in the category, the $200,000+ income range is the most frequent in New Baltimore, accounting for 37.0% of all households.
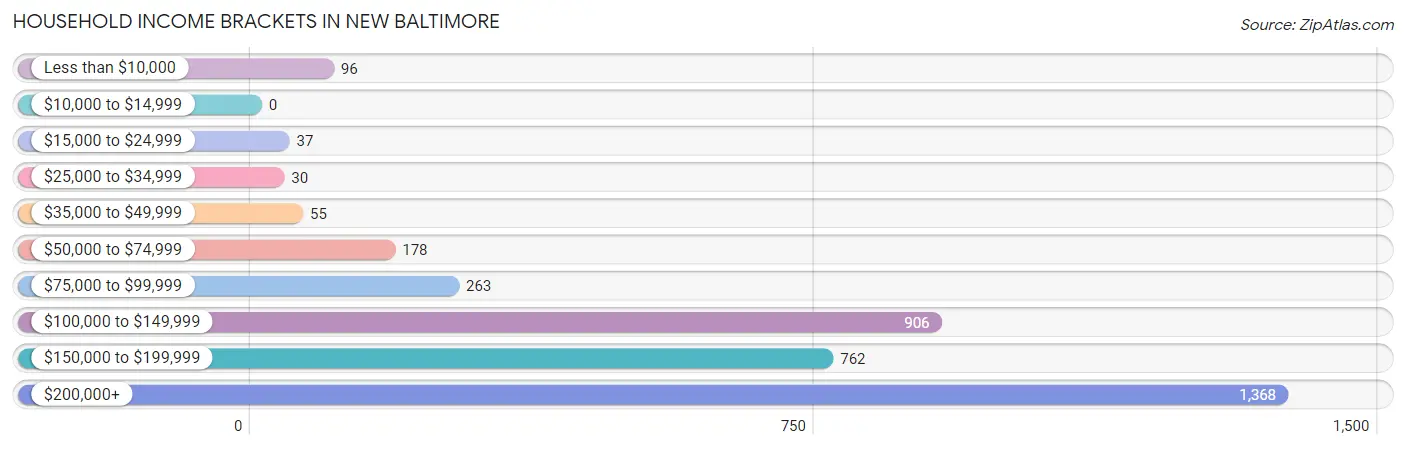
| Income Bracket | # Households | % Households |
| Less than $10,000 | 96 | 2.6% |
| $10,000 to $14,999 | 0 | 0.0% |
| $15,000 to $24,999 | 37 | 1.0% |
| $25,000 to $34,999 | 30 | 0.8% |
| $35,000 to $49,999 | 55 | 1.5% |
| $50,000 to $74,999 | 178 | 4.8% |
| $75,000 to $99,999 | 263 | 7.1% |
| $100,000 to $149,999 | 906 | 24.5% |
| $150,000 to $199,999 | 762 | 20.6% |
| $200,000+ | 1,368 | 37.0% |
Household Income by Householder Age in New Baltimore
The median household income in New Baltimore is $167,727, with the highest median household income of $185,341 found in the 45 to 64 years age bracket for the primary householder. A total of 1,530 households (41.4%) fall into this category.
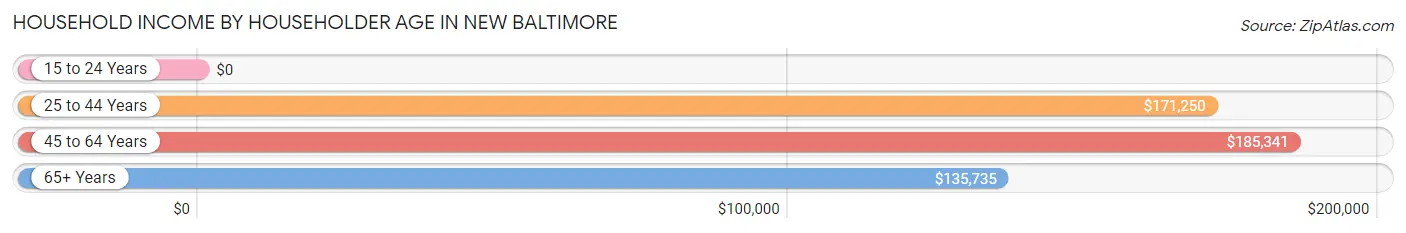
| Income Bracket | # Households | Median Income |
| 15 to 24 Years | 0 (0.0%) | $0 |
| 25 to 44 Years | 1,336 (36.1%) | $171,250 |
| 45 to 64 Years | 1,530 (41.4%) | $185,341 |
| 65+ Years | 832 (22.5%) | $135,735 |
| Total | 3,698 (100.0%) | $167,727 |
Poverty in New Baltimore
Income Below Poverty by Sex and Age in New Baltimore
With 2.2% poverty level for males and 1.5% for females among the residents of New Baltimore, 16 and 17 year old males and 75 year old and over females are the most vulnerable to poverty, with 26 males (8.6%) and 39 females (10.6%) in their respective age groups living below the poverty level.
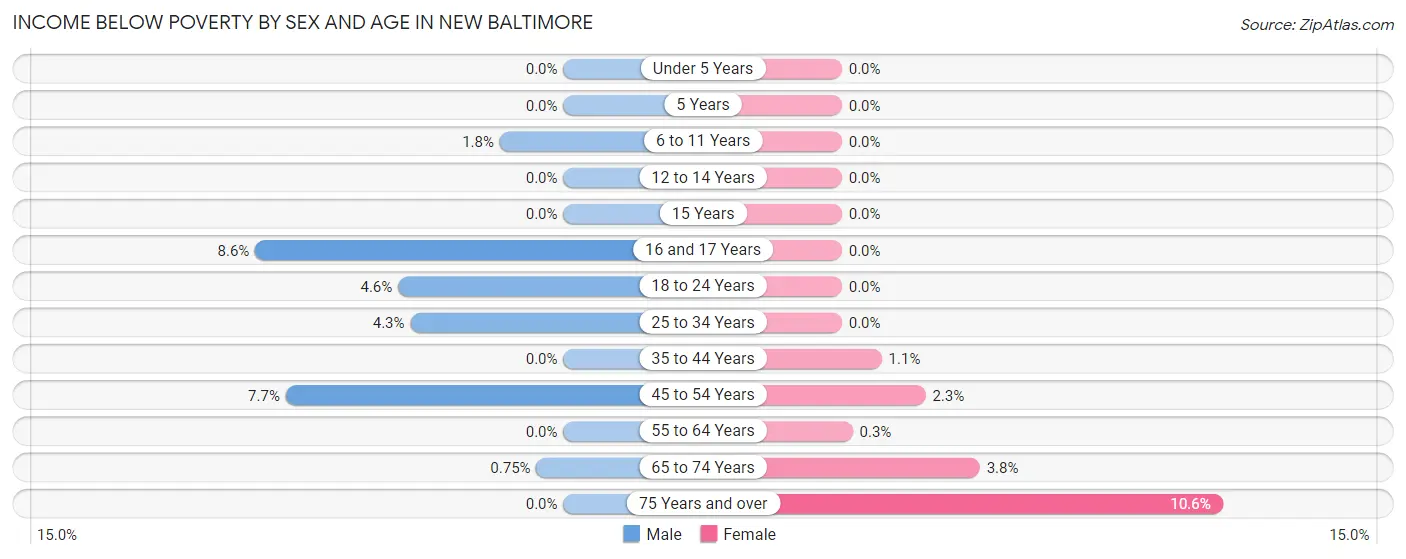
| Age Bracket | Male | Female |
| Under 5 Years | 0 (0.0%) | 0 (0.0%) |
| 5 Years | 0 (0.0%) | 0 (0.0%) |
| 6 to 11 Years | 11 (1.8%) | 0 (0.0%) |
| 12 to 14 Years | 0 (0.0%) | 0 (0.0%) |
| 15 Years | 0 (0.0%) | 0 (0.0%) |
| 16 and 17 Years | 26 (8.6%) | 0 (0.0%) |
| 18 to 24 Years | 19 (4.6%) | 0 (0.0%) |
| 25 to 34 Years | 26 (4.3%) | 0 (0.0%) |
| 35 to 44 Years | 0 (0.0%) | 8 (1.1%) |
| 45 to 54 Years | 54 (7.7%) | 17 (2.3%) |
| 55 to 64 Years | 0 (0.0%) | 3 (0.3%) |
| 65 to 74 Years | 4 (0.7%) | 17 (3.8%) |
| 75 Years and over | 0 (0.0%) | 39 (10.6%) |
| Total | 140 (2.2%) | 84 (1.5%) |
Income Above Poverty by Sex and Age in New Baltimore
According to the poverty statistics in New Baltimore, males aged under 5 years and females aged under 5 years are the age groups that are most secure financially, with 100.0% of males and 100.0% of females in these age groups living above the poverty line.
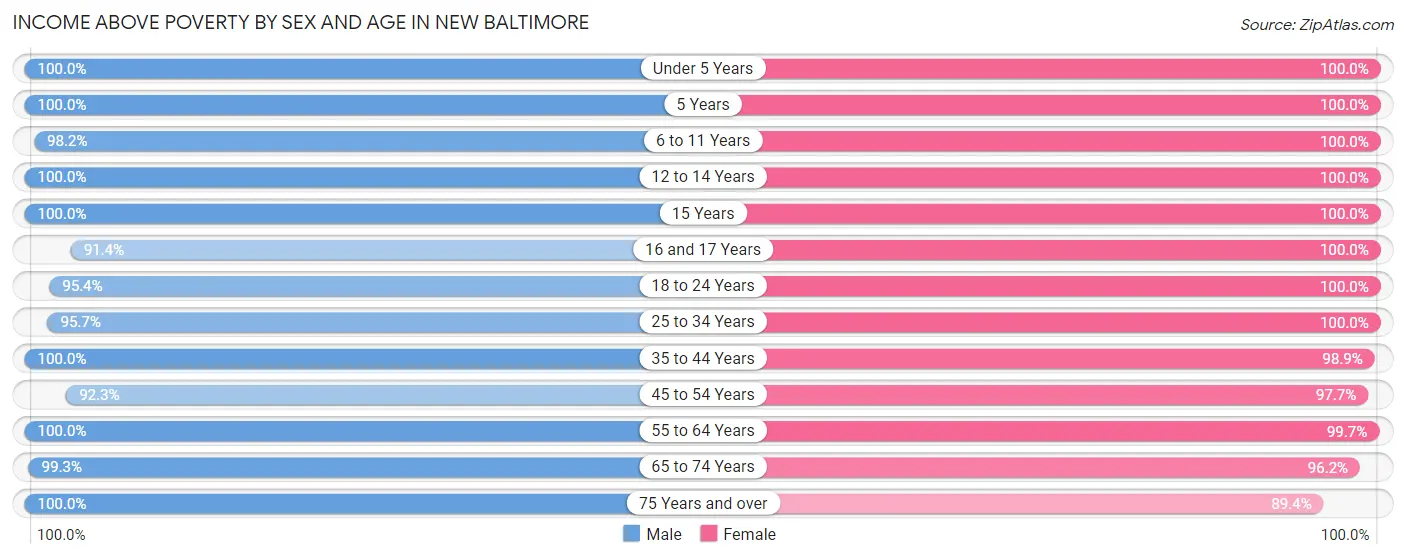
| Age Bracket | Male | Female |
| Under 5 Years | 411 (100.0%) | 277 (100.0%) |
| 5 Years | 192 (100.0%) | 22 (100.0%) |
| 6 to 11 Years | 611 (98.2%) | 391 (100.0%) |
| 12 to 14 Years | 292 (100.0%) | 255 (100.0%) |
| 15 Years | 51 (100.0%) | 60 (100.0%) |
| 16 and 17 Years | 277 (91.4%) | 146 (100.0%) |
| 18 to 24 Years | 394 (95.4%) | 457 (100.0%) |
| 25 to 34 Years | 584 (95.7%) | 628 (100.0%) |
| 35 to 44 Years | 982 (100.0%) | 714 (98.9%) |
| 45 to 54 Years | 645 (92.3%) | 712 (97.7%) |
| 55 to 64 Years | 892 (100.0%) | 1,012 (99.7%) |
| 65 to 74 Years | 526 (99.3%) | 426 (96.2%) |
| 75 Years and over | 233 (100.0%) | 329 (89.4%) |
| Total | 6,090 (97.8%) | 5,429 (98.5%) |
Income Below Poverty Among Married-Couple Families in New Baltimore
The poverty statistics for married-couple families in New Baltimore show that 0.1% or 4 of the total 2,779 families live below the poverty line. Families with no children have the highest poverty rate of 0.3%, comprising of 4 families. On the other hand, families with 1 or 2 children have the lowest poverty rate of 0.0%, which includes 0 families.
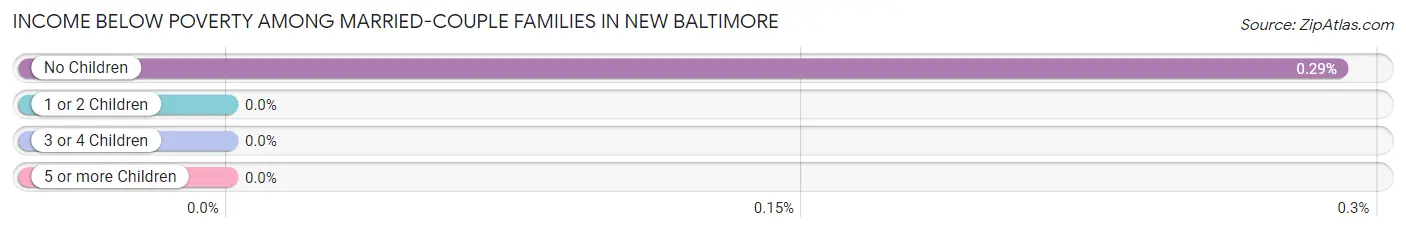
| Children | Above Poverty | Below Poverty |
| No Children | 1,367 (99.7%) | 4 (0.3%) |
| 1 or 2 Children | 1,053 (100.0%) | 0 (0.0%) |
| 3 or 4 Children | 330 (100.0%) | 0 (0.0%) |
| 5 or more Children | 25 (100.0%) | 0 (0.0%) |
| Total | 2,775 (99.9%) | 4 (0.1%) |
Income Below Poverty Among Single-Parent Households in New Baltimore
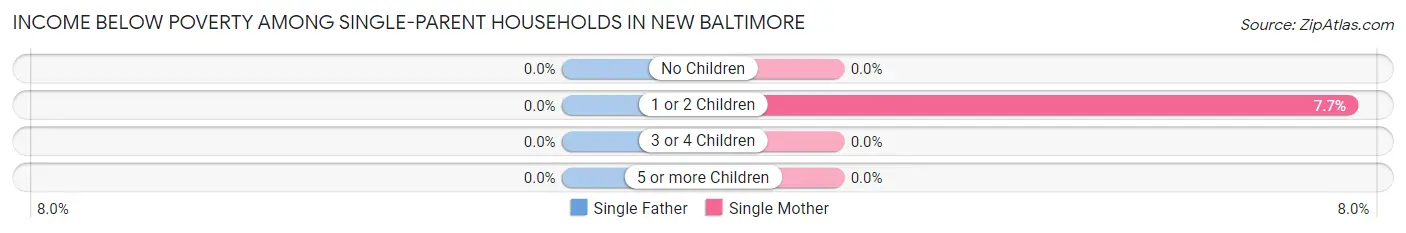
| Children | Single Father | Single Mother |
| No Children | 0 (0.0%) | 0 (0.0%) |
| 1 or 2 Children | 0 (0.0%) | 17 (7.7%) |
| 3 or 4 Children | 0 (0.0%) | 0 (0.0%) |
| 5 or more Children | 0 (0.0%) | 0 (0.0%) |
| Total | 0 (0.0%) | 17 (4.6%) |
Income Below Poverty Among Married-Couple vs Single-Parent Households in New Baltimore
The poverty data for New Baltimore shows that 4 of the married-couple family households (0.1%) and 17 of the single-parent households (4.4%) are living below the poverty level. Within the married-couple family households, those with no children have the highest poverty rate, with 4 households (0.3%) falling below the poverty line. Among the single-parent households, those with 1 or 2 children have the highest poverty rate, with 17 household (7.5%) living below poverty.
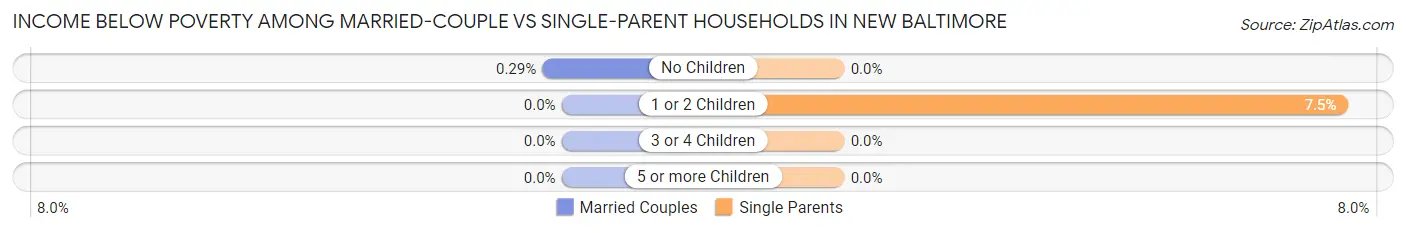
| Children | Married-Couple Families | Single-Parent Households |
| No Children | 4 (0.3%) | 0 (0.0%) |
| 1 or 2 Children | 0 (0.0%) | 17 (7.5%) |
| 3 or 4 Children | 0 (0.0%) | 0 (0.0%) |
| 5 or more Children | 0 (0.0%) | 0 (0.0%) |
| Total | 4 (0.1%) | 17 (4.4%) |
Race in New Baltimore
The most populous races in New Baltimore are White / Caucasian (9,808 | 83.5%), Hispanic or Latino (801 | 6.8%), and Two or more Races (787 | 6.7%).
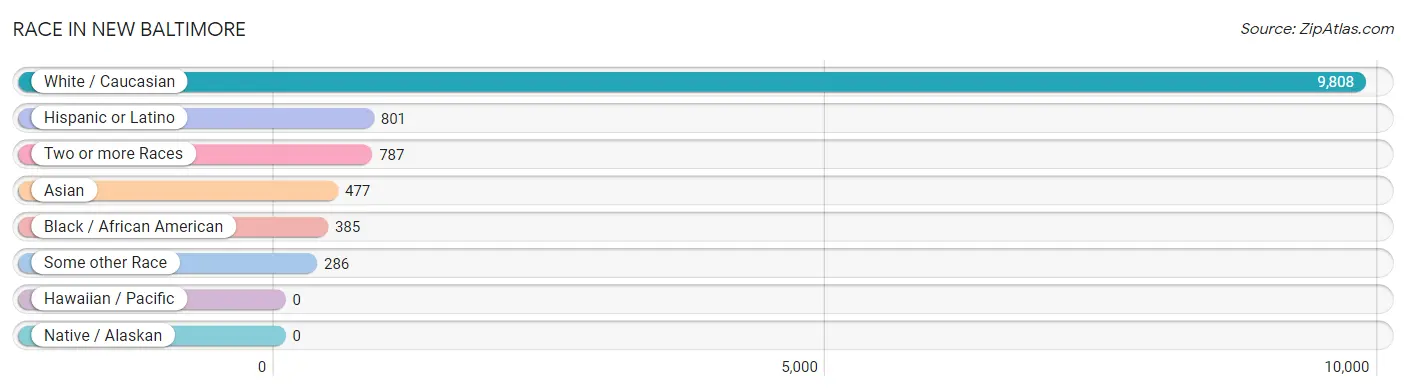
| Race | # Population | % Population |
| Asian | 477 | 4.1% |
| Black / African American | 385 | 3.3% |
| Hawaiian / Pacific | 0 | 0.0% |
| Hispanic or Latino | 801 | 6.8% |
| Native / Alaskan | 0 | 0.0% |
| White / Caucasian | 9,808 | 83.5% |
| Two or more Races | 787 | 6.7% |
| Some other Race | 286 | 2.4% |
| Total | 11,743 | 100.0% |
Ancestry in New Baltimore
The most populous ancestries reported in New Baltimore are English (2,208 | 18.8%), Irish (1,761 | 15.0%), German (1,751 | 14.9%), Italian (814 | 6.9%), and American (500 | 4.3%), together accounting for 59.9% of all New Baltimore residents.
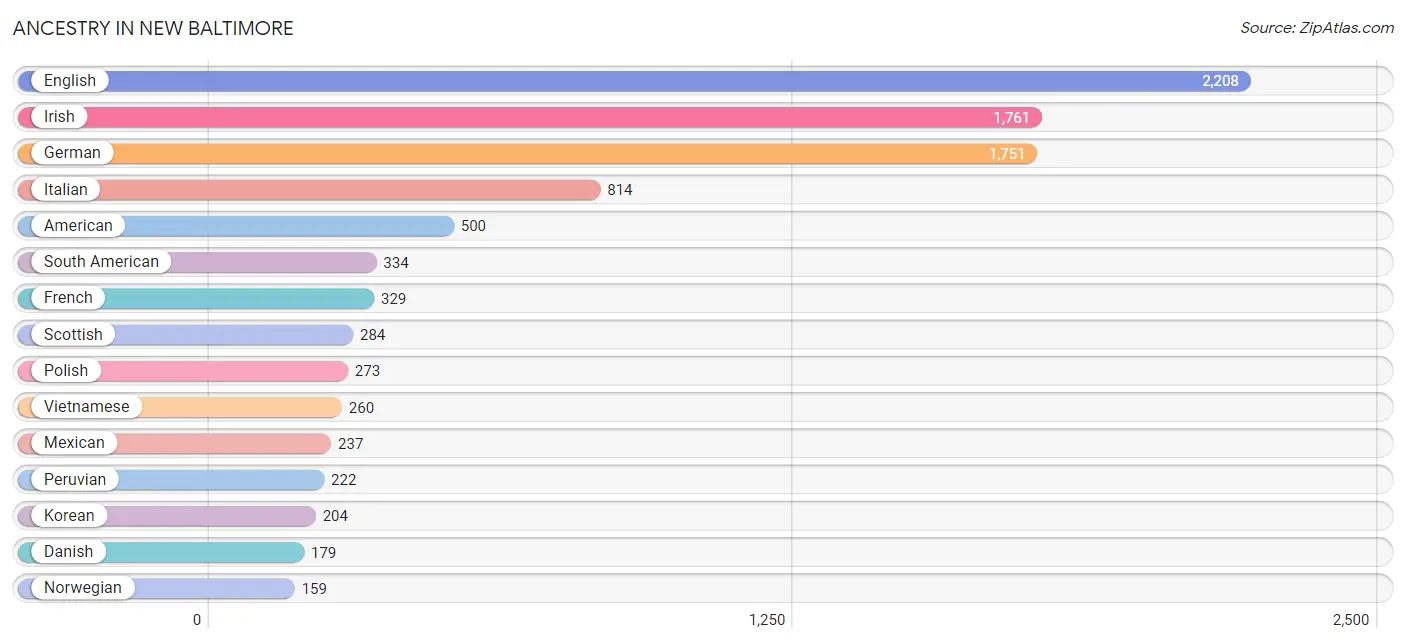
| Ancestry | # Population | % Population |
| American | 500 | 4.3% |
| Arab | 64 | 0.5% |
| Argentinean | 5 | 0.0% |
| Austrian | 52 | 0.4% |
| Belgian | 16 | 0.1% |
| Bhutanese | 44 | 0.4% |
| Bolivian | 65 | 0.5% |
| British | 50 | 0.4% |
| Burmese | 37 | 0.3% |
| Canadian | 18 | 0.2% |
| Central American | 74 | 0.6% |
| Cherokee | 9 | 0.1% |
| Colombian | 42 | 0.4% |
| Costa Rican | 13 | 0.1% |
| Cuban | 66 | 0.6% |
| Czech | 30 | 0.3% |
| Czechoslovakian | 14 | 0.1% |
| Danish | 179 | 1.5% |
| Dutch | 104 | 0.9% |
| Eastern European | 97 | 0.8% |
| English | 2,208 | 18.8% |
| Ethiopian | 23 | 0.2% |
| European | 127 | 1.1% |
| Finnish | 62 | 0.5% |
| French | 329 | 2.8% |
| French Canadian | 47 | 0.4% |
| German | 1,751 | 14.9% |
| Greek | 94 | 0.8% |
| Hungarian | 86 | 0.7% |
| Icelander | 40 | 0.3% |
| Indian (Asian) | 58 | 0.5% |
| Irish | 1,761 | 15.0% |
| Italian | 814 | 6.9% |
| Jamaican | 29 | 0.3% |
| Korean | 204 | 1.7% |
| Latvian | 42 | 0.4% |
| Mexican | 237 | 2.0% |
| Mexican American Indian | 87 | 0.7% |
| Moroccan | 64 | 0.5% |
| Nicaraguan | 46 | 0.4% |
| Nigerian | 17 | 0.1% |
| Northern European | 14 | 0.1% |
| Norwegian | 159 | 1.3% |
| Panamanian | 15 | 0.1% |
| Pennsylvania German | 59 | 0.5% |
| Peruvian | 222 | 1.9% |
| Polish | 273 | 2.3% |
| Portuguese | 94 | 0.8% |
| Puerto Rican | 77 | 0.7% |
| Russian | 112 | 0.9% |
| Scandinavian | 65 | 0.5% |
| Scotch-Irish | 94 | 0.8% |
| Scottish | 284 | 2.4% |
| Slavic | 47 | 0.4% |
| Slovak | 64 | 0.5% |
| South American | 334 | 2.8% |
| Spaniard | 2 | 0.0% |
| Subsaharan African | 40 | 0.3% |
| Swedish | 55 | 0.5% |
| Swiss | 7 | 0.1% |
| Thai | 99 | 0.8% |
| Trinidadian and Tobagonian | 16 | 0.1% |
| Turkish | 19 | 0.2% |
| Ukrainian | 69 | 0.6% |
| Vietnamese | 260 | 2.2% |
| Welsh | 18 | 0.2% |
| West Indian | 17 | 0.1% | View All 67 Rows |
Immigrants in New Baltimore
The most numerous immigrant groups reported in New Baltimore came from Asia (355 | 3.0%), South Central Asia (225 | 1.9%), Bangladesh (221 | 1.9%), Latin America (196 | 1.7%), and Europe (164 | 1.4%), together accounting for 9.9% of all New Baltimore residents.
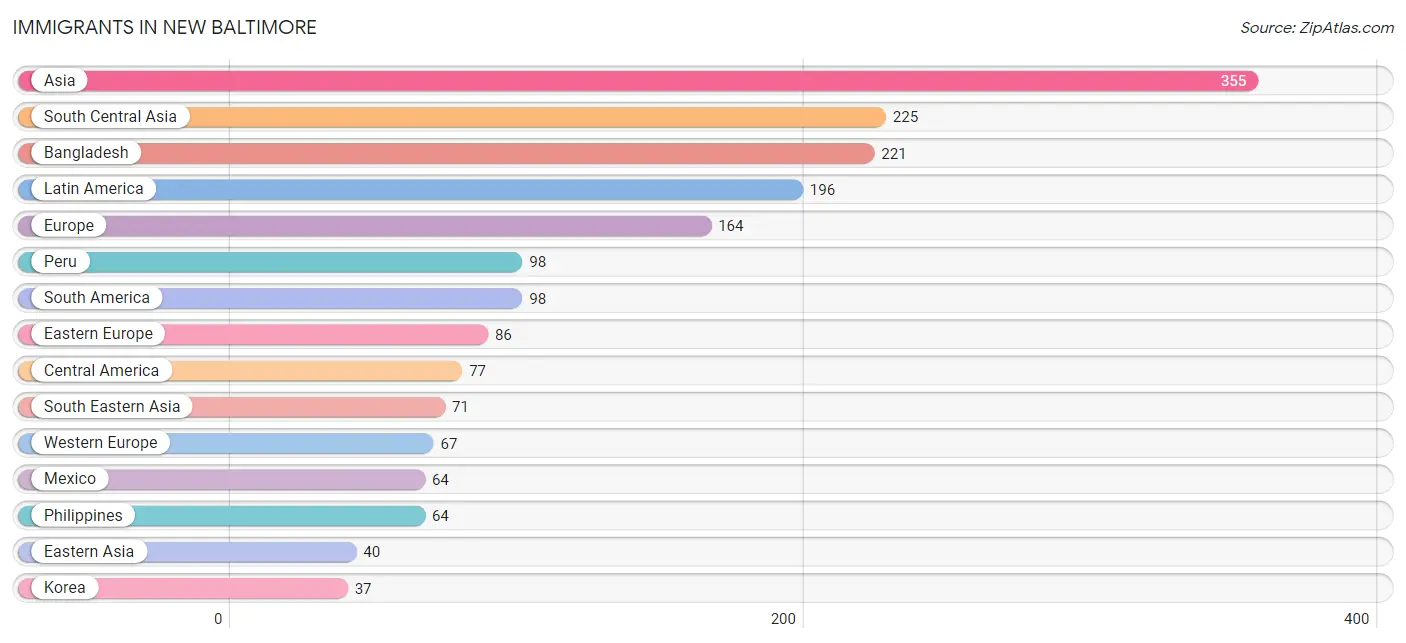
| Immigration Origin | # Population | % Population |
| Africa | 22 | 0.2% |
| Asia | 355 | 3.0% |
| Australia | 7 | 0.1% |
| Bangladesh | 221 | 1.9% |
| Belarus | 29 | 0.3% |
| Belgium | 30 | 0.3% |
| Canada | 30 | 0.3% |
| Caribbean | 21 | 0.2% |
| Central America | 77 | 0.7% |
| China | 3 | 0.0% |
| Costa Rica | 13 | 0.1% |
| Czechoslovakia | 17 | 0.1% |
| Eastern Asia | 40 | 0.3% |
| Eastern Europe | 86 | 0.7% |
| England | 11 | 0.1% |
| Europe | 164 | 1.4% |
| France | 17 | 0.1% |
| Germany | 15 | 0.1% |
| Hungary | 19 | 0.2% |
| India | 4 | 0.0% |
| Korea | 37 | 0.3% |
| Latin America | 196 | 1.7% |
| Mexico | 64 | 0.5% |
| Morocco | 5 | 0.0% |
| Netherlands | 5 | 0.0% |
| Nigeria | 17 | 0.1% |
| Northern Africa | 5 | 0.0% |
| Northern Europe | 11 | 0.1% |
| Oceania | 7 | 0.1% |
| Peru | 98 | 0.8% |
| Philippines | 64 | 0.5% |
| South America | 98 | 0.8% |
| South Central Asia | 225 | 1.9% |
| South Eastern Asia | 71 | 0.6% |
| Taiwan | 3 | 0.0% |
| Thailand | 7 | 0.1% |
| Trinidad and Tobago | 16 | 0.1% |
| Turkey | 19 | 0.2% |
| Ukraine | 21 | 0.2% |
| Western Africa | 17 | 0.1% |
| Western Asia | 19 | 0.2% |
| Western Europe | 67 | 0.6% | View All 42 Rows |
Sex and Age in New Baltimore
Sex and Age in New Baltimore
The most populous age groups in New Baltimore are 35 to 39 Years (649 | 10.4%) for men and 55 to 59 Years (672 | 12.2%) for women.
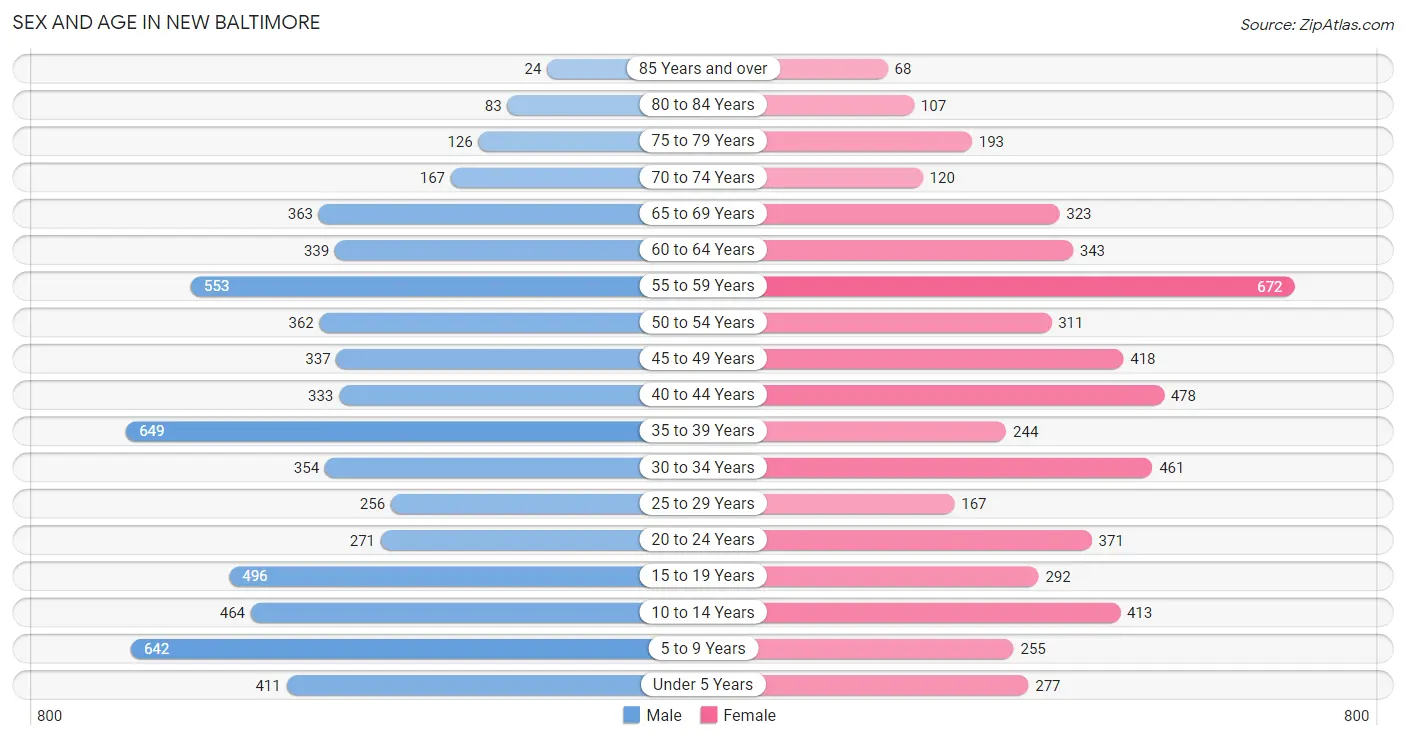
| Age Bracket | Male | Female |
| Under 5 Years | 411 (6.6%) | 277 (5.0%) |
| 5 to 9 Years | 642 (10.3%) | 255 (4.6%) |
| 10 to 14 Years | 464 (7.4%) | 413 (7.5%) |
| 15 to 19 Years | 496 (8.0%) | 292 (5.3%) |
| 20 to 24 Years | 271 (4.3%) | 371 (6.7%) |
| 25 to 29 Years | 256 (4.1%) | 167 (3.0%) |
| 30 to 34 Years | 354 (5.7%) | 461 (8.4%) |
| 35 to 39 Years | 649 (10.4%) | 244 (4.4%) |
| 40 to 44 Years | 333 (5.3%) | 478 (8.7%) |
| 45 to 49 Years | 337 (5.4%) | 418 (7.6%) |
| 50 to 54 Years | 362 (5.8%) | 311 (5.6%) |
| 55 to 59 Years | 553 (8.9%) | 672 (12.2%) |
| 60 to 64 Years | 339 (5.4%) | 343 (6.2%) |
| 65 to 69 Years | 363 (5.8%) | 323 (5.9%) |
| 70 to 74 Years | 167 (2.7%) | 120 (2.2%) |
| 75 to 79 Years | 126 (2.0%) | 193 (3.5%) |
| 80 to 84 Years | 83 (1.3%) | 107 (1.9%) |
| 85 Years and over | 24 (0.4%) | 68 (1.2%) |
| Total | 6,230 (100.0%) | 5,513 (100.0%) |
Families and Households in New Baltimore
Median Family Size in New Baltimore
The median family size in New Baltimore is 3.49 persons per family, with married-couple families (2,779 | 87.7%) accounting for the largest median family size of 3.53 persons per family. On the other hand, single female/mother families (370 | 11.7%) represent the smallest median family size with 3.17 persons per family.
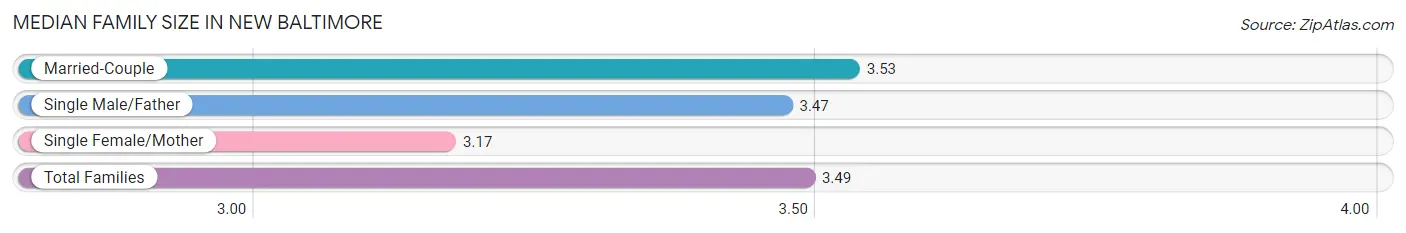
| Family Type | # Families | Family Size |
| Married-Couple | 2,779 (87.7%) | 3.53 |
| Single Male/Father | 19 (0.6%) | 3.47 |
| Single Female/Mother | 370 (11.7%) | 3.17 |
| Total Families | 3,168 (100.0%) | 3.49 |
Median Household Size in New Baltimore
The median household size in New Baltimore is 3.17 persons per household, with single male/father households (19 | 0.5%) accounting for the largest median household size of 3.74 persons per household. non-family households (530 | 14.3%) represent the smallest median household size with 1.04 persons per household.
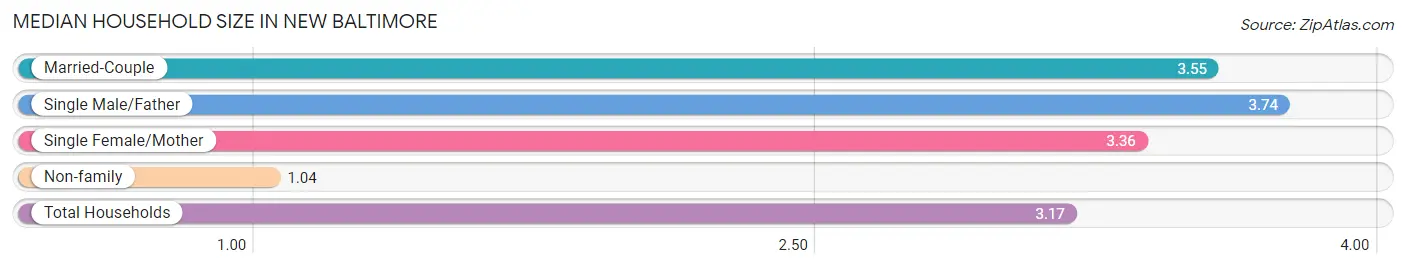
| Household Type | # Households | Household Size |
| Married-Couple | 2,779 (75.1%) | 3.55 |
| Single Male/Father | 19 (0.5%) | 3.74 |
| Single Female/Mother | 370 (10.0%) | 3.36 |
| Non-family | 530 (14.3%) | 1.04 |
| Total Households | 3,698 (100.0%) | 3.17 |
Household Size by Marriage Status in New Baltimore
Out of a total of 3,698 households in New Baltimore, 3,168 (85.7%) are family households, while 530 (14.3%) are nonfamily households. The most numerous type of family households are 3-person households, comprising 1,014, and the most common type of nonfamily households are 1-person households, comprising 517.
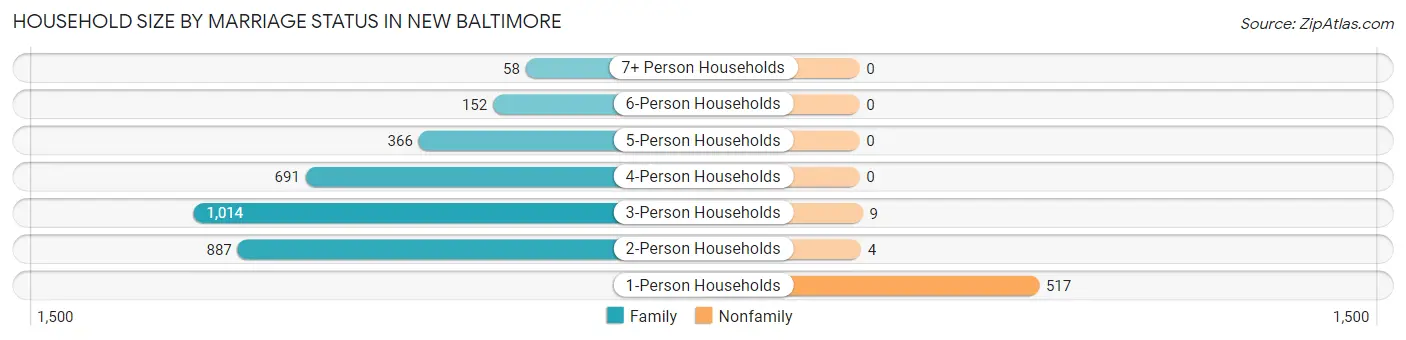
| Household Size | Family Households | Nonfamily Households |
| 1-Person Households | - | 517 (14.0%) |
| 2-Person Households | 887 (24.0%) | 4 (0.1%) |
| 3-Person Households | 1,014 (27.4%) | 9 (0.2%) |
| 4-Person Households | 691 (18.7%) | 0 (0.0%) |
| 5-Person Households | 366 (9.9%) | 0 (0.0%) |
| 6-Person Households | 152 (4.1%) | 0 (0.0%) |
| 7+ Person Households | 58 (1.6%) | 0 (0.0%) |
| Total | 3,168 (85.7%) | 530 (14.3%) |
Female Fertility in New Baltimore
Fertility by Age in New Baltimore
Average fertility rate in New Baltimore is 36.0 births per 1,000 women. Women in the age bracket of 20 to 34 years have the highest fertility rate with 83.0 births per 1,000 women. Women in the age bracket of 20 to 34 years acount for 91.2% of all women with births.
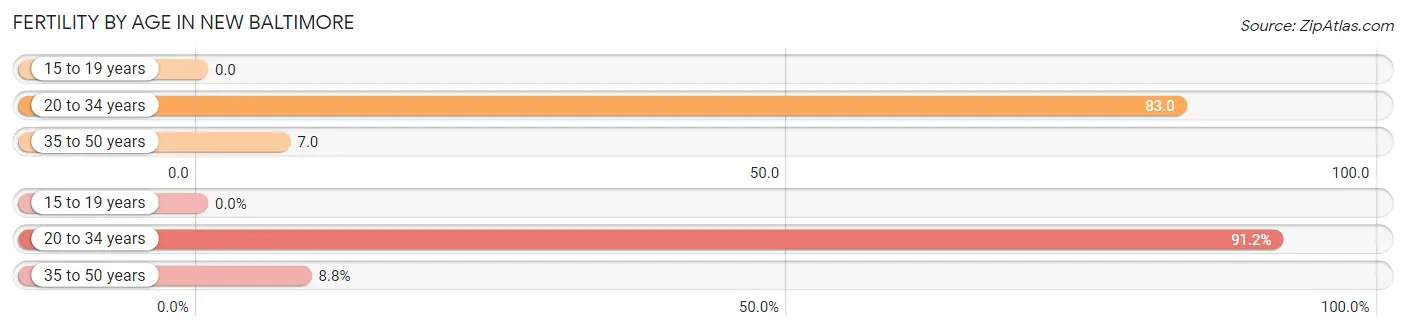
| Age Bracket | Women with Births | Births / 1,000 Women |
| 15 to 19 years | 0 (0.0%) | 0.0 |
| 20 to 34 years | 83 (91.2%) | 83.0 |
| 35 to 50 years | 8 (8.8%) | 7.0 |
| Total | 91 (100.0%) | 36.0 |
Fertility by Age by Marriage Status in New Baltimore
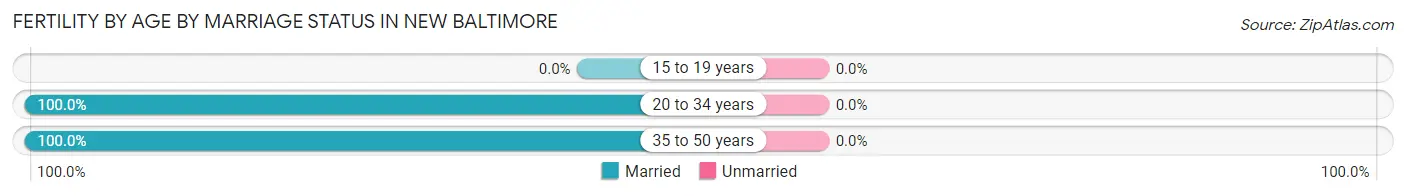
| Age Bracket | Married | Unmarried |
| 15 to 19 years | 0 (0.0%) | 0 (0.0%) |
| 20 to 34 years | 83 (100.0%) | 0 (0.0%) |
| 35 to 50 years | 8 (100.0%) | 0 (0.0%) |
| Total | 91 (100.0%) | 0 (0.0%) |
Fertility by Education in New Baltimore
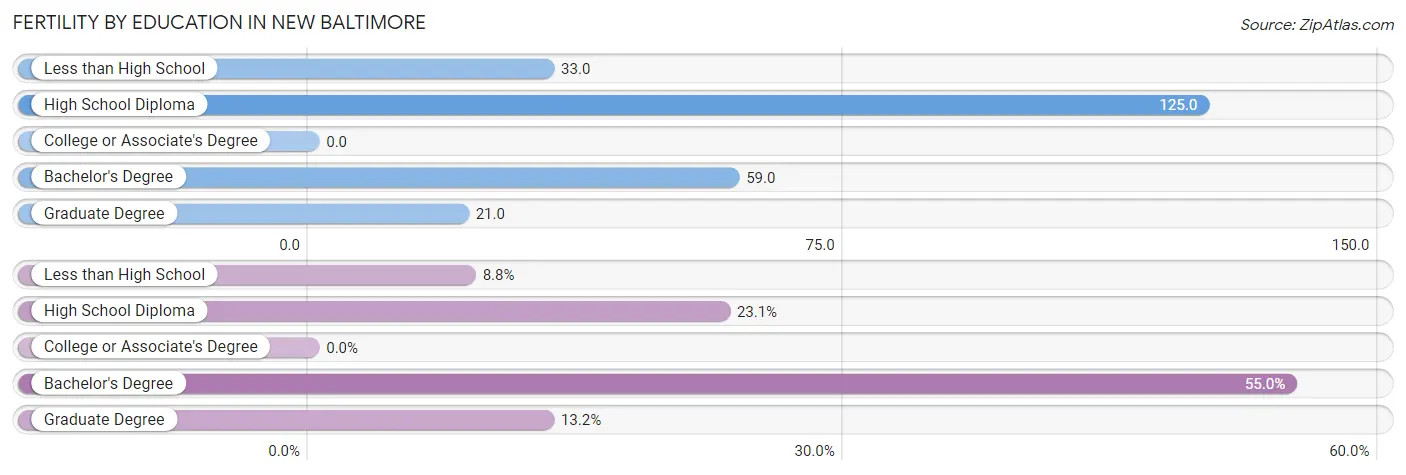
| Educational Attainment | Women with Births | Births / 1,000 Women |
| Less than High School | 8 (8.8%) | 33.0 |
| High School Diploma | 21 (23.1%) | 125.0 |
| College or Associate's Degree | 0 (0.0%) | 0.0 |
| Bachelor's Degree | 50 (54.9%) | 59.0 |
| Graduate Degree | 12 (13.2%) | 21.0 |
| Total | 91 (100.0%) | 36.0 |
Fertility by Education by Marriage Status in New Baltimore
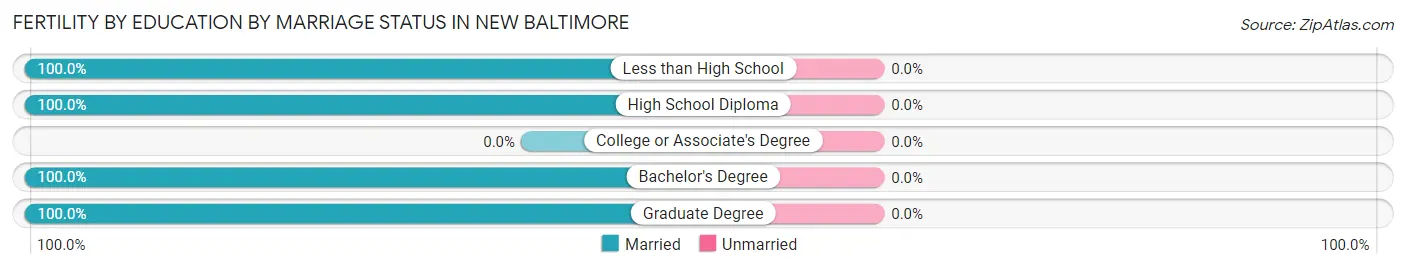
| Educational Attainment | Married | Unmarried |
| Less than High School | 8 (100.0%) | 0 (0.0%) |
| High School Diploma | 21 (100.0%) | 0 (0.0%) |
| College or Associate's Degree | 0 (0.0%) | 0 (0.0%) |
| Bachelor's Degree | 50 (100.0%) | 0 (0.0%) |
| Graduate Degree | 12 (100.0%) | 0 (0.0%) |
| Total | 91 (100.0%) | 0 (0.0%) |
Employment Characteristics in New Baltimore
Employment by Class of Employer in New Baltimore
Among the 5,941 employed individuals in New Baltimore, private company employees (3,789 | 63.8%), local government employees (668 | 11.2%), and federal government employees (569 | 9.6%) make up the most common classes of employment.
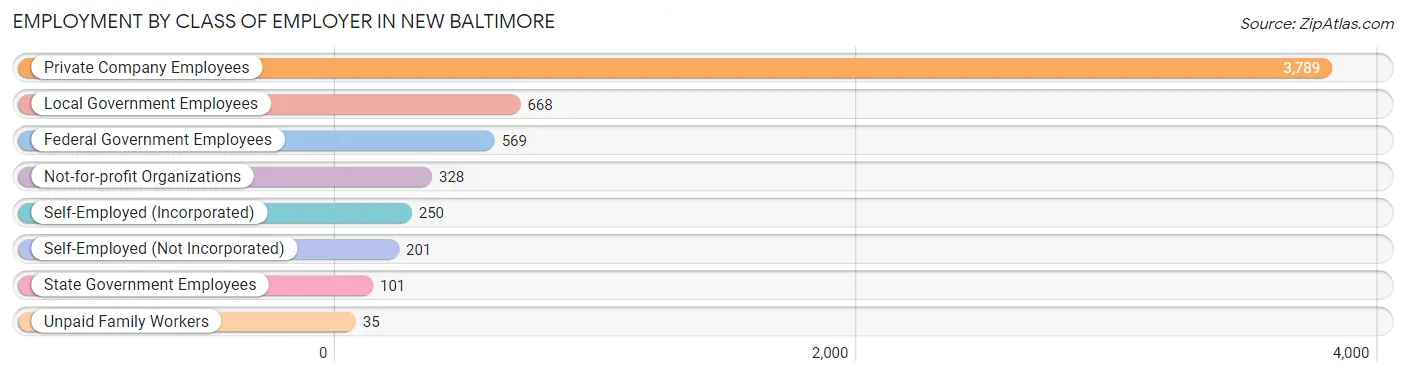
| Employer Class | # Employees | % Employees |
| Private Company Employees | 3,789 | 63.8% |
| Self-Employed (Incorporated) | 250 | 4.2% |
| Self-Employed (Not Incorporated) | 201 | 3.4% |
| Not-for-profit Organizations | 328 | 5.5% |
| Local Government Employees | 668 | 11.2% |
| State Government Employees | 101 | 1.7% |
| Federal Government Employees | 569 | 9.6% |
| Unpaid Family Workers | 35 | 0.6% |
| Total | 5,941 | 100.0% |
Employment Status by Age in New Baltimore
According to the labor force statistics for New Baltimore, out of the total population over 16 years of age (9,170), 67.0% or 6,144 individuals are in the labor force, with 1.5% or 92 of them unemployed. The age group with the highest labor force participation rate is 35 to 44 years, with 91.0% or 1,551 individuals in the labor force. Within the labor force, the 16 to 19 years age range has the highest percentage of unemployed individuals, with 5.0% or 14 of them being unemployed.
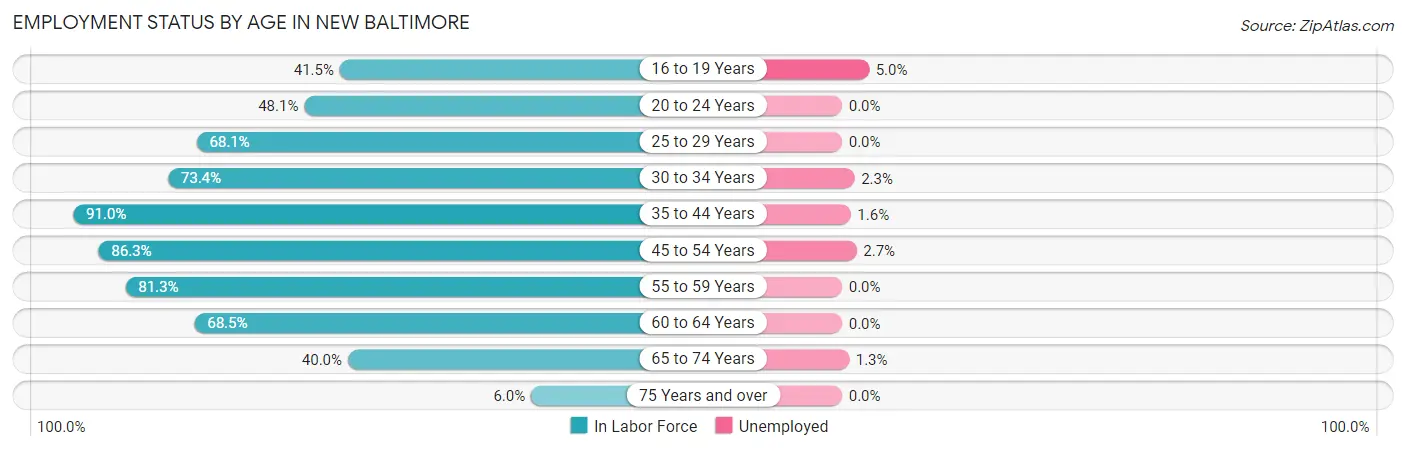
| Age Bracket | In Labor Force | Unemployed |
| 16 to 19 Years | 281 (41.5%) | 14 (5.0%) |
| 20 to 24 Years | 309 (48.1%) | 0 (0.0%) |
| 25 to 29 Years | 288 (68.1%) | 0 (0.0%) |
| 30 to 34 Years | 598 (73.4%) | 14 (2.3%) |
| 35 to 44 Years | 1,551 (91.0%) | 25 (1.6%) |
| 45 to 54 Years | 1,232 (86.3%) | 33 (2.7%) |
| 55 to 59 Years | 996 (81.3%) | 0 (0.0%) |
| 60 to 64 Years | 467 (68.5%) | 0 (0.0%) |
| 65 to 74 Years | 389 (40.0%) | 5 (1.3%) |
| 75 Years and over | 36 (6.0%) | 0 (0.0%) |
| Total | 6,144 (67.0%) | 92 (1.5%) |
Employment Status by Educational Attainment in New Baltimore
According to labor force statistics for New Baltimore, 81.7% of individuals (5,128) out of the total population between 25 and 64 years of age (6,277) are in the labor force, with 1.4% or 72 of them being unemployed. The group with the highest labor force participation rate are those with the educational attainment of bachelor's degree or higher, with 87.6% or 3,202 individuals in the labor force. Within the labor force, individuals with bachelor's degree or higher education have the highest percentage of unemployment, with 2.2% or 70 of them being unemployed.
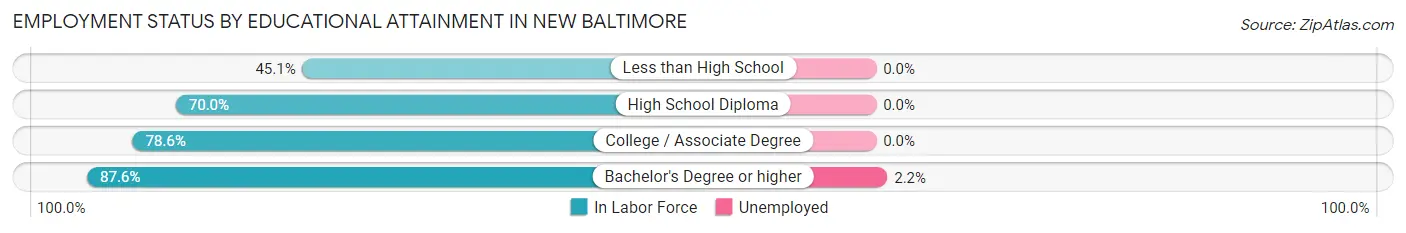
| Educational Attainment | In Labor Force | Unemployed |
| Less than High School | 82 (45.1%) | 0 (0.0%) |
| High School Diploma | 568 (70.0%) | 0 (0.0%) |
| College / Associate Degree | 1,280 (78.6%) | 0 (0.0%) |
| Bachelor's Degree or higher | 3,202 (87.6%) | 80 (2.2%) |
| Total | 5,128 (81.7%) | 88 (1.4%) |
Employment Occupations by Sex in New Baltimore
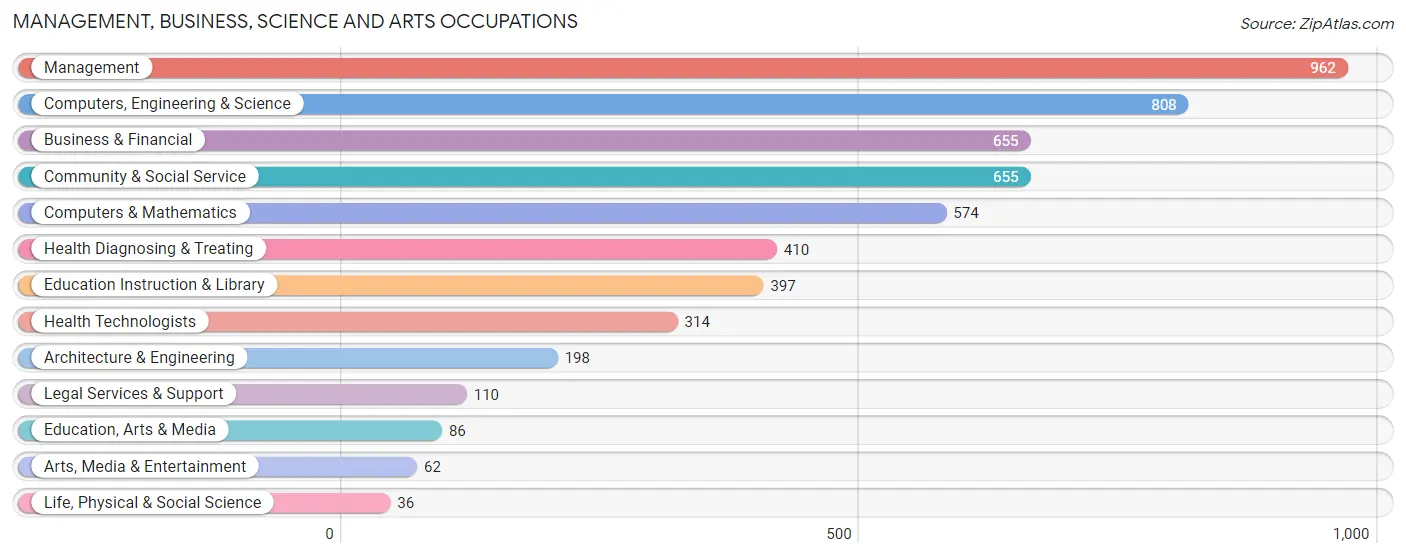
Management, Business, Science and Arts Occupations
The most common Management, Business, Science and Arts occupations in New Baltimore are Management (962 | 15.9%), Computers, Engineering & Science (808 | 13.4%), Business & Financial (655 | 10.8%), Community & Social Service (655 | 10.8%), and Computers & Mathematics (574 | 9.5%).
Management, Business, Science and Arts Occupations by Sex
Within the Management, Business, Science and Arts occupations in New Baltimore, the most male-oriented occupations are Computers & Mathematics (78.7%), Computers, Engineering & Science (77.7%), and Architecture & Engineering (75.8%), while the most female-oriented occupations are Health Technologists (85.7%), Education Instruction & Library (83.6%), and Arts, Media & Entertainment (79.0%).
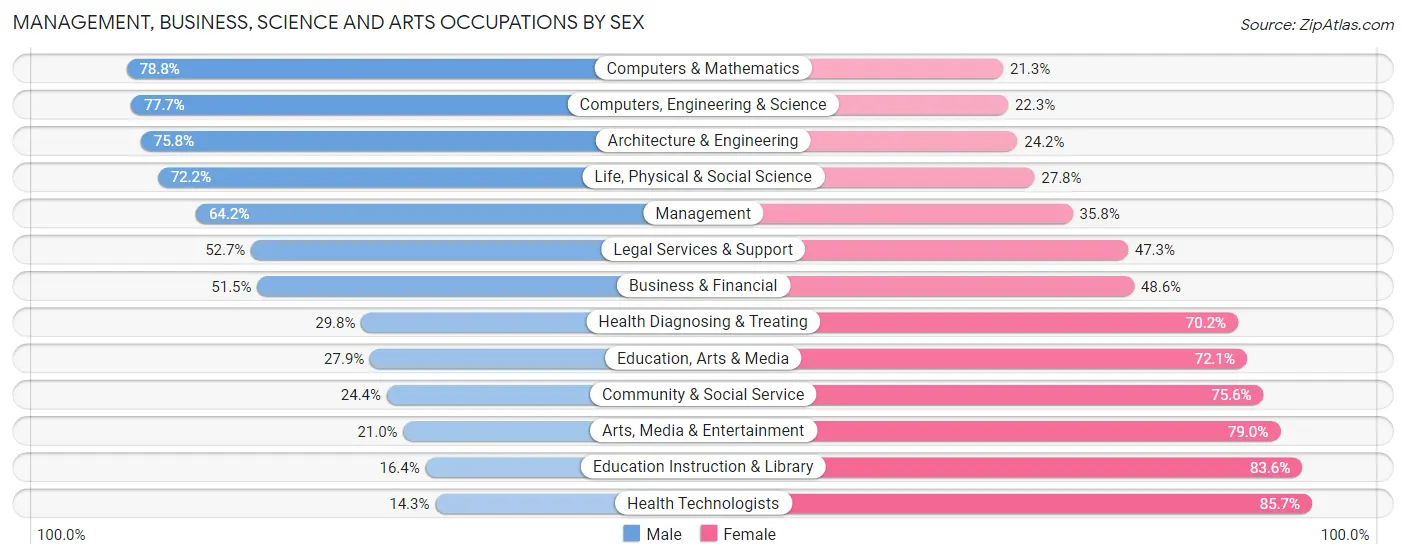
| Occupation | Male | Female |
| Management | 618 (64.2%) | 344 (35.8%) |
| Business & Financial | 337 (51.4%) | 318 (48.5%) |
| Computers, Engineering & Science | 628 (77.7%) | 180 (22.3%) |
| Computers & Mathematics | 452 (78.7%) | 122 (21.2%) |
| Architecture & Engineering | 150 (75.8%) | 48 (24.2%) |
| Life, Physical & Social Science | 26 (72.2%) | 10 (27.8%) |
| Community & Social Service | 160 (24.4%) | 495 (75.6%) |
| Education, Arts & Media | 24 (27.9%) | 62 (72.1%) |
| Legal Services & Support | 58 (52.7%) | 52 (47.3%) |
| Education Instruction & Library | 65 (16.4%) | 332 (83.6%) |
| Arts, Media & Entertainment | 13 (21.0%) | 49 (79.0%) |
| Health Diagnosing & Treating | 122 (29.8%) | 288 (70.2%) |
| Health Technologists | 45 (14.3%) | 269 (85.7%) |
| Total (Category) | 1,865 (53.4%) | 1,625 (46.6%) |
| Total (Overall) | 3,294 (54.5%) | 2,750 (45.5%) |
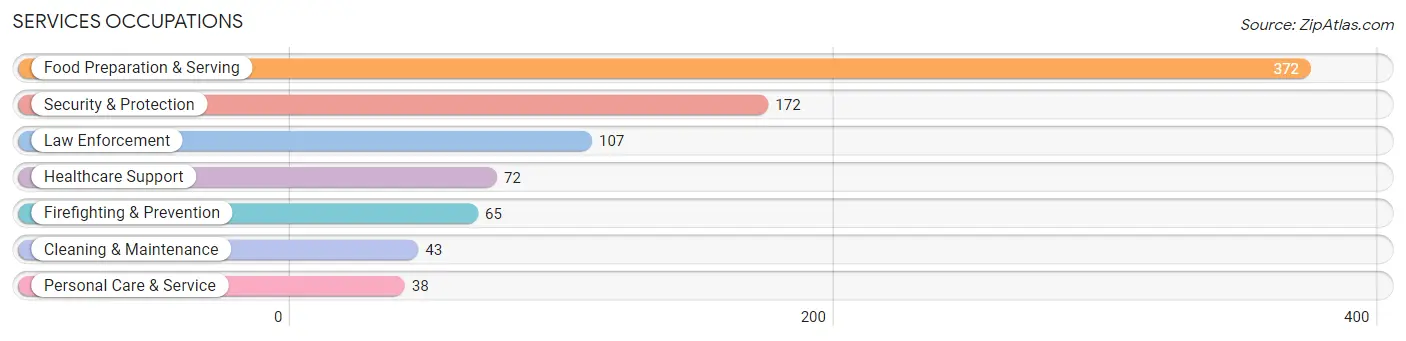
Services Occupations
The most common Services occupations in New Baltimore are Food Preparation & Serving (372 | 6.1%), Security & Protection (172 | 2.9%), Law Enforcement (107 | 1.8%), Healthcare Support (72 | 1.2%), and Firefighting & Prevention (65 | 1.1%).
Services Occupations by Sex
Within the Services occupations in New Baltimore, the most male-oriented occupations are Law Enforcement (80.4%), Cleaning & Maintenance (74.4%), and Security & Protection (67.4%), while the most female-oriented occupations are Personal Care & Service (100.0%), Healthcare Support (77.8%), and Firefighting & Prevention (53.8%).
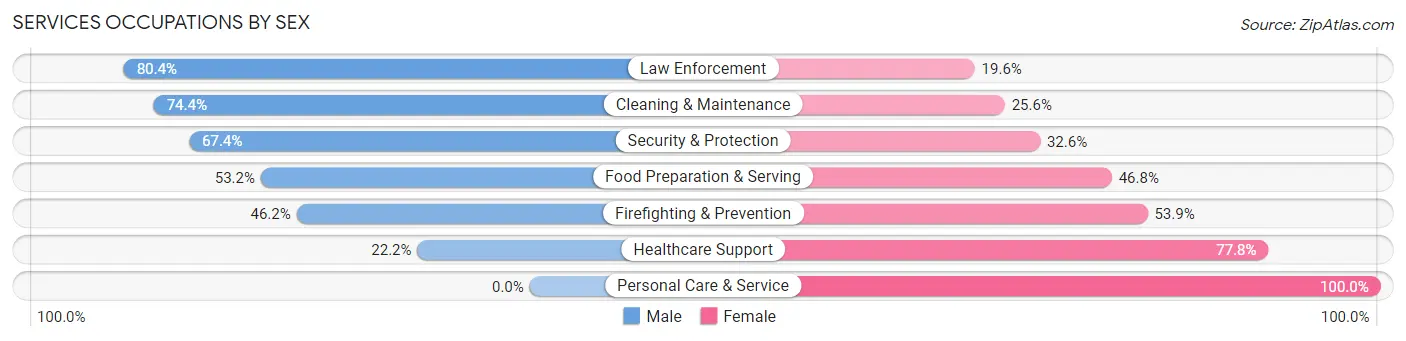
| Occupation | Male | Female |
| Healthcare Support | 16 (22.2%) | 56 (77.8%) |
| Security & Protection | 116 (67.4%) | 56 (32.6%) |
| Firefighting & Prevention | 30 (46.2%) | 35 (53.8%) |
| Law Enforcement | 86 (80.4%) | 21 (19.6%) |
| Food Preparation & Serving | 198 (53.2%) | 174 (46.8%) |
| Cleaning & Maintenance | 32 (74.4%) | 11 (25.6%) |
| Personal Care & Service | 0 (0.0%) | 38 (100.0%) |
| Total (Category) | 362 (51.9%) | 335 (48.1%) |
| Total (Overall) | 3,294 (54.5%) | 2,750 (45.5%) |
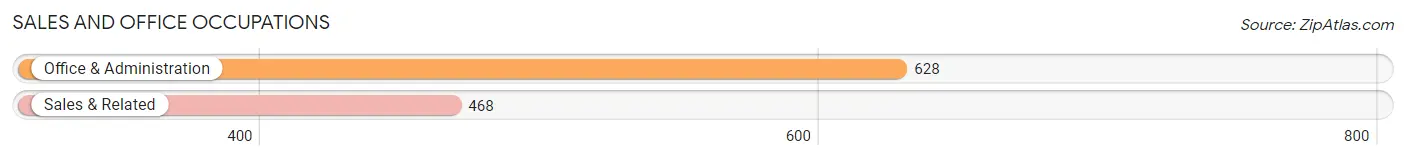
Sales and Office Occupations
The most common Sales and Office occupations in New Baltimore are Office & Administration (628 | 10.4%), and Sales & Related (468 | 7.7%).
Sales and Office Occupations by Sex
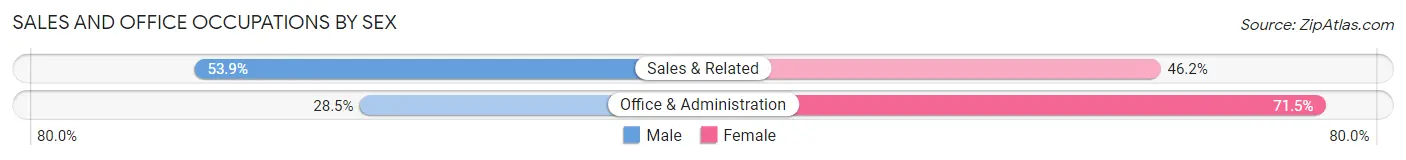
| Occupation | Male | Female |
| Sales & Related | 252 (53.8%) | 216 (46.2%) |
| Office & Administration | 179 (28.5%) | 449 (71.5%) |
| Total (Category) | 431 (39.3%) | 665 (60.7%) |
| Total (Overall) | 3,294 (54.5%) | 2,750 (45.5%) |
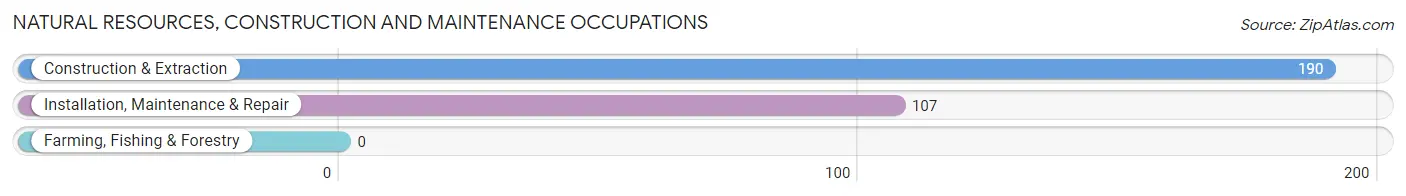
Natural Resources, Construction and Maintenance Occupations
The most common Natural Resources, Construction and Maintenance occupations in New Baltimore are Construction & Extraction (190 | 3.1%), and Installation, Maintenance & Repair (107 | 1.8%).
Natural Resources, Construction and Maintenance Occupations by Sex
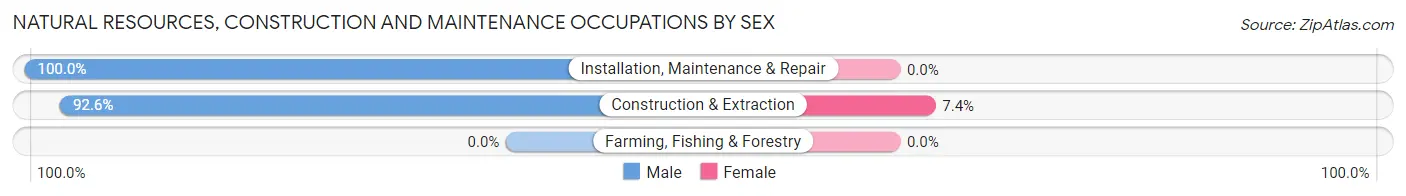
| Occupation | Male | Female |
| Farming, Fishing & Forestry | 0 (0.0%) | 0 (0.0%) |
| Construction & Extraction | 176 (92.6%) | 14 (7.4%) |
| Installation, Maintenance & Repair | 107 (100.0%) | 0 (0.0%) |
| Total (Category) | 283 (95.3%) | 14 (4.7%) |
| Total (Overall) | 3,294 (54.5%) | 2,750 (45.5%) |
Production, Transportation and Moving Occupations
The most common Production, Transportation and Moving occupations in New Baltimore are Transportation (261 | 4.3%), Production (120 | 2.0%), and Material Moving (83 | 1.4%).
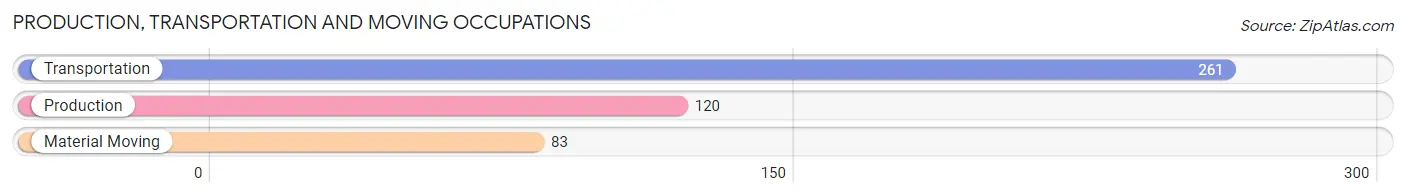
Production, Transportation and Moving Occupations by Sex
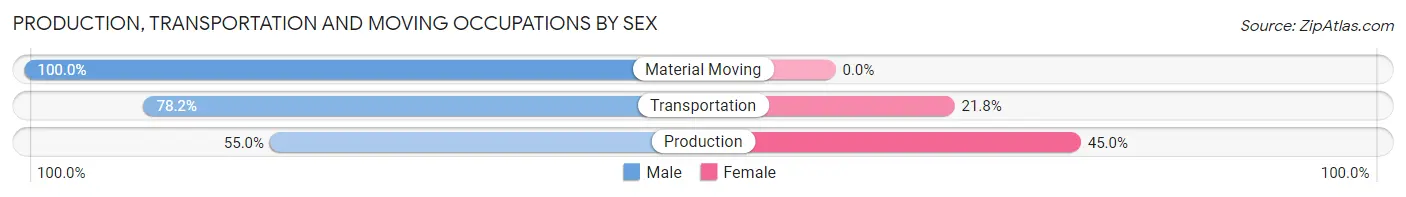
| Occupation | Male | Female |
| Production | 66 (55.0%) | 54 (45.0%) |
| Transportation | 204 (78.2%) | 57 (21.8%) |
| Material Moving | 83 (100.0%) | 0 (0.0%) |
| Total (Category) | 353 (76.1%) | 111 (23.9%) |
| Total (Overall) | 3,294 (54.5%) | 2,750 (45.5%) |
Employment Industries by Sex in New Baltimore
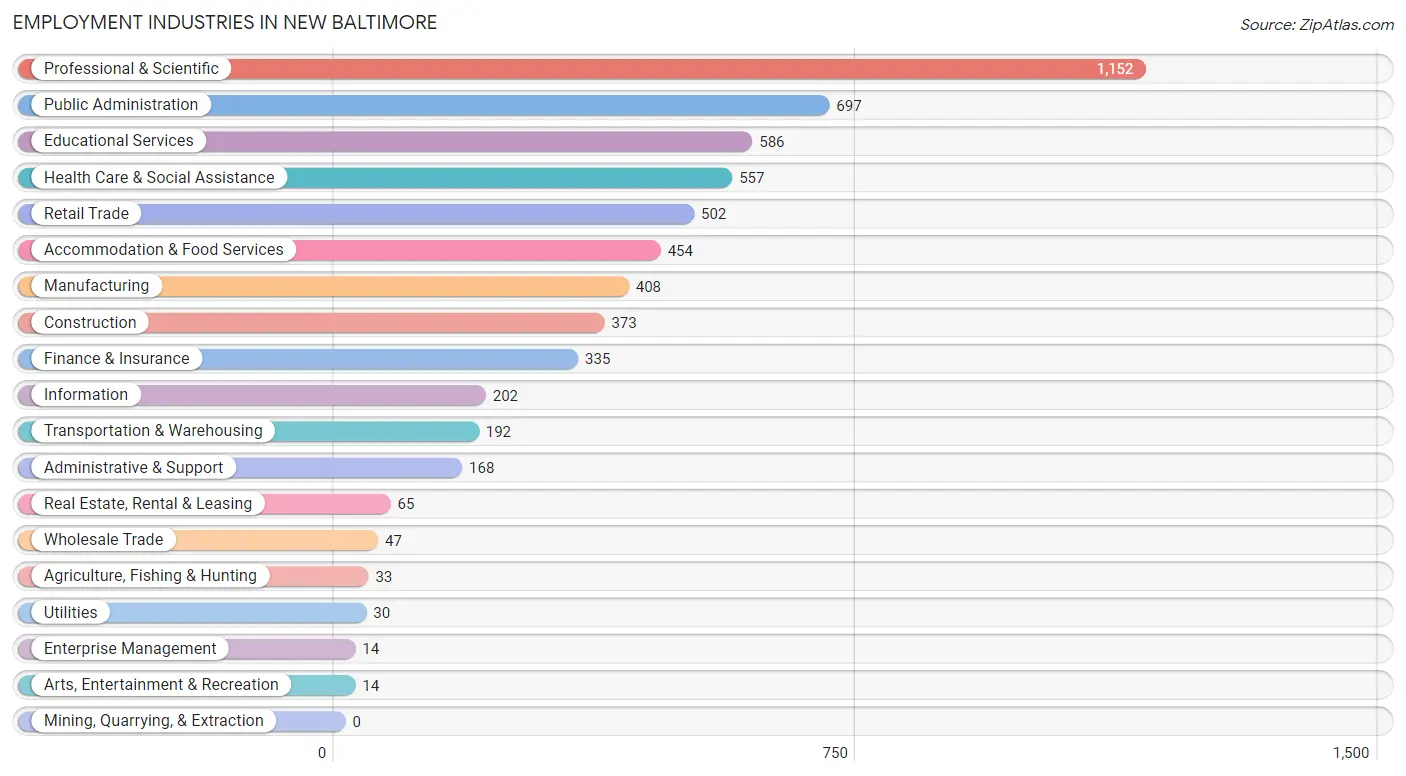
Employment Industries in New Baltimore
The major employment industries in New Baltimore include Professional & Scientific (1,152 | 19.1%), Public Administration (697 | 11.5%), Educational Services (586 | 9.7%), Health Care & Social Assistance (557 | 9.2%), and Retail Trade (502 | 8.3%).
Employment Industries by Sex in New Baltimore
The New Baltimore industries that see more men than women are Utilities (100.0%), Construction (89.3%), and Transportation & Warehousing (88.5%), whereas the industries that tend to have a higher number of women are Enterprise Management (100.0%), Arts, Entertainment & Recreation (100.0%), and Wholesale Trade (85.1%).
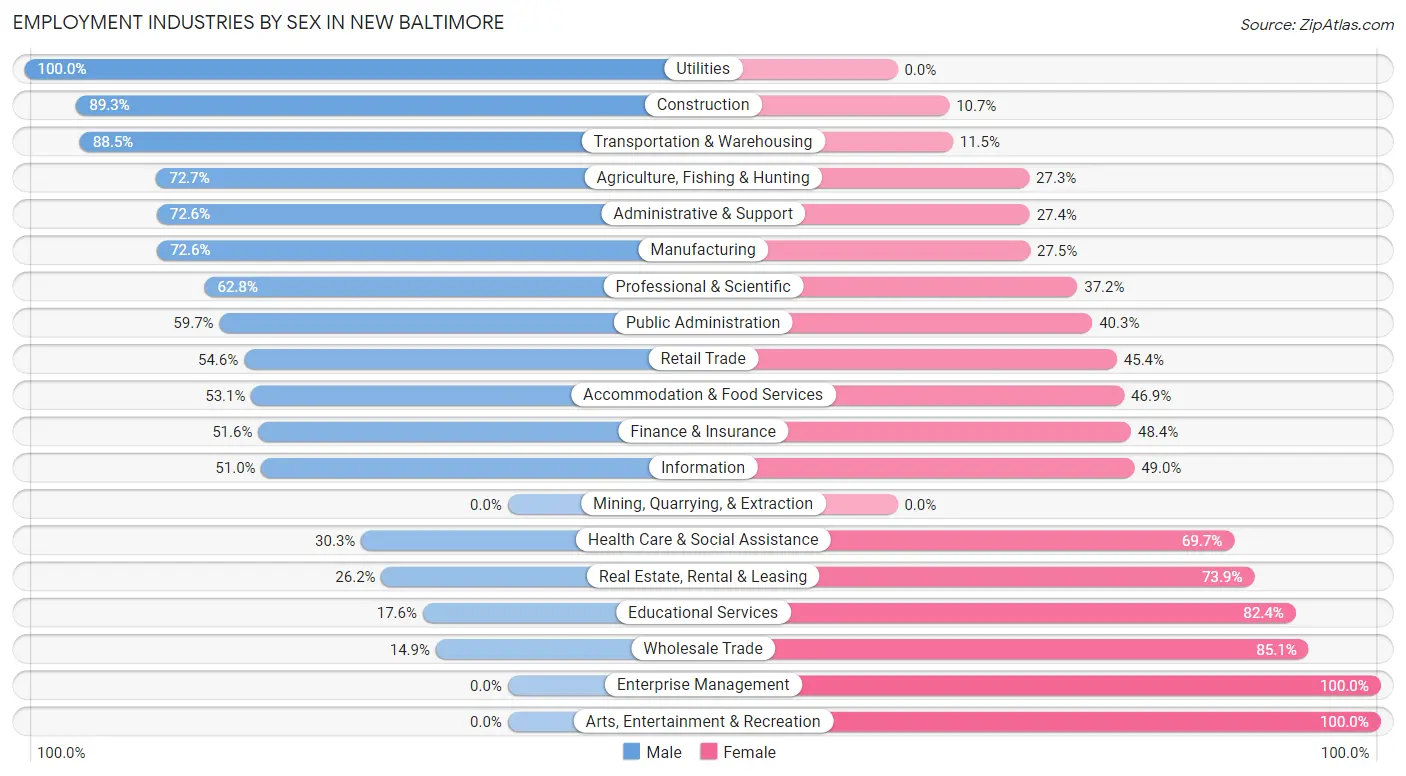
| Industry | Male | Female |
| Agriculture, Fishing & Hunting | 24 (72.7%) | 9 (27.3%) |
| Mining, Quarrying, & Extraction | 0 (0.0%) | 0 (0.0%) |
| Construction | 333 (89.3%) | 40 (10.7%) |
| Manufacturing | 296 (72.6%) | 112 (27.5%) |
| Wholesale Trade | 7 (14.9%) | 40 (85.1%) |
| Retail Trade | 274 (54.6%) | 228 (45.4%) |
| Transportation & Warehousing | 170 (88.5%) | 22 (11.5%) |
| Utilities | 30 (100.0%) | 0 (0.0%) |
| Information | 103 (51.0%) | 99 (49.0%) |
| Finance & Insurance | 173 (51.6%) | 162 (48.4%) |
| Real Estate, Rental & Leasing | 17 (26.2%) | 48 (73.9%) |
| Professional & Scientific | 723 (62.8%) | 429 (37.2%) |
| Enterprise Management | 0 (0.0%) | 14 (100.0%) |
| Administrative & Support | 122 (72.6%) | 46 (27.4%) |
| Educational Services | 103 (17.6%) | 483 (82.4%) |
| Health Care & Social Assistance | 169 (30.3%) | 388 (69.7%) |
| Arts, Entertainment & Recreation | 0 (0.0%) | 14 (100.0%) |
| Accommodation & Food Services | 241 (53.1%) | 213 (46.9%) |
| Public Administration | 416 (59.7%) | 281 (40.3%) |
| Total | 3,294 (54.5%) | 2,750 (45.5%) |
Education in New Baltimore
School Enrollment in New Baltimore
The most common levels of schooling among the 3,503 students in New Baltimore are college / undergraduate (883 | 25.2%), high school (786 | 22.4%), and elementary school (699 | 20.0%).
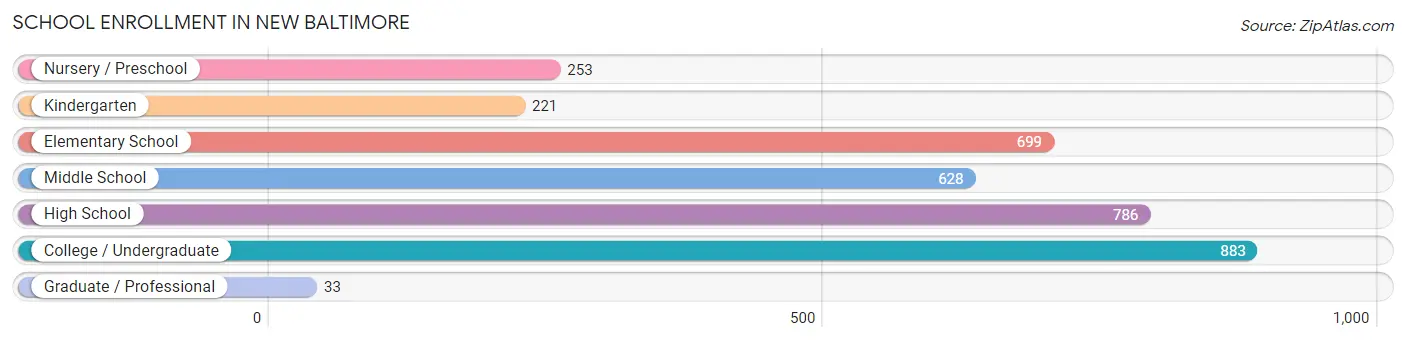
| School Level | # Students | % Students |
| Nursery / Preschool | 253 | 7.2% |
| Kindergarten | 221 | 6.3% |
| Elementary School | 699 | 20.0% |
| Middle School | 628 | 17.9% |
| High School | 786 | 22.4% |
| College / Undergraduate | 883 | 25.2% |
| Graduate / Professional | 33 | 0.9% |
| Total | 3,503 | 100.0% |
School Enrollment by Age by Funding Source in New Baltimore
Out of a total of 3,503 students who are enrolled in schools in New Baltimore, 802 (22.9%) attend a private institution, while the remaining 2,701 (77.1%) are enrolled in public schools. The age group of 3 to 4 year olds has the highest likelihood of being enrolled in private schools, with 201 (88.2% in the age bracket) enrolled. Conversely, the age group of 18 to 19 year olds has the lowest likelihood of being enrolled in a private school, with 228 (100.0% in the age bracket) attending a public institution.
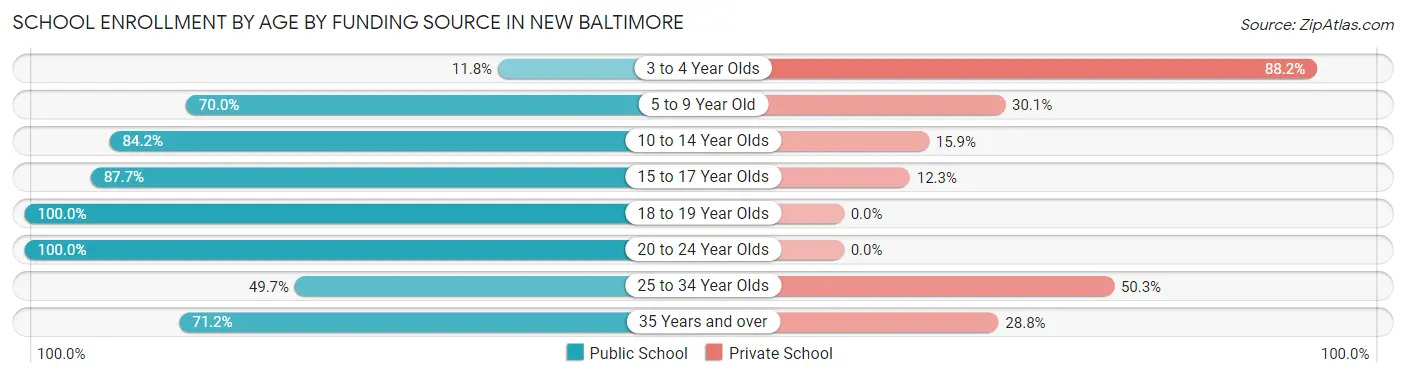
| Age Bracket | Public School | Private School |
| 3 to 4 Year Olds | 27 (11.8%) | 201 (88.2%) |
| 5 to 9 Year Old | 589 (70.0%) | 253 (30.0%) |
| 10 to 14 Year Olds | 738 (84.2%) | 139 (15.9%) |
| 15 to 17 Year Olds | 491 (87.7%) | 69 (12.3%) |
| 18 to 19 Year Olds | 228 (100.0%) | 0 (0.0%) |
| 20 to 24 Year Olds | 394 (100.0%) | 0 (0.0%) |
| 25 to 34 Year Olds | 72 (49.7%) | 73 (50.3%) |
| 35 Years and over | 163 (71.2%) | 66 (28.8%) |
| Total | 2,701 (77.1%) | 802 (22.9%) |
Educational Attainment by Field of Study in New Baltimore
Business (950 | 19.1%), social sciences (587 | 11.8%), engineering (486 | 9.8%), education (432 | 8.7%), and computers & mathematics (372 | 7.5%) are the most common fields of study among 4,982 individuals in New Baltimore who have obtained a bachelor's degree or higher.
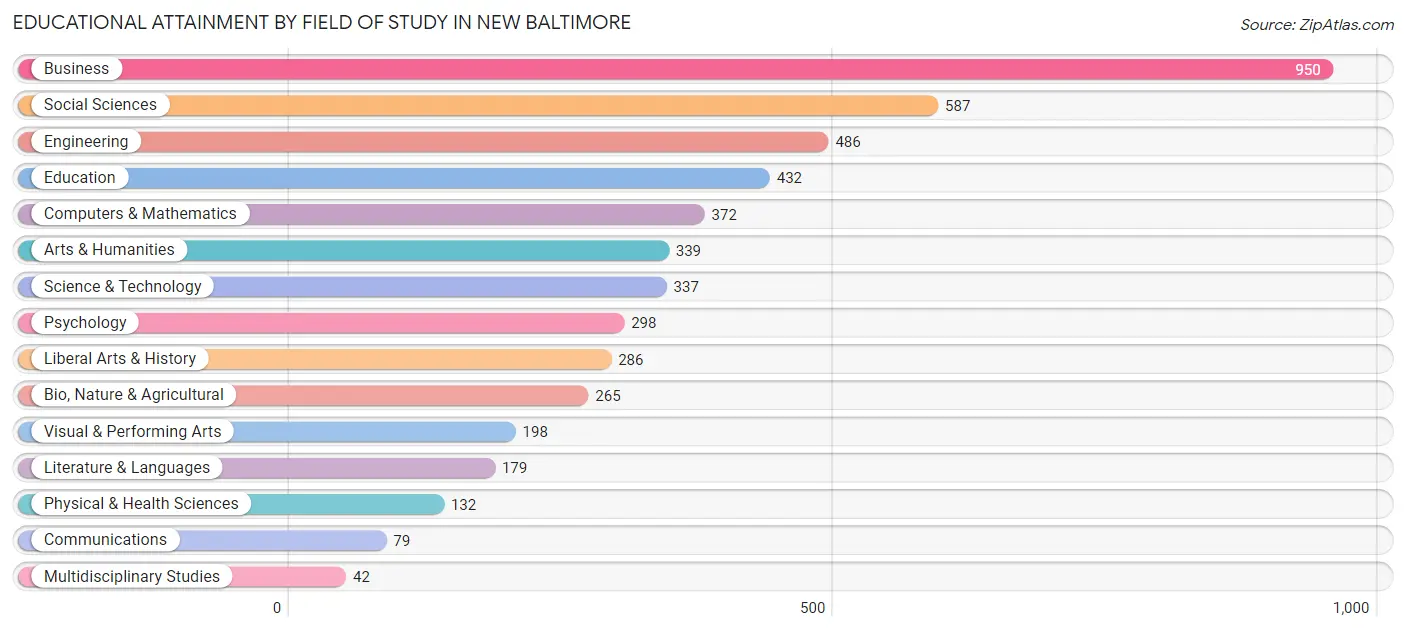
| Field of Study | # Graduates | % Graduates |
| Computers & Mathematics | 372 | 7.5% |
| Bio, Nature & Agricultural | 265 | 5.3% |
| Physical & Health Sciences | 132 | 2.6% |
| Psychology | 298 | 6.0% |
| Social Sciences | 587 | 11.8% |
| Engineering | 486 | 9.8% |
| Multidisciplinary Studies | 42 | 0.8% |
| Science & Technology | 337 | 6.8% |
| Business | 950 | 19.1% |
| Education | 432 | 8.7% |
| Literature & Languages | 179 | 3.6% |
| Liberal Arts & History | 286 | 5.7% |
| Visual & Performing Arts | 198 | 4.0% |
| Communications | 79 | 1.6% |
| Arts & Humanities | 339 | 6.8% |
| Total | 4,982 | 100.0% |
Transportation & Commute in New Baltimore
Vehicle Availability by Sex in New Baltimore
The most prevalent vehicle ownership categories in New Baltimore are males with 3 vehicles (1,120, accounting for 34.6%) and females with 3 vehicles (822, making up 41.5%).
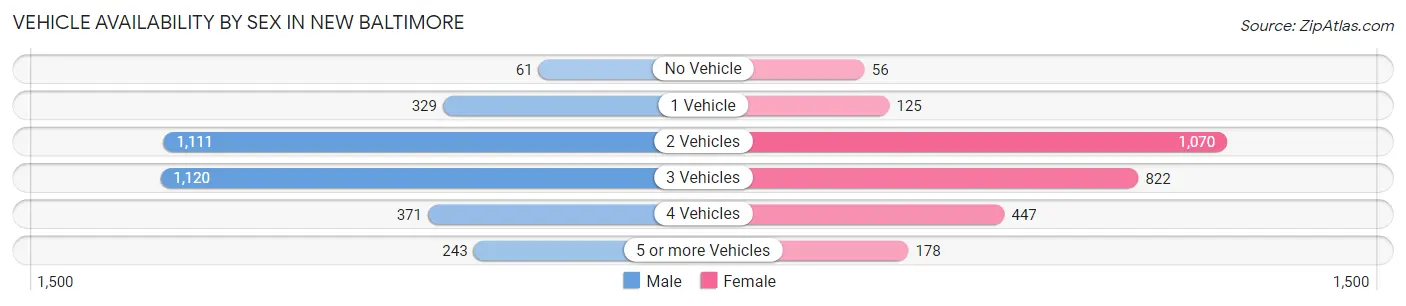
| Vehicles Available | Male | Female |
| No Vehicle | 61 (1.9%) | 56 (2.1%) |
| 1 Vehicle | 329 (10.2%) | 125 (4.6%) |
| 2 Vehicles | 1,111 (34.3%) | 1,070 (39.7%) |
| 3 Vehicles | 1,120 (34.6%) | 822 (30.5%) |
| 4 Vehicles | 371 (11.5%) | 447 (16.6%) |
| 5 or more Vehicles | 243 (7.5%) | 178 (6.6%) |
| Total | 3,235 (100.0%) | 2,698 (100.0%) |
Commute Time in New Baltimore
The most frequently occuring commute durations in New Baltimore are 60 to 89 minutes (956 commuters, 20.9%), 45 to 59 minutes (777 commuters, 17.0%), and 15 to 19 minutes (534 commuters, 11.7%).
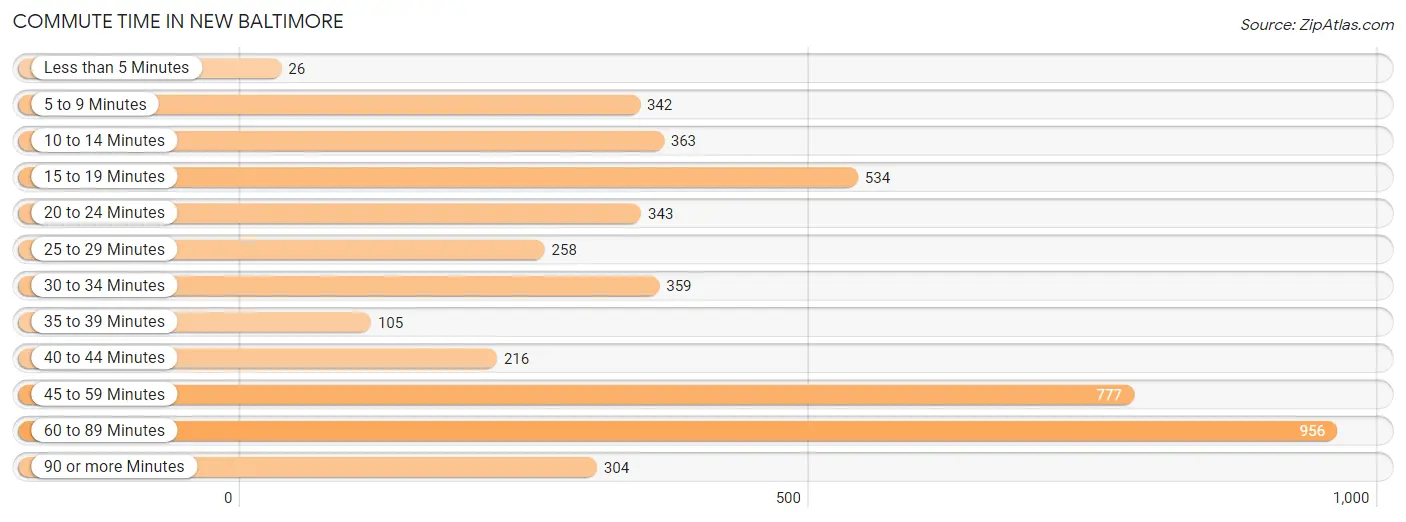
| Commute Time | # Commuters | % Commuters |
| Less than 5 Minutes | 26 | 0.6% |
| 5 to 9 Minutes | 342 | 7.5% |
| 10 to 14 Minutes | 363 | 7.9% |
| 15 to 19 Minutes | 534 | 11.7% |
| 20 to 24 Minutes | 343 | 7.5% |
| 25 to 29 Minutes | 258 | 5.6% |
| 30 to 34 Minutes | 359 | 7.8% |
| 35 to 39 Minutes | 105 | 2.3% |
| 40 to 44 Minutes | 216 | 4.7% |
| 45 to 59 Minutes | 777 | 17.0% |
| 60 to 89 Minutes | 956 | 20.9% |
| 90 or more Minutes | 304 | 6.6% |
Commute Time by Sex in New Baltimore
The most common commute times in New Baltimore are 60 to 89 minutes (679 commuters, 27.3%) for males and 15 to 19 minutes (338 commuters, 16.2%) for females.
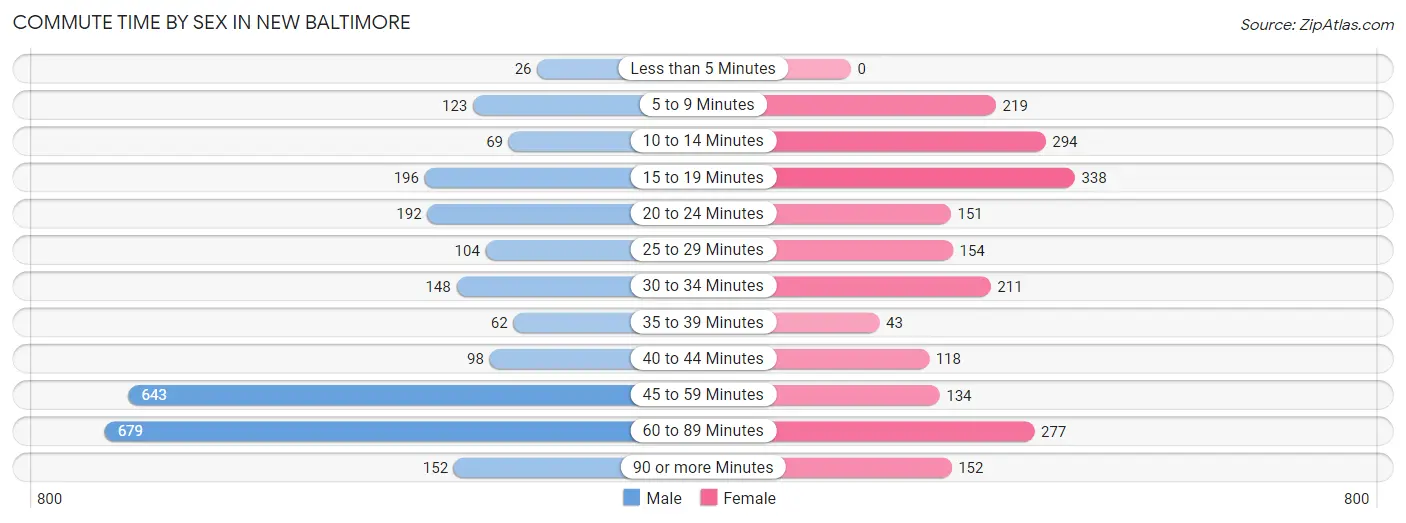
| Commute Time | Male | Female |
| Less than 5 Minutes | 26 (1.0%) | 0 (0.0%) |
| 5 to 9 Minutes | 123 (4.9%) | 219 (10.5%) |
| 10 to 14 Minutes | 69 (2.8%) | 294 (14.1%) |
| 15 to 19 Minutes | 196 (7.9%) | 338 (16.2%) |
| 20 to 24 Minutes | 192 (7.7%) | 151 (7.2%) |
| 25 to 29 Minutes | 104 (4.2%) | 154 (7.4%) |
| 30 to 34 Minutes | 148 (5.9%) | 211 (10.1%) |
| 35 to 39 Minutes | 62 (2.5%) | 43 (2.1%) |
| 40 to 44 Minutes | 98 (3.9%) | 118 (5.6%) |
| 45 to 59 Minutes | 643 (25.8%) | 134 (6.4%) |
| 60 to 89 Minutes | 679 (27.3%) | 277 (13.3%) |
| 90 or more Minutes | 152 (6.1%) | 152 (7.3%) |
Time of Departure to Work by Sex in New Baltimore
The most frequent times of departure to work in New Baltimore are 6:00 AM to 6:29 AM (404, 16.2%) for males and 7:30 AM to 7:59 AM (370, 17.7%) for females.
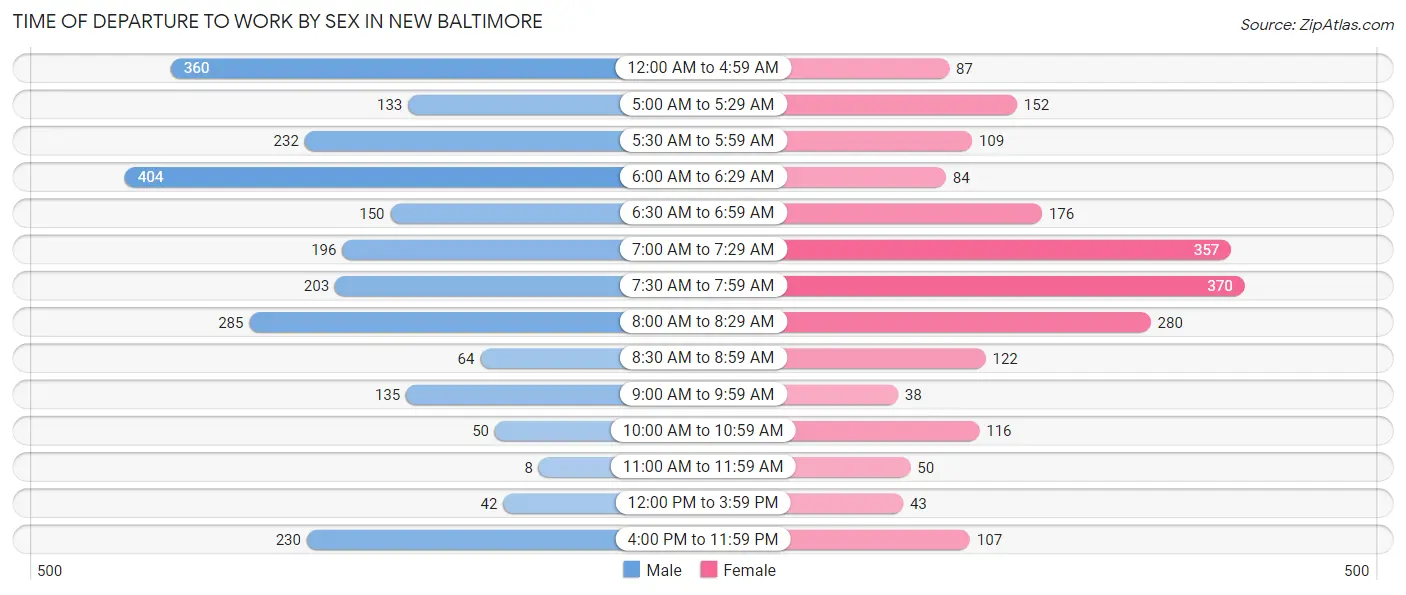
| Time of Departure | Male | Female |
| 12:00 AM to 4:59 AM | 360 (14.4%) | 87 (4.2%) |
| 5:00 AM to 5:29 AM | 133 (5.3%) | 152 (7.3%) |
| 5:30 AM to 5:59 AM | 232 (9.3%) | 109 (5.2%) |
| 6:00 AM to 6:29 AM | 404 (16.2%) | 84 (4.0%) |
| 6:30 AM to 6:59 AM | 150 (6.0%) | 176 (8.4%) |
| 7:00 AM to 7:29 AM | 196 (7.9%) | 357 (17.1%) |
| 7:30 AM to 7:59 AM | 203 (8.2%) | 370 (17.7%) |
| 8:00 AM to 8:29 AM | 285 (11.4%) | 280 (13.4%) |
| 8:30 AM to 8:59 AM | 64 (2.6%) | 122 (5.8%) |
| 9:00 AM to 9:59 AM | 135 (5.4%) | 38 (1.8%) |
| 10:00 AM to 10:59 AM | 50 (2.0%) | 116 (5.6%) |
| 11:00 AM to 11:59 AM | 8 (0.3%) | 50 (2.4%) |
| 12:00 PM to 3:59 PM | 42 (1.7%) | 43 (2.1%) |
| 4:00 PM to 11:59 PM | 230 (9.2%) | 107 (5.1%) |
| Total | 2,492 (100.0%) | 2,091 (100.0%) |
Housing Occupancy in New Baltimore
Occupancy by Ownership in New Baltimore
Of the total 3,698 dwellings in New Baltimore, owner-occupied units account for 3,419 (92.5%), while renter-occupied units make up 279 (7.5%).
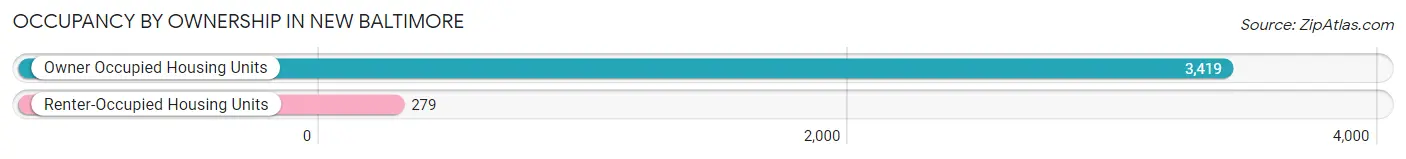
| Occupancy | # Housing Units | % Housing Units |
| Owner Occupied Housing Units | 3,419 | 92.5% |
| Renter-Occupied Housing Units | 279 | 7.5% |
| Total Occupied Housing Units | 3,698 | 100.0% |
Occupancy by Household Size in New Baltimore
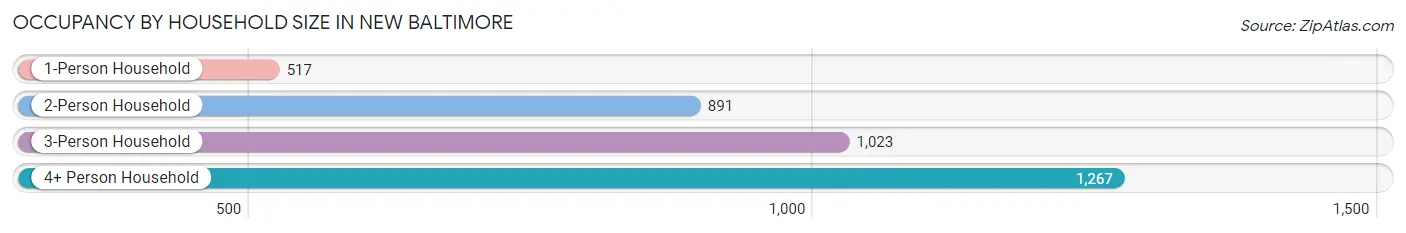
| Household Size | # Housing Units | % Housing Units |
| 1-Person Household | 517 | 14.0% |
| 2-Person Household | 891 | 24.1% |
| 3-Person Household | 1,023 | 27.7% |
| 4+ Person Household | 1,267 | 34.3% |
| Total Housing Units | 3,698 | 100.0% |
Occupancy by Ownership by Household Size in New Baltimore
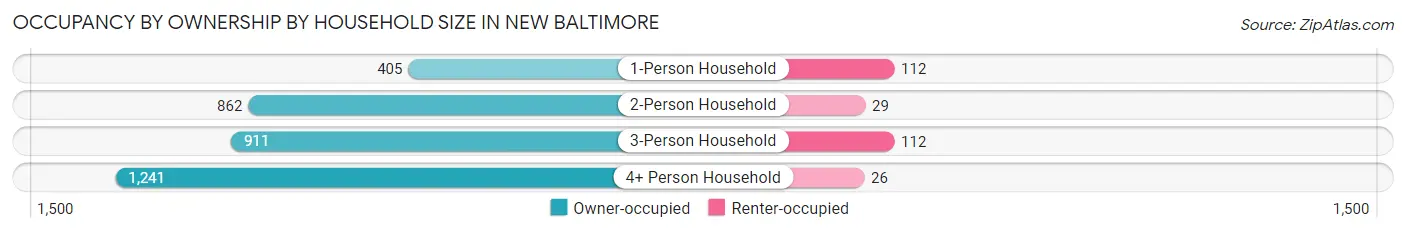
| Household Size | Owner-occupied | Renter-occupied |
| 1-Person Household | 405 (78.3%) | 112 (21.7%) |
| 2-Person Household | 862 (96.8%) | 29 (3.3%) |
| 3-Person Household | 911 (89.0%) | 112 (11.0%) |
| 4+ Person Household | 1,241 (98.0%) | 26 (2.1%) |
| Total Housing Units | 3,419 (92.5%) | 279 (7.5%) |
Occupancy by Educational Attainment in New Baltimore
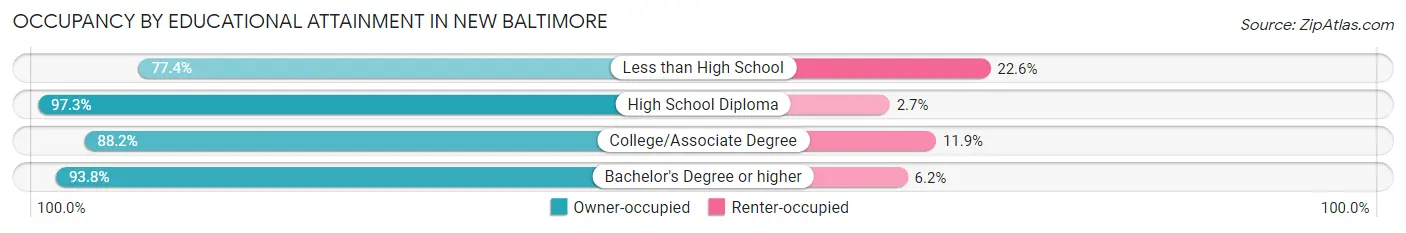
| Household Size | Owner-occupied | Renter-occupied |
| Less than High School | 65 (77.4%) | 19 (22.6%) |
| High School Diploma | 362 (97.3%) | 10 (2.7%) |
| College/Associate Degree | 751 (88.1%) | 101 (11.8%) |
| Bachelor's Degree or higher | 2,241 (93.8%) | 149 (6.2%) |
Occupancy by Age of Householder in New Baltimore
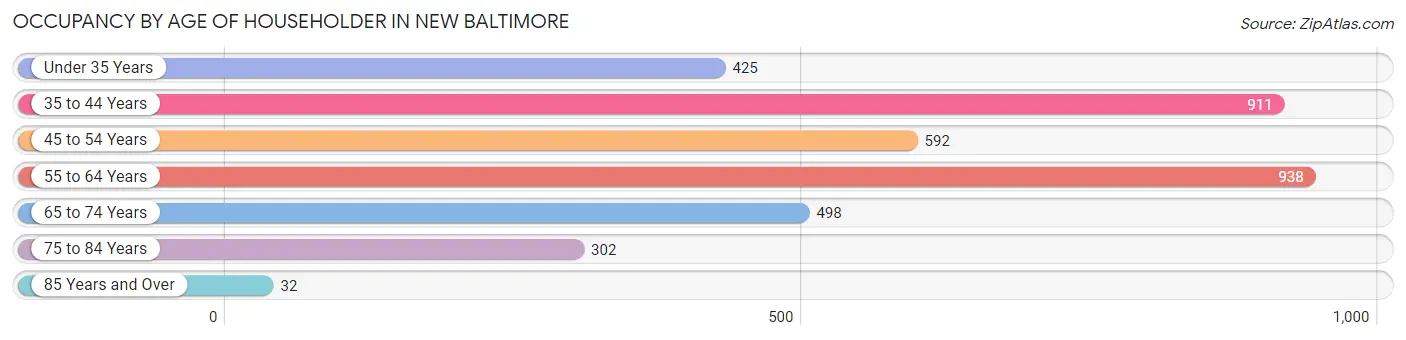
| Age Bracket | # Households | % Households |
| Under 35 Years | 425 | 11.5% |
| 35 to 44 Years | 911 | 24.6% |
| 45 to 54 Years | 592 | 16.0% |
| 55 to 64 Years | 938 | 25.4% |
| 65 to 74 Years | 498 | 13.5% |
| 75 to 84 Years | 302 | 8.2% |
| 85 Years and Over | 32 | 0.9% |
| Total | 3,698 | 100.0% |
Housing Finances in New Baltimore
Median Income by Occupancy in New Baltimore
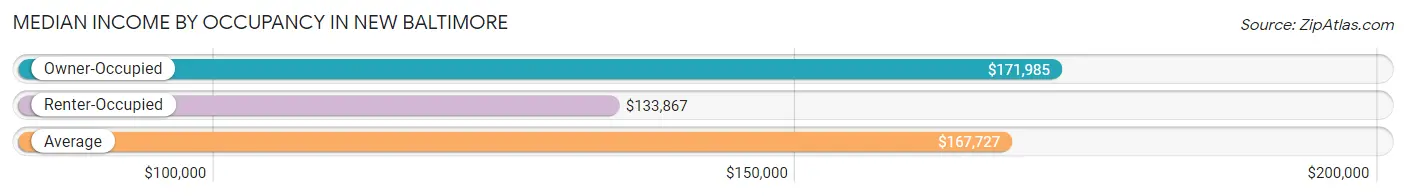
| Occupancy Type | # Households | Median Income |
| Owner-Occupied | 3,419 (92.5%) | $171,985 |
| Renter-Occupied | 279 (7.5%) | $133,867 |
| Average | 3,698 (100.0%) | $167,727 |
Occupancy by Householder Income Bracket in New Baltimore
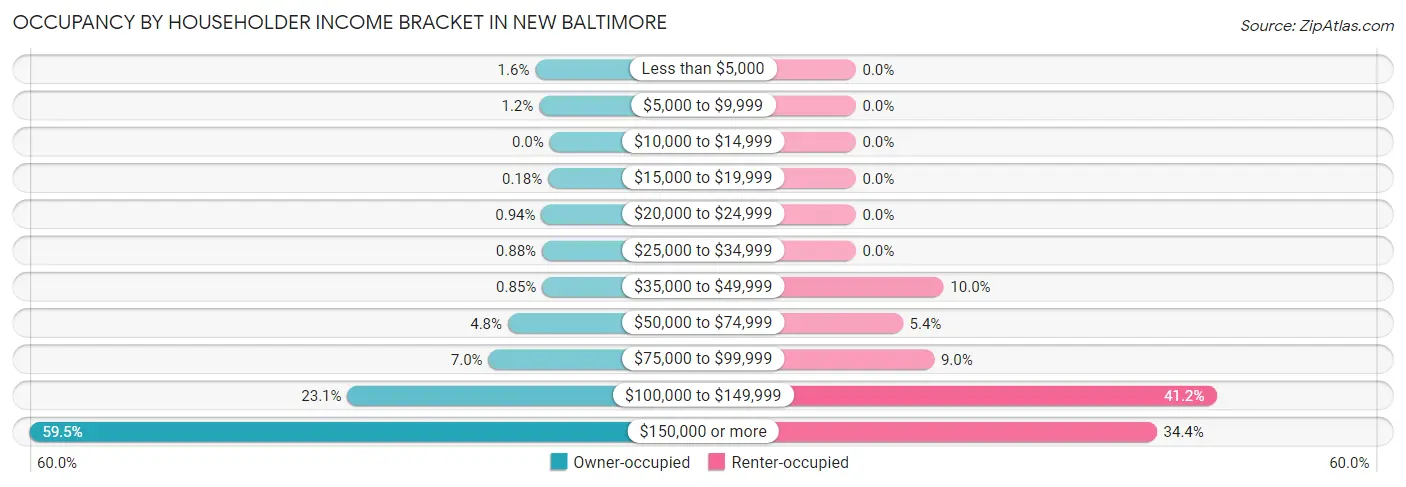
| Income Bracket | Owner-occupied | Renter-occupied |
| Less than $5,000 | 56 (1.6%) | 0 (0.0%) |
| $5,000 to $9,999 | 41 (1.2%) | 0 (0.0%) |
| $10,000 to $14,999 | 0 (0.0%) | 0 (0.0%) |
| $15,000 to $19,999 | 6 (0.2%) | 0 (0.0%) |
| $20,000 to $24,999 | 32 (0.9%) | 0 (0.0%) |
| $25,000 to $34,999 | 30 (0.9%) | 0 (0.0%) |
| $35,000 to $49,999 | 29 (0.9%) | 28 (10.0%) |
| $50,000 to $74,999 | 163 (4.8%) | 15 (5.4%) |
| $75,000 to $99,999 | 239 (7.0%) | 25 (9.0%) |
| $100,000 to $149,999 | 790 (23.1%) | 115 (41.2%) |
| $150,000 or more | 2,033 (59.5%) | 96 (34.4%) |
| Total | 3,419 (100.0%) | 279 (100.0%) |
Monthly Housing Cost Tiers in New Baltimore
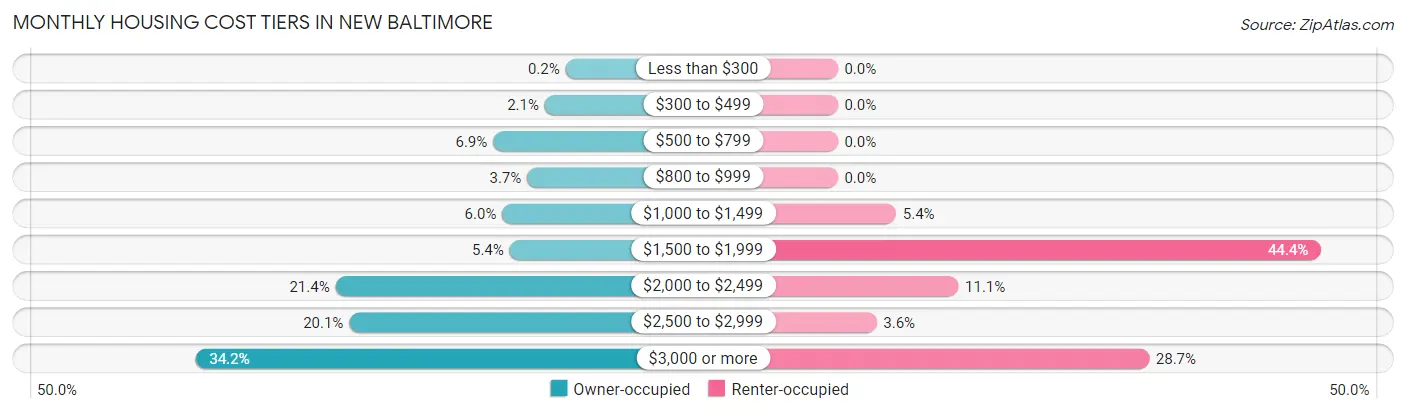
| Monthly Cost | Owner-occupied | Renter-occupied |
| Less than $300 | 7 (0.2%) | 0 (0.0%) |
| $300 to $499 | 72 (2.1%) | 0 (0.0%) |
| $500 to $799 | 235 (6.9%) | 0 (0.0%) |
| $800 to $999 | 128 (3.7%) | 0 (0.0%) |
| $1,000 to $1,499 | 206 (6.0%) | 15 (5.4%) |
| $1,500 to $1,999 | 183 (5.3%) | 124 (44.4%) |
| $2,000 to $2,499 | 731 (21.4%) | 31 (11.1%) |
| $2,500 to $2,999 | 688 (20.1%) | 10 (3.6%) |
| $3,000 or more | 1,169 (34.2%) | 80 (28.7%) |
| Total | 3,419 (100.0%) | 279 (100.0%) |
Physical Housing Characteristics in New Baltimore
Housing Structures in New Baltimore
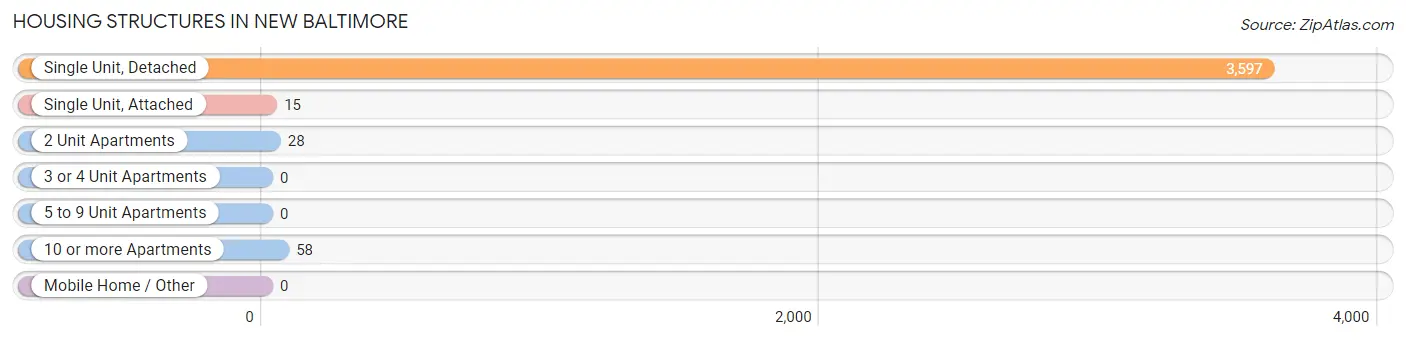
| Structure Type | # Housing Units | % Housing Units |
| Single Unit, Detached | 3,597 | 97.3% |
| Single Unit, Attached | 15 | 0.4% |
| 2 Unit Apartments | 28 | 0.8% |
| 3 or 4 Unit Apartments | 0 | 0.0% |
| 5 to 9 Unit Apartments | 0 | 0.0% |
| 10 or more Apartments | 58 | 1.6% |
| Mobile Home / Other | 0 | 0.0% |
| Total | 3,698 | 100.0% |
Housing Structures by Occupancy in New Baltimore
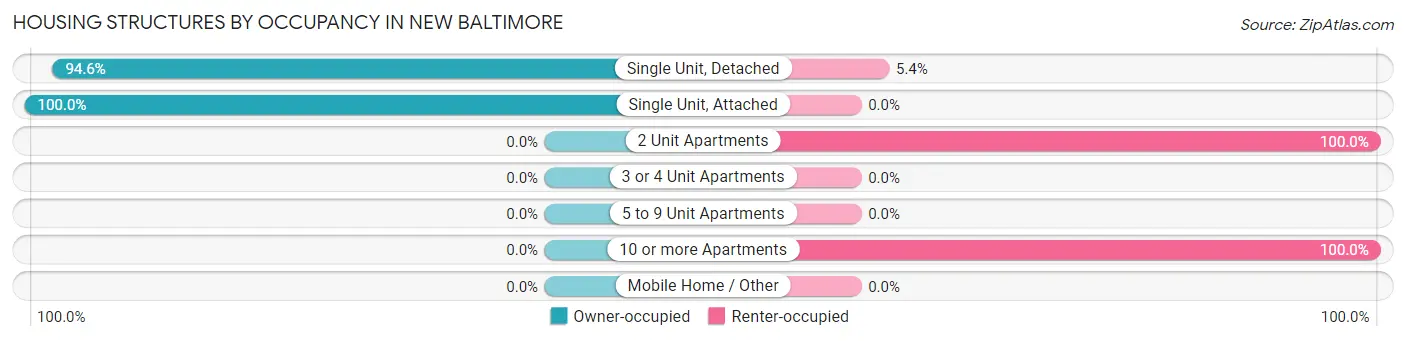
| Structure Type | Owner-occupied | Renter-occupied |
| Single Unit, Detached | 3,404 (94.6%) | 193 (5.4%) |
| Single Unit, Attached | 15 (100.0%) | 0 (0.0%) |
| 2 Unit Apartments | 0 (0.0%) | 28 (100.0%) |
| 3 or 4 Unit Apartments | 0 (0.0%) | 0 (0.0%) |
| 5 to 9 Unit Apartments | 0 (0.0%) | 0 (0.0%) |
| 10 or more Apartments | 0 (0.0%) | 58 (100.0%) |
| Mobile Home / Other | 0 (0.0%) | 0 (0.0%) |
| Total | 3,419 (92.5%) | 279 (7.5%) |
Housing Structures by Number of Rooms in New Baltimore
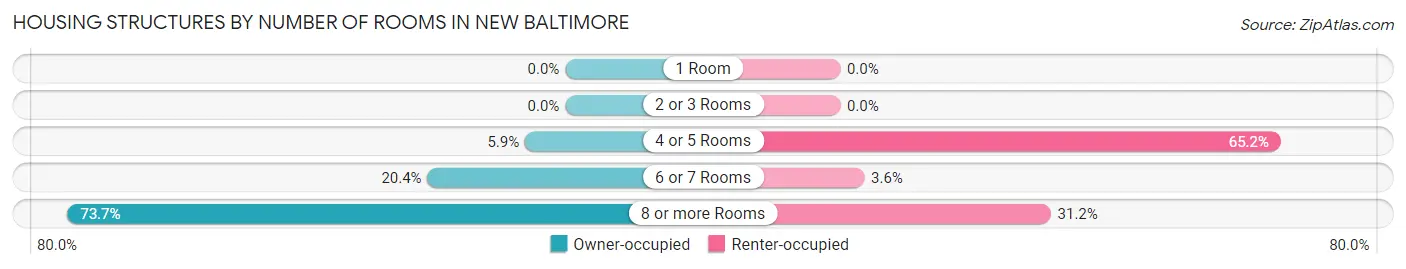
| Number of Rooms | Owner-occupied | Renter-occupied |
| 1 Room | 0 (0.0%) | 0 (0.0%) |
| 2 or 3 Rooms | 0 (0.0%) | 0 (0.0%) |
| 4 or 5 Rooms | 203 (5.9%) | 182 (65.2%) |
| 6 or 7 Rooms | 697 (20.4%) | 10 (3.6%) |
| 8 or more Rooms | 2,519 (73.7%) | 87 (31.2%) |
| Total | 3,419 (100.0%) | 279 (100.0%) |
Housing Structure by Heating Type in New Baltimore
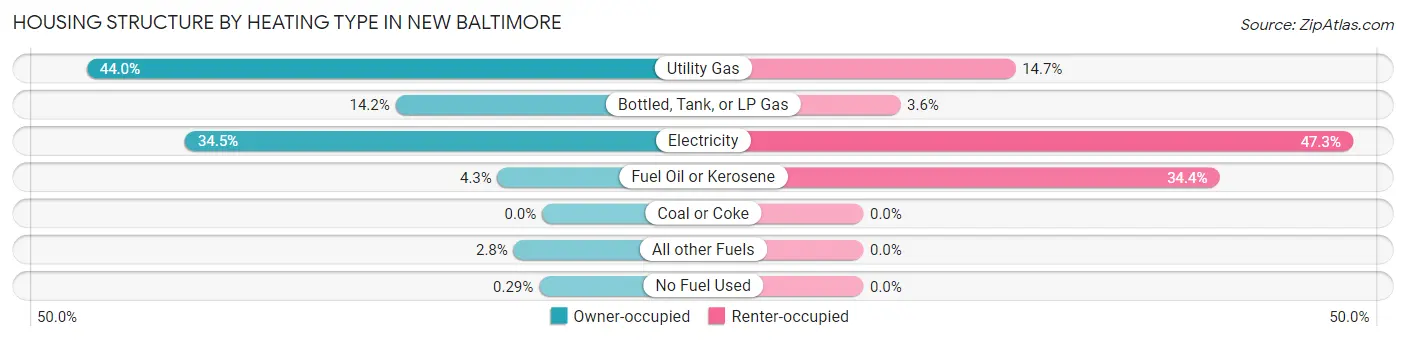
| Heating Type | Owner-occupied | Renter-occupied |
| Utility Gas | 1,504 (44.0%) | 41 (14.7%) |
| Bottled, Tank, or LP Gas | 484 (14.2%) | 10 (3.6%) |
| Electricity | 1,180 (34.5%) | 132 (47.3%) |
| Fuel Oil or Kerosene | 147 (4.3%) | 96 (34.4%) |
| Coal or Coke | 0 (0.0%) | 0 (0.0%) |
| All other Fuels | 94 (2.8%) | 0 (0.0%) |
| No Fuel Used | 10 (0.3%) | 0 (0.0%) |
| Total | 3,419 (100.0%) | 279 (100.0%) |
Household Vehicle Usage in New Baltimore
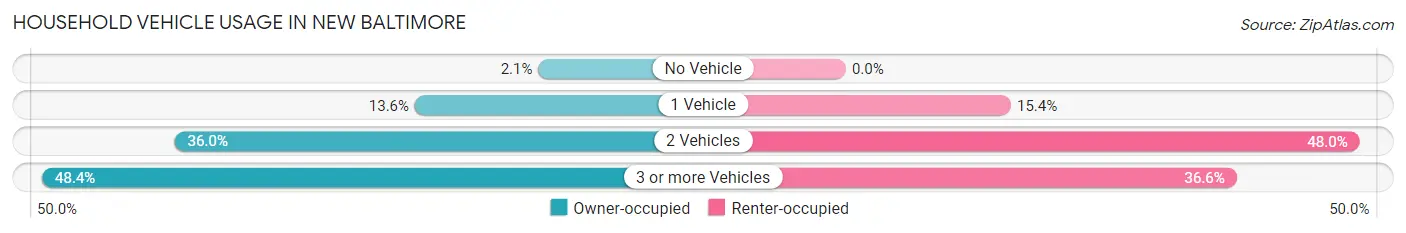
| Vehicles per Household | Owner-occupied | Renter-occupied |
| No Vehicle | 70 (2.1%) | 0 (0.0%) |
| 1 Vehicle | 464 (13.6%) | 43 (15.4%) |
| 2 Vehicles | 1,231 (36.0%) | 134 (48.0%) |
| 3 or more Vehicles | 1,654 (48.4%) | 102 (36.6%) |
| Total | 3,419 (100.0%) | 279 (100.0%) |
Real Estate & Mortgages in New Baltimore
Real Estate and Mortgage Overview in New Baltimore
| Characteristic | Without Mortgage | With Mortgage |
| Housing Units | 515 | 2,904 |
| Median Property Value | $596,200 | $599,100 |
| Median Household Income | $137,563 | $1,876 |
| Monthly Housing Costs | $779 | $1,169 |
| Real Estate Taxes | $4,265 | $27 |
Property Value by Mortgage Status in New Baltimore
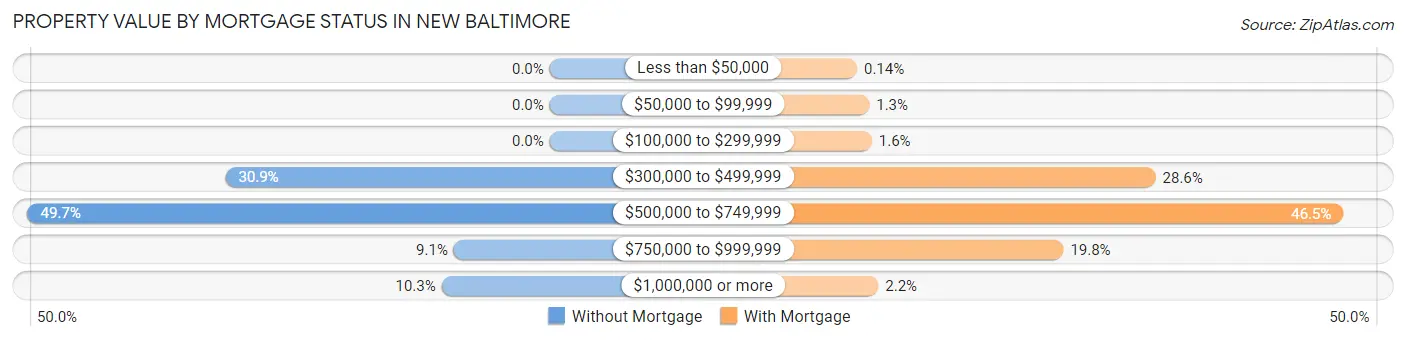
| Property Value | Without Mortgage | With Mortgage |
| Less than $50,000 | 0 (0.0%) | 4 (0.1%) |
| $50,000 to $99,999 | 0 (0.0%) | 38 (1.3%) |
| $100,000 to $299,999 | 0 (0.0%) | 45 (1.5%) |
| $300,000 to $499,999 | 159 (30.9%) | 830 (28.6%) |
| $500,000 to $749,999 | 256 (49.7%) | 1,349 (46.5%) |
| $750,000 to $999,999 | 47 (9.1%) | 575 (19.8%) |
| $1,000,000 or more | 53 (10.3%) | 63 (2.2%) |
| Total | 515 (100.0%) | 2,904 (100.0%) |
Household Income by Mortgage Status in New Baltimore
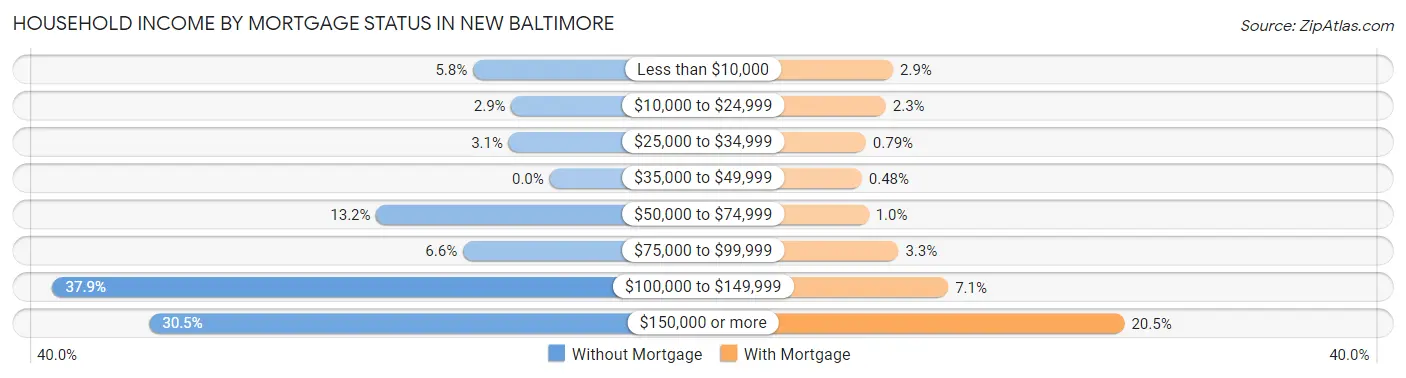
| Household Income | Without Mortgage | With Mortgage |
| Less than $10,000 | 30 (5.8%) | 83 (2.9%) |
| $10,000 to $24,999 | 15 (2.9%) | 67 (2.3%) |
| $25,000 to $34,999 | 16 (3.1%) | 23 (0.8%) |
| $35,000 to $49,999 | 0 (0.0%) | 14 (0.5%) |
| $50,000 to $74,999 | 68 (13.2%) | 29 (1.0%) |
| $75,000 to $99,999 | 34 (6.6%) | 95 (3.3%) |
| $100,000 to $149,999 | 195 (37.9%) | 205 (7.1%) |
| $150,000 or more | 157 (30.5%) | 595 (20.5%) |
| Total | 515 (100.0%) | 2,904 (100.0%) |
Property Value to Household Income Ratio in New Baltimore
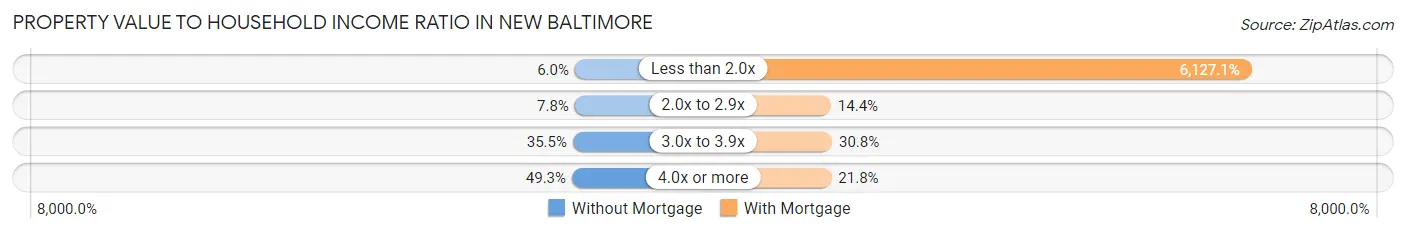
| Value-to-Income Ratio | Without Mortgage | With Mortgage |
| Less than 2.0x | 31 (6.0%) | 177,931 (6,127.1%) |
| 2.0x to 2.9x | 40 (7.8%) | 417 (14.4%) |
| 3.0x to 3.9x | 183 (35.5%) | 894 (30.8%) |
| 4.0x or more | 254 (49.3%) | 633 (21.8%) |
| Total | 515 (100.0%) | 2,904 (100.0%) |
Real Estate Taxes by Mortgage Status in New Baltimore
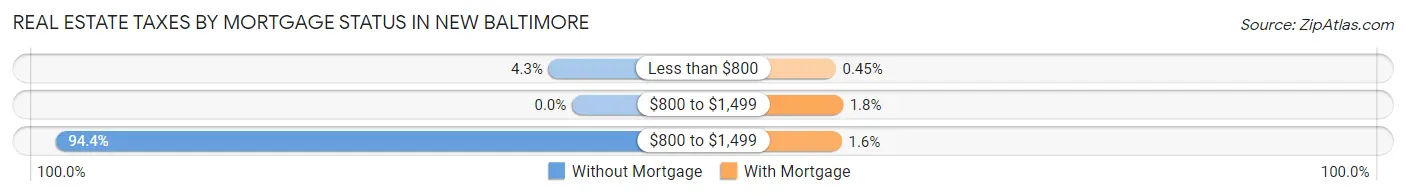
| Property Taxes | Without Mortgage | With Mortgage |
| Less than $800 | 22 (4.3%) | 13 (0.4%) |
| $800 to $1,499 | 0 (0.0%) | 51 (1.8%) |
| $800 to $1,499 | 486 (94.4%) | 45 (1.5%) |
| Total | 515 (100.0%) | 2,904 (100.0%) |
Health & Disability in New Baltimore
Health Insurance Coverage by Age in New Baltimore
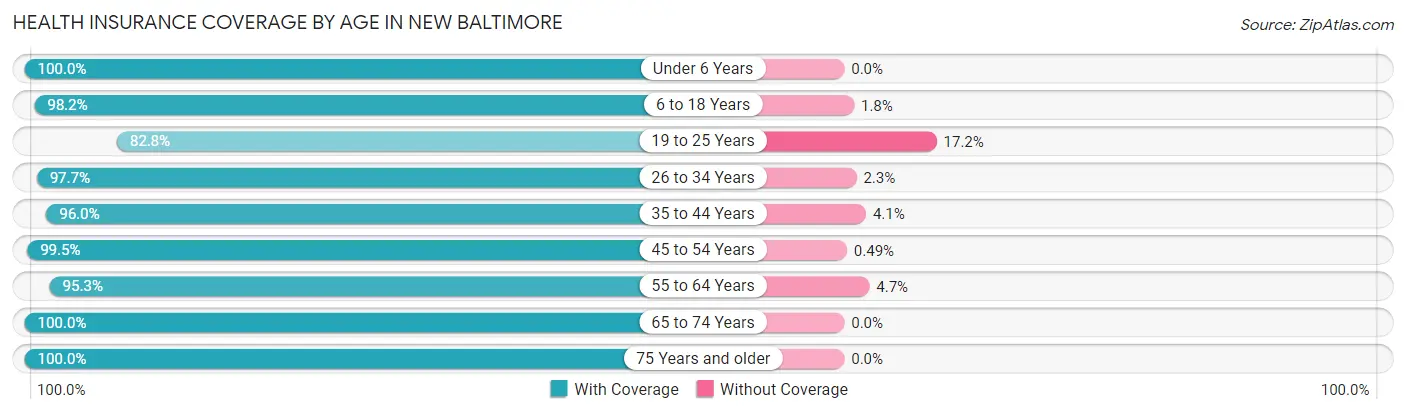
| Age Bracket | With Coverage | Without Coverage |
| Under 6 Years | 902 (100.0%) | 0 (0.0%) |
| 6 to 18 Years | 2,214 (98.2%) | 41 (1.8%) |
| 19 to 25 Years | 640 (82.8%) | 133 (17.2%) |
| 26 to 34 Years | 1,162 (97.7%) | 27 (2.3%) |
| 35 to 44 Years | 1,635 (96.0%) | 69 (4.1%) |
| 45 to 54 Years | 1,421 (99.5%) | 7 (0.5%) |
| 55 to 64 Years | 1,818 (95.3%) | 89 (4.7%) |
| 65 to 74 Years | 973 (100.0%) | 0 (0.0%) |
| 75 Years and older | 601 (100.0%) | 0 (0.0%) |
| Total | 11,366 (96.9%) | 366 (3.1%) |
Health Insurance Coverage by Citizenship Status in New Baltimore
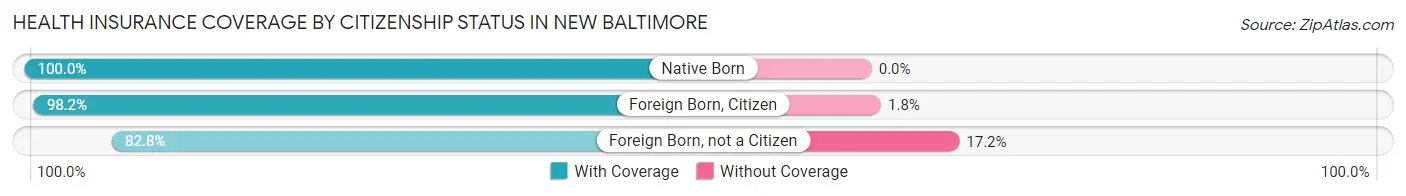
| Citizenship Status | With Coverage | Without Coverage |
| Native Born | 902 (100.0%) | 0 (0.0%) |
| Foreign Born, Citizen | 2,214 (98.2%) | 41 (1.8%) |
| Foreign Born, not a Citizen | 640 (82.8%) | 133 (17.2%) |
Health Insurance Coverage by Household Income in New Baltimore
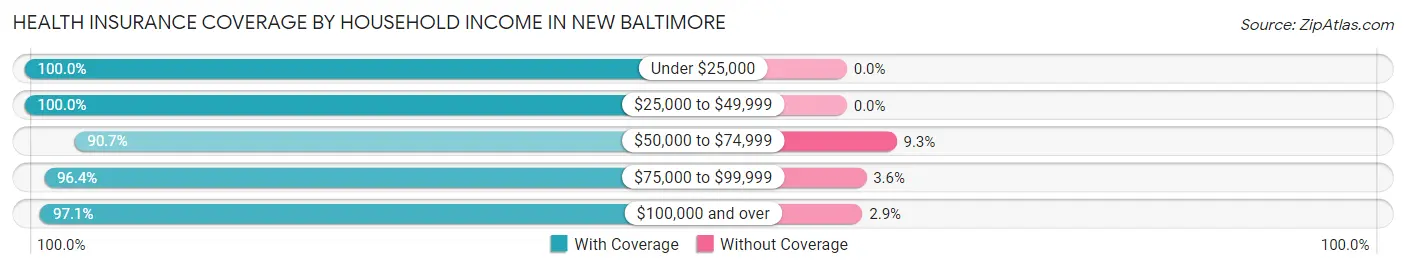
| Household Income | With Coverage | Without Coverage |
| Under $25,000 | 211 (100.0%) | 0 (0.0%) |
| $25,000 to $49,999 | 194 (100.0%) | 0 (0.0%) |
| $50,000 to $74,999 | 438 (90.7%) | 45 (9.3%) |
| $75,000 to $99,999 | 770 (96.4%) | 29 (3.6%) |
| $100,000 and over | 9,745 (97.1%) | 292 (2.9%) |
Public vs Private Health Insurance Coverage by Age in New Baltimore
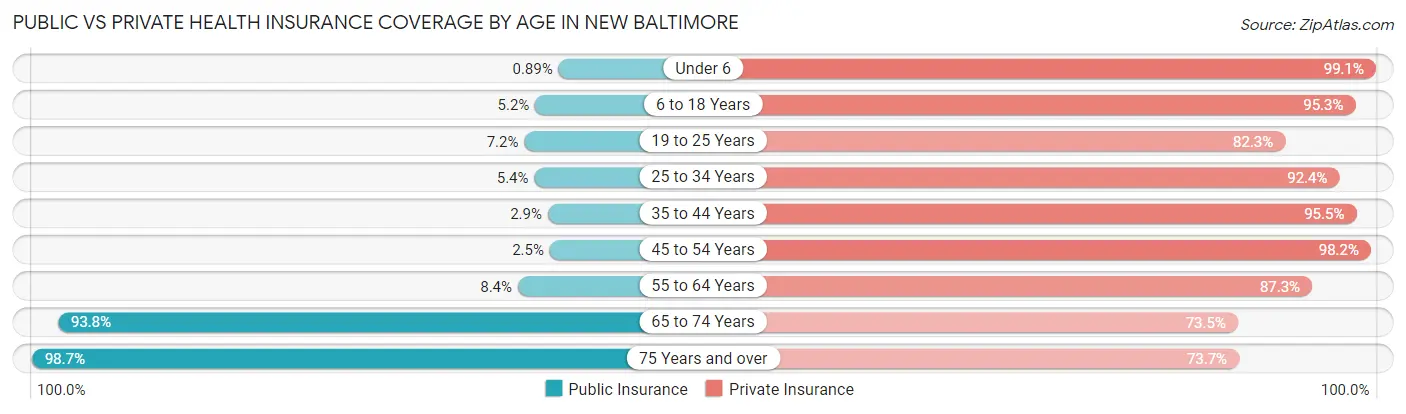
| Age Bracket | Public Insurance | Private Insurance |
| Under 6 | 8 (0.9%) | 894 (99.1%) |
| 6 to 18 Years | 118 (5.2%) | 2,149 (95.3%) |
| 19 to 25 Years | 56 (7.2%) | 636 (82.3%) |
| 25 to 34 Years | 64 (5.4%) | 1,098 (92.3%) |
| 35 to 44 Years | 49 (2.9%) | 1,627 (95.5%) |
| 45 to 54 Years | 36 (2.5%) | 1,402 (98.2%) |
| 55 to 64 Years | 161 (8.4%) | 1,664 (87.3%) |
| 65 to 74 Years | 913 (93.8%) | 715 (73.5%) |
| 75 Years and over | 593 (98.7%) | 443 (73.7%) |
| Total | 1,998 (17.0%) | 10,628 (90.6%) |
Disability Status by Sex by Age in New Baltimore
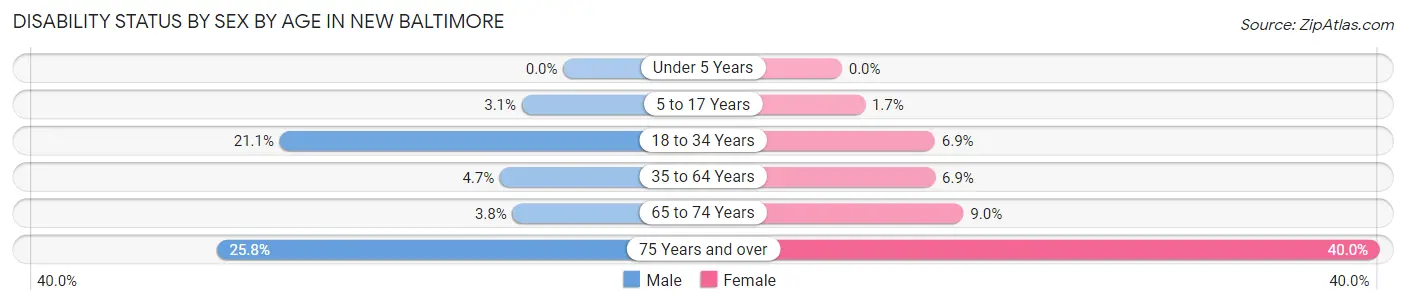
| Age Bracket | Male | Female |
| Under 5 Years | 0 (0.0%) | 0 (0.0%) |
| 5 to 17 Years | 45 (3.1%) | 15 (1.7%) |
| 18 to 34 Years | 213 (21.0%) | 75 (6.9%) |
| 35 to 64 Years | 121 (4.7%) | 171 (6.9%) |
| 65 to 74 Years | 20 (3.8%) | 40 (9.0%) |
| 75 Years and over | 60 (25.8%) | 147 (40.0%) |
Disability Class by Sex by Age in New Baltimore
Disability Class: Hearing Difficulty
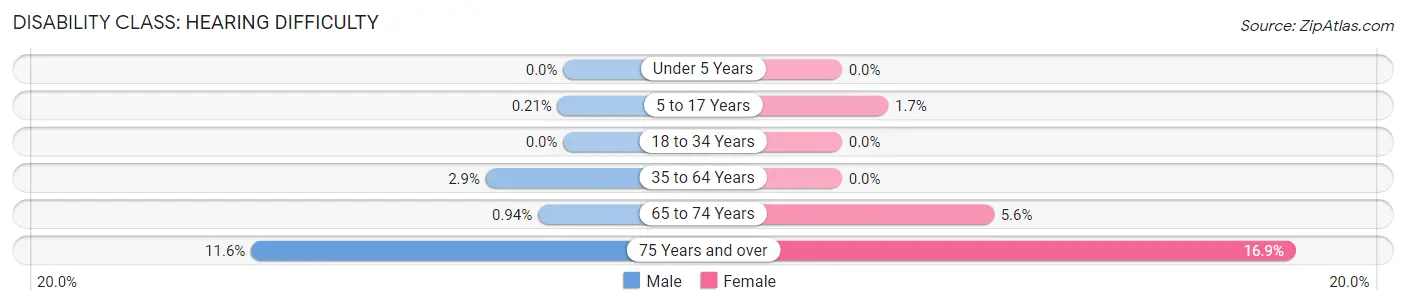
| Age Bracket | Male | Female |
| Under 5 Years | 0 (0.0%) | 0 (0.0%) |
| 5 to 17 Years | 3 (0.2%) | 15 (1.7%) |
| 18 to 34 Years | 0 (0.0%) | 0 (0.0%) |
| 35 to 64 Years | 74 (2.9%) | 0 (0.0%) |
| 65 to 74 Years | 5 (0.9%) | 25 (5.6%) |
| 75 Years and over | 27 (11.6%) | 62 (16.9%) |
Disability Class: Vision Difficulty
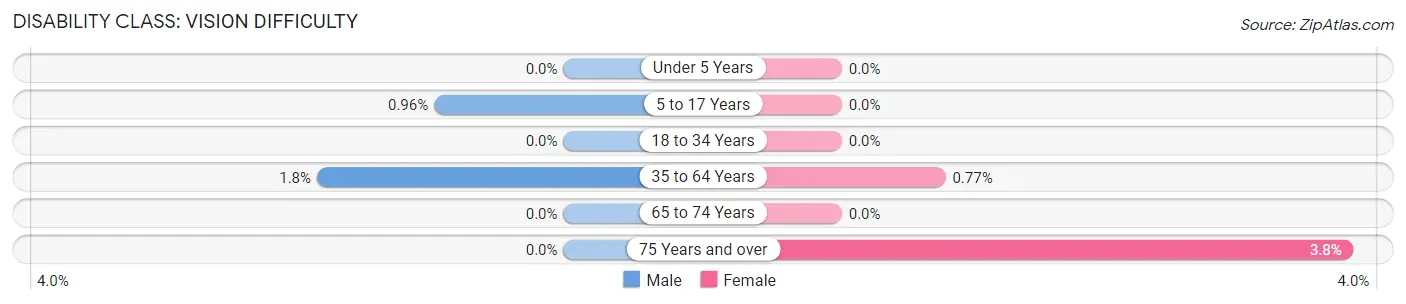
| Age Bracket | Male | Female |
| Under 5 Years | 0 (0.0%) | 0 (0.0%) |
| 5 to 17 Years | 14 (1.0%) | 0 (0.0%) |
| 18 to 34 Years | 0 (0.0%) | 0 (0.0%) |
| 35 to 64 Years | 47 (1.8%) | 19 (0.8%) |
| 65 to 74 Years | 0 (0.0%) | 0 (0.0%) |
| 75 Years and over | 0 (0.0%) | 14 (3.8%) |
Disability Class: Cognitive Difficulty
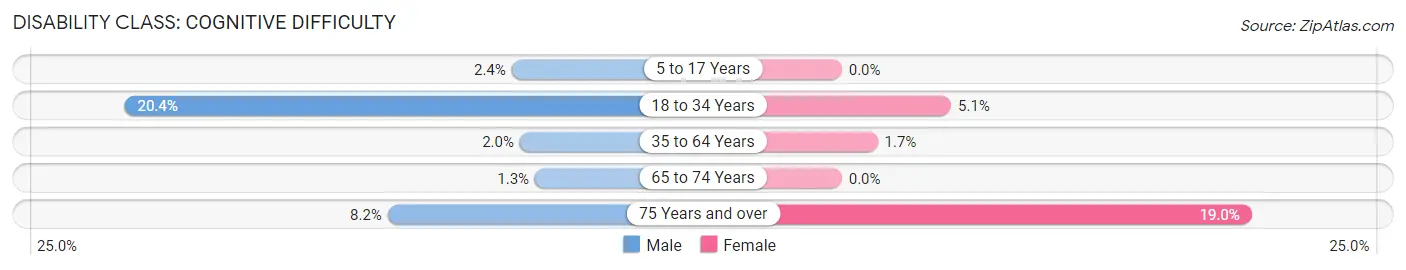
| Age Bracket | Male | Female |
| 5 to 17 Years | 35 (2.4%) | 0 (0.0%) |
| 18 to 34 Years | 206 (20.4%) | 55 (5.1%) |
| 35 to 64 Years | 52 (2.0%) | 41 (1.7%) |
| 65 to 74 Years | 7 (1.3%) | 0 (0.0%) |
| 75 Years and over | 19 (8.2%) | 70 (19.0%) |
Disability Class: Ambulatory Difficulty
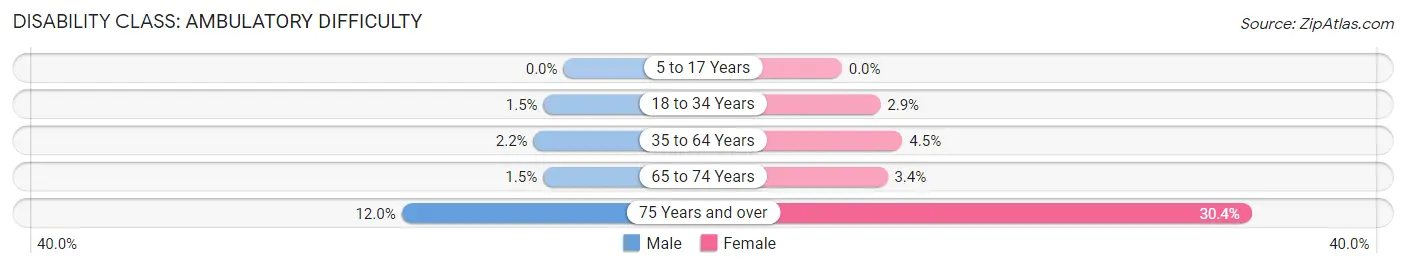
| Age Bracket | Male | Female |
| 5 to 17 Years | 0 (0.0%) | 0 (0.0%) |
| 18 to 34 Years | 15 (1.5%) | 31 (2.9%) |
| 35 to 64 Years | 57 (2.2%) | 111 (4.5%) |
| 65 to 74 Years | 8 (1.5%) | 15 (3.4%) |
| 75 Years and over | 28 (12.0%) | 112 (30.4%) |
Disability Class: Self-Care Difficulty
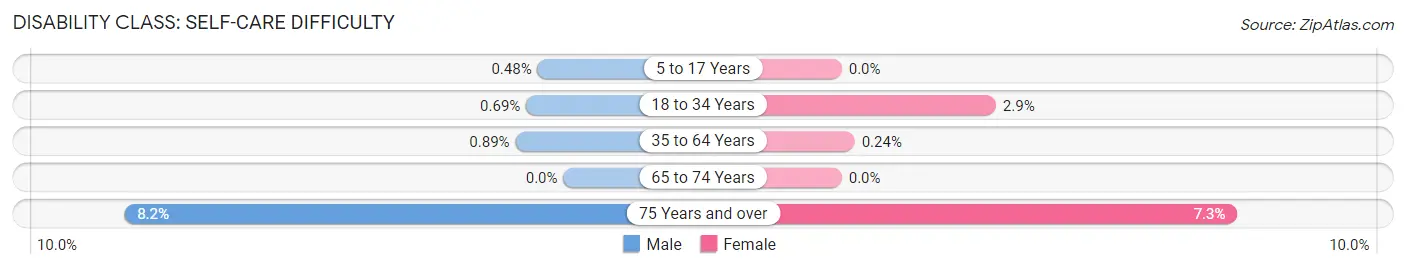
| Age Bracket | Male | Female |
| 5 to 17 Years | 7 (0.5%) | 0 (0.0%) |
| 18 to 34 Years | 7 (0.7%) | 31 (2.9%) |
| 35 to 64 Years | 23 (0.9%) | 6 (0.2%) |
| 65 to 74 Years | 0 (0.0%) | 0 (0.0%) |
| 75 Years and over | 19 (8.2%) | 27 (7.3%) |
Technology Access in New Baltimore
Computing Device Access in New Baltimore
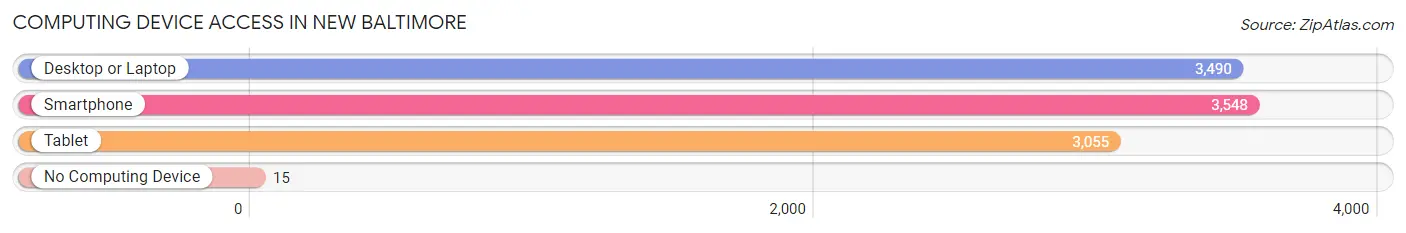
| Device Type | # Households | % Households |
| Desktop or Laptop | 3,490 | 94.4% |
| Smartphone | 3,548 | 95.9% |
| Tablet | 3,055 | 82.6% |
| No Computing Device | 15 | 0.4% |
| Total | 3,698 | 100.0% |
Internet Access in New Baltimore
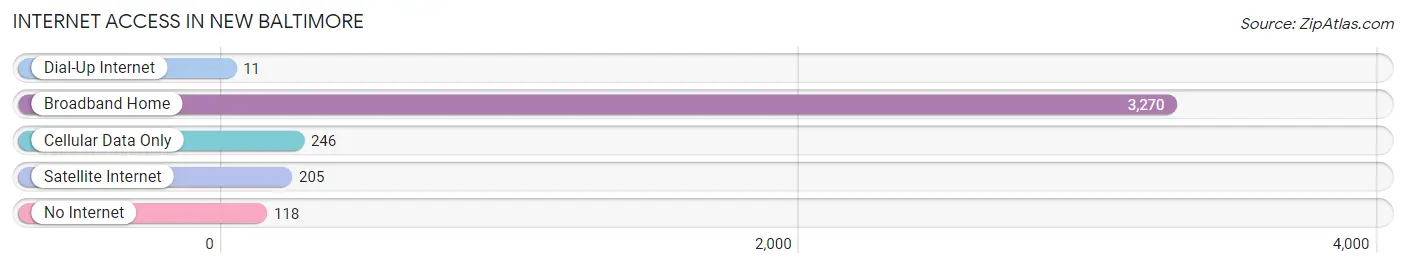
| Internet Type | # Households | % Households |
| Dial-Up Internet | 11 | 0.3% |
| Broadband Home | 3,270 | 88.4% |
| Cellular Data Only | 246 | 6.7% |
| Satellite Internet | 205 | 5.5% |
| No Internet | 118 | 3.2% |
| Total | 3,698 | 100.0% |
New Baltimore Summary
New Baltimore is a small town located in the state of Virginia, in the United States. It is situated in the northern part of the state, in the Shenandoah Valley region. The town is located in the county of Augusta, and is part of the Staunton-Waynesboro Metropolitan Statistical Area. The town has a population of approximately 1,000 people, and is a rural community with a strong agricultural base.
History
New Baltimore was founded in 1790 by a group of settlers from Pennsylvania. The town was originally known as “New Berlin”, but the name was changed to New Baltimore in 1802. The town was named after the city of Baltimore, Maryland, which was the birthplace of many of the settlers.
The town was an important stop on the Valley Turnpike, which was a major transportation route in the 19th century. The town was also a stop on the Chesapeake and Ohio Railway, which was built in the late 19th century.
The town was an important center of commerce and industry in the 19th century. It was home to several mills, including a flour mill, a sawmill, and a woolen mill. The town also had several stores, a hotel, and a post office.
Geography
New Baltimore is located in the northern part of the state of Virginia, in the Shenandoah Valley region. The town is situated in the county of Augusta, and is part of the Staunton-Waynesboro Metropolitan Statistical Area.
The town is located in the foothills of the Blue Ridge Mountains, and is surrounded by rolling hills and valleys. The town is situated at an elevation of 1,000 feet above sea level.
The climate in New Baltimore is temperate, with hot summers and cold winters. The average annual temperature is around 55 degrees Fahrenheit. The average annual precipitation is around 40 inches.
Economy
The economy of New Baltimore is largely based on agriculture. The town is home to several farms, which produce a variety of crops, including corn, wheat, hay, and soybeans. The town is also home to several wineries, which produce a variety of wines.
The town is also home to several small businesses, including restaurants, retail stores, and service providers. The town is also home to several manufacturing companies, which produce a variety of products, including furniture, clothing, and electronics.
Demographics
As of the 2010 census, the population of New Baltimore was 1,000 people. The racial makeup of the town was 97.2% White, 0.7% African American, 0.3% Native American, 0.3% Asian, and 1.5% from other races.
The median household income in New Baltimore was $41,250, and the median family income was $50,000. The per capita income in the town was $20,000. The poverty rate in the town was 11.2%.
Conclusion
New Baltimore is a small town located in the state of Virginia, in the United States. It is situated in the northern part of the state, in the Shenandoah Valley region. The town has a population of approximately 1,000 people, and is a rural community with a strong agricultural base. The town is home to several farms, wineries, and small businesses, and is an important center of commerce and industry in the region. The town has a temperate climate, with hot summers and cold winters. The population of the town is largely White, with a small percentage of African Americans, Native Americans, and Asians. The median household income in New Baltimore is $41,250, and the poverty rate is 11.2%.
Common Questions
What is Per Capita Income in New Baltimore?
Per Capita income in New Baltimore is $61,454.
What is the Median Family Income in New Baltimore?
Median Family Income in New Baltimore is $176,467.
What is the Median Household income in New Baltimore?
Median Household Income in New Baltimore is $167,727.
What is Income or Wage Gap in New Baltimore?
Income or Wage Gap in New Baltimore is 41.5%.
Women in New Baltimore earn 58.5 cents for every dollar earned by a man.
What is Inequality or Gini Index in New Baltimore?
Inequality or Gini Index in New Baltimore is 0.31.
What is the Total Population of New Baltimore?
Total Population of New Baltimore is 11,743.
What is the Total Male Population of New Baltimore?
Total Male Population of New Baltimore is 6,230.
What is the Total Female Population of New Baltimore?
Total Female Population of New Baltimore is 5,513.
What is the Ratio of Males per 100 Females in New Baltimore?
There are 113.01 Males per 100 Females in New Baltimore.
What is the Ratio of Females per 100 Males in New Baltimore?
There are 88.49 Females per 100 Males in New Baltimore.
What is the Median Population Age in New Baltimore?
Median Population Age in New Baltimore is 39.0 Years.
What is the Average Family Size in New Baltimore
Average Family Size in New Baltimore is 3.5 People.
What is the Average Household Size in New Baltimore
Average Household Size in New Baltimore is 3.2 People.
How Large is the Labor Force in New Baltimore?
There are 6,144 People in the Labor Forcein in New Baltimore.
What is the Percentage of People in the Labor Force in New Baltimore?
67.0% of People are in the Labor Force in New Baltimore.
What is the Unemployment Rate in New Baltimore?
Unemployment Rate in New Baltimore is 1.5%.