Metompkin, VA Map & Demographics
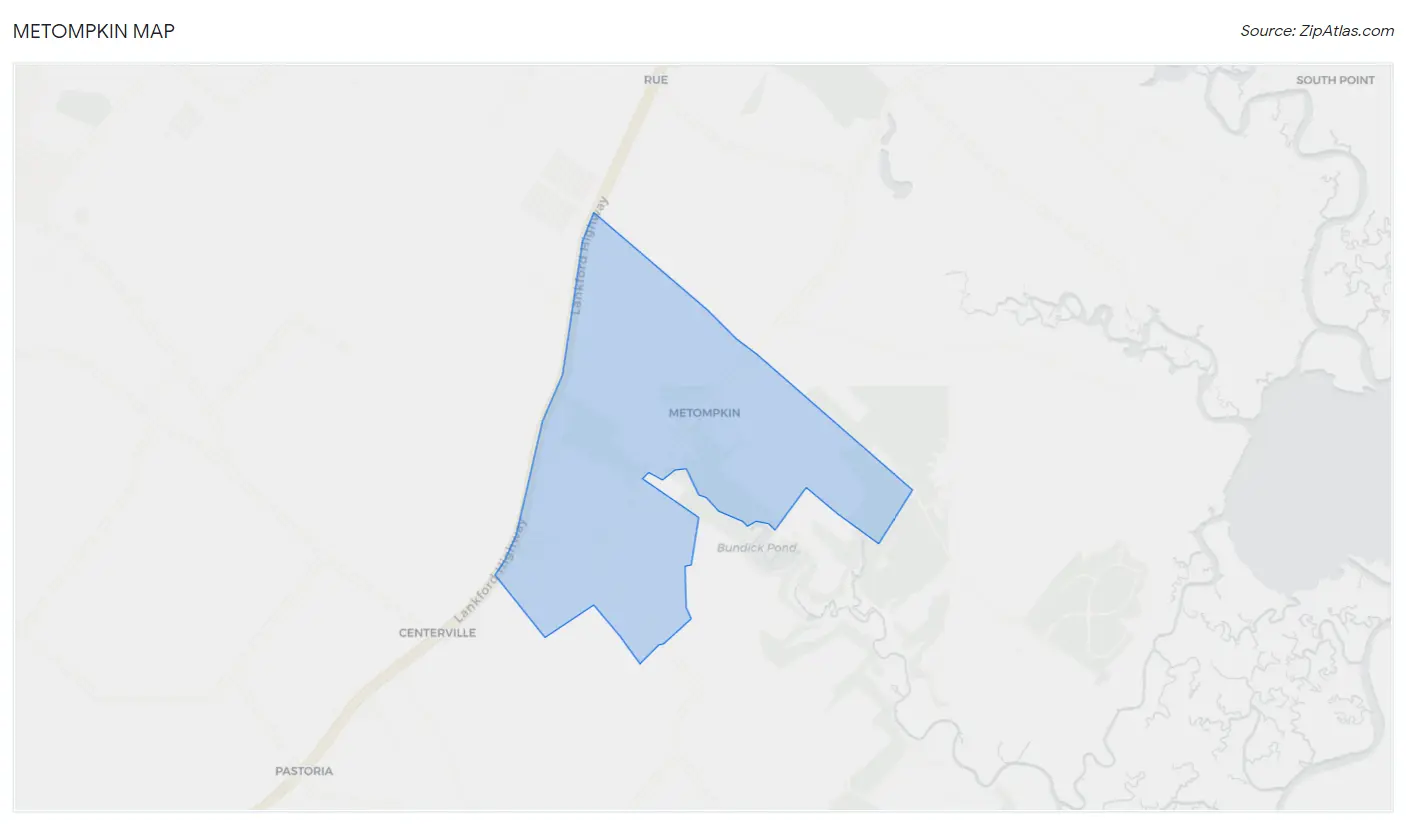
Metompkin Map
Metompkin Overview
$52,615
PER CAPITA INCOME
$23,564
AVG HOUSEHOLD INCOME
0.62
INEQUALITY / GINI INDEX
244
TOTAL POPULATION
165
MALE POPULATION
79
FEMALE POPULATION
208.86
MALES / 100 FEMALES
47.88
FEMALES / 100 MALES
56.0
MEDIAN AGE
2.2
AVG FAMILY SIZE
1.3
AVG HOUSEHOLD SIZE
171
LABOR FORCE [ PEOPLE ]
70.1%
PERCENT IN LABOR FORCE
Income in Metompkin
Income Overview in Metompkin
| Characteristic | Number | Measure |
| Per Capita Income | 244 | $52,615 |
| Median Family Income | 50 | $0 |
| Mean Family Income | 50 | $0 |
| Median Household Income | 182 | $23,564 |
| Mean Household Income | 182 | $90,902 |
| Income Deficit | 50 | $0 |
| Wage / Income Gap (%) | 244 | 0.00% |
| Wage / Income Gap ($) | 244 | 100.00¢ per $1 |
| Gini / Inequality Index | 244 | 0.62 |
Earnings by Sex in Metompkin
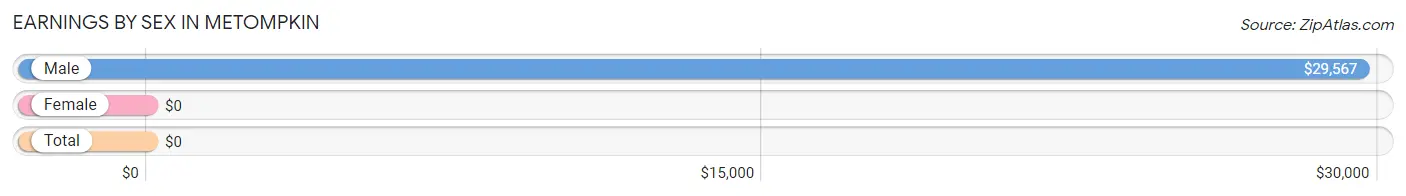
| Sex | Number | Average Earnings |
| Male | 137 (80.1%) | $29,567 |
| Female | 34 (19.9%) | $0 |
| Total | 171 (100.0%) | $0 |
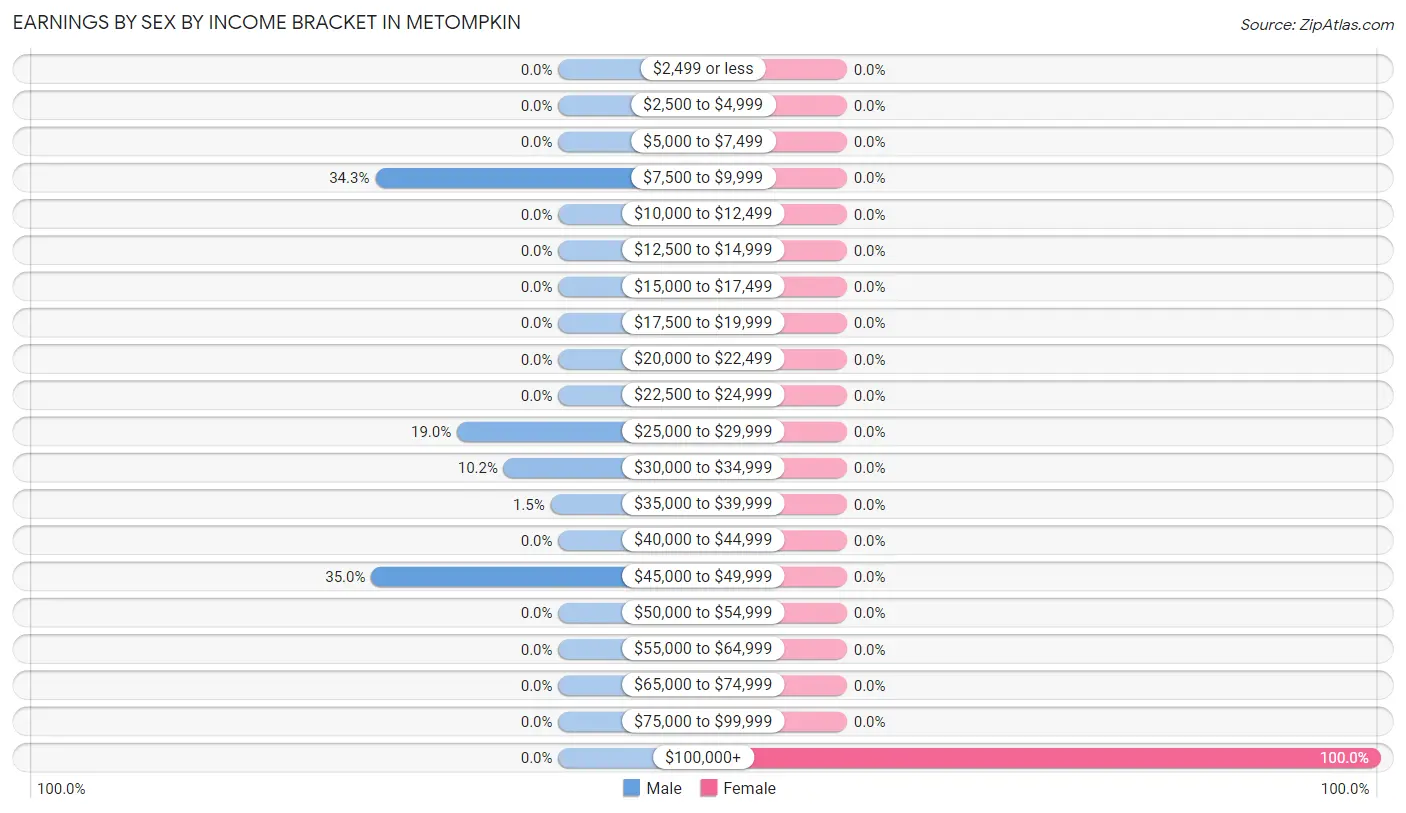
Earnings by Sex by Income Bracket in Metompkin
The most common earnings brackets in Metompkin are $45,000 to $49,999 for men (48 | 35.0%) and $100,000+ for women (34 | 100.0%).
| Income | Male | Female |
| $2,499 or less | 0 (0.0%) | 0 (0.0%) |
| $2,500 to $4,999 | 0 (0.0%) | 0 (0.0%) |
| $5,000 to $7,499 | 0 (0.0%) | 0 (0.0%) |
| $7,500 to $9,999 | 47 (34.3%) | 0 (0.0%) |
| $10,000 to $12,499 | 0 (0.0%) | 0 (0.0%) |
| $12,500 to $14,999 | 0 (0.0%) | 0 (0.0%) |
| $15,000 to $17,499 | 0 (0.0%) | 0 (0.0%) |
| $17,500 to $19,999 | 0 (0.0%) | 0 (0.0%) |
| $20,000 to $22,499 | 0 (0.0%) | 0 (0.0%) |
| $22,500 to $24,999 | 0 (0.0%) | 0 (0.0%) |
| $25,000 to $29,999 | 26 (19.0%) | 0 (0.0%) |
| $30,000 to $34,999 | 14 (10.2%) | 0 (0.0%) |
| $35,000 to $39,999 | 2 (1.5%) | 0 (0.0%) |
| $40,000 to $44,999 | 0 (0.0%) | 0 (0.0%) |
| $45,000 to $49,999 | 48 (35.0%) | 0 (0.0%) |
| $50,000 to $54,999 | 0 (0.0%) | 0 (0.0%) |
| $55,000 to $64,999 | 0 (0.0%) | 0 (0.0%) |
| $65,000 to $74,999 | 0 (0.0%) | 0 (0.0%) |
| $75,000 to $99,999 | 0 (0.0%) | 0 (0.0%) |
| $100,000+ | 0 (0.0%) | 34 (100.0%) |
| Total | 137 (100.0%) | 34 (100.0%) |
Earnings by Sex by Educational Attainment in Metompkin
| Educational Attainment | Male Income | Female Income |
| Less than High School | - | - |
| High School Diploma | - | - |
| College or Associate's Degree | - | - |
| Bachelor's Degree | - | - |
| Graduate Degree | - | - |
| Total | - | - |
Family Income in Metompkin
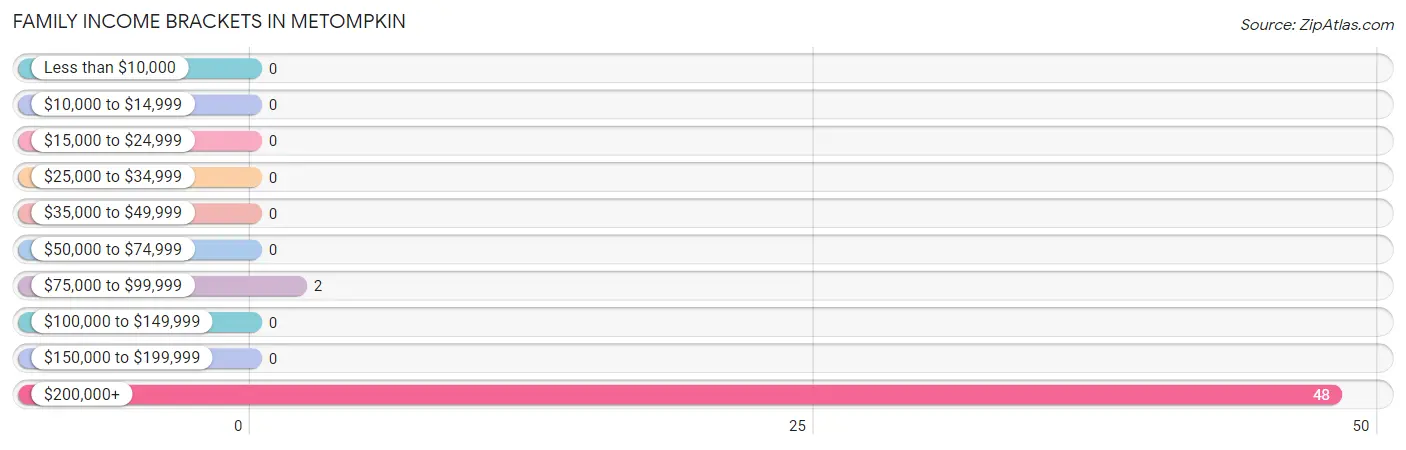
Family Income Brackets in Metompkin
According to the Metompkin family income data, there are 48 families falling into the $200,000+ income range, which is the most common income bracket and makes up 96.0% of all families.
| Income Bracket | # Families | % Families |
| Less than $10,000 | 0 | 0.0% |
| $10,000 to $14,999 | 0 | 0.0% |
| $15,000 to $24,999 | 0 | 0.0% |
| $25,000 to $34,999 | 0 | 0.0% |
| $35,000 to $49,999 | 0 | 0.0% |
| $50,000 to $74,999 | 0 | 0.0% |
| $75,000 to $99,999 | 2 | 4.0% |
| $100,000 to $149,999 | 0 | 0.0% |
| $150,000 to $199,999 | 0 | 0.0% |
| $200,000+ | 48 | 96.0% |
Family Income by Famaliy Size in Metompkin
| Income Bracket | # Families | Median Income |
| 2-Person Families | 2 (4.0%) | $0 |
| 3-Person Families | 48 (96.0%) | $0 |
| 4-Person Families | 0 (0.0%) | $0 |
| 5-Person Families | 0 (0.0%) | $0 |
| 6-Person Families | 0 (0.0%) | $0 |
| 7+ Person Families | 0 (0.0%) | $0 |
| Total | 50 (100.0%) | $0 |
Family Income by Number of Earners in Metompkin
| Number of Earners | # Families | Median Income |
| No Earners | 0 (0.0%) | $0 |
| 1 Earner | 2 (4.0%) | $0 |
| 2 Earners | 0 (0.0%) | $0 |
| 3+ Earners | 48 (96.0%) | $0 |
| Total | 50 (100.0%) | $0 |
Household Income in Metompkin
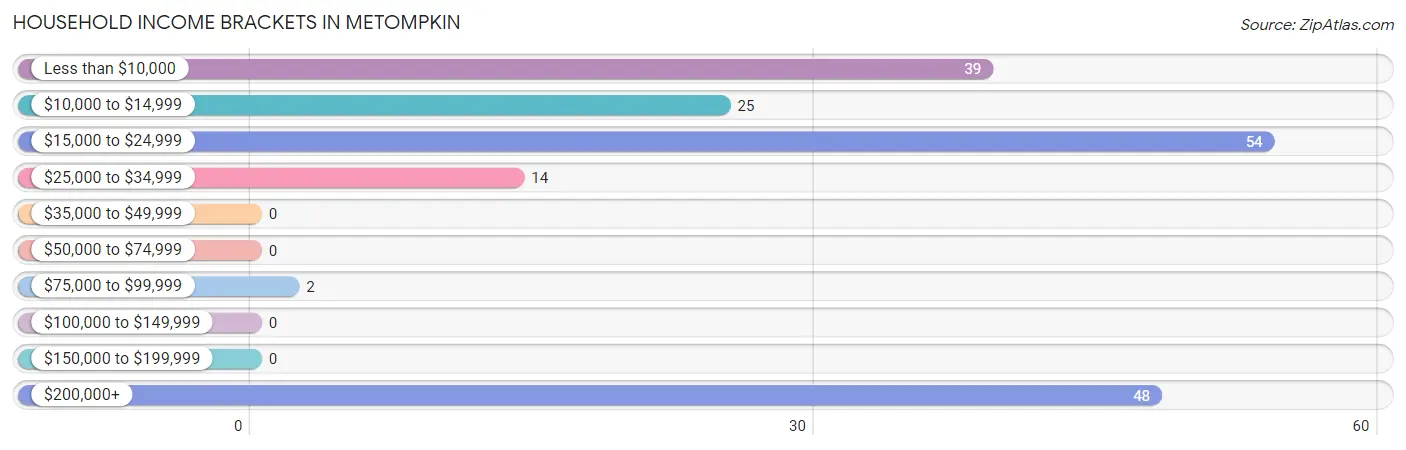
Household Income Brackets in Metompkin
With 54 households falling in the category, the $15,000 to $24,999 income range is the most frequent in Metompkin, accounting for 29.7% of all households.
| Income Bracket | # Households | % Households |
| Less than $10,000 | 39 | 21.4% |
| $10,000 to $14,999 | 25 | 13.7% |
| $15,000 to $24,999 | 54 | 29.7% |
| $25,000 to $34,999 | 14 | 7.7% |
| $35,000 to $49,999 | 0 | 0.0% |
| $50,000 to $74,999 | 0 | 0.0% |
| $75,000 to $99,999 | 2 | 1.1% |
| $100,000 to $149,999 | 0 | 0.0% |
| $150,000 to $199,999 | 0 | 0.0% |
| $200,000+ | 48 | 26.4% |
Household Income by Householder Age in Metompkin
| Income Bracket | # Households | Median Income |
| 15 to 24 Years | 0 (0.0%) | $0 |
| 25 to 44 Years | 0 (0.0%) | $0 |
| 45 to 64 Years | 62 (34.1%) | $0 |
| 65+ Years | 120 (65.9%) | $0 |
| Total | 182 (100.0%) | $23,564 |
Poverty in Metompkin
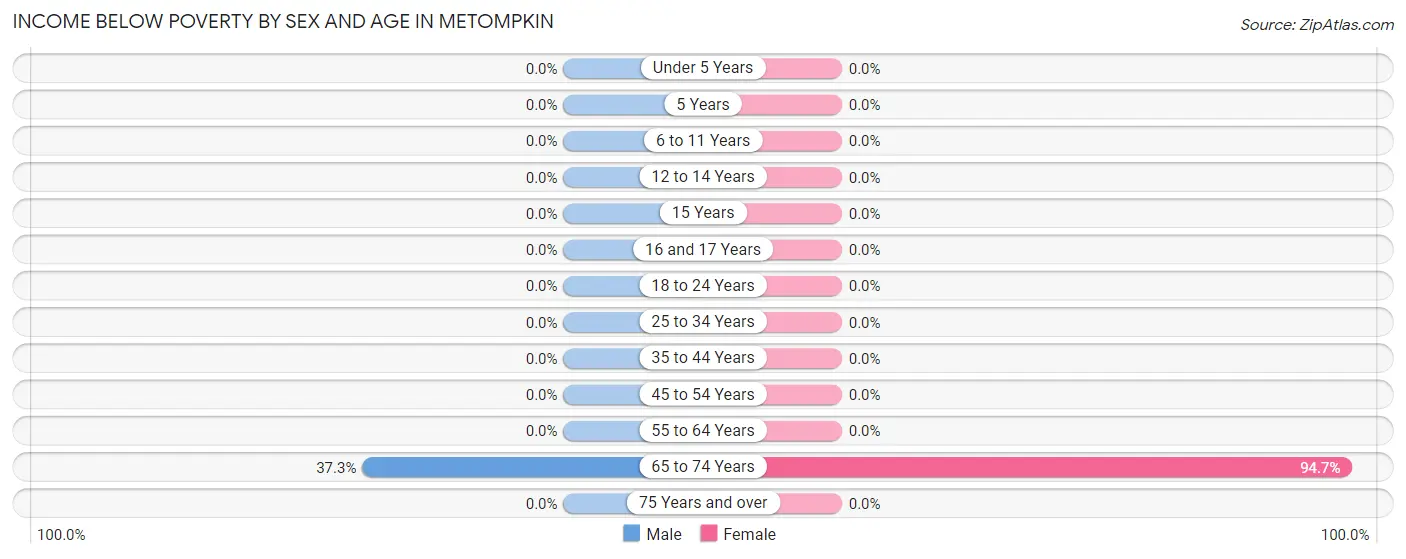
Income Below Poverty by Sex and Age in Metompkin
With 17.0% poverty level for males and 45.6% for females among the residents of Metompkin, 65 to 74 year old males and 65 to 74 year old females are the most vulnerable to poverty, with 28 males (37.3%) and 36 females (94.7%) in their respective age groups living below the poverty level.
| Age Bracket | Male | Female |
| Under 5 Years | 0 (0.0%) | 0 (0.0%) |
| 5 Years | 0 (0.0%) | 0 (0.0%) |
| 6 to 11 Years | 0 (0.0%) | 0 (0.0%) |
| 12 to 14 Years | 0 (0.0%) | 0 (0.0%) |
| 15 Years | 0 (0.0%) | 0 (0.0%) |
| 16 and 17 Years | 0 (0.0%) | 0 (0.0%) |
| 18 to 24 Years | 0 (0.0%) | 0 (0.0%) |
| 25 to 34 Years | 0 (0.0%) | 0 (0.0%) |
| 35 to 44 Years | 0 (0.0%) | 0 (0.0%) |
| 45 to 54 Years | 0 (0.0%) | 0 (0.0%) |
| 55 to 64 Years | 0 (0.0%) | 0 (0.0%) |
| 65 to 74 Years | 28 (37.3%) | 36 (94.7%) |
| 75 Years and over | 0 (0.0%) | 0 (0.0%) |
| Total | 28 (17.0%) | 36 (45.6%) |
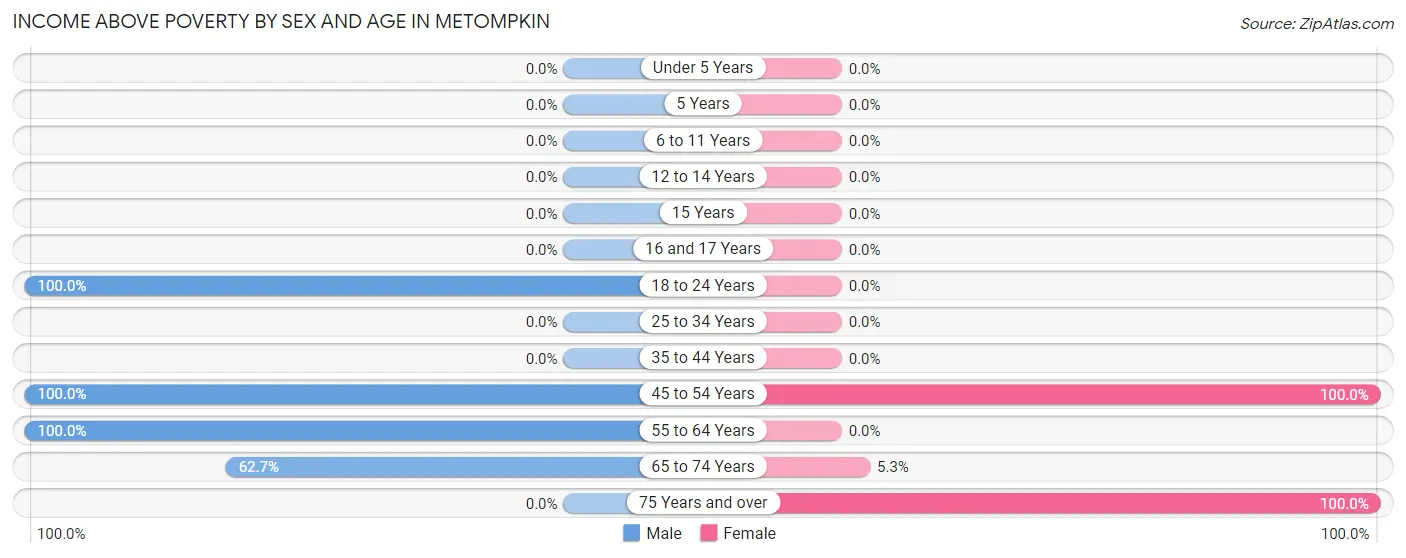
Income Above Poverty by Sex and Age in Metompkin
According to the poverty statistics in Metompkin, males aged 18 to 24 years and females aged 45 to 54 years are the age groups that are most secure financially, with 100.0% of males and 100.0% of females in these age groups living above the poverty line.
| Age Bracket | Male | Female |
| Under 5 Years | 0 (0.0%) | 0 (0.0%) |
| 5 Years | 0 (0.0%) | 0 (0.0%) |
| 6 to 11 Years | 0 (0.0%) | 0 (0.0%) |
| 12 to 14 Years | 0 (0.0%) | 0 (0.0%) |
| 15 Years | 0 (0.0%) | 0 (0.0%) |
| 16 and 17 Years | 0 (0.0%) | 0 (0.0%) |
| 18 to 24 Years | 26 (100.0%) | 0 (0.0%) |
| 25 to 34 Years | 0 (0.0%) | 0 (0.0%) |
| 35 to 44 Years | 0 (0.0%) | 0 (0.0%) |
| 45 to 54 Years | 62 (100.0%) | 34 (100.0%) |
| 55 to 64 Years | 2 (100.0%) | 0 (0.0%) |
| 65 to 74 Years | 47 (62.7%) | 2 (5.3%) |
| 75 Years and over | 0 (0.0%) | 7 (100.0%) |
| Total | 137 (83.0%) | 43 (54.4%) |
Income Below Poverty Among Married-Couple Families in Metompkin
| Children | Above Poverty | Below Poverty |
| No Children | 50 (100.0%) | 0 (0.0%) |
| 1 or 2 Children | 0 (0.0%) | 0 (0.0%) |
| 3 or 4 Children | 0 (0.0%) | 0 (0.0%) |
| 5 or more Children | 0 (0.0%) | 0 (0.0%) |
| Total | 50 (100.0%) | 0 (0.0%) |
Income Below Poverty Among Single-Parent Households in Metompkin
| Children | Single Father | Single Mother |
| No Children | 0 (0.0%) | 0 (0.0%) |
| 1 or 2 Children | 0 (0.0%) | 0 (0.0%) |
| 3 or 4 Children | 0 (0.0%) | 0 (0.0%) |
| 5 or more Children | 0 (0.0%) | 0 (0.0%) |
| Total | 0 (0.0%) | 0 (0.0%) |
Income Below Poverty Among Married-Couple vs Single-Parent Households in Metompkin
| Children | Married-Couple Families | Single-Parent Households |
| No Children | 0 (0.0%) | 0 (0.0%) |
| 1 or 2 Children | 0 (0.0%) | 0 (0.0%) |
| 3 or 4 Children | 0 (0.0%) | 0 (0.0%) |
| 5 or more Children | 0 (0.0%) | 0 (0.0%) |
| Total | 0 (0.0%) | 0 (0.0%) |
Race in Metompkin
The most populous races in Metompkin are Black / African American (132 | 54.1%), Hispanic or Latino (108 | 44.3%), and Two or more Races (108 | 44.3%).
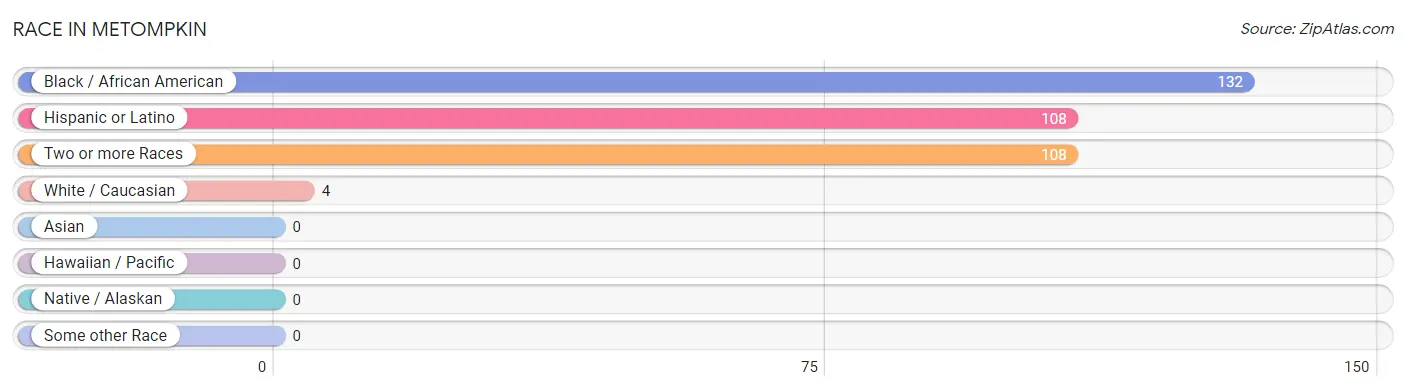
| Race | # Population | % Population |
| Asian | 0 | 0.0% |
| Black / African American | 132 | 54.1% |
| Hawaiian / Pacific | 0 | 0.0% |
| Hispanic or Latino | 108 | 44.3% |
| Native / Alaskan | 0 | 0.0% |
| White / Caucasian | 4 | 1.6% |
| Two or more Races | 108 | 44.3% |
| Some other Race | 0 | 0.0% |
| Total | 244 | 100.0% |
Ancestry in Metompkin
The most populous ancestries reported in Metompkin are American (126 | 51.6%), Central American (74 | 30.3%), Guatemalan (74 | 30.3%), Cuban (34 | 13.9%), and German (4 | 1.6%), together accounting for 127.9% of all Metompkin residents.
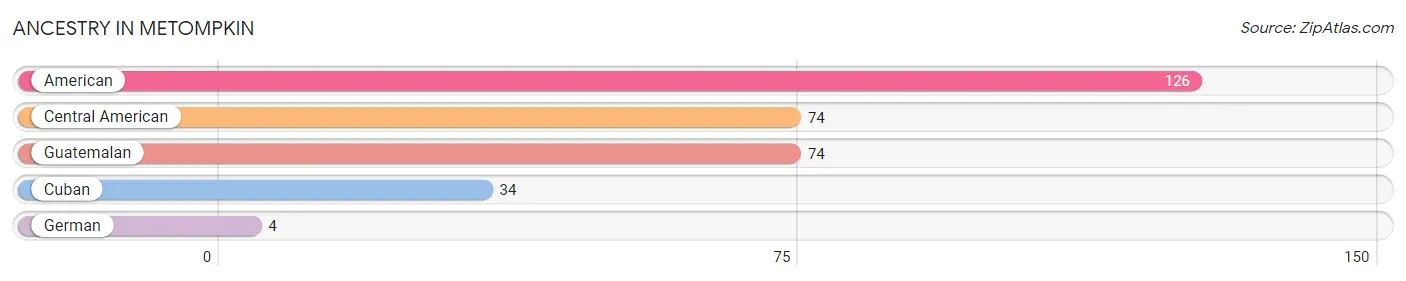
| Ancestry | # Population | % Population |
| American | 126 | 51.6% |
| Central American | 74 | 30.3% |
| Cuban | 34 | 13.9% |
| German | 4 | 1.6% |
| Guatemalan | 74 | 30.3% | View All 5 Rows |
Immigrants in Metompkin
The most numerous immigrant groups reported in Metompkin came from Central America (82 | 33.6%), Guatemala (82 | 33.6%), and Latin America (82 | 33.6%), together accounting for 100.8% of all Metompkin residents.
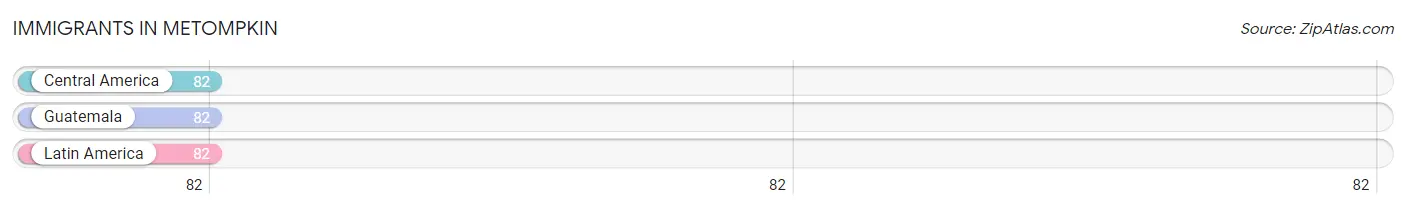
| Immigration Origin | # Population | % Population |
| Central America | 82 | 33.6% |
| Guatemala | 82 | 33.6% |
| Latin America | 82 | 33.6% | View All 3 Rows |
Sex and Age in Metompkin
Sex and Age in Metompkin
The most populous age groups in Metompkin are 65 to 69 Years (75 | 45.5%) for men and 65 to 69 Years (38 | 48.1%) for women.
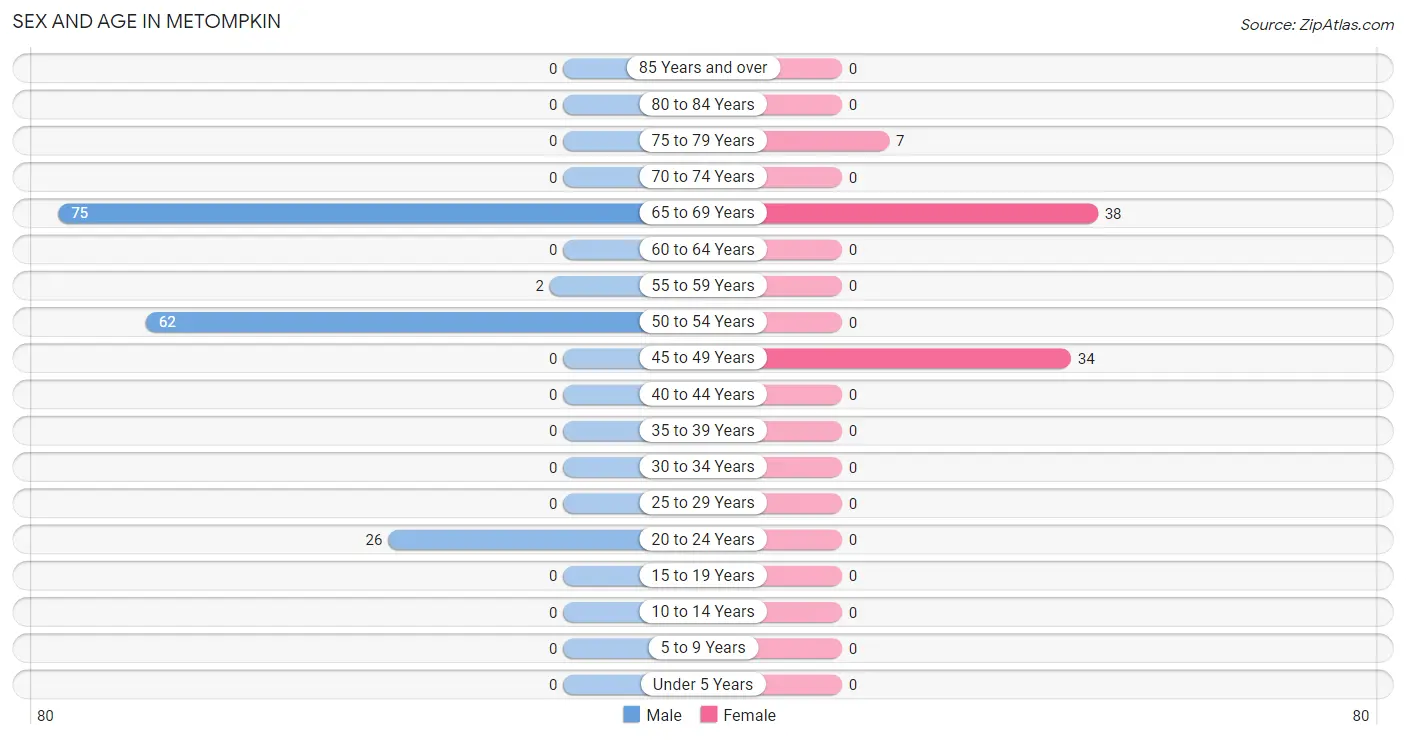
| Age Bracket | Male | Female |
| Under 5 Years | 0 (0.0%) | 0 (0.0%) |
| 5 to 9 Years | 0 (0.0%) | 0 (0.0%) |
| 10 to 14 Years | 0 (0.0%) | 0 (0.0%) |
| 15 to 19 Years | 0 (0.0%) | 0 (0.0%) |
| 20 to 24 Years | 26 (15.8%) | 0 (0.0%) |
| 25 to 29 Years | 0 (0.0%) | 0 (0.0%) |
| 30 to 34 Years | 0 (0.0%) | 0 (0.0%) |
| 35 to 39 Years | 0 (0.0%) | 0 (0.0%) |
| 40 to 44 Years | 0 (0.0%) | 0 (0.0%) |
| 45 to 49 Years | 0 (0.0%) | 34 (43.0%) |
| 50 to 54 Years | 62 (37.6%) | 0 (0.0%) |
| 55 to 59 Years | 2 (1.2%) | 0 (0.0%) |
| 60 to 64 Years | 0 (0.0%) | 0 (0.0%) |
| 65 to 69 Years | 75 (45.5%) | 38 (48.1%) |
| 70 to 74 Years | 0 (0.0%) | 0 (0.0%) |
| 75 to 79 Years | 0 (0.0%) | 7 (8.9%) |
| 80 to 84 Years | 0 (0.0%) | 0 (0.0%) |
| 85 Years and over | 0 (0.0%) | 0 (0.0%) |
| Total | 165 (100.0%) | 79 (100.0%) |
Families and Households in Metompkin
Median Family Size in Metompkin
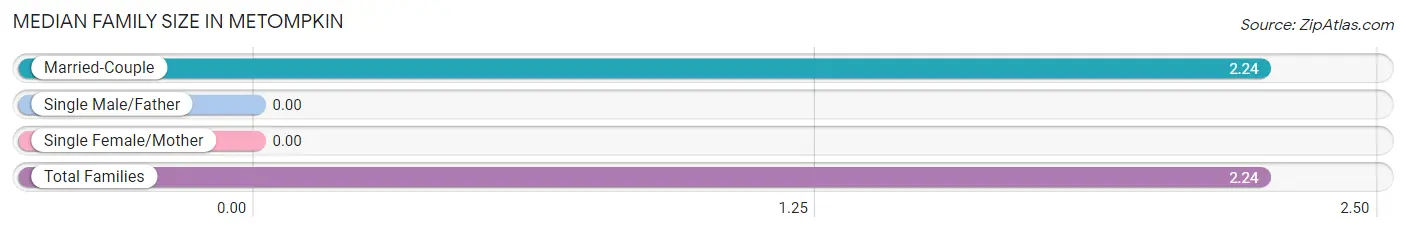
| Family Type | # Families | Family Size |
| Married-Couple | 50 (100.0%) | 2.24 |
| Single Male/Father | 0 (0.0%) | - |
| Single Female/Mother | 0 (0.0%) | - |
| Total Families | 50 (100.0%) | 2.24 |
Median Household Size in Metompkin
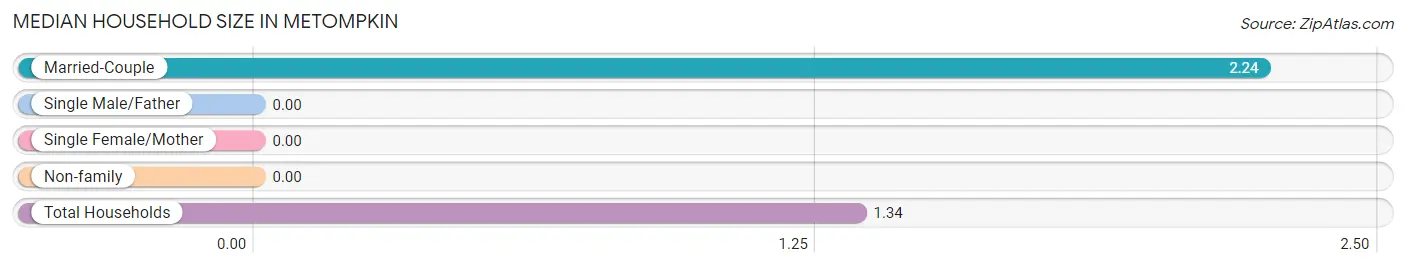
| Household Type | # Households | Household Size |
| Married-Couple | 50 (27.5%) | 2.24 |
| Single Male/Father | 0 (0.0%) | - |
| Single Female/Mother | 0 (0.0%) | - |
| Non-family | 132 (72.5%) | - |
| Total Households | 182 (100.0%) | 1.34 |
Household Size by Marriage Status in Metompkin
Out of a total of 182 households in Metompkin, 50 (27.5%) are family households, while 132 (72.5%) are nonfamily households. The most numerous type of family households are 3-person households, comprising 48, and the most common type of nonfamily households are 1-person households, comprising 132.
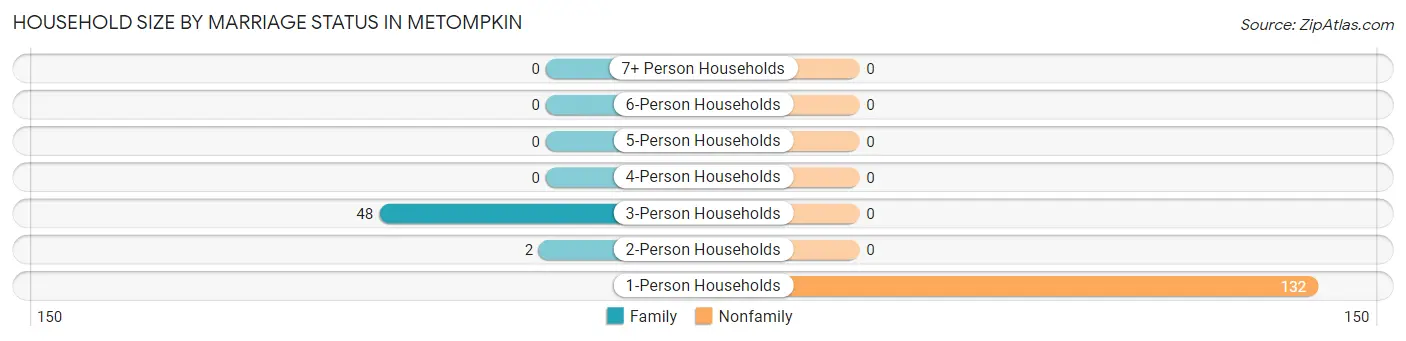
| Household Size | Family Households | Nonfamily Households |
| 1-Person Households | - | 132 (72.5%) |
| 2-Person Households | 2 (1.1%) | 0 (0.0%) |
| 3-Person Households | 48 (26.4%) | 0 (0.0%) |
| 4-Person Households | 0 (0.0%) | 0 (0.0%) |
| 5-Person Households | 0 (0.0%) | 0 (0.0%) |
| 6-Person Households | 0 (0.0%) | 0 (0.0%) |
| 7+ Person Households | 0 (0.0%) | 0 (0.0%) |
| Total | 50 (27.5%) | 132 (72.5%) |
Female Fertility in Metompkin
Fertility by Age in Metompkin
| Age Bracket | Women with Births | Births / 1,000 Women |
| 15 to 19 years | 0 (0.0%) | 0.0 |
| 20 to 34 years | 0 (0.0%) | 0.0 |
| 35 to 50 years | 0 (0.0%) | 0.0 |
| Total | 0 (0.0%) | 0.0 |
Fertility by Age by Marriage Status in Metompkin
| Age Bracket | Married | Unmarried |
| 15 to 19 years | 0 (0.0%) | 0 (0.0%) |
| 20 to 34 years | 0 (0.0%) | 0 (0.0%) |
| 35 to 50 years | 0 (0.0%) | 0 (0.0%) |
| Total | 0 (0.0%) | 0 (0.0%) |
Fertility by Education in Metompkin
| Educational Attainment | Women with Births | Births / 1,000 Women |
| Less than High School | 0 (0.0%) | 0.0 |
| High School Diploma | 0 (0.0%) | 0.0 |
| College or Associate's Degree | 0 (0.0%) | 0.0 |
| Bachelor's Degree | 0 (0.0%) | 0.0 |
| Graduate Degree | 0 (0.0%) | 0.0 |
| Total | 0 (0.0%) | 0.0 |
Fertility by Education by Marriage Status in Metompkin
| Educational Attainment | Married | Unmarried |
| Less than High School | 0 (0.0%) | 0 (0.0%) |
| High School Diploma | 0 (0.0%) | 0 (0.0%) |
| College or Associate's Degree | 0 (0.0%) | 0 (0.0%) |
| Bachelor's Degree | 0 (0.0%) | 0 (0.0%) |
| Graduate Degree | 0 (0.0%) | 0 (0.0%) |
| Total | 0 (0.0%) | 0 (0.0%) |
Employment Characteristics in Metompkin
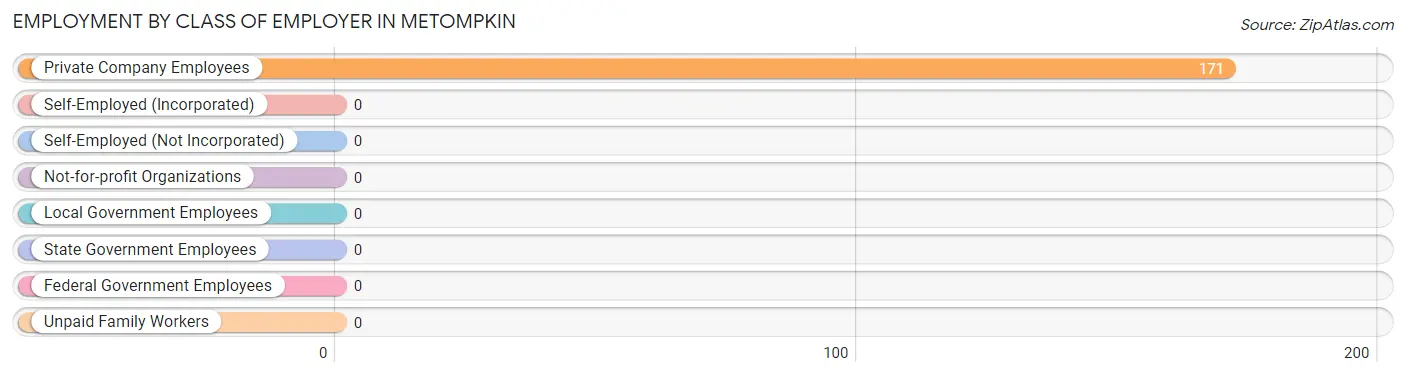
Employment by Class of Employer in Metompkin
Among the 171 employed individuals in Metompkin, , and private company employees (171 | 100.0%) make up the most common classes of employment.
| Employer Class | # Employees | % Employees |
| Private Company Employees | 171 | 100.0% |
| Self-Employed (Incorporated) | 0 | 0.0% |
| Self-Employed (Not Incorporated) | 0 | 0.0% |
| Not-for-profit Organizations | 0 | 0.0% |
| Local Government Employees | 0 | 0.0% |
| State Government Employees | 0 | 0.0% |
| Federal Government Employees | 0 | 0.0% |
| Unpaid Family Workers | 0 | 0.0% |
| Total | 171 | 100.0% |
Employment Status by Age in Metompkin
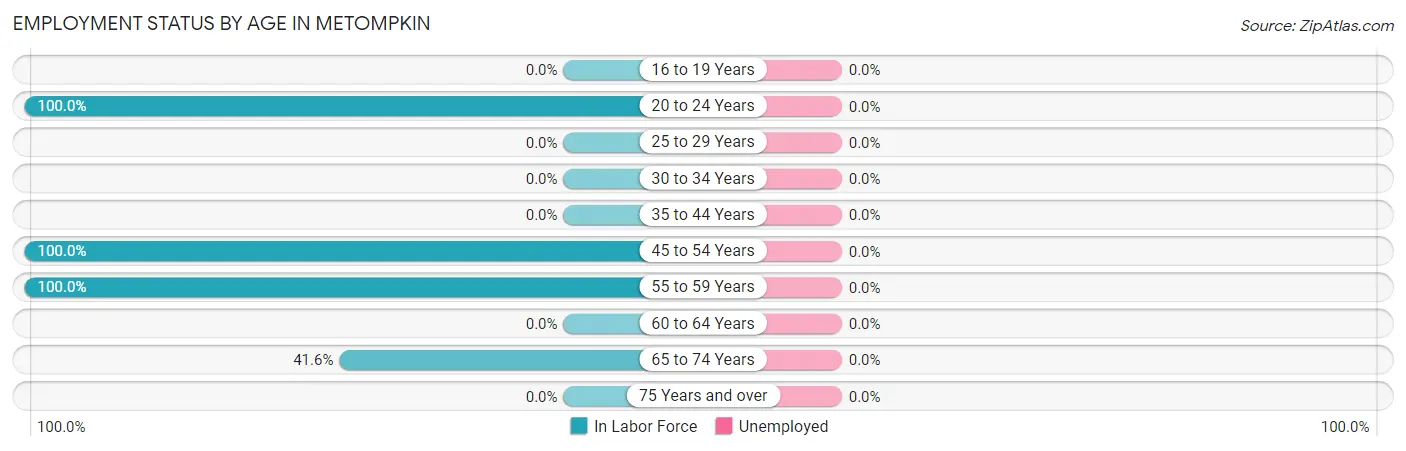
| Age Bracket | In Labor Force | Unemployed |
| 16 to 19 Years | 0 (0.0%) | 0 (0.0%) |
| 20 to 24 Years | 26 (100.0%) | 0 (0.0%) |
| 25 to 29 Years | 0 (0.0%) | 0 (0.0%) |
| 30 to 34 Years | 0 (0.0%) | 0 (0.0%) |
| 35 to 44 Years | 0 (0.0%) | 0 (0.0%) |
| 45 to 54 Years | 96 (100.0%) | 0 (0.0%) |
| 55 to 59 Years | 2 (100.0%) | 0 (0.0%) |
| 60 to 64 Years | 0 (0.0%) | 0 (0.0%) |
| 65 to 74 Years | 47 (41.6%) | 0 (0.0%) |
| 75 Years and over | 0 (0.0%) | 0 (0.0%) |
| Total | 171 (70.1%) | 0 (0.0%) |
Employment Status by Educational Attainment in Metompkin
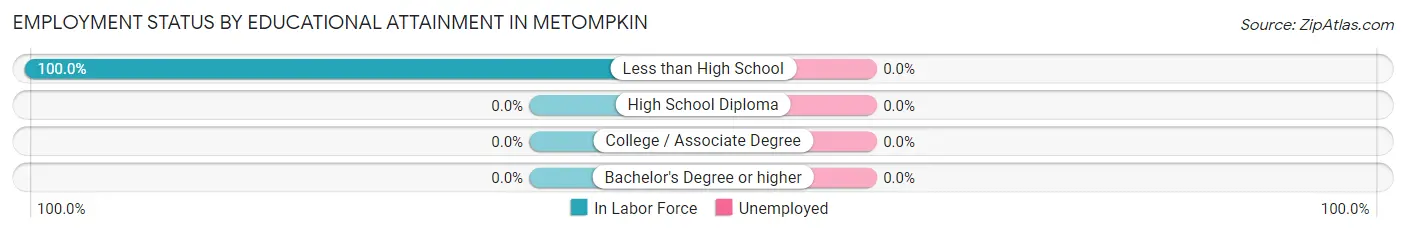
| Educational Attainment | In Labor Force | Unemployed |
| Less than High School | 98 (100.0%) | 0 (0.0%) |
| High School Diploma | 0 (0.0%) | 0 (0.0%) |
| College / Associate Degree | 0 (0.0%) | 0 (0.0%) |
| Bachelor's Degree or higher | 0 (0.0%) | 0 (0.0%) |
| Total | 98 (100.0%) | 0 (0.0%) |
Employment Occupations by Sex in Metompkin
Management, Business, Science and Arts Occupations
Management, Business, Science and Arts Occupations by Sex
| Occupation | Male | Female |
| Management | 0 (0.0%) | 0 (0.0%) |
| Business & Financial | 0 (0.0%) | 0 (0.0%) |
| Computers, Engineering & Science | 0 (0.0%) | 0 (0.0%) |
| Computers & Mathematics | 0 (0.0%) | 0 (0.0%) |
| Architecture & Engineering | 0 (0.0%) | 0 (0.0%) |
| Life, Physical & Social Science | 0 (0.0%) | 0 (0.0%) |
| Community & Social Service | 0 (0.0%) | 0 (0.0%) |
| Education, Arts & Media | 0 (0.0%) | 0 (0.0%) |
| Legal Services & Support | 0 (0.0%) | 0 (0.0%) |
| Education Instruction & Library | 0 (0.0%) | 0 (0.0%) |
| Arts, Media & Entertainment | 0 (0.0%) | 0 (0.0%) |
| Health Diagnosing & Treating | 0 (0.0%) | 0 (0.0%) |
| Health Technologists | 0 (0.0%) | 0 (0.0%) |
| Total (Category) | 0 (0.0%) | 0 (0.0%) |
| Total (Overall) | 137 (80.1%) | 34 (19.9%) |
Services Occupations
The most common Services occupations in Metompkin are , and Cleaning & Maintenance (49 | 28.6%).
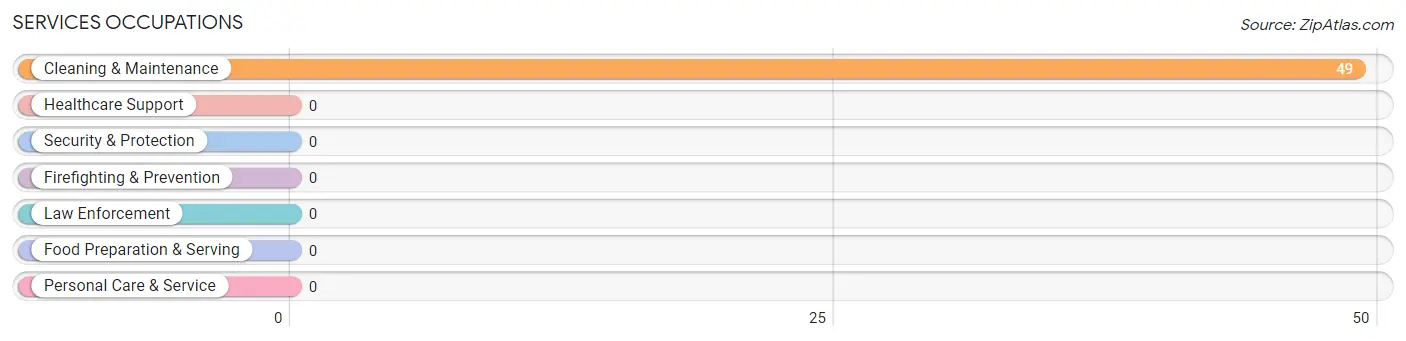
Services Occupations by Sex
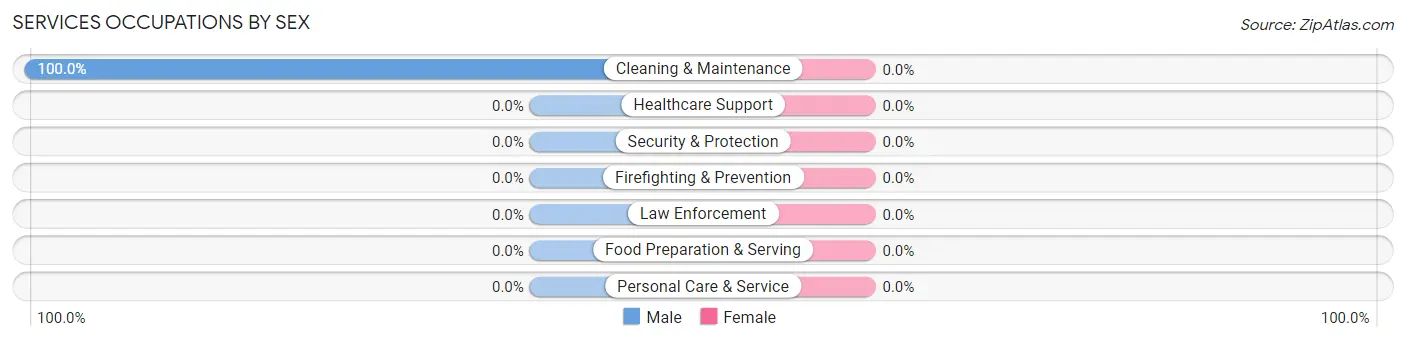
| Occupation | Male | Female |
| Healthcare Support | 0 (0.0%) | 0 (0.0%) |
| Security & Protection | 0 (0.0%) | 0 (0.0%) |
| Firefighting & Prevention | 0 (0.0%) | 0 (0.0%) |
| Law Enforcement | 0 (0.0%) | 0 (0.0%) |
| Food Preparation & Serving | 0 (0.0%) | 0 (0.0%) |
| Cleaning & Maintenance | 49 (100.0%) | 0 (0.0%) |
| Personal Care & Service | 0 (0.0%) | 0 (0.0%) |
| Total (Category) | 49 (100.0%) | 0 (0.0%) |
| Total (Overall) | 137 (80.1%) | 34 (19.9%) |
Sales and Office Occupations
Sales and Office Occupations by Sex
| Occupation | Male | Female |
| Sales & Related | 0 (0.0%) | 0 (0.0%) |
| Office & Administration | 0 (0.0%) | 0 (0.0%) |
| Total (Category) | 0 (0.0%) | 0 (0.0%) |
| Total (Overall) | 137 (80.1%) | 34 (19.9%) |
Natural Resources, Construction and Maintenance Occupations
The most common Natural Resources, Construction and Maintenance occupations in Metompkin are , and Construction & Extraction (14 | 8.2%).
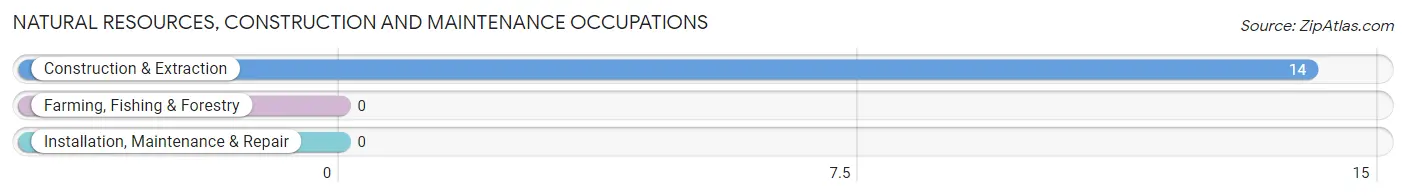
Natural Resources, Construction and Maintenance Occupations by Sex
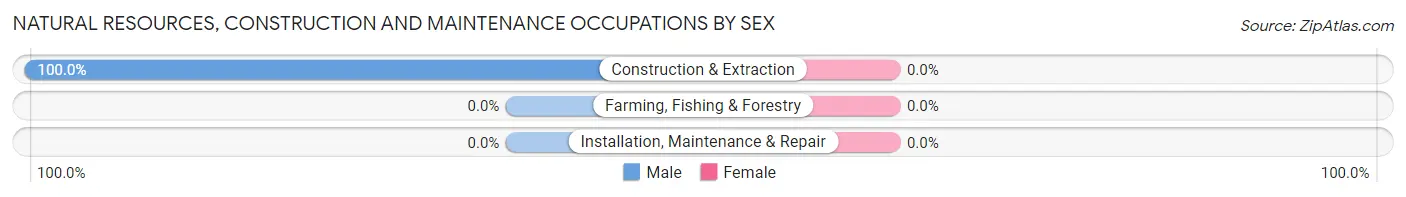
| Occupation | Male | Female |
| Farming, Fishing & Forestry | 0 (0.0%) | 0 (0.0%) |
| Construction & Extraction | 14 (100.0%) | 0 (0.0%) |
| Installation, Maintenance & Repair | 0 (0.0%) | 0 (0.0%) |
| Total (Category) | 14 (100.0%) | 0 (0.0%) |
| Total (Overall) | 137 (80.1%) | 34 (19.9%) |
Production, Transportation and Moving Occupations
The most common Production, Transportation and Moving occupations in Metompkin are , and Production (108 | 63.2%).
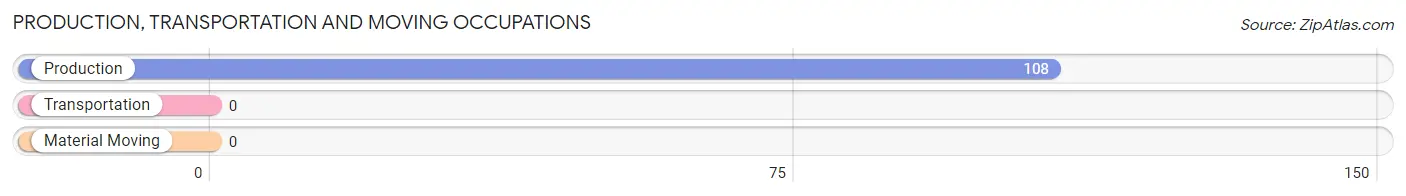
Production, Transportation and Moving Occupations by Sex
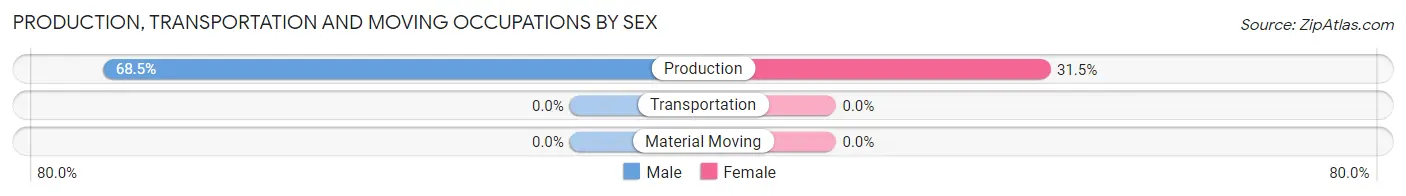
| Occupation | Male | Female |
| Production | 74 (68.5%) | 34 (31.5%) |
| Transportation | 0 (0.0%) | 0 (0.0%) |
| Material Moving | 0 (0.0%) | 0 (0.0%) |
| Total (Category) | 74 (68.5%) | 34 (31.5%) |
| Total (Overall) | 137 (80.1%) | 34 (19.9%) |
Employment Industries by Sex in Metompkin
Employment Industries in Metompkin
The major employment industries in Metompkin include Manufacturing (155 | 90.6%), Administrative & Support (14 | 8.2%), and Retail Trade (2 | 1.2%).
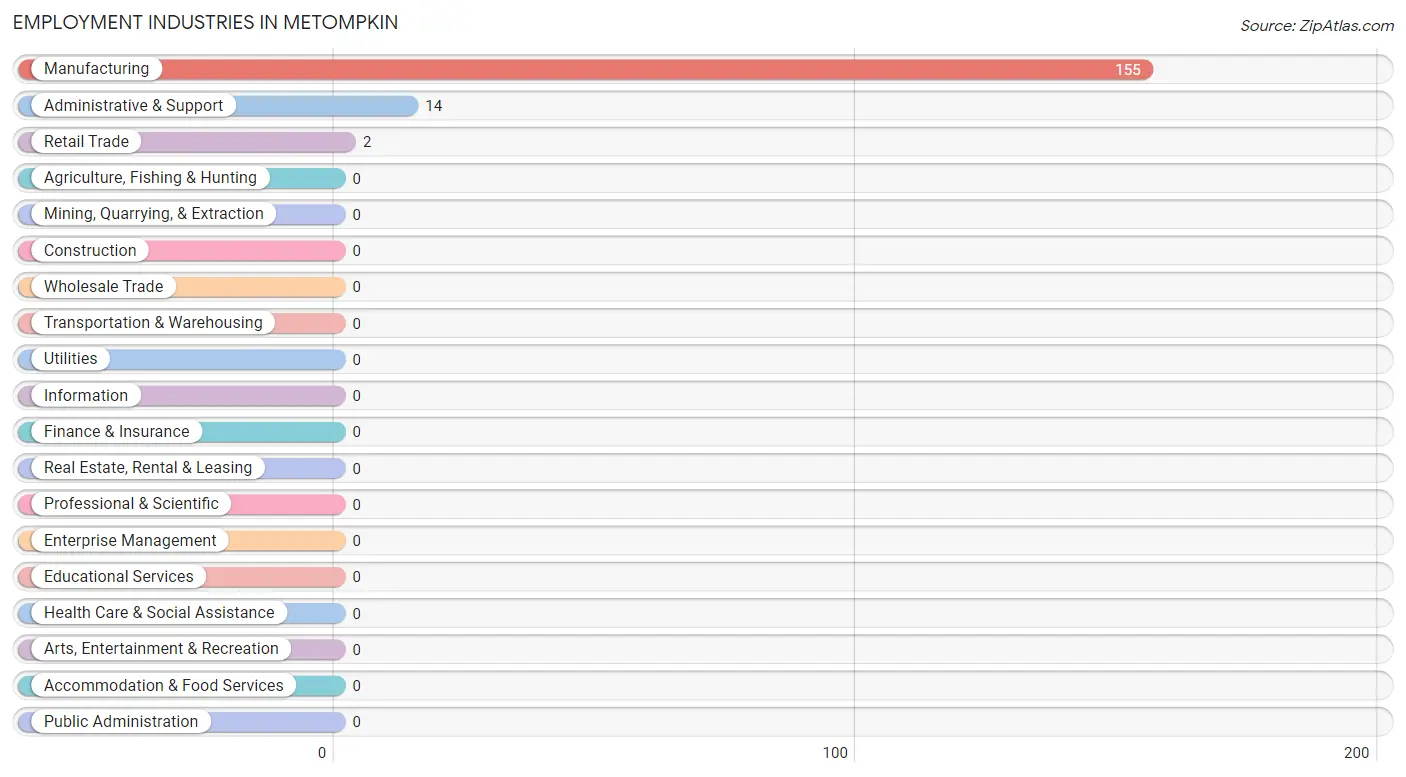
Employment Industries by Sex in Metompkin
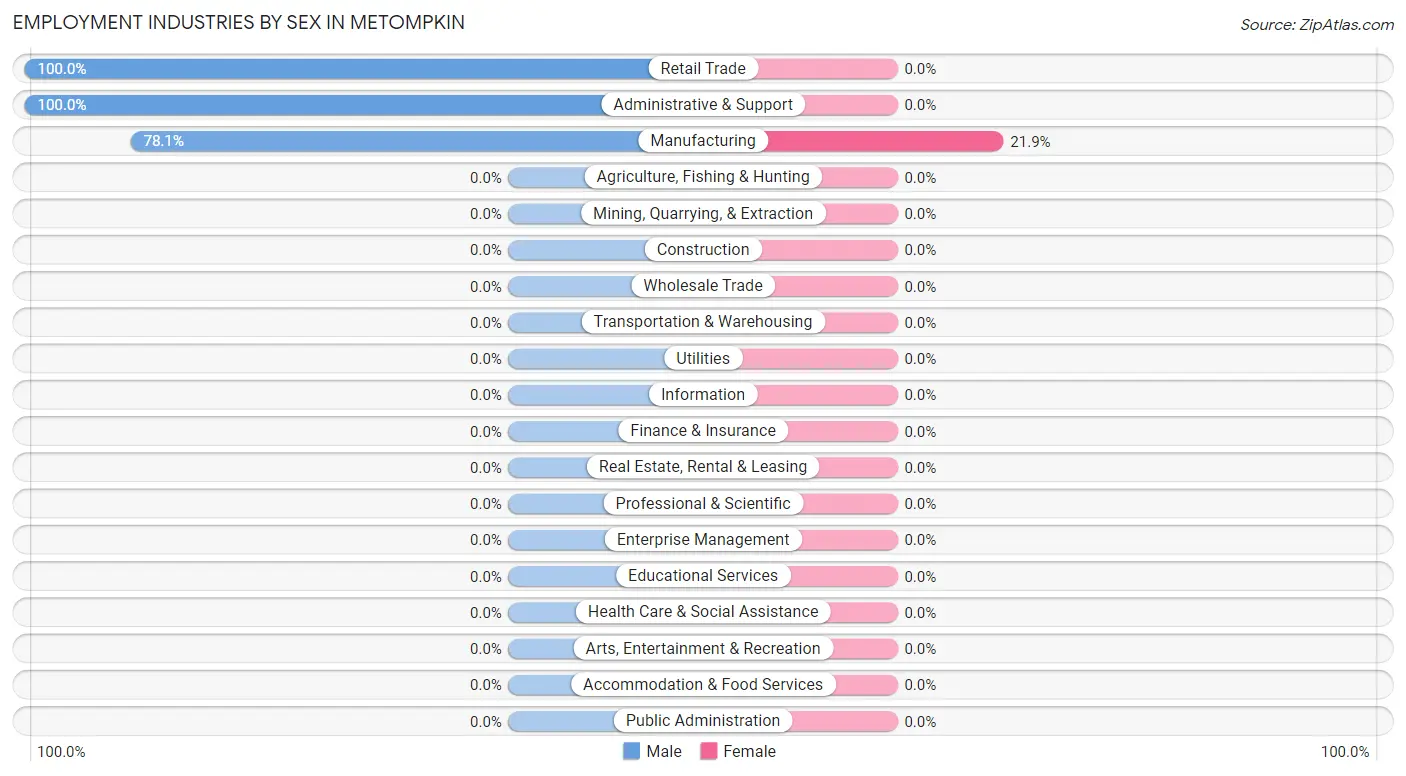
| Industry | Male | Female |
| Agriculture, Fishing & Hunting | 0 (0.0%) | 0 (0.0%) |
| Mining, Quarrying, & Extraction | 0 (0.0%) | 0 (0.0%) |
| Construction | 0 (0.0%) | 0 (0.0%) |
| Manufacturing | 121 (78.1%) | 34 (21.9%) |
| Wholesale Trade | 0 (0.0%) | 0 (0.0%) |
| Retail Trade | 2 (100.0%) | 0 (0.0%) |
| Transportation & Warehousing | 0 (0.0%) | 0 (0.0%) |
| Utilities | 0 (0.0%) | 0 (0.0%) |
| Information | 0 (0.0%) | 0 (0.0%) |
| Finance & Insurance | 0 (0.0%) | 0 (0.0%) |
| Real Estate, Rental & Leasing | 0 (0.0%) | 0 (0.0%) |
| Professional & Scientific | 0 (0.0%) | 0 (0.0%) |
| Enterprise Management | 0 (0.0%) | 0 (0.0%) |
| Administrative & Support | 14 (100.0%) | 0 (0.0%) |
| Educational Services | 0 (0.0%) | 0 (0.0%) |
| Health Care & Social Assistance | 0 (0.0%) | 0 (0.0%) |
| Arts, Entertainment & Recreation | 0 (0.0%) | 0 (0.0%) |
| Accommodation & Food Services | 0 (0.0%) | 0 (0.0%) |
| Public Administration | 0 (0.0%) | 0 (0.0%) |
| Total | 137 (80.1%) | 34 (19.9%) |
Education in Metompkin
School Enrollment in Metompkin
| School Level | # Students | % Students |
| Nursery / Preschool | 0 | 0.0% |
| Kindergarten | 0 | 0.0% |
| Elementary School | 0 | 0.0% |
| Middle School | 0 | 0.0% |
| High School | 0 | 0.0% |
| College / Undergraduate | 0 | 0.0% |
| Graduate / Professional | 0 | 0.0% |
| Total | 0 | 0.0% |
School Enrollment by Age by Funding Source in Metompkin
| Age Bracket | Public School | Private School |
| 3 to 4 Year Olds | 0 (0.0%) | 0 (0.0%) |
| 5 to 9 Year Old | 0 (0.0%) | 0 (0.0%) |
| 10 to 14 Year Olds | 0 (0.0%) | 0 (0.0%) |
| 15 to 17 Year Olds | 0 (0.0%) | 0 (0.0%) |
| 18 to 19 Year Olds | 0 (0.0%) | 0 (0.0%) |
| 20 to 24 Year Olds | 0 (0.0%) | 0 (0.0%) |
| 25 to 34 Year Olds | 0 (0.0%) | 0 (0.0%) |
| 35 Years and over | 0 (0.0%) | 0 (0.0%) |
| Total | 0 (0.0%) | 0 (0.0%) |
Educational Attainment by Field of Study in Metompkin
| Field of Study | # Graduates | % Graduates |
| Computers & Mathematics | 0 | 0.0% |
| Bio, Nature & Agricultural | 0 | 0.0% |
| Physical & Health Sciences | 0 | 0.0% |
| Psychology | 0 | 0.0% |
| Social Sciences | 0 | 0.0% |
| Engineering | 0 | 0.0% |
| Multidisciplinary Studies | 0 | 0.0% |
| Science & Technology | 0 | 0.0% |
| Business | 0 | 0.0% |
| Education | 0 | 0.0% |
| Literature & Languages | 0 | 0.0% |
| Liberal Arts & History | 0 | 0.0% |
| Visual & Performing Arts | 0 | 0.0% |
| Communications | 0 | 0.0% |
| Arts & Humanities | 0 | 0.0% |
| Total | 0 | 0.0% |
Transportation & Commute in Metompkin
Vehicle Availability by Sex in Metompkin
The most prevalent vehicle ownership categories in Metompkin are males with 3 vehicles (74, accounting for 54.0%) and females with 3 vehicles (34, making up 217.6%).
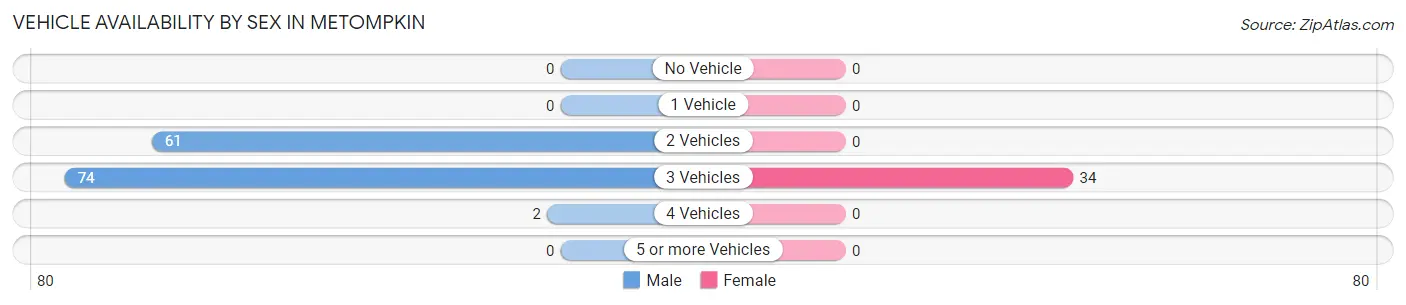
| Vehicles Available | Male | Female |
| No Vehicle | 0 (0.0%) | 0 (0.0%) |
| 1 Vehicle | 0 (0.0%) | 0 (0.0%) |
| 2 Vehicles | 61 (44.5%) | 0 (0.0%) |
| 3 Vehicles | 74 (54.0%) | 34 (100.0%) |
| 4 Vehicles | 2 (1.5%) | 0 (0.0%) |
| 5 or more Vehicles | 0 (0.0%) | 0 (0.0%) |
| Total | 137 (100.0%) | 34 (100.0%) |
Commute Time in Metompkin
The most frequently occuring commute durations in Metompkin are 15 to 19 minutes (108 commuters, 63.2%), 10 to 14 minutes (47 commuters, 27.5%), and 25 to 29 minutes (14 commuters, 8.2%).
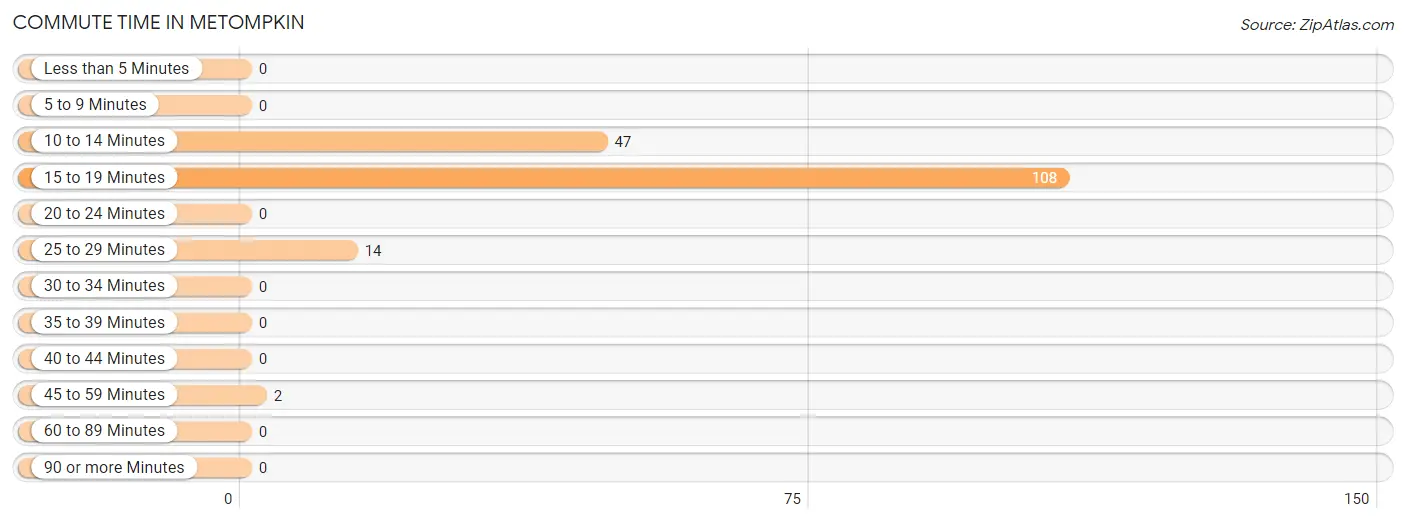
| Commute Time | # Commuters | % Commuters |
| Less than 5 Minutes | 0 | 0.0% |
| 5 to 9 Minutes | 0 | 0.0% |
| 10 to 14 Minutes | 47 | 27.5% |
| 15 to 19 Minutes | 108 | 63.2% |
| 20 to 24 Minutes | 0 | 0.0% |
| 25 to 29 Minutes | 14 | 8.2% |
| 30 to 34 Minutes | 0 | 0.0% |
| 35 to 39 Minutes | 0 | 0.0% |
| 40 to 44 Minutes | 0 | 0.0% |
| 45 to 59 Minutes | 2 | 1.2% |
| 60 to 89 Minutes | 0 | 0.0% |
| 90 or more Minutes | 0 | 0.0% |
Commute Time by Sex in Metompkin
The most common commute times in Metompkin are 15 to 19 minutes (74 commuters, 54.0%) for males and 15 to 19 minutes (34 commuters, 100.0%) for females.
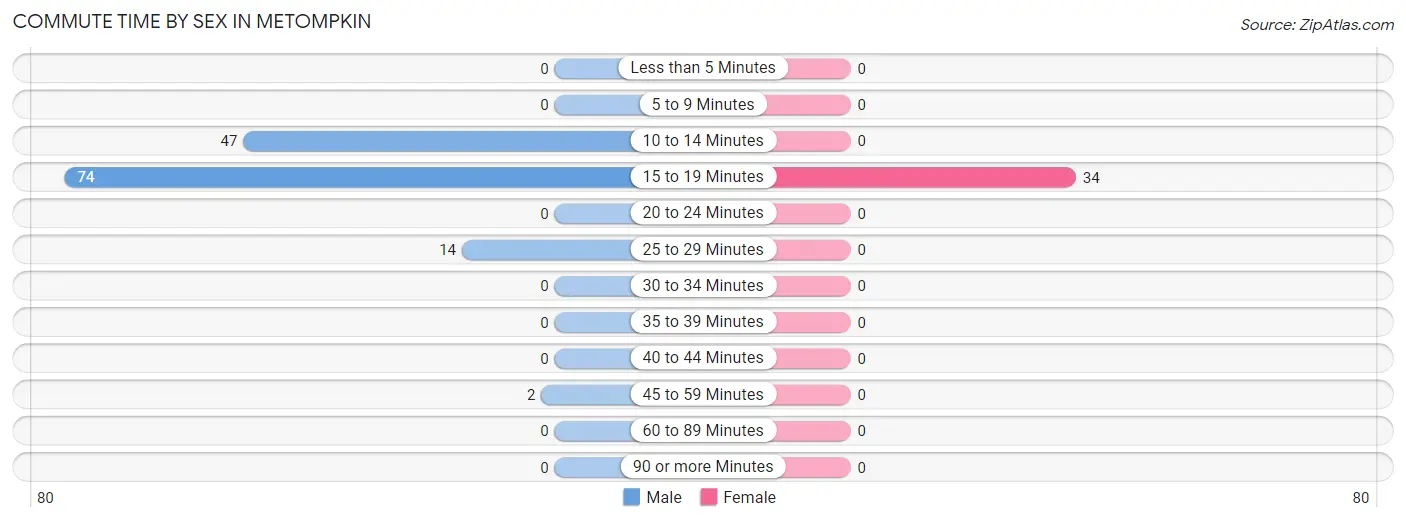
| Commute Time | Male | Female |
| Less than 5 Minutes | 0 (0.0%) | 0 (0.0%) |
| 5 to 9 Minutes | 0 (0.0%) | 0 (0.0%) |
| 10 to 14 Minutes | 47 (34.3%) | 0 (0.0%) |
| 15 to 19 Minutes | 74 (54.0%) | 34 (100.0%) |
| 20 to 24 Minutes | 0 (0.0%) | 0 (0.0%) |
| 25 to 29 Minutes | 14 (10.2%) | 0 (0.0%) |
| 30 to 34 Minutes | 0 (0.0%) | 0 (0.0%) |
| 35 to 39 Minutes | 0 (0.0%) | 0 (0.0%) |
| 40 to 44 Minutes | 0 (0.0%) | 0 (0.0%) |
| 45 to 59 Minutes | 2 (1.5%) | 0 (0.0%) |
| 60 to 89 Minutes | 0 (0.0%) | 0 (0.0%) |
| 90 or more Minutes | 0 (0.0%) | 0 (0.0%) |
Time of Departure to Work by Sex in Metompkin
The most frequent times of departure to work in Metompkin are 7:00 AM to 7:29 AM (74, 54.0%) for males and 8:00 AM to 8:29 AM (34, 100.0%) for females.
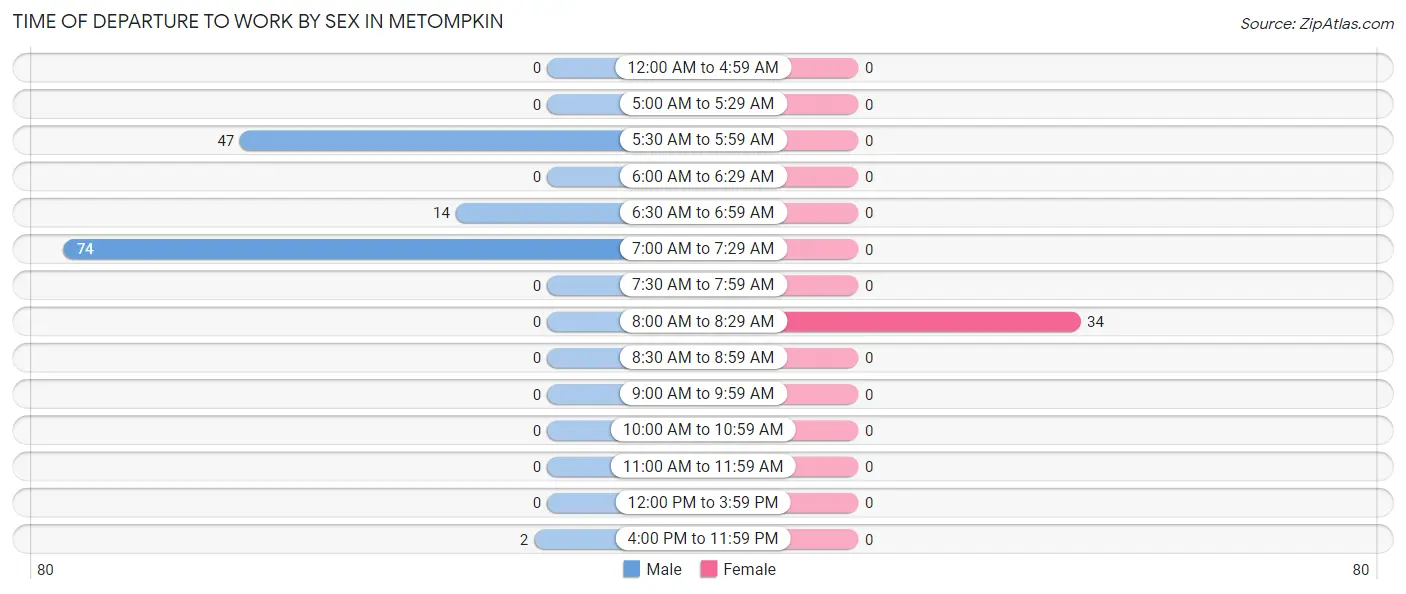
| Time of Departure | Male | Female |
| 12:00 AM to 4:59 AM | 0 (0.0%) | 0 (0.0%) |
| 5:00 AM to 5:29 AM | 0 (0.0%) | 0 (0.0%) |
| 5:30 AM to 5:59 AM | 47 (34.3%) | 0 (0.0%) |
| 6:00 AM to 6:29 AM | 0 (0.0%) | 0 (0.0%) |
| 6:30 AM to 6:59 AM | 14 (10.2%) | 0 (0.0%) |
| 7:00 AM to 7:29 AM | 74 (54.0%) | 0 (0.0%) |
| 7:30 AM to 7:59 AM | 0 (0.0%) | 0 (0.0%) |
| 8:00 AM to 8:29 AM | 0 (0.0%) | 34 (100.0%) |
| 8:30 AM to 8:59 AM | 0 (0.0%) | 0 (0.0%) |
| 9:00 AM to 9:59 AM | 0 (0.0%) | 0 (0.0%) |
| 10:00 AM to 10:59 AM | 0 (0.0%) | 0 (0.0%) |
| 11:00 AM to 11:59 AM | 0 (0.0%) | 0 (0.0%) |
| 12:00 PM to 3:59 PM | 0 (0.0%) | 0 (0.0%) |
| 4:00 PM to 11:59 PM | 2 (1.5%) | 0 (0.0%) |
| Total | 137 (100.0%) | 34 (100.0%) |
Housing Occupancy in Metompkin
Occupancy by Ownership in Metompkin
Of the total 182 dwellings in Metompkin, owner-occupied units account for 50 (27.5%), while renter-occupied units make up 132 (72.5%).
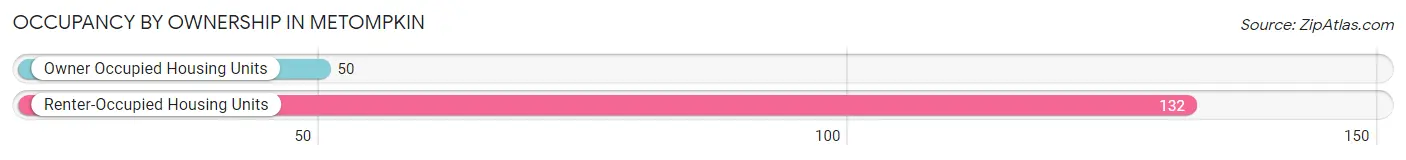
| Occupancy | # Housing Units | % Housing Units |
| Owner Occupied Housing Units | 50 | 27.5% |
| Renter-Occupied Housing Units | 132 | 72.5% |
| Total Occupied Housing Units | 182 | 100.0% |
Occupancy by Household Size in Metompkin
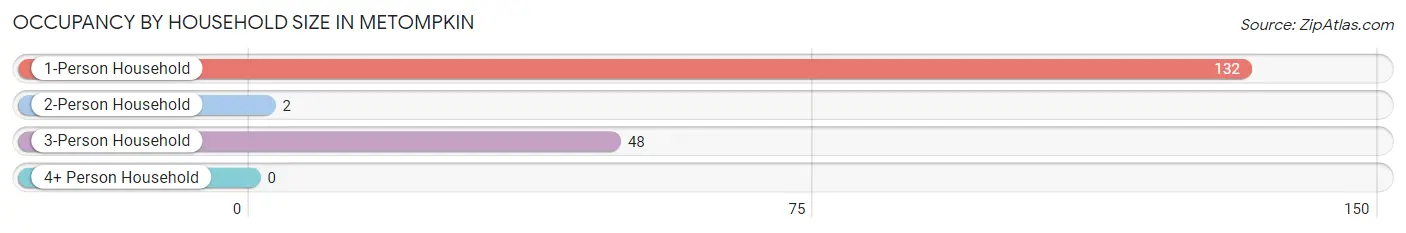
| Household Size | # Housing Units | % Housing Units |
| 1-Person Household | 132 | 72.5% |
| 2-Person Household | 2 | 1.1% |
| 3-Person Household | 48 | 26.4% |
| 4+ Person Household | 0 | 0.0% |
| Total Housing Units | 182 | 100.0% |
Occupancy by Ownership by Household Size in Metompkin
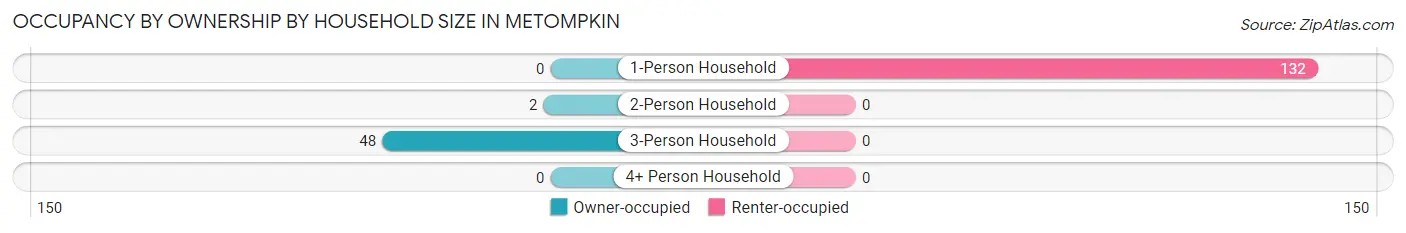
| Household Size | Owner-occupied | Renter-occupied |
| 1-Person Household | 0 (0.0%) | 132 (100.0%) |
| 2-Person Household | 2 (100.0%) | 0 (0.0%) |
| 3-Person Household | 48 (100.0%) | 0 (0.0%) |
| 4+ Person Household | 0 (0.0%) | 0 (0.0%) |
| Total Housing Units | 50 (27.5%) | 132 (72.5%) |
Occupancy by Educational Attainment in Metompkin
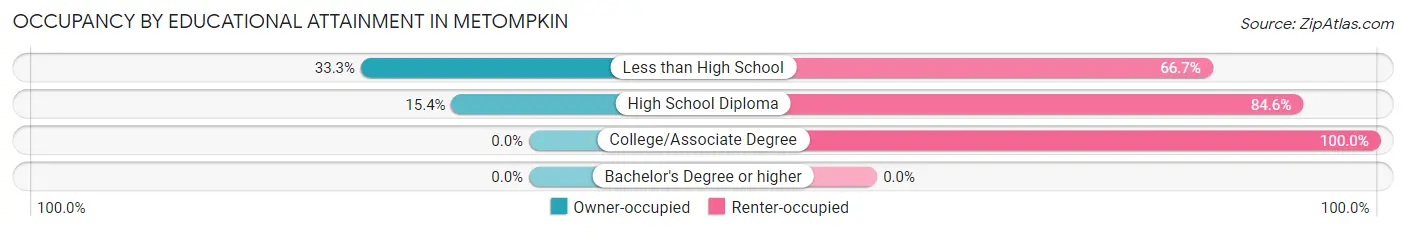
| Household Size | Owner-occupied | Renter-occupied |
| Less than High School | 48 (33.3%) | 96 (66.7%) |
| High School Diploma | 2 (15.4%) | 11 (84.6%) |
| College/Associate Degree | 0 (0.0%) | 25 (100.0%) |
| Bachelor's Degree or higher | 0 (0.0%) | 0 (0.0%) |
Occupancy by Age of Householder in Metompkin
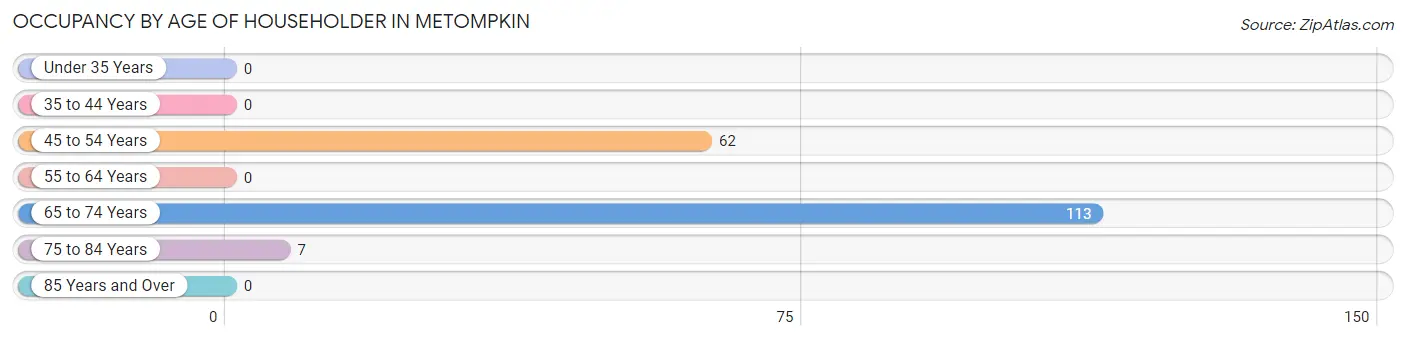
| Age Bracket | # Households | % Households |
| Under 35 Years | 0 | 0.0% |
| 35 to 44 Years | 0 | 0.0% |
| 45 to 54 Years | 62 | 34.1% |
| 55 to 64 Years | 0 | 0.0% |
| 65 to 74 Years | 113 | 62.1% |
| 75 to 84 Years | 7 | 3.8% |
| 85 Years and Over | 0 | 0.0% |
| Total | 182 | 100.0% |
Housing Finances in Metompkin
Median Income by Occupancy in Metompkin
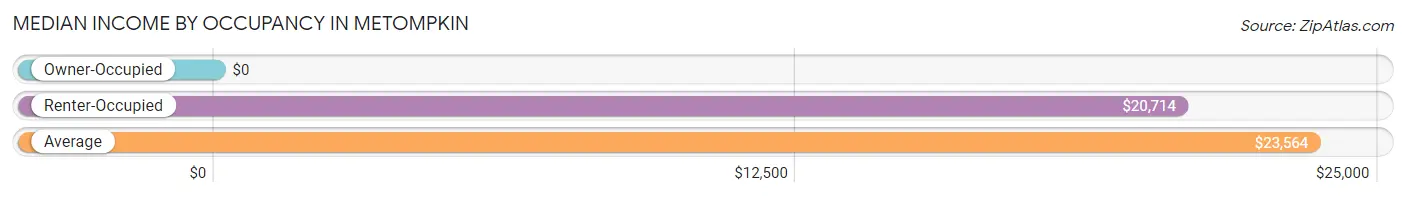
| Occupancy Type | # Households | Median Income |
| Owner-Occupied | 50 (27.5%) | $0 |
| Renter-Occupied | 132 (72.5%) | $20,714 |
| Average | 182 (100.0%) | $23,564 |
Occupancy by Householder Income Bracket in Metompkin
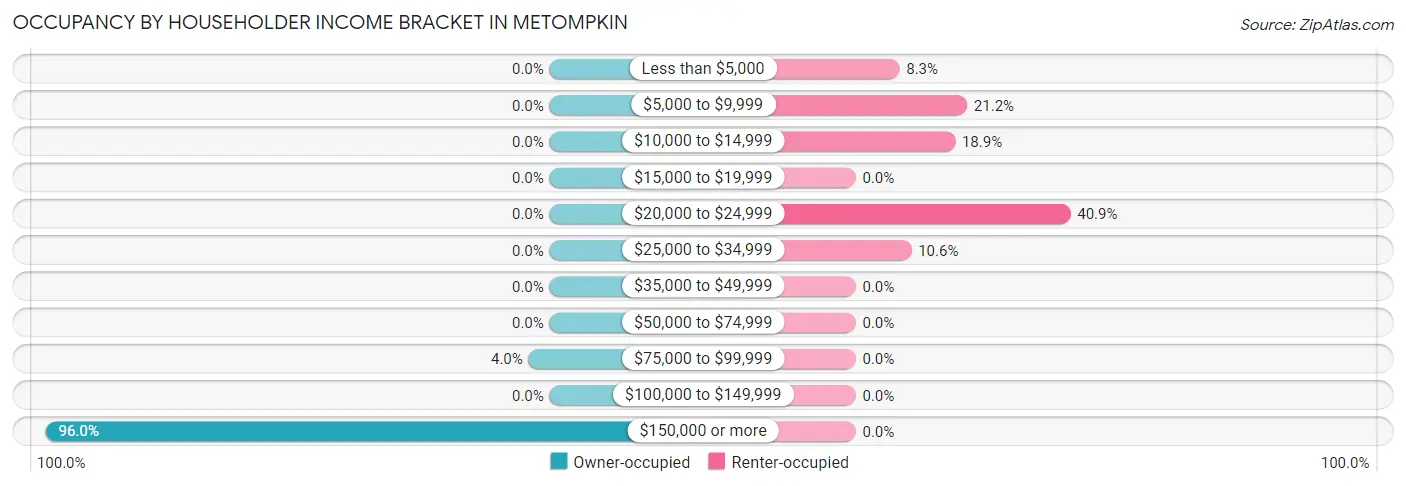
| Income Bracket | Owner-occupied | Renter-occupied |
| Less than $5,000 | 0 (0.0%) | 11 (8.3%) |
| $5,000 to $9,999 | 0 (0.0%) | 28 (21.2%) |
| $10,000 to $14,999 | 0 (0.0%) | 25 (18.9%) |
| $15,000 to $19,999 | 0 (0.0%) | 0 (0.0%) |
| $20,000 to $24,999 | 0 (0.0%) | 54 (40.9%) |
| $25,000 to $34,999 | 0 (0.0%) | 14 (10.6%) |
| $35,000 to $49,999 | 0 (0.0%) | 0 (0.0%) |
| $50,000 to $74,999 | 0 (0.0%) | 0 (0.0%) |
| $75,000 to $99,999 | 2 (4.0%) | 0 (0.0%) |
| $100,000 to $149,999 | 0 (0.0%) | 0 (0.0%) |
| $150,000 or more | 48 (96.0%) | 0 (0.0%) |
| Total | 50 (100.0%) | 132 (100.0%) |
Monthly Housing Cost Tiers in Metompkin
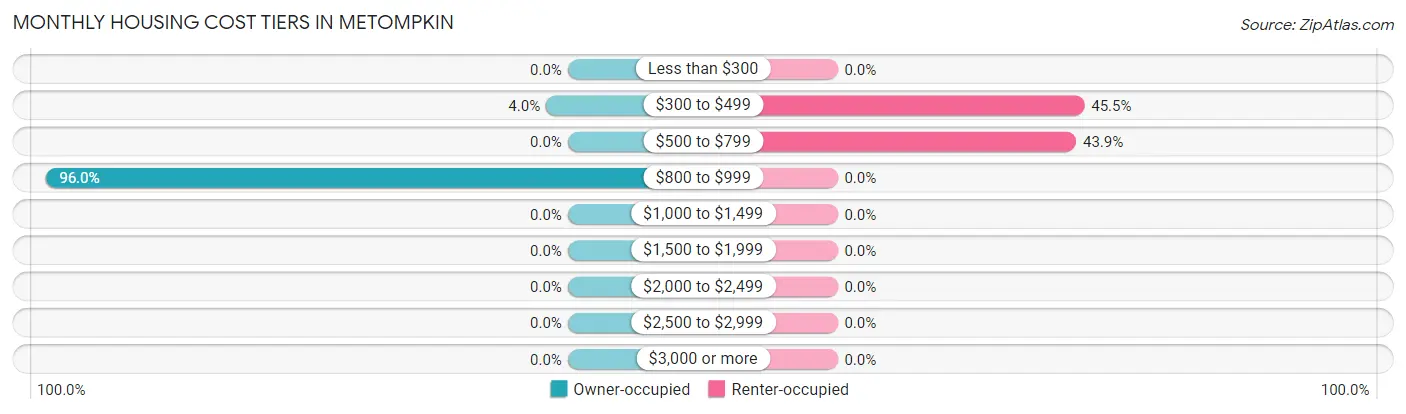
| Monthly Cost | Owner-occupied | Renter-occupied |
| Less than $300 | 0 (0.0%) | 0 (0.0%) |
| $300 to $499 | 2 (4.0%) | 60 (45.5%) |
| $500 to $799 | 0 (0.0%) | 58 (43.9%) |
| $800 to $999 | 48 (96.0%) | 0 (0.0%) |
| $1,000 to $1,499 | 0 (0.0%) | 0 (0.0%) |
| $1,500 to $1,999 | 0 (0.0%) | 0 (0.0%) |
| $2,000 to $2,499 | 0 (0.0%) | 0 (0.0%) |
| $2,500 to $2,999 | 0 (0.0%) | 0 (0.0%) |
| $3,000 or more | 0 (0.0%) | 0 (0.0%) |
| Total | 50 (100.0%) | 132 (100.0%) |
Physical Housing Characteristics in Metompkin
Housing Structures in Metompkin
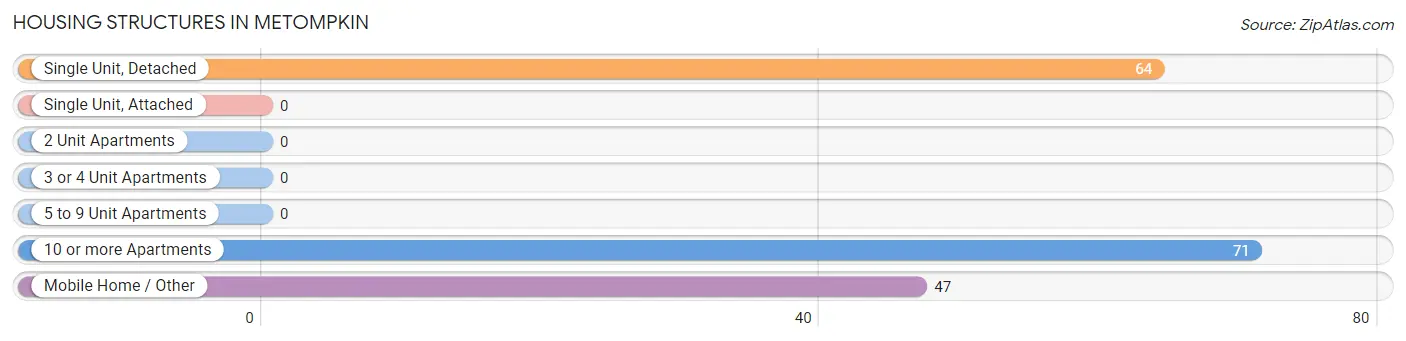
| Structure Type | # Housing Units | % Housing Units |
| Single Unit, Detached | 64 | 35.2% |
| Single Unit, Attached | 0 | 0.0% |
| 2 Unit Apartments | 0 | 0.0% |
| 3 or 4 Unit Apartments | 0 | 0.0% |
| 5 to 9 Unit Apartments | 0 | 0.0% |
| 10 or more Apartments | 71 | 39.0% |
| Mobile Home / Other | 47 | 25.8% |
| Total | 182 | 100.0% |
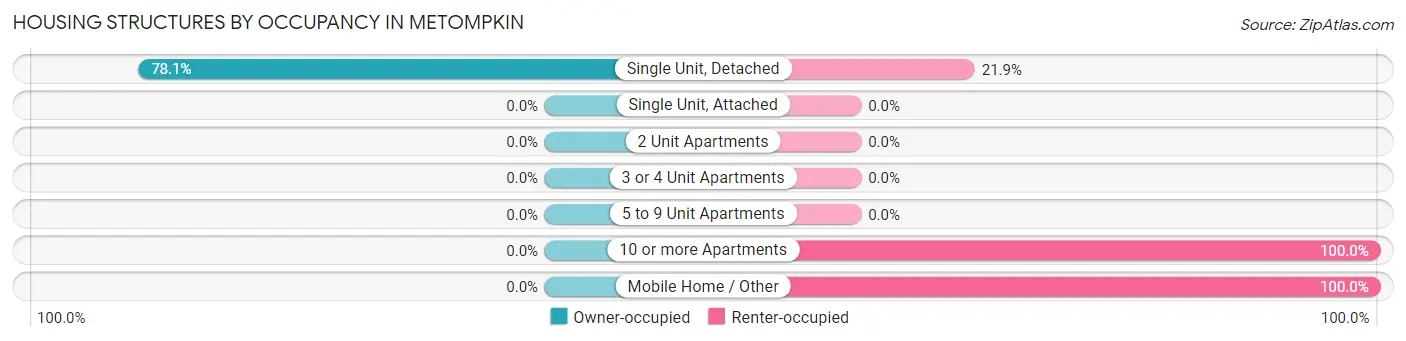
Housing Structures by Occupancy in Metompkin
| Structure Type | Owner-occupied | Renter-occupied |
| Single Unit, Detached | 50 (78.1%) | 14 (21.9%) |
| Single Unit, Attached | 0 (0.0%) | 0 (0.0%) |
| 2 Unit Apartments | 0 (0.0%) | 0 (0.0%) |
| 3 or 4 Unit Apartments | 0 (0.0%) | 0 (0.0%) |
| 5 to 9 Unit Apartments | 0 (0.0%) | 0 (0.0%) |
| 10 or more Apartments | 0 (0.0%) | 71 (100.0%) |
| Mobile Home / Other | 0 (0.0%) | 47 (100.0%) |
| Total | 50 (27.5%) | 132 (72.5%) |
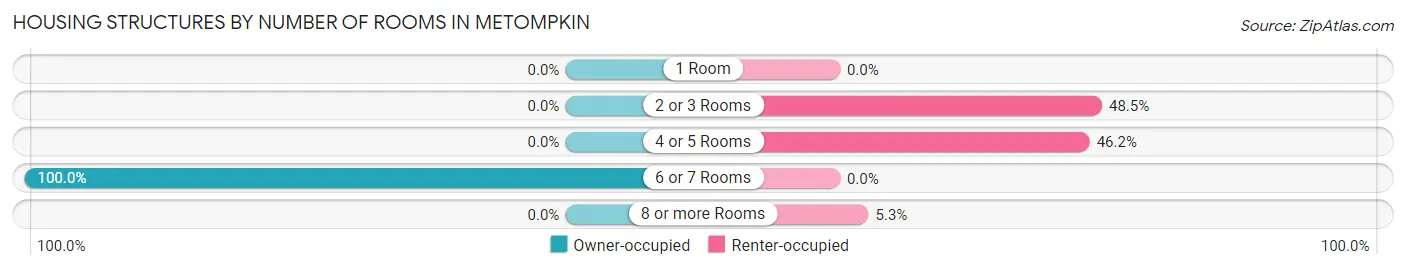
Housing Structures by Number of Rooms in Metompkin
| Number of Rooms | Owner-occupied | Renter-occupied |
| 1 Room | 0 (0.0%) | 0 (0.0%) |
| 2 or 3 Rooms | 0 (0.0%) | 64 (48.5%) |
| 4 or 5 Rooms | 0 (0.0%) | 61 (46.2%) |
| 6 or 7 Rooms | 50 (100.0%) | 0 (0.0%) |
| 8 or more Rooms | 0 (0.0%) | 7 (5.3%) |
| Total | 50 (100.0%) | 132 (100.0%) |
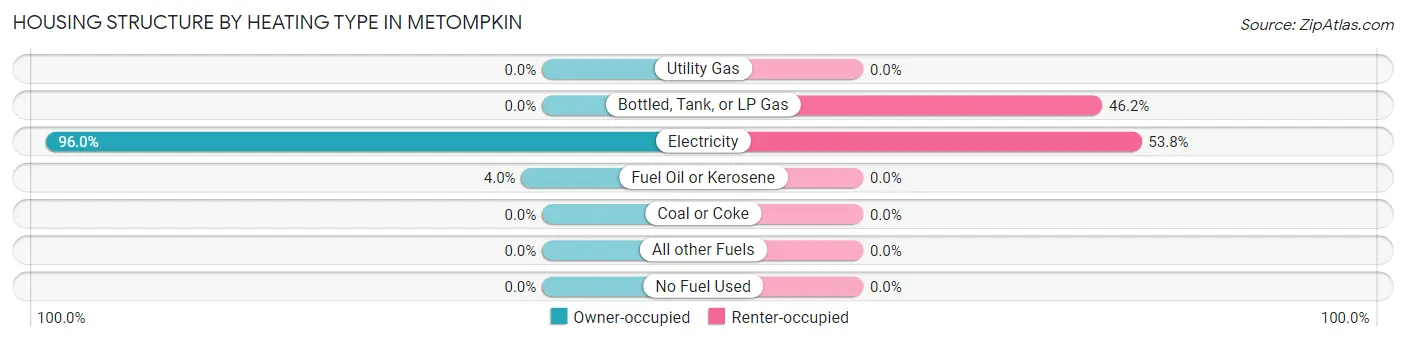
Housing Structure by Heating Type in Metompkin
| Heating Type | Owner-occupied | Renter-occupied |
| Utility Gas | 0 (0.0%) | 0 (0.0%) |
| Bottled, Tank, or LP Gas | 0 (0.0%) | 61 (46.2%) |
| Electricity | 48 (96.0%) | 71 (53.8%) |
| Fuel Oil or Kerosene | 2 (4.0%) | 0 (0.0%) |
| Coal or Coke | 0 (0.0%) | 0 (0.0%) |
| All other Fuels | 0 (0.0%) | 0 (0.0%) |
| No Fuel Used | 0 (0.0%) | 0 (0.0%) |
| Total | 50 (100.0%) | 132 (100.0%) |
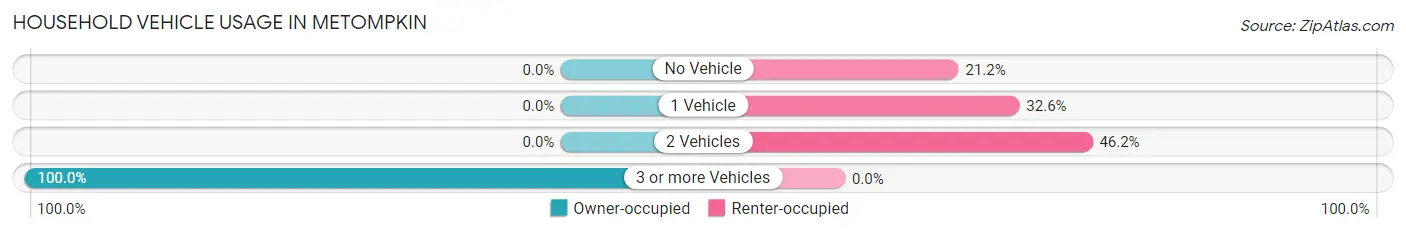
Household Vehicle Usage in Metompkin
| Vehicles per Household | Owner-occupied | Renter-occupied |
| No Vehicle | 0 (0.0%) | 28 (21.2%) |
| 1 Vehicle | 0 (0.0%) | 43 (32.6%) |
| 2 Vehicles | 0 (0.0%) | 61 (46.2%) |
| 3 or more Vehicles | 50 (100.0%) | 0 (0.0%) |
| Total | 50 (100.0%) | 132 (100.0%) |
Real Estate & Mortgages in Metompkin
Real Estate and Mortgage Overview in Metompkin
| Characteristic | Without Mortgage | With Mortgage |
| Housing Units | 2 | 48 |
| Median Property Value | - | - |
| Median Household Income | - | - |
| Monthly Housing Costs | - | - |
| Real Estate Taxes | - | - |
Property Value by Mortgage Status in Metompkin
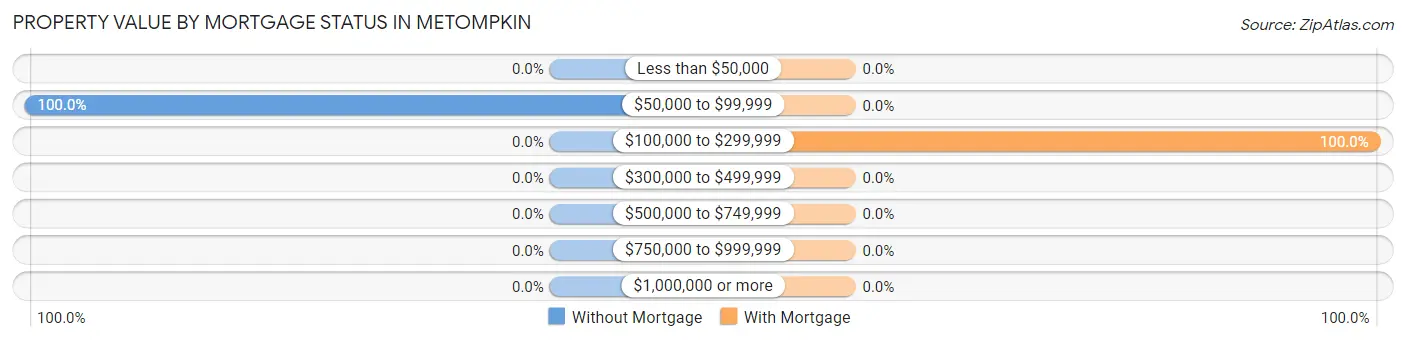
| Property Value | Without Mortgage | With Mortgage |
| Less than $50,000 | 0 (0.0%) | 0 (0.0%) |
| $50,000 to $99,999 | 2 (100.0%) | 0 (0.0%) |
| $100,000 to $299,999 | 0 (0.0%) | 48 (100.0%) |
| $300,000 to $499,999 | 0 (0.0%) | 0 (0.0%) |
| $500,000 to $749,999 | 0 (0.0%) | 0 (0.0%) |
| $750,000 to $999,999 | 0 (0.0%) | 0 (0.0%) |
| $1,000,000 or more | 0 (0.0%) | 0 (0.0%) |
| Total | 2 (100.0%) | 48 (100.0%) |
Household Income by Mortgage Status in Metompkin
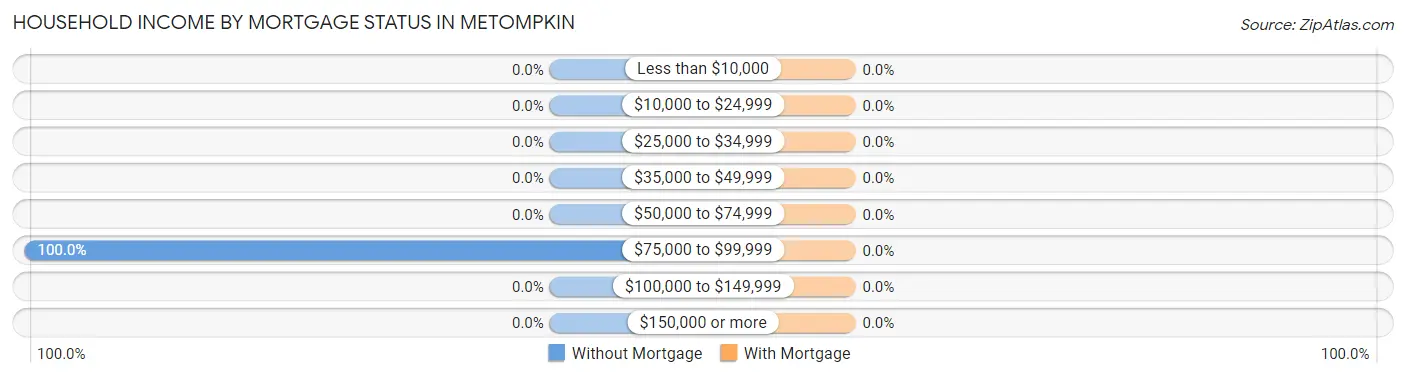
| Household Income | Without Mortgage | With Mortgage |
| Less than $10,000 | 0 (0.0%) | 0 (0.0%) |
| $10,000 to $24,999 | 0 (0.0%) | 0 (0.0%) |
| $25,000 to $34,999 | 0 (0.0%) | 0 (0.0%) |
| $35,000 to $49,999 | 0 (0.0%) | 0 (0.0%) |
| $50,000 to $74,999 | 0 (0.0%) | 0 (0.0%) |
| $75,000 to $99,999 | 2 (100.0%) | 0 (0.0%) |
| $100,000 to $149,999 | 0 (0.0%) | 0 (0.0%) |
| $150,000 or more | 0 (0.0%) | 0 (0.0%) |
| Total | 2 (100.0%) | 48 (100.0%) |
Property Value to Household Income Ratio in Metompkin
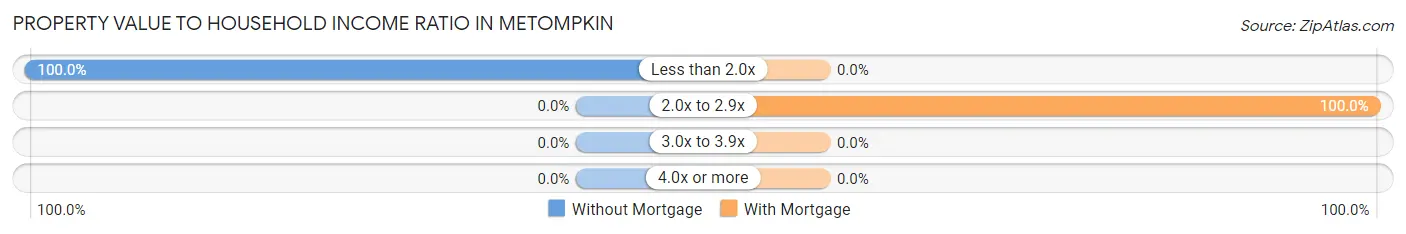
| Value-to-Income Ratio | Without Mortgage | With Mortgage |
| Less than 2.0x | 2 (100.0%) | 0 (0.0%) |
| 2.0x to 2.9x | 0 (0.0%) | 48 (100.0%) |
| 3.0x to 3.9x | 0 (0.0%) | 0 (0.0%) |
| 4.0x or more | 0 (0.0%) | 0 (0.0%) |
| Total | 2 (100.0%) | 48 (100.0%) |
Real Estate Taxes by Mortgage Status in Metompkin
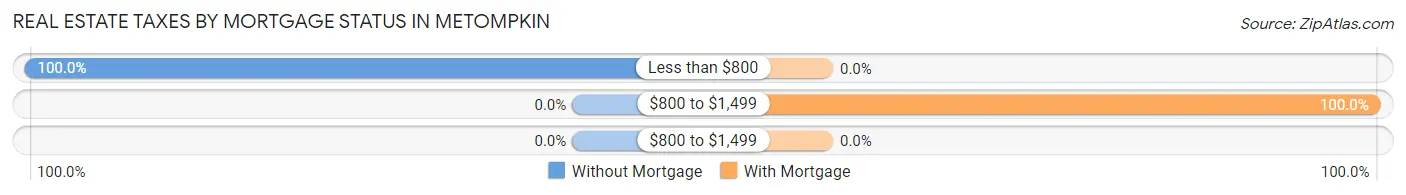
| Property Taxes | Without Mortgage | With Mortgage |
| Less than $800 | 2 (100.0%) | 0 (0.0%) |
| $800 to $1,499 | 0 (0.0%) | 48 (100.0%) |
| $800 to $1,499 | 0 (0.0%) | 0 (0.0%) |
| Total | 2 (100.0%) | 48 (100.0%) |
Health & Disability in Metompkin
Health Insurance Coverage by Age in Metompkin
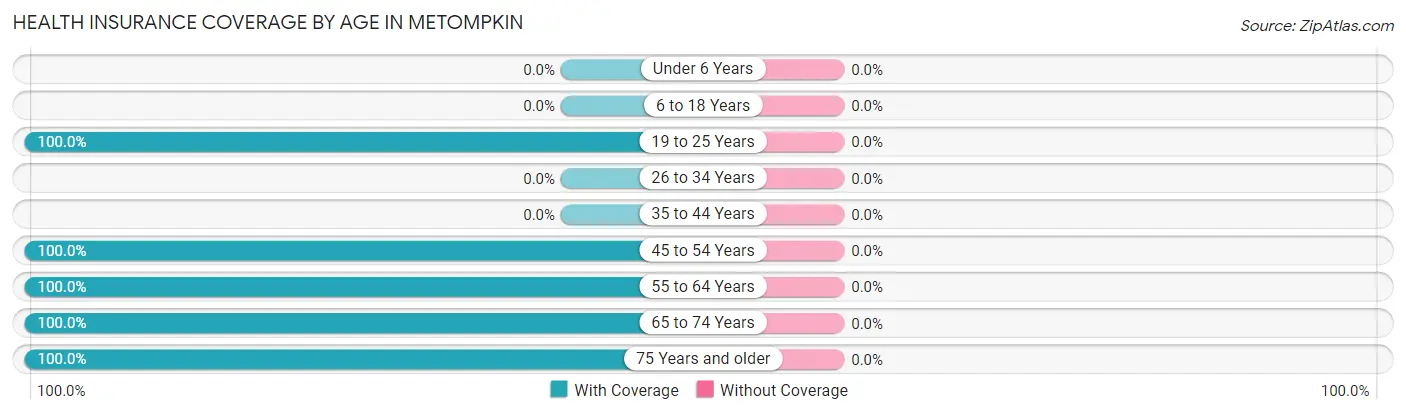
| Age Bracket | With Coverage | Without Coverage |
| Under 6 Years | 0 (0.0%) | 0 (0.0%) |
| 6 to 18 Years | 0 (0.0%) | 0 (0.0%) |
| 19 to 25 Years | 26 (100.0%) | 0 (0.0%) |
| 26 to 34 Years | 0 (0.0%) | 0 (0.0%) |
| 35 to 44 Years | 0 (0.0%) | 0 (0.0%) |
| 45 to 54 Years | 96 (100.0%) | 0 (0.0%) |
| 55 to 64 Years | 2 (100.0%) | 0 (0.0%) |
| 65 to 74 Years | 113 (100.0%) | 0 (0.0%) |
| 75 Years and older | 7 (100.0%) | 0 (0.0%) |
| Total | 244 (100.0%) | 0 (0.0%) |
Health Insurance Coverage by Citizenship Status in Metompkin
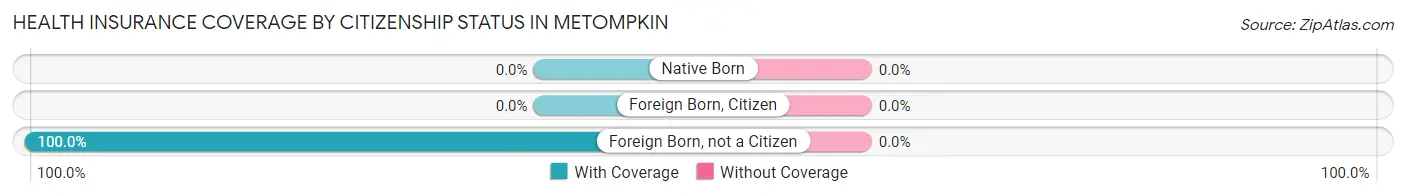
| Citizenship Status | With Coverage | Without Coverage |
| Native Born | 0 (0.0%) | 0 (0.0%) |
| Foreign Born, Citizen | 0 (0.0%) | 0 (0.0%) |
| Foreign Born, not a Citizen | 26 (100.0%) | 0 (0.0%) |
Health Insurance Coverage by Household Income in Metompkin
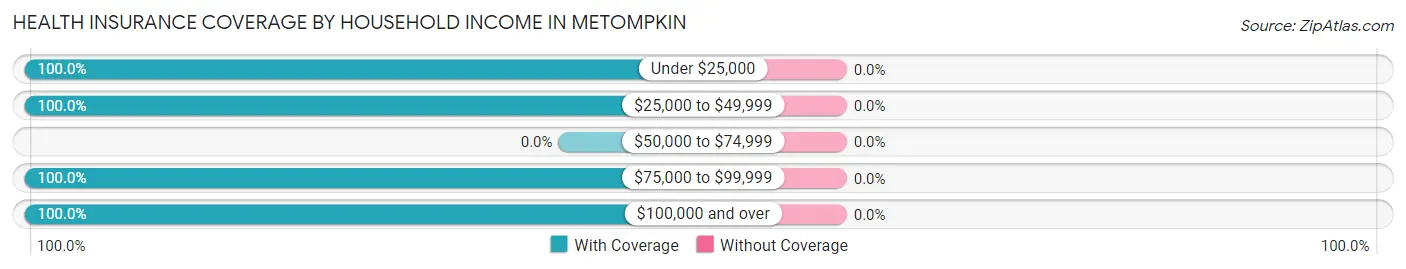
| Household Income | With Coverage | Without Coverage |
| Under $25,000 | 118 (100.0%) | 0 (0.0%) |
| $25,000 to $49,999 | 14 (100.0%) | 0 (0.0%) |
| $50,000 to $74,999 | 0 (0.0%) | 0 (0.0%) |
| $75,000 to $99,999 | 4 (100.0%) | 0 (0.0%) |
| $100,000 and over | 108 (100.0%) | 0 (0.0%) |
Public vs Private Health Insurance Coverage by Age in Metompkin
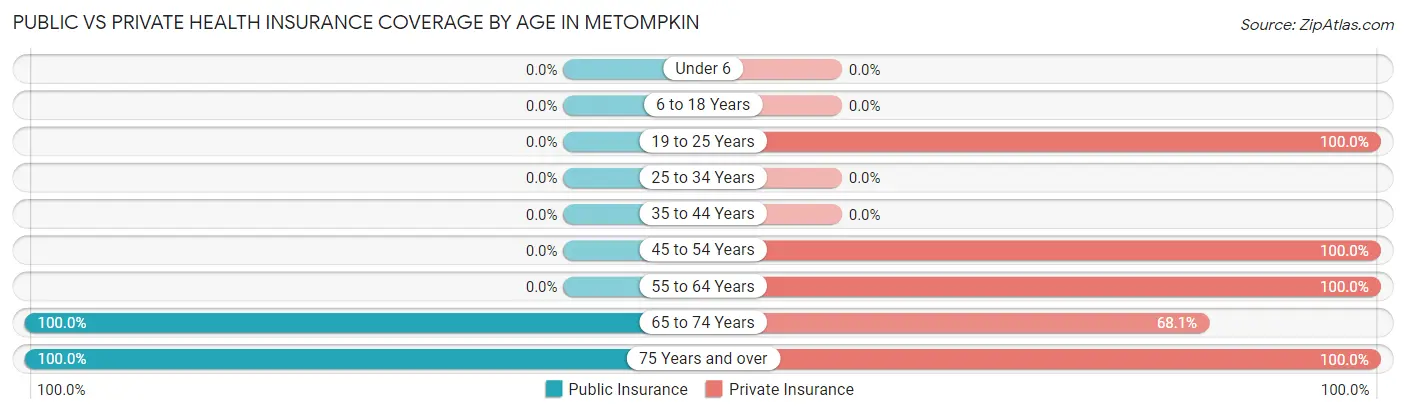
| Age Bracket | Public Insurance | Private Insurance |
| Under 6 | 0 (0.0%) | 0 (0.0%) |
| 6 to 18 Years | 0 (0.0%) | 0 (0.0%) |
| 19 to 25 Years | 0 (0.0%) | 26 (100.0%) |
| 25 to 34 Years | 0 (0.0%) | 0 (0.0%) |
| 35 to 44 Years | 0 (0.0%) | 0 (0.0%) |
| 45 to 54 Years | 0 (0.0%) | 96 (100.0%) |
| 55 to 64 Years | 0 (0.0%) | 2 (100.0%) |
| 65 to 74 Years | 113 (100.0%) | 77 (68.1%) |
| 75 Years and over | 7 (100.0%) | 7 (100.0%) |
| Total | 120 (49.2%) | 208 (85.3%) |
Disability Status by Sex by Age in Metompkin
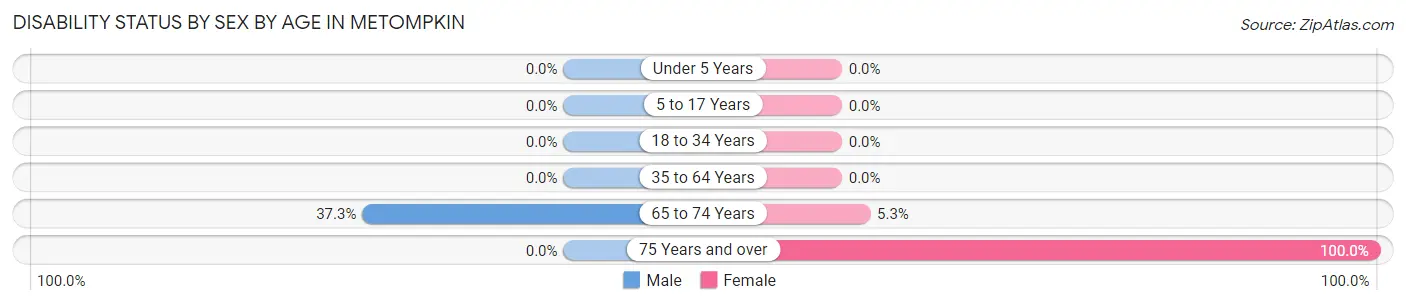
| Age Bracket | Male | Female |
| Under 5 Years | 0 (0.0%) | 0 (0.0%) |
| 5 to 17 Years | 0 (0.0%) | 0 (0.0%) |
| 18 to 34 Years | 0 (0.0%) | 0 (0.0%) |
| 35 to 64 Years | 0 (0.0%) | 0 (0.0%) |
| 65 to 74 Years | 28 (37.3%) | 2 (5.3%) |
| 75 Years and over | 0 (0.0%) | 7 (100.0%) |
Disability Class by Sex by Age in Metompkin
Disability Class: Hearing Difficulty
| Age Bracket | Male | Female |
| Under 5 Years | 0 (0.0%) | 0 (0.0%) |
| 5 to 17 Years | 0 (0.0%) | 0 (0.0%) |
| 18 to 34 Years | 0 (0.0%) | 0 (0.0%) |
| 35 to 64 Years | 0 (0.0%) | 0 (0.0%) |
| 65 to 74 Years | 0 (0.0%) | 0 (0.0%) |
| 75 Years and over | 0 (0.0%) | 0 (0.0%) |
Disability Class: Vision Difficulty
| Age Bracket | Male | Female |
| Under 5 Years | 0 (0.0%) | 0 (0.0%) |
| 5 to 17 Years | 0 (0.0%) | 0 (0.0%) |
| 18 to 34 Years | 0 (0.0%) | 0 (0.0%) |
| 35 to 64 Years | 0 (0.0%) | 0 (0.0%) |
| 65 to 74 Years | 0 (0.0%) | 0 (0.0%) |
| 75 Years and over | 0 (0.0%) | 0 (0.0%) |
Disability Class: Cognitive Difficulty
| Age Bracket | Male | Female |
| 5 to 17 Years | 0 (0.0%) | 0 (0.0%) |
| 18 to 34 Years | 0 (0.0%) | 0 (0.0%) |
| 35 to 64 Years | 0 (0.0%) | 0 (0.0%) |
| 65 to 74 Years | 0 (0.0%) | 0 (0.0%) |
| 75 Years and over | 0 (0.0%) | 0 (0.0%) |
Disability Class: Ambulatory Difficulty
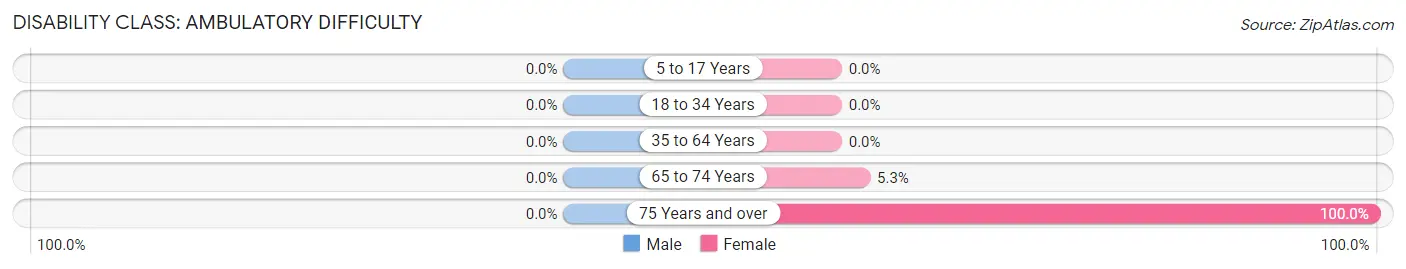
| Age Bracket | Male | Female |
| 5 to 17 Years | 0 (0.0%) | 0 (0.0%) |
| 18 to 34 Years | 0 (0.0%) | 0 (0.0%) |
| 35 to 64 Years | 0 (0.0%) | 0 (0.0%) |
| 65 to 74 Years | 0 (0.0%) | 2 (5.3%) |
| 75 Years and over | 0 (0.0%) | 7 (100.0%) |
Disability Class: Self-Care Difficulty
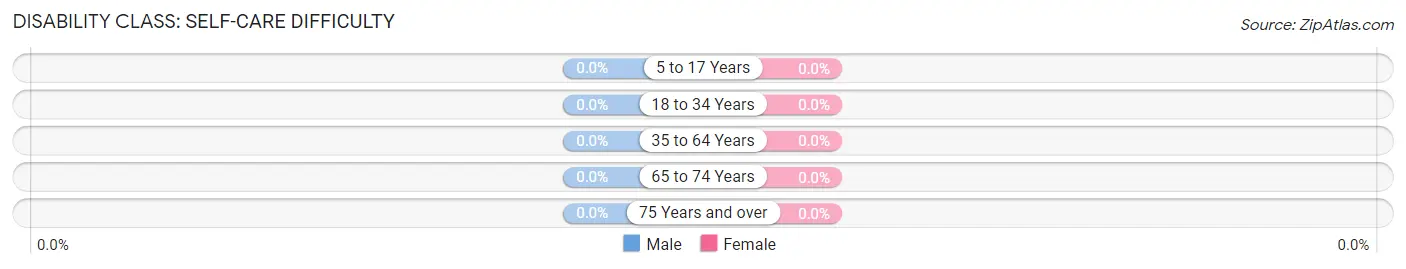
| Age Bracket | Male | Female |
| 5 to 17 Years | 0 (0.0%) | 0 (0.0%) |
| 18 to 34 Years | 0 (0.0%) | 0 (0.0%) |
| 35 to 64 Years | 0 (0.0%) | 0 (0.0%) |
| 65 to 74 Years | 0 (0.0%) | 0 (0.0%) |
| 75 Years and over | 0 (0.0%) | 0 (0.0%) |
Technology Access in Metompkin
Computing Device Access in Metompkin
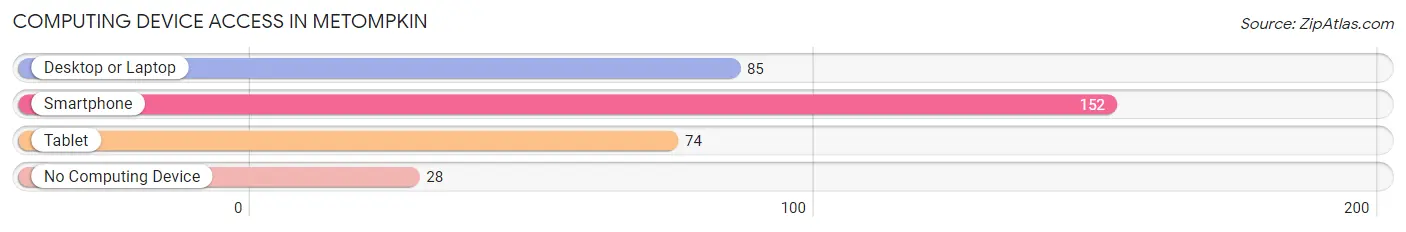
| Device Type | # Households | % Households |
| Desktop or Laptop | 85 | 46.7% |
| Smartphone | 152 | 83.5% |
| Tablet | 74 | 40.7% |
| No Computing Device | 28 | 15.4% |
| Total | 182 | 100.0% |
Internet Access in Metompkin
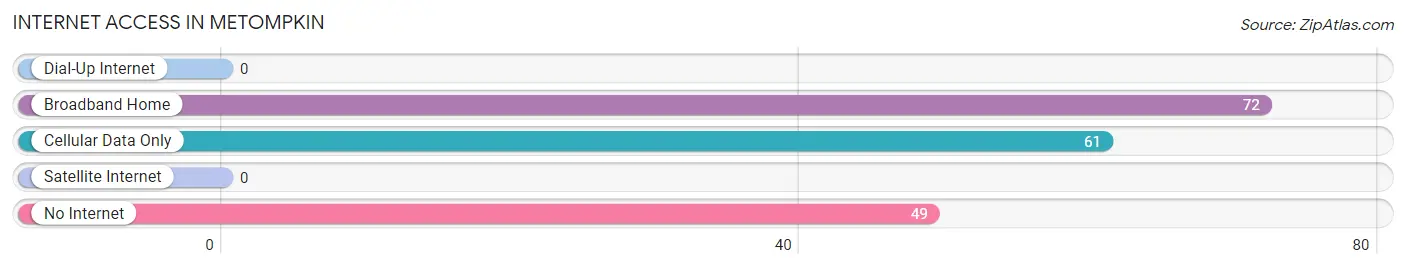
| Internet Type | # Households | % Households |
| Dial-Up Internet | 0 | 0.0% |
| Broadband Home | 72 | 39.6% |
| Cellular Data Only | 61 | 33.5% |
| Satellite Internet | 0 | 0.0% |
| No Internet | 49 | 26.9% |
| Total | 182 | 100.0% |
Metompkin Summary
Metompkin is a small unincorporated community located in Accomack County, Virginia. It is situated on the Eastern Shore of Virginia, near the Chesapeake Bay. The community is bordered by the towns of Parksley and Onancock. Metompkin is a rural area with a population of approximately 500 people.
History
Metompkin was first settled in the early 1700s by English colonists. The community was named after the Metompkin Indians, a Native American tribe that lived in the area. The Metompkin Indians were part of the Powhatan Confederacy, a group of Native American tribes that inhabited the area before the arrival of the English. The Metompkin Indians were eventually forced out of the area by the English colonists.
In the late 1700s, Metompkin became a popular destination for wealthy planters from the mainland. The planters built large estates in the area and used the land for farming and hunting. The area was also known for its oyster beds, which were harvested for food and for their pearls.
In the early 1800s, Metompkin became a popular destination for vacationers. The area was known for its beautiful beaches and its abundance of wildlife. The area was also known for its seafood, which was harvested from the nearby Chesapeake Bay.
Geography
Metompkin is located on the Eastern Shore of Virginia, near the Chesapeake Bay. The community is bordered by the towns of Parksley and Onancock. The area is mostly rural, with a few small towns and villages scattered throughout. The area is known for its beautiful beaches, marshes, and forests.
Economy
The economy of Metompkin is largely based on agriculture and fishing. The area is known for its oyster beds, which are harvested for food and for their pearls. The area is also known for its seafood, which is harvested from the nearby Chesapeake Bay.
The area is also home to several small businesses, including restaurants, stores, and other services. The area is also home to several small farms, which produce a variety of crops, including corn, soybeans, and wheat.
Demographics
As of the 2010 census, the population of Metompkin was 498 people. The racial makeup of the community was 94.2% White, 3.2% African American, 0.2% Native American, 0.2% Asian, 0.2% from other races, and 1.8% from two or more races. The median household income was $37,500. The median age was 44 years.
Metompkin is a small, rural community with a population of approximately 500 people. The area is known for its beautiful beaches, marshes, and forests. The economy of the area is largely based on agriculture and fishing. The area is also home to several small businesses, including restaurants, stores, and other services. The area is also home to several small farms, which produce a variety of crops, including corn, soybeans, and wheat.
Common Questions
What is Per Capita Income in Metompkin?
Per Capita income in Metompkin is $52,615.
What is the Median Household income in Metompkin?
Median Household Income in Metompkin is $23,564.
What is Inequality or Gini Index in Metompkin?
Inequality or Gini Index in Metompkin is 0.62.
What is the Total Population of Metompkin?
Total Population of Metompkin is 244.
What is the Total Male Population of Metompkin?
Total Male Population of Metompkin is 165.
What is the Total Female Population of Metompkin?
Total Female Population of Metompkin is 79.
What is the Ratio of Males per 100 Females in Metompkin?
There are 208.86 Males per 100 Females in Metompkin.
What is the Ratio of Females per 100 Males in Metompkin?
There are 47.88 Females per 100 Males in Metompkin.
What is the Median Population Age in Metompkin?
Median Population Age in Metompkin is 56.0 Years.
What is the Average Family Size in Metompkin
Average Family Size in Metompkin is 2.2 People.
What is the Average Household Size in Metompkin
Average Household Size in Metompkin is 1.3 People.
How Large is the Labor Force in Metompkin?
There are 171 People in the Labor Forcein in Metompkin.
What is the Percentage of People in the Labor Force in Metompkin?
70.1% of People are in the Labor Force in Metompkin.