Stone Ridge, VA Map & Demographics
Stone Ridge Map
Stone Ridge Overview
$58,858
PER CAPITA INCOME
$188,116
AVG FAMILY INCOME
$185,586
AVG HOUSEHOLD INCOME
52.2%
WAGE / INCOME GAP [ % ]
47.8¢/ $1
WAGE / INCOME GAP [ $ ]
0.30
INEQUALITY / GINI INDEX
16,049
TOTAL POPULATION
7,632
MALE POPULATION
8,417
FEMALE POPULATION
90.67
MALES / 100 FEMALES
110.29
FEMALES / 100 MALES
35.7
MEDIAN AGE
3.6
AVG FAMILY SIZE
3.4
AVG HOUSEHOLD SIZE
8,940
LABOR FORCE [ PEOPLE ]
79.6%
PERCENT IN LABOR FORCE
1.1%
UNEMPLOYMENT RATE
Income in Stone Ridge
Income Overview in Stone Ridge
Per Capita Income in Stone Ridge is $58,858, while median incomes of families and households are $188,116 and $185,586 respectively.
| Characteristic | Number | Measure |
| Per Capita Income | 16,049 | $58,858 |
| Median Family Income | 4,172 | $188,116 |
| Mean Family Income | 4,172 | $195,761 |
| Median Household Income | 4,770 | $185,586 |
| Mean Household Income | 4,770 | $194,052 |
| Income Deficit | 4,172 | $0 |
| Wage / Income Gap (%) | 16,049 | 52.25% |
| Wage / Income Gap ($) | 16,049 | 47.75¢ per $1 |
| Gini / Inequality Index | 16,049 | 0.30 |
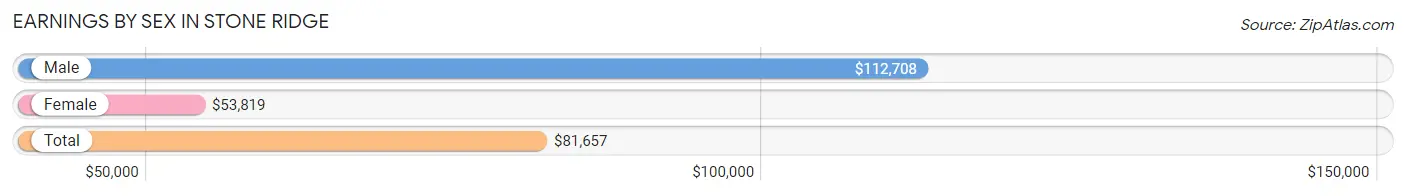
Earnings by Sex in Stone Ridge
Average Earnings in Stone Ridge are $81,657, $112,708 for men and $53,819 for women, a difference of 52.2%.
| Sex | Number | Average Earnings |
| Male | 4,908 (52.4%) | $112,708 |
| Female | 4,453 (47.6%) | $53,819 |
| Total | 9,361 (100.0%) | $81,657 |
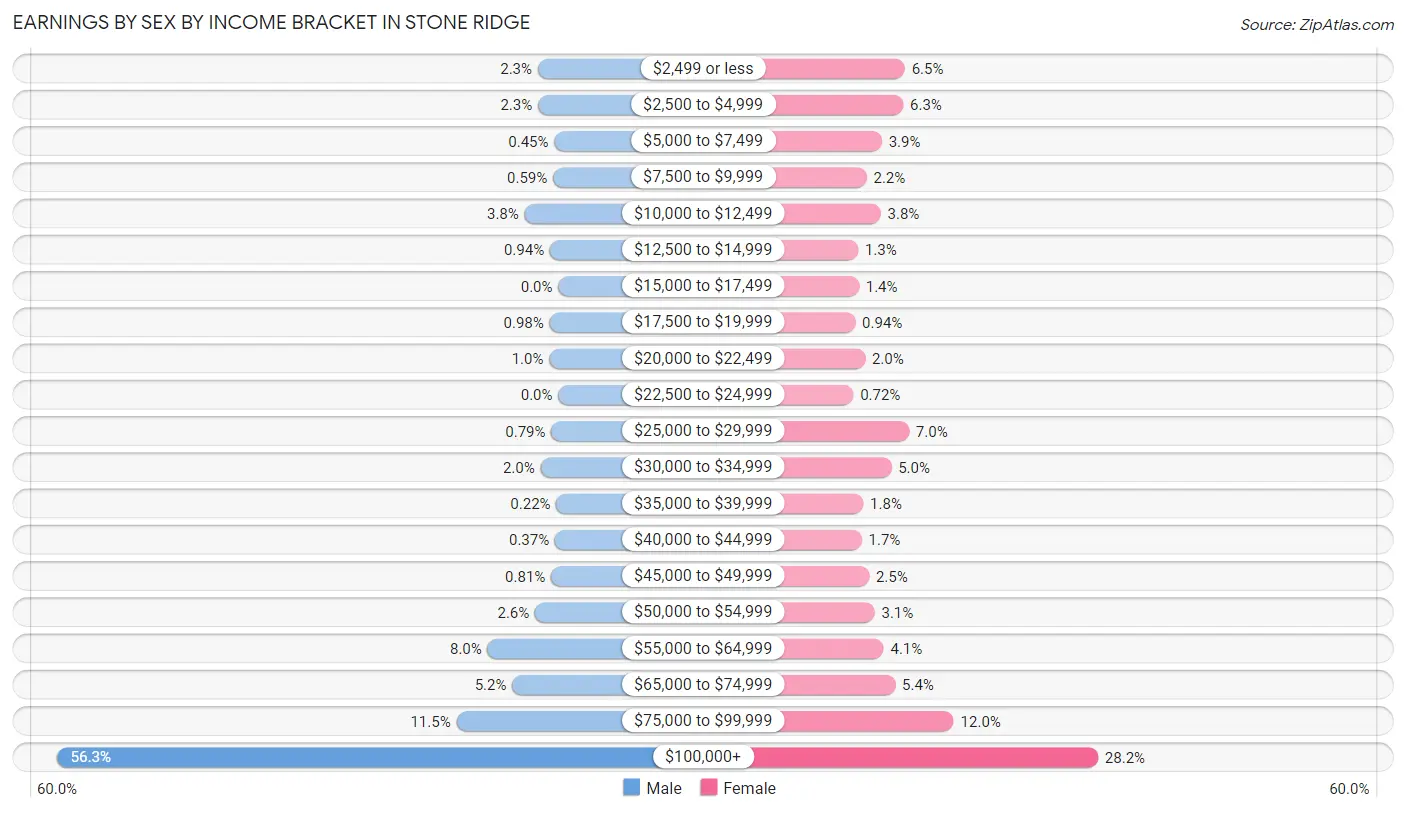
Earnings by Sex by Income Bracket in Stone Ridge
The most common earnings brackets in Stone Ridge are $100,000+ for men (2,762 | 56.3%) and $100,000+ for women (1,257 | 28.2%).
| Income | Male | Female |
| $2,499 or less | 113 (2.3%) | 290 (6.5%) |
| $2,500 to $4,999 | 112 (2.3%) | 282 (6.3%) |
| $5,000 to $7,499 | 22 (0.4%) | 175 (3.9%) |
| $7,500 to $9,999 | 29 (0.6%) | 99 (2.2%) |
| $10,000 to $12,499 | 186 (3.8%) | 169 (3.8%) |
| $12,500 to $14,999 | 46 (0.9%) | 56 (1.3%) |
| $15,000 to $17,499 | 0 (0.0%) | 60 (1.3%) |
| $17,500 to $19,999 | 48 (1.0%) | 42 (0.9%) |
| $20,000 to $22,499 | 50 (1.0%) | 91 (2.0%) |
| $22,500 to $24,999 | 0 (0.0%) | 32 (0.7%) |
| $25,000 to $29,999 | 39 (0.8%) | 311 (7.0%) |
| $30,000 to $34,999 | 98 (2.0%) | 222 (5.0%) |
| $35,000 to $39,999 | 11 (0.2%) | 82 (1.8%) |
| $40,000 to $44,999 | 18 (0.4%) | 74 (1.7%) |
| $45,000 to $49,999 | 40 (0.8%) | 111 (2.5%) |
| $50,000 to $54,999 | 128 (2.6%) | 139 (3.1%) |
| $55,000 to $64,999 | 390 (8.0%) | 184 (4.1%) |
| $65,000 to $74,999 | 254 (5.2%) | 242 (5.4%) |
| $75,000 to $99,999 | 562 (11.5%) | 535 (12.0%) |
| $100,000+ | 2,762 (56.3%) | 1,257 (28.2%) |
| Total | 4,908 (100.0%) | 4,453 (100.0%) |
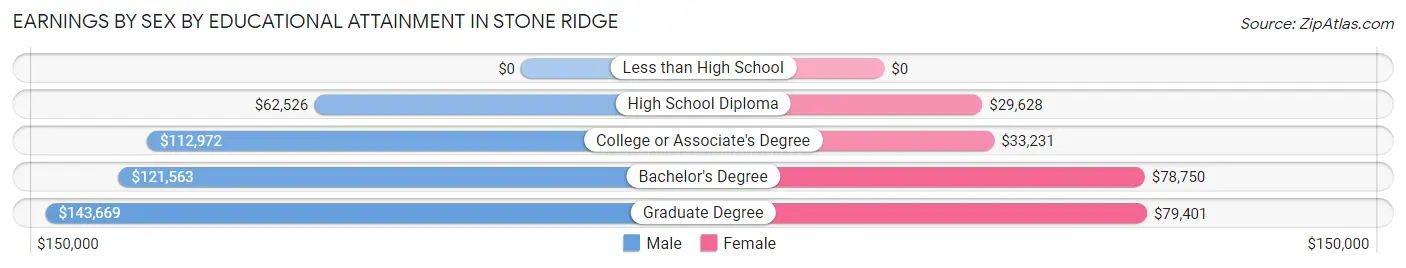
Earnings by Sex by Educational Attainment in Stone Ridge
Average earnings in Stone Ridge are $114,479 for men and $68,788 for women, a difference of 39.9%. Men with an educational attainment of graduate degree enjoy the highest average annual earnings of $143,669, while those with high school diploma education earn the least with $62,526. Women with an educational attainment of graduate degree earn the most with the average annual earnings of $79,401, while those with high school diploma education have the smallest earnings of $29,628.
| Educational Attainment | Male Income | Female Income |
| Less than High School | - | - |
| High School Diploma | $62,526 | $29,628 |
| College or Associate's Degree | $112,972 | $33,231 |
| Bachelor's Degree | $121,563 | $78,750 |
| Graduate Degree | $143,669 | $79,401 |
| Total | $114,479 | $68,788 |
Family Income in Stone Ridge
Family Income Brackets in Stone Ridge
According to the Stone Ridge family income data, there are 1,798 families falling into the $200,000+ income range, which is the most common income bracket and makes up 43.1% of all families.
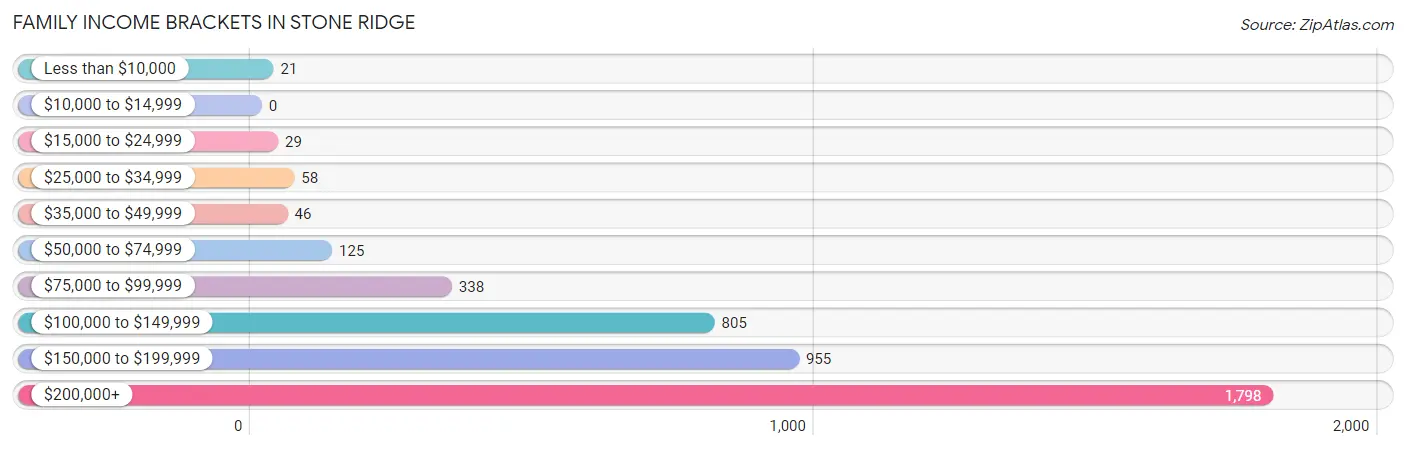
| Income Bracket | # Families | % Families |
| Less than $10,000 | 21 | 0.5% |
| $10,000 to $14,999 | 0 | 0.0% |
| $15,000 to $24,999 | 29 | 0.7% |
| $25,000 to $34,999 | 58 | 1.4% |
| $35,000 to $49,999 | 46 | 1.1% |
| $50,000 to $74,999 | 125 | 3.0% |
| $75,000 to $99,999 | 338 | 8.1% |
| $100,000 to $149,999 | 805 | 19.3% |
| $150,000 to $199,999 | 955 | 22.9% |
| $200,000+ | 1,798 | 43.1% |
Family Income by Famaliy Size in Stone Ridge
5-person families (730 | 17.5%) account for the highest median family income in Stone Ridge with $216,976 per family, while 2-person families (947 | 22.7%) have the highest median income of $94,128 per family member.
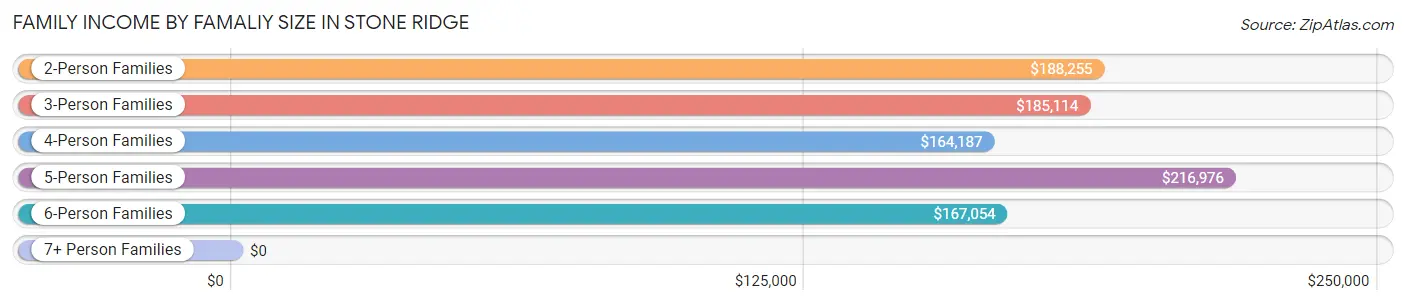
| Income Bracket | # Families | Median Income |
| 2-Person Families | 947 (22.7%) | $188,255 |
| 3-Person Families | 852 (20.4%) | $185,114 |
| 4-Person Families | 1,437 (34.4%) | $164,187 |
| 5-Person Families | 730 (17.5%) | $216,976 |
| 6-Person Families | 91 (2.2%) | $167,054 |
| 7+ Person Families | 115 (2.8%) | $0 |
| Total | 4,172 (100.0%) | $188,116 |
Family Income by Number of Earners in Stone Ridge
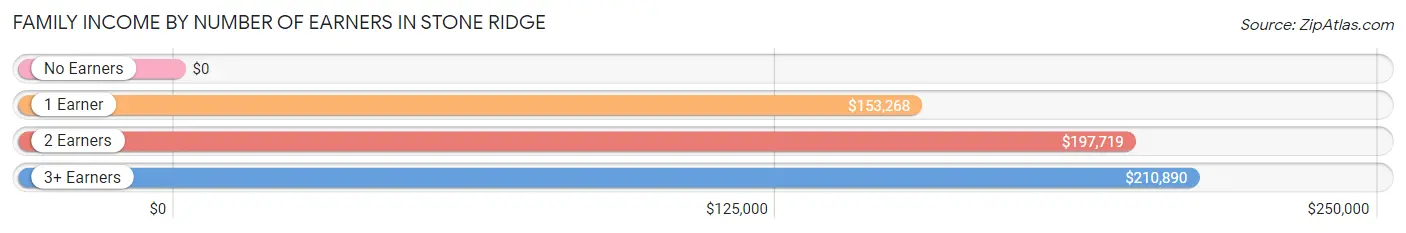
| Number of Earners | # Families | Median Income |
| No Earners | 44 (1.1%) | $0 |
| 1 Earner | 975 (23.4%) | $153,268 |
| 2 Earners | 2,272 (54.5%) | $197,719 |
| 3+ Earners | 881 (21.1%) | $210,890 |
| Total | 4,172 (100.0%) | $188,116 |
Household Income in Stone Ridge
Household Income Brackets in Stone Ridge
With 1,918 households falling in the category, the $200,000+ income range is the most frequent in Stone Ridge, accounting for 40.2% of all households.
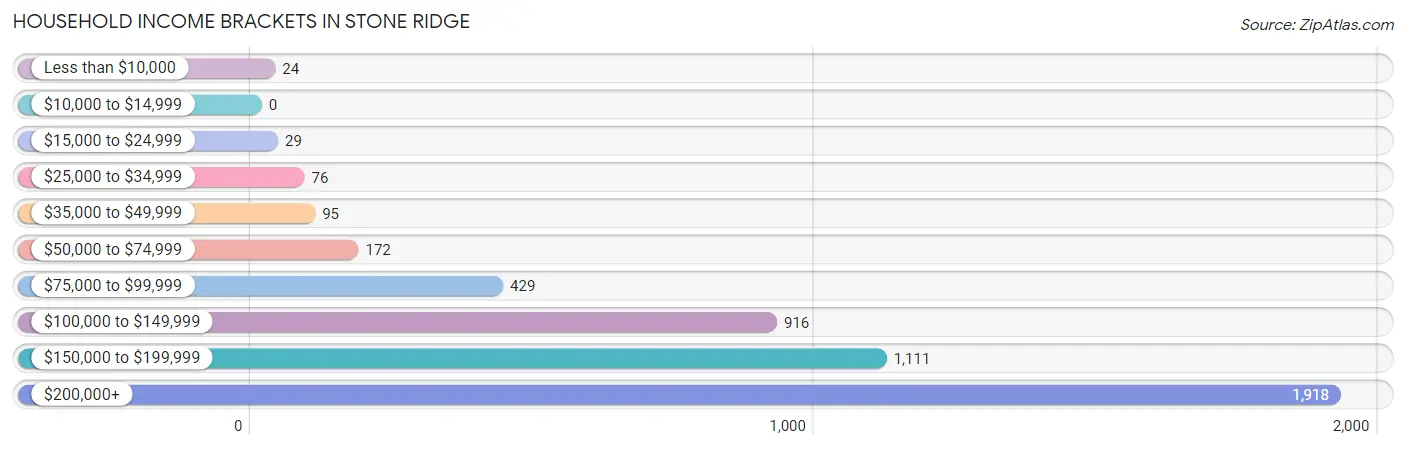
| Income Bracket | # Households | % Households |
| Less than $10,000 | 24 | 0.5% |
| $10,000 to $14,999 | 0 | 0.0% |
| $15,000 to $24,999 | 29 | 0.6% |
| $25,000 to $34,999 | 76 | 1.6% |
| $35,000 to $49,999 | 95 | 2.0% |
| $50,000 to $74,999 | 172 | 3.6% |
| $75,000 to $99,999 | 429 | 9.0% |
| $100,000 to $149,999 | 916 | 19.2% |
| $150,000 to $199,999 | 1,111 | 23.3% |
| $200,000+ | 1,918 | 40.2% |
Household Income by Householder Age in Stone Ridge
The median household income in Stone Ridge is $185,586, with the highest median household income of $188,775 found in the 45 to 64 years age bracket for the primary householder. A total of 1,807 households (37.9%) fall into this category. Meanwhile, the 15 to 24 years age bracket for the primary householder has the lowest median household income of $0, with 26 households (0.5%) in this group.
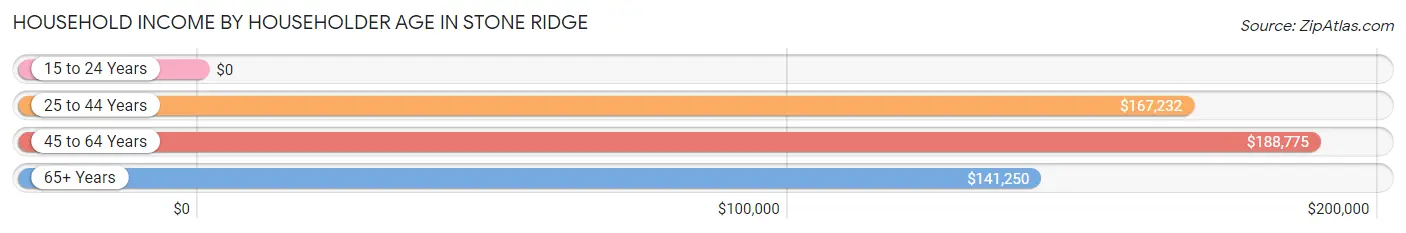
| Income Bracket | # Households | Median Income |
| 15 to 24 Years | 26 (0.5%) | $0 |
| 25 to 44 Years | 2,557 (53.6%) | $167,232 |
| 45 to 64 Years | 1,807 (37.9%) | $188,775 |
| 65+ Years | 380 (8.0%) | $141,250 |
| Total | 4,770 (100.0%) | $185,586 |
Poverty in Stone Ridge
Income Below Poverty by Sex and Age in Stone Ridge
With 0.6% poverty level for males and 1.3% for females among the residents of Stone Ridge, 16 and 17 year old males and 12 to 14 year old females are the most vulnerable to poverty, with 16 males (25.0%) and 21 females (5.5%) in their respective age groups living below the poverty level.
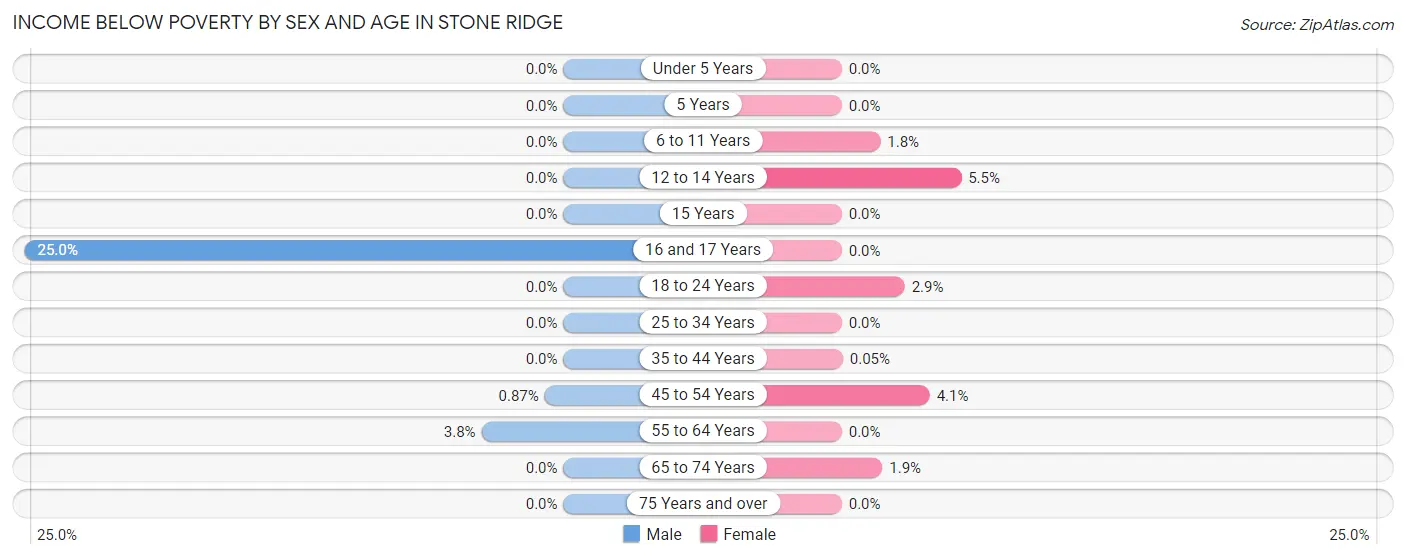
| Age Bracket | Male | Female |
| Under 5 Years | 0 (0.0%) | 0 (0.0%) |
| 5 Years | 0 (0.0%) | 0 (0.0%) |
| 6 to 11 Years | 0 (0.0%) | 21 (1.8%) |
| 12 to 14 Years | 0 (0.0%) | 21 (5.5%) |
| 15 Years | 0 (0.0%) | 0 (0.0%) |
| 16 and 17 Years | 16 (25.0%) | 0 (0.0%) |
| 18 to 24 Years | 0 (0.0%) | 8 (2.9%) |
| 25 to 34 Years | 0 (0.0%) | 0 (0.0%) |
| 35 to 44 Years | 0 (0.0%) | 1 (0.1%) |
| 45 to 54 Years | 11 (0.9%) | 45 (4.1%) |
| 55 to 64 Years | 18 (3.8%) | 0 (0.0%) |
| 65 to 74 Years | 0 (0.0%) | 10 (1.9%) |
| 75 Years and over | 0 (0.0%) | 0 (0.0%) |
| Total | 45 (0.6%) | 106 (1.3%) |
Income Above Poverty by Sex and Age in Stone Ridge
According to the poverty statistics in Stone Ridge, males aged under 5 years and females aged under 5 years are the age groups that are most secure financially, with 100.0% of males and 100.0% of females in these age groups living above the poverty line.
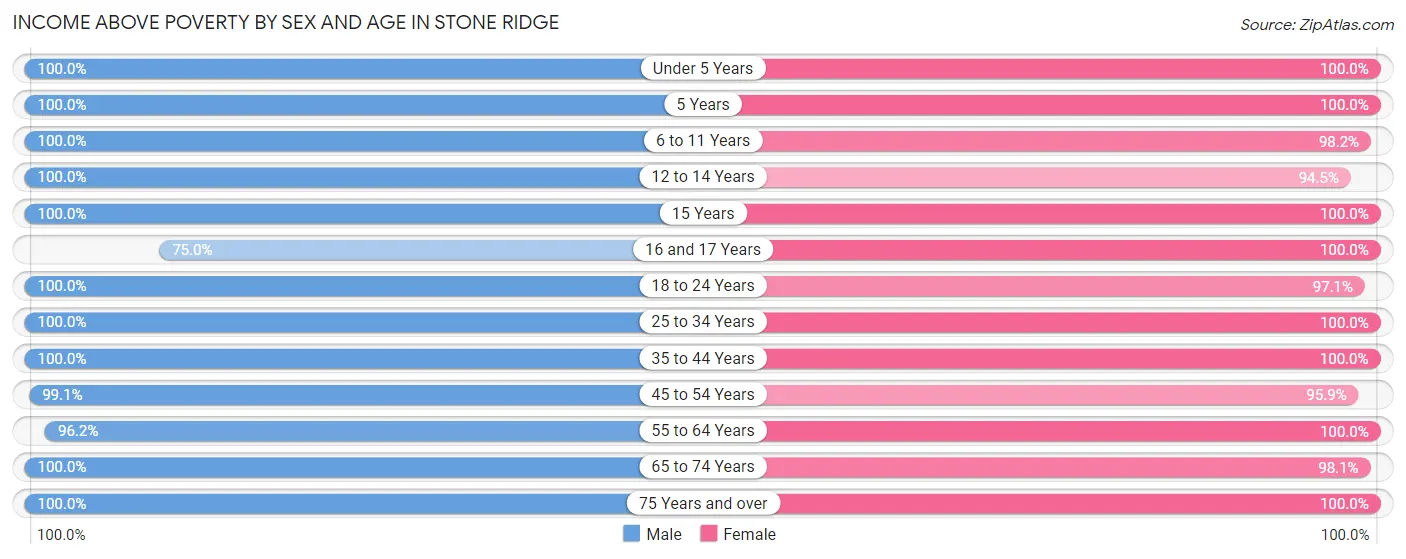
| Age Bracket | Male | Female |
| Under 5 Years | 901 (100.0%) | 768 (100.0%) |
| 5 Years | 175 (100.0%) | 142 (100.0%) |
| 6 to 11 Years | 906 (100.0%) | 1,155 (98.2%) |
| 12 to 14 Years | 275 (100.0%) | 358 (94.5%) |
| 15 Years | 30 (100.0%) | 66 (100.0%) |
| 16 and 17 Years | 48 (75.0%) | 635 (100.0%) |
| 18 to 24 Years | 478 (100.0%) | 266 (97.1%) |
| 25 to 34 Years | 750 (100.0%) | 789 (100.0%) |
| 35 to 44 Years | 1,977 (100.0%) | 2,021 (100.0%) |
| 45 to 54 Years | 1,247 (99.1%) | 1,059 (95.9%) |
| 55 to 64 Years | 456 (96.2%) | 489 (100.0%) |
| 65 to 74 Years | 262 (100.0%) | 521 (98.1%) |
| 75 Years and over | 82 (100.0%) | 42 (100.0%) |
| Total | 7,587 (99.4%) | 8,311 (98.7%) |
Income Below Poverty Among Married-Couple Families in Stone Ridge
The poverty statistics for married-couple families in Stone Ridge show that 0.6% or 20 of the total 3,574 families live below the poverty line. Families with 1 or 2 children have the highest poverty rate of 1.0%, comprising of 20 families. On the other hand, families with no children have the lowest poverty rate of 0.0%, which includes 0 families.
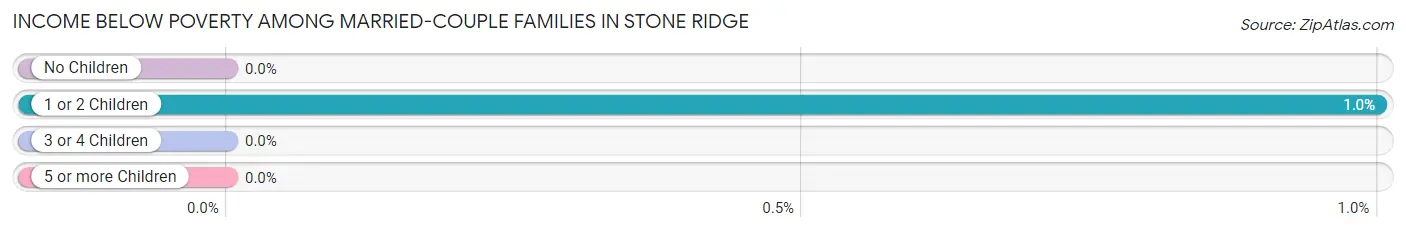
| Children | Above Poverty | Below Poverty |
| No Children | 999 (100.0%) | 0 (0.0%) |
| 1 or 2 Children | 1,978 (99.0%) | 20 (1.0%) |
| 3 or 4 Children | 577 (100.0%) | 0 (0.0%) |
| 5 or more Children | 0 (0.0%) | 0 (0.0%) |
| Total | 3,554 (99.4%) | 20 (0.6%) |
Income Below Poverty Among Single-Parent Households in Stone Ridge
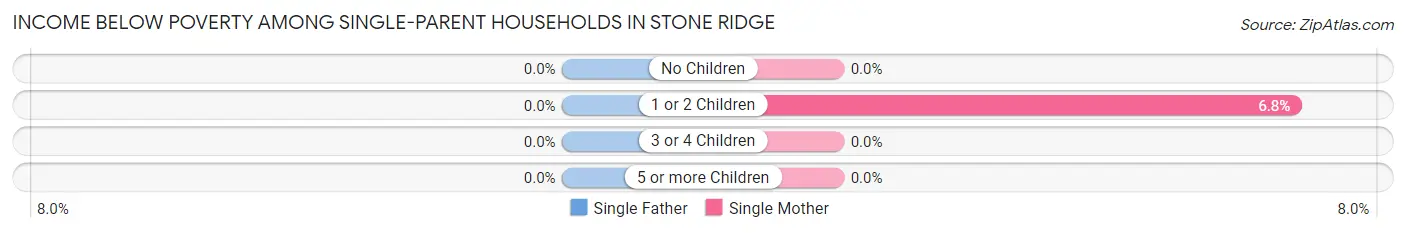
| Children | Single Father | Single Mother |
| No Children | 0 (0.0%) | 0 (0.0%) |
| 1 or 2 Children | 0 (0.0%) | 22 (6.8%) |
| 3 or 4 Children | 0 (0.0%) | 0 (0.0%) |
| 5 or more Children | 0 (0.0%) | 0 (0.0%) |
| Total | 0 (0.0%) | 22 (4.7%) |
Income Below Poverty Among Married-Couple vs Single-Parent Households in Stone Ridge
The poverty data for Stone Ridge shows that 20 of the married-couple family households (0.6%) and 22 of the single-parent households (3.7%) are living below the poverty level. Within the married-couple family households, those with 1 or 2 children have the highest poverty rate, with 20 households (1.0%) falling below the poverty line. Among the single-parent households, those with 1 or 2 children have the highest poverty rate, with 22 household (5.1%) living below poverty.
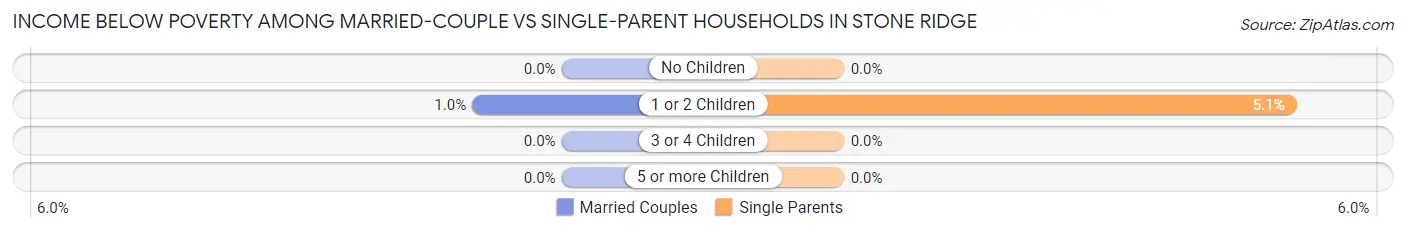
| Children | Married-Couple Families | Single-Parent Households |
| No Children | 0 (0.0%) | 0 (0.0%) |
| 1 or 2 Children | 20 (1.0%) | 22 (5.1%) |
| 3 or 4 Children | 0 (0.0%) | 0 (0.0%) |
| 5 or more Children | 0 (0.0%) | 0 (0.0%) |
| Total | 20 (0.6%) | 22 (3.7%) |
Race in Stone Ridge
The most populous races in Stone Ridge are White / Caucasian (7,630 | 47.5%), Asian (4,394 | 27.4%), and Black / African American (2,025 | 12.6%).
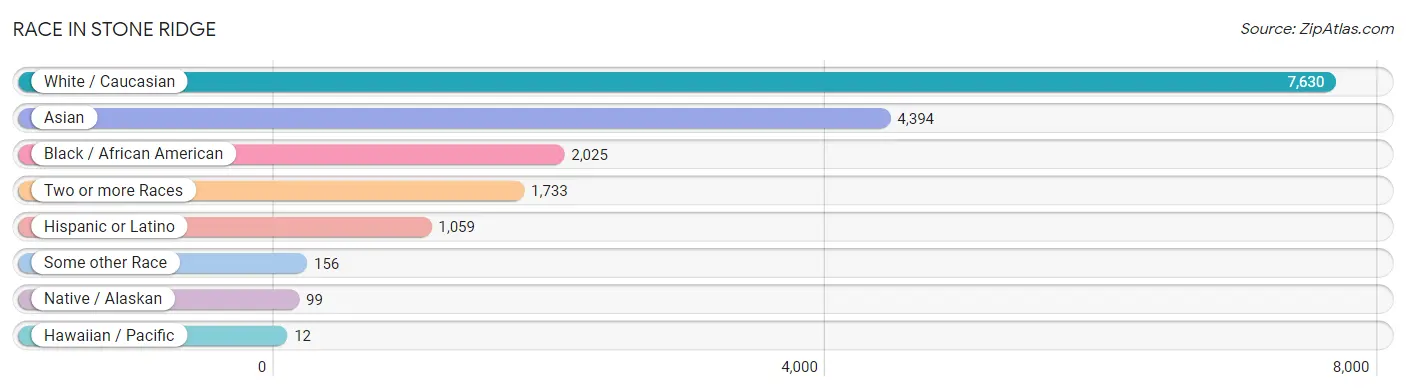
| Race | # Population | % Population |
| Asian | 4,394 | 27.4% |
| Black / African American | 2,025 | 12.6% |
| Hawaiian / Pacific | 12 | 0.1% |
| Hispanic or Latino | 1,059 | 6.6% |
| Native / Alaskan | 99 | 0.6% |
| White / Caucasian | 7,630 | 47.5% |
| Two or more Races | 1,733 | 10.8% |
| Some other Race | 156 | 1.0% |
| Total | 16,049 | 100.0% |
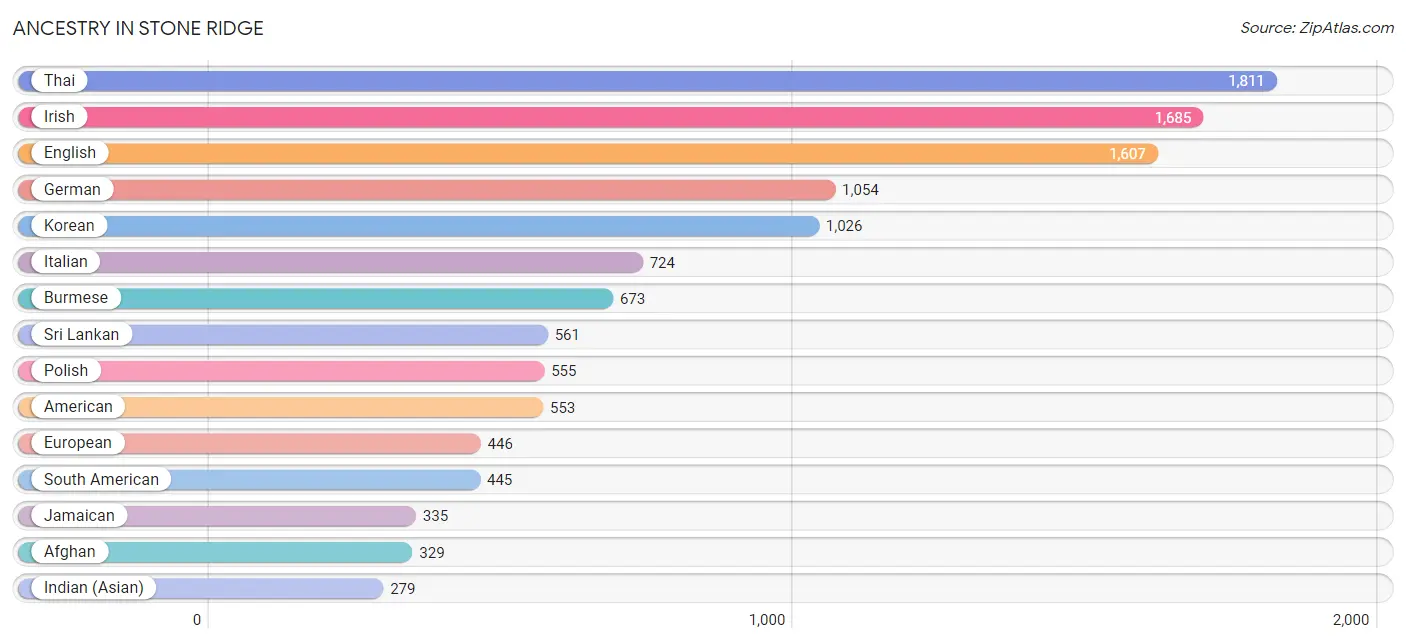
Ancestry in Stone Ridge
The most populous ancestries reported in Stone Ridge are Thai (1,811 | 11.3%), Irish (1,685 | 10.5%), English (1,607 | 10.0%), German (1,054 | 6.6%), and Korean (1,026 | 6.4%), together accounting for 44.7% of all Stone Ridge residents.
| Ancestry | # Population | % Population |
| Afghan | 329 | 2.1% |
| African | 93 | 0.6% |
| Albanian | 100 | 0.6% |
| American | 553 | 3.5% |
| Arab | 91 | 0.6% |
| Bhutanese | 31 | 0.2% |
| Bolivian | 37 | 0.2% |
| British | 16 | 0.1% |
| Burmese | 673 | 4.2% |
| Central American | 199 | 1.2% |
| Cherokee | 30 | 0.2% |
| Chilean | 119 | 0.7% |
| Chippewa | 21 | 0.1% |
| Choctaw | 30 | 0.2% |
| Croatian | 13 | 0.1% |
| Czech | 55 | 0.3% |
| Czechoslovakian | 13 | 0.1% |
| Egyptian | 15 | 0.1% |
| English | 1,607 | 10.0% |
| European | 446 | 2.8% |
| Filipino | 34 | 0.2% |
| Finnish | 17 | 0.1% |
| French | 162 | 1.0% |
| French Canadian | 17 | 0.1% |
| German | 1,054 | 6.6% |
| Hungarian | 37 | 0.2% |
| Icelander | 17 | 0.1% |
| Indian (Asian) | 279 | 1.7% |
| Inupiat | 18 | 0.1% |
| Iranian | 115 | 0.7% |
| Irish | 1,685 | 10.5% |
| Italian | 724 | 4.5% |
| Jamaican | 335 | 2.1% |
| Korean | 1,026 | 6.4% |
| Lebanese | 17 | 0.1% |
| Mexican | 144 | 0.9% |
| Moroccan | 32 | 0.2% |
| Navajo | 46 | 0.3% |
| Nigerian | 64 | 0.4% |
| Norwegian | 11 | 0.1% |
| Palestinian | 14 | 0.1% |
| Pennsylvania German | 18 | 0.1% |
| Peruvian | 222 | 1.4% |
| Polish | 555 | 3.5% |
| Puerto Rican | 157 | 1.0% |
| Russian | 108 | 0.7% |
| Salvadoran | 199 | 1.2% |
| Scandinavian | 23 | 0.1% |
| Scotch-Irish | 192 | 1.2% |
| Scottish | 75 | 0.5% |
| Slovak | 92 | 0.6% |
| South American | 445 | 2.8% |
| Spaniard | 46 | 0.3% |
| Spanish | 13 | 0.1% |
| Sri Lankan | 561 | 3.5% |
| Subsaharan African | 157 | 1.0% |
| Swedish | 226 | 1.4% |
| Syrian | 13 | 0.1% |
| Thai | 1,811 | 11.3% |
| Trinidadian and Tobagonian | 75 | 0.5% |
| Turkish | 99 | 0.6% |
| Venezuelan | 67 | 0.4% |
| Welsh | 25 | 0.2% |
| West Indian | 174 | 1.1% | View All 64 Rows |
Immigrants in Stone Ridge
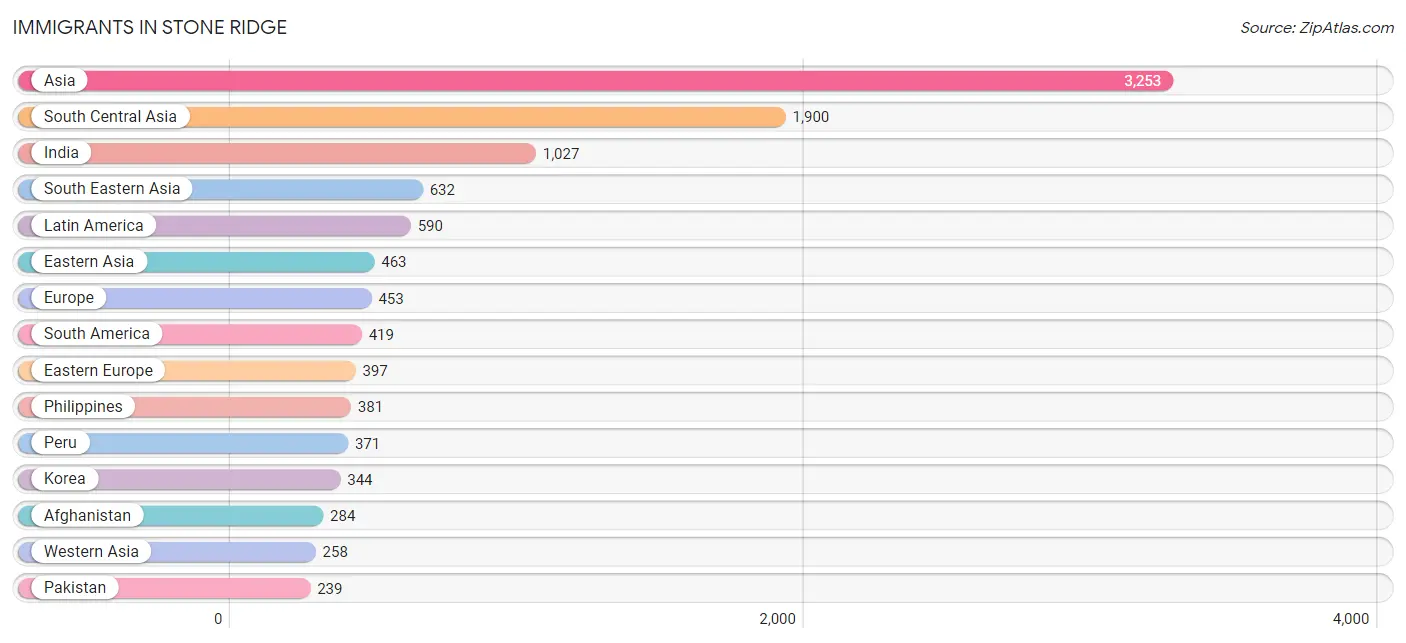
The most numerous immigrant groups reported in Stone Ridge came from Asia (3,253 | 20.3%), South Central Asia (1,900 | 11.8%), India (1,027 | 6.4%), South Eastern Asia (632 | 3.9%), and Latin America (590 | 3.7%), together accounting for 46.1% of all Stone Ridge residents.
| Immigration Origin | # Population | % Population |
| Afghanistan | 284 | 1.8% |
| Africa | 163 | 1.0% |
| Albania | 80 | 0.5% |
| Asia | 3,253 | 20.3% |
| Australia | 74 | 0.5% |
| Bolivia | 30 | 0.2% |
| Caribbean | 90 | 0.6% |
| Central America | 81 | 0.5% |
| Chile | 18 | 0.1% |
| China | 109 | 0.7% |
| Czechoslovakia | 37 | 0.2% |
| Eastern Asia | 463 | 2.9% |
| Eastern Europe | 397 | 2.5% |
| Egypt | 42 | 0.3% |
| El Salvador | 81 | 0.5% |
| Europe | 453 | 2.8% |
| Fiji | 52 | 0.3% |
| France | 36 | 0.2% |
| Ghana | 23 | 0.1% |
| Greece | 20 | 0.1% |
| Hong Kong | 22 | 0.1% |
| Hungary | 37 | 0.2% |
| India | 1,027 | 6.4% |
| Indonesia | 37 | 0.2% |
| Iran | 89 | 0.5% |
| Jamaica | 15 | 0.1% |
| Japan | 10 | 0.1% |
| Korea | 344 | 2.1% |
| Latin America | 590 | 3.7% |
| Nepal | 141 | 0.9% |
| Nigeria | 21 | 0.1% |
| Northern Africa | 42 | 0.3% |
| Oceania | 126 | 0.8% |
| Pakistan | 239 | 1.5% |
| Peru | 371 | 2.3% |
| Philippines | 381 | 2.4% |
| Poland | 226 | 1.4% |
| Saudi Arabia | 120 | 0.7% |
| Sierra Leone | 55 | 0.3% |
| South America | 419 | 2.6% |
| South Central Asia | 1,900 | 11.8% |
| South Eastern Asia | 632 | 3.9% |
| Southern Europe | 20 | 0.1% |
| Taiwan | 16 | 0.1% |
| Trinidad and Tobago | 75 | 0.5% |
| Turkey | 124 | 0.8% |
| Vietnam | 214 | 1.3% |
| Western Africa | 121 | 0.7% |
| Western Asia | 258 | 1.6% |
| Western Europe | 36 | 0.2% | View All 50 Rows |
Sex and Age in Stone Ridge
Sex and Age in Stone Ridge
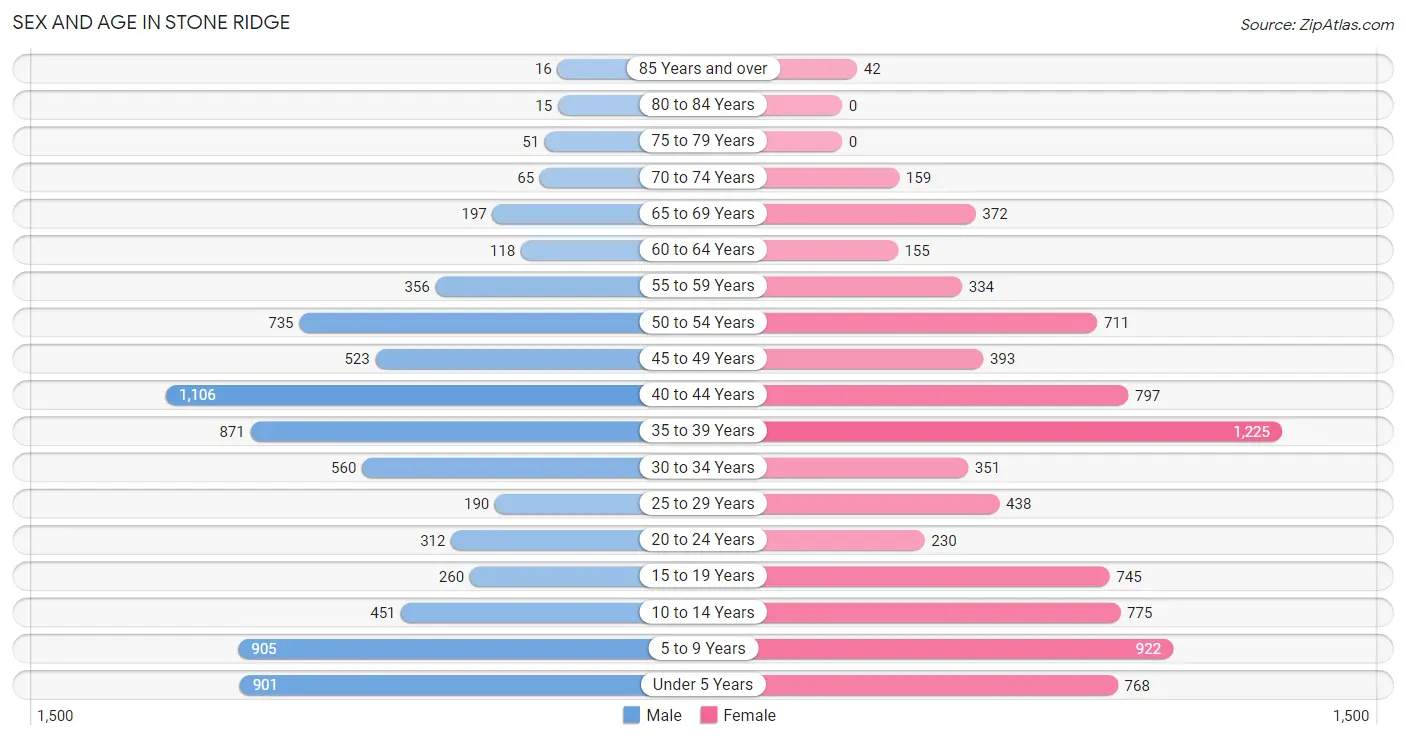
The most populous age groups in Stone Ridge are 40 to 44 Years (1,106 | 14.5%) for men and 35 to 39 Years (1,225 | 14.5%) for women.
| Age Bracket | Male | Female |
| Under 5 Years | 901 (11.8%) | 768 (9.1%) |
| 5 to 9 Years | 905 (11.9%) | 922 (11.0%) |
| 10 to 14 Years | 451 (5.9%) | 775 (9.2%) |
| 15 to 19 Years | 260 (3.4%) | 745 (8.8%) |
| 20 to 24 Years | 312 (4.1%) | 230 (2.7%) |
| 25 to 29 Years | 190 (2.5%) | 438 (5.2%) |
| 30 to 34 Years | 560 (7.3%) | 351 (4.2%) |
| 35 to 39 Years | 871 (11.4%) | 1,225 (14.5%) |
| 40 to 44 Years | 1,106 (14.5%) | 797 (9.5%) |
| 45 to 49 Years | 523 (6.9%) | 393 (4.7%) |
| 50 to 54 Years | 735 (9.6%) | 711 (8.5%) |
| 55 to 59 Years | 356 (4.7%) | 334 (4.0%) |
| 60 to 64 Years | 118 (1.5%) | 155 (1.8%) |
| 65 to 69 Years | 197 (2.6%) | 372 (4.4%) |
| 70 to 74 Years | 65 (0.9%) | 159 (1.9%) |
| 75 to 79 Years | 51 (0.7%) | 0 (0.0%) |
| 80 to 84 Years | 15 (0.2%) | 0 (0.0%) |
| 85 Years and over | 16 (0.2%) | 42 (0.5%) |
| Total | 7,632 (100.0%) | 8,417 (100.0%) |
Families and Households in Stone Ridge
Median Family Size in Stone Ridge
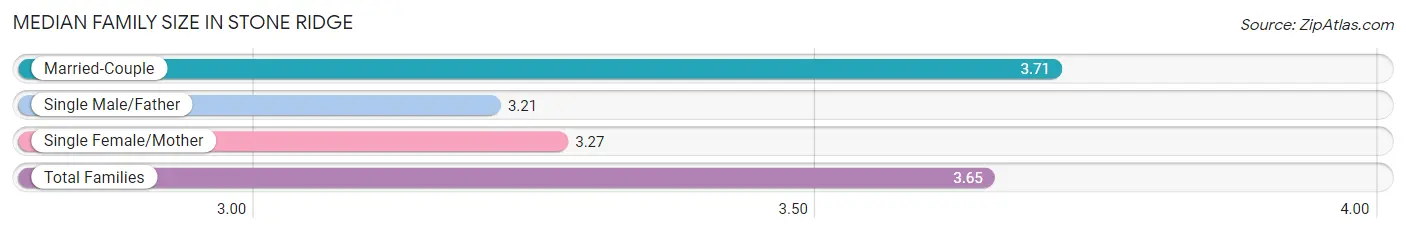
The median family size in Stone Ridge is 3.65 persons per family, with married-couple families (3,574 | 85.7%) accounting for the largest median family size of 3.71 persons per family. On the other hand, single male/father families (131 | 3.1%) represent the smallest median family size with 3.21 persons per family.
| Family Type | # Families | Family Size |
| Married-Couple | 3,574 (85.7%) | 3.71 |
| Single Male/Father | 131 (3.1%) | 3.21 |
| Single Female/Mother | 467 (11.2%) | 3.27 |
| Total Families | 4,172 (100.0%) | 3.65 |
Median Household Size in Stone Ridge
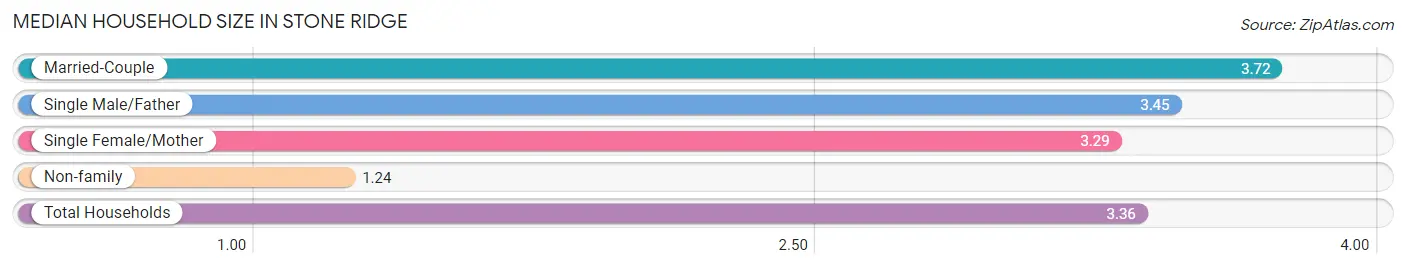
The median household size in Stone Ridge is 3.36 persons per household, with married-couple households (3,574 | 74.9%) accounting for the largest median household size of 3.72 persons per household. non-family households (598 | 12.5%) represent the smallest median household size with 1.24 persons per household.
| Household Type | # Households | Household Size |
| Married-Couple | 3,574 (74.9%) | 3.72 |
| Single Male/Father | 131 (2.8%) | 3.45 |
| Single Female/Mother | 467 (9.8%) | 3.29 |
| Non-family | 598 (12.5%) | 1.24 |
| Total Households | 4,770 (100.0%) | 3.36 |
Household Size by Marriage Status in Stone Ridge
Out of a total of 4,770 households in Stone Ridge, 4,172 (87.5%) are family households, while 598 (12.5%) are nonfamily households. The most numerous type of family households are 4-person households, comprising 1,446, and the most common type of nonfamily households are 1-person households, comprising 477.
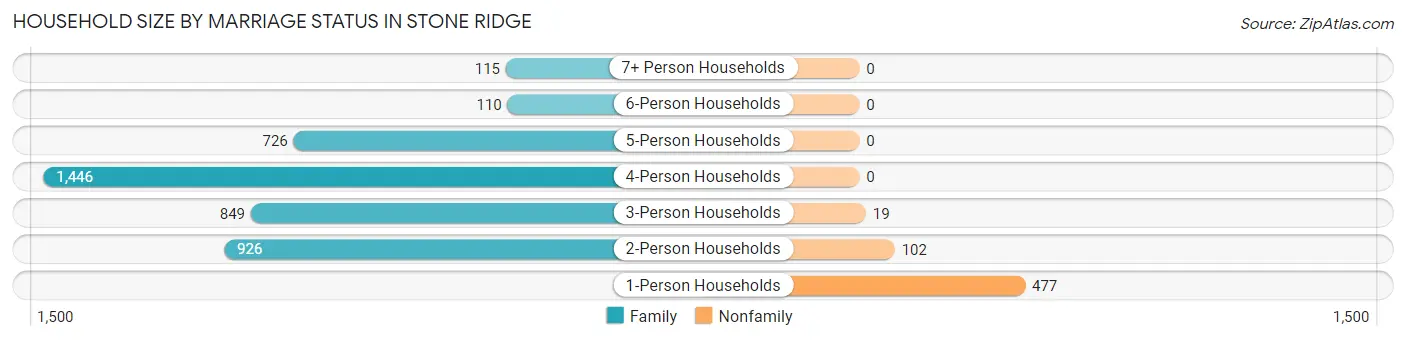
| Household Size | Family Households | Nonfamily Households |
| 1-Person Households | - | 477 (10.0%) |
| 2-Person Households | 926 (19.4%) | 102 (2.1%) |
| 3-Person Households | 849 (17.8%) | 19 (0.4%) |
| 4-Person Households | 1,446 (30.3%) | 0 (0.0%) |
| 5-Person Households | 726 (15.2%) | 0 (0.0%) |
| 6-Person Households | 110 (2.3%) | 0 (0.0%) |
| 7+ Person Households | 115 (2.4%) | 0 (0.0%) |
| Total | 4,172 (87.5%) | 598 (12.5%) |
Female Fertility in Stone Ridge
Fertility by Age in Stone Ridge
Average fertility rate in Stone Ridge is 52.0 births per 1,000 women. Women in the age bracket of 20 to 34 years have the highest fertility rate with 83.0 births per 1,000 women. Women in the age bracket of 35 to 50 years acount for 62.4% of all women with births.
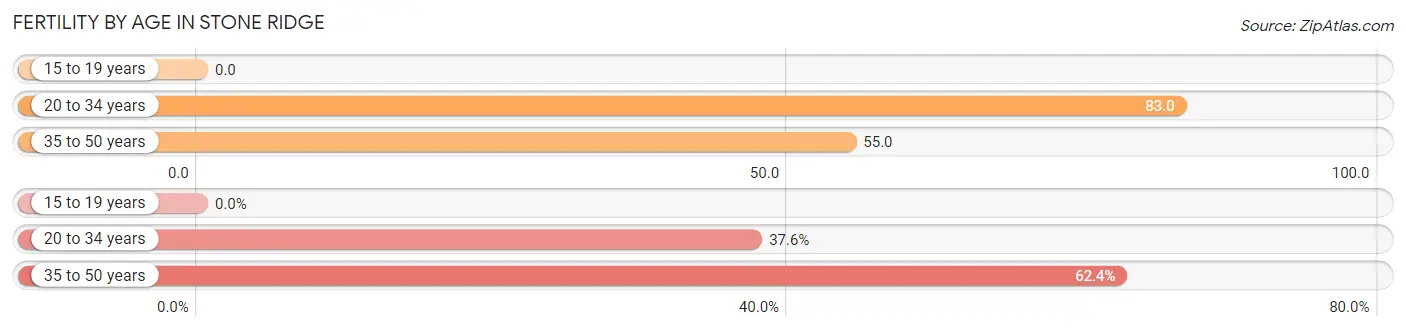
| Age Bracket | Women with Births | Births / 1,000 Women |
| 15 to 19 years | 0 (0.0%) | 0.0 |
| 20 to 34 years | 85 (37.6%) | 83.0 |
| 35 to 50 years | 141 (62.4%) | 55.0 |
| Total | 226 (100.0%) | 52.0 |
Fertility by Age by Marriage Status in Stone Ridge
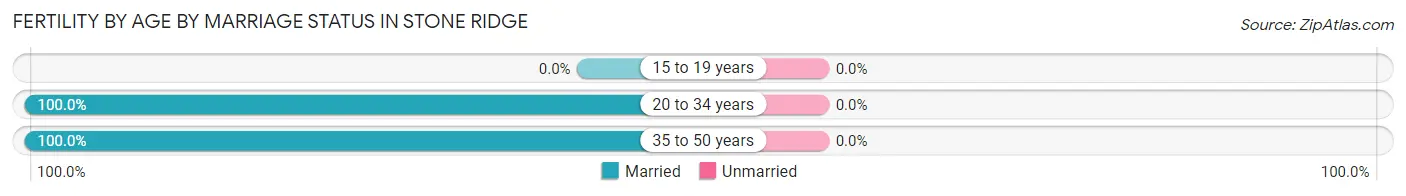
| Age Bracket | Married | Unmarried |
| 15 to 19 years | 0 (0.0%) | 0 (0.0%) |
| 20 to 34 years | 85 (100.0%) | 0 (0.0%) |
| 35 to 50 years | 141 (100.0%) | 0 (0.0%) |
| Total | 226 (100.0%) | 0 (0.0%) |
Fertility by Education in Stone Ridge
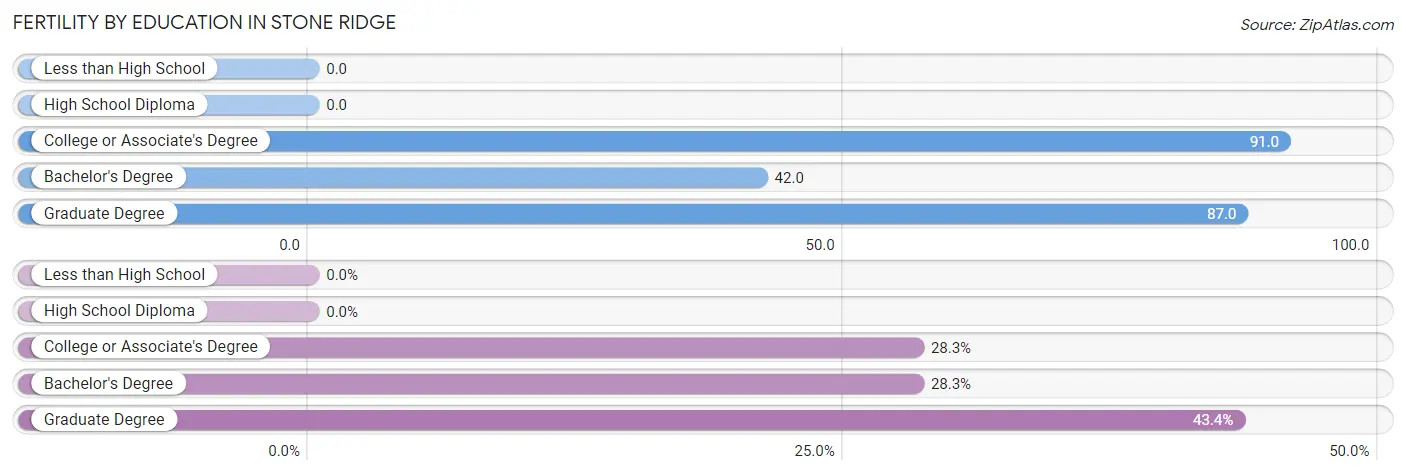
| Educational Attainment | Women with Births | Births / 1,000 Women |
| Less than High School | 0 (0.0%) | 0.0 |
| High School Diploma | 0 (0.0%) | 0.0 |
| College or Associate's Degree | 64 (28.3%) | 91.0 |
| Bachelor's Degree | 64 (28.3%) | 42.0 |
| Graduate Degree | 98 (43.4%) | 87.0 |
| Total | 226 (100.0%) | 52.0 |
Fertility by Education by Marriage Status in Stone Ridge
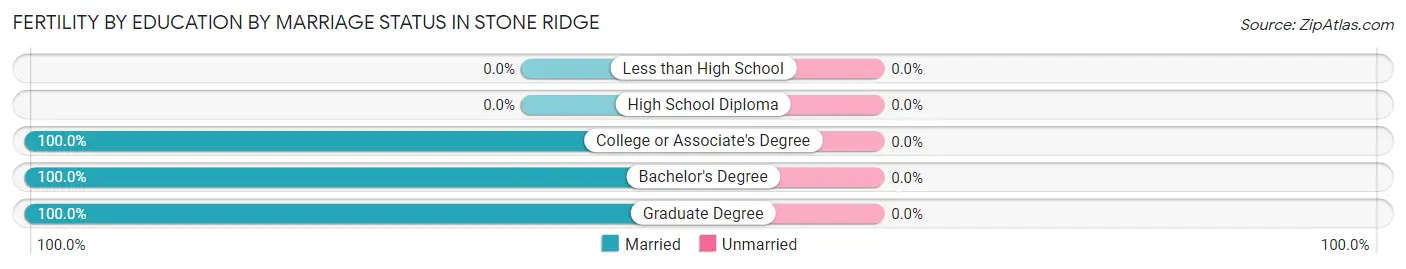
| Educational Attainment | Married | Unmarried |
| Less than High School | 0 (0.0%) | 0 (0.0%) |
| High School Diploma | 0 (0.0%) | 0 (0.0%) |
| College or Associate's Degree | 64 (100.0%) | 0 (0.0%) |
| Bachelor's Degree | 64 (100.0%) | 0 (0.0%) |
| Graduate Degree | 98 (100.0%) | 0 (0.0%) |
| Total | 226 (100.0%) | 0 (0.0%) |
Employment Characteristics in Stone Ridge
Employment by Class of Employer in Stone Ridge
Among the 8,668 employed individuals in Stone Ridge, private company employees (5,258 | 60.7%), federal government employees (945 | 10.9%), and local government employees (830 | 9.6%) make up the most common classes of employment.
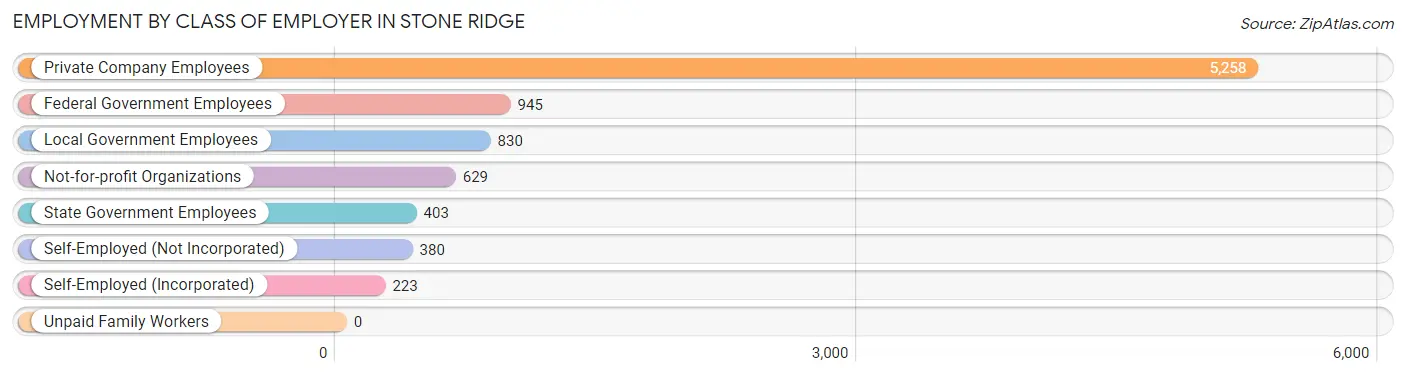
| Employer Class | # Employees | % Employees |
| Private Company Employees | 5,258 | 60.7% |
| Self-Employed (Incorporated) | 223 | 2.6% |
| Self-Employed (Not Incorporated) | 380 | 4.4% |
| Not-for-profit Organizations | 629 | 7.3% |
| Local Government Employees | 830 | 9.6% |
| State Government Employees | 403 | 4.6% |
| Federal Government Employees | 945 | 10.9% |
| Unpaid Family Workers | 0 | 0.0% |
| Total | 8,668 | 100.0% |
Employment Status by Age in Stone Ridge
According to the labor force statistics for Stone Ridge, out of the total population over 16 years of age (11,231), 79.6% or 8,940 individuals are in the labor force, with 1.1% or 98 of them unemployed. The age group with the highest labor force participation rate is 25 to 29 years, with 93.8% or 589 individuals in the labor force. Within the labor force, the 25 to 29 years age range has the highest percentage of unemployed individuals, with 3.7% or 22 of them being unemployed.
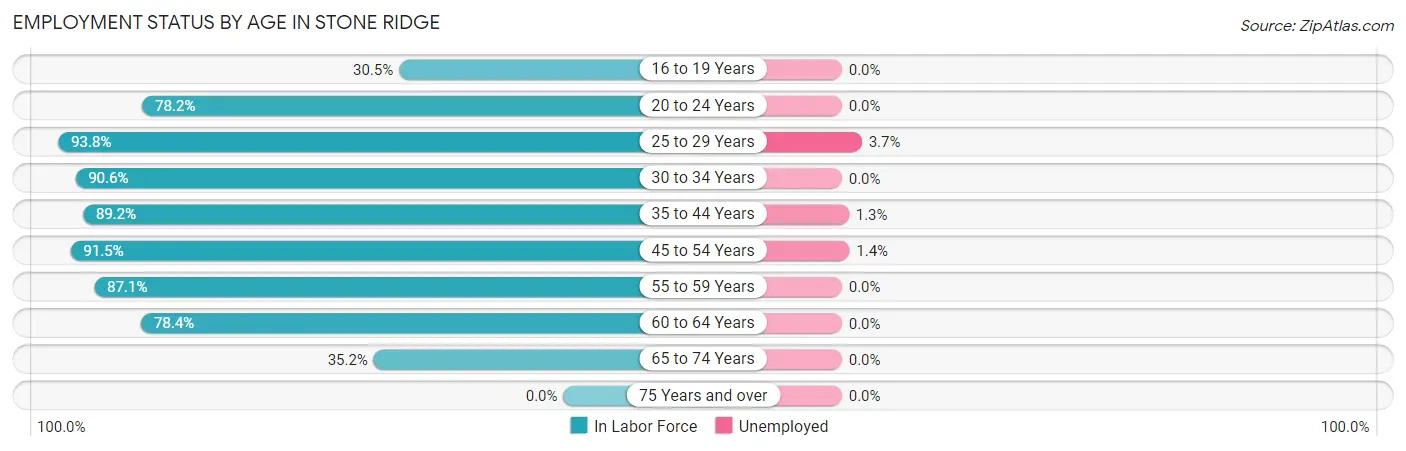
| Age Bracket | In Labor Force | Unemployed |
| 16 to 19 Years | 277 (30.5%) | 0 (0.0%) |
| 20 to 24 Years | 424 (78.2%) | 0 (0.0%) |
| 25 to 29 Years | 589 (93.8%) | 22 (3.7%) |
| 30 to 34 Years | 825 (90.6%) | 0 (0.0%) |
| 35 to 44 Years | 3,567 (89.2%) | 46 (1.3%) |
| 45 to 54 Years | 2,161 (91.5%) | 30 (1.4%) |
| 55 to 59 Years | 601 (87.1%) | 0 (0.0%) |
| 60 to 64 Years | 214 (78.4%) | 0 (0.0%) |
| 65 to 74 Years | 279 (35.2%) | 0 (0.0%) |
| 75 Years and over | 0 (0.0%) | 0 (0.0%) |
| Total | 8,940 (79.6%) | 98 (1.1%) |
Employment Status by Educational Attainment in Stone Ridge
According to labor force statistics for Stone Ridge, 89.8% of individuals (7,959) out of the total population between 25 and 64 years of age (8,863) are in the labor force, with 1.3% or 103 of them being unemployed. The group with the highest labor force participation rate are those with the educational attainment of college / associate degree, with 95.5% or 1,994 individuals in the labor force. Within the labor force, individuals with high school diploma education have the highest percentage of unemployment, with 3.2% or 15 of them being unemployed.
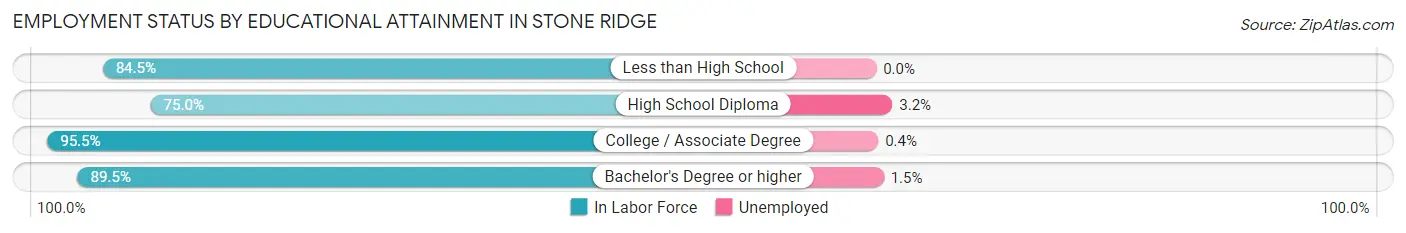
| Educational Attainment | In Labor Force | Unemployed |
| Less than High School | 87 (84.5%) | 0 (0.0%) |
| High School Diploma | 466 (75.0%) | 20 (3.2%) |
| College / Associate Degree | 1,994 (95.5%) | 8 (0.4%) |
| Bachelor's Degree or higher | 5,416 (89.5%) | 91 (1.5%) |
| Total | 7,959 (89.8%) | 115 (1.3%) |
Employment Occupations by Sex in Stone Ridge
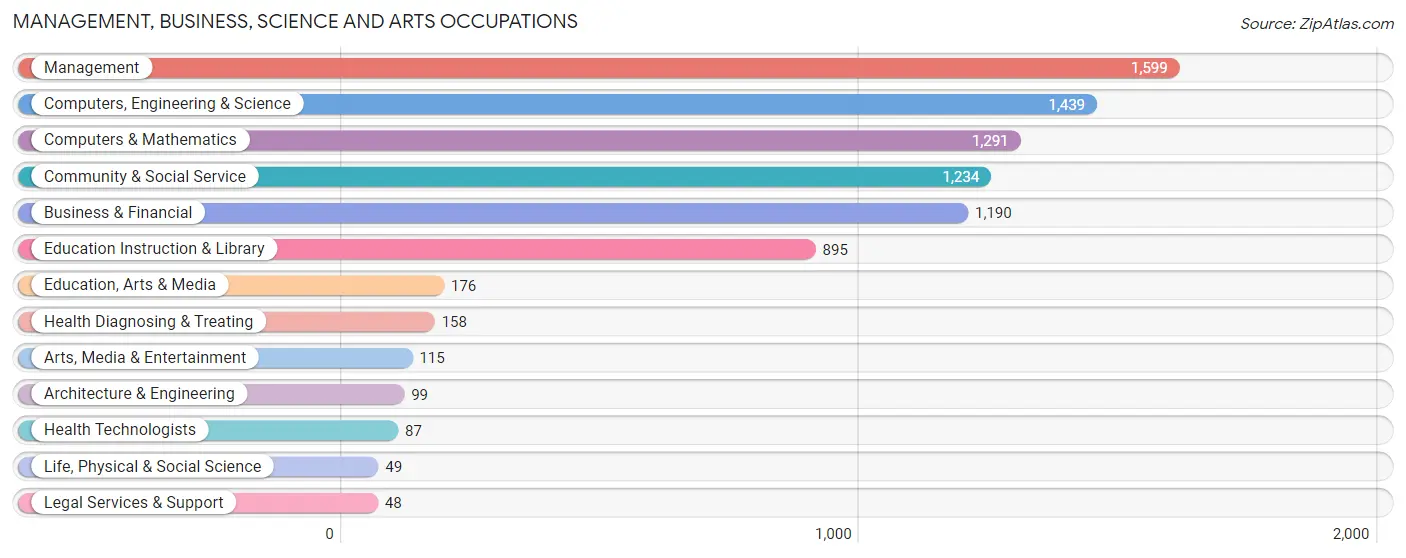
Management, Business, Science and Arts Occupations
The most common Management, Business, Science and Arts occupations in Stone Ridge are Management (1,599 | 18.2%), Computers, Engineering & Science (1,439 | 16.4%), Computers & Mathematics (1,291 | 14.7%), Community & Social Service (1,234 | 14.1%), and Business & Financial (1,190 | 13.6%).
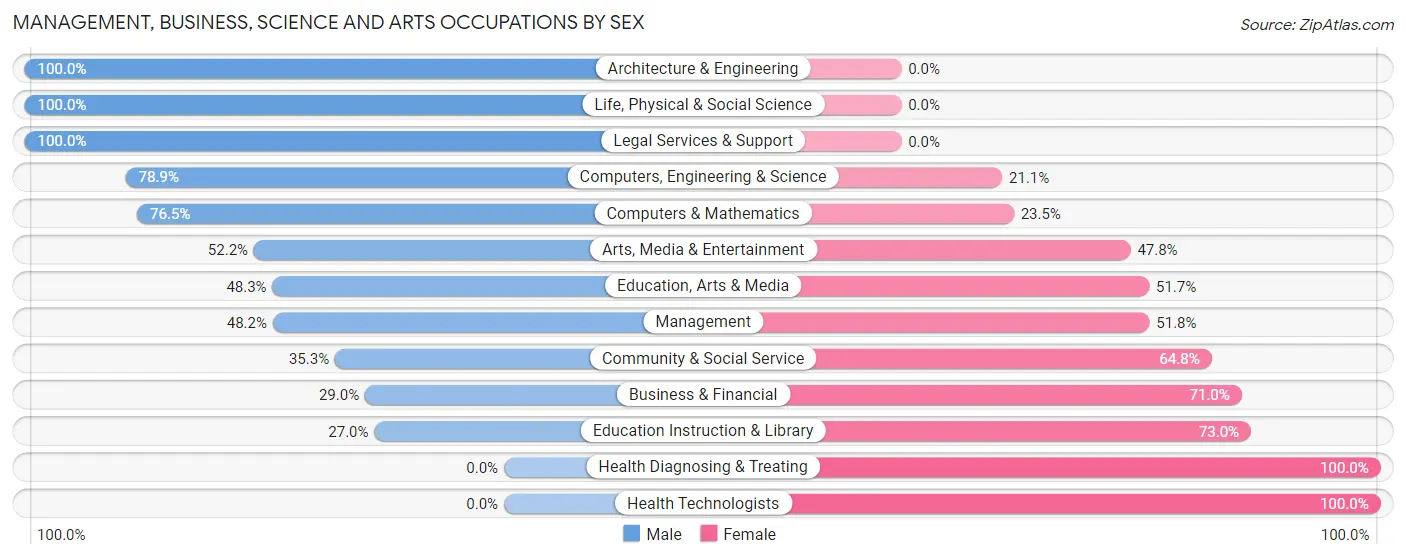
Management, Business, Science and Arts Occupations by Sex
Within the Management, Business, Science and Arts occupations in Stone Ridge, the most male-oriented occupations are Architecture & Engineering (100.0%), Life, Physical & Social Science (100.0%), and Legal Services & Support (100.0%), while the most female-oriented occupations are Health Diagnosing & Treating (100.0%), Health Technologists (100.0%), and Education Instruction & Library (73.0%).
| Occupation | Male | Female |
| Management | 771 (48.2%) | 828 (51.8%) |
| Business & Financial | 345 (29.0%) | 845 (71.0%) |
| Computers, Engineering & Science | 1,136 (78.9%) | 303 (21.1%) |
| Computers & Mathematics | 988 (76.5%) | 303 (23.5%) |
| Architecture & Engineering | 99 (100.0%) | 0 (0.0%) |
| Life, Physical & Social Science | 49 (100.0%) | 0 (0.0%) |
| Community & Social Service | 435 (35.2%) | 799 (64.7%) |
| Education, Arts & Media | 85 (48.3%) | 91 (51.7%) |
| Legal Services & Support | 48 (100.0%) | 0 (0.0%) |
| Education Instruction & Library | 242 (27.0%) | 653 (73.0%) |
| Arts, Media & Entertainment | 60 (52.2%) | 55 (47.8%) |
| Health Diagnosing & Treating | 0 (0.0%) | 158 (100.0%) |
| Health Technologists | 0 (0.0%) | 87 (100.0%) |
| Total (Category) | 2,687 (47.8%) | 2,933 (52.2%) |
| Total (Overall) | 4,753 (54.1%) | 4,027 (45.9%) |
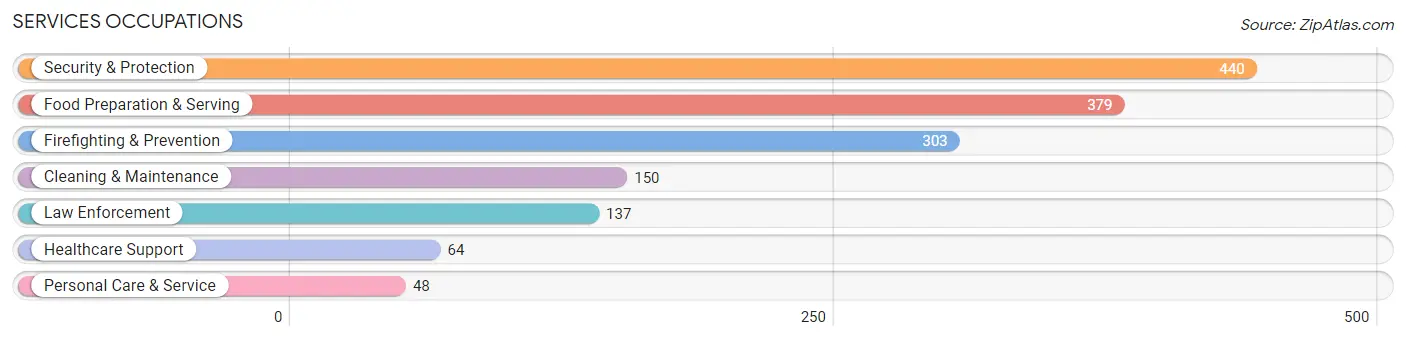
Services Occupations
The most common Services occupations in Stone Ridge are Security & Protection (440 | 5.0%), Food Preparation & Serving (379 | 4.3%), Firefighting & Prevention (303 | 3.5%), Cleaning & Maintenance (150 | 1.7%), and Law Enforcement (137 | 1.6%).
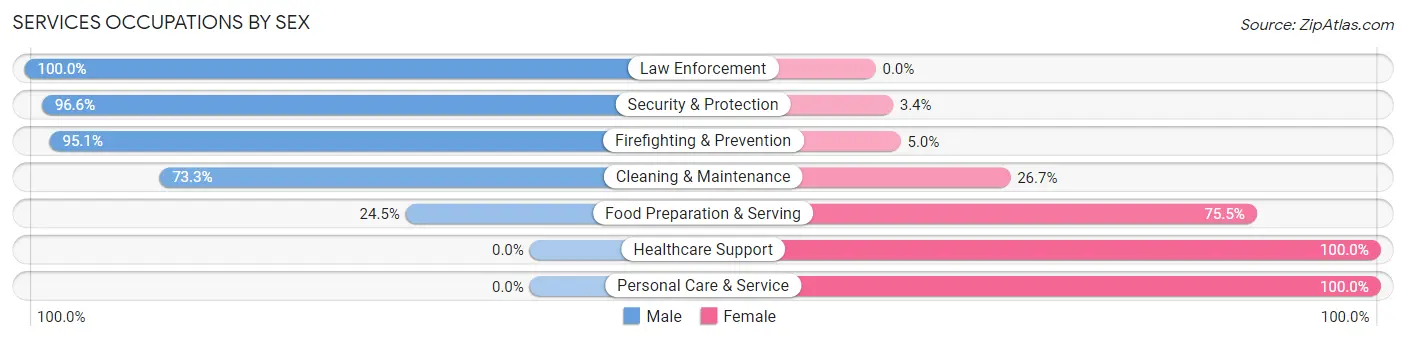
Services Occupations by Sex
Within the Services occupations in Stone Ridge, the most male-oriented occupations are Law Enforcement (100.0%), Security & Protection (96.6%), and Firefighting & Prevention (95.1%), while the most female-oriented occupations are Healthcare Support (100.0%), Personal Care & Service (100.0%), and Food Preparation & Serving (75.5%).
| Occupation | Male | Female |
| Healthcare Support | 0 (0.0%) | 64 (100.0%) |
| Security & Protection | 425 (96.6%) | 15 (3.4%) |
| Firefighting & Prevention | 288 (95.1%) | 15 (5.0%) |
| Law Enforcement | 137 (100.0%) | 0 (0.0%) |
| Food Preparation & Serving | 93 (24.5%) | 286 (75.5%) |
| Cleaning & Maintenance | 110 (73.3%) | 40 (26.7%) |
| Personal Care & Service | 0 (0.0%) | 48 (100.0%) |
| Total (Category) | 628 (58.1%) | 453 (41.9%) |
| Total (Overall) | 4,753 (54.1%) | 4,027 (45.9%) |
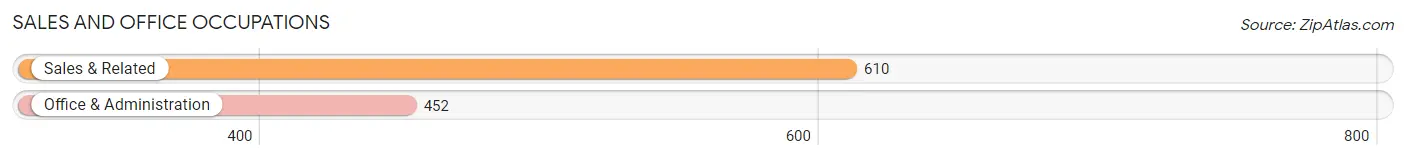
Sales and Office Occupations
The most common Sales and Office occupations in Stone Ridge are Sales & Related (610 | 7.0%), and Office & Administration (452 | 5.1%).
Sales and Office Occupations by Sex
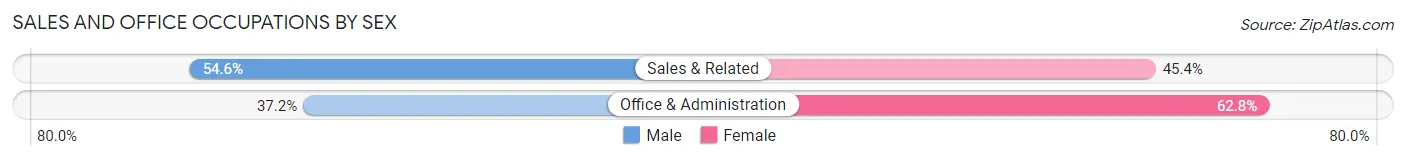
| Occupation | Male | Female |
| Sales & Related | 333 (54.6%) | 277 (45.4%) |
| Office & Administration | 168 (37.2%) | 284 (62.8%) |
| Total (Category) | 501 (47.2%) | 561 (52.8%) |
| Total (Overall) | 4,753 (54.1%) | 4,027 (45.9%) |
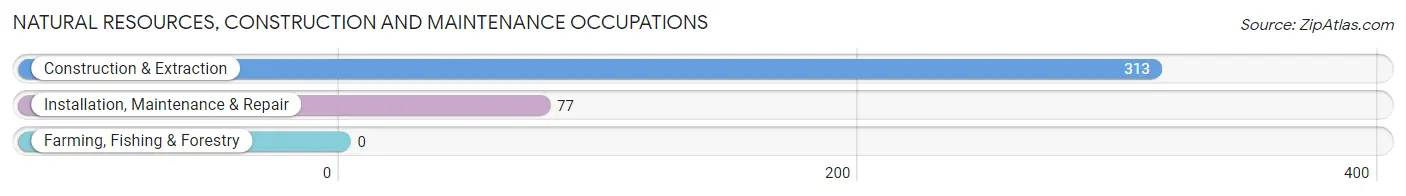
Natural Resources, Construction and Maintenance Occupations
The most common Natural Resources, Construction and Maintenance occupations in Stone Ridge are Construction & Extraction (313 | 3.6%), and Installation, Maintenance & Repair (77 | 0.9%).
Natural Resources, Construction and Maintenance Occupations by Sex
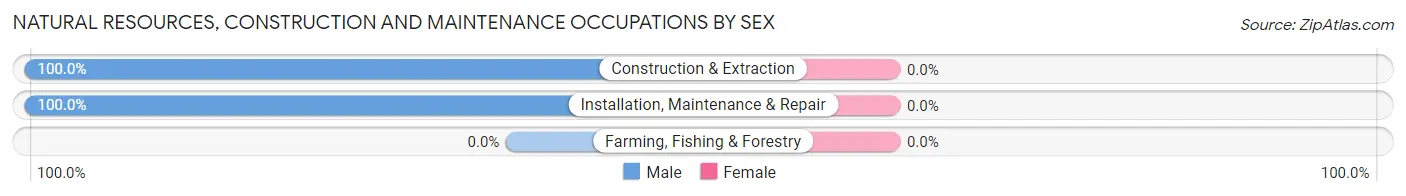
| Occupation | Male | Female |
| Farming, Fishing & Forestry | 0 (0.0%) | 0 (0.0%) |
| Construction & Extraction | 313 (100.0%) | 0 (0.0%) |
| Installation, Maintenance & Repair | 77 (100.0%) | 0 (0.0%) |
| Total (Category) | 390 (100.0%) | 0 (0.0%) |
| Total (Overall) | 4,753 (54.1%) | 4,027 (45.9%) |
Production, Transportation and Moving Occupations
The most common Production, Transportation and Moving occupations in Stone Ridge are Transportation (418 | 4.8%), Production (157 | 1.8%), and Material Moving (52 | 0.6%).
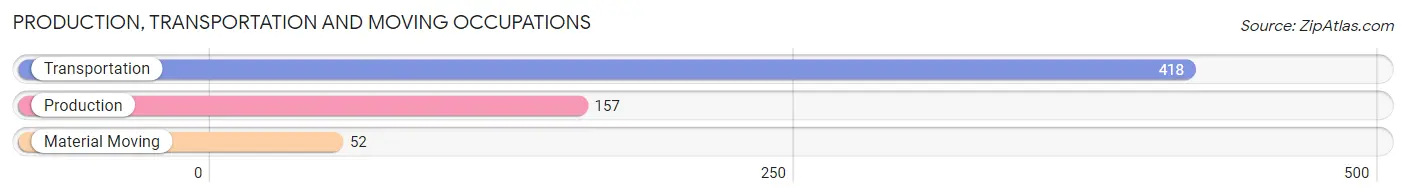
Production, Transportation and Moving Occupations by Sex
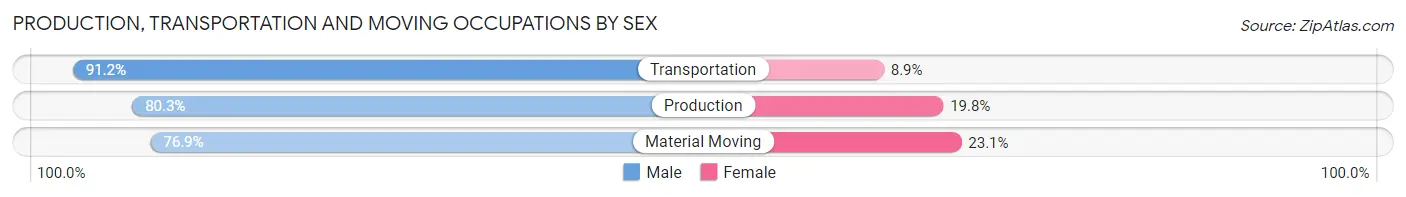
| Occupation | Male | Female |
| Production | 126 (80.2%) | 31 (19.8%) |
| Transportation | 381 (91.1%) | 37 (8.8%) |
| Material Moving | 40 (76.9%) | 12 (23.1%) |
| Total (Category) | 547 (87.2%) | 80 (12.8%) |
| Total (Overall) | 4,753 (54.1%) | 4,027 (45.9%) |
Employment Industries by Sex in Stone Ridge
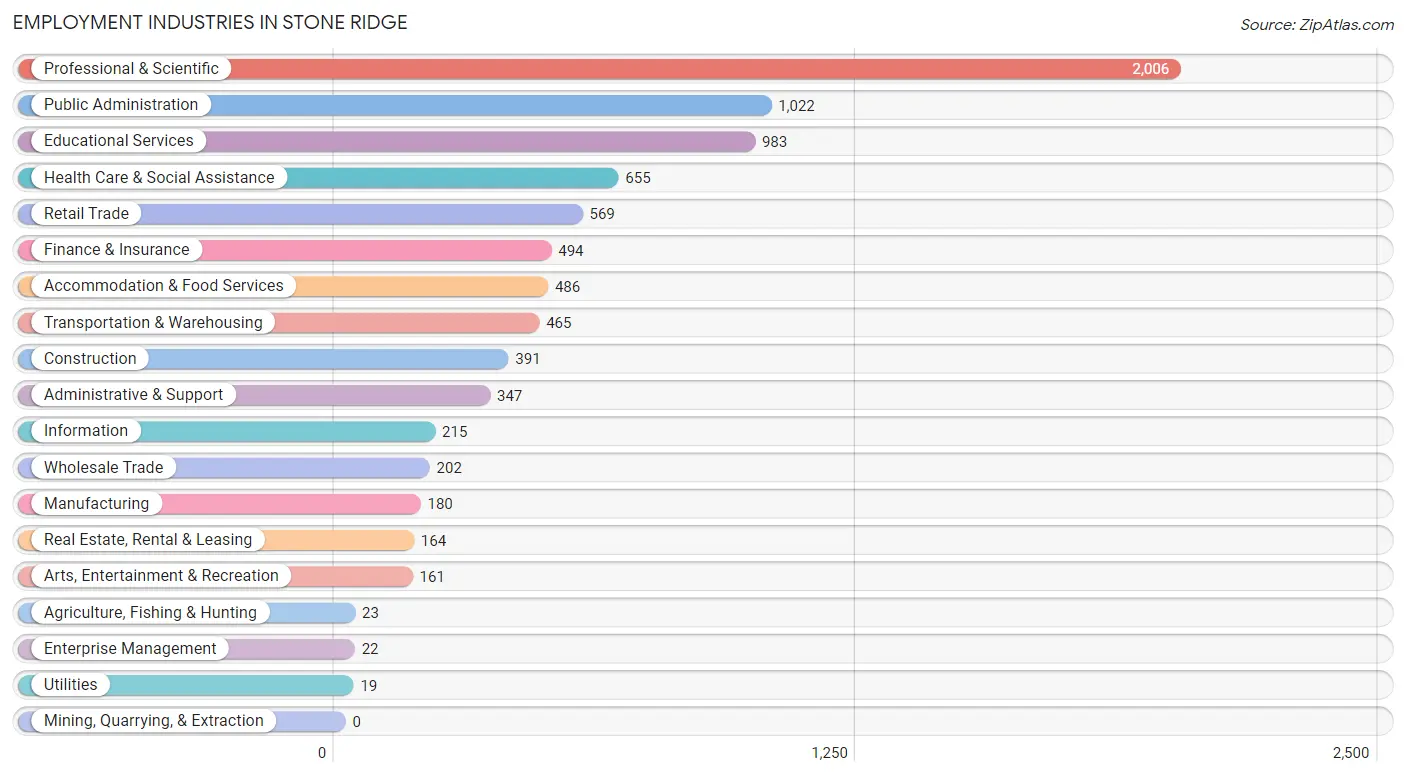
Employment Industries in Stone Ridge
The major employment industries in Stone Ridge include Professional & Scientific (2,006 | 22.9%), Public Administration (1,022 | 11.6%), Educational Services (983 | 11.2%), Health Care & Social Assistance (655 | 7.5%), and Retail Trade (569 | 6.5%).
Employment Industries by Sex in Stone Ridge
The Stone Ridge industries that see more men than women are Agriculture, Fishing & Hunting (100.0%), Utilities (100.0%), and Construction (88.2%), whereas the industries that tend to have a higher number of women are Enterprise Management (100.0%), Health Care & Social Assistance (97.1%), and Educational Services (82.3%).
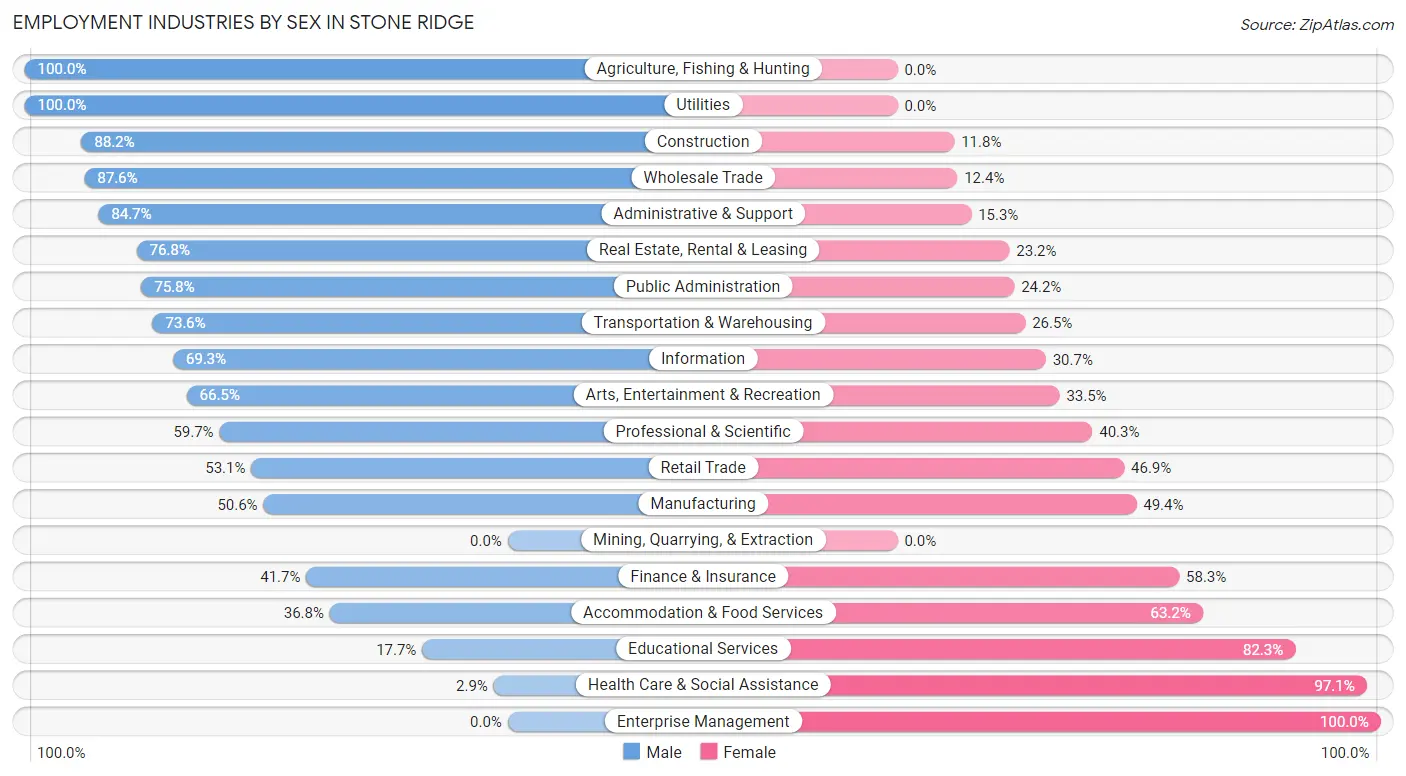
| Industry | Male | Female |
| Agriculture, Fishing & Hunting | 23 (100.0%) | 0 (0.0%) |
| Mining, Quarrying, & Extraction | 0 (0.0%) | 0 (0.0%) |
| Construction | 345 (88.2%) | 46 (11.8%) |
| Manufacturing | 91 (50.6%) | 89 (49.4%) |
| Wholesale Trade | 177 (87.6%) | 25 (12.4%) |
| Retail Trade | 302 (53.1%) | 267 (46.9%) |
| Transportation & Warehousing | 342 (73.6%) | 123 (26.5%) |
| Utilities | 19 (100.0%) | 0 (0.0%) |
| Information | 149 (69.3%) | 66 (30.7%) |
| Finance & Insurance | 206 (41.7%) | 288 (58.3%) |
| Real Estate, Rental & Leasing | 126 (76.8%) | 38 (23.2%) |
| Professional & Scientific | 1,197 (59.7%) | 809 (40.3%) |
| Enterprise Management | 0 (0.0%) | 22 (100.0%) |
| Administrative & Support | 294 (84.7%) | 53 (15.3%) |
| Educational Services | 174 (17.7%) | 809 (82.3%) |
| Health Care & Social Assistance | 19 (2.9%) | 636 (97.1%) |
| Arts, Entertainment & Recreation | 107 (66.5%) | 54 (33.5%) |
| Accommodation & Food Services | 179 (36.8%) | 307 (63.2%) |
| Public Administration | 775 (75.8%) | 247 (24.2%) |
| Total | 4,753 (54.1%) | 4,027 (45.9%) |
Education in Stone Ridge
School Enrollment in Stone Ridge
The most common levels of schooling among the 5,330 students in Stone Ridge are elementary school (1,239 | 23.3%), high school (1,074 | 20.2%), and middle school (893 | 16.8%).
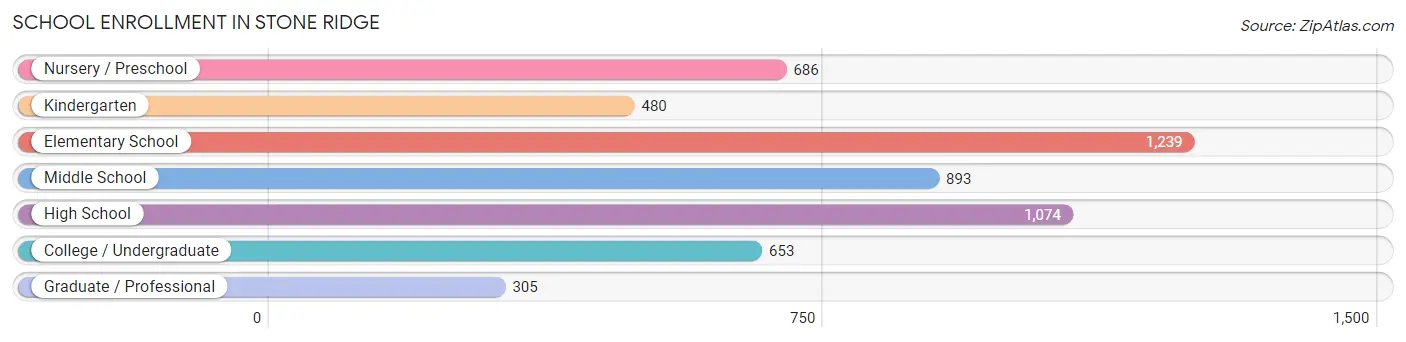
| School Level | # Students | % Students |
| Nursery / Preschool | 686 | 12.9% |
| Kindergarten | 480 | 9.0% |
| Elementary School | 1,239 | 23.3% |
| Middle School | 893 | 16.8% |
| High School | 1,074 | 20.2% |
| College / Undergraduate | 653 | 12.2% |
| Graduate / Professional | 305 | 5.7% |
| Total | 5,330 | 100.0% |
School Enrollment by Age by Funding Source in Stone Ridge
Out of a total of 5,330 students who are enrolled in schools in Stone Ridge, 975 (18.3%) attend a private institution, while the remaining 4,355 (81.7%) are enrolled in public schools. The age group of 3 to 4 year olds has the highest likelihood of being enrolled in private schools, with 434 (73.8% in the age bracket) enrolled. Conversely, the age group of 15 to 17 year olds has the lowest likelihood of being enrolled in a private school, with 795 (100.0% in the age bracket) attending a public institution.
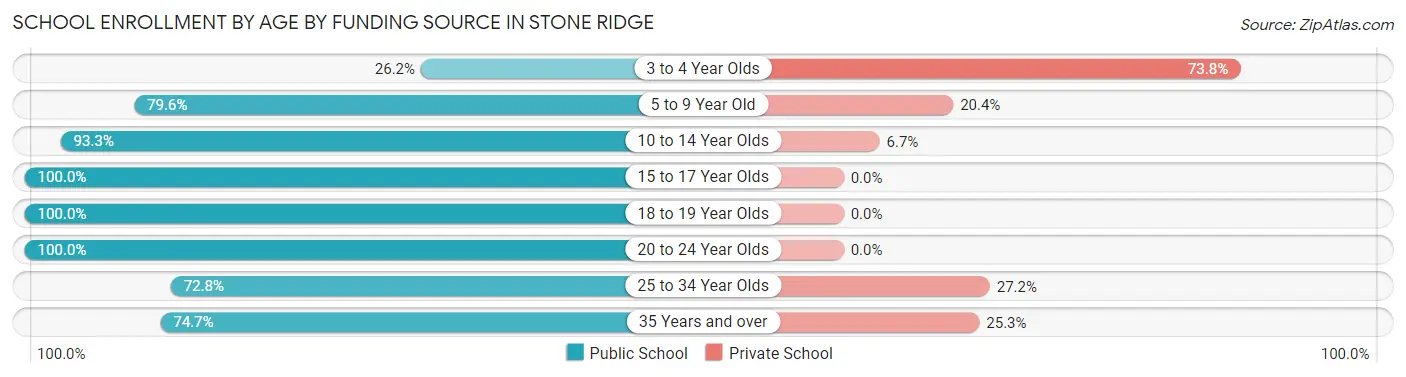
| Age Bracket | Public School | Private School |
| 3 to 4 Year Olds | 154 (26.2%) | 434 (73.8%) |
| 5 to 9 Year Old | 1,350 (79.6%) | 346 (20.4%) |
| 10 to 14 Year Olds | 1,144 (93.3%) | 82 (6.7%) |
| 15 to 17 Year Olds | 795 (100.0%) | 0 (0.0%) |
| 18 to 19 Year Olds | 210 (100.0%) | 0 (0.0%) |
| 20 to 24 Year Olds | 388 (100.0%) | 0 (0.0%) |
| 25 to 34 Year Olds | 115 (72.8%) | 43 (27.2%) |
| 35 Years and over | 201 (74.7%) | 68 (25.3%) |
| Total | 4,355 (81.7%) | 975 (18.3%) |
Educational Attainment by Field of Study in Stone Ridge
Business (2,057 | 28.4%), computers & mathematics (815 | 11.2%), social sciences (815 | 11.2%), arts & humanities (559 | 7.7%), and education (550 | 7.6%) are the most common fields of study among 7,251 individuals in Stone Ridge who have obtained a bachelor's degree or higher.
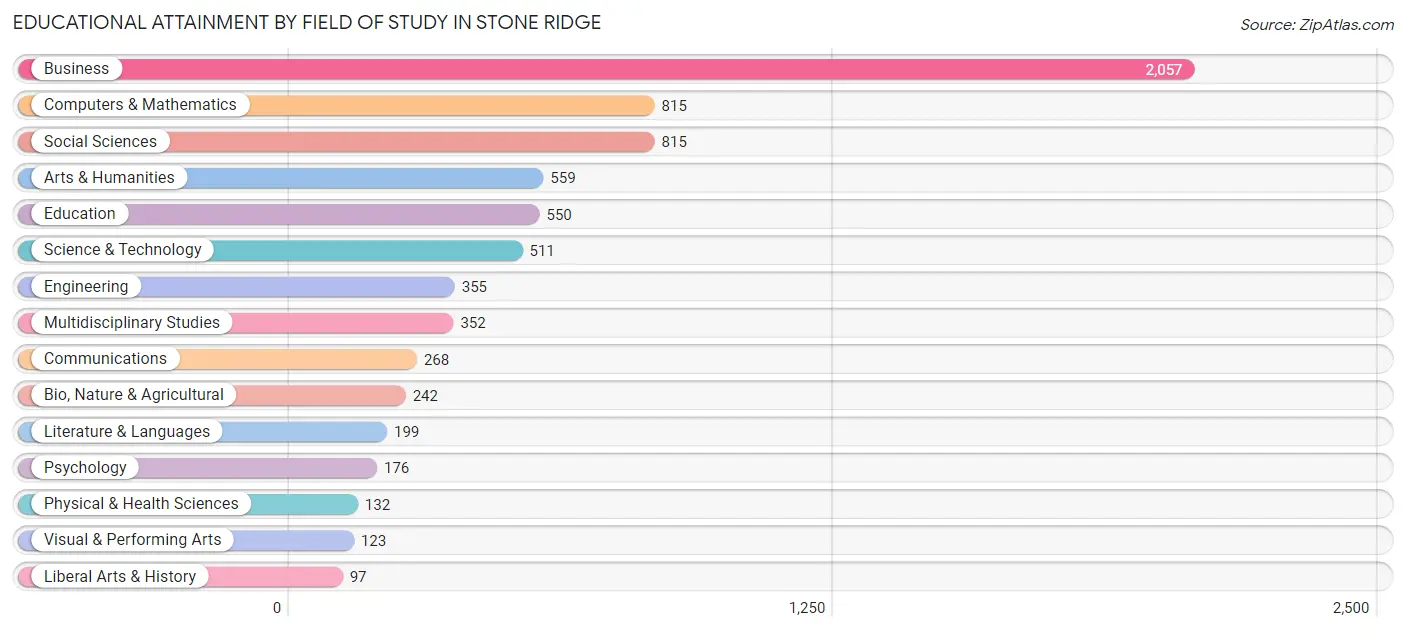
| Field of Study | # Graduates | % Graduates |
| Computers & Mathematics | 815 | 11.2% |
| Bio, Nature & Agricultural | 242 | 3.3% |
| Physical & Health Sciences | 132 | 1.8% |
| Psychology | 176 | 2.4% |
| Social Sciences | 815 | 11.2% |
| Engineering | 355 | 4.9% |
| Multidisciplinary Studies | 352 | 4.9% |
| Science & Technology | 511 | 7.0% |
| Business | 2,057 | 28.4% |
| Education | 550 | 7.6% |
| Literature & Languages | 199 | 2.7% |
| Liberal Arts & History | 97 | 1.3% |
| Visual & Performing Arts | 123 | 1.7% |
| Communications | 268 | 3.7% |
| Arts & Humanities | 559 | 7.7% |
| Total | 7,251 | 100.0% |
Transportation & Commute in Stone Ridge
Vehicle Availability by Sex in Stone Ridge
The most prevalent vehicle ownership categories in Stone Ridge are males with 2 vehicles (2,972, accounting for 63.9%) and females with 2 vehicles (2,274, making up 74.0%).
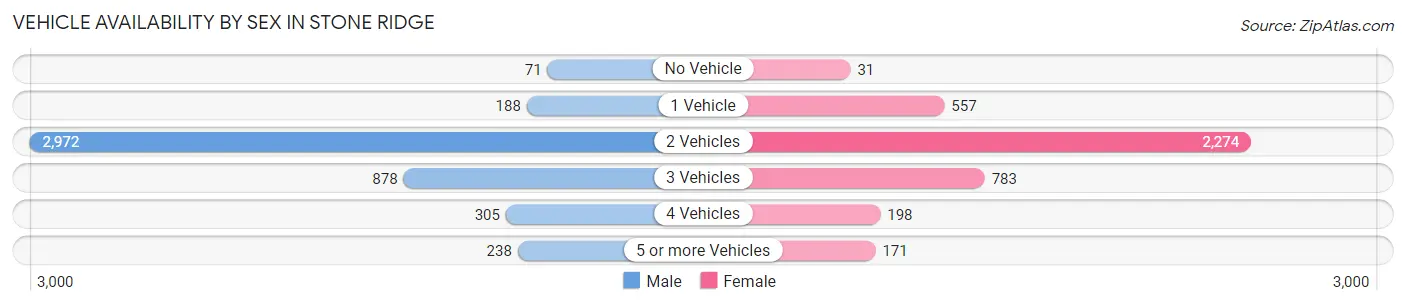
| Vehicles Available | Male | Female |
| No Vehicle | 71 (1.5%) | 31 (0.8%) |
| 1 Vehicle | 188 (4.0%) | 557 (13.9%) |
| 2 Vehicles | 2,972 (63.9%) | 2,274 (56.7%) |
| 3 Vehicles | 878 (18.9%) | 783 (19.5%) |
| 4 Vehicles | 305 (6.6%) | 198 (4.9%) |
| 5 or more Vehicles | 238 (5.1%) | 171 (4.3%) |
| Total | 4,652 (100.0%) | 4,014 (100.0%) |
Commute Time in Stone Ridge
The most frequently occuring commute durations in Stone Ridge are 60 to 89 minutes (1,013 commuters, 14.8%), 45 to 59 minutes (992 commuters, 14.4%), and 30 to 34 minutes (874 commuters, 12.7%).
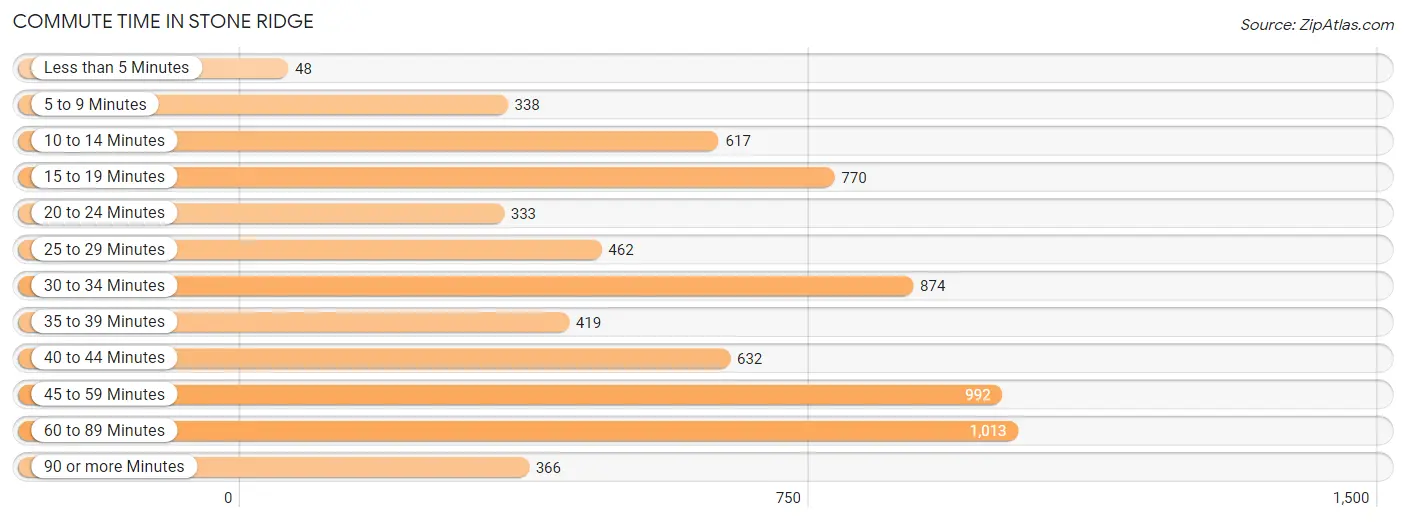
| Commute Time | # Commuters | % Commuters |
| Less than 5 Minutes | 48 | 0.7% |
| 5 to 9 Minutes | 338 | 4.9% |
| 10 to 14 Minutes | 617 | 9.0% |
| 15 to 19 Minutes | 770 | 11.2% |
| 20 to 24 Minutes | 333 | 4.9% |
| 25 to 29 Minutes | 462 | 6.7% |
| 30 to 34 Minutes | 874 | 12.7% |
| 35 to 39 Minutes | 419 | 6.1% |
| 40 to 44 Minutes | 632 | 9.2% |
| 45 to 59 Minutes | 992 | 14.4% |
| 60 to 89 Minutes | 1,013 | 14.8% |
| 90 or more Minutes | 366 | 5.3% |
Commute Time by Sex in Stone Ridge
The most common commute times in Stone Ridge are 60 to 89 minutes (765 commuters, 19.8%) for males and 15 to 19 minutes (451 commuters, 15.0%) for females.
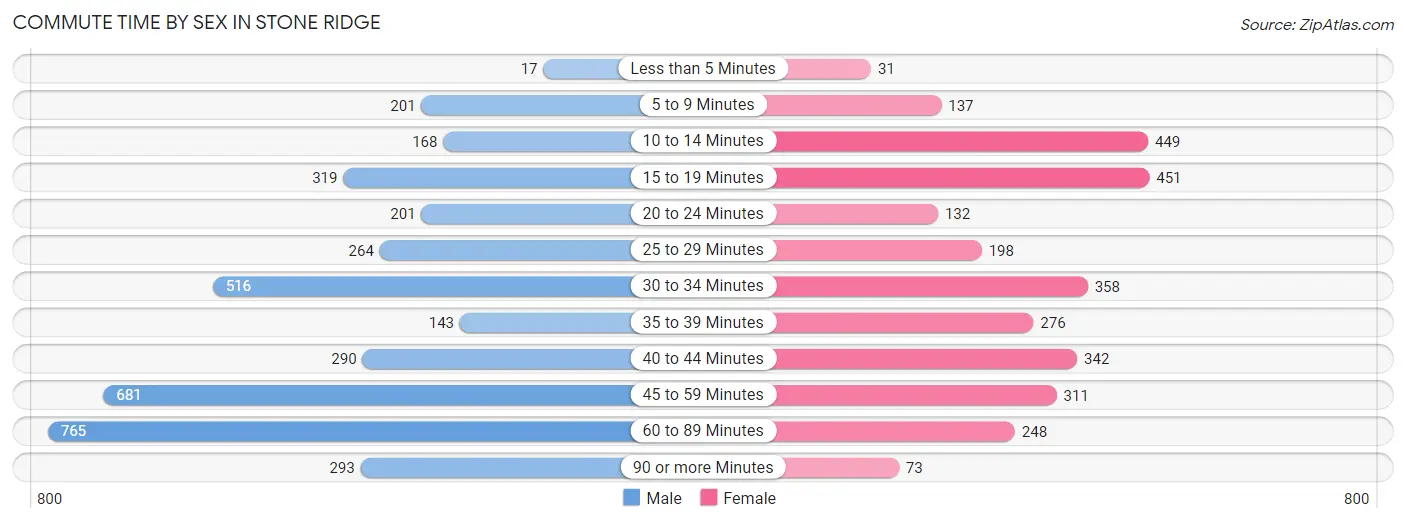
| Commute Time | Male | Female |
| Less than 5 Minutes | 17 (0.4%) | 31 (1.0%) |
| 5 to 9 Minutes | 201 (5.2%) | 137 (4.6%) |
| 10 to 14 Minutes | 168 (4.3%) | 449 (14.9%) |
| 15 to 19 Minutes | 319 (8.3%) | 451 (15.0%) |
| 20 to 24 Minutes | 201 (5.2%) | 132 (4.4%) |
| 25 to 29 Minutes | 264 (6.8%) | 198 (6.6%) |
| 30 to 34 Minutes | 516 (13.4%) | 358 (11.9%) |
| 35 to 39 Minutes | 143 (3.7%) | 276 (9.2%) |
| 40 to 44 Minutes | 290 (7.5%) | 342 (11.4%) |
| 45 to 59 Minutes | 681 (17.6%) | 311 (10.3%) |
| 60 to 89 Minutes | 765 (19.8%) | 248 (8.3%) |
| 90 or more Minutes | 293 (7.6%) | 73 (2.4%) |
Time of Departure to Work by Sex in Stone Ridge
The most frequent times of departure to work in Stone Ridge are 7:00 AM to 7:29 AM (757, 19.6%) for males and 7:30 AM to 7:59 AM (505, 16.8%) for females.
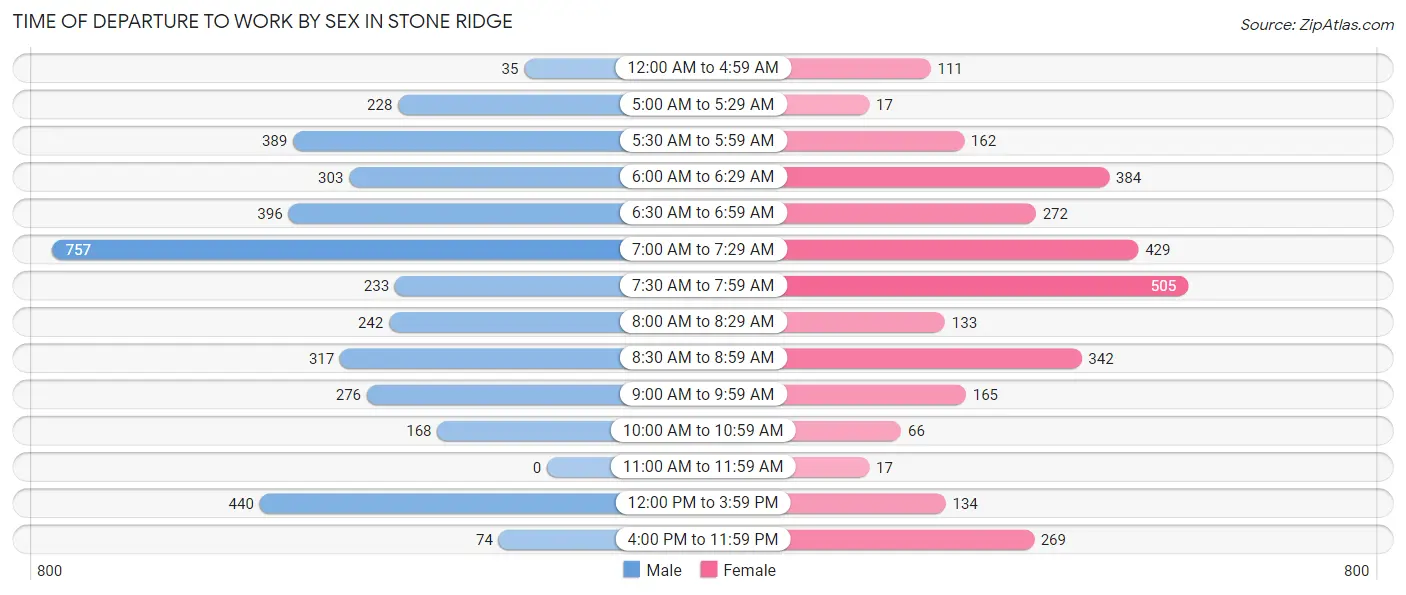
| Time of Departure | Male | Female |
| 12:00 AM to 4:59 AM | 35 (0.9%) | 111 (3.7%) |
| 5:00 AM to 5:29 AM | 228 (5.9%) | 17 (0.6%) |
| 5:30 AM to 5:59 AM | 389 (10.1%) | 162 (5.4%) |
| 6:00 AM to 6:29 AM | 303 (7.9%) | 384 (12.8%) |
| 6:30 AM to 6:59 AM | 396 (10.3%) | 272 (9.0%) |
| 7:00 AM to 7:29 AM | 757 (19.6%) | 429 (14.3%) |
| 7:30 AM to 7:59 AM | 233 (6.0%) | 505 (16.8%) |
| 8:00 AM to 8:29 AM | 242 (6.3%) | 133 (4.4%) |
| 8:30 AM to 8:59 AM | 317 (8.2%) | 342 (11.4%) |
| 9:00 AM to 9:59 AM | 276 (7.1%) | 165 (5.5%) |
| 10:00 AM to 10:59 AM | 168 (4.3%) | 66 (2.2%) |
| 11:00 AM to 11:59 AM | 0 (0.0%) | 17 (0.6%) |
| 12:00 PM to 3:59 PM | 440 (11.4%) | 134 (4.5%) |
| 4:00 PM to 11:59 PM | 74 (1.9%) | 269 (8.9%) |
| Total | 3,858 (100.0%) | 3,006 (100.0%) |
Housing Occupancy in Stone Ridge
Occupancy by Ownership in Stone Ridge
Of the total 4,770 dwellings in Stone Ridge, owner-occupied units account for 4,166 (87.3%), while renter-occupied units make up 604 (12.7%).
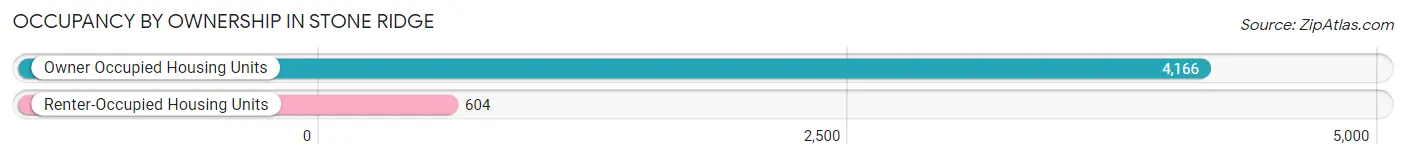
| Occupancy | # Housing Units | % Housing Units |
| Owner Occupied Housing Units | 4,166 | 87.3% |
| Renter-Occupied Housing Units | 604 | 12.7% |
| Total Occupied Housing Units | 4,770 | 100.0% |
Occupancy by Household Size in Stone Ridge
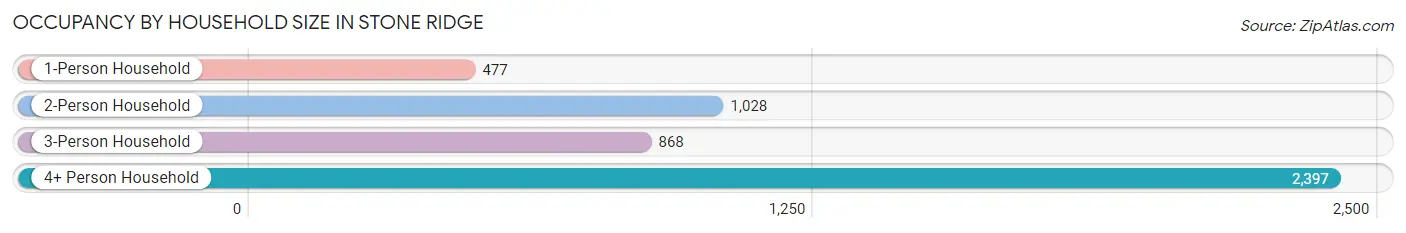
| Household Size | # Housing Units | % Housing Units |
| 1-Person Household | 477 | 10.0% |
| 2-Person Household | 1,028 | 21.5% |
| 3-Person Household | 868 | 18.2% |
| 4+ Person Household | 2,397 | 50.2% |
| Total Housing Units | 4,770 | 100.0% |
Occupancy by Ownership by Household Size in Stone Ridge
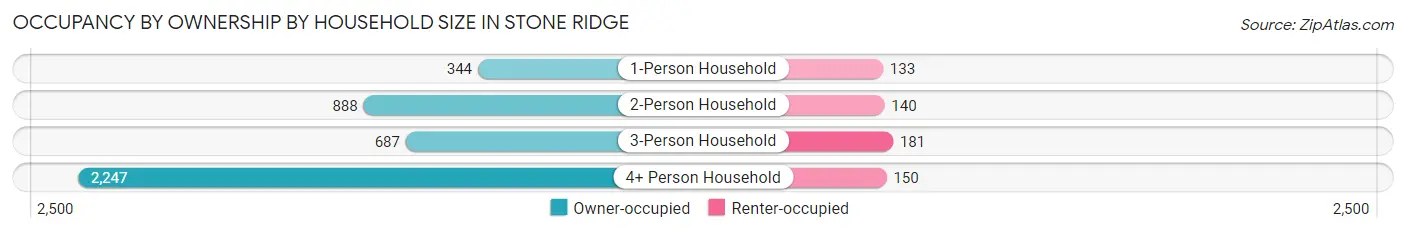
| Household Size | Owner-occupied | Renter-occupied |
| 1-Person Household | 344 (72.1%) | 133 (27.9%) |
| 2-Person Household | 888 (86.4%) | 140 (13.6%) |
| 3-Person Household | 687 (79.1%) | 181 (20.8%) |
| 4+ Person Household | 2,247 (93.7%) | 150 (6.3%) |
| Total Housing Units | 4,166 (87.3%) | 604 (12.7%) |
Occupancy by Educational Attainment in Stone Ridge
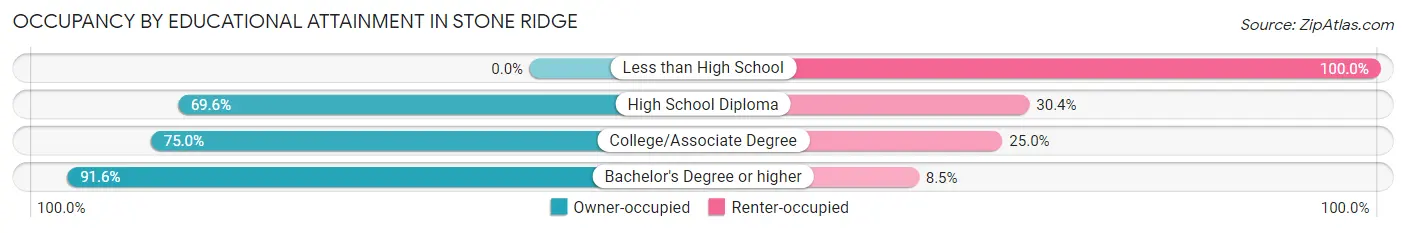
| Household Size | Owner-occupied | Renter-occupied |
| Less than High School | 0 (0.0%) | 18 (100.0%) |
| High School Diploma | 133 (69.6%) | 58 (30.4%) |
| College/Associate Degree | 644 (75.0%) | 215 (25.0%) |
| Bachelor's Degree or higher | 3,389 (91.5%) | 313 (8.5%) |
Occupancy by Age of Householder in Stone Ridge
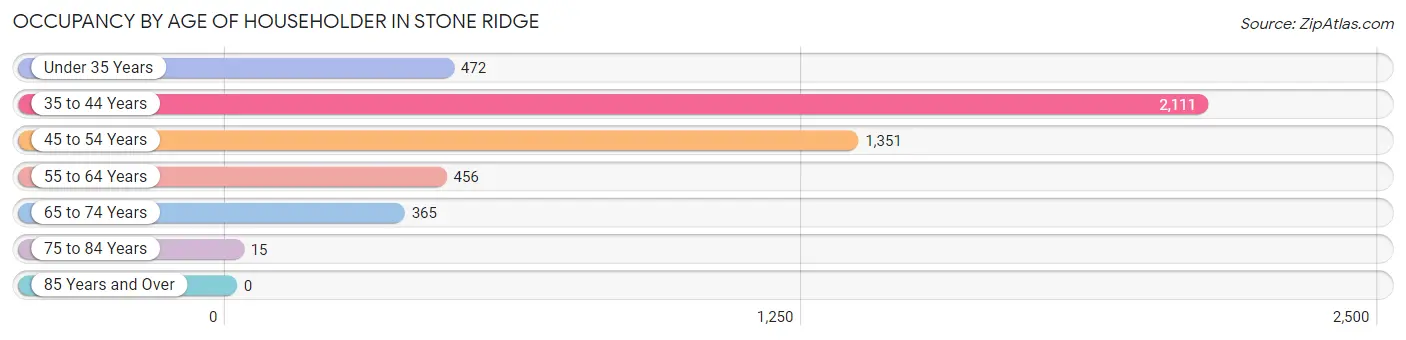
| Age Bracket | # Households | % Households |
| Under 35 Years | 472 | 9.9% |
| 35 to 44 Years | 2,111 | 44.3% |
| 45 to 54 Years | 1,351 | 28.3% |
| 55 to 64 Years | 456 | 9.6% |
| 65 to 74 Years | 365 | 7.6% |
| 75 to 84 Years | 15 | 0.3% |
| 85 Years and Over | 0 | 0.0% |
| Total | 4,770 | 100.0% |
Housing Finances in Stone Ridge
Median Income by Occupancy in Stone Ridge
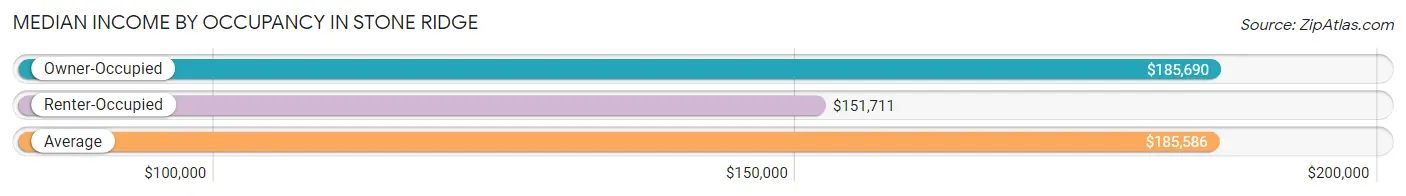
| Occupancy Type | # Households | Median Income |
| Owner-Occupied | 4,166 (87.3%) | $185,690 |
| Renter-Occupied | 604 (12.7%) | $151,711 |
| Average | 4,770 (100.0%) | $185,586 |
Occupancy by Householder Income Bracket in Stone Ridge
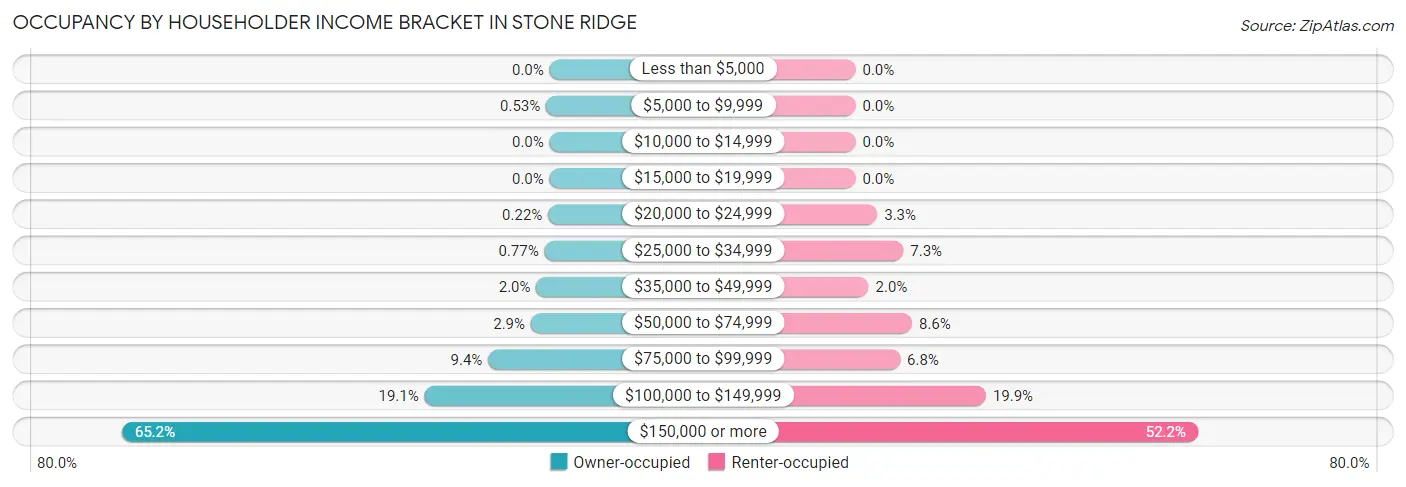
| Income Bracket | Owner-occupied | Renter-occupied |
| Less than $5,000 | 0 (0.0%) | 0 (0.0%) |
| $5,000 to $9,999 | 22 (0.5%) | 0 (0.0%) |
| $10,000 to $14,999 | 0 (0.0%) | 0 (0.0%) |
| $15,000 to $19,999 | 0 (0.0%) | 0 (0.0%) |
| $20,000 to $24,999 | 9 (0.2%) | 20 (3.3%) |
| $25,000 to $34,999 | 32 (0.8%) | 44 (7.3%) |
| $35,000 to $49,999 | 84 (2.0%) | 12 (2.0%) |
| $50,000 to $74,999 | 119 (2.9%) | 52 (8.6%) |
| $75,000 to $99,999 | 390 (9.4%) | 41 (6.8%) |
| $100,000 to $149,999 | 794 (19.1%) | 120 (19.9%) |
| $150,000 or more | 2,716 (65.2%) | 315 (52.1%) |
| Total | 4,166 (100.0%) | 604 (100.0%) |
Monthly Housing Cost Tiers in Stone Ridge
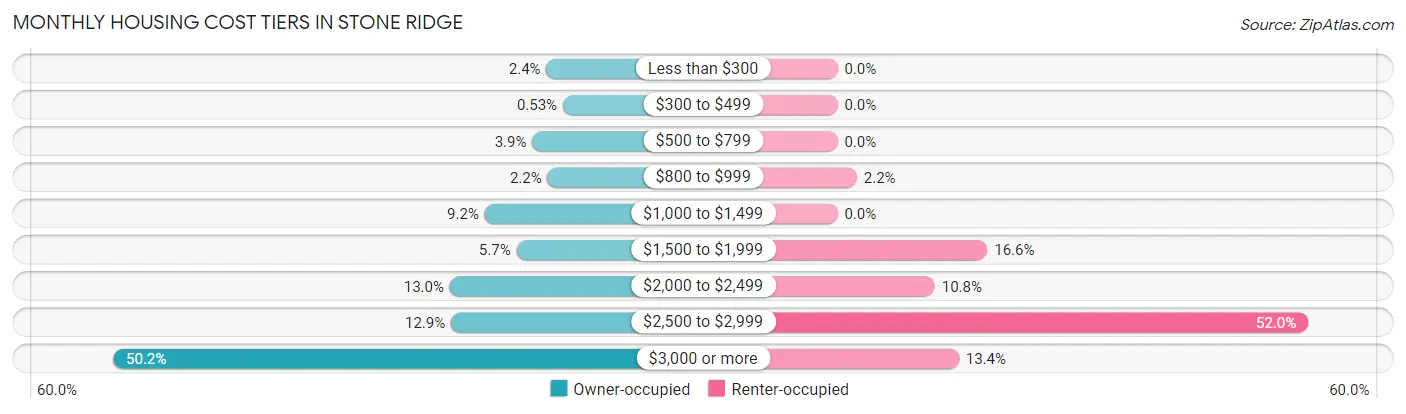
| Monthly Cost | Owner-occupied | Renter-occupied |
| Less than $300 | 98 (2.4%) | 0 (0.0%) |
| $300 to $499 | 22 (0.5%) | 0 (0.0%) |
| $500 to $799 | 163 (3.9%) | 0 (0.0%) |
| $800 to $999 | 93 (2.2%) | 13 (2.1%) |
| $1,000 to $1,499 | 382 (9.2%) | 0 (0.0%) |
| $1,500 to $1,999 | 236 (5.7%) | 100 (16.6%) |
| $2,000 to $2,499 | 543 (13.0%) | 65 (10.8%) |
| $2,500 to $2,999 | 537 (12.9%) | 314 (52.0%) |
| $3,000 or more | 2,092 (50.2%) | 81 (13.4%) |
| Total | 4,166 (100.0%) | 604 (100.0%) |
Physical Housing Characteristics in Stone Ridge
Housing Structures in Stone Ridge
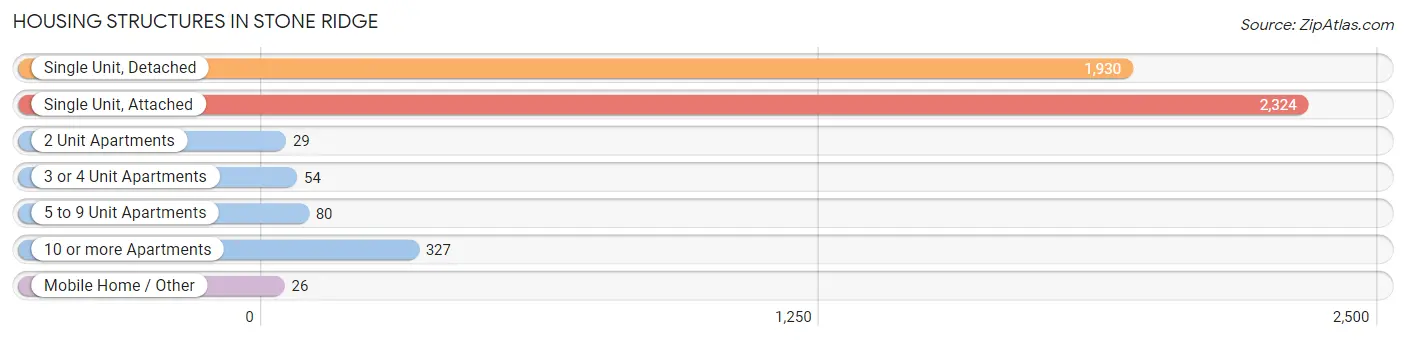
| Structure Type | # Housing Units | % Housing Units |
| Single Unit, Detached | 1,930 | 40.5% |
| Single Unit, Attached | 2,324 | 48.7% |
| 2 Unit Apartments | 29 | 0.6% |
| 3 or 4 Unit Apartments | 54 | 1.1% |
| 5 to 9 Unit Apartments | 80 | 1.7% |
| 10 or more Apartments | 327 | 6.9% |
| Mobile Home / Other | 26 | 0.5% |
| Total | 4,770 | 100.0% |
Housing Structures by Occupancy in Stone Ridge
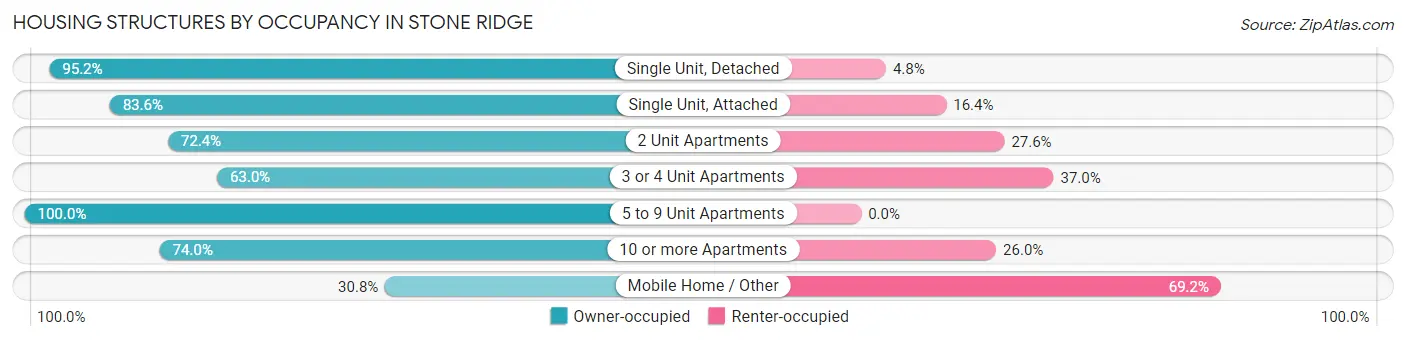
| Structure Type | Owner-occupied | Renter-occupied |
| Single Unit, Detached | 1,838 (95.2%) | 92 (4.8%) |
| Single Unit, Attached | 1,943 (83.6%) | 381 (16.4%) |
| 2 Unit Apartments | 21 (72.4%) | 8 (27.6%) |
| 3 or 4 Unit Apartments | 34 (63.0%) | 20 (37.0%) |
| 5 to 9 Unit Apartments | 80 (100.0%) | 0 (0.0%) |
| 10 or more Apartments | 242 (74.0%) | 85 (26.0%) |
| Mobile Home / Other | 8 (30.8%) | 18 (69.2%) |
| Total | 4,166 (87.3%) | 604 (12.7%) |
Housing Structures by Number of Rooms in Stone Ridge
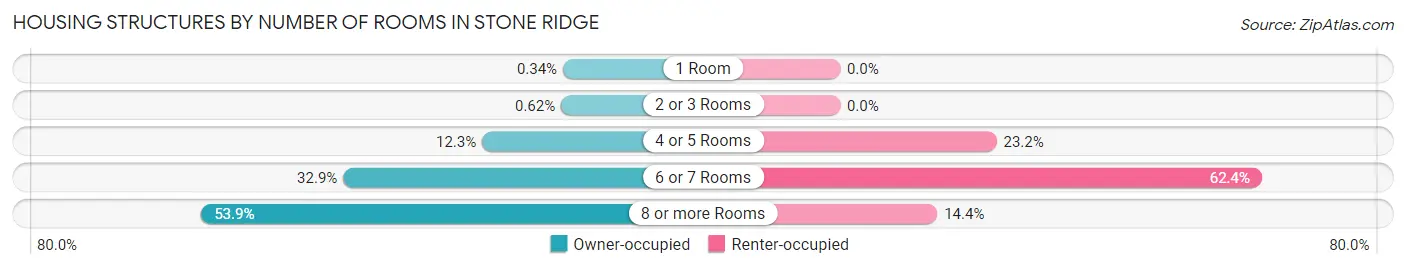
| Number of Rooms | Owner-occupied | Renter-occupied |
| 1 Room | 14 (0.3%) | 0 (0.0%) |
| 2 or 3 Rooms | 26 (0.6%) | 0 (0.0%) |
| 4 or 5 Rooms | 513 (12.3%) | 140 (23.2%) |
| 6 or 7 Rooms | 1,369 (32.9%) | 377 (62.4%) |
| 8 or more Rooms | 2,244 (53.9%) | 87 (14.4%) |
| Total | 4,166 (100.0%) | 604 (100.0%) |
Housing Structure by Heating Type in Stone Ridge
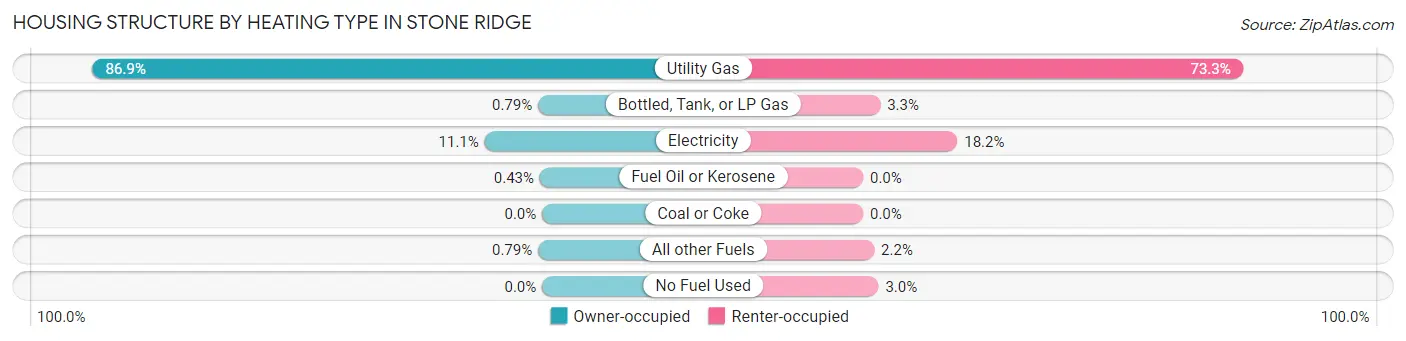
| Heating Type | Owner-occupied | Renter-occupied |
| Utility Gas | 3,619 (86.9%) | 443 (73.3%) |
| Bottled, Tank, or LP Gas | 33 (0.8%) | 20 (3.3%) |
| Electricity | 463 (11.1%) | 110 (18.2%) |
| Fuel Oil or Kerosene | 18 (0.4%) | 0 (0.0%) |
| Coal or Coke | 0 (0.0%) | 0 (0.0%) |
| All other Fuels | 33 (0.8%) | 13 (2.1%) |
| No Fuel Used | 0 (0.0%) | 18 (3.0%) |
| Total | 4,166 (100.0%) | 604 (100.0%) |
Household Vehicle Usage in Stone Ridge
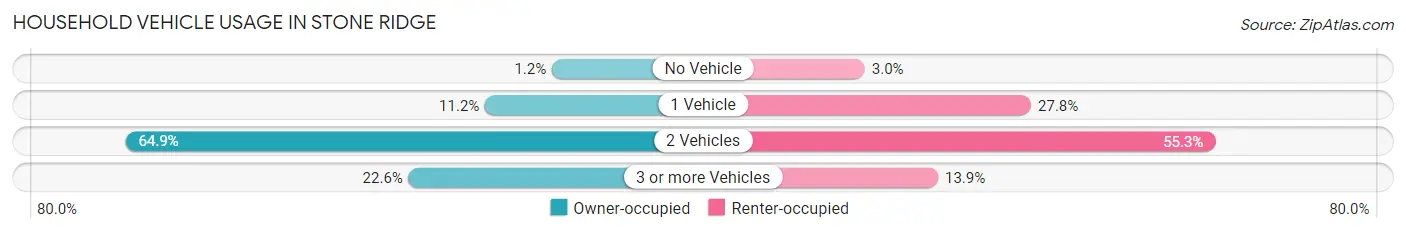
| Vehicles per Household | Owner-occupied | Renter-occupied |
| No Vehicle | 51 (1.2%) | 18 (3.0%) |
| 1 Vehicle | 467 (11.2%) | 168 (27.8%) |
| 2 Vehicles | 2,705 (64.9%) | 334 (55.3%) |
| 3 or more Vehicles | 943 (22.6%) | 84 (13.9%) |
| Total | 4,166 (100.0%) | 604 (100.0%) |
Real Estate & Mortgages in Stone Ridge
Real Estate and Mortgage Overview in Stone Ridge
| Characteristic | Without Mortgage | With Mortgage |
| Housing Units | 622 | 3,544 |
| Median Property Value | $594,500 | $662,300 |
| Median Household Income | $160,090 | $2,381 |
| Monthly Housing Costs | $936 | $2,092 |
| Real Estate Taxes | $6,294 | $81 |
Property Value by Mortgage Status in Stone Ridge
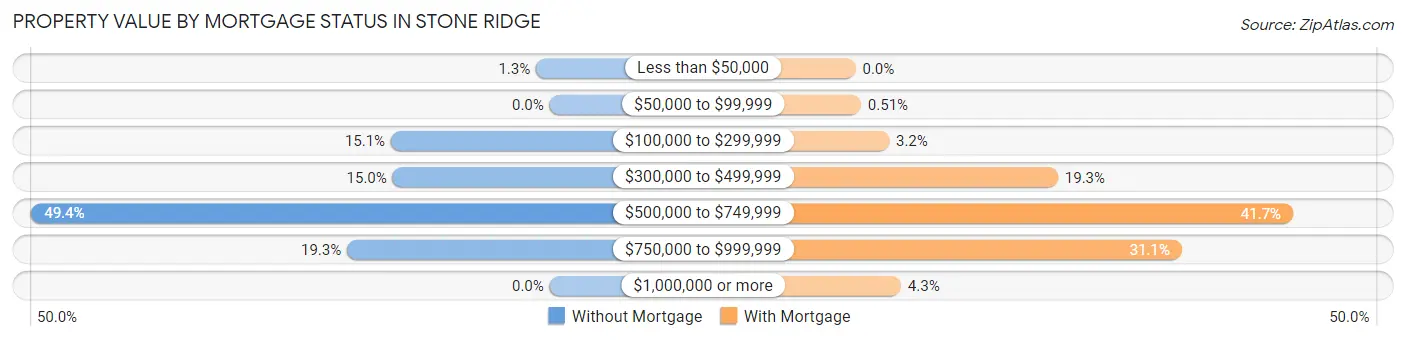
| Property Value | Without Mortgage | With Mortgage |
| Less than $50,000 | 8 (1.3%) | 0 (0.0%) |
| $50,000 to $99,999 | 0 (0.0%) | 18 (0.5%) |
| $100,000 to $299,999 | 94 (15.1%) | 113 (3.2%) |
| $300,000 to $499,999 | 93 (14.9%) | 683 (19.3%) |
| $500,000 to $749,999 | 307 (49.4%) | 1,476 (41.6%) |
| $750,000 to $999,999 | 120 (19.3%) | 1,101 (31.1%) |
| $1,000,000 or more | 0 (0.0%) | 153 (4.3%) |
| Total | 622 (100.0%) | 3,544 (100.0%) |
Household Income by Mortgage Status in Stone Ridge
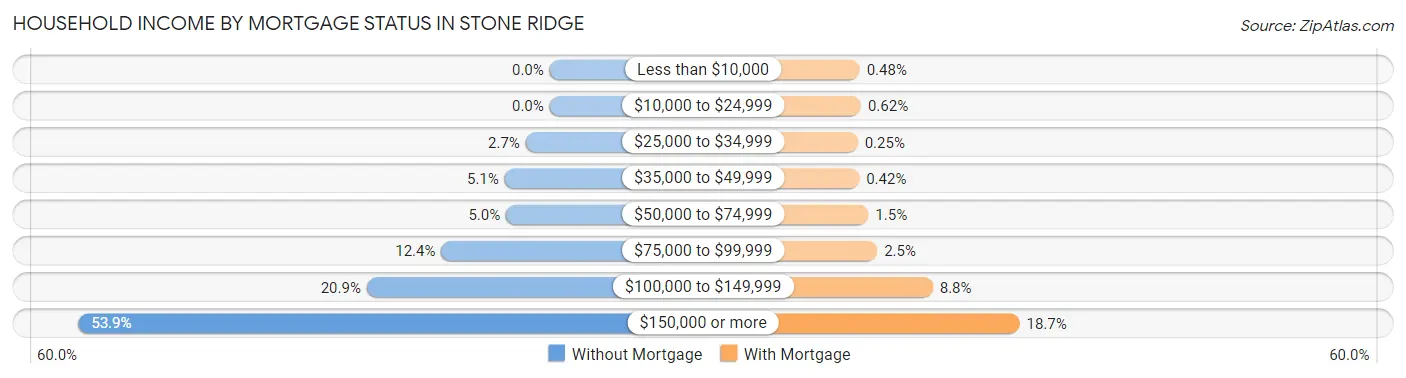
| Household Income | Without Mortgage | With Mortgage |
| Less than $10,000 | 0 (0.0%) | 17 (0.5%) |
| $10,000 to $24,999 | 0 (0.0%) | 22 (0.6%) |
| $25,000 to $34,999 | 17 (2.7%) | 9 (0.3%) |
| $35,000 to $49,999 | 32 (5.1%) | 15 (0.4%) |
| $50,000 to $74,999 | 31 (5.0%) | 52 (1.5%) |
| $75,000 to $99,999 | 77 (12.4%) | 88 (2.5%) |
| $100,000 to $149,999 | 130 (20.9%) | 313 (8.8%) |
| $150,000 or more | 335 (53.9%) | 664 (18.7%) |
| Total | 622 (100.0%) | 3,544 (100.0%) |
Property Value to Household Income Ratio in Stone Ridge
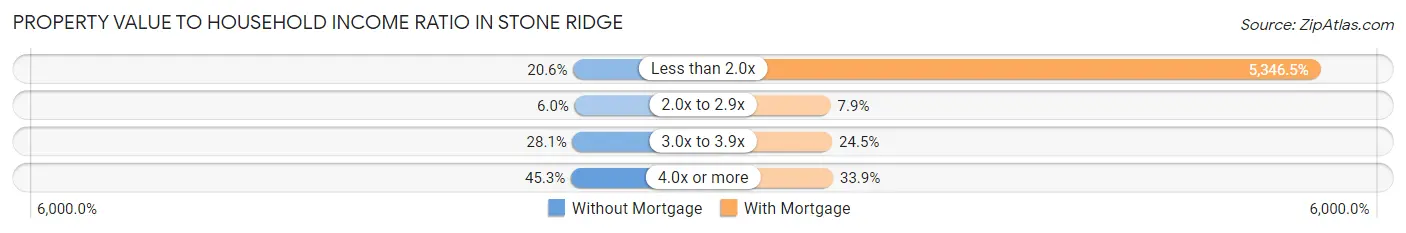
| Value-to-Income Ratio | Without Mortgage | With Mortgage |
| Less than 2.0x | 128 (20.6%) | 189,480 (5,346.5%) |
| 2.0x to 2.9x | 37 (5.9%) | 281 (7.9%) |
| 3.0x to 3.9x | 175 (28.1%) | 867 (24.5%) |
| 4.0x or more | 282 (45.3%) | 1,200 (33.9%) |
| Total | 622 (100.0%) | 3,544 (100.0%) |
Real Estate Taxes by Mortgage Status in Stone Ridge
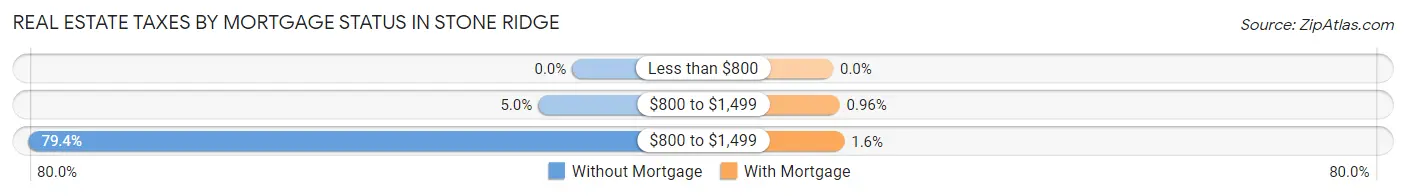
| Property Taxes | Without Mortgage | With Mortgage |
| Less than $800 | 0 (0.0%) | 0 (0.0%) |
| $800 to $1,499 | 31 (5.0%) | 34 (1.0%) |
| $800 to $1,499 | 494 (79.4%) | 58 (1.6%) |
| Total | 622 (100.0%) | 3,544 (100.0%) |
Health & Disability in Stone Ridge
Health Insurance Coverage by Age in Stone Ridge
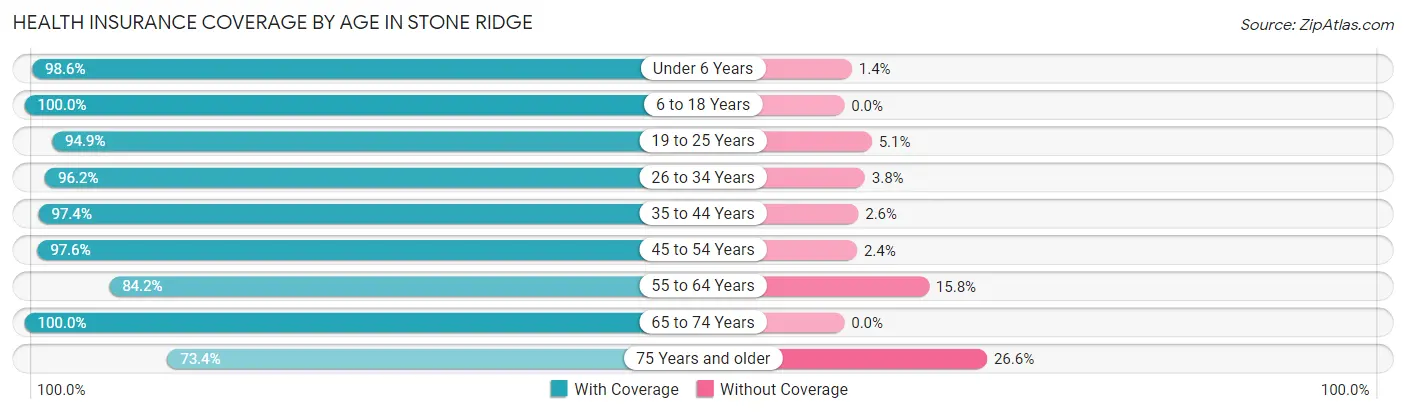
| Age Bracket | With Coverage | Without Coverage |
| Under 6 Years | 1,958 (98.6%) | 28 (1.4%) |
| 6 to 18 Years | 3,598 (100.0%) | 0 (0.0%) |
| 19 to 25 Years | 723 (94.9%) | 39 (5.1%) |
| 26 to 34 Years | 1,406 (96.2%) | 56 (3.8%) |
| 35 to 44 Years | 3,837 (97.4%) | 103 (2.6%) |
| 45 to 54 Years | 2,306 (97.6%) | 56 (2.4%) |
| 55 to 64 Years | 811 (84.2%) | 152 (15.8%) |
| 65 to 74 Years | 793 (100.0%) | 0 (0.0%) |
| 75 Years and older | 91 (73.4%) | 33 (26.6%) |
| Total | 15,523 (97.1%) | 467 (2.9%) |
Health Insurance Coverage by Citizenship Status in Stone Ridge
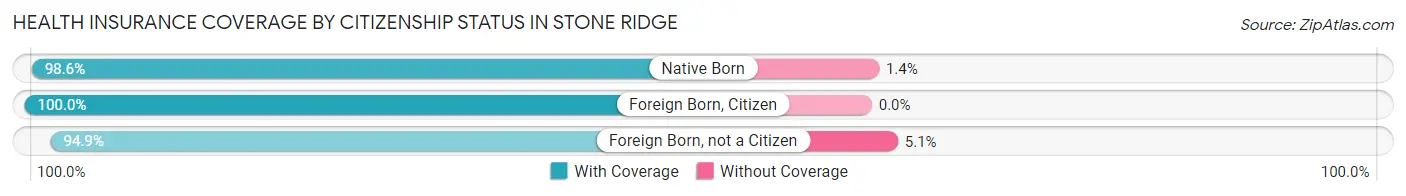
| Citizenship Status | With Coverage | Without Coverage |
| Native Born | 1,958 (98.6%) | 28 (1.4%) |
| Foreign Born, Citizen | 3,598 (100.0%) | 0 (0.0%) |
| Foreign Born, not a Citizen | 723 (94.9%) | 39 (5.1%) |
Health Insurance Coverage by Household Income in Stone Ridge
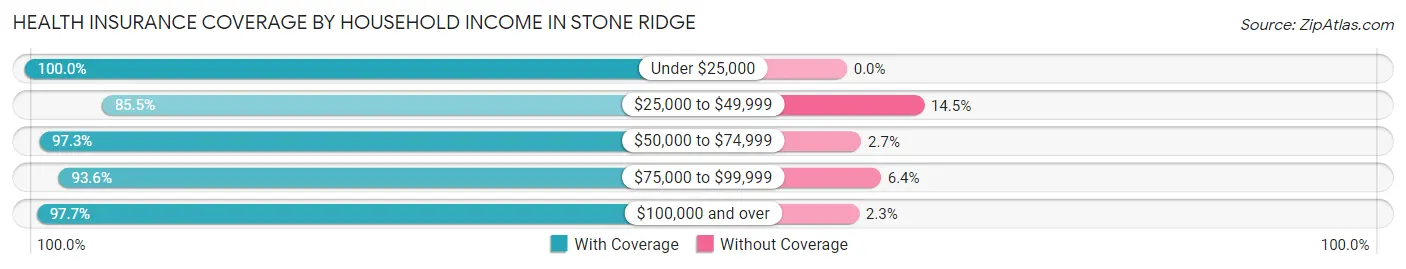
| Household Income | With Coverage | Without Coverage |
| Under $25,000 | 134 (100.0%) | 0 (0.0%) |
| $25,000 to $49,999 | 349 (85.5%) | 59 (14.5%) |
| $50,000 to $74,999 | 579 (97.3%) | 16 (2.7%) |
| $75,000 to $99,999 | 1,264 (93.6%) | 86 (6.4%) |
| $100,000 and over | 13,190 (97.7%) | 306 (2.3%) |
Public vs Private Health Insurance Coverage by Age in Stone Ridge
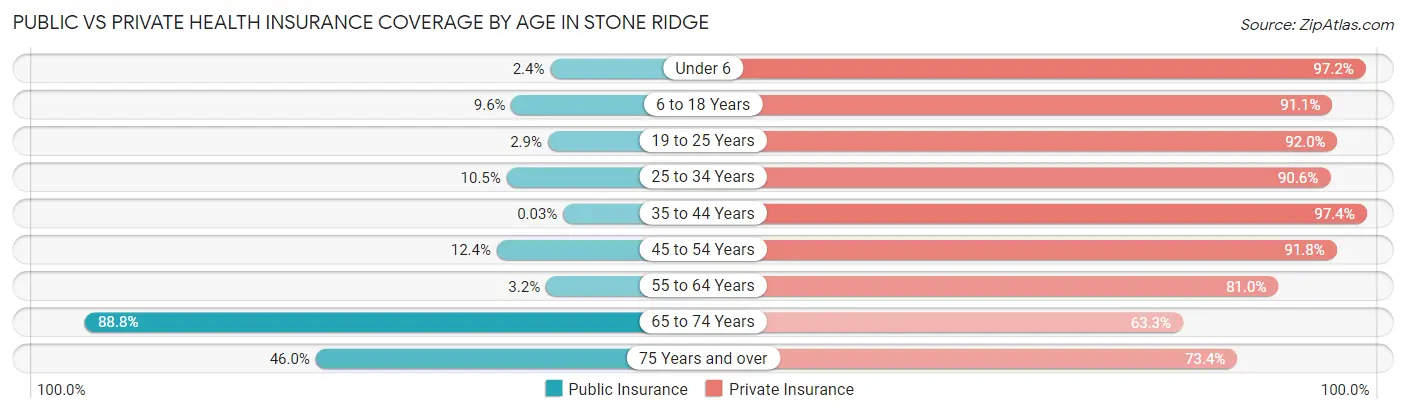
| Age Bracket | Public Insurance | Private Insurance |
| Under 6 | 48 (2.4%) | 1,931 (97.2%) |
| 6 to 18 Years | 347 (9.6%) | 3,276 (91.0%) |
| 19 to 25 Years | 22 (2.9%) | 701 (92.0%) |
| 25 to 34 Years | 154 (10.5%) | 1,325 (90.6%) |
| 35 to 44 Years | 1 (0.0%) | 3,837 (97.4%) |
| 45 to 54 Years | 292 (12.4%) | 2,169 (91.8%) |
| 55 to 64 Years | 31 (3.2%) | 780 (81.0%) |
| 65 to 74 Years | 704 (88.8%) | 502 (63.3%) |
| 75 Years and over | 57 (46.0%) | 91 (73.4%) |
| Total | 1,656 (10.4%) | 14,612 (91.4%) |
Disability Status by Sex by Age in Stone Ridge
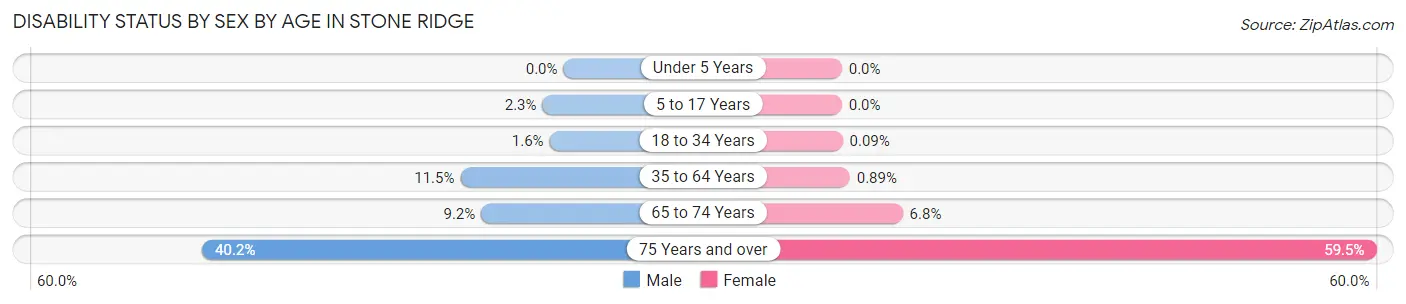
| Age Bracket | Male | Female |
| Under 5 Years | 0 (0.0%) | 0 (0.0%) |
| 5 to 17 Years | 34 (2.3%) | 0 (0.0%) |
| 18 to 34 Years | 19 (1.5%) | 1 (0.1%) |
| 35 to 64 Years | 419 (11.5%) | 32 (0.9%) |
| 65 to 74 Years | 24 (9.2%) | 36 (6.8%) |
| 75 Years and over | 33 (40.2%) | 25 (59.5%) |
Disability Class by Sex by Age in Stone Ridge
Disability Class: Hearing Difficulty
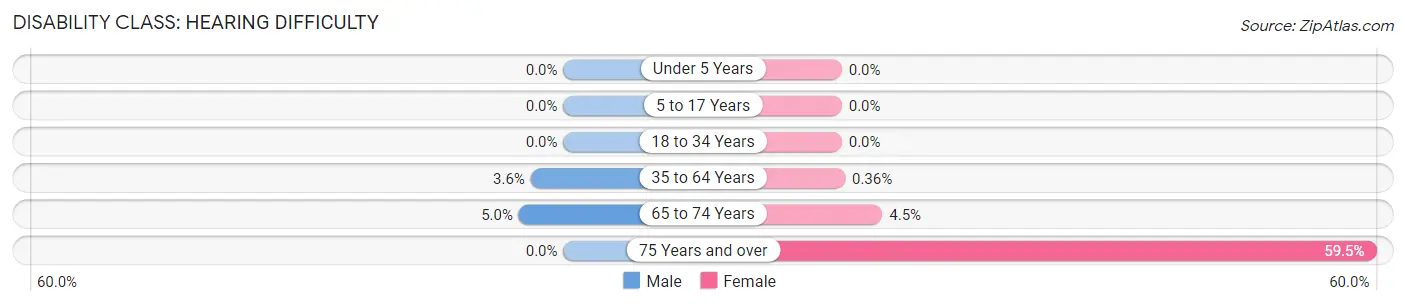
| Age Bracket | Male | Female |
| Under 5 Years | 0 (0.0%) | 0 (0.0%) |
| 5 to 17 Years | 0 (0.0%) | 0 (0.0%) |
| 18 to 34 Years | 0 (0.0%) | 0 (0.0%) |
| 35 to 64 Years | 133 (3.6%) | 13 (0.4%) |
| 65 to 74 Years | 13 (5.0%) | 24 (4.5%) |
| 75 Years and over | 0 (0.0%) | 25 (59.5%) |
Disability Class: Vision Difficulty
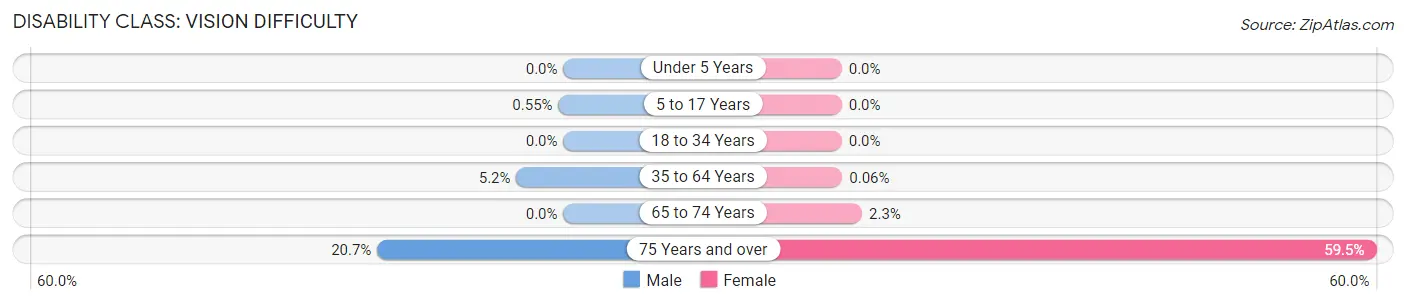
| Age Bracket | Male | Female |
| Under 5 Years | 0 (0.0%) | 0 (0.0%) |
| 5 to 17 Years | 8 (0.5%) | 0 (0.0%) |
| 18 to 34 Years | 0 (0.0%) | 0 (0.0%) |
| 35 to 64 Years | 191 (5.2%) | 2 (0.1%) |
| 65 to 74 Years | 0 (0.0%) | 12 (2.3%) |
| 75 Years and over | 17 (20.7%) | 25 (59.5%) |
Disability Class: Cognitive Difficulty
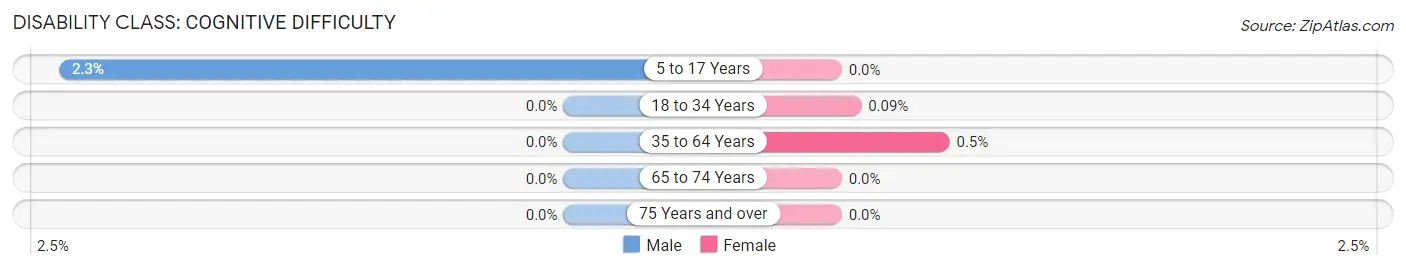
| Age Bracket | Male | Female |
| 5 to 17 Years | 34 (2.3%) | 0 (0.0%) |
| 18 to 34 Years | 0 (0.0%) | 1 (0.1%) |
| 35 to 64 Years | 0 (0.0%) | 18 (0.5%) |
| 65 to 74 Years | 0 (0.0%) | 0 (0.0%) |
| 75 Years and over | 0 (0.0%) | 0 (0.0%) |
Disability Class: Ambulatory Difficulty
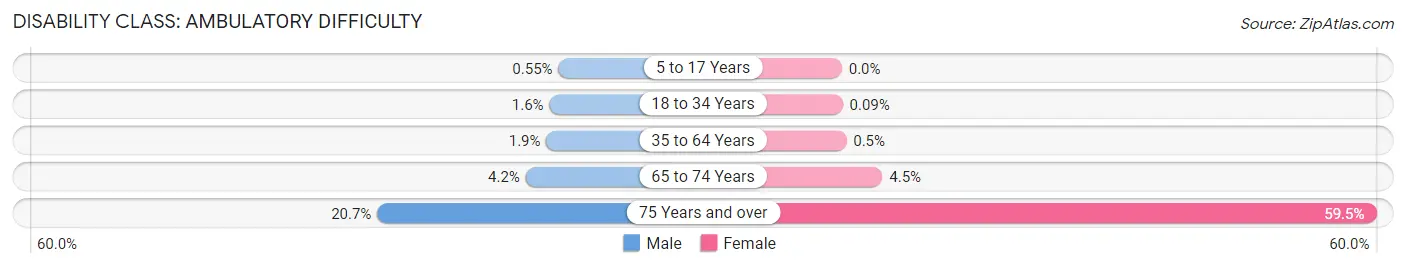
| Age Bracket | Male | Female |
| 5 to 17 Years | 8 (0.5%) | 0 (0.0%) |
| 18 to 34 Years | 19 (1.5%) | 1 (0.1%) |
| 35 to 64 Years | 69 (1.9%) | 18 (0.5%) |
| 65 to 74 Years | 11 (4.2%) | 24 (4.5%) |
| 75 Years and over | 17 (20.7%) | 25 (59.5%) |
Disability Class: Self-Care Difficulty
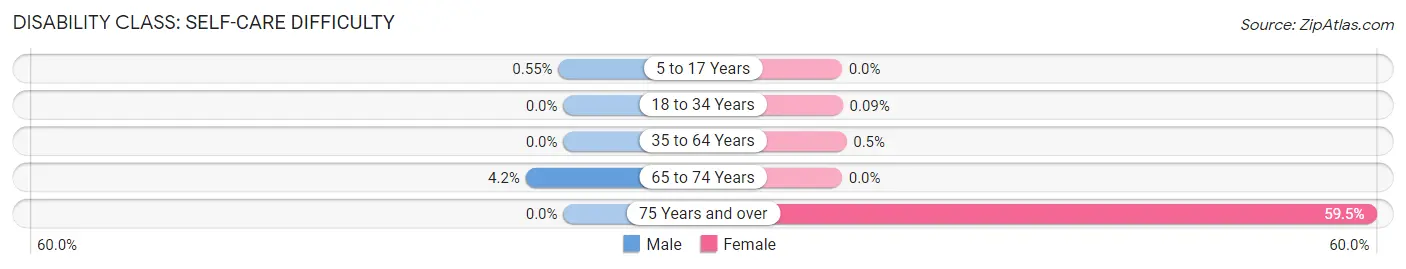
| Age Bracket | Male | Female |
| 5 to 17 Years | 8 (0.5%) | 0 (0.0%) |
| 18 to 34 Years | 0 (0.0%) | 1 (0.1%) |
| 35 to 64 Years | 0 (0.0%) | 18 (0.5%) |
| 65 to 74 Years | 11 (4.2%) | 0 (0.0%) |
| 75 Years and over | 0 (0.0%) | 25 (59.5%) |
Technology Access in Stone Ridge
Computing Device Access in Stone Ridge
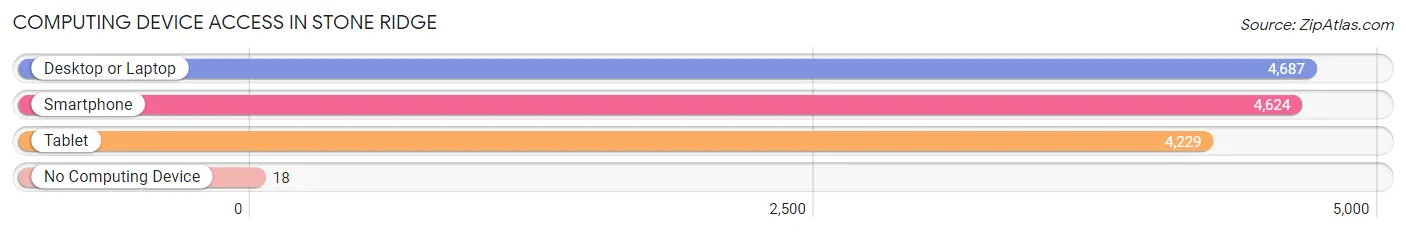
| Device Type | # Households | % Households |
| Desktop or Laptop | 4,687 | 98.3% |
| Smartphone | 4,624 | 96.9% |
| Tablet | 4,229 | 88.7% |
| No Computing Device | 18 | 0.4% |
| Total | 4,770 | 100.0% |
Internet Access in Stone Ridge
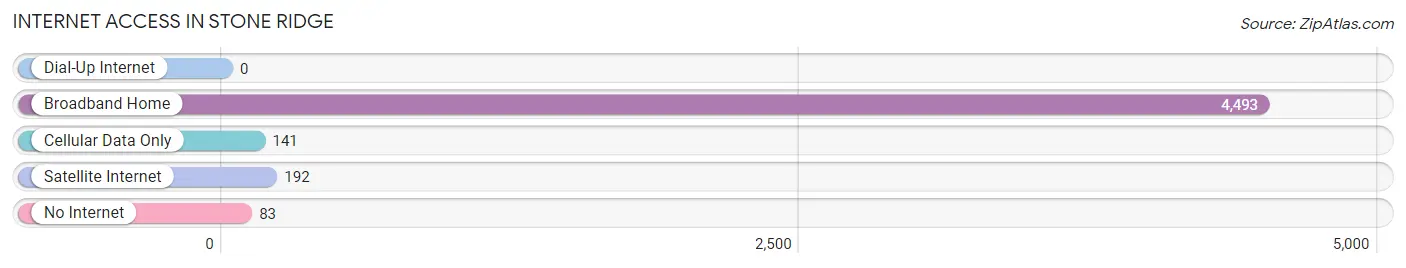
| Internet Type | # Households | % Households |
| Dial-Up Internet | 0 | 0.0% |
| Broadband Home | 4,493 | 94.2% |
| Cellular Data Only | 141 | 3.0% |
| Satellite Internet | 192 | 4.0% |
| No Internet | 83 | 1.7% |
| Total | 4,770 | 100.0% |
Stone Ridge Summary
Stone Ridge is a census-designated place (CDP) located in Loudoun County, Virginia. It is situated in the Washington metropolitan area and is part of the Dulles Technology Corridor. The population of Stone Ridge was 8,945 at the 2010 census.
History
Stone Ridge was first settled in the late 1700s by German and English immigrants. The area was originally known as “Stone Ridge Crossroads” due to its location at the intersection of two major roads. The area was primarily agricultural until the 1950s, when the Dulles Airport was built nearby. This led to an influx of new residents and businesses, and the area was eventually incorporated as a CDP in 2000.
Geography
Stone Ridge is located at 38°59'25"N 77°30'17"W (38.990278, -77.504722). It is situated in the Washington metropolitan area and is part of the Dulles Technology Corridor. The CDP has a total area of 8.2 square miles, all of which is land.
Economy
Stone Ridge is home to a variety of businesses, including technology companies, retail stores, and restaurants. The area is also home to several corporate headquarters, including those of AOL, Orbital Sciences Corporation, and Northrop Grumman. The area is also home to several government contractors, such as Lockheed Martin and Raytheon.
Demographics
As of the 2010 census, the population of Stone Ridge was 8,945. The racial makeup of the CDP was 79.2% White, 8.2% African American, 0.3% Native American, 8.2% Asian, 0.1% Pacific Islander, and 2.2% from other races. Hispanic or Latino of any race were 5.2% of the population.
The median income for a household in Stone Ridge was $117,917, and the median income for a family was $128,917. The per capita income for the CDP was $50,917. About 3.2% of families and 4.2% of the population were below the poverty line, including 5.2% of those under age 18 and 4.2% of those age 65 or over.
Common Questions
What is Per Capita Income in Stone Ridge?
Per Capita income in Stone Ridge is $58,858.
What is the Median Family Income in Stone Ridge?
Median Family Income in Stone Ridge is $188,116.
What is the Median Household income in Stone Ridge?
Median Household Income in Stone Ridge is $185,586.
What is Income or Wage Gap in Stone Ridge?
Income or Wage Gap in Stone Ridge is 52.2%.
Women in Stone Ridge earn 47.8 cents for every dollar earned by a man.
What is Inequality or Gini Index in Stone Ridge?
Inequality or Gini Index in Stone Ridge is 0.30.
What is the Total Population of Stone Ridge?
Total Population of Stone Ridge is 16,049.
What is the Total Male Population of Stone Ridge?
Total Male Population of Stone Ridge is 7,632.
What is the Total Female Population of Stone Ridge?
Total Female Population of Stone Ridge is 8,417.
What is the Ratio of Males per 100 Females in Stone Ridge?
There are 90.67 Males per 100 Females in Stone Ridge.
What is the Ratio of Females per 100 Males in Stone Ridge?
There are 110.29 Females per 100 Males in Stone Ridge.
What is the Median Population Age in Stone Ridge?
Median Population Age in Stone Ridge is 35.7 Years.
What is the Average Family Size in Stone Ridge
Average Family Size in Stone Ridge is 3.6 People.
What is the Average Household Size in Stone Ridge
Average Household Size in Stone Ridge is 3.4 People.
How Large is the Labor Force in Stone Ridge?
There are 8,940 People in the Labor Forcein in Stone Ridge.
What is the Percentage of People in the Labor Force in Stone Ridge?
79.6% of People are in the Labor Force in Stone Ridge.
What is the Unemployment Rate in Stone Ridge?
Unemployment Rate in Stone Ridge is 1.1%.