Bobtown, VA Map & Demographics
Bobtown Map
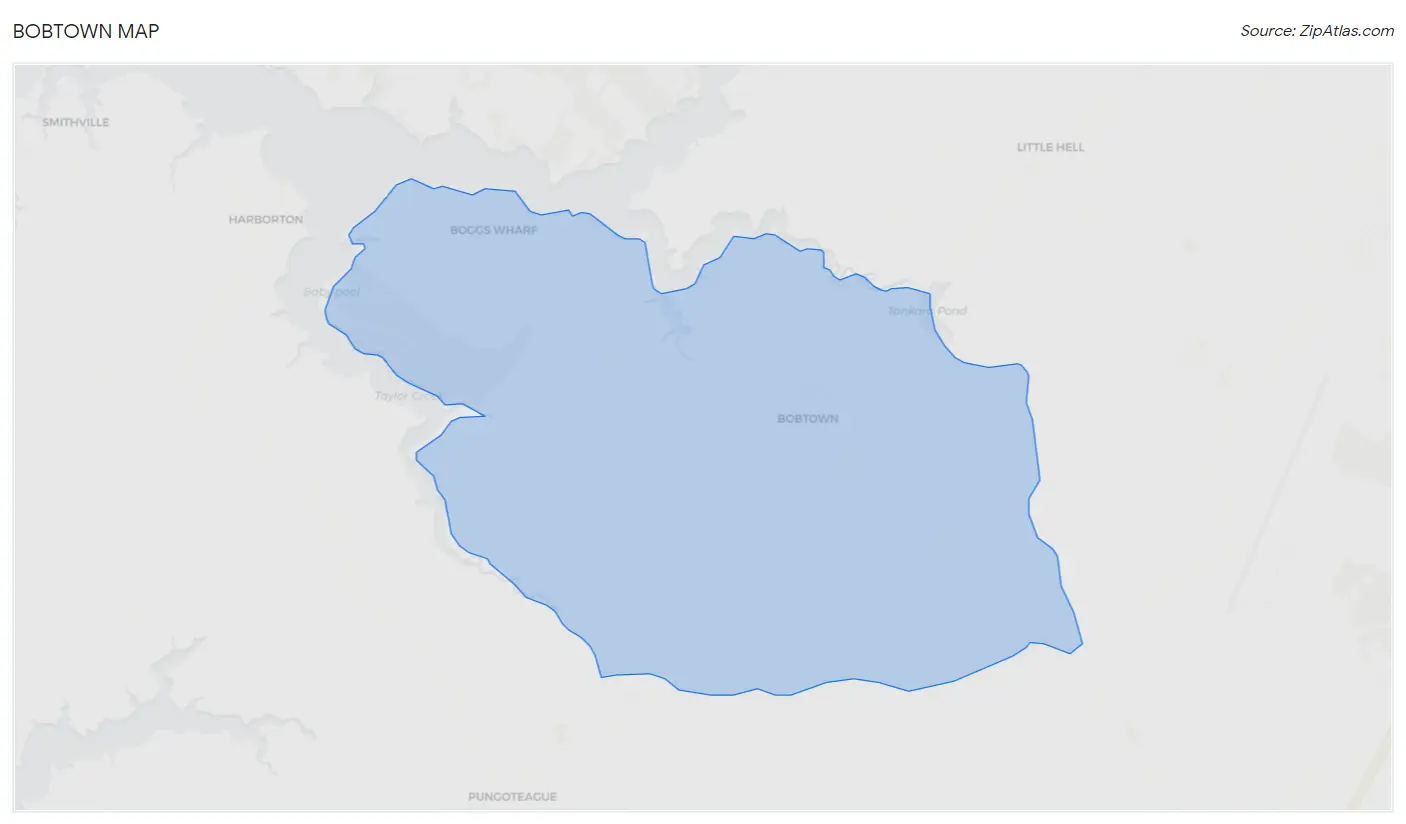
Bobtown Overview
$86,324
PER CAPITA INCOME
0.44
INEQUALITY / GINI INDEX
214
TOTAL POPULATION
93
MALE POPULATION
121
FEMALE POPULATION
76.86
MALES / 100 FEMALES
130.11
FEMALES / 100 MALES
61.7
MEDIAN AGE
2.1
AVG FAMILY SIZE
1.9
AVG HOUSEHOLD SIZE
91
LABOR FORCE [ PEOPLE ]
42.5%
PERCENT IN LABOR FORCE
Income in Bobtown
Income Overview in Bobtown
| Characteristic | Number | Measure |
| Per Capita Income | 214 | $86,324 |
| Median Family Income | 88 | $0 |
| Mean Family Income | 88 | $177,631 |
| Median Household Income | 112 | $0 |
| Mean Household Income | 112 | $156,959 |
| Income Deficit | 88 | $0 |
| Wage / Income Gap (%) | 214 | 0.00% |
| Wage / Income Gap ($) | 214 | 100.00¢ per $1 |
| Gini / Inequality Index | 214 | 0.44 |
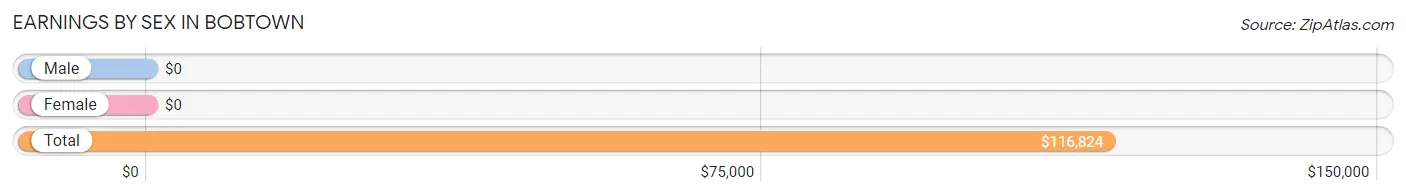
Earnings by Sex in Bobtown
| Sex | Number | Average Earnings |
| Male | 54 (51.9%) | $0 |
| Female | 50 (48.1%) | $0 |
| Total | 104 (100.0%) | $116,824 |
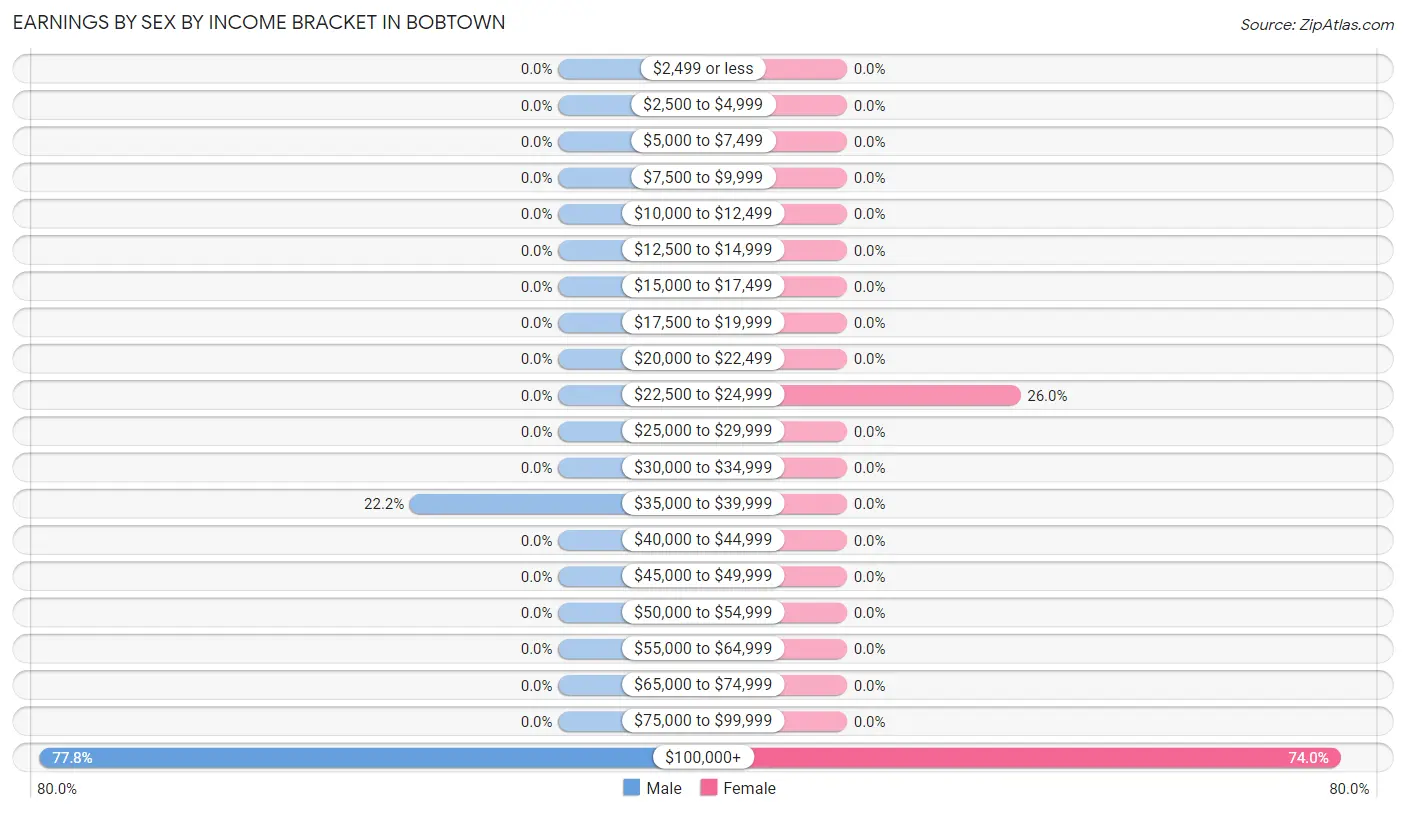
Earnings by Sex by Income Bracket in Bobtown
The most common earnings brackets in Bobtown are $100,000+ for men (42 | 77.8%) and $100,000+ for women (37 | 74.0%).
| Income | Male | Female |
| $2,499 or less | 0 (0.0%) | 0 (0.0%) |
| $2,500 to $4,999 | 0 (0.0%) | 0 (0.0%) |
| $5,000 to $7,499 | 0 (0.0%) | 0 (0.0%) |
| $7,500 to $9,999 | 0 (0.0%) | 0 (0.0%) |
| $10,000 to $12,499 | 0 (0.0%) | 0 (0.0%) |
| $12,500 to $14,999 | 0 (0.0%) | 0 (0.0%) |
| $15,000 to $17,499 | 0 (0.0%) | 0 (0.0%) |
| $17,500 to $19,999 | 0 (0.0%) | 0 (0.0%) |
| $20,000 to $22,499 | 0 (0.0%) | 0 (0.0%) |
| $22,500 to $24,999 | 0 (0.0%) | 13 (26.0%) |
| $25,000 to $29,999 | 0 (0.0%) | 0 (0.0%) |
| $30,000 to $34,999 | 0 (0.0%) | 0 (0.0%) |
| $35,000 to $39,999 | 12 (22.2%) | 0 (0.0%) |
| $40,000 to $44,999 | 0 (0.0%) | 0 (0.0%) |
| $45,000 to $49,999 | 0 (0.0%) | 0 (0.0%) |
| $50,000 to $54,999 | 0 (0.0%) | 0 (0.0%) |
| $55,000 to $64,999 | 0 (0.0%) | 0 (0.0%) |
| $65,000 to $74,999 | 0 (0.0%) | 0 (0.0%) |
| $75,000 to $99,999 | 0 (0.0%) | 0 (0.0%) |
| $100,000+ | 42 (77.8%) | 37 (74.0%) |
| Total | 54 (100.0%) | 50 (100.0%) |
Earnings by Sex by Educational Attainment in Bobtown
| Educational Attainment | Male Income | Female Income |
| Less than High School | - | - |
| High School Diploma | - | - |
| College or Associate's Degree | - | - |
| Bachelor's Degree | - | - |
| Graduate Degree | - | - |
| Total | - | - |
Family Income in Bobtown
Family Income Brackets in Bobtown
According to the Bobtown family income data, there are 37 families falling into the $200,000+ income range, which is the most common income bracket and makes up 42.0% of all families.
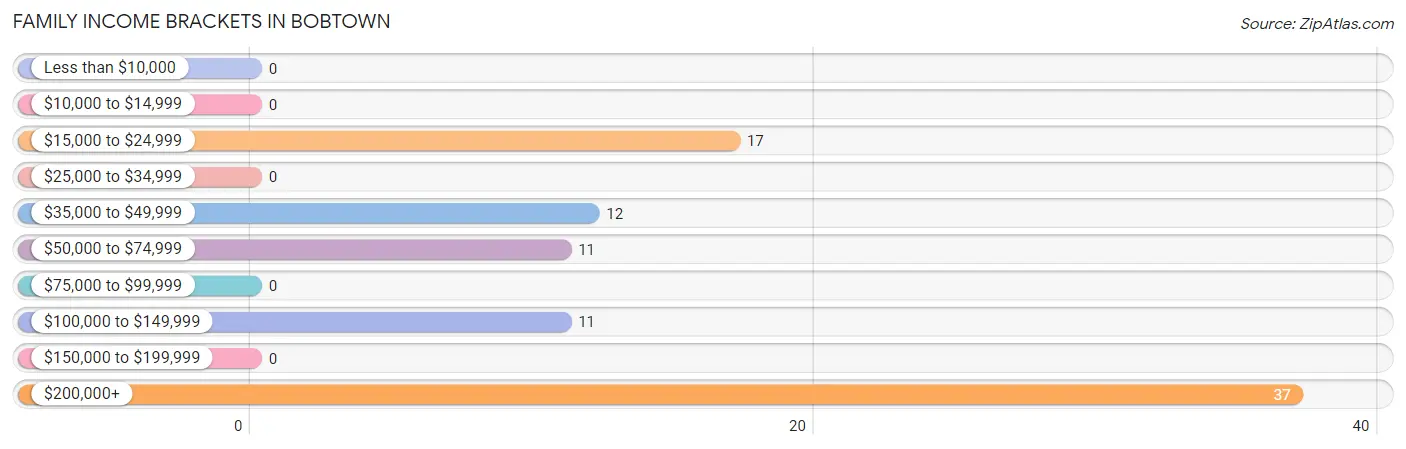
| Income Bracket | # Families | % Families |
| Less than $10,000 | 0 | 0.0% |
| $10,000 to $14,999 | 0 | 0.0% |
| $15,000 to $24,999 | 17 | 19.3% |
| $25,000 to $34,999 | 0 | 0.0% |
| $35,000 to $49,999 | 12 | 13.6% |
| $50,000 to $74,999 | 11 | 12.5% |
| $75,000 to $99,999 | 0 | 0.0% |
| $100,000 to $149,999 | 11 | 12.5% |
| $150,000 to $199,999 | 0 | 0.0% |
| $200,000+ | 37 | 42.0% |
Family Income by Famaliy Size in Bobtown
2-person families (71 | 80.7%) account for the highest median family income in Bobtown with $250,001 per family, while 2-person families (71 | 80.7%) have the highest median income of $125,000 per family member.
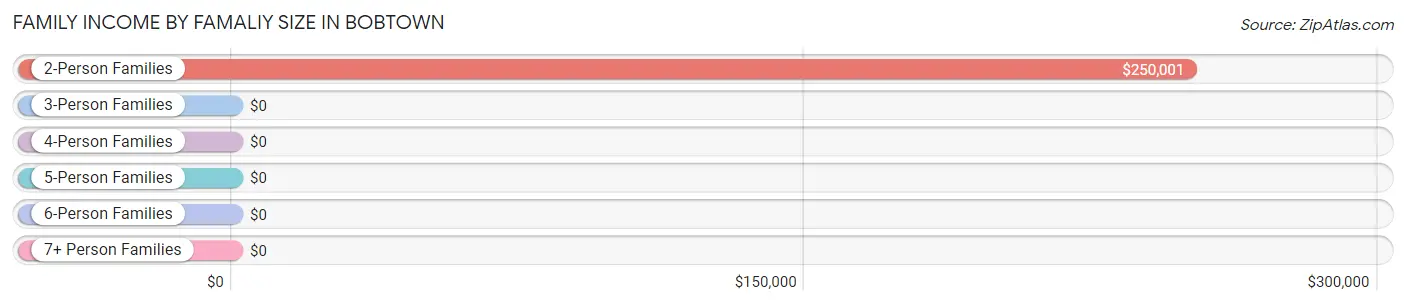
| Income Bracket | # Families | Median Income |
| 2-Person Families | 71 (80.7%) | $250,001 |
| 3-Person Families | 17 (19.3%) | $0 |
| 4-Person Families | 0 (0.0%) | $0 |
| 5-Person Families | 0 (0.0%) | $0 |
| 6-Person Families | 0 (0.0%) | $0 |
| 7+ Person Families | 0 (0.0%) | $0 |
| Total | 88 (100.0%) | $0 |
Family Income by Number of Earners in Bobtown
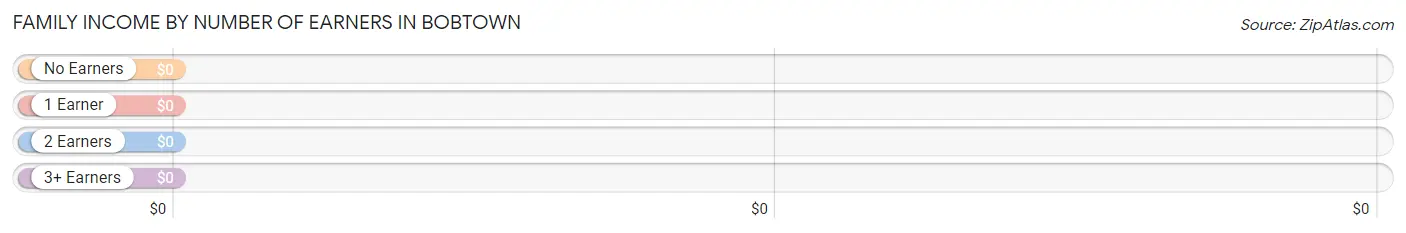
| Number of Earners | # Families | Median Income |
| No Earners | 22 (25.0%) | $0 |
| 1 Earner | 29 (33.0%) | $0 |
| 2 Earners | 37 (42.0%) | $0 |
| 3+ Earners | 0 (0.0%) | $0 |
| Total | 88 (100.0%) | $0 |
Household Income in Bobtown
Household Income Brackets in Bobtown
With 37 households falling in the category, the $200,000+ income range is the most frequent in Bobtown, accounting for 33.0% of all households.
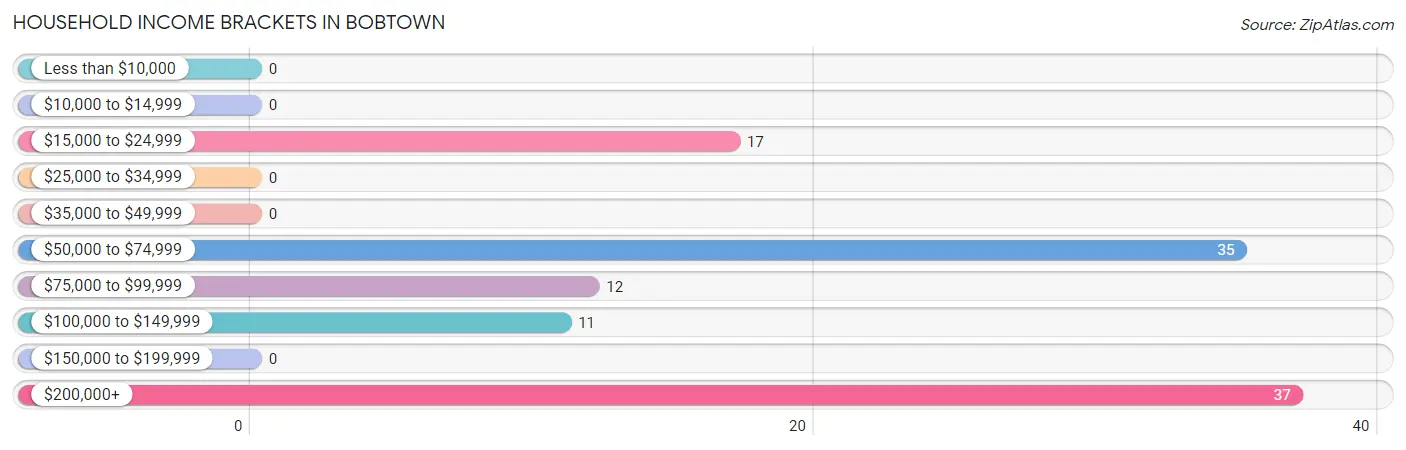
| Income Bracket | # Households | % Households |
| Less than $10,000 | 0 | 0.0% |
| $10,000 to $14,999 | 0 | 0.0% |
| $15,000 to $24,999 | 17 | 15.2% |
| $25,000 to $34,999 | 0 | 0.0% |
| $35,000 to $49,999 | 0 | 0.0% |
| $50,000 to $74,999 | 35 | 31.3% |
| $75,000 to $99,999 | 12 | 10.7% |
| $100,000 to $149,999 | 11 | 9.8% |
| $150,000 to $199,999 | 0 | 0.0% |
| $200,000+ | 37 | 33.0% |
Household Income by Householder Age in Bobtown
The median household income in Bobtown is $0, with the highest median household income of $59,271 found in the 65+ years age bracket for the primary householder. A total of 75 households (67.0%) fall into this category.
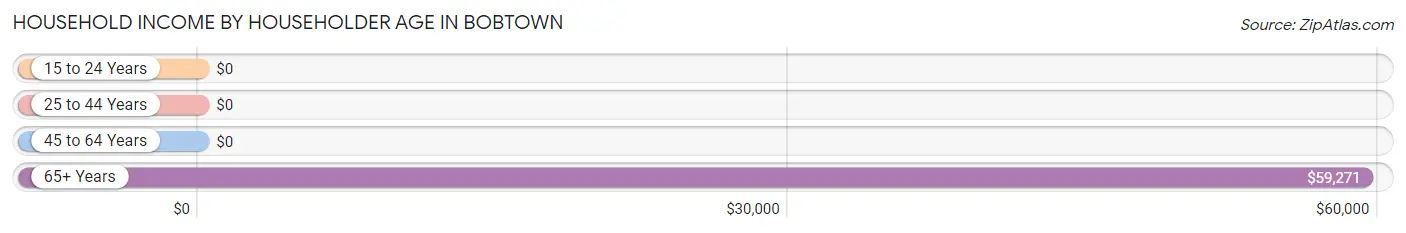
| Income Bracket | # Households | Median Income |
| 15 to 24 Years | 0 (0.0%) | $0 |
| 25 to 44 Years | 37 (33.0%) | $0 |
| 45 to 64 Years | 0 (0.0%) | $0 |
| 65+ Years | 75 (67.0%) | $59,271 |
| Total | 112 (100.0%) | $0 |
Poverty in Bobtown
Income Below Poverty by Sex and Age in Bobtown
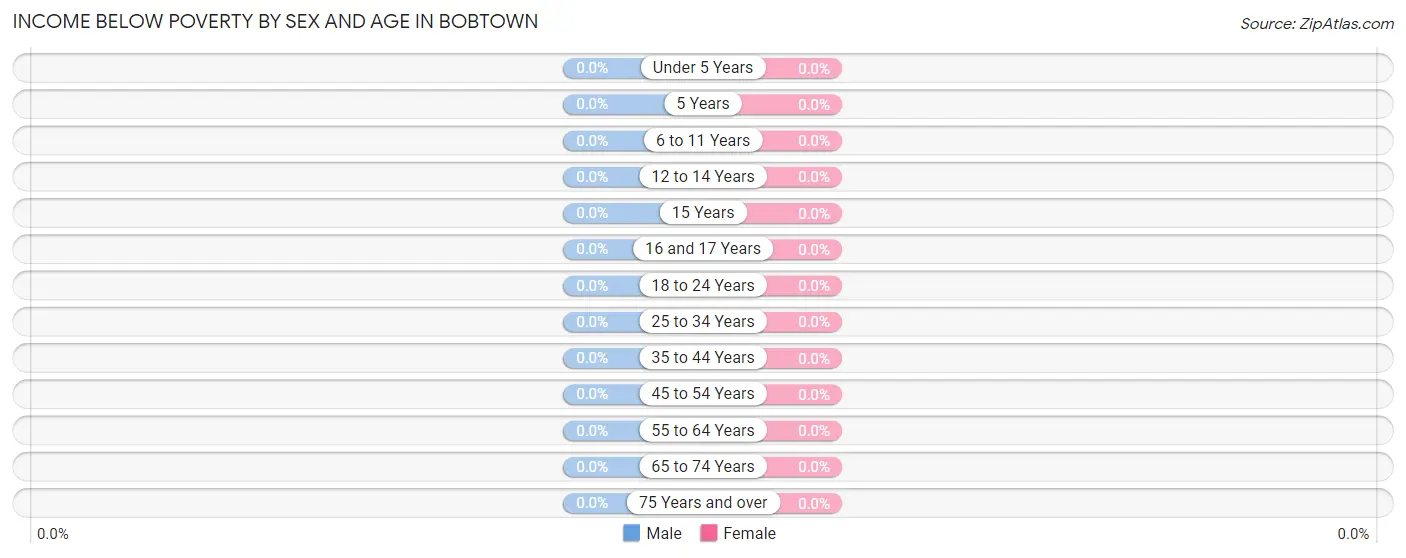
| Age Bracket | Male | Female |
| Under 5 Years | 0 (0.0%) | 0 (0.0%) |
| 5 Years | 0 (0.0%) | 0 (0.0%) |
| 6 to 11 Years | 0 (0.0%) | 0 (0.0%) |
| 12 to 14 Years | 0 (0.0%) | 0 (0.0%) |
| 15 Years | 0 (0.0%) | 0 (0.0%) |
| 16 and 17 Years | 0 (0.0%) | 0 (0.0%) |
| 18 to 24 Years | 0 (0.0%) | 0 (0.0%) |
| 25 to 34 Years | 0 (0.0%) | 0 (0.0%) |
| 35 to 44 Years | 0 (0.0%) | 0 (0.0%) |
| 45 to 54 Years | 0 (0.0%) | 0 (0.0%) |
| 55 to 64 Years | 0 (0.0%) | 0 (0.0%) |
| 65 to 74 Years | 0 (0.0%) | 0 (0.0%) |
| 75 Years and over | 0 (0.0%) | 0 (0.0%) |
| Total | 0 (0.0%) | 0 (0.0%) |
Income Above Poverty by Sex and Age in Bobtown
According to the poverty statistics in Bobtown, males aged 35 to 44 years and females aged 35 to 44 years are the age groups that are most secure financially, with 100.0% of males and 100.0% of females in these age groups living above the poverty line.
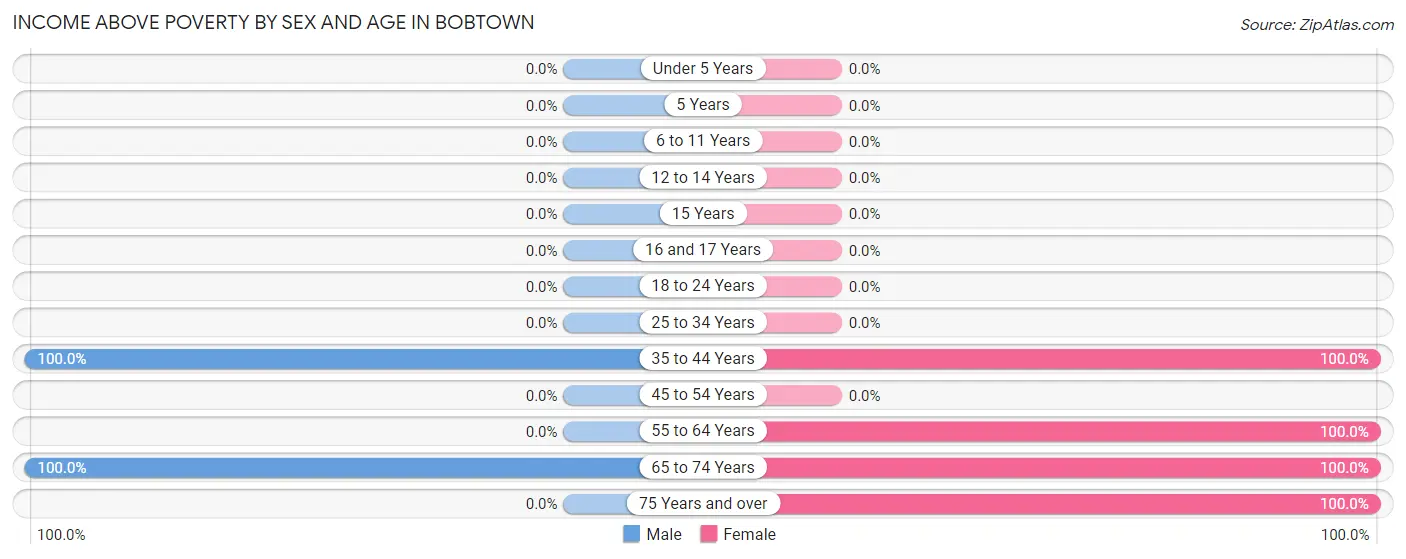
| Age Bracket | Male | Female |
| Under 5 Years | 0 (0.0%) | 0 (0.0%) |
| 5 Years | 0 (0.0%) | 0 (0.0%) |
| 6 to 11 Years | 0 (0.0%) | 0 (0.0%) |
| 12 to 14 Years | 0 (0.0%) | 0 (0.0%) |
| 15 Years | 0 (0.0%) | 0 (0.0%) |
| 16 and 17 Years | 0 (0.0%) | 0 (0.0%) |
| 18 to 24 Years | 0 (0.0%) | 0 (0.0%) |
| 25 to 34 Years | 0 (0.0%) | 0 (0.0%) |
| 35 to 44 Years | 42 (100.0%) | 37 (100.0%) |
| 45 to 54 Years | 0 (0.0%) | 0 (0.0%) |
| 55 to 64 Years | 0 (0.0%) | 42 (100.0%) |
| 65 to 74 Years | 51 (100.0%) | 30 (100.0%) |
| 75 Years and over | 0 (0.0%) | 12 (100.0%) |
| Total | 93 (100.0%) | 121 (100.0%) |
Income Below Poverty Among Married-Couple Families in Bobtown
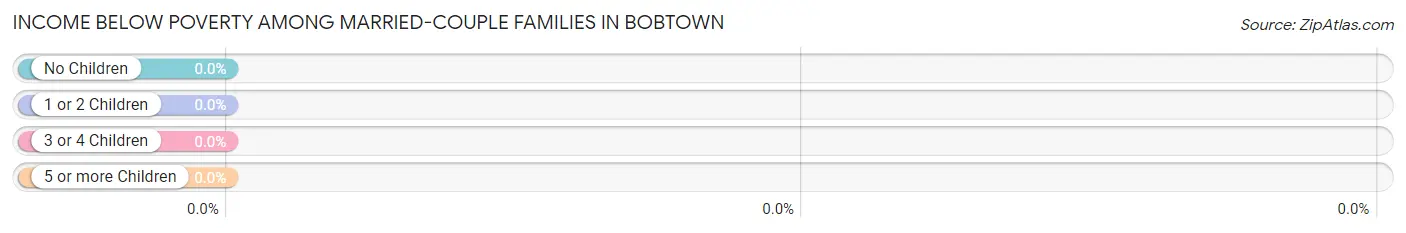
| Children | Above Poverty | Below Poverty |
| No Children | 88 (100.0%) | 0 (0.0%) |
| 1 or 2 Children | 0 (0.0%) | 0 (0.0%) |
| 3 or 4 Children | 0 (0.0%) | 0 (0.0%) |
| 5 or more Children | 0 (0.0%) | 0 (0.0%) |
| Total | 88 (100.0%) | 0 (0.0%) |
Income Below Poverty Among Single-Parent Households in Bobtown
| Children | Single Father | Single Mother |
| No Children | 0 (0.0%) | 0 (0.0%) |
| 1 or 2 Children | 0 (0.0%) | 0 (0.0%) |
| 3 or 4 Children | 0 (0.0%) | 0 (0.0%) |
| 5 or more Children | 0 (0.0%) | 0 (0.0%) |
| Total | 0 (0.0%) | 0 (0.0%) |
Income Below Poverty Among Married-Couple vs Single-Parent Households in Bobtown
| Children | Married-Couple Families | Single-Parent Households |
| No Children | 0 (0.0%) | 0 (0.0%) |
| 1 or 2 Children | 0 (0.0%) | 0 (0.0%) |
| 3 or 4 Children | 0 (0.0%) | 0 (0.0%) |
| 5 or more Children | 0 (0.0%) | 0 (0.0%) |
| Total | 0 (0.0%) | 0 (0.0%) |
Race in Bobtown
The most populous races in Bobtown are White / Caucasian (166 | 77.6%), and Asian (48 | 22.4%).
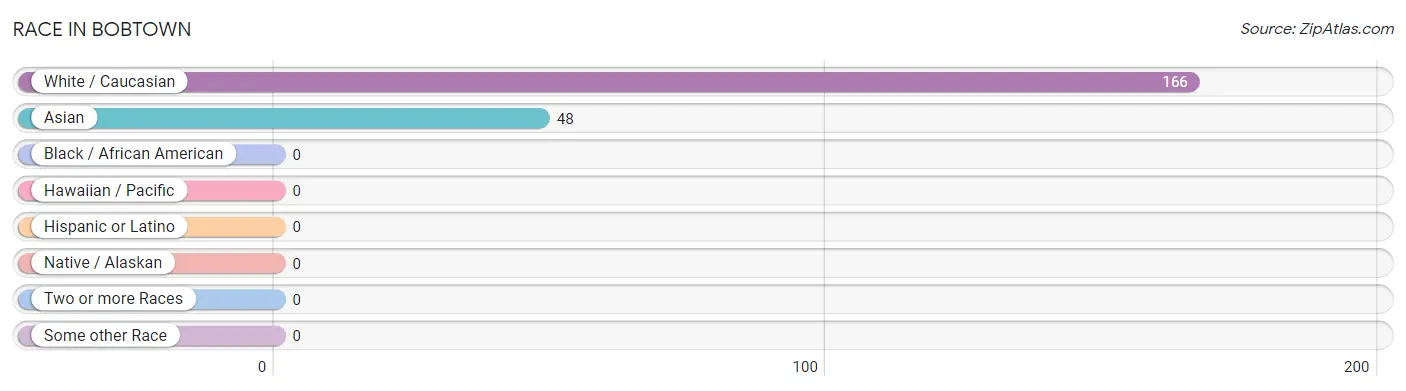
| Race | # Population | % Population |
| Asian | 48 | 22.4% |
| Black / African American | 0 | 0.0% |
| Hawaiian / Pacific | 0 | 0.0% |
| Hispanic or Latino | 0 | 0.0% |
| Native / Alaskan | 0 | 0.0% |
| White / Caucasian | 166 | 77.6% |
| Two or more Races | 0 | 0.0% |
| Some other Race | 0 | 0.0% |
| Total | 214 | 100.0% |
Ancestry in Bobtown
The most populous ancestries reported in Bobtown are American (102 | 47.7%), Korean (40 | 18.7%), German (32 | 14.9%), Irish (21 | 9.8%), and English (12 | 5.6%), together accounting for 96.7% of all Bobtown residents.
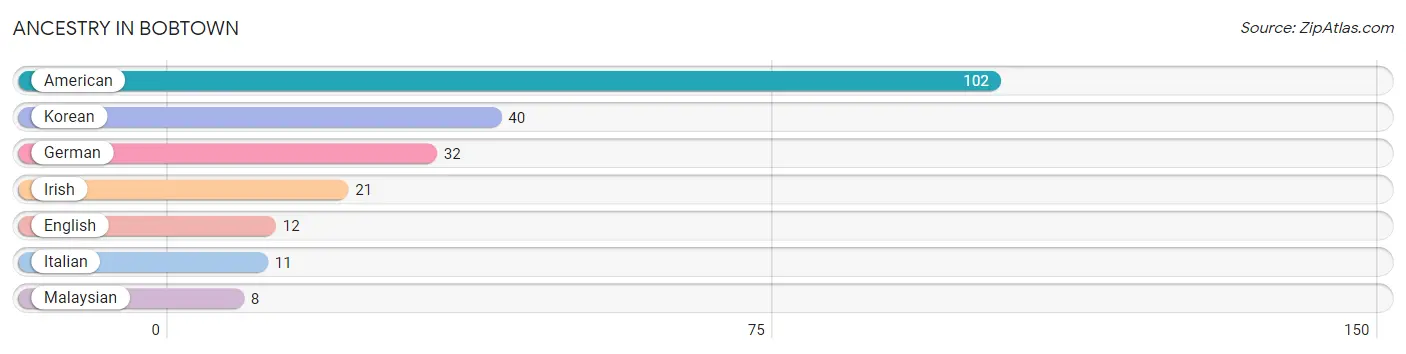
| Ancestry | # Population | % Population |
| American | 102 | 47.7% |
| English | 12 | 5.6% |
| German | 32 | 14.9% |
| Irish | 21 | 9.8% |
| Italian | 11 | 5.1% |
| Korean | 40 | 18.7% |
| Malaysian | 8 | 3.7% | View All 7 Rows |
Immigrants in Bobtown
The most numerous immigrant groups reported in Bobtown came from Asia (48 | 22.4%), South Eastern Asia (48 | 22.4%), Philippines (40 | 18.7%), and Laos (8 | 3.7%), together accounting for 67.3% of all Bobtown residents.
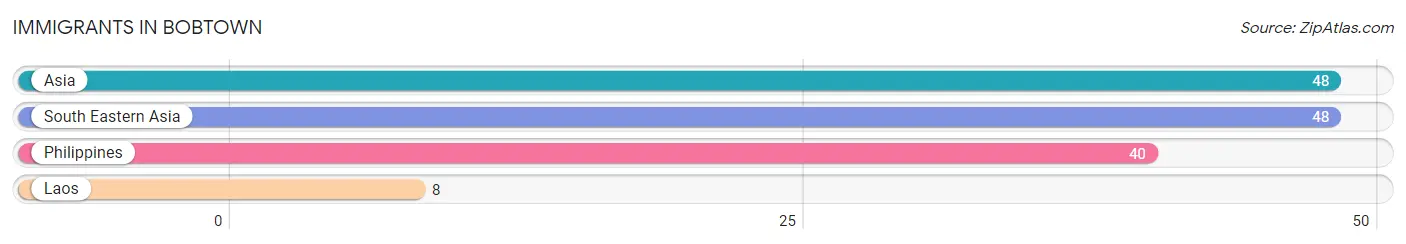
| Immigration Origin | # Population | % Population |
| Asia | 48 | 22.4% |
| Laos | 8 | 3.7% |
| Philippines | 40 | 18.7% |
| South Eastern Asia | 48 | 22.4% | View All 4 Rows |
Sex and Age in Bobtown
Sex and Age in Bobtown
The most populous age groups in Bobtown are 40 to 44 Years (42 | 45.2%) for men and 35 to 39 Years (37 | 30.6%) for women.
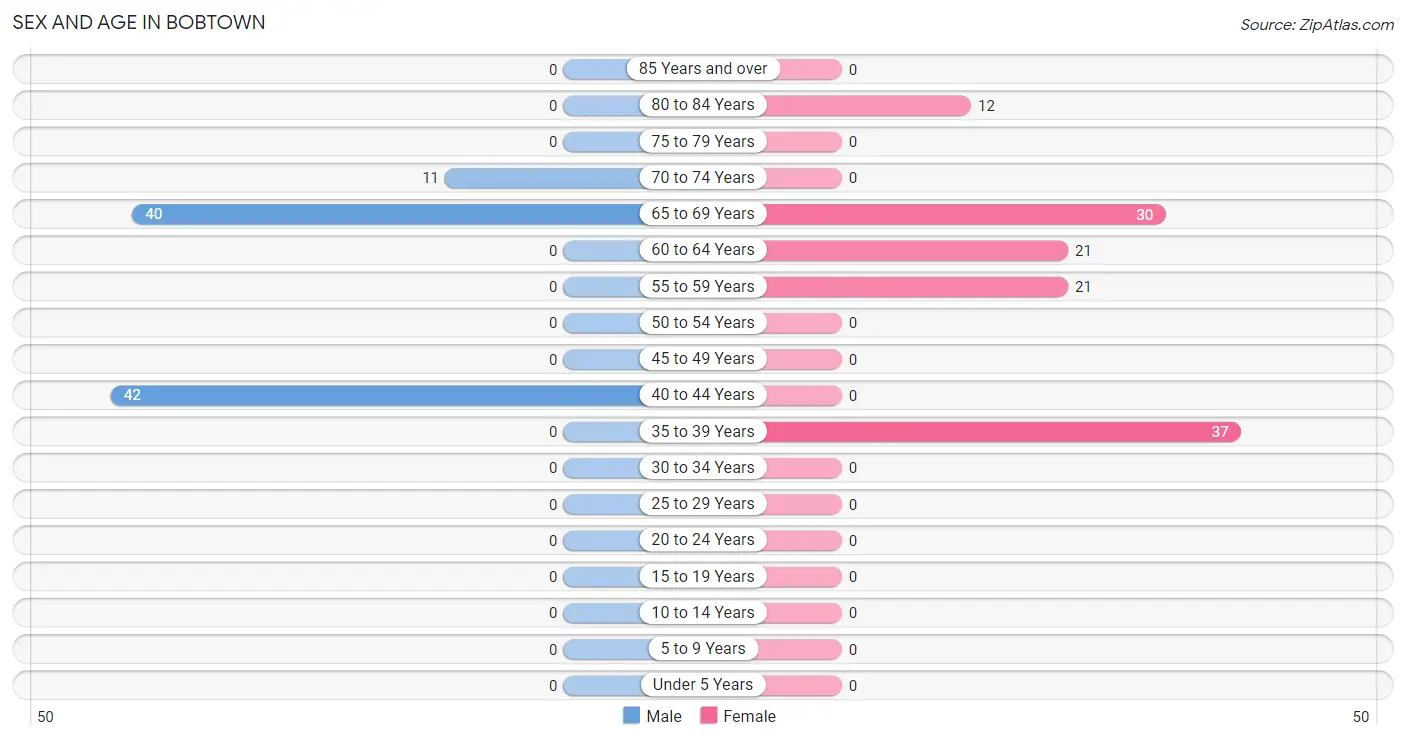
| Age Bracket | Male | Female |
| Under 5 Years | 0 (0.0%) | 0 (0.0%) |
| 5 to 9 Years | 0 (0.0%) | 0 (0.0%) |
| 10 to 14 Years | 0 (0.0%) | 0 (0.0%) |
| 15 to 19 Years | 0 (0.0%) | 0 (0.0%) |
| 20 to 24 Years | 0 (0.0%) | 0 (0.0%) |
| 25 to 29 Years | 0 (0.0%) | 0 (0.0%) |
| 30 to 34 Years | 0 (0.0%) | 0 (0.0%) |
| 35 to 39 Years | 0 (0.0%) | 37 (30.6%) |
| 40 to 44 Years | 42 (45.2%) | 0 (0.0%) |
| 45 to 49 Years | 0 (0.0%) | 0 (0.0%) |
| 50 to 54 Years | 0 (0.0%) | 0 (0.0%) |
| 55 to 59 Years | 0 (0.0%) | 21 (17.4%) |
| 60 to 64 Years | 0 (0.0%) | 21 (17.4%) |
| 65 to 69 Years | 40 (43.0%) | 30 (24.8%) |
| 70 to 74 Years | 11 (11.8%) | 0 (0.0%) |
| 75 to 79 Years | 0 (0.0%) | 0 (0.0%) |
| 80 to 84 Years | 0 (0.0%) | 12 (9.9%) |
| 85 Years and over | 0 (0.0%) | 0 (0.0%) |
| Total | 93 (100.0%) | 121 (100.0%) |
Families and Households in Bobtown
Median Family Size in Bobtown
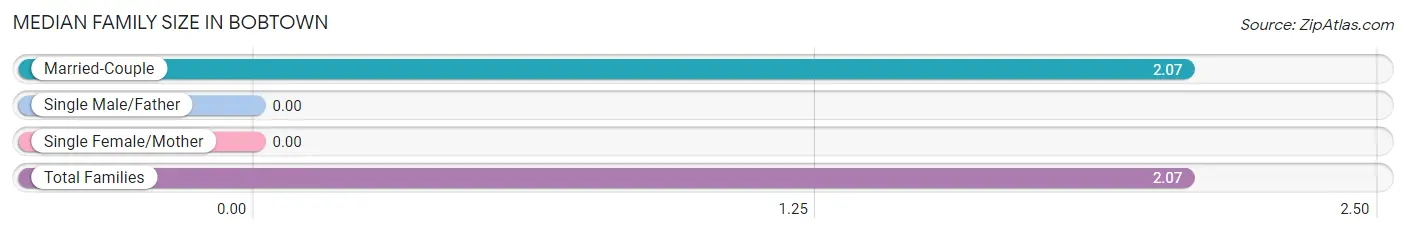
| Family Type | # Families | Family Size |
| Married-Couple | 88 (100.0%) | 2.07 |
| Single Male/Father | 0 (0.0%) | - |
| Single Female/Mother | 0 (0.0%) | - |
| Total Families | 88 (100.0%) | 2.07 |
Median Household Size in Bobtown
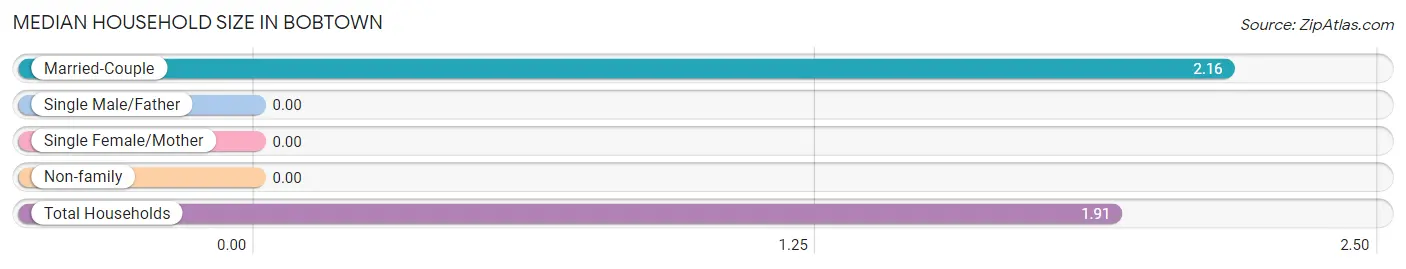
| Household Type | # Households | Household Size |
| Married-Couple | 88 (78.6%) | 2.16 |
| Single Male/Father | 0 (0.0%) | - |
| Single Female/Mother | 0 (0.0%) | - |
| Non-family | 24 (21.4%) | - |
| Total Households | 112 (100.0%) | 1.91 |
Household Size by Marriage Status in Bobtown
Out of a total of 112 households in Bobtown, 88 (78.6%) are family households, while 24 (21.4%) are nonfamily households. The most numerous type of family households are 2-person households, comprising 59, and the most common type of nonfamily households are 1-person households, comprising 24.
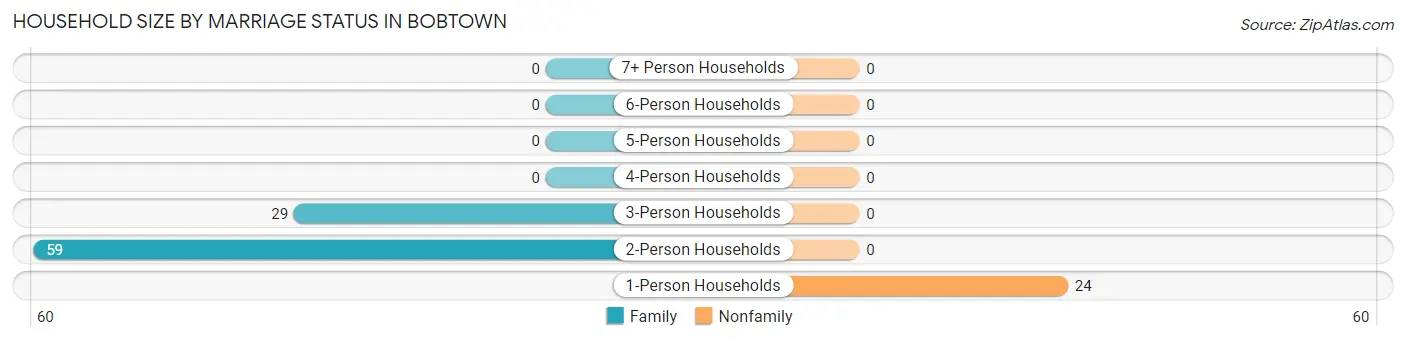
| Household Size | Family Households | Nonfamily Households |
| 1-Person Households | - | 24 (21.4%) |
| 2-Person Households | 59 (52.7%) | 0 (0.0%) |
| 3-Person Households | 29 (25.9%) | 0 (0.0%) |
| 4-Person Households | 0 (0.0%) | 0 (0.0%) |
| 5-Person Households | 0 (0.0%) | 0 (0.0%) |
| 6-Person Households | 0 (0.0%) | 0 (0.0%) |
| 7+ Person Households | 0 (0.0%) | 0 (0.0%) |
| Total | 88 (78.6%) | 24 (21.4%) |
Female Fertility in Bobtown
Fertility by Age in Bobtown
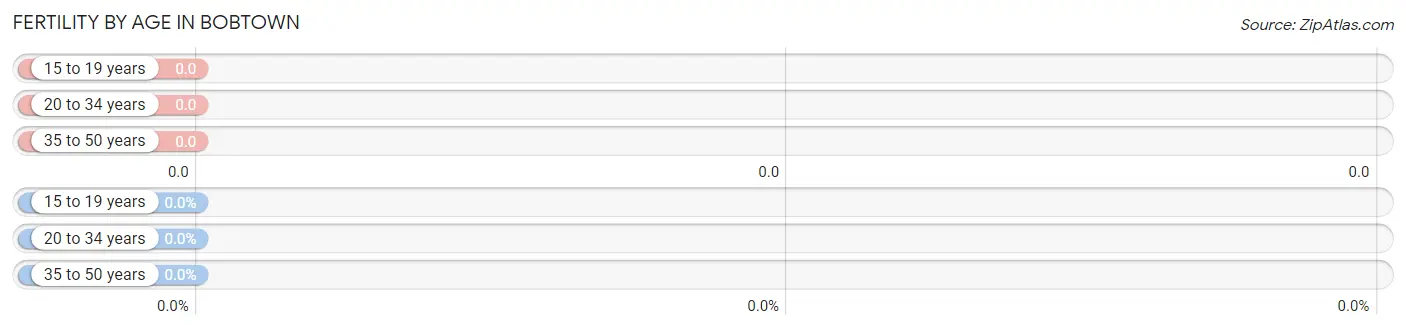
| Age Bracket | Women with Births | Births / 1,000 Women |
| 15 to 19 years | 0 (0.0%) | 0.0 |
| 20 to 34 years | 0 (0.0%) | 0.0 |
| 35 to 50 years | 0 (0.0%) | 0.0 |
| Total | 0 (0.0%) | 0.0 |
Fertility by Age by Marriage Status in Bobtown
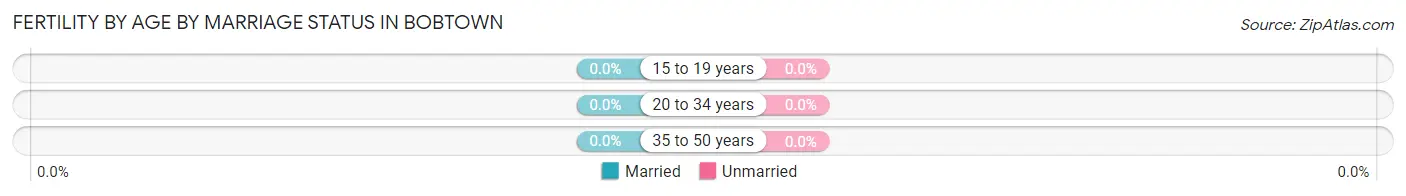
| Age Bracket | Married | Unmarried |
| 15 to 19 years | 0 (0.0%) | 0 (0.0%) |
| 20 to 34 years | 0 (0.0%) | 0 (0.0%) |
| 35 to 50 years | 0 (0.0%) | 0 (0.0%) |
| Total | 0 (0.0%) | 0 (0.0%) |
Fertility by Education in Bobtown
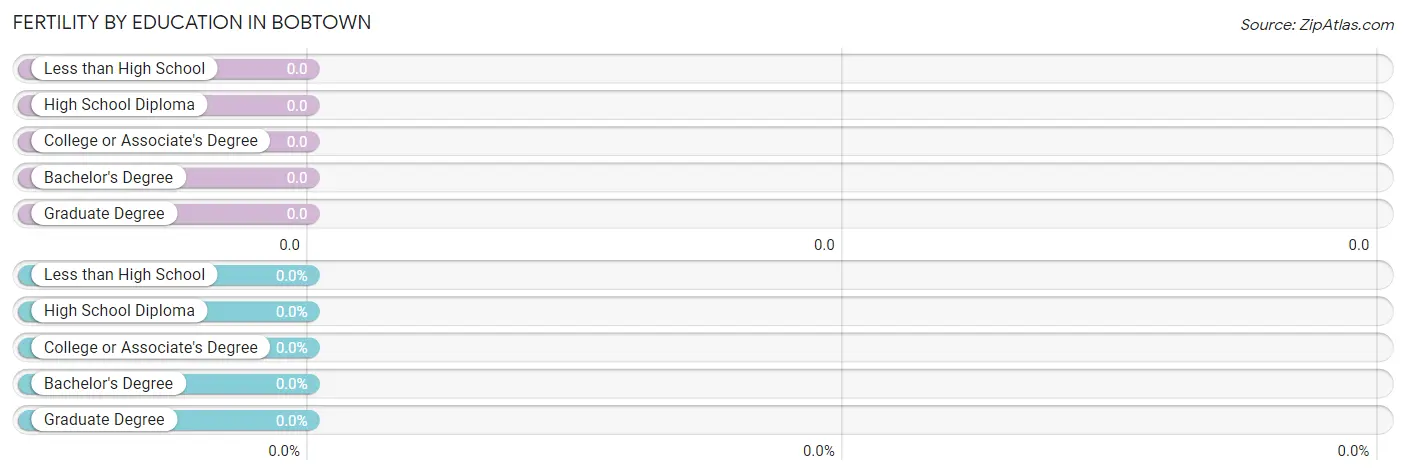
| Educational Attainment | Women with Births | Births / 1,000 Women |
| Less than High School | 0 (0.0%) | 0.0 |
| High School Diploma | 0 (0.0%) | 0.0 |
| College or Associate's Degree | 0 (0.0%) | 0.0 |
| Bachelor's Degree | 0 (0.0%) | 0.0 |
| Graduate Degree | 0 (0.0%) | 0.0 |
| Total | 0 (0.0%) | 0.0 |
Fertility by Education by Marriage Status in Bobtown
| Educational Attainment | Married | Unmarried |
| Less than High School | 0 (0.0%) | 0 (0.0%) |
| High School Diploma | 0 (0.0%) | 0 (0.0%) |
| College or Associate's Degree | 0 (0.0%) | 0 (0.0%) |
| Bachelor's Degree | 0 (0.0%) | 0 (0.0%) |
| Graduate Degree | 0 (0.0%) | 0 (0.0%) |
| Total | 0 (0.0%) | 0 (0.0%) |
Employment Characteristics in Bobtown
Employment by Class of Employer in Bobtown
Among the 91 employed individuals in Bobtown, private company employees (79 | 86.8%), and not-for-profit organizations (12 | 13.2%) make up the most common classes of employment.
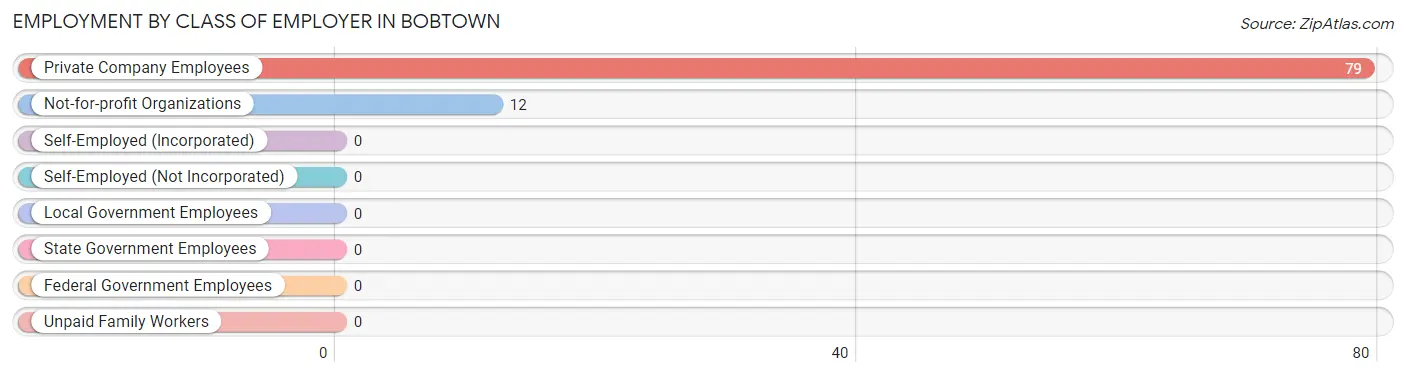
| Employer Class | # Employees | % Employees |
| Private Company Employees | 79 | 86.8% |
| Self-Employed (Incorporated) | 0 | 0.0% |
| Self-Employed (Not Incorporated) | 0 | 0.0% |
| Not-for-profit Organizations | 12 | 13.2% |
| Local Government Employees | 0 | 0.0% |
| State Government Employees | 0 | 0.0% |
| Federal Government Employees | 0 | 0.0% |
| Unpaid Family Workers | 0 | 0.0% |
| Total | 91 | 100.0% |
Employment Status by Age in Bobtown
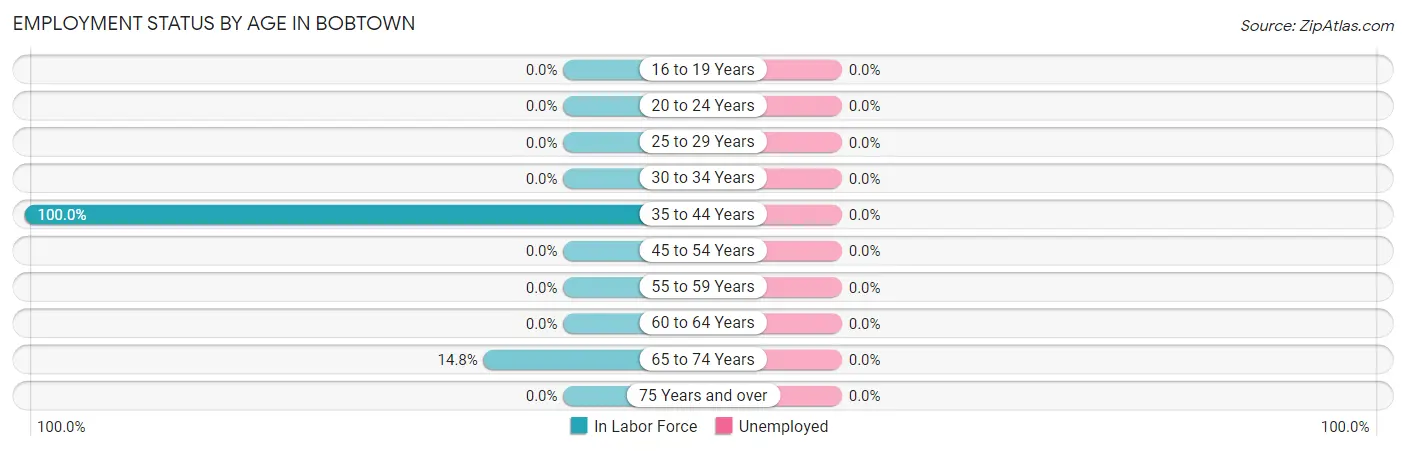
| Age Bracket | In Labor Force | Unemployed |
| 16 to 19 Years | 0 (0.0%) | 0 (0.0%) |
| 20 to 24 Years | 0 (0.0%) | 0 (0.0%) |
| 25 to 29 Years | 0 (0.0%) | 0 (0.0%) |
| 30 to 34 Years | 0 (0.0%) | 0 (0.0%) |
| 35 to 44 Years | 79 (100.0%) | 0 (0.0%) |
| 45 to 54 Years | 0 (0.0%) | 0 (0.0%) |
| 55 to 59 Years | 0 (0.0%) | 0 (0.0%) |
| 60 to 64 Years | 0 (0.0%) | 0 (0.0%) |
| 65 to 74 Years | 12 (14.8%) | 0 (0.0%) |
| 75 Years and over | 0 (0.0%) | 0 (0.0%) |
| Total | 91 (42.5%) | 0 (0.0%) |
Employment Status by Educational Attainment in Bobtown
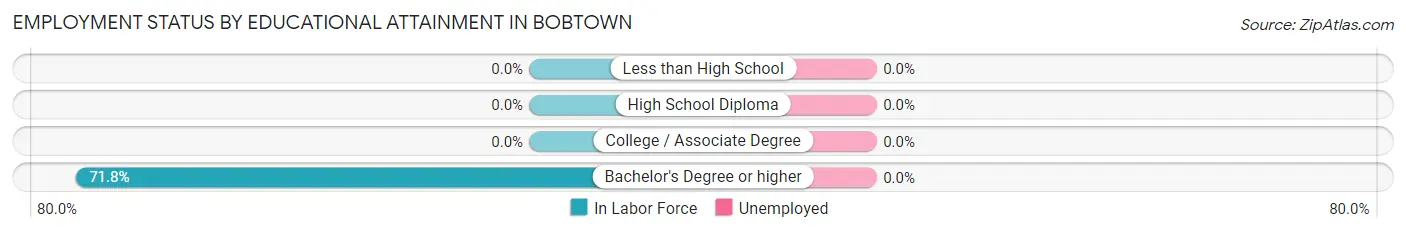
| Educational Attainment | In Labor Force | Unemployed |
| Less than High School | 0 (0.0%) | 0 (0.0%) |
| High School Diploma | 0 (0.0%) | 0 (0.0%) |
| College / Associate Degree | 0 (0.0%) | 0 (0.0%) |
| Bachelor's Degree or higher | 79 (71.8%) | 0 (0.0%) |
| Total | 79 (65.3%) | 0 (0.0%) |
Employment Occupations by Sex in Bobtown
Management, Business, Science and Arts Occupations
The most common Management, Business, Science and Arts occupations in Bobtown are , and Business & Financial (79 | 86.8%).
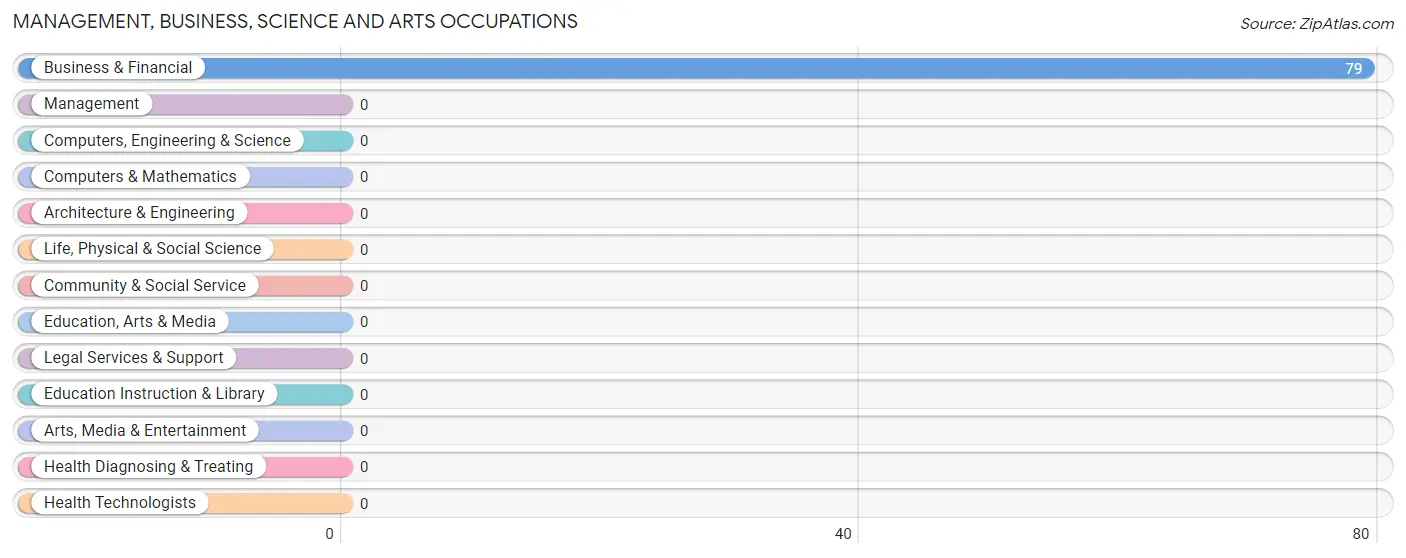
Management, Business, Science and Arts Occupations by Sex
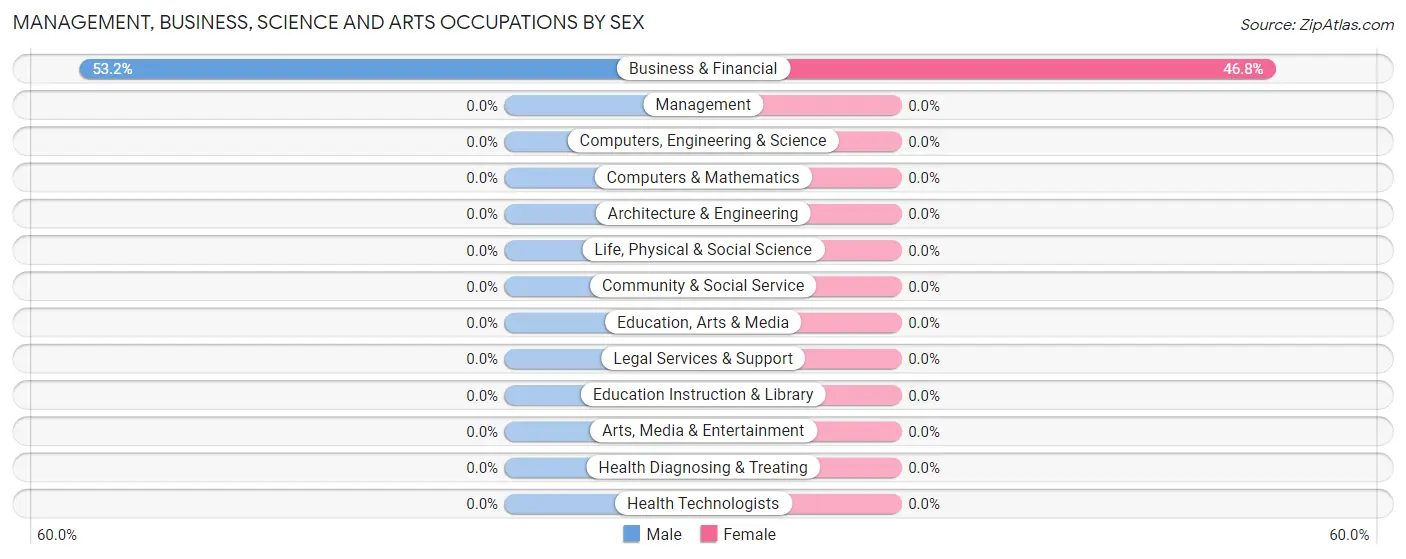
| Occupation | Male | Female |
| Management | 0 (0.0%) | 0 (0.0%) |
| Business & Financial | 42 (53.2%) | 37 (46.8%) |
| Computers, Engineering & Science | 0 (0.0%) | 0 (0.0%) |
| Computers & Mathematics | 0 (0.0%) | 0 (0.0%) |
| Architecture & Engineering | 0 (0.0%) | 0 (0.0%) |
| Life, Physical & Social Science | 0 (0.0%) | 0 (0.0%) |
| Community & Social Service | 0 (0.0%) | 0 (0.0%) |
| Education, Arts & Media | 0 (0.0%) | 0 (0.0%) |
| Legal Services & Support | 0 (0.0%) | 0 (0.0%) |
| Education Instruction & Library | 0 (0.0%) | 0 (0.0%) |
| Arts, Media & Entertainment | 0 (0.0%) | 0 (0.0%) |
| Health Diagnosing & Treating | 0 (0.0%) | 0 (0.0%) |
| Health Technologists | 0 (0.0%) | 0 (0.0%) |
| Total (Category) | 42 (53.2%) | 37 (46.8%) |
| Total (Overall) | 54 (59.3%) | 37 (40.7%) |
Services Occupations
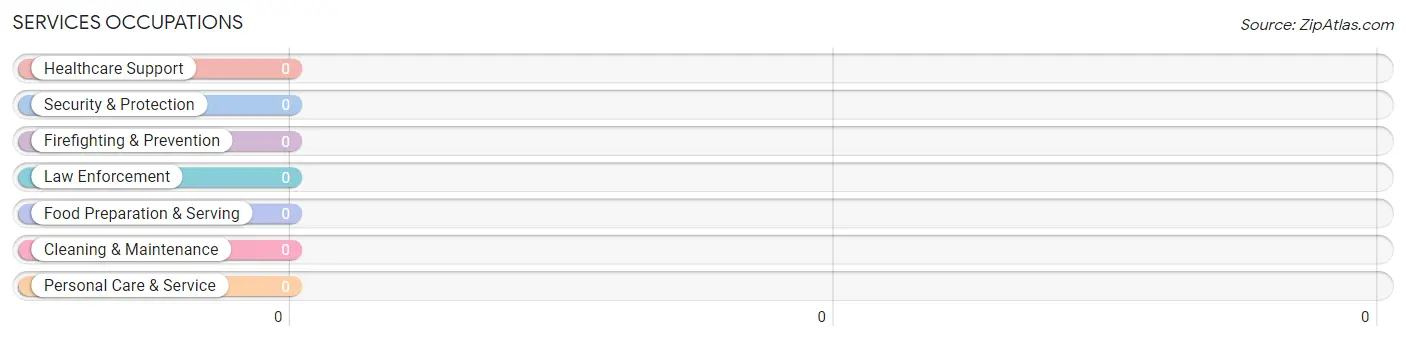
Services Occupations by Sex
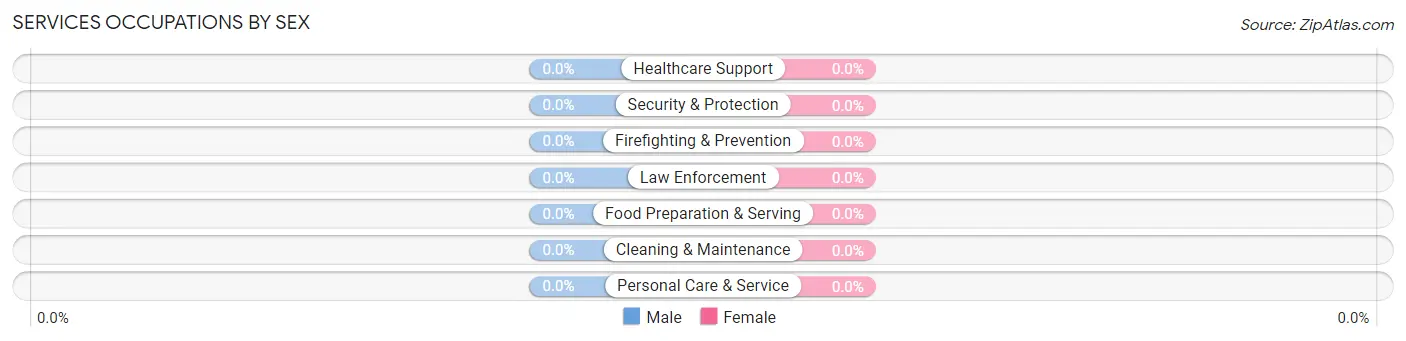
| Occupation | Male | Female |
| Healthcare Support | 0 (0.0%) | 0 (0.0%) |
| Security & Protection | 0 (0.0%) | 0 (0.0%) |
| Firefighting & Prevention | 0 (0.0%) | 0 (0.0%) |
| Law Enforcement | 0 (0.0%) | 0 (0.0%) |
| Food Preparation & Serving | 0 (0.0%) | 0 (0.0%) |
| Cleaning & Maintenance | 0 (0.0%) | 0 (0.0%) |
| Personal Care & Service | 0 (0.0%) | 0 (0.0%) |
| Total (Category) | 0 (0.0%) | 0 (0.0%) |
| Total (Overall) | 54 (59.3%) | 37 (40.7%) |
Sales and Office Occupations
Sales and Office Occupations by Sex
| Occupation | Male | Female |
| Sales & Related | 0 (0.0%) | 0 (0.0%) |
| Office & Administration | 0 (0.0%) | 0 (0.0%) |
| Total (Category) | 0 (0.0%) | 0 (0.0%) |
| Total (Overall) | 54 (59.3%) | 37 (40.7%) |
Natural Resources, Construction and Maintenance Occupations
The most common Natural Resources, Construction and Maintenance occupations in Bobtown are , and Installation, Maintenance & Repair (12 | 13.2%).
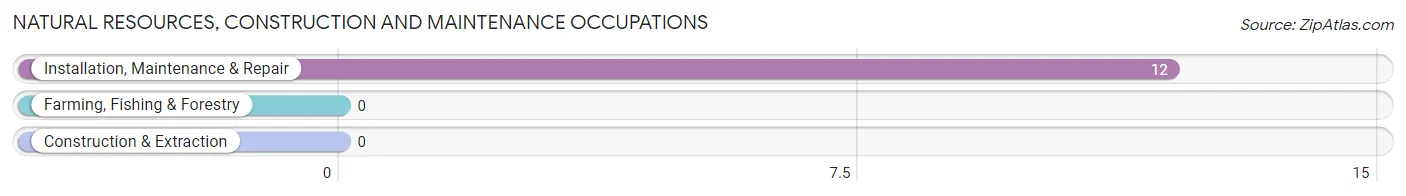
Natural Resources, Construction and Maintenance Occupations by Sex
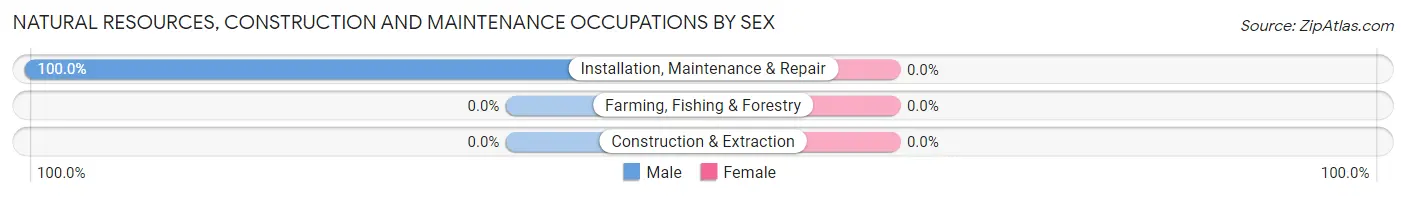
| Occupation | Male | Female |
| Farming, Fishing & Forestry | 0 (0.0%) | 0 (0.0%) |
| Construction & Extraction | 0 (0.0%) | 0 (0.0%) |
| Installation, Maintenance & Repair | 12 (100.0%) | 0 (0.0%) |
| Total (Category) | 12 (100.0%) | 0 (0.0%) |
| Total (Overall) | 54 (59.3%) | 37 (40.7%) |
Production, Transportation and Moving Occupations
Production, Transportation and Moving Occupations by Sex
| Occupation | Male | Female |
| Production | 0 (0.0%) | 0 (0.0%) |
| Transportation | 0 (0.0%) | 0 (0.0%) |
| Material Moving | 0 (0.0%) | 0 (0.0%) |
| Total (Category) | 0 (0.0%) | 0 (0.0%) |
| Total (Overall) | 54 (59.3%) | 37 (40.7%) |
Employment Industries by Sex in Bobtown
Employment Industries in Bobtown
The major employment industries in Bobtown include Professional & Scientific (42 | 46.2%), Finance & Insurance (37 | 40.7%), and Health Care & Social Assistance (12 | 13.2%).
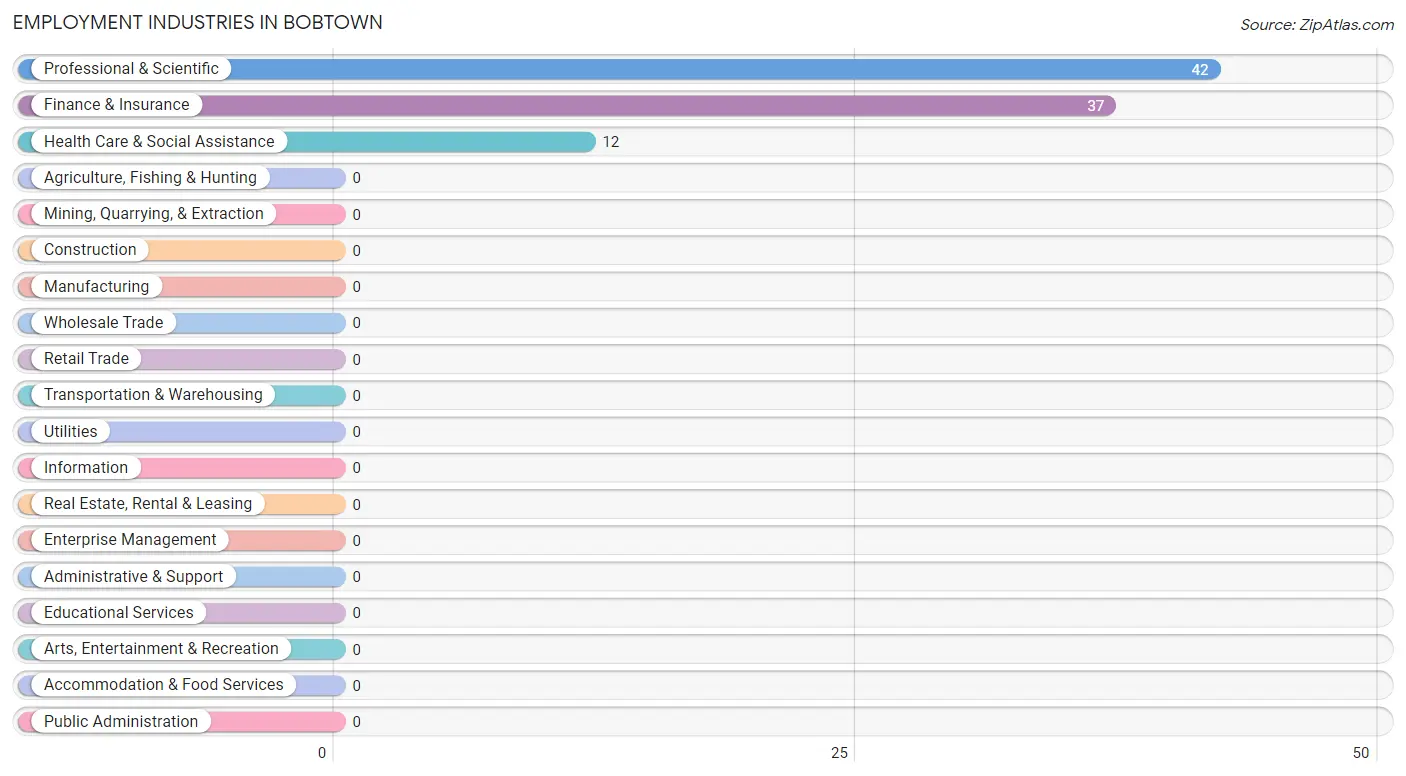
Employment Industries by Sex in Bobtown
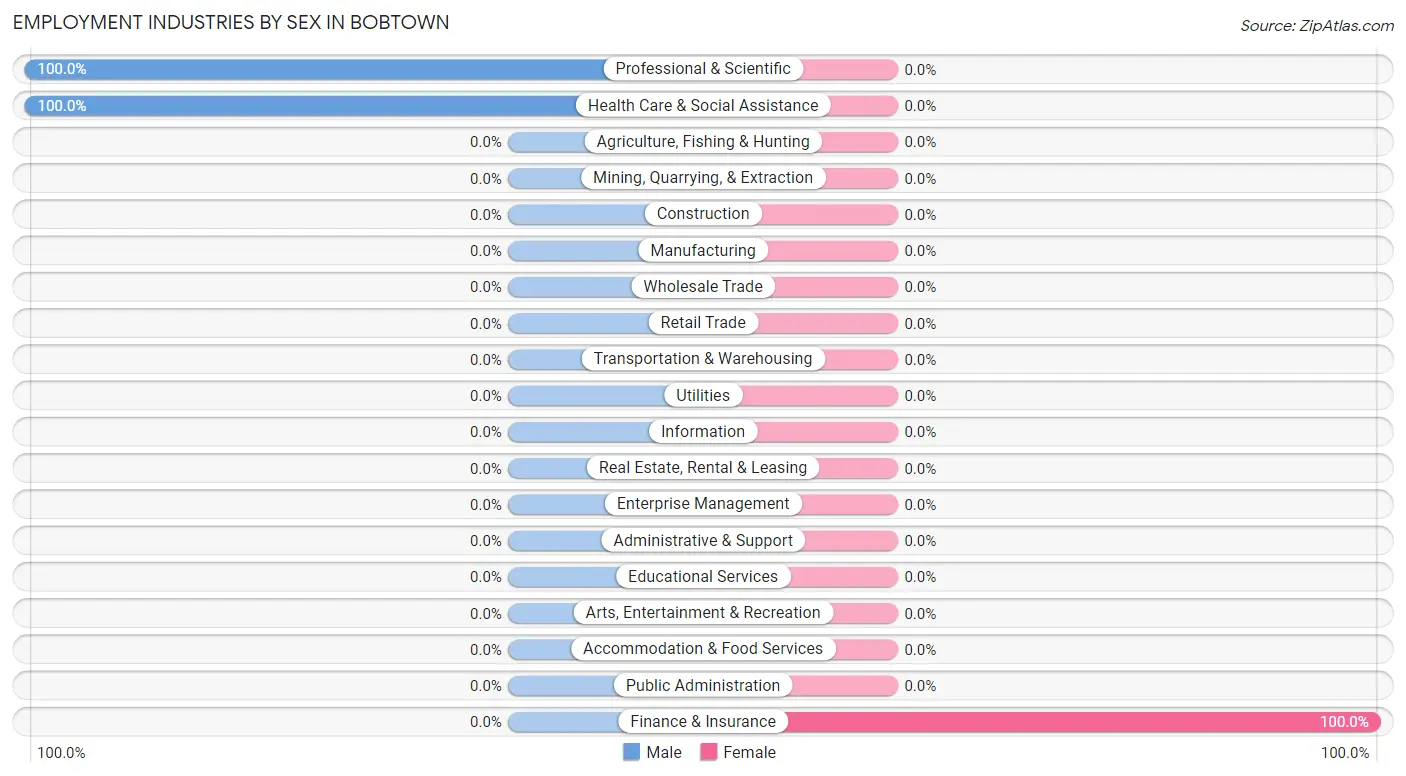
| Industry | Male | Female |
| Agriculture, Fishing & Hunting | 0 (0.0%) | 0 (0.0%) |
| Mining, Quarrying, & Extraction | 0 (0.0%) | 0 (0.0%) |
| Construction | 0 (0.0%) | 0 (0.0%) |
| Manufacturing | 0 (0.0%) | 0 (0.0%) |
| Wholesale Trade | 0 (0.0%) | 0 (0.0%) |
| Retail Trade | 0 (0.0%) | 0 (0.0%) |
| Transportation & Warehousing | 0 (0.0%) | 0 (0.0%) |
| Utilities | 0 (0.0%) | 0 (0.0%) |
| Information | 0 (0.0%) | 0 (0.0%) |
| Finance & Insurance | 0 (0.0%) | 37 (100.0%) |
| Real Estate, Rental & Leasing | 0 (0.0%) | 0 (0.0%) |
| Professional & Scientific | 42 (100.0%) | 0 (0.0%) |
| Enterprise Management | 0 (0.0%) | 0 (0.0%) |
| Administrative & Support | 0 (0.0%) | 0 (0.0%) |
| Educational Services | 0 (0.0%) | 0 (0.0%) |
| Health Care & Social Assistance | 12 (100.0%) | 0 (0.0%) |
| Arts, Entertainment & Recreation | 0 (0.0%) | 0 (0.0%) |
| Accommodation & Food Services | 0 (0.0%) | 0 (0.0%) |
| Public Administration | 0 (0.0%) | 0 (0.0%) |
| Total | 54 (59.3%) | 37 (40.7%) |
Education in Bobtown
School Enrollment in Bobtown
| School Level | # Students | % Students |
| Nursery / Preschool | 0 | 0.0% |
| Kindergarten | 0 | 0.0% |
| Elementary School | 0 | 0.0% |
| Middle School | 0 | 0.0% |
| High School | 0 | 0.0% |
| College / Undergraduate | 0 | 0.0% |
| Graduate / Professional | 0 | 0.0% |
| Total | 0 | 0.0% |
School Enrollment by Age by Funding Source in Bobtown
| Age Bracket | Public School | Private School |
| 3 to 4 Year Olds | 0 (0.0%) | 0 (0.0%) |
| 5 to 9 Year Old | 0 (0.0%) | 0 (0.0%) |
| 10 to 14 Year Olds | 0 (0.0%) | 0 (0.0%) |
| 15 to 17 Year Olds | 0 (0.0%) | 0 (0.0%) |
| 18 to 19 Year Olds | 0 (0.0%) | 0 (0.0%) |
| 20 to 24 Year Olds | 0 (0.0%) | 0 (0.0%) |
| 25 to 34 Year Olds | 0 (0.0%) | 0 (0.0%) |
| 35 Years and over | 0 (0.0%) | 0 (0.0%) |
| Total | 0 (0.0%) | 0 (0.0%) |
Educational Attainment by Field of Study in Bobtown
Business (77 | 40.3%), social sciences (42 | 22.0%), education (20 | 10.5%), liberal arts & history (17 | 8.9%), and computers & mathematics (12 | 6.3%) are the most common fields of study among 191 individuals in Bobtown who have obtained a bachelor's degree or higher.
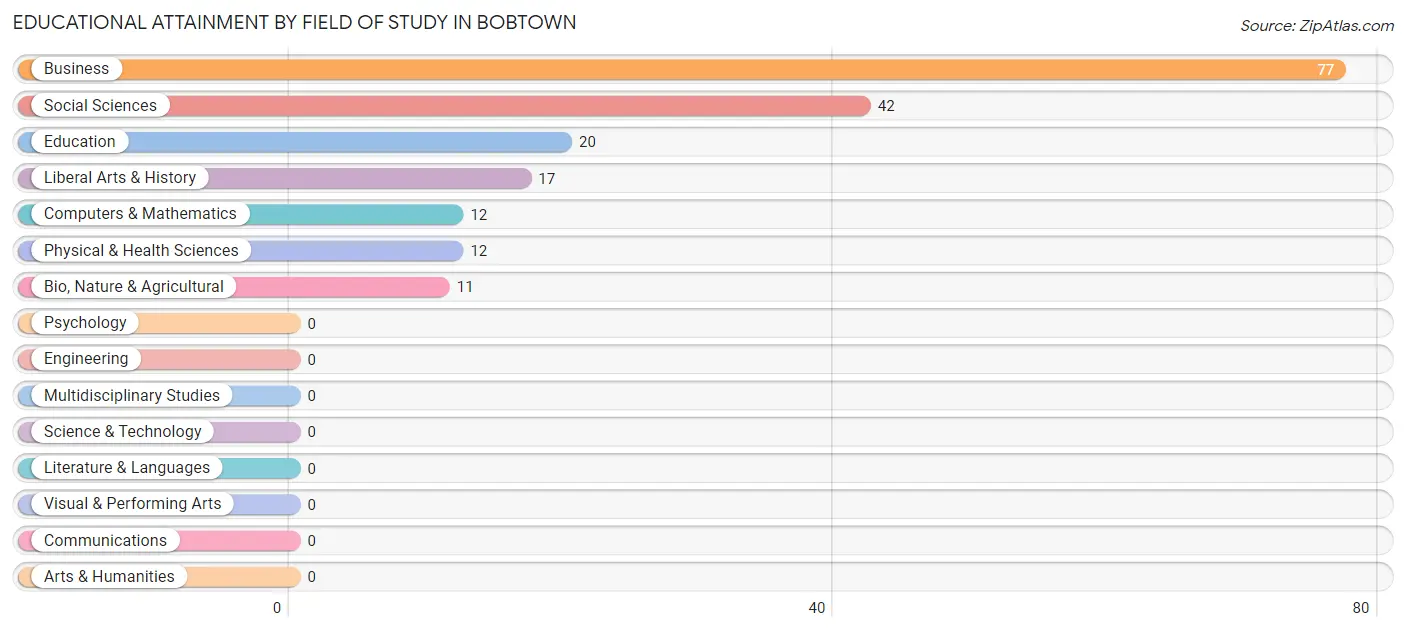
| Field of Study | # Graduates | % Graduates |
| Computers & Mathematics | 12 | 6.3% |
| Bio, Nature & Agricultural | 11 | 5.8% |
| Physical & Health Sciences | 12 | 6.3% |
| Psychology | 0 | 0.0% |
| Social Sciences | 42 | 22.0% |
| Engineering | 0 | 0.0% |
| Multidisciplinary Studies | 0 | 0.0% |
| Science & Technology | 0 | 0.0% |
| Business | 77 | 40.3% |
| Education | 20 | 10.5% |
| Literature & Languages | 0 | 0.0% |
| Liberal Arts & History | 17 | 8.9% |
| Visual & Performing Arts | 0 | 0.0% |
| Communications | 0 | 0.0% |
| Arts & Humanities | 0 | 0.0% |
| Total | 191 | 100.0% |
Transportation & Commute in Bobtown
Vehicle Availability by Sex in Bobtown
The most prevalent vehicle ownership categories in Bobtown are males with 2 vehicles (42, accounting for 77.8%) and females with 2 vehicles (37, making up 113.5%).
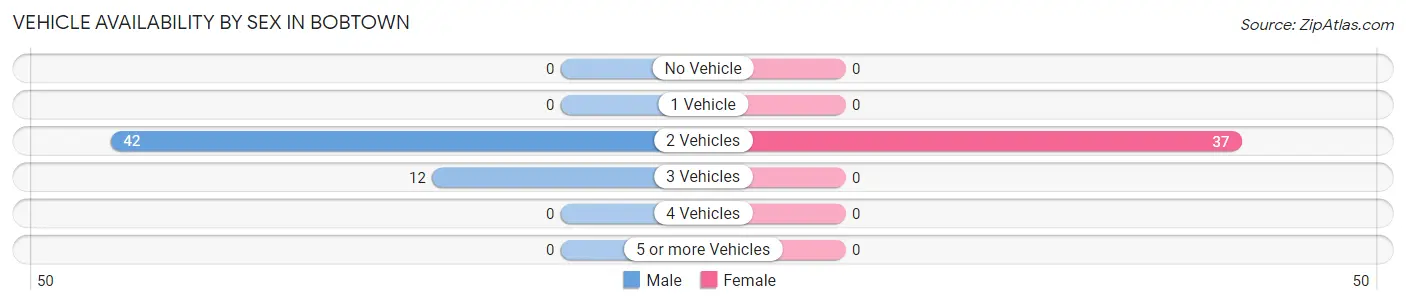
| Vehicles Available | Male | Female |
| No Vehicle | 0 (0.0%) | 0 (0.0%) |
| 1 Vehicle | 0 (0.0%) | 0 (0.0%) |
| 2 Vehicles | 42 (77.8%) | 37 (100.0%) |
| 3 Vehicles | 12 (22.2%) | 0 (0.0%) |
| 4 Vehicles | 0 (0.0%) | 0 (0.0%) |
| 5 or more Vehicles | 0 (0.0%) | 0 (0.0%) |
| Total | 54 (100.0%) | 37 (100.0%) |
Commute Time in Bobtown
The most frequently occuring commute durations in Bobtown are 40 to 44 minutes (49 commuters, 53.8%), 5 to 9 minutes (42 commuters, 46.2%), and less than 5 minutes (0 commuters, 0.0%).
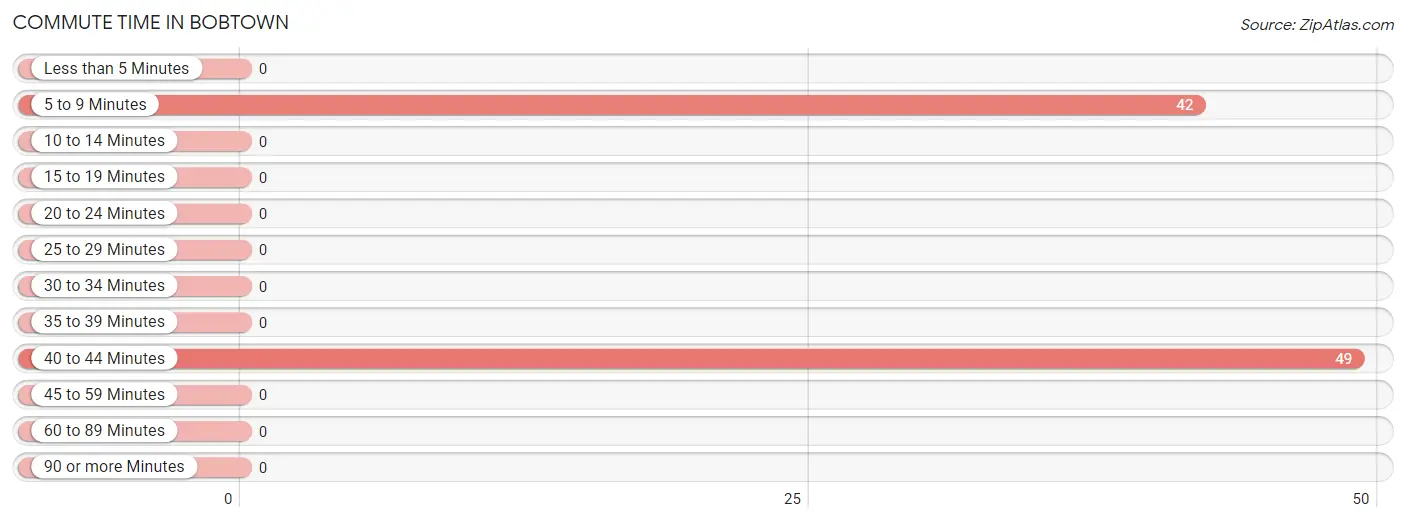
| Commute Time | # Commuters | % Commuters |
| Less than 5 Minutes | 0 | 0.0% |
| 5 to 9 Minutes | 42 | 46.2% |
| 10 to 14 Minutes | 0 | 0.0% |
| 15 to 19 Minutes | 0 | 0.0% |
| 20 to 24 Minutes | 0 | 0.0% |
| 25 to 29 Minutes | 0 | 0.0% |
| 30 to 34 Minutes | 0 | 0.0% |
| 35 to 39 Minutes | 0 | 0.0% |
| 40 to 44 Minutes | 49 | 53.8% |
| 45 to 59 Minutes | 0 | 0.0% |
| 60 to 89 Minutes | 0 | 0.0% |
| 90 or more Minutes | 0 | 0.0% |
Commute Time by Sex in Bobtown
The most common commute times in Bobtown are 5 to 9 minutes (42 commuters, 77.8%) for males and 40 to 44 minutes (37 commuters, 100.0%) for females.
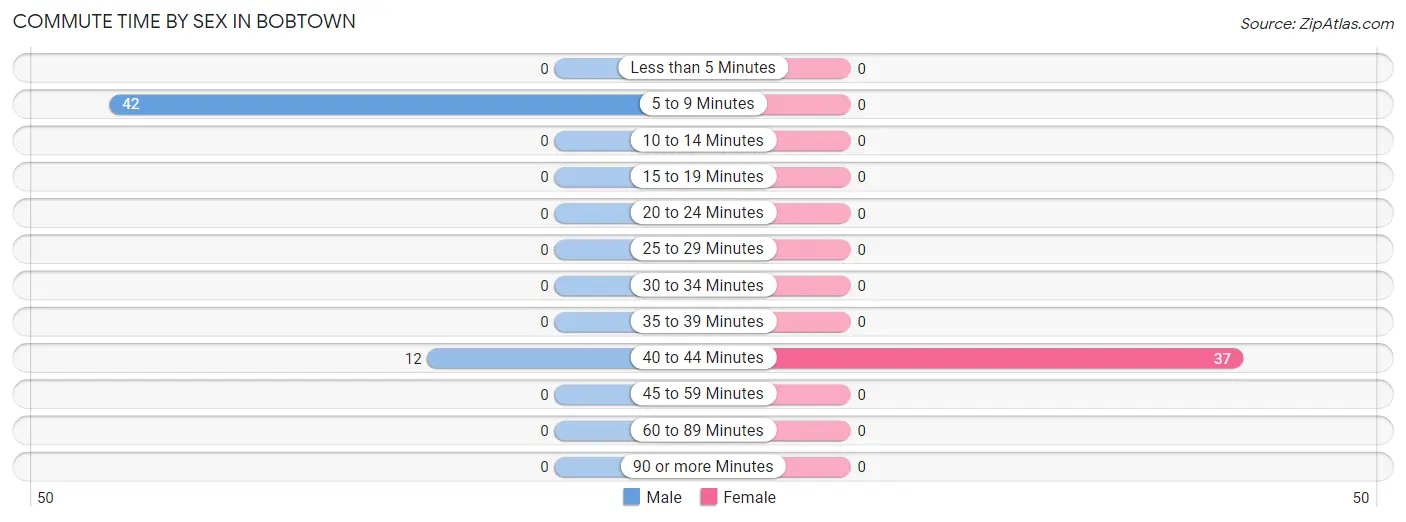
| Commute Time | Male | Female |
| Less than 5 Minutes | 0 (0.0%) | 0 (0.0%) |
| 5 to 9 Minutes | 42 (77.8%) | 0 (0.0%) |
| 10 to 14 Minutes | 0 (0.0%) | 0 (0.0%) |
| 15 to 19 Minutes | 0 (0.0%) | 0 (0.0%) |
| 20 to 24 Minutes | 0 (0.0%) | 0 (0.0%) |
| 25 to 29 Minutes | 0 (0.0%) | 0 (0.0%) |
| 30 to 34 Minutes | 0 (0.0%) | 0 (0.0%) |
| 35 to 39 Minutes | 0 (0.0%) | 0 (0.0%) |
| 40 to 44 Minutes | 12 (22.2%) | 37 (100.0%) |
| 45 to 59 Minutes | 0 (0.0%) | 0 (0.0%) |
| 60 to 89 Minutes | 0 (0.0%) | 0 (0.0%) |
| 90 or more Minutes | 0 (0.0%) | 0 (0.0%) |
Time of Departure to Work by Sex in Bobtown
The most frequent times of departure to work in Bobtown are 7:00 AM to 7:29 AM (54, 100.0%) for males and 8:00 AM to 8:29 AM (37, 100.0%) for females.
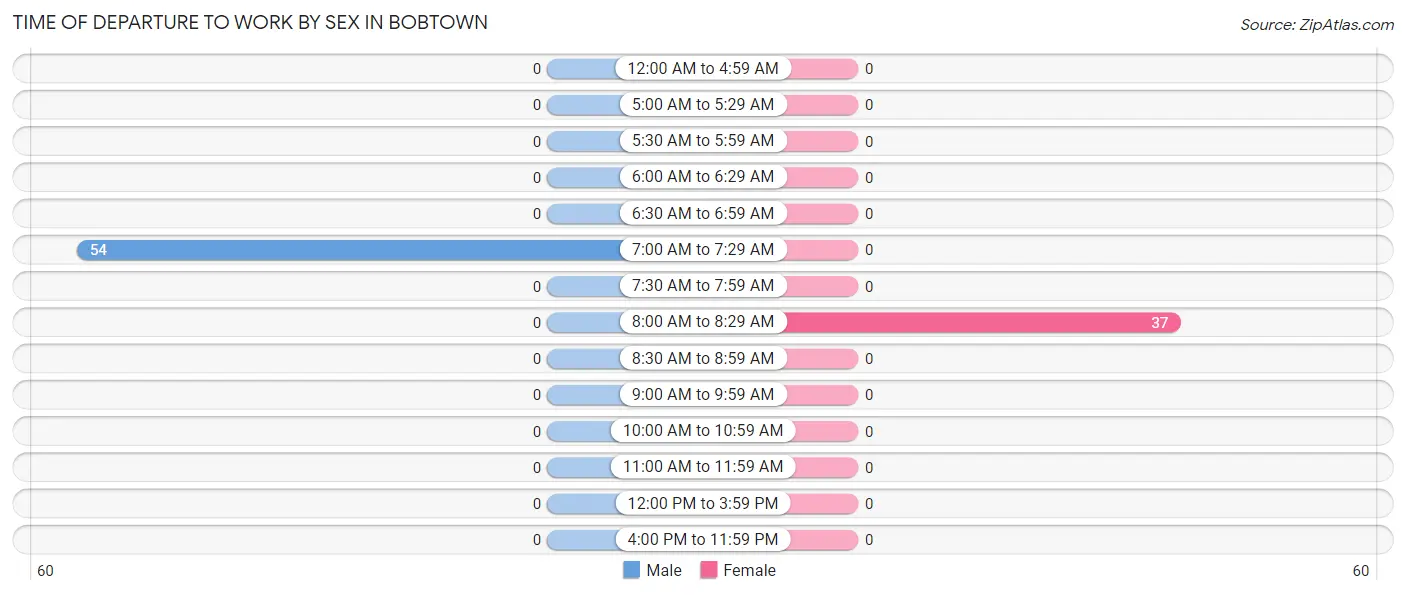
| Time of Departure | Male | Female |
| 12:00 AM to 4:59 AM | 0 (0.0%) | 0 (0.0%) |
| 5:00 AM to 5:29 AM | 0 (0.0%) | 0 (0.0%) |
| 5:30 AM to 5:59 AM | 0 (0.0%) | 0 (0.0%) |
| 6:00 AM to 6:29 AM | 0 (0.0%) | 0 (0.0%) |
| 6:30 AM to 6:59 AM | 0 (0.0%) | 0 (0.0%) |
| 7:00 AM to 7:29 AM | 54 (100.0%) | 0 (0.0%) |
| 7:30 AM to 7:59 AM | 0 (0.0%) | 0 (0.0%) |
| 8:00 AM to 8:29 AM | 0 (0.0%) | 37 (100.0%) |
| 8:30 AM to 8:59 AM | 0 (0.0%) | 0 (0.0%) |
| 9:00 AM to 9:59 AM | 0 (0.0%) | 0 (0.0%) |
| 10:00 AM to 10:59 AM | 0 (0.0%) | 0 (0.0%) |
| 11:00 AM to 11:59 AM | 0 (0.0%) | 0 (0.0%) |
| 12:00 PM to 3:59 PM | 0 (0.0%) | 0 (0.0%) |
| 4:00 PM to 11:59 PM | 0 (0.0%) | 0 (0.0%) |
| Total | 54 (100.0%) | 37 (100.0%) |
Housing Occupancy in Bobtown
Occupancy by Ownership in Bobtown
Of the total 112 dwellings in Bobtown, owner-occupied units account for 95 (84.8%), while renter-occupied units make up 17 (15.2%).
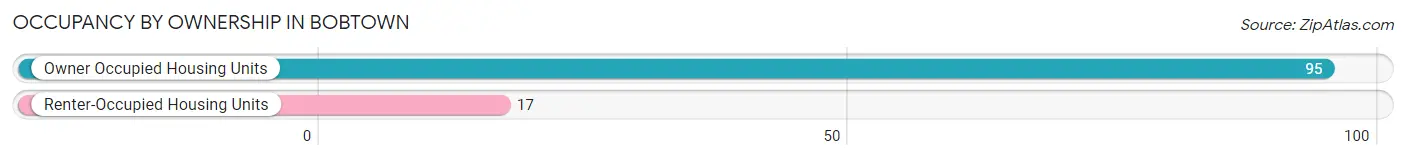
| Occupancy | # Housing Units | % Housing Units |
| Owner Occupied Housing Units | 95 | 84.8% |
| Renter-Occupied Housing Units | 17 | 15.2% |
| Total Occupied Housing Units | 112 | 100.0% |
Occupancy by Household Size in Bobtown
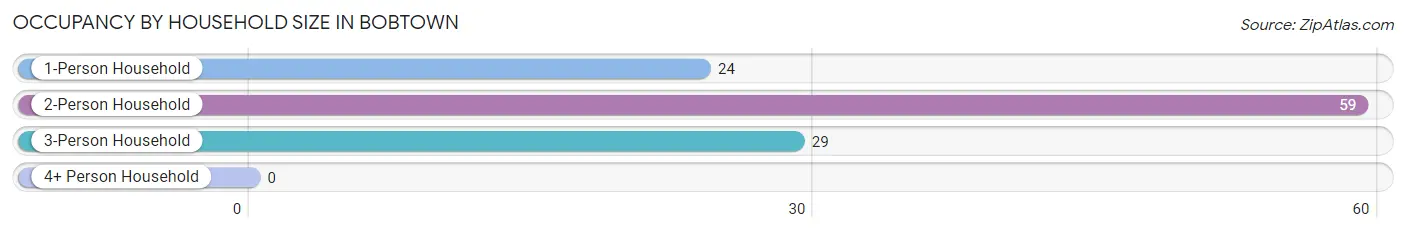
| Household Size | # Housing Units | % Housing Units |
| 1-Person Household | 24 | 21.4% |
| 2-Person Household | 59 | 52.7% |
| 3-Person Household | 29 | 25.9% |
| 4+ Person Household | 0 | 0.0% |
| Total Housing Units | 112 | 100.0% |
Occupancy by Ownership by Household Size in Bobtown
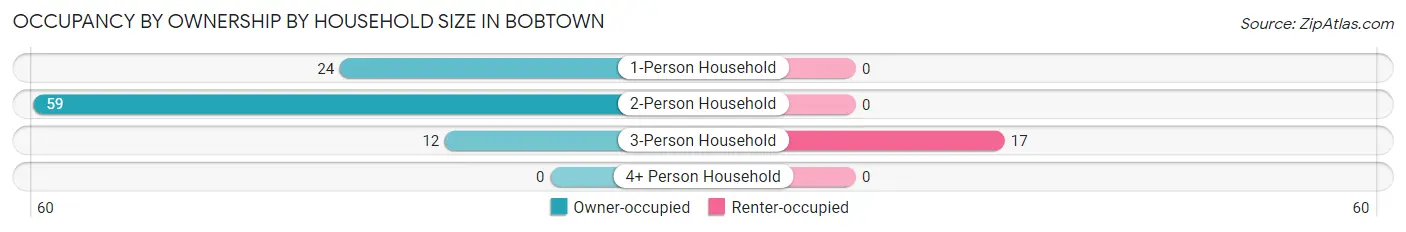
| Household Size | Owner-occupied | Renter-occupied |
| 1-Person Household | 24 (100.0%) | 0 (0.0%) |
| 2-Person Household | 59 (100.0%) | 0 (0.0%) |
| 3-Person Household | 12 (41.4%) | 17 (58.6%) |
| 4+ Person Household | 0 (0.0%) | 0 (0.0%) |
| Total Housing Units | 95 (84.8%) | 17 (15.2%) |
Occupancy by Educational Attainment in Bobtown
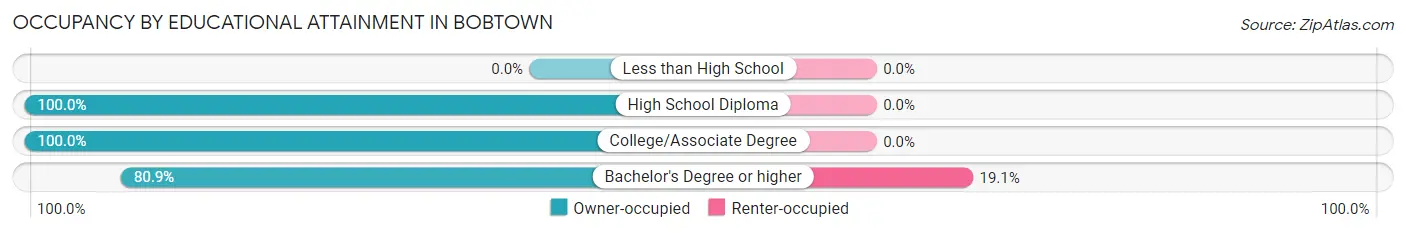
| Household Size | Owner-occupied | Renter-occupied |
| Less than High School | 0 (0.0%) | 0 (0.0%) |
| High School Diploma | 11 (100.0%) | 0 (0.0%) |
| College/Associate Degree | 12 (100.0%) | 0 (0.0%) |
| Bachelor's Degree or higher | 72 (80.9%) | 17 (19.1%) |
Occupancy by Age of Householder in Bobtown
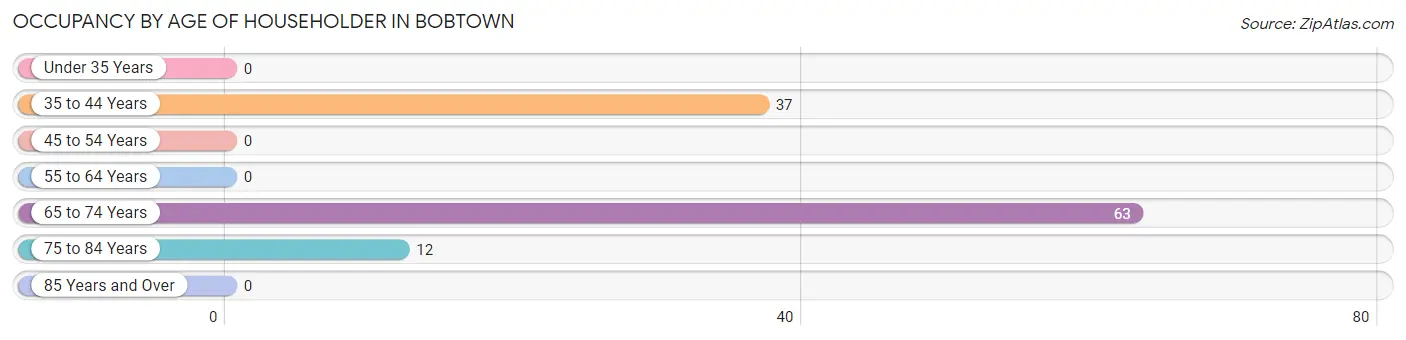
| Age Bracket | # Households | % Households |
| Under 35 Years | 0 | 0.0% |
| 35 to 44 Years | 37 | 33.0% |
| 45 to 54 Years | 0 | 0.0% |
| 55 to 64 Years | 0 | 0.0% |
| 65 to 74 Years | 63 | 56.2% |
| 75 to 84 Years | 12 | 10.7% |
| 85 Years and Over | 0 | 0.0% |
| Total | 112 | 100.0% |
Housing Finances in Bobtown
Median Income by Occupancy in Bobtown
| Occupancy Type | # Households | Median Income |
| Owner-Occupied | 95 (84.8%) | $0 |
| Renter-Occupied | 17 (15.2%) | $0 |
| Average | 112 (100.0%) | $0 |
Occupancy by Householder Income Bracket in Bobtown
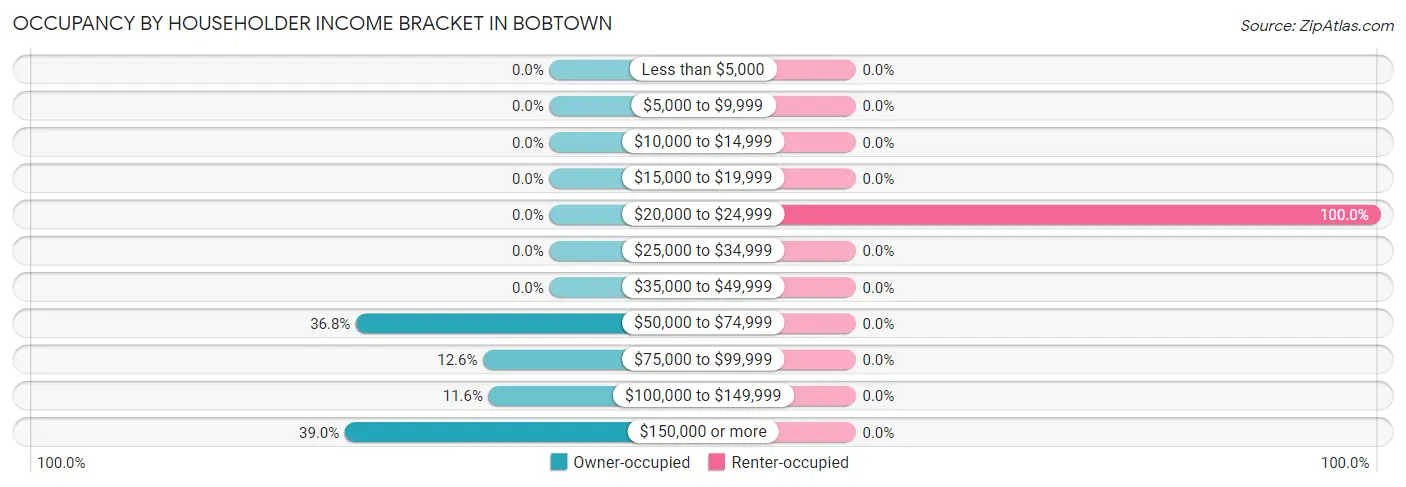
| Income Bracket | Owner-occupied | Renter-occupied |
| Less than $5,000 | 0 (0.0%) | 0 (0.0%) |
| $5,000 to $9,999 | 0 (0.0%) | 0 (0.0%) |
| $10,000 to $14,999 | 0 (0.0%) | 0 (0.0%) |
| $15,000 to $19,999 | 0 (0.0%) | 0 (0.0%) |
| $20,000 to $24,999 | 0 (0.0%) | 17 (100.0%) |
| $25,000 to $34,999 | 0 (0.0%) | 0 (0.0%) |
| $35,000 to $49,999 | 0 (0.0%) | 0 (0.0%) |
| $50,000 to $74,999 | 35 (36.8%) | 0 (0.0%) |
| $75,000 to $99,999 | 12 (12.6%) | 0 (0.0%) |
| $100,000 to $149,999 | 11 (11.6%) | 0 (0.0%) |
| $150,000 or more | 37 (39.0%) | 0 (0.0%) |
| Total | 95 (100.0%) | 17 (100.0%) |
Monthly Housing Cost Tiers in Bobtown
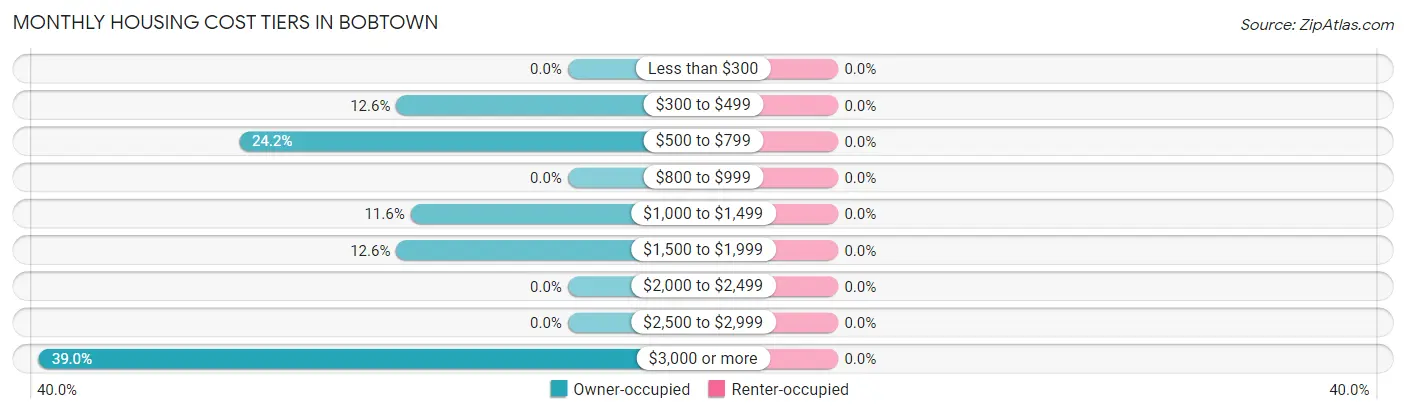
| Monthly Cost | Owner-occupied | Renter-occupied |
| Less than $300 | 0 (0.0%) | 0 (0.0%) |
| $300 to $499 | 12 (12.6%) | 0 (0.0%) |
| $500 to $799 | 23 (24.2%) | 0 (0.0%) |
| $800 to $999 | 0 (0.0%) | 0 (0.0%) |
| $1,000 to $1,499 | 11 (11.6%) | 0 (0.0%) |
| $1,500 to $1,999 | 12 (12.6%) | 0 (0.0%) |
| $2,000 to $2,499 | 0 (0.0%) | 0 (0.0%) |
| $2,500 to $2,999 | 0 (0.0%) | 0 (0.0%) |
| $3,000 or more | 37 (39.0%) | 0 (0.0%) |
| Total | 95 (100.0%) | 17 (100.0%) |
Physical Housing Characteristics in Bobtown
Housing Structures in Bobtown
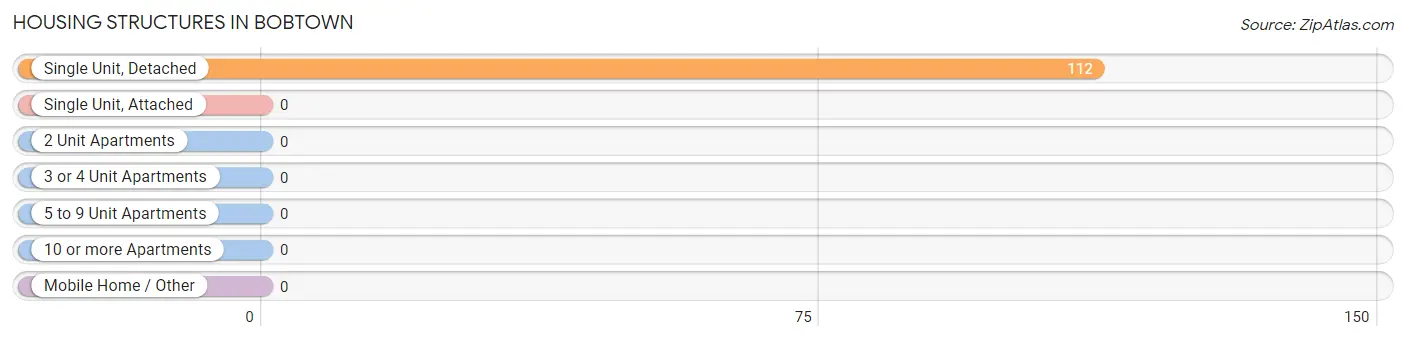
| Structure Type | # Housing Units | % Housing Units |
| Single Unit, Detached | 112 | 100.0% |
| Single Unit, Attached | 0 | 0.0% |
| 2 Unit Apartments | 0 | 0.0% |
| 3 or 4 Unit Apartments | 0 | 0.0% |
| 5 to 9 Unit Apartments | 0 | 0.0% |
| 10 or more Apartments | 0 | 0.0% |
| Mobile Home / Other | 0 | 0.0% |
| Total | 112 | 100.0% |
Housing Structures by Occupancy in Bobtown
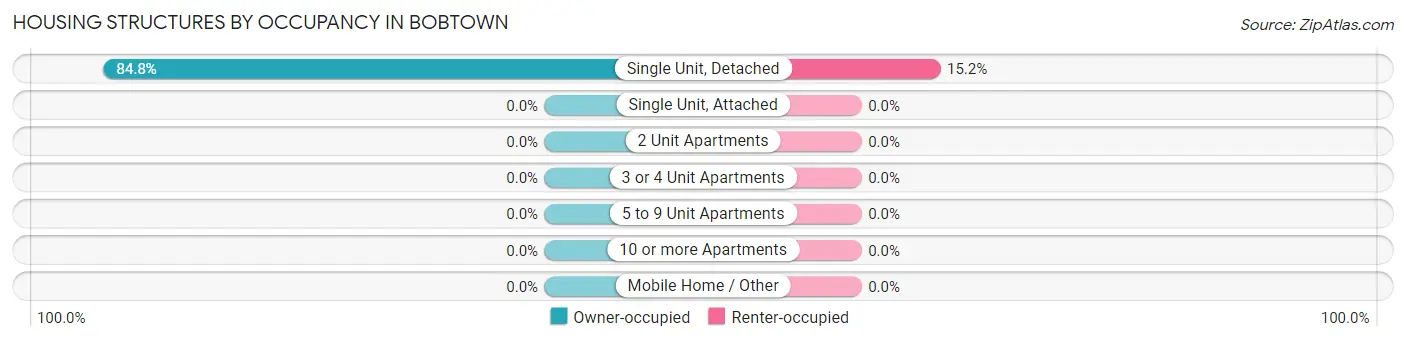
| Structure Type | Owner-occupied | Renter-occupied |
| Single Unit, Detached | 95 (84.8%) | 17 (15.2%) |
| Single Unit, Attached | 0 (0.0%) | 0 (0.0%) |
| 2 Unit Apartments | 0 (0.0%) | 0 (0.0%) |
| 3 or 4 Unit Apartments | 0 (0.0%) | 0 (0.0%) |
| 5 to 9 Unit Apartments | 0 (0.0%) | 0 (0.0%) |
| 10 or more Apartments | 0 (0.0%) | 0 (0.0%) |
| Mobile Home / Other | 0 (0.0%) | 0 (0.0%) |
| Total | 95 (84.8%) | 17 (15.2%) |
Housing Structures by Number of Rooms in Bobtown
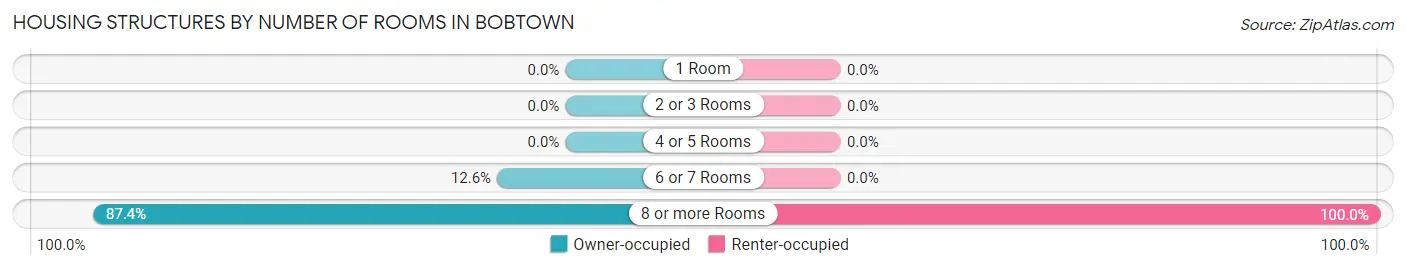
| Number of Rooms | Owner-occupied | Renter-occupied |
| 1 Room | 0 (0.0%) | 0 (0.0%) |
| 2 or 3 Rooms | 0 (0.0%) | 0 (0.0%) |
| 4 or 5 Rooms | 0 (0.0%) | 0 (0.0%) |
| 6 or 7 Rooms | 12 (12.6%) | 0 (0.0%) |
| 8 or more Rooms | 83 (87.4%) | 17 (100.0%) |
| Total | 95 (100.0%) | 17 (100.0%) |
Housing Structure by Heating Type in Bobtown
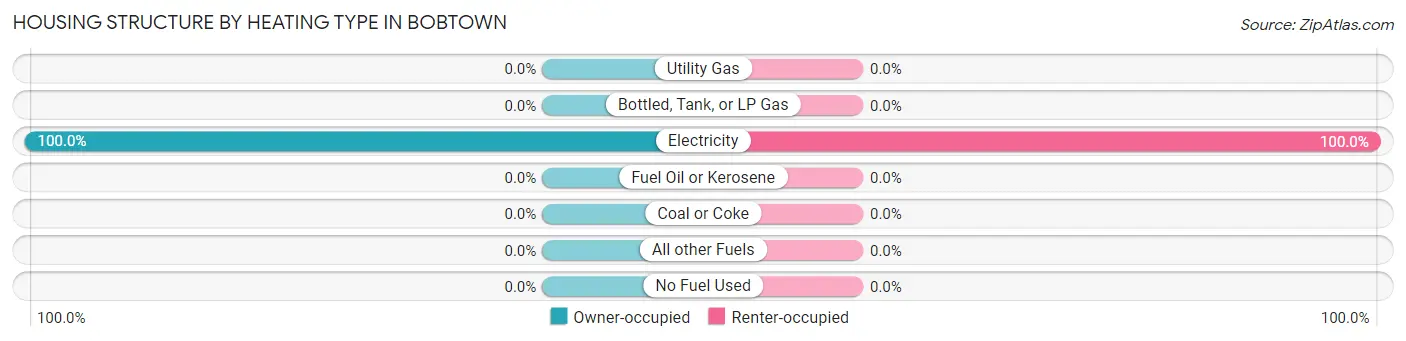
| Heating Type | Owner-occupied | Renter-occupied |
| Utility Gas | 0 (0.0%) | 0 (0.0%) |
| Bottled, Tank, or LP Gas | 0 (0.0%) | 0 (0.0%) |
| Electricity | 95 (100.0%) | 17 (100.0%) |
| Fuel Oil or Kerosene | 0 (0.0%) | 0 (0.0%) |
| Coal or Coke | 0 (0.0%) | 0 (0.0%) |
| All other Fuels | 0 (0.0%) | 0 (0.0%) |
| No Fuel Used | 0 (0.0%) | 0 (0.0%) |
| Total | 95 (100.0%) | 17 (100.0%) |
Household Vehicle Usage in Bobtown
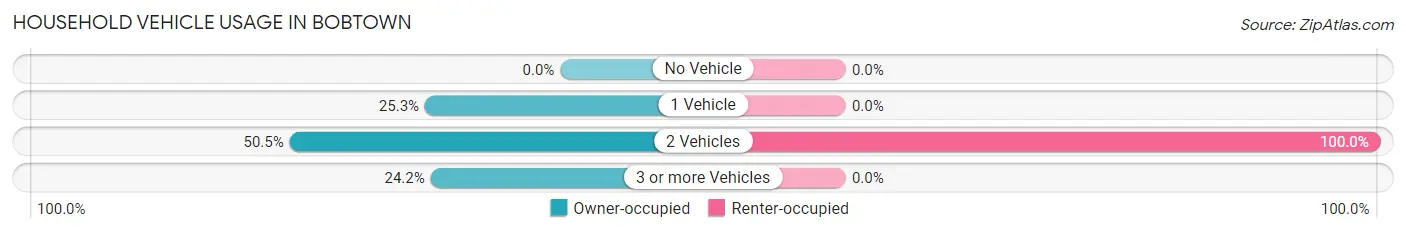
| Vehicles per Household | Owner-occupied | Renter-occupied |
| No Vehicle | 0 (0.0%) | 0 (0.0%) |
| 1 Vehicle | 24 (25.3%) | 0 (0.0%) |
| 2 Vehicles | 48 (50.5%) | 17 (100.0%) |
| 3 or more Vehicles | 23 (24.2%) | 0 (0.0%) |
| Total | 95 (100.0%) | 17 (100.0%) |
Real Estate & Mortgages in Bobtown
Real Estate and Mortgage Overview in Bobtown
| Characteristic | Without Mortgage | With Mortgage |
| Housing Units | 35 | 60 |
| Median Property Value | $445,800 | $547,300 |
| Median Household Income | $58,646 | $37 |
| Monthly Housing Costs | $546 | $37 |
| Real Estate Taxes | $2,239 | $0 |
Property Value by Mortgage Status in Bobtown
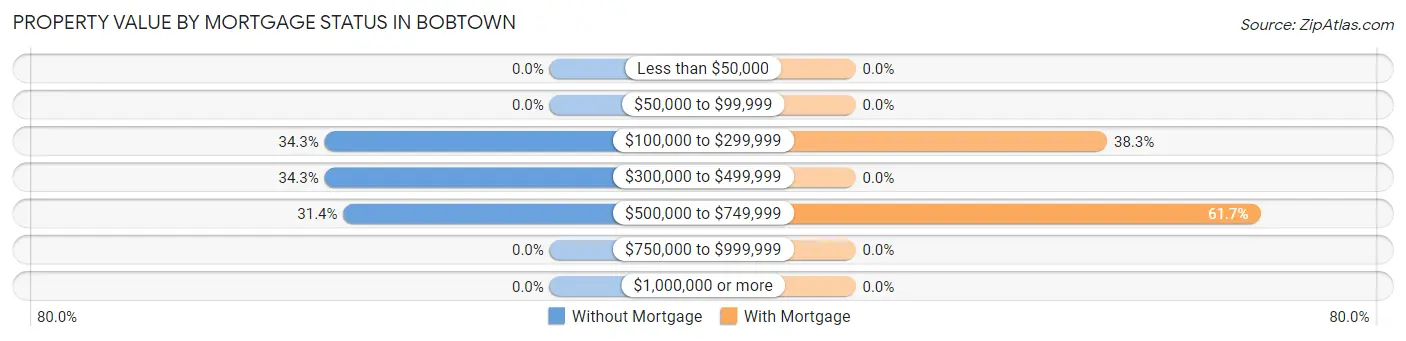
| Property Value | Without Mortgage | With Mortgage |
| Less than $50,000 | 0 (0.0%) | 0 (0.0%) |
| $50,000 to $99,999 | 0 (0.0%) | 0 (0.0%) |
| $100,000 to $299,999 | 12 (34.3%) | 23 (38.3%) |
| $300,000 to $499,999 | 12 (34.3%) | 0 (0.0%) |
| $500,000 to $749,999 | 11 (31.4%) | 37 (61.7%) |
| $750,000 to $999,999 | 0 (0.0%) | 0 (0.0%) |
| $1,000,000 or more | 0 (0.0%) | 0 (0.0%) |
| Total | 35 (100.0%) | 60 (100.0%) |
Household Income by Mortgage Status in Bobtown
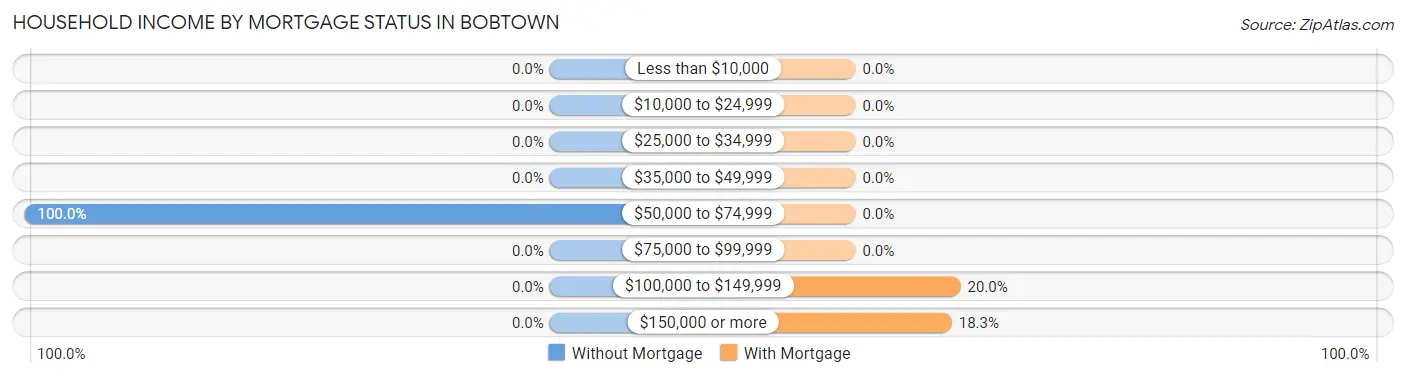
| Household Income | Without Mortgage | With Mortgage |
| Less than $10,000 | 0 (0.0%) | 0 (0.0%) |
| $10,000 to $24,999 | 0 (0.0%) | 0 (0.0%) |
| $25,000 to $34,999 | 0 (0.0%) | 0 (0.0%) |
| $35,000 to $49,999 | 0 (0.0%) | 0 (0.0%) |
| $50,000 to $74,999 | 35 (100.0%) | 0 (0.0%) |
| $75,000 to $99,999 | 0 (0.0%) | 0 (0.0%) |
| $100,000 to $149,999 | 0 (0.0%) | 12 (20.0%) |
| $150,000 or more | 0 (0.0%) | 11 (18.3%) |
| Total | 35 (100.0%) | 60 (100.0%) |
Property Value to Household Income Ratio in Bobtown
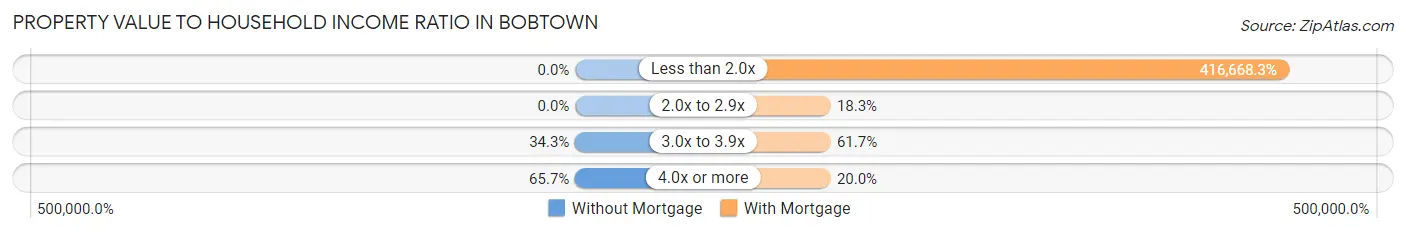
| Value-to-Income Ratio | Without Mortgage | With Mortgage |
| Less than 2.0x | 0 (0.0%) | 250,001 (416,668.3%) |
| 2.0x to 2.9x | 0 (0.0%) | 11 (18.3%) |
| 3.0x to 3.9x | 12 (34.3%) | 37 (61.7%) |
| 4.0x or more | 23 (65.7%) | 12 (20.0%) |
| Total | 35 (100.0%) | 60 (100.0%) |
Real Estate Taxes by Mortgage Status in Bobtown
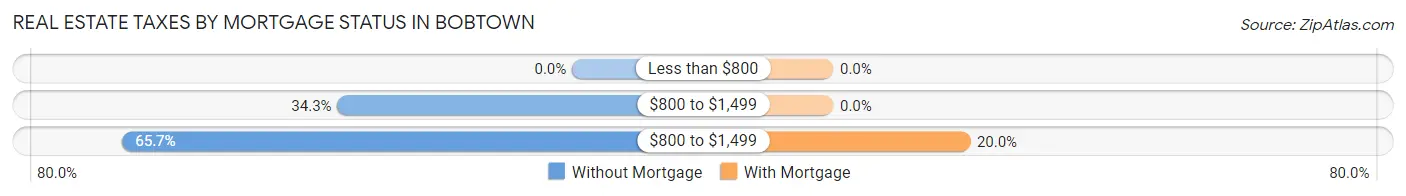
| Property Taxes | Without Mortgage | With Mortgage |
| Less than $800 | 0 (0.0%) | 0 (0.0%) |
| $800 to $1,499 | 12 (34.3%) | 0 (0.0%) |
| $800 to $1,499 | 23 (65.7%) | 12 (20.0%) |
| Total | 35 (100.0%) | 60 (100.0%) |
Health & Disability in Bobtown
Health Insurance Coverage by Age in Bobtown
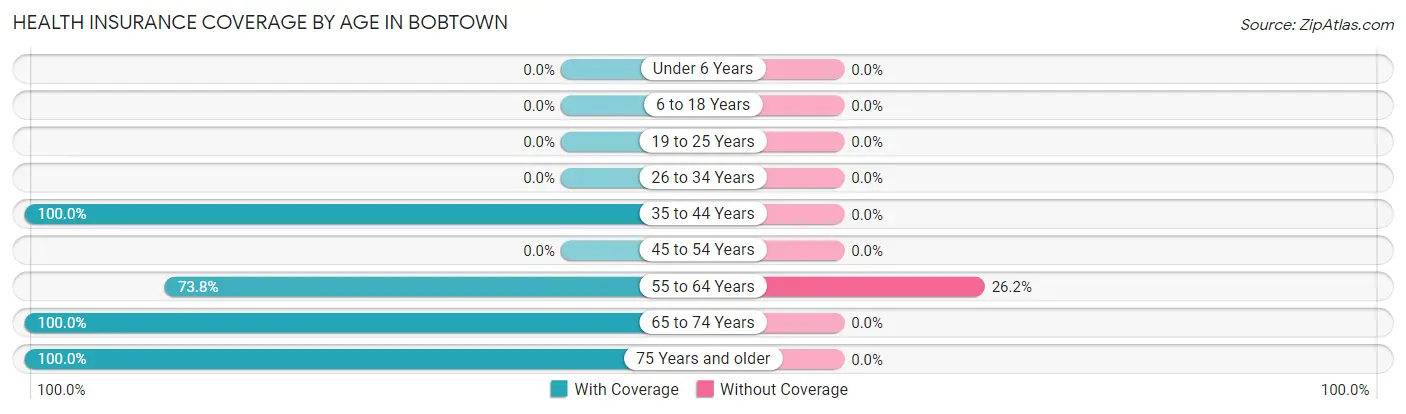
| Age Bracket | With Coverage | Without Coverage |
| Under 6 Years | 0 (0.0%) | 0 (0.0%) |
| 6 to 18 Years | 0 (0.0%) | 0 (0.0%) |
| 19 to 25 Years | 0 (0.0%) | 0 (0.0%) |
| 26 to 34 Years | 0 (0.0%) | 0 (0.0%) |
| 35 to 44 Years | 79 (100.0%) | 0 (0.0%) |
| 45 to 54 Years | 0 (0.0%) | 0 (0.0%) |
| 55 to 64 Years | 31 (73.8%) | 11 (26.2%) |
| 65 to 74 Years | 81 (100.0%) | 0 (0.0%) |
| 75 Years and older | 12 (100.0%) | 0 (0.0%) |
| Total | 203 (94.9%) | 11 (5.1%) |
Health Insurance Coverage by Citizenship Status in Bobtown
| Citizenship Status | With Coverage | Without Coverage |
| Native Born | 0 (0.0%) | 0 (0.0%) |
| Foreign Born, Citizen | 0 (0.0%) | 0 (0.0%) |
| Foreign Born, not a Citizen | 0 (0.0%) | 0 (0.0%) |
Health Insurance Coverage by Household Income in Bobtown
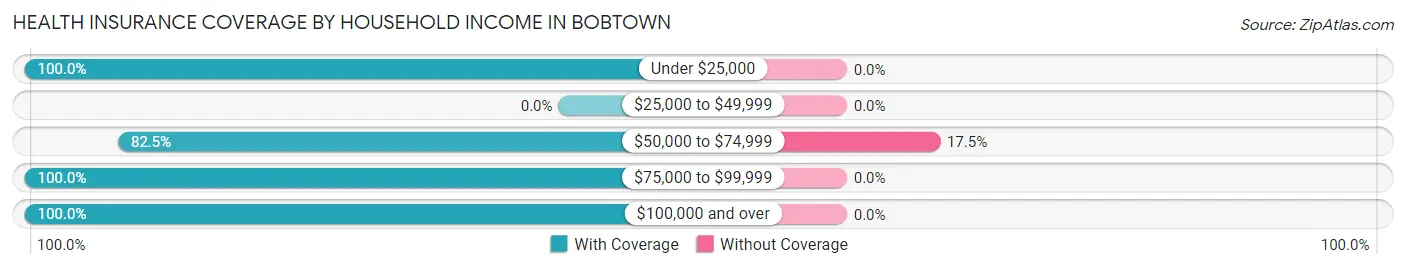
| Household Income | With Coverage | Without Coverage |
| Under $25,000 | 40 (100.0%) | 0 (0.0%) |
| $25,000 to $49,999 | 0 (0.0%) | 0 (0.0%) |
| $50,000 to $74,999 | 52 (82.5%) | 11 (17.5%) |
| $75,000 to $99,999 | 12 (100.0%) | 0 (0.0%) |
| $100,000 and over | 99 (100.0%) | 0 (0.0%) |
Public vs Private Health Insurance Coverage by Age in Bobtown
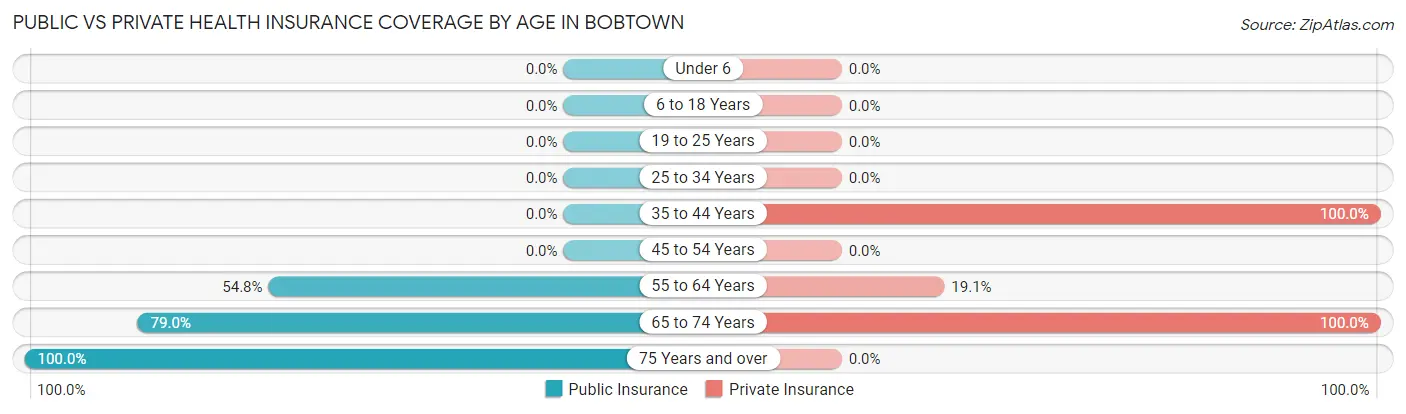
| Age Bracket | Public Insurance | Private Insurance |
| Under 6 | 0 (0.0%) | 0 (0.0%) |
| 6 to 18 Years | 0 (0.0%) | 0 (0.0%) |
| 19 to 25 Years | 0 (0.0%) | 0 (0.0%) |
| 25 to 34 Years | 0 (0.0%) | 0 (0.0%) |
| 35 to 44 Years | 0 (0.0%) | 79 (100.0%) |
| 45 to 54 Years | 0 (0.0%) | 0 (0.0%) |
| 55 to 64 Years | 23 (54.8%) | 8 (19.1%) |
| 65 to 74 Years | 64 (79.0%) | 81 (100.0%) |
| 75 Years and over | 12 (100.0%) | 0 (0.0%) |
| Total | 99 (46.3%) | 168 (78.5%) |
Disability Status by Sex by Age in Bobtown
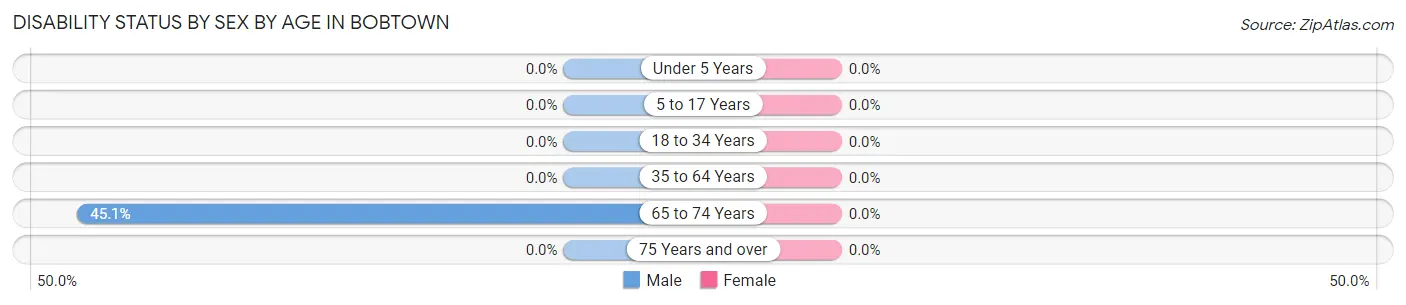
| Age Bracket | Male | Female |
| Under 5 Years | 0 (0.0%) | 0 (0.0%) |
| 5 to 17 Years | 0 (0.0%) | 0 (0.0%) |
| 18 to 34 Years | 0 (0.0%) | 0 (0.0%) |
| 35 to 64 Years | 0 (0.0%) | 0 (0.0%) |
| 65 to 74 Years | 23 (45.1%) | 0 (0.0%) |
| 75 Years and over | 0 (0.0%) | 0 (0.0%) |
Disability Class by Sex by Age in Bobtown
Disability Class: Hearing Difficulty
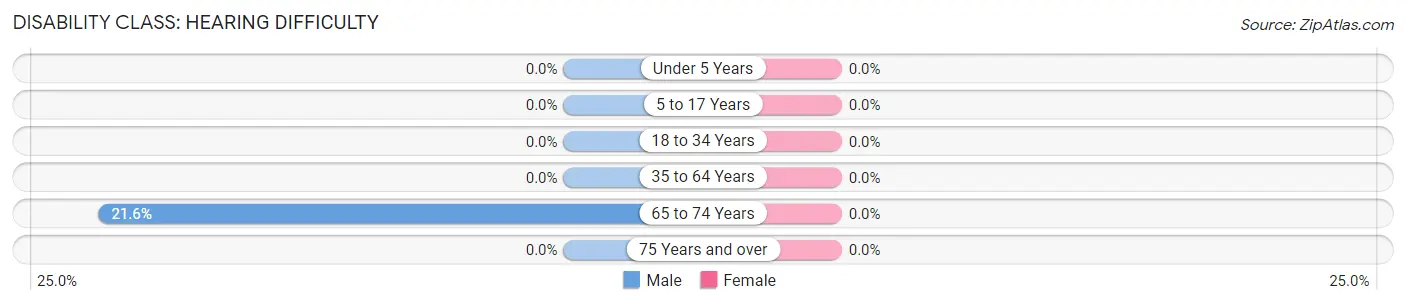
| Age Bracket | Male | Female |
| Under 5 Years | 0 (0.0%) | 0 (0.0%) |
| 5 to 17 Years | 0 (0.0%) | 0 (0.0%) |
| 18 to 34 Years | 0 (0.0%) | 0 (0.0%) |
| 35 to 64 Years | 0 (0.0%) | 0 (0.0%) |
| 65 to 74 Years | 11 (21.6%) | 0 (0.0%) |
| 75 Years and over | 0 (0.0%) | 0 (0.0%) |
Disability Class: Vision Difficulty
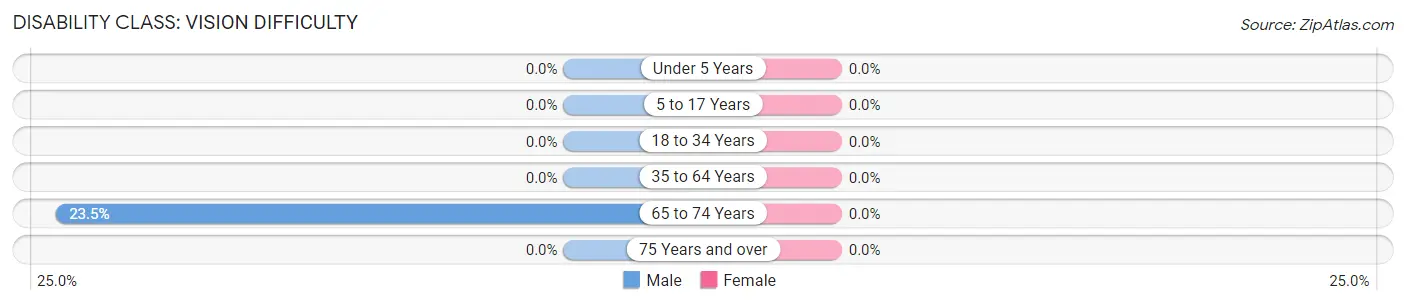
| Age Bracket | Male | Female |
| Under 5 Years | 0 (0.0%) | 0 (0.0%) |
| 5 to 17 Years | 0 (0.0%) | 0 (0.0%) |
| 18 to 34 Years | 0 (0.0%) | 0 (0.0%) |
| 35 to 64 Years | 0 (0.0%) | 0 (0.0%) |
| 65 to 74 Years | 12 (23.5%) | 0 (0.0%) |
| 75 Years and over | 0 (0.0%) | 0 (0.0%) |
Disability Class: Cognitive Difficulty
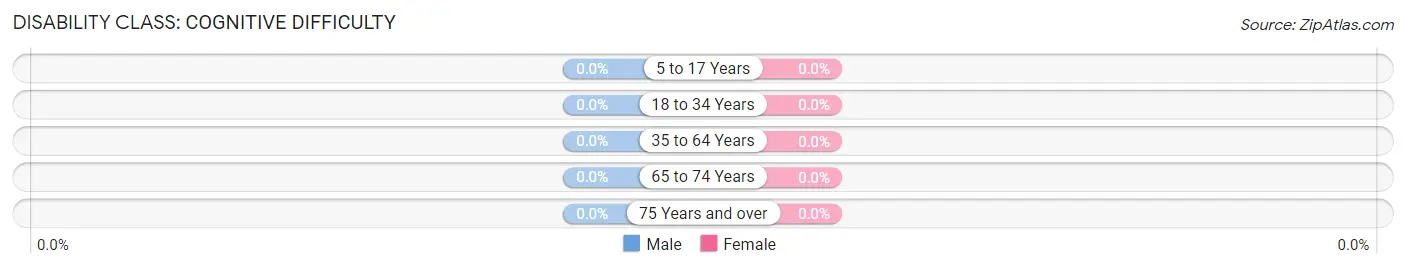
| Age Bracket | Male | Female |
| 5 to 17 Years | 0 (0.0%) | 0 (0.0%) |
| 18 to 34 Years | 0 (0.0%) | 0 (0.0%) |
| 35 to 64 Years | 0 (0.0%) | 0 (0.0%) |
| 65 to 74 Years | 0 (0.0%) | 0 (0.0%) |
| 75 Years and over | 0 (0.0%) | 0 (0.0%) |
Disability Class: Ambulatory Difficulty
| Age Bracket | Male | Female |
| 5 to 17 Years | 0 (0.0%) | 0 (0.0%) |
| 18 to 34 Years | 0 (0.0%) | 0 (0.0%) |
| 35 to 64 Years | 0 (0.0%) | 0 (0.0%) |
| 65 to 74 Years | 0 (0.0%) | 0 (0.0%) |
| 75 Years and over | 0 (0.0%) | 0 (0.0%) |
Disability Class: Self-Care Difficulty
| Age Bracket | Male | Female |
| 5 to 17 Years | 0 (0.0%) | 0 (0.0%) |
| 18 to 34 Years | 0 (0.0%) | 0 (0.0%) |
| 35 to 64 Years | 0 (0.0%) | 0 (0.0%) |
| 65 to 74 Years | 0 (0.0%) | 0 (0.0%) |
| 75 Years and over | 0 (0.0%) | 0 (0.0%) |
Technology Access in Bobtown
Computing Device Access in Bobtown
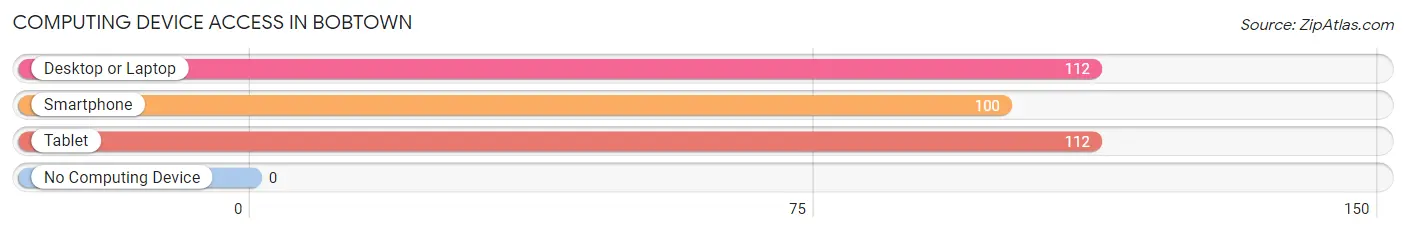
| Device Type | # Households | % Households |
| Desktop or Laptop | 112 | 100.0% |
| Smartphone | 100 | 89.3% |
| Tablet | 112 | 100.0% |
| No Computing Device | 0 | 0.0% |
| Total | 112 | 100.0% |
Internet Access in Bobtown
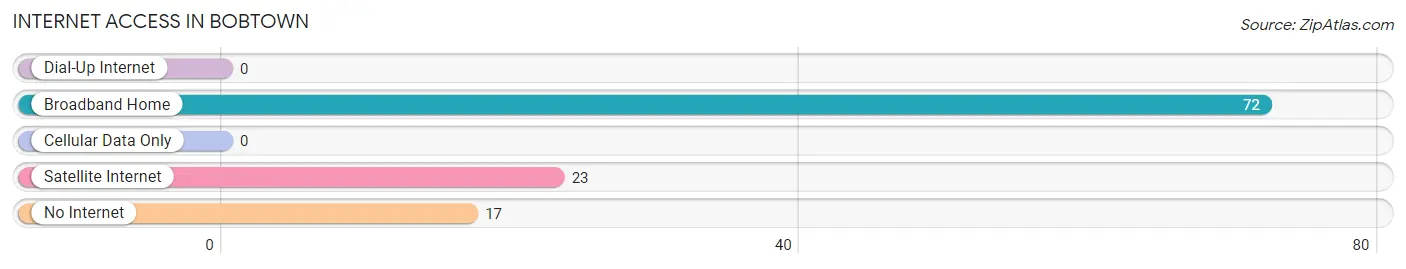
| Internet Type | # Households | % Households |
| Dial-Up Internet | 0 | 0.0% |
| Broadband Home | 72 | 64.3% |
| Cellular Data Only | 0 | 0.0% |
| Satellite Internet | 23 | 20.5% |
| No Internet | 17 | 15.2% |
| Total | 112 | 100.0% |
Bobtown Summary
Bobtown is a small unincorporated community located in Giles County, Virginia. It is situated in the Appalachian Mountains, approximately 10 miles south of the town of Pearisburg. The population of Bobtown was estimated to be around 200 people in 2020.
History
Bobtown was first settled in the late 1700s by a group of settlers from North Carolina. The town was originally known as “Bob’s Town” after the first settler, Robert Bobbitt. The town was officially incorporated in 1820 and was named Bobtown.
The town was a small farming community for many years, but in the early 1900s, the coal industry began to boom in the area. The town was home to several coal mines, and many of the residents worked in the mines. The coal industry provided jobs and economic stability to the town for many years.
In the 1950s, the coal industry began to decline, and many of the mines closed. This caused a significant economic downturn in the town, and many of the residents moved away in search of better opportunities.
Geography
Bobtown is located in the Appalachian Mountains in Giles County, Virginia. The town is situated in a valley between two mountain ranges, the Blue Ridge Mountains and the Allegheny Mountains. The town is surrounded by rolling hills and lush forests.
The town is located near the New River, which is a major tributary of the Ohio River. The New River is a popular destination for fishing, canoeing, and kayaking.
The climate in Bobtown is temperate, with hot summers and cold winters. The average temperature in the summer is around 80 degrees Fahrenheit, and the average temperature in the winter is around 40 degrees Fahrenheit.
Economy
The economy of Bobtown is largely based on agriculture and tourism. The town is home to several farms, which produce a variety of crops, including corn, soybeans, and hay. The town is also home to several wineries, which produce a variety of wines.
The town is also a popular tourist destination, as it is located near several popular attractions, including the New River, the Appalachian Trail, and the Blue Ridge Parkway. The town is also home to several bed and breakfasts, which attract visitors from all over the world.
Demographics
The population of Bobtown was estimated to be around 200 people in 2020. The town is predominantly white, with a small minority population. The median household income in the town is around $35,000, and the median home value is around $100,000. The town has a low unemployment rate, and the majority of the residents are employed in the agriculture and tourism industries.
Common Questions
What is Per Capita Income in Bobtown?
Per Capita income in Bobtown is $86,324.
What is Inequality or Gini Index in Bobtown?
Inequality or Gini Index in Bobtown is 0.44.
What is the Total Population of Bobtown?
Total Population of Bobtown is 214.
What is the Total Male Population of Bobtown?
Total Male Population of Bobtown is 93.
What is the Total Female Population of Bobtown?
Total Female Population of Bobtown is 121.
What is the Ratio of Males per 100 Females in Bobtown?
There are 76.86 Males per 100 Females in Bobtown.
What is the Ratio of Females per 100 Males in Bobtown?
There are 130.11 Females per 100 Males in Bobtown.
What is the Median Population Age in Bobtown?
Median Population Age in Bobtown is 61.7 Years.
What is the Average Family Size in Bobtown
Average Family Size in Bobtown is 2.1 People.
What is the Average Household Size in Bobtown
Average Household Size in Bobtown is 1.9 People.
How Large is the Labor Force in Bobtown?
There are 91 People in the Labor Forcein in Bobtown.
What is the Percentage of People in the Labor Force in Bobtown?
42.5% of People are in the Labor Force in Bobtown.