Mount Sidney, VA Map & Demographics
Mount Sidney Map
Mount Sidney Overview
$47,189
PER CAPITA INCOME
13.1%
WAGE / INCOME GAP [ % ]
86.9¢/ $1
WAGE / INCOME GAP [ $ ]
0.38
INEQUALITY / GINI INDEX
894
TOTAL POPULATION
368
MALE POPULATION
526
FEMALE POPULATION
69.96
MALES / 100 FEMALES
142.93
FEMALES / 100 MALES
42.0
MEDIAN AGE
2.4
AVG FAMILY SIZE
2.3
AVG HOUSEHOLD SIZE
638
LABOR FORCE [ PEOPLE ]
79.4%
PERCENT IN LABOR FORCE
Mount Sidney Zip Codes
Mount Sidney Area Codes
Income in Mount Sidney
Income Overview in Mount Sidney
| Characteristic | Number | Measure |
| Per Capita Income | 894 | $47,189 |
| Median Family Income | 332 | $0 |
| Mean Family Income | 332 | $167,452 |
| Median Household Income | 386 | $0 |
| Mean Household Income | 386 | $150,498 |
| Income Deficit | 332 | $0 |
| Wage / Income Gap (%) | 894 | 13.11% |
| Wage / Income Gap ($) | 894 | 86.89¢ per $1 |
| Gini / Inequality Index | 894 | 0.38 |
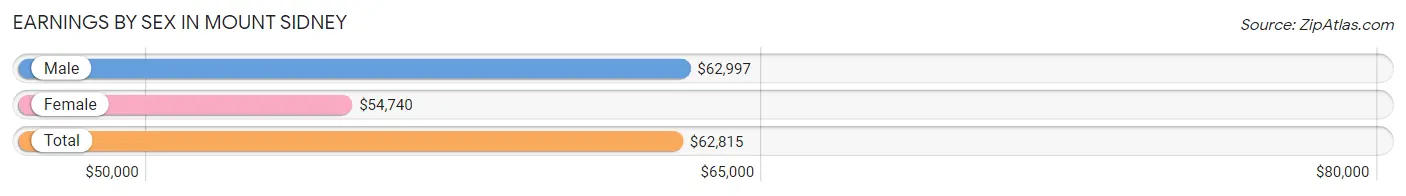
Earnings by Sex in Mount Sidney
Average Earnings in Mount Sidney are $62,815, $62,997 for men and $54,740 for women, a difference of 13.1%.
| Sex | Number | Average Earnings |
| Male | 277 (43.4%) | $62,997 |
| Female | 361 (56.6%) | $54,740 |
| Total | 638 (100.0%) | $62,815 |
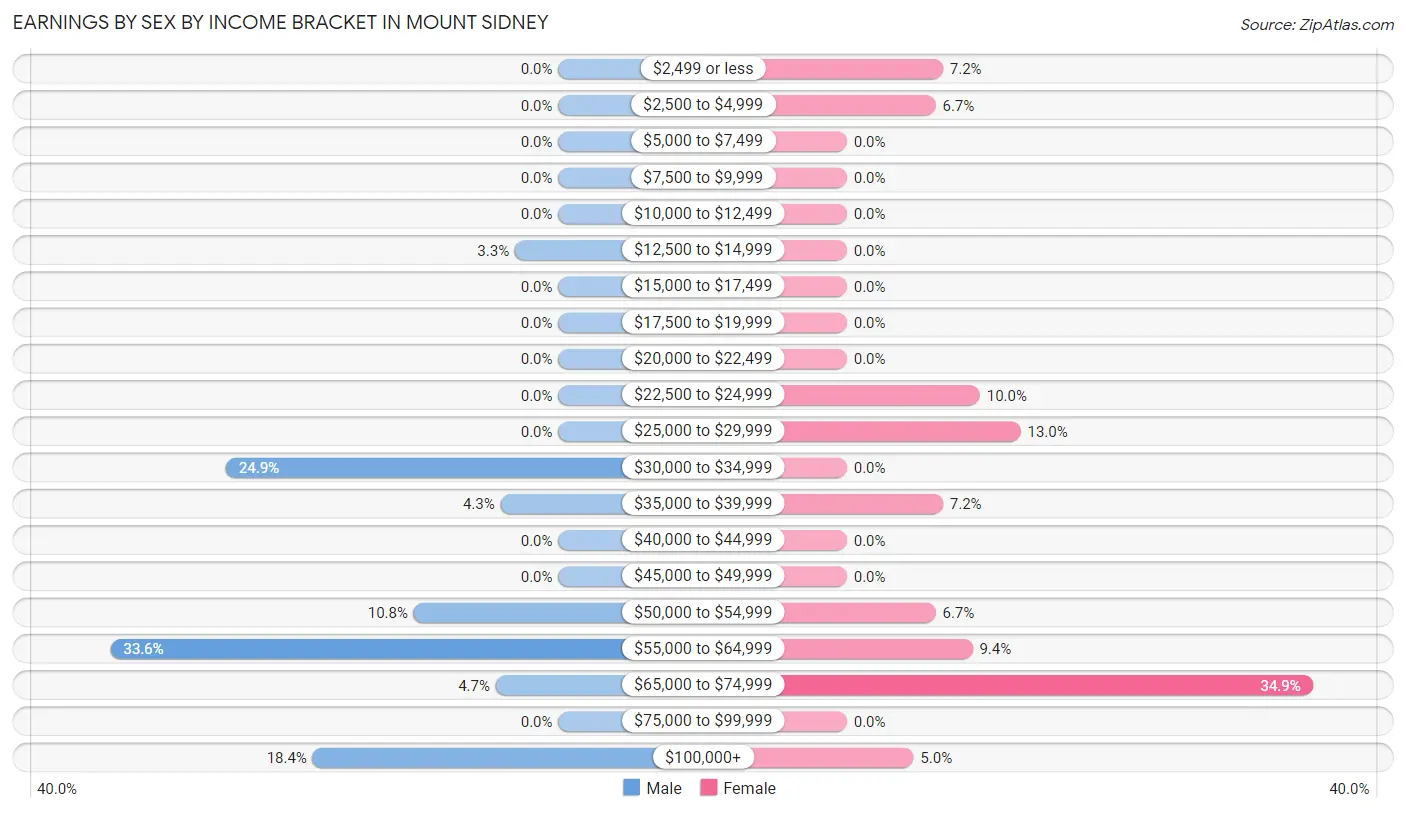
Earnings by Sex by Income Bracket in Mount Sidney
The most common earnings brackets in Mount Sidney are $55,000 to $64,999 for men (93 | 33.6%) and $65,000 to $74,999 for women (126 | 34.9%).
| Income | Male | Female |
| $2,499 or less | 0 (0.0%) | 26 (7.2%) |
| $2,500 to $4,999 | 0 (0.0%) | 24 (6.7%) |
| $5,000 to $7,499 | 0 (0.0%) | 0 (0.0%) |
| $7,500 to $9,999 | 0 (0.0%) | 0 (0.0%) |
| $10,000 to $12,499 | 0 (0.0%) | 0 (0.0%) |
| $12,500 to $14,999 | 9 (3.3%) | 0 (0.0%) |
| $15,000 to $17,499 | 0 (0.0%) | 0 (0.0%) |
| $17,500 to $19,999 | 0 (0.0%) | 0 (0.0%) |
| $20,000 to $22,499 | 0 (0.0%) | 0 (0.0%) |
| $22,500 to $24,999 | 0 (0.0%) | 36 (10.0%) |
| $25,000 to $29,999 | 0 (0.0%) | 47 (13.0%) |
| $30,000 to $34,999 | 69 (24.9%) | 0 (0.0%) |
| $35,000 to $39,999 | 12 (4.3%) | 26 (7.2%) |
| $40,000 to $44,999 | 0 (0.0%) | 0 (0.0%) |
| $45,000 to $49,999 | 0 (0.0%) | 0 (0.0%) |
| $50,000 to $54,999 | 30 (10.8%) | 24 (6.7%) |
| $55,000 to $64,999 | 93 (33.6%) | 34 (9.4%) |
| $65,000 to $74,999 | 13 (4.7%) | 126 (34.9%) |
| $75,000 to $99,999 | 0 (0.0%) | 0 (0.0%) |
| $100,000+ | 51 (18.4%) | 18 (5.0%) |
| Total | 277 (100.0%) | 361 (100.0%) |
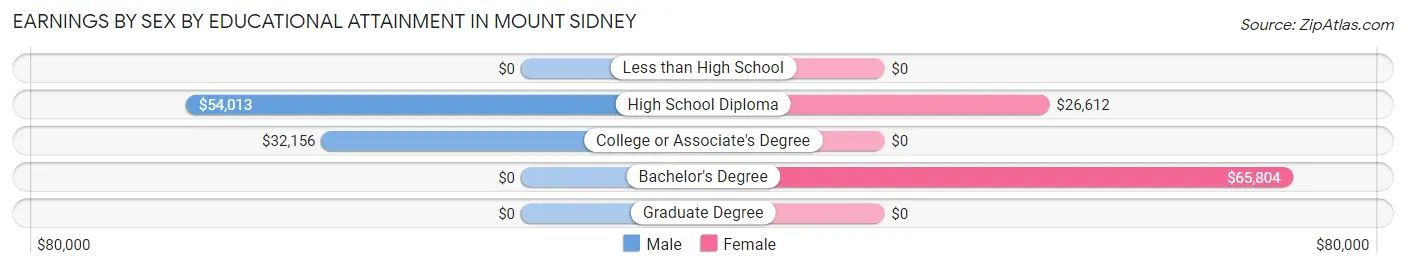
Earnings by Sex by Educational Attainment in Mount Sidney
Average earnings in Mount Sidney are $51,477 for men and $53,958 for women, a difference of 4.6%. Men with an educational attainment of high school diploma enjoy the highest average annual earnings of $54,013, while those with college or associate's degree education earn the least with $32,156. Women with an educational attainment of bachelor's degree earn the most with the average annual earnings of $65,804, while those with high school diploma education have the smallest earnings of $26,612.
| Educational Attainment | Male Income | Female Income |
| Less than High School | - | - |
| High School Diploma | $54,013 | $26,612 |
| College or Associate's Degree | $32,156 | $0 |
| Bachelor's Degree | - | - |
| Graduate Degree | - | - |
| Total | $51,477 | $53,958 |
Family Income in Mount Sidney
Family Income Brackets in Mount Sidney
According to the Mount Sidney family income data, there are 126 families falling into the $200,000+ income range, which is the most common income bracket and makes up 38.0% of all families.
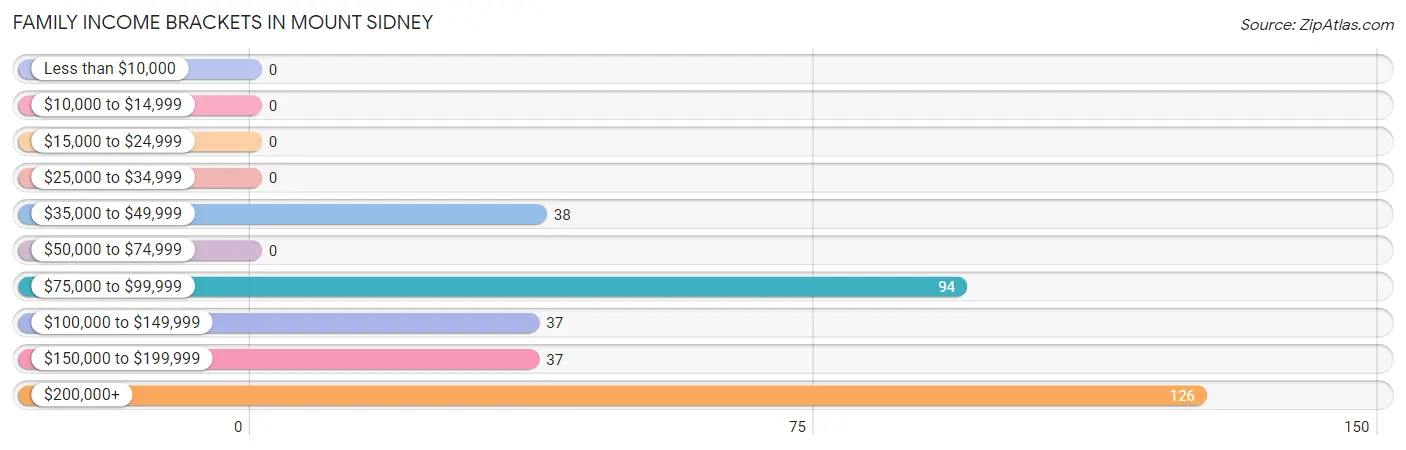
| Income Bracket | # Families | % Families |
| Less than $10,000 | 0 | 0.0% |
| $10,000 to $14,999 | 0 | 0.0% |
| $15,000 to $24,999 | 0 | 0.0% |
| $25,000 to $34,999 | 0 | 0.0% |
| $35,000 to $49,999 | 38 | 11.4% |
| $50,000 to $74,999 | 0 | 0.0% |
| $75,000 to $99,999 | 94 | 28.3% |
| $100,000 to $149,999 | 37 | 11.1% |
| $150,000 to $199,999 | 37 | 11.1% |
| $200,000+ | 126 | 38.0% |
Family Income by Famaliy Size in Mount Sidney
4-person families (173 | 52.1%) account for the highest median family income in Mount Sidney with $250,001 per family, while 4-person families (173 | 52.1%) have the highest median income of $62,500 per family member.
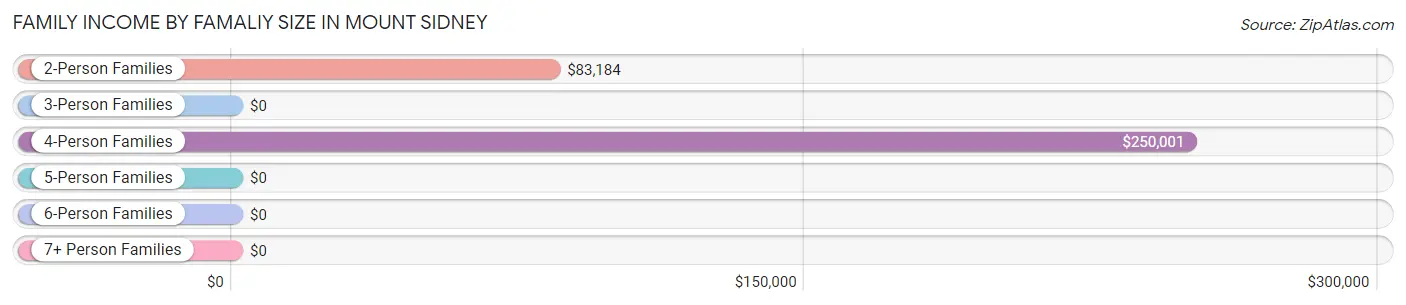
| Income Bracket | # Families | Median Income |
| 2-Person Families | 129 (38.9%) | $83,184 |
| 3-Person Families | 30 (9.0%) | $0 |
| 4-Person Families | 173 (52.1%) | $250,001 |
| 5-Person Families | 0 (0.0%) | $0 |
| 6-Person Families | 0 (0.0%) | $0 |
| 7+ Person Families | 0 (0.0%) | $0 |
| Total | 332 (100.0%) | $0 |
Family Income by Number of Earners in Mount Sidney
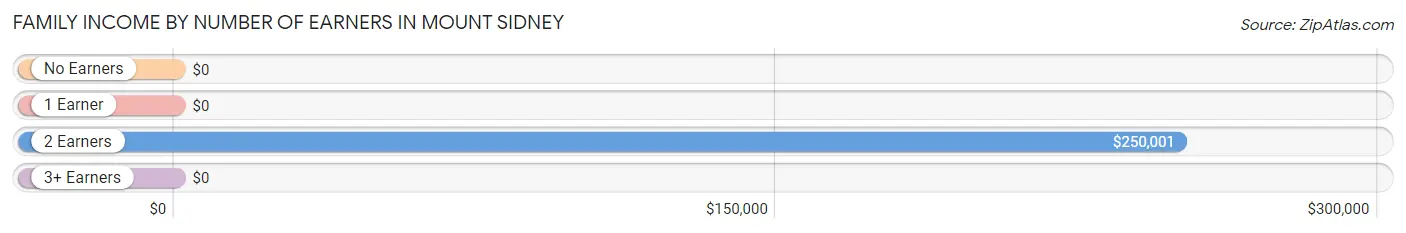
| Number of Earners | # Families | Median Income |
| No Earners | 0 (0.0%) | $0 |
| 1 Earner | 64 (19.3%) | $0 |
| 2 Earners | 231 (69.6%) | $250,001 |
| 3+ Earners | 37 (11.1%) | $0 |
| Total | 332 (100.0%) | $0 |
Household Income in Mount Sidney
Household Income Brackets in Mount Sidney
With 139 households falling in the category, the $200,000+ income range is the most frequent in Mount Sidney, accounting for 36.0% of all households.
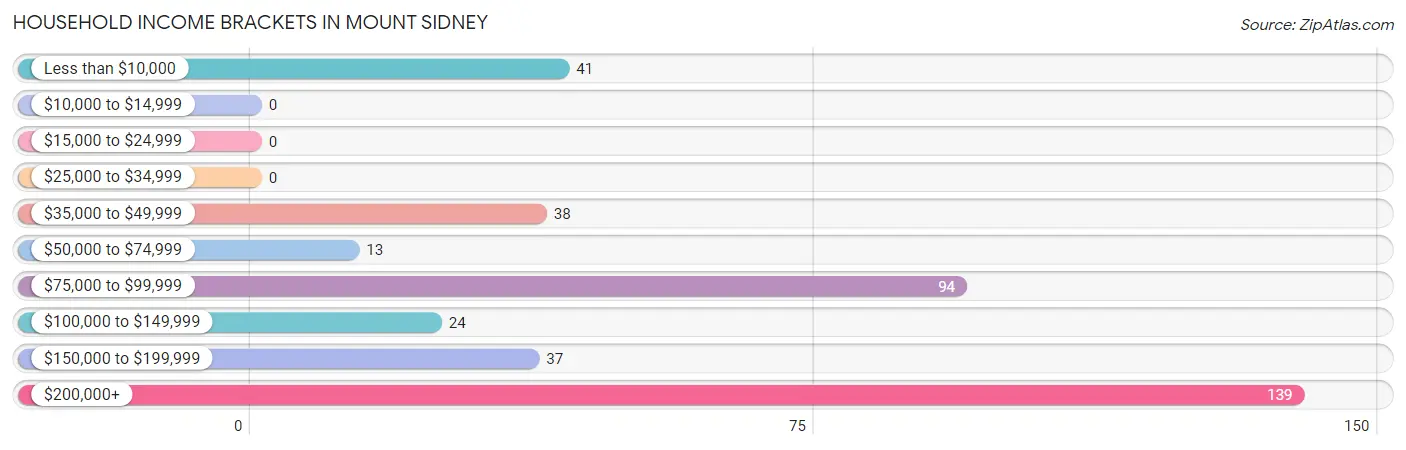
| Income Bracket | # Households | % Households |
| Less than $10,000 | 41 | 10.6% |
| $10,000 to $14,999 | 0 | 0.0% |
| $15,000 to $24,999 | 0 | 0.0% |
| $25,000 to $34,999 | 0 | 0.0% |
| $35,000 to $49,999 | 38 | 9.8% |
| $50,000 to $74,999 | 13 | 3.4% |
| $75,000 to $99,999 | 94 | 24.4% |
| $100,000 to $149,999 | 24 | 6.2% |
| $150,000 to $199,999 | 37 | 9.6% |
| $200,000+ | 139 | 36.0% |
Household Income by Householder Age in Mount Sidney
The median household income in Mount Sidney is $0, with the highest median household income of $250,001 found in the 25 to 44 years age bracket for the primary householder. A total of 156 households (40.4%) fall into this category. Meanwhile, the 15 to 24 years age bracket for the primary householder has the lowest median household income of $0, with 24 households (6.2%) in this group.
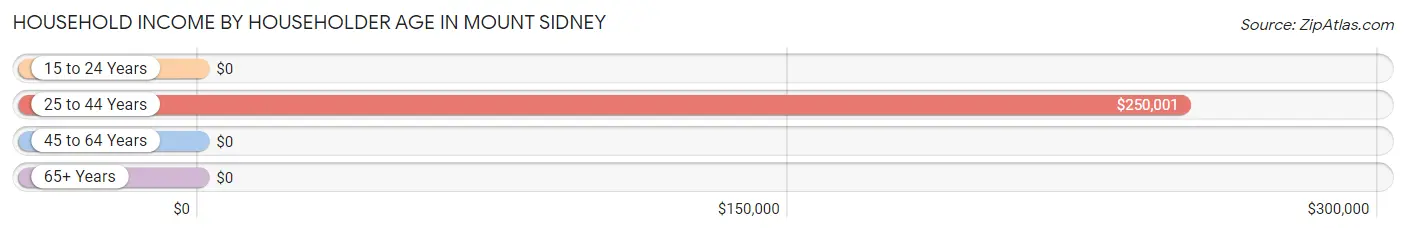
| Income Bracket | # Households | Median Income |
| 15 to 24 Years | 24 (6.2%) | $0 |
| 25 to 44 Years | 156 (40.4%) | $250,001 |
| 45 to 64 Years | 129 (33.4%) | $0 |
| 65+ Years | 77 (20.0%) | $0 |
| Total | 386 (100.0%) | $0 |
Poverty in Mount Sidney
Income Below Poverty by Sex and Age in Mount Sidney
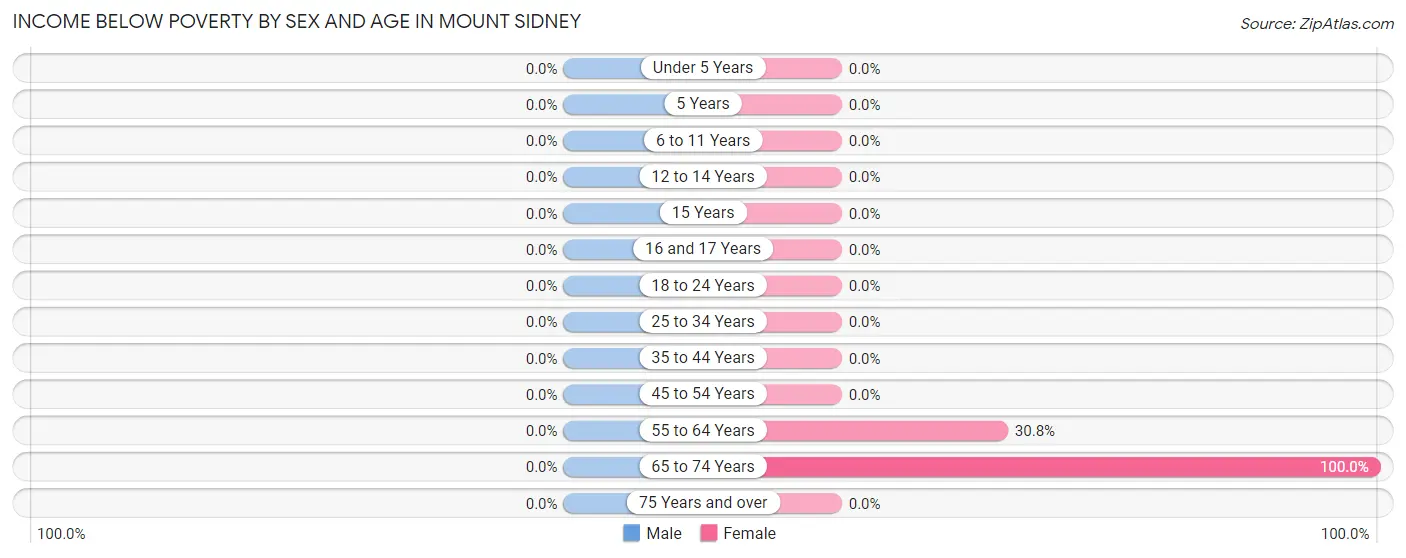
| Age Bracket | Male | Female |
| Under 5 Years | 0 (0.0%) | 0 (0.0%) |
| 5 Years | 0 (0.0%) | 0 (0.0%) |
| 6 to 11 Years | 0 (0.0%) | 0 (0.0%) |
| 12 to 14 Years | 0 (0.0%) | 0 (0.0%) |
| 15 Years | 0 (0.0%) | 0 (0.0%) |
| 16 and 17 Years | 0 (0.0%) | 0 (0.0%) |
| 18 to 24 Years | 0 (0.0%) | 0 (0.0%) |
| 25 to 34 Years | 0 (0.0%) | 0 (0.0%) |
| 35 to 44 Years | 0 (0.0%) | 0 (0.0%) |
| 45 to 54 Years | 0 (0.0%) | 0 (0.0%) |
| 55 to 64 Years | 0 (0.0%) | 41 (30.8%) |
| 65 to 74 Years | 0 (0.0%) | 13 (100.0%) |
| 75 Years and over | 0 (0.0%) | 0 (0.0%) |
| Total | 0 (0.0%) | 54 (10.3%) |
Income Above Poverty by Sex and Age in Mount Sidney
According to the poverty statistics in Mount Sidney, males aged 6 to 11 years and females aged under 5 years are the age groups that are most secure financially, with 100.0% of males and 100.0% of females in these age groups living above the poverty line.
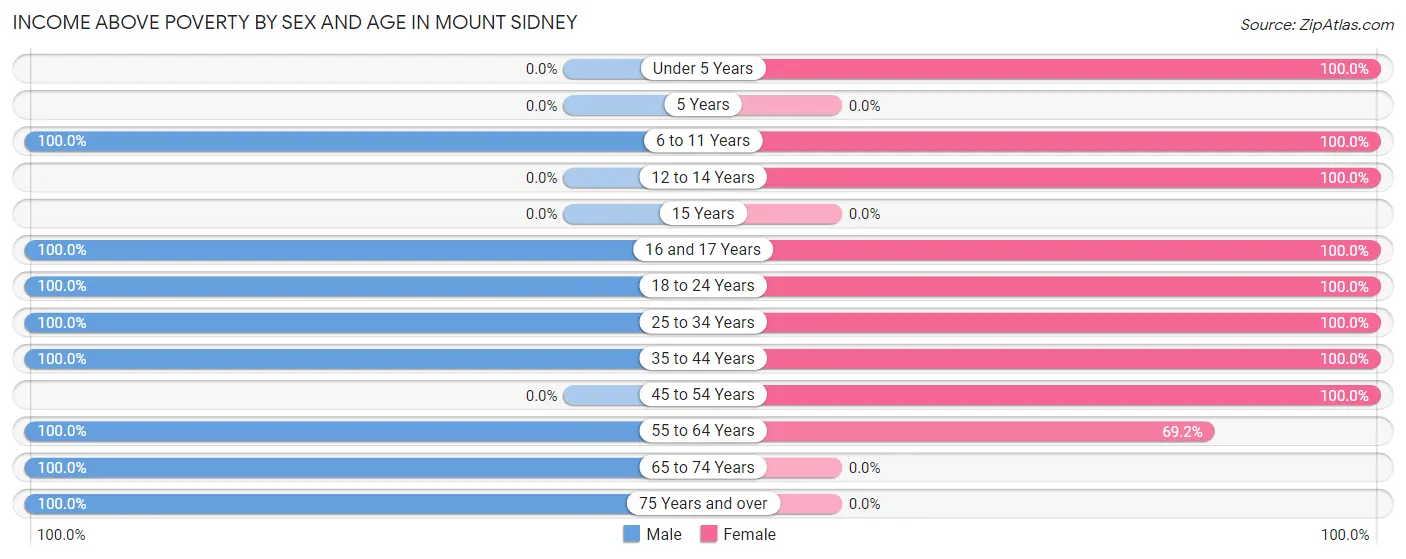
| Age Bracket | Male | Female |
| Under 5 Years | 0 (0.0%) | 13 (100.0%) |
| 5 Years | 0 (0.0%) | 0 (0.0%) |
| 6 to 11 Years | 11 (100.0%) | 56 (100.0%) |
| 12 to 14 Years | 0 (0.0%) | 10 (100.0%) |
| 15 Years | 0 (0.0%) | 0 (0.0%) |
| 16 and 17 Years | 9 (100.0%) | 38 (100.0%) |
| 18 to 24 Years | 93 (100.0%) | 33 (100.0%) |
| 25 to 34 Years | 77 (100.0%) | 42 (100.0%) |
| 35 to 44 Years | 66 (100.0%) | 153 (100.0%) |
| 45 to 54 Years | 0 (0.0%) | 35 (100.0%) |
| 55 to 64 Years | 32 (100.0%) | 92 (69.2%) |
| 65 to 74 Years | 64 (100.0%) | 0 (0.0%) |
| 75 Years and over | 16 (100.0%) | 0 (0.0%) |
| Total | 368 (100.0%) | 472 (89.7%) |
Income Below Poverty Among Married-Couple Families in Mount Sidney
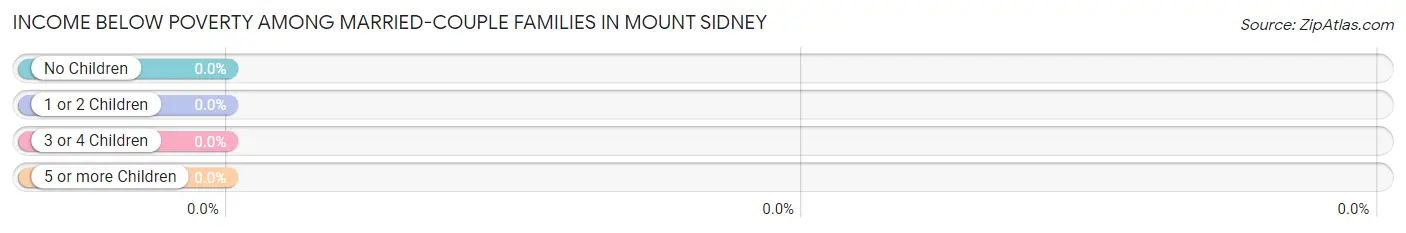
| Children | Above Poverty | Below Poverty |
| No Children | 59 (100.0%) | 0 (0.0%) |
| 1 or 2 Children | 147 (100.0%) | 0 (0.0%) |
| 3 or 4 Children | 0 (0.0%) | 0 (0.0%) |
| 5 or more Children | 0 (0.0%) | 0 (0.0%) |
| Total | 206 (100.0%) | 0 (0.0%) |
Income Below Poverty Among Single-Parent Households in Mount Sidney
| Children | Single Father | Single Mother |
| No Children | 0 (0.0%) | 0 (0.0%) |
| 1 or 2 Children | 0 (0.0%) | 0 (0.0%) |
| 3 or 4 Children | 0 (0.0%) | 0 (0.0%) |
| 5 or more Children | 0 (0.0%) | 0 (0.0%) |
| Total | 0 (0.0%) | 0 (0.0%) |
Income Below Poverty Among Married-Couple vs Single-Parent Households in Mount Sidney
| Children | Married-Couple Families | Single-Parent Households |
| No Children | 0 (0.0%) | 0 (0.0%) |
| 1 or 2 Children | 0 (0.0%) | 0 (0.0%) |
| 3 or 4 Children | 0 (0.0%) | 0 (0.0%) |
| 5 or more Children | 0 (0.0%) | 0 (0.0%) |
| Total | 0 (0.0%) | 0 (0.0%) |
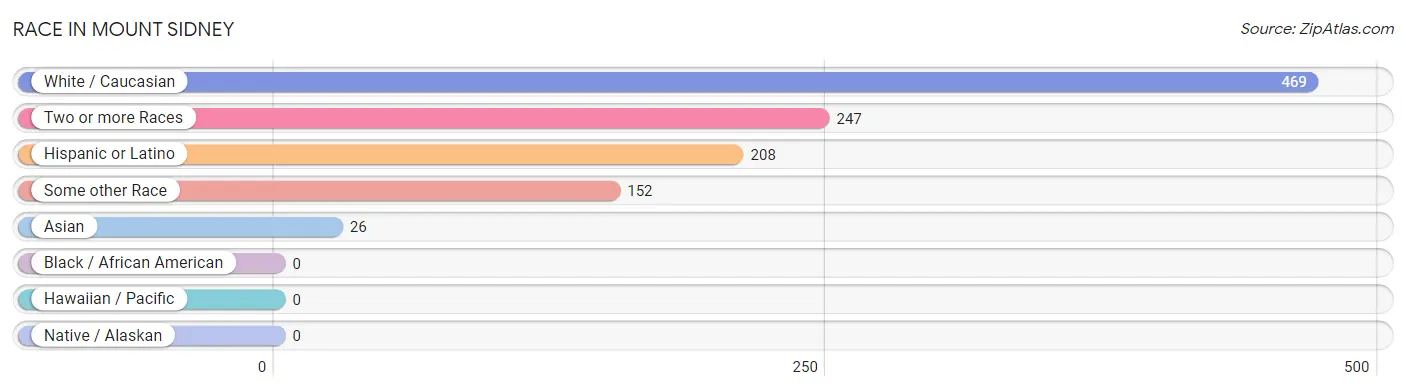
Race in Mount Sidney
The most populous races in Mount Sidney are White / Caucasian (469 | 52.5%), Two or more Races (247 | 27.6%), and Hispanic or Latino (208 | 23.3%).
| Race | # Population | % Population |
| Asian | 26 | 2.9% |
| Black / African American | 0 | 0.0% |
| Hawaiian / Pacific | 0 | 0.0% |
| Hispanic or Latino | 208 | 23.3% |
| Native / Alaskan | 0 | 0.0% |
| White / Caucasian | 469 | 52.5% |
| Two or more Races | 247 | 27.6% |
| Some other Race | 152 | 17.0% |
| Total | 894 | 100.0% |
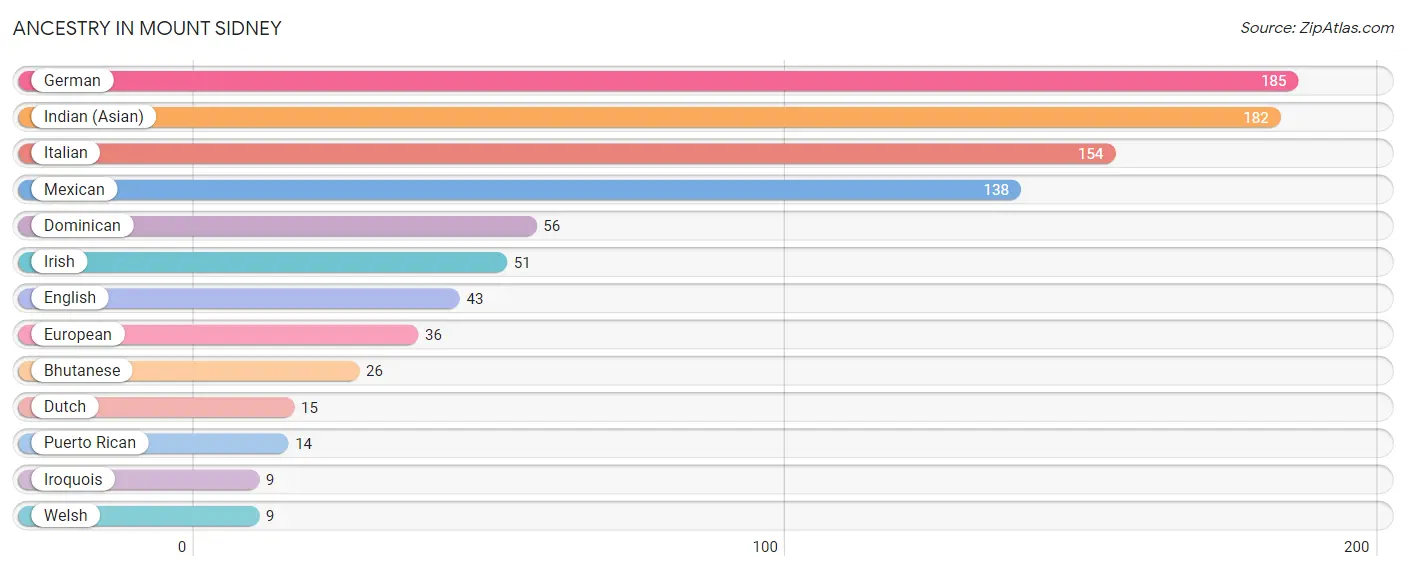
Ancestry in Mount Sidney
The most populous ancestries reported in Mount Sidney are German (185 | 20.7%), Indian (Asian) (182 | 20.4%), Italian (154 | 17.2%), Mexican (138 | 15.4%), and Dominican (56 | 6.3%), together accounting for 80.0% of all Mount Sidney residents.
| Ancestry | # Population | % Population |
| Bhutanese | 26 | 2.9% |
| Dominican | 56 | 6.3% |
| Dutch | 15 | 1.7% |
| English | 43 | 4.8% |
| European | 36 | 4.0% |
| German | 185 | 20.7% |
| Indian (Asian) | 182 | 20.4% |
| Irish | 51 | 5.7% |
| Iroquois | 9 | 1.0% |
| Italian | 154 | 17.2% |
| Mexican | 138 | 15.4% |
| Puerto Rican | 14 | 1.6% |
| Welsh | 9 | 1.0% | View All 13 Rows |
Immigrants in Mount Sidney
The most numerous immigrant groups reported in Mount Sidney came from Latin America (83 | 9.3%), Caribbean (47 | 5.3%), Dominican Republic (47 | 5.3%), Central America (36 | 4.0%), and Mexico (36 | 4.0%), together accounting for 27.9% of all Mount Sidney residents.
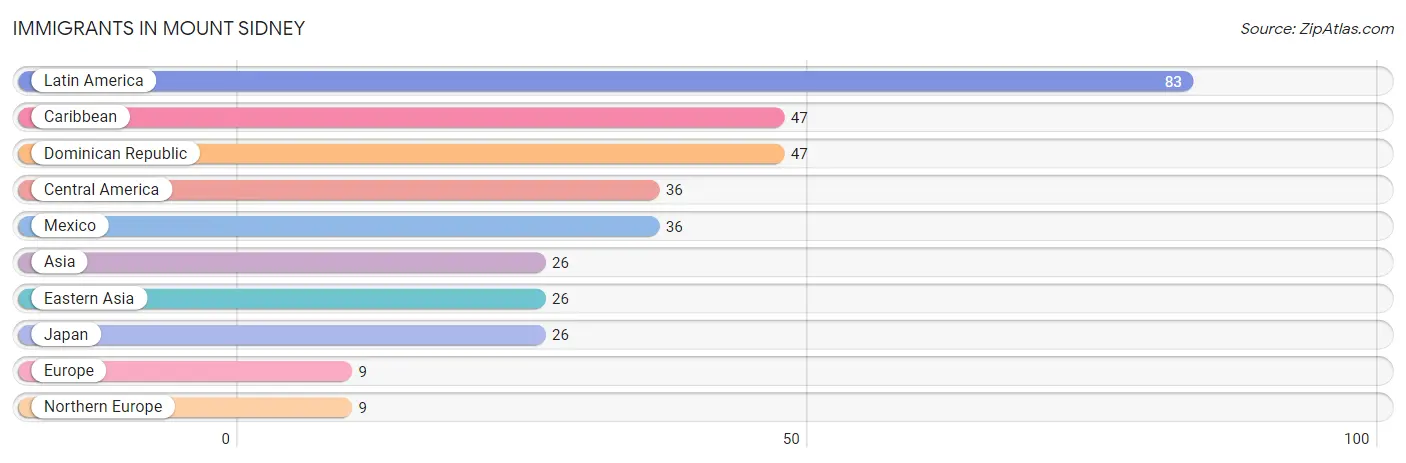
| Immigration Origin | # Population | % Population |
| Asia | 26 | 2.9% |
| Caribbean | 47 | 5.3% |
| Central America | 36 | 4.0% |
| Dominican Republic | 47 | 5.3% |
| Eastern Asia | 26 | 2.9% |
| Europe | 9 | 1.0% |
| Japan | 26 | 2.9% |
| Latin America | 83 | 9.3% |
| Mexico | 36 | 4.0% |
| Northern Europe | 9 | 1.0% | View All 10 Rows |
Sex and Age in Mount Sidney
Sex and Age in Mount Sidney
The most populous age groups in Mount Sidney are 20 to 24 Years (93 | 25.3%) for men and 40 to 44 Years (126 | 23.9%) for women.
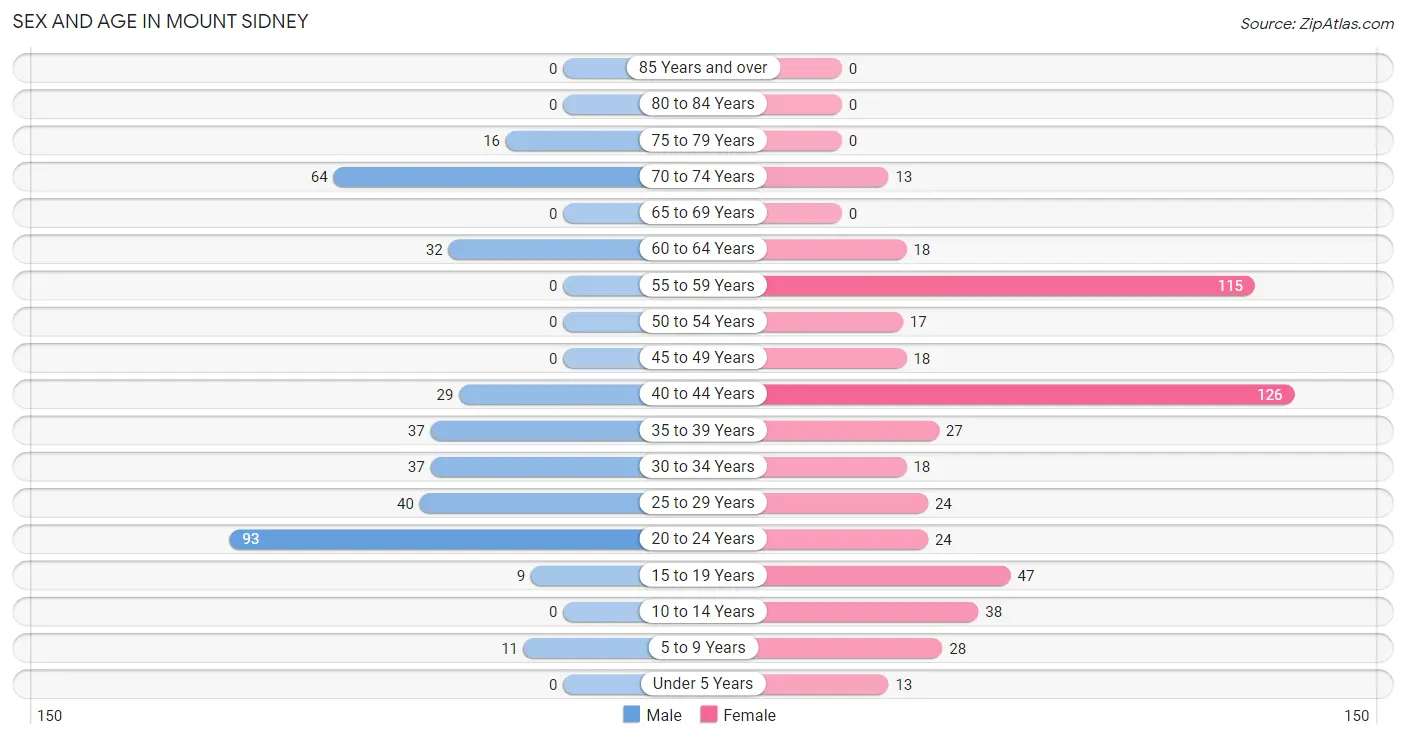
| Age Bracket | Male | Female |
| Under 5 Years | 0 (0.0%) | 13 (2.5%) |
| 5 to 9 Years | 11 (3.0%) | 28 (5.3%) |
| 10 to 14 Years | 0 (0.0%) | 38 (7.2%) |
| 15 to 19 Years | 9 (2.5%) | 47 (8.9%) |
| 20 to 24 Years | 93 (25.3%) | 24 (4.6%) |
| 25 to 29 Years | 40 (10.9%) | 24 (4.6%) |
| 30 to 34 Years | 37 (10.1%) | 18 (3.4%) |
| 35 to 39 Years | 37 (10.1%) | 27 (5.1%) |
| 40 to 44 Years | 29 (7.9%) | 126 (23.9%) |
| 45 to 49 Years | 0 (0.0%) | 18 (3.4%) |
| 50 to 54 Years | 0 (0.0%) | 17 (3.2%) |
| 55 to 59 Years | 0 (0.0%) | 115 (21.9%) |
| 60 to 64 Years | 32 (8.7%) | 18 (3.4%) |
| 65 to 69 Years | 0 (0.0%) | 0 (0.0%) |
| 70 to 74 Years | 64 (17.4%) | 13 (2.5%) |
| 75 to 79 Years | 16 (4.3%) | 0 (0.0%) |
| 80 to 84 Years | 0 (0.0%) | 0 (0.0%) |
| 85 Years and over | 0 (0.0%) | 0 (0.0%) |
| Total | 368 (100.0%) | 526 (100.0%) |
Families and Households in Mount Sidney
Median Family Size in Mount Sidney
The median family size in Mount Sidney is 2.44 persons per family, with single female/mother families (62 | 18.7%) accounting for the largest median family size of 2.98 persons per family. On the other hand, married-couple families (206 | 62.1%) represent the smallest median family size with 2.27 persons per family.
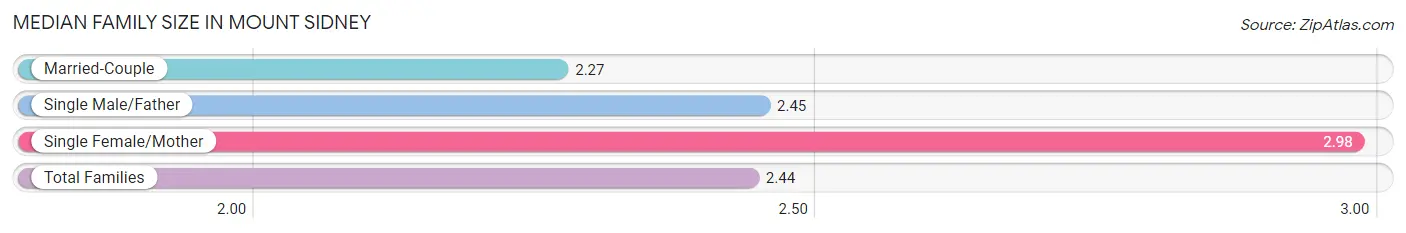
| Family Type | # Families | Family Size |
| Married-Couple | 206 (62.1%) | 2.27 |
| Single Male/Father | 64 (19.3%) | 2.45 |
| Single Female/Mother | 62 (18.7%) | 2.98 |
| Total Families | 332 (100.0%) | 2.44 |
Median Household Size in Mount Sidney
The median household size in Mount Sidney is 2.32 persons per household, with single female/mother households (62 | 16.1%) accounting for the largest median household size of 2.98 persons per household. non-family households (54 | 14.0%) represent the smallest median household size with 1.30 persons per household.
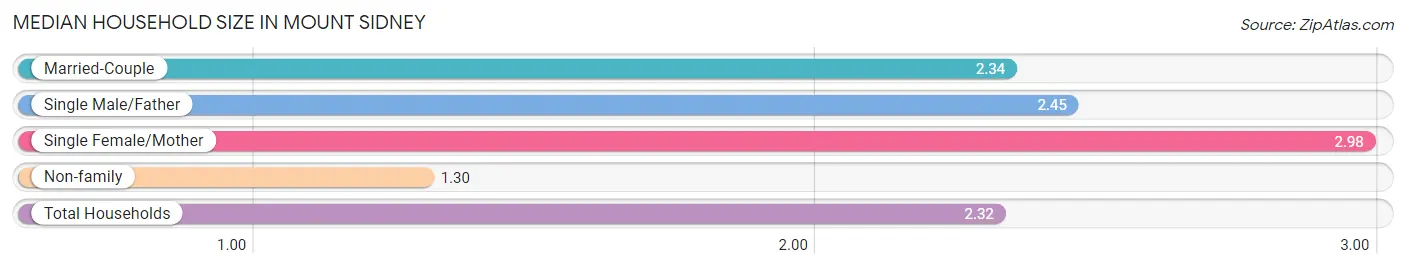
| Household Type | # Households | Household Size |
| Married-Couple | 206 (53.4%) | 2.34 |
| Single Male/Father | 64 (16.6%) | 2.45 |
| Single Female/Mother | 62 (16.1%) | 2.98 |
| Non-family | 54 (14.0%) | 1.30 |
| Total Households | 386 (100.0%) | 2.32 |
Household Size by Marriage Status in Mount Sidney
Out of a total of 386 households in Mount Sidney, 332 (86.0%) are family households, while 54 (14.0%) are nonfamily households. The most numerous type of family households are 4-person households, comprising 160, and the most common type of nonfamily households are 1-person households, comprising 41.
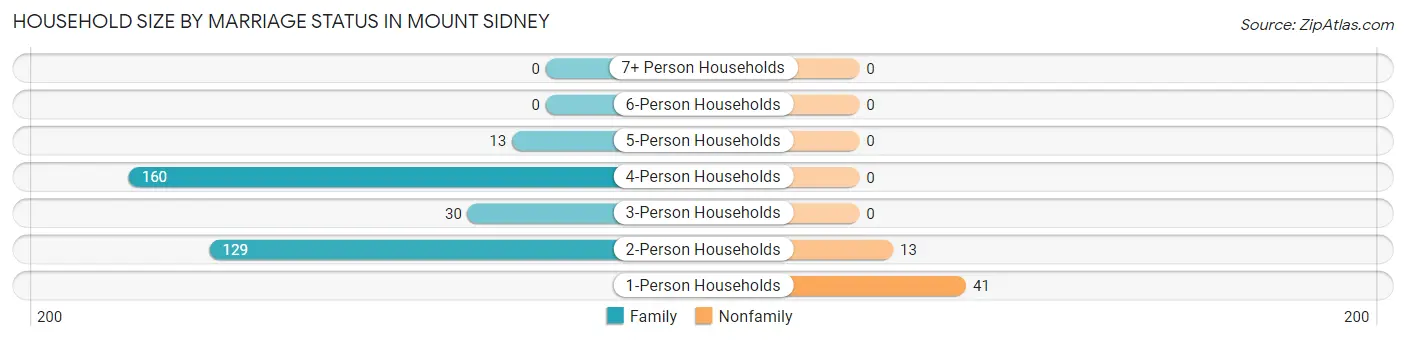
| Household Size | Family Households | Nonfamily Households |
| 1-Person Households | - | 41 (10.6%) |
| 2-Person Households | 129 (33.4%) | 13 (3.4%) |
| 3-Person Households | 30 (7.8%) | 0 (0.0%) |
| 4-Person Households | 160 (41.4%) | 0 (0.0%) |
| 5-Person Households | 13 (3.4%) | 0 (0.0%) |
| 6-Person Households | 0 (0.0%) | 0 (0.0%) |
| 7+ Person Households | 0 (0.0%) | 0 (0.0%) |
| Total | 332 (86.0%) | 54 (14.0%) |
Female Fertility in Mount Sidney
Fertility by Age in Mount Sidney
| Age Bracket | Women with Births | Births / 1,000 Women |
| 15 to 19 years | 0 (0.0%) | 0.0 |
| 20 to 34 years | 0 (0.0%) | 0.0 |
| 35 to 50 years | 0 (0.0%) | 0.0 |
| Total | 0 (0.0%) | 0.0 |
Fertility by Age by Marriage Status in Mount Sidney
| Age Bracket | Married | Unmarried |
| 15 to 19 years | 0 (0.0%) | 0 (0.0%) |
| 20 to 34 years | 0 (0.0%) | 0 (0.0%) |
| 35 to 50 years | 0 (0.0%) | 0 (0.0%) |
| Total | 0 (0.0%) | 0 (0.0%) |
Fertility by Education in Mount Sidney
| Educational Attainment | Women with Births | Births / 1,000 Women |
| Less than High School | 0 (0.0%) | 0.0 |
| High School Diploma | 0 (0.0%) | 0.0 |
| College or Associate's Degree | 0 (0.0%) | 0.0 |
| Bachelor's Degree | 0 (0.0%) | 0.0 |
| Graduate Degree | 0 (0.0%) | 0.0 |
| Total | 0 (0.0%) | 0.0 |
Fertility by Education by Marriage Status in Mount Sidney
| Educational Attainment | Married | Unmarried |
| Less than High School | 0 (0.0%) | 0 (0.0%) |
| High School Diploma | 0 (0.0%) | 0 (0.0%) |
| College or Associate's Degree | 0 (0.0%) | 0 (0.0%) |
| Bachelor's Degree | 0 (0.0%) | 0 (0.0%) |
| Graduate Degree | 0 (0.0%) | 0 (0.0%) |
| Total | 0 (0.0%) | 0 (0.0%) |
Employment Characteristics in Mount Sidney
Employment by Class of Employer in Mount Sidney
Among the 538 employed individuals in Mount Sidney, private company employees (218 | 40.5%), federal government employees (163 | 30.3%), and self-employed (not incorporated) (63 | 11.7%) make up the most common classes of employment.
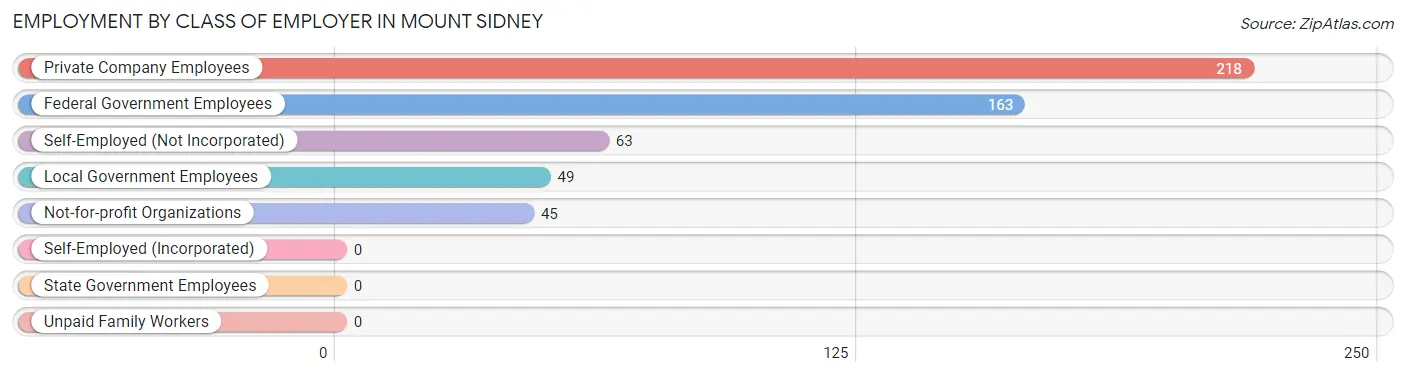
| Employer Class | # Employees | % Employees |
| Private Company Employees | 218 | 40.5% |
| Self-Employed (Incorporated) | 0 | 0.0% |
| Self-Employed (Not Incorporated) | 63 | 11.7% |
| Not-for-profit Organizations | 45 | 8.4% |
| Local Government Employees | 49 | 9.1% |
| State Government Employees | 0 | 0.0% |
| Federal Government Employees | 163 | 30.3% |
| Unpaid Family Workers | 0 | 0.0% |
| Total | 538 | 100.0% |
Employment Status by Age in Mount Sidney
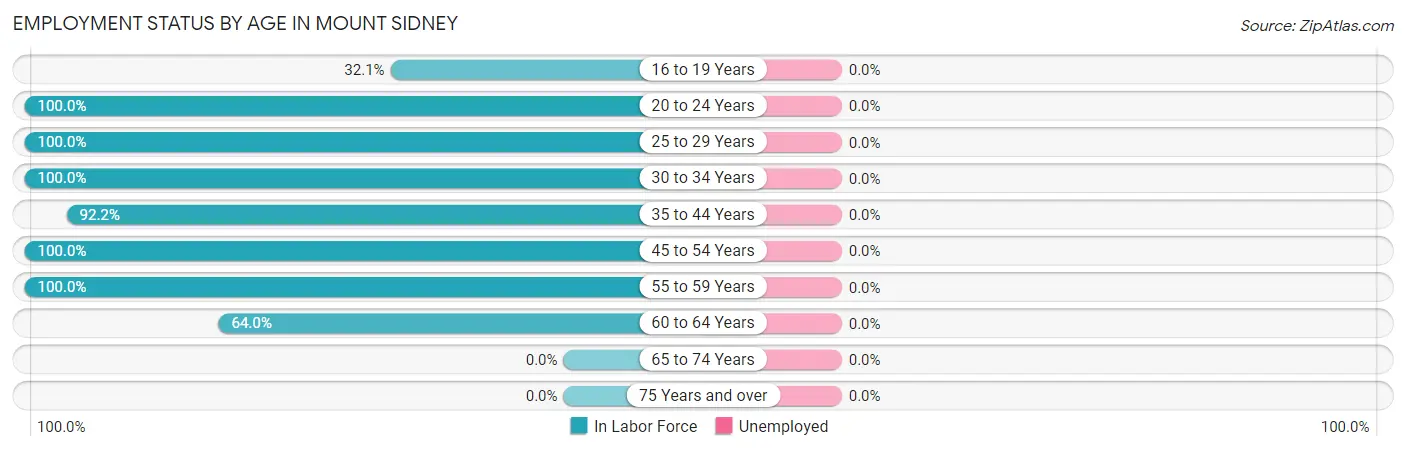
| Age Bracket | In Labor Force | Unemployed |
| 16 to 19 Years | 18 (32.1%) | 0 (0.0%) |
| 20 to 24 Years | 117 (100.0%) | 0 (0.0%) |
| 25 to 29 Years | 64 (100.0%) | 0 (0.0%) |
| 30 to 34 Years | 55 (100.0%) | 0 (0.0%) |
| 35 to 44 Years | 202 (92.2%) | 0 (0.0%) |
| 45 to 54 Years | 35 (100.0%) | 0 (0.0%) |
| 55 to 59 Years | 115 (100.0%) | 0 (0.0%) |
| 60 to 64 Years | 32 (64.0%) | 0 (0.0%) |
| 65 to 74 Years | 0 (0.0%) | 0 (0.0%) |
| 75 Years and over | 0 (0.0%) | 0 (0.0%) |
| Total | 638 (79.4%) | 0 (0.0%) |
Employment Status by Educational Attainment in Mount Sidney
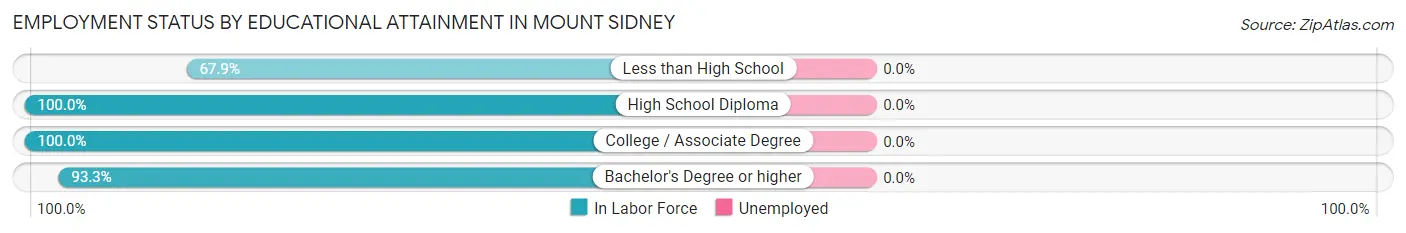
| Educational Attainment | In Labor Force | Unemployed |
| Less than High School | 36 (67.9%) | 0 (0.0%) |
| High School Diploma | 148 (100.0%) | 0 (0.0%) |
| College / Associate Degree | 69 (100.0%) | 0 (0.0%) |
| Bachelor's Degree or higher | 250 (93.3%) | 0 (0.0%) |
| Total | 503 (93.5%) | 0 (0.0%) |
Employment Occupations by Sex in Mount Sidney
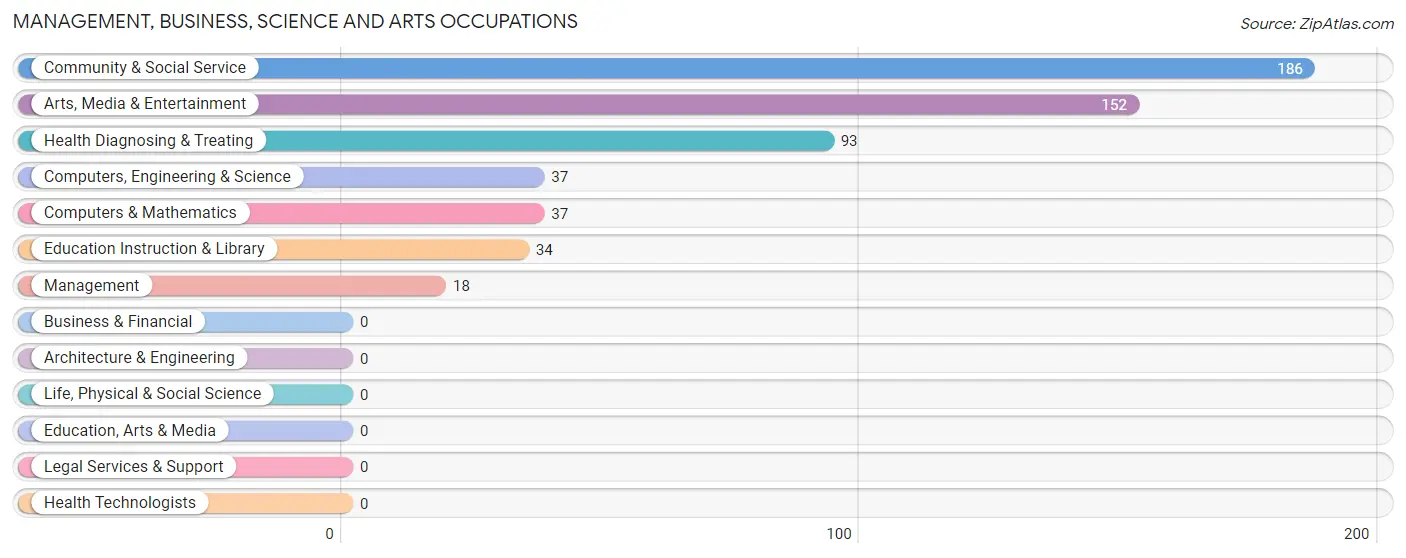
Management, Business, Science and Arts Occupations
The most common Management, Business, Science and Arts occupations in Mount Sidney are Community & Social Service (186 | 29.1%), Arts, Media & Entertainment (152 | 23.8%), Health Diagnosing & Treating (93 | 14.6%), Computers, Engineering & Science (37 | 5.8%), and Computers & Mathematics (37 | 5.8%).
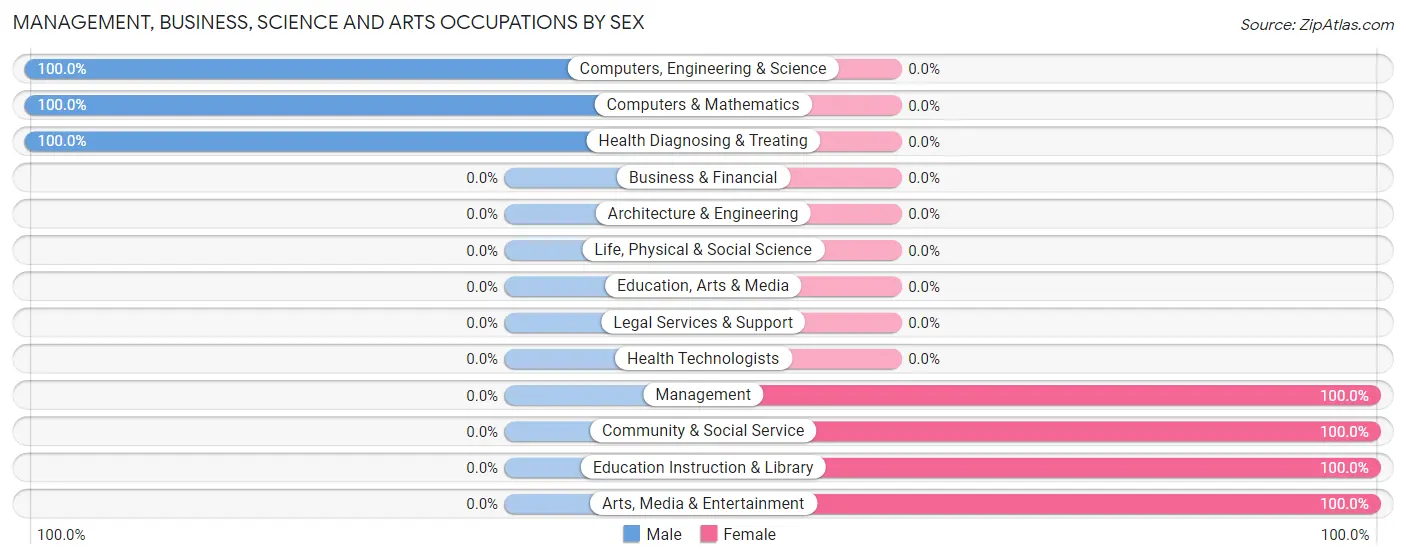
Management, Business, Science and Arts Occupations by Sex
Within the Management, Business, Science and Arts occupations in Mount Sidney, the most male-oriented occupations are Computers, Engineering & Science (100.0%), Computers & Mathematics (100.0%), and Health Diagnosing & Treating (100.0%), while the most female-oriented occupations are Management (100.0%), Community & Social Service (100.0%), and Education Instruction & Library (100.0%).
| Occupation | Male | Female |
| Management | 0 (0.0%) | 18 (100.0%) |
| Business & Financial | 0 (0.0%) | 0 (0.0%) |
| Computers, Engineering & Science | 37 (100.0%) | 0 (0.0%) |
| Computers & Mathematics | 37 (100.0%) | 0 (0.0%) |
| Architecture & Engineering | 0 (0.0%) | 0 (0.0%) |
| Life, Physical & Social Science | 0 (0.0%) | 0 (0.0%) |
| Community & Social Service | 0 (0.0%) | 186 (100.0%) |
| Education, Arts & Media | 0 (0.0%) | 0 (0.0%) |
| Legal Services & Support | 0 (0.0%) | 0 (0.0%) |
| Education Instruction & Library | 0 (0.0%) | 34 (100.0%) |
| Arts, Media & Entertainment | 0 (0.0%) | 152 (100.0%) |
| Health Diagnosing & Treating | 93 (100.0%) | 0 (0.0%) |
| Health Technologists | 0 (0.0%) | 0 (0.0%) |
| Total (Category) | 130 (38.9%) | 204 (61.1%) |
| Total (Overall) | 277 (43.4%) | 361 (56.6%) |
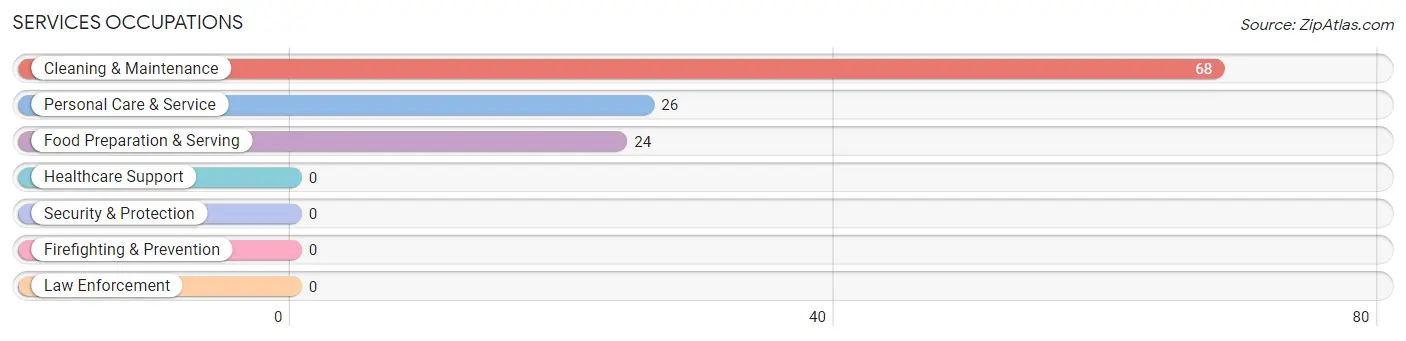
Services Occupations
The most common Services occupations in Mount Sidney are Cleaning & Maintenance (68 | 10.7%), Personal Care & Service (26 | 4.1%), and Food Preparation & Serving (24 | 3.8%).
Services Occupations by Sex
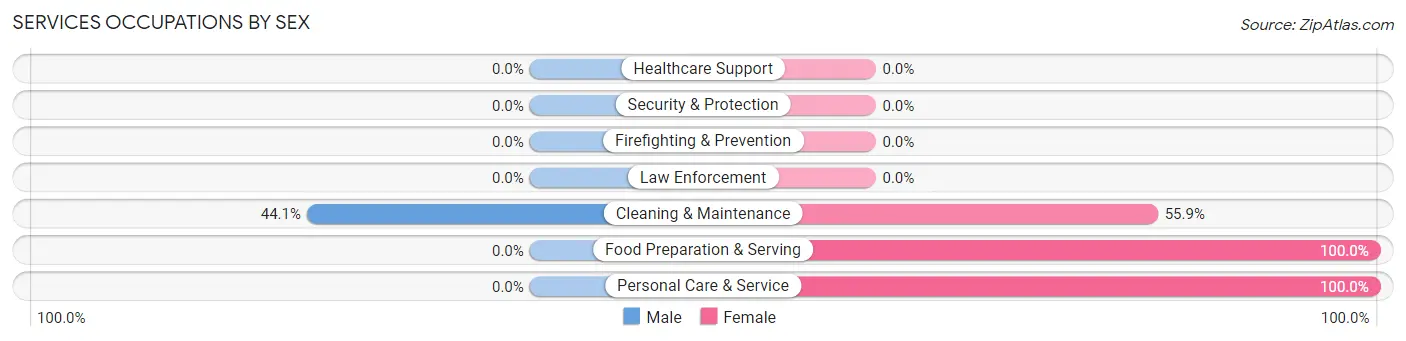
| Occupation | Male | Female |
| Healthcare Support | 0 (0.0%) | 0 (0.0%) |
| Security & Protection | 0 (0.0%) | 0 (0.0%) |
| Firefighting & Prevention | 0 (0.0%) | 0 (0.0%) |
| Law Enforcement | 0 (0.0%) | 0 (0.0%) |
| Food Preparation & Serving | 0 (0.0%) | 24 (100.0%) |
| Cleaning & Maintenance | 30 (44.1%) | 38 (55.9%) |
| Personal Care & Service | 0 (0.0%) | 26 (100.0%) |
| Total (Category) | 30 (25.4%) | 88 (74.6%) |
| Total (Overall) | 277 (43.4%) | 361 (56.6%) |
Sales and Office Occupations
The most common Sales and Office occupations in Mount Sidney are Sales & Related (33 | 5.2%), and Office & Administration (9 | 1.4%).
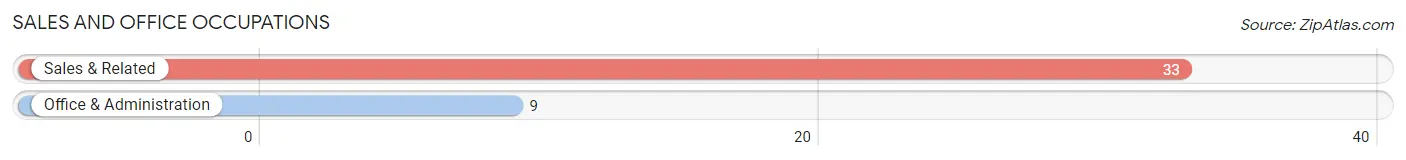
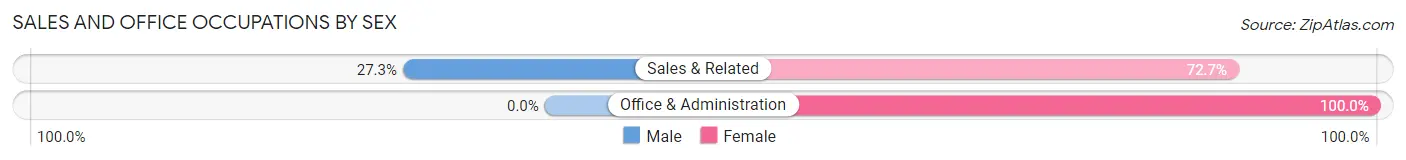
Sales and Office Occupations by Sex
| Occupation | Male | Female |
| Sales & Related | 9 (27.3%) | 24 (72.7%) |
| Office & Administration | 0 (0.0%) | 9 (100.0%) |
| Total (Category) | 9 (21.4%) | 33 (78.6%) |
| Total (Overall) | 277 (43.4%) | 361 (56.6%) |
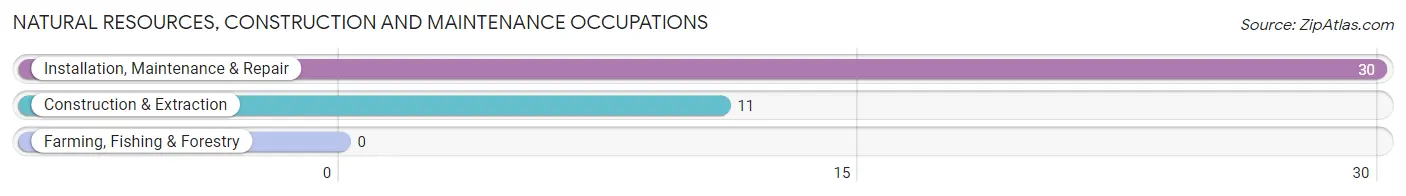
Natural Resources, Construction and Maintenance Occupations
The most common Natural Resources, Construction and Maintenance occupations in Mount Sidney are Installation, Maintenance & Repair (30 | 4.7%), and Construction & Extraction (11 | 1.7%).
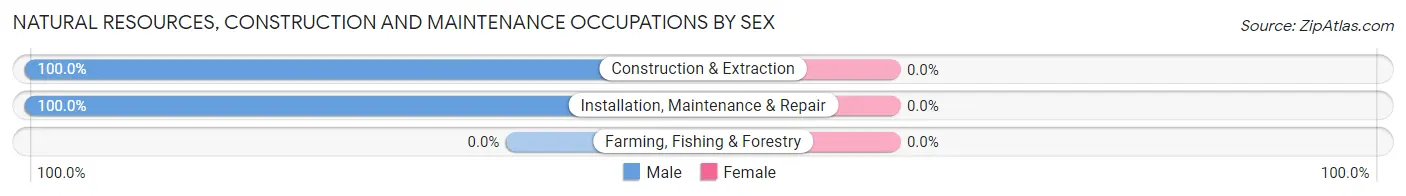
Natural Resources, Construction and Maintenance Occupations by Sex
| Occupation | Male | Female |
| Farming, Fishing & Forestry | 0 (0.0%) | 0 (0.0%) |
| Construction & Extraction | 11 (100.0%) | 0 (0.0%) |
| Installation, Maintenance & Repair | 30 (100.0%) | 0 (0.0%) |
| Total (Category) | 41 (100.0%) | 0 (0.0%) |
| Total (Overall) | 277 (43.4%) | 361 (56.6%) |
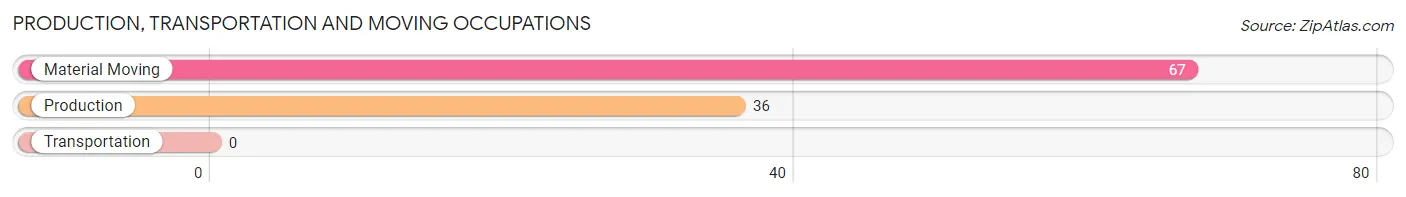
Production, Transportation and Moving Occupations
The most common Production, Transportation and Moving occupations in Mount Sidney are Material Moving (67 | 10.5%), and Production (36 | 5.6%).
Production, Transportation and Moving Occupations by Sex
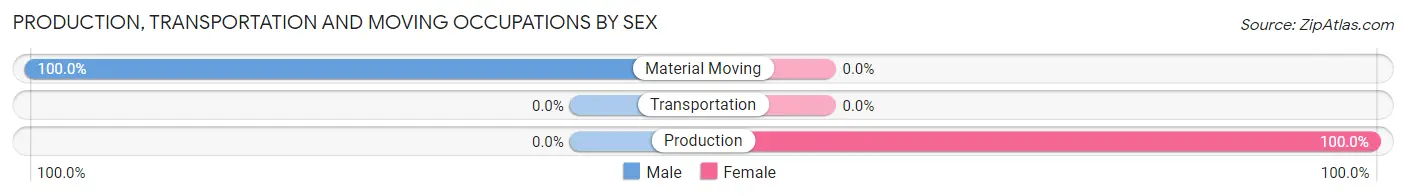
| Occupation | Male | Female |
| Production | 0 (0.0%) | 36 (100.0%) |
| Transportation | 0 (0.0%) | 0 (0.0%) |
| Material Moving | 67 (100.0%) | 0 (0.0%) |
| Total (Category) | 67 (65.0%) | 36 (34.9%) |
| Total (Overall) | 277 (43.4%) | 361 (56.6%) |
Employment Industries by Sex in Mount Sidney
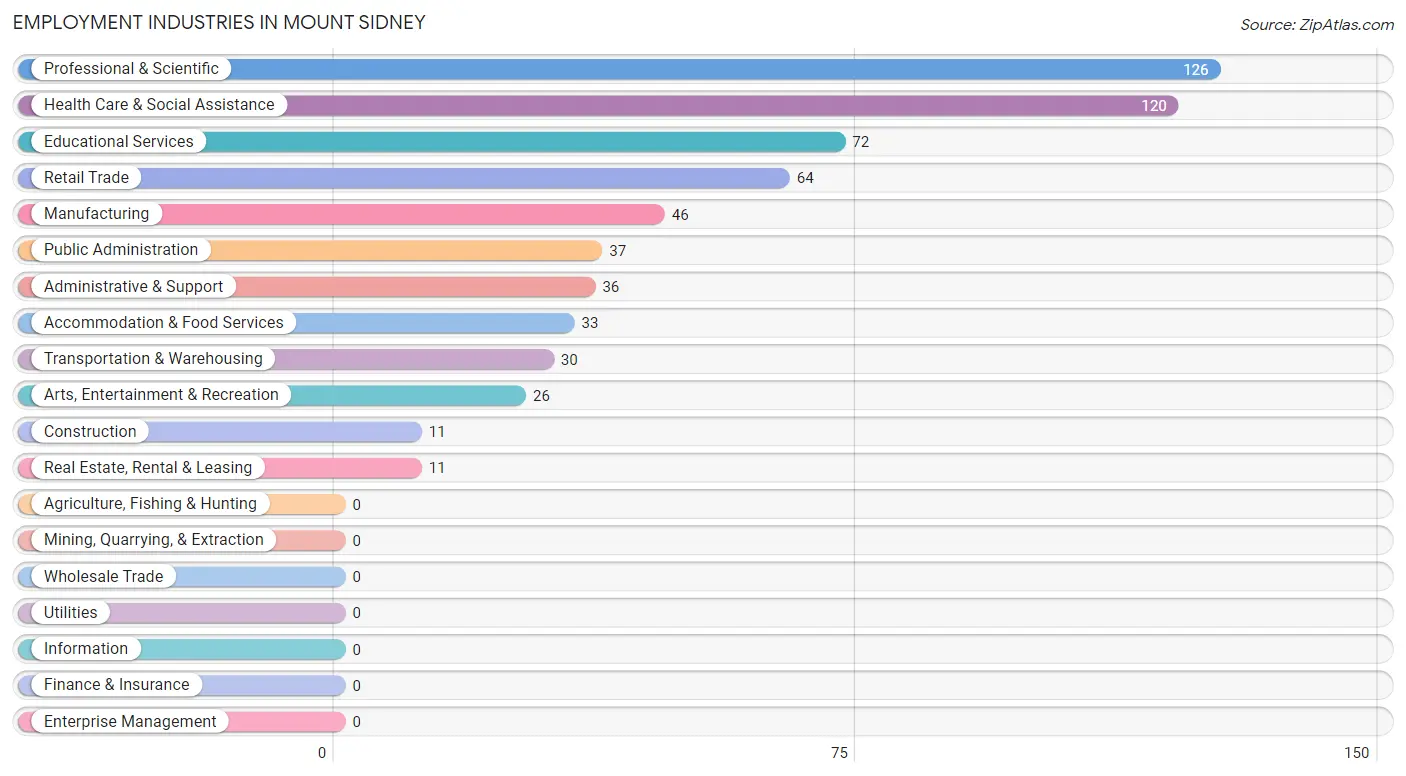
Employment Industries in Mount Sidney
The major employment industries in Mount Sidney include Professional & Scientific (126 | 19.8%), Health Care & Social Assistance (120 | 18.8%), Educational Services (72 | 11.3%), Retail Trade (64 | 10.0%), and Manufacturing (46 | 7.2%).
Employment Industries by Sex in Mount Sidney
The Mount Sidney industries that see more men than women are Construction (100.0%), Manufacturing (100.0%), and Transportation & Warehousing (100.0%), whereas the industries that tend to have a higher number of women are Professional & Scientific (100.0%), Administrative & Support (100.0%), and Educational Services (100.0%).
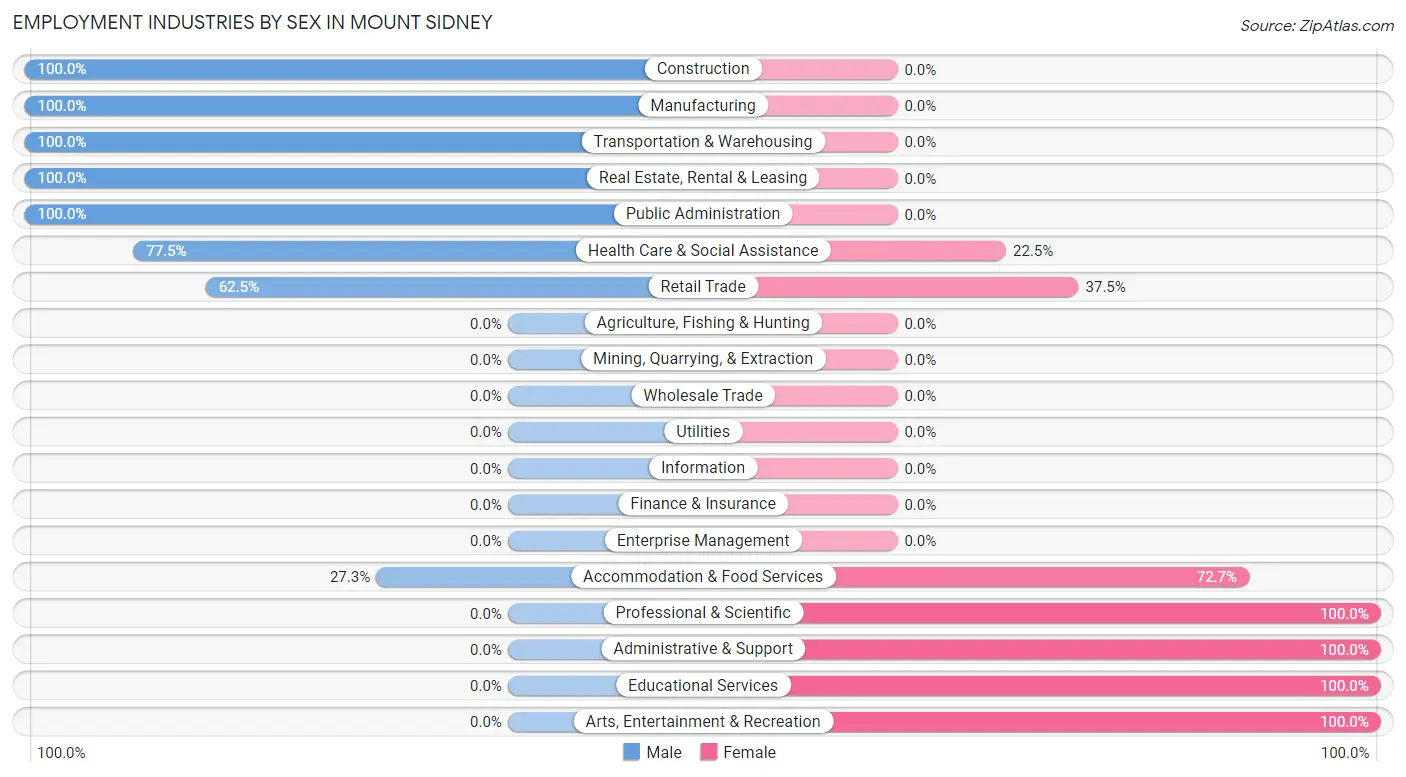
| Industry | Male | Female |
| Agriculture, Fishing & Hunting | 0 (0.0%) | 0 (0.0%) |
| Mining, Quarrying, & Extraction | 0 (0.0%) | 0 (0.0%) |
| Construction | 11 (100.0%) | 0 (0.0%) |
| Manufacturing | 46 (100.0%) | 0 (0.0%) |
| Wholesale Trade | 0 (0.0%) | 0 (0.0%) |
| Retail Trade | 40 (62.5%) | 24 (37.5%) |
| Transportation & Warehousing | 30 (100.0%) | 0 (0.0%) |
| Utilities | 0 (0.0%) | 0 (0.0%) |
| Information | 0 (0.0%) | 0 (0.0%) |
| Finance & Insurance | 0 (0.0%) | 0 (0.0%) |
| Real Estate, Rental & Leasing | 11 (100.0%) | 0 (0.0%) |
| Professional & Scientific | 0 (0.0%) | 126 (100.0%) |
| Enterprise Management | 0 (0.0%) | 0 (0.0%) |
| Administrative & Support | 0 (0.0%) | 36 (100.0%) |
| Educational Services | 0 (0.0%) | 72 (100.0%) |
| Health Care & Social Assistance | 93 (77.5%) | 27 (22.5%) |
| Arts, Entertainment & Recreation | 0 (0.0%) | 26 (100.0%) |
| Accommodation & Food Services | 9 (27.3%) | 24 (72.7%) |
| Public Administration | 37 (100.0%) | 0 (0.0%) |
| Total | 277 (43.4%) | 361 (56.6%) |
Education in Mount Sidney
School Enrollment in Mount Sidney
The most common levels of schooling among the 166 students in Mount Sidney are high school (47 | 28.3%), elementary school (39 | 23.5%), and middle school (38 | 22.9%).
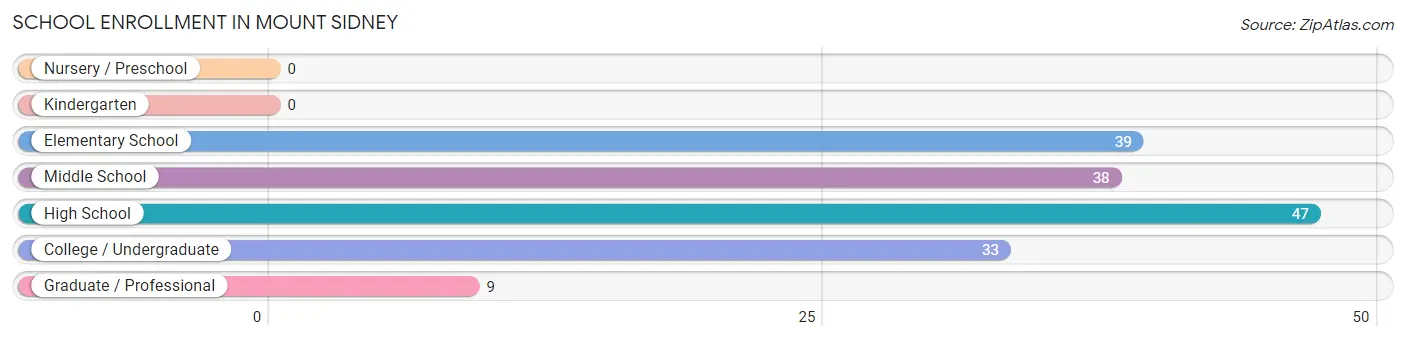
| School Level | # Students | % Students |
| Nursery / Preschool | 0 | 0.0% |
| Kindergarten | 0 | 0.0% |
| Elementary School | 39 | 23.5% |
| Middle School | 38 | 22.9% |
| High School | 47 | 28.3% |
| College / Undergraduate | 33 | 19.9% |
| Graduate / Professional | 9 | 5.4% |
| Total | 166 | 100.0% |
School Enrollment by Age by Funding Source in Mount Sidney
Out of a total of 166 students who are enrolled in schools in Mount Sidney, 28 (16.9%) attend a private institution, while the remaining 138 (83.1%) are enrolled in public schools. The age group of 5 to 9 year old has the highest likelihood of being enrolled in private schools, with 28 (71.8% in the age bracket) enrolled. Conversely, the age group of 10 to 14 year olds has the lowest likelihood of being enrolled in a private school, with 38 (100.0% in the age bracket) attending a public institution.
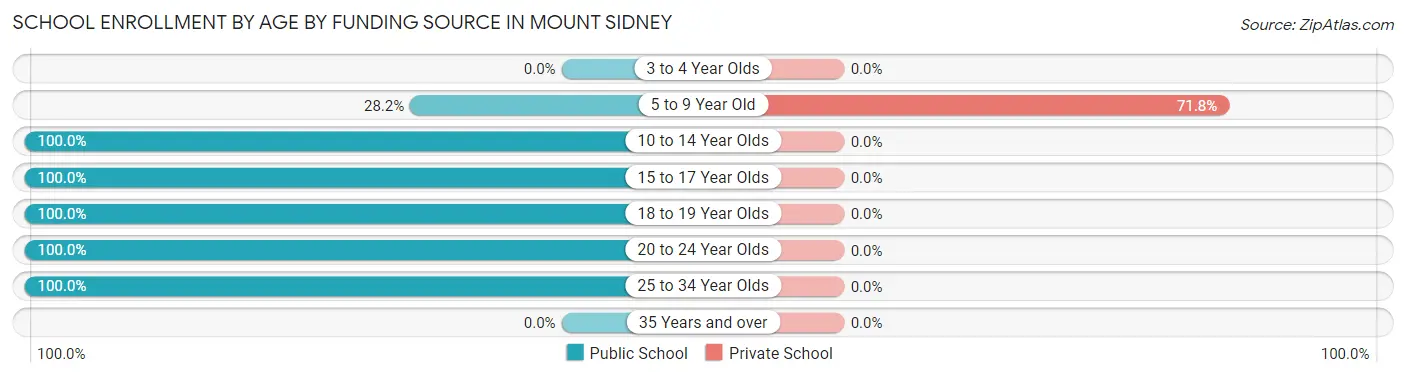
| Age Bracket | Public School | Private School |
| 3 to 4 Year Olds | 0 (0.0%) | 0 (0.0%) |
| 5 to 9 Year Old | 11 (28.2%) | 28 (71.8%) |
| 10 to 14 Year Olds | 38 (100.0%) | 0 (0.0%) |
| 15 to 17 Year Olds | 47 (100.0%) | 0 (0.0%) |
| 18 to 19 Year Olds | 9 (100.0%) | 0 (0.0%) |
| 20 to 24 Year Olds | 24 (100.0%) | 0 (0.0%) |
| 25 to 34 Year Olds | 9 (100.0%) | 0 (0.0%) |
| 35 Years and over | 0 (0.0%) | 0 (0.0%) |
| Total | 138 (83.1%) | 28 (16.9%) |
Educational Attainment by Field of Study in Mount Sidney
Computers & mathematics (163 | 54.5%), psychology (36 | 12.0%), arts & humanities (27 | 9.0%), education (24 | 8.0%), and visual & performing arts (18 | 6.0%) are the most common fields of study among 299 individuals in Mount Sidney who have obtained a bachelor's degree or higher.
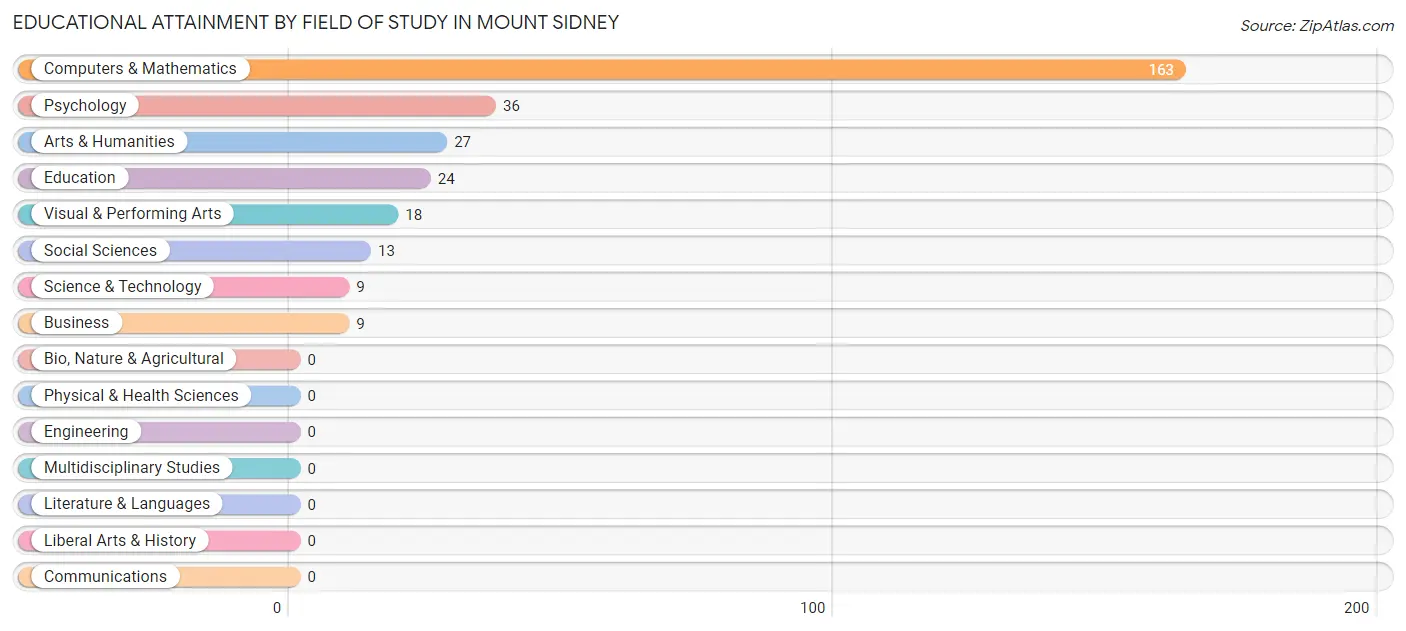
| Field of Study | # Graduates | % Graduates |
| Computers & Mathematics | 163 | 54.5% |
| Bio, Nature & Agricultural | 0 | 0.0% |
| Physical & Health Sciences | 0 | 0.0% |
| Psychology | 36 | 12.0% |
| Social Sciences | 13 | 4.3% |
| Engineering | 0 | 0.0% |
| Multidisciplinary Studies | 0 | 0.0% |
| Science & Technology | 9 | 3.0% |
| Business | 9 | 3.0% |
| Education | 24 | 8.0% |
| Literature & Languages | 0 | 0.0% |
| Liberal Arts & History | 0 | 0.0% |
| Visual & Performing Arts | 18 | 6.0% |
| Communications | 0 | 0.0% |
| Arts & Humanities | 27 | 9.0% |
| Total | 299 | 100.0% |
Transportation & Commute in Mount Sidney
Vehicle Availability by Sex in Mount Sidney
The most prevalent vehicle ownership categories in Mount Sidney are males with 2 vehicles (179, accounting for 75.5%) and females with 2 vehicles (201, making up 59.5%).
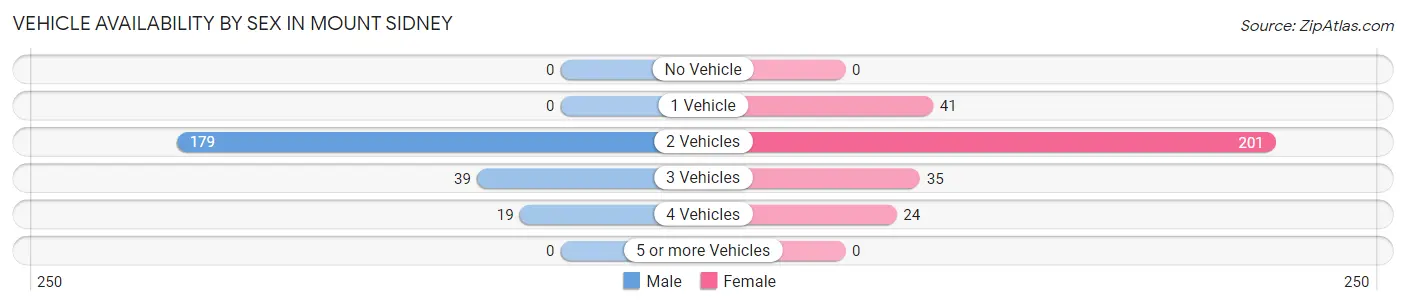
| Vehicles Available | Male | Female |
| No Vehicle | 0 (0.0%) | 0 (0.0%) |
| 1 Vehicle | 0 (0.0%) | 41 (13.6%) |
| 2 Vehicles | 179 (75.5%) | 201 (66.8%) |
| 3 Vehicles | 39 (16.5%) | 35 (11.6%) |
| 4 Vehicles | 19 (8.0%) | 24 (8.0%) |
| 5 or more Vehicles | 0 (0.0%) | 0 (0.0%) |
| Total | 237 (100.0%) | 301 (100.0%) |
Commute Time in Mount Sidney
The most frequently occuring commute durations in Mount Sidney are 20 to 24 minutes (301 commuters, 58.8%), 10 to 14 minutes (59 commuters, 11.5%), and 15 to 19 minutes (43 commuters, 8.4%).
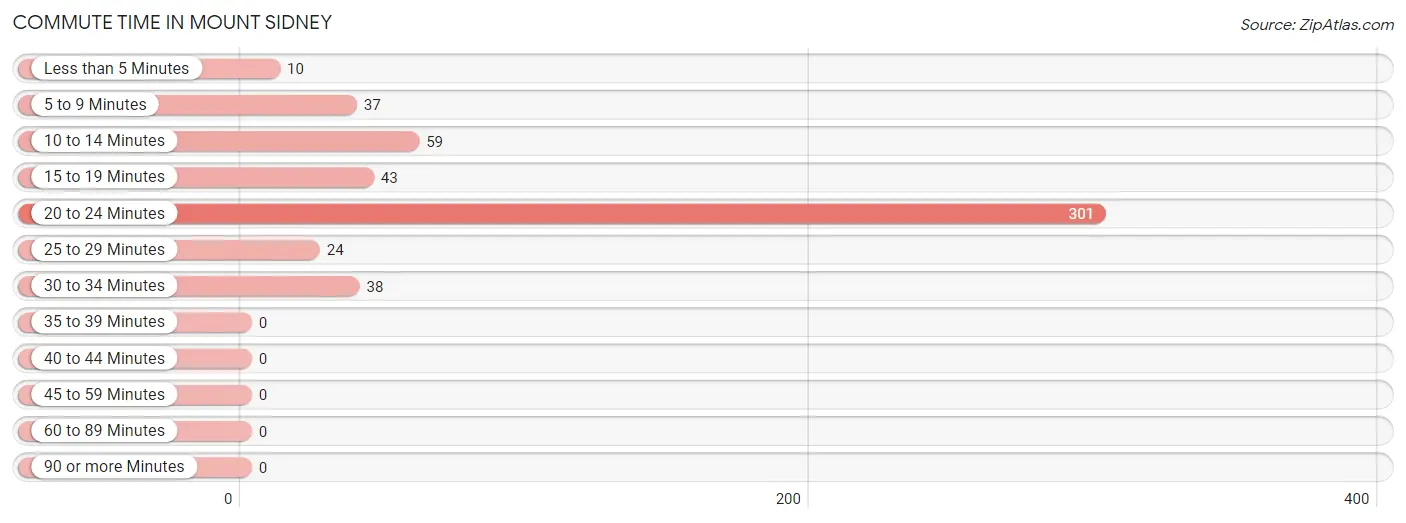
| Commute Time | # Commuters | % Commuters |
| Less than 5 Minutes | 10 | 1.9% |
| 5 to 9 Minutes | 37 | 7.2% |
| 10 to 14 Minutes | 59 | 11.5% |
| 15 to 19 Minutes | 43 | 8.4% |
| 20 to 24 Minutes | 301 | 58.8% |
| 25 to 29 Minutes | 24 | 4.7% |
| 30 to 34 Minutes | 38 | 7.4% |
| 35 to 39 Minutes | 0 | 0.0% |
| 40 to 44 Minutes | 0 | 0.0% |
| 45 to 59 Minutes | 0 | 0.0% |
| 60 to 89 Minutes | 0 | 0.0% |
| 90 or more Minutes | 0 | 0.0% |
Commute Time by Sex in Mount Sidney
The most common commute times in Mount Sidney are 20 to 24 minutes (107 commuters, 45.2%) for males and 20 to 24 minutes (194 commuters, 70.6%) for females.
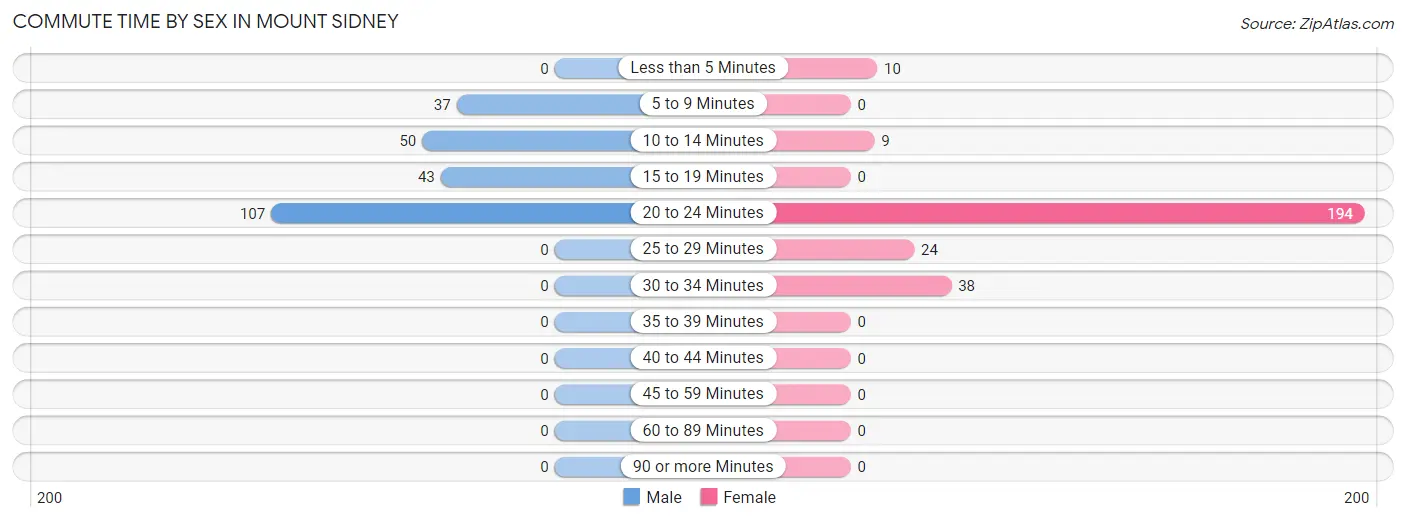
| Commute Time | Male | Female |
| Less than 5 Minutes | 0 (0.0%) | 10 (3.6%) |
| 5 to 9 Minutes | 37 (15.6%) | 0 (0.0%) |
| 10 to 14 Minutes | 50 (21.1%) | 9 (3.3%) |
| 15 to 19 Minutes | 43 (18.1%) | 0 (0.0%) |
| 20 to 24 Minutes | 107 (45.2%) | 194 (70.6%) |
| 25 to 29 Minutes | 0 (0.0%) | 24 (8.7%) |
| 30 to 34 Minutes | 0 (0.0%) | 38 (13.8%) |
| 35 to 39 Minutes | 0 (0.0%) | 0 (0.0%) |
| 40 to 44 Minutes | 0 (0.0%) | 0 (0.0%) |
| 45 to 59 Minutes | 0 (0.0%) | 0 (0.0%) |
| 60 to 89 Minutes | 0 (0.0%) | 0 (0.0%) |
| 90 or more Minutes | 0 (0.0%) | 0 (0.0%) |
Time of Departure to Work by Sex in Mount Sidney
The most frequent times of departure to work in Mount Sidney are 11:00 AM to 11:59 AM (93, 39.2%) for males and 10:00 AM to 10:59 AM (135, 49.1%) for females.
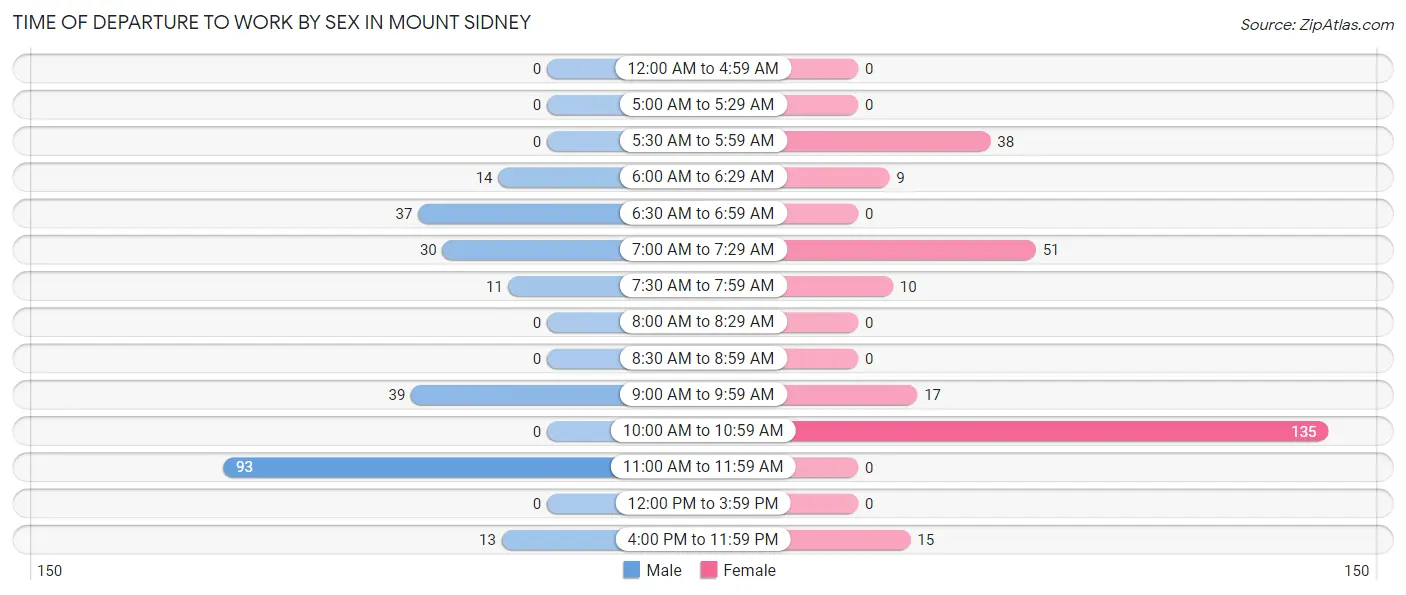
| Time of Departure | Male | Female |
| 12:00 AM to 4:59 AM | 0 (0.0%) | 0 (0.0%) |
| 5:00 AM to 5:29 AM | 0 (0.0%) | 0 (0.0%) |
| 5:30 AM to 5:59 AM | 0 (0.0%) | 38 (13.8%) |
| 6:00 AM to 6:29 AM | 14 (5.9%) | 9 (3.3%) |
| 6:30 AM to 6:59 AM | 37 (15.6%) | 0 (0.0%) |
| 7:00 AM to 7:29 AM | 30 (12.7%) | 51 (18.5%) |
| 7:30 AM to 7:59 AM | 11 (4.6%) | 10 (3.6%) |
| 8:00 AM to 8:29 AM | 0 (0.0%) | 0 (0.0%) |
| 8:30 AM to 8:59 AM | 0 (0.0%) | 0 (0.0%) |
| 9:00 AM to 9:59 AM | 39 (16.5%) | 17 (6.2%) |
| 10:00 AM to 10:59 AM | 0 (0.0%) | 135 (49.1%) |
| 11:00 AM to 11:59 AM | 93 (39.2%) | 0 (0.0%) |
| 12:00 PM to 3:59 PM | 0 (0.0%) | 0 (0.0%) |
| 4:00 PM to 11:59 PM | 13 (5.5%) | 15 (5.4%) |
| Total | 237 (100.0%) | 275 (100.0%) |
Housing Occupancy in Mount Sidney
Occupancy by Ownership in Mount Sidney
Of the total 386 dwellings in Mount Sidney, owner-occupied units account for 226 (58.6%), while renter-occupied units make up 160 (41.4%).
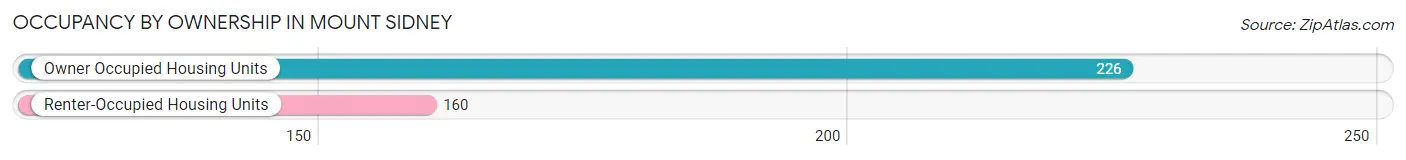
| Occupancy | # Housing Units | % Housing Units |
| Owner Occupied Housing Units | 226 | 58.6% |
| Renter-Occupied Housing Units | 160 | 41.4% |
| Total Occupied Housing Units | 386 | 100.0% |
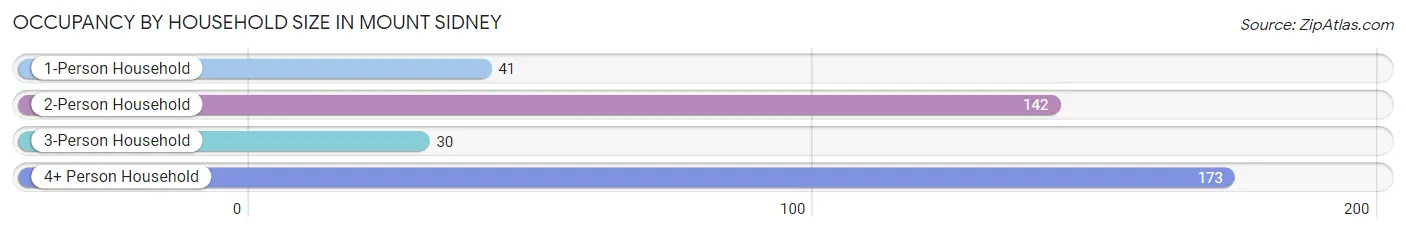
Occupancy by Household Size in Mount Sidney
| Household Size | # Housing Units | % Housing Units |
| 1-Person Household | 41 | 10.6% |
| 2-Person Household | 142 | 36.8% |
| 3-Person Household | 30 | 7.8% |
| 4+ Person Household | 173 | 44.8% |
| Total Housing Units | 386 | 100.0% |
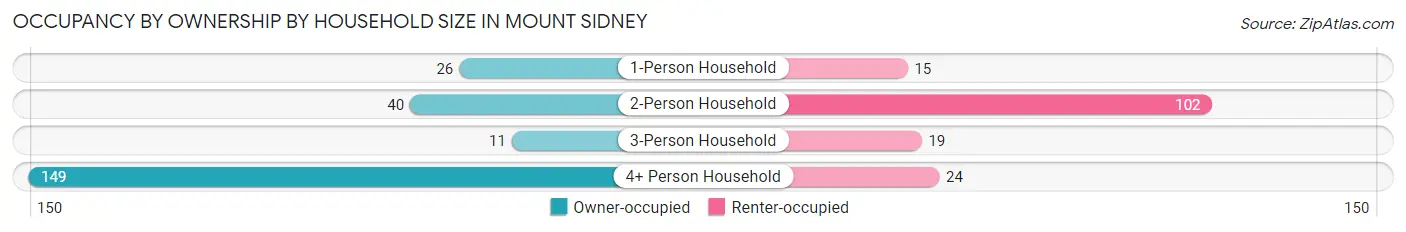
Occupancy by Ownership by Household Size in Mount Sidney
| Household Size | Owner-occupied | Renter-occupied |
| 1-Person Household | 26 (63.4%) | 15 (36.6%) |
| 2-Person Household | 40 (28.2%) | 102 (71.8%) |
| 3-Person Household | 11 (36.7%) | 19 (63.3%) |
| 4+ Person Household | 149 (86.1%) | 24 (13.9%) |
| Total Housing Units | 226 (58.6%) | 160 (41.4%) |
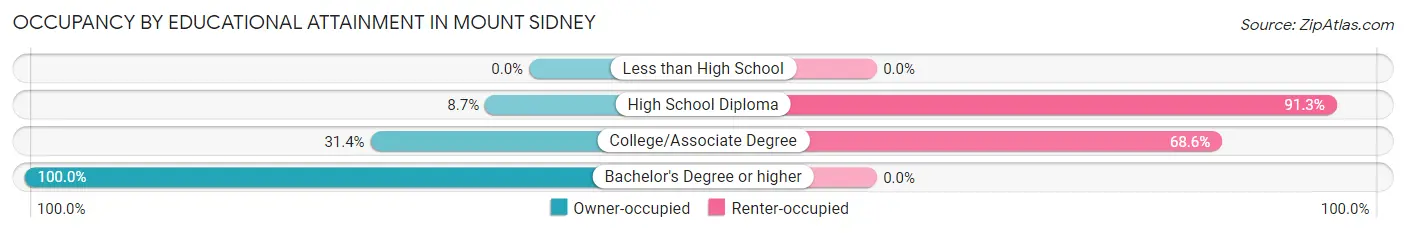
Occupancy by Educational Attainment in Mount Sidney
| Household Size | Owner-occupied | Renter-occupied |
| Less than High School | 0 (0.0%) | 0 (0.0%) |
| High School Diploma | 13 (8.7%) | 136 (91.3%) |
| College/Associate Degree | 11 (31.4%) | 24 (68.6%) |
| Bachelor's Degree or higher | 202 (100.0%) | 0 (0.0%) |
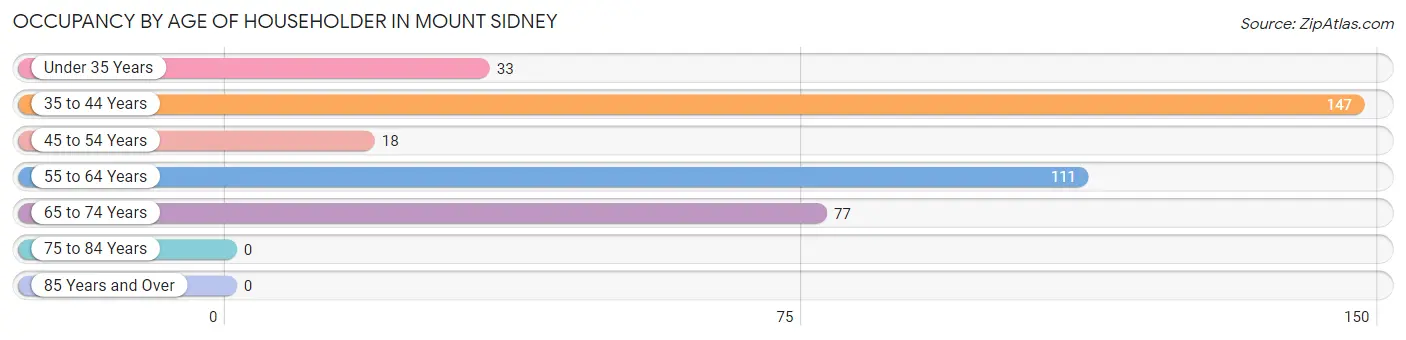
Occupancy by Age of Householder in Mount Sidney
| Age Bracket | # Households | % Households |
| Under 35 Years | 33 | 8.6% |
| 35 to 44 Years | 147 | 38.1% |
| 45 to 54 Years | 18 | 4.7% |
| 55 to 64 Years | 111 | 28.8% |
| 65 to 74 Years | 77 | 20.0% |
| 75 to 84 Years | 0 | 0.0% |
| 85 Years and Over | 0 | 0.0% |
| Total | 386 | 100.0% |
Housing Finances in Mount Sidney
Median Income by Occupancy in Mount Sidney
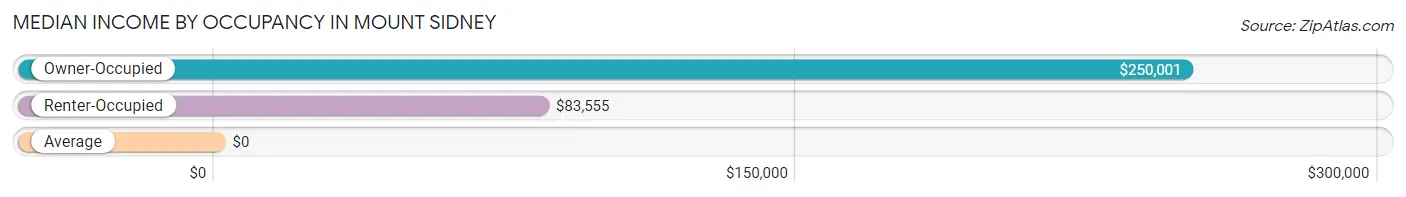
| Occupancy Type | # Households | Median Income |
| Owner-Occupied | 226 (58.6%) | $250,001 |
| Renter-Occupied | 160 (41.4%) | $83,555 |
| Average | 386 (100.0%) | $0 |
Occupancy by Householder Income Bracket in Mount Sidney
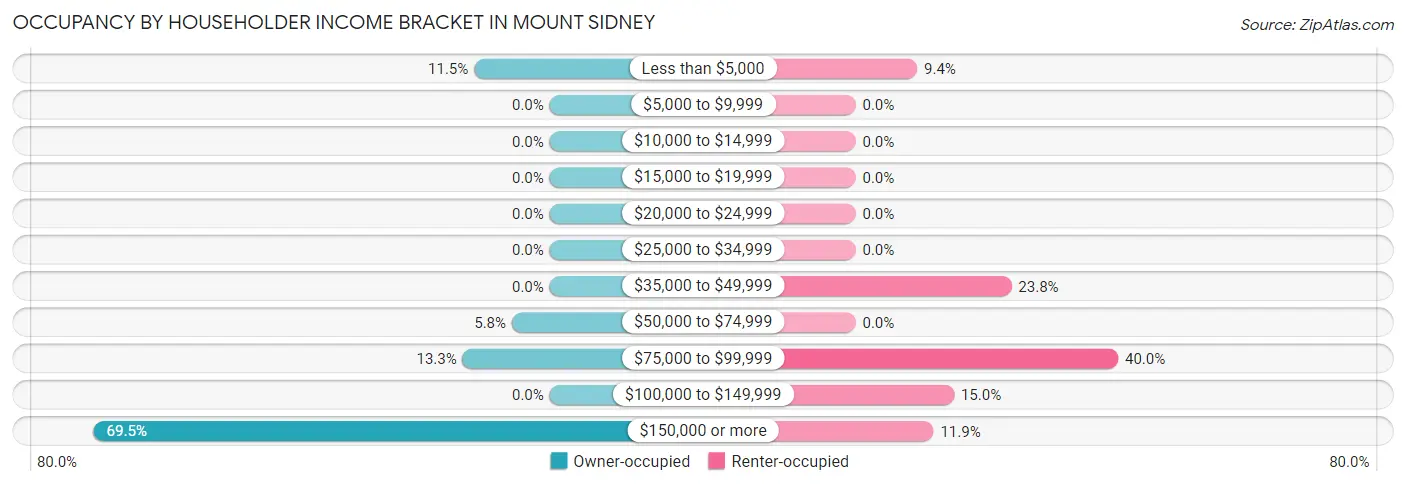
| Income Bracket | Owner-occupied | Renter-occupied |
| Less than $5,000 | 26 (11.5%) | 15 (9.4%) |
| $5,000 to $9,999 | 0 (0.0%) | 0 (0.0%) |
| $10,000 to $14,999 | 0 (0.0%) | 0 (0.0%) |
| $15,000 to $19,999 | 0 (0.0%) | 0 (0.0%) |
| $20,000 to $24,999 | 0 (0.0%) | 0 (0.0%) |
| $25,000 to $34,999 | 0 (0.0%) | 0 (0.0%) |
| $35,000 to $49,999 | 0 (0.0%) | 38 (23.7%) |
| $50,000 to $74,999 | 13 (5.8%) | 0 (0.0%) |
| $75,000 to $99,999 | 30 (13.3%) | 64 (40.0%) |
| $100,000 to $149,999 | 0 (0.0%) | 24 (15.0%) |
| $150,000 or more | 157 (69.5%) | 19 (11.9%) |
| Total | 226 (100.0%) | 160 (100.0%) |
Monthly Housing Cost Tiers in Mount Sidney
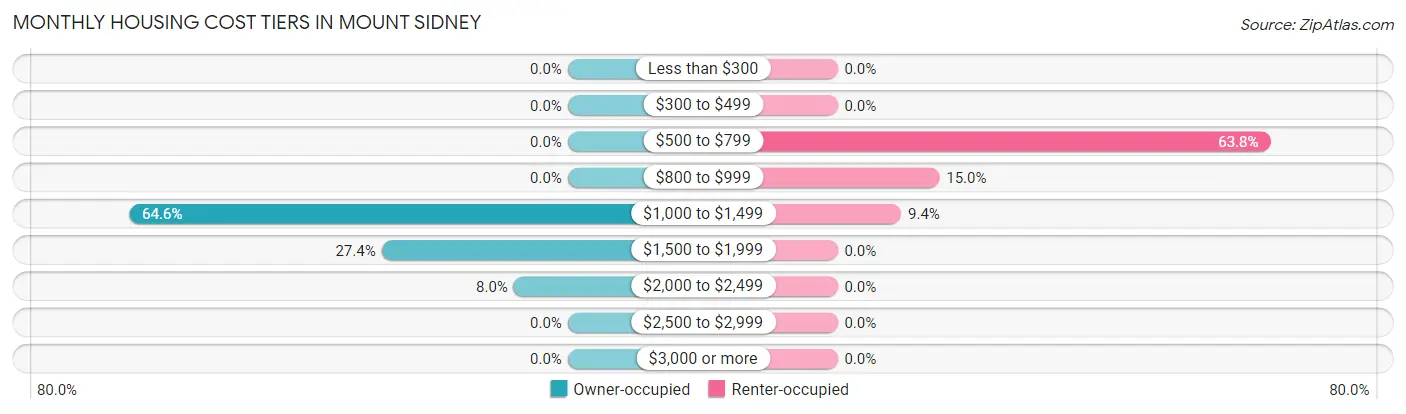
| Monthly Cost | Owner-occupied | Renter-occupied |
| Less than $300 | 0 (0.0%) | 0 (0.0%) |
| $300 to $499 | 0 (0.0%) | 0 (0.0%) |
| $500 to $799 | 0 (0.0%) | 102 (63.7%) |
| $800 to $999 | 0 (0.0%) | 24 (15.0%) |
| $1,000 to $1,499 | 146 (64.6%) | 15 (9.4%) |
| $1,500 to $1,999 | 62 (27.4%) | 0 (0.0%) |
| $2,000 to $2,499 | 18 (8.0%) | 0 (0.0%) |
| $2,500 to $2,999 | 0 (0.0%) | 0 (0.0%) |
| $3,000 or more | 0 (0.0%) | 0 (0.0%) |
| Total | 226 (100.0%) | 160 (100.0%) |
Physical Housing Characteristics in Mount Sidney
Housing Structures in Mount Sidney
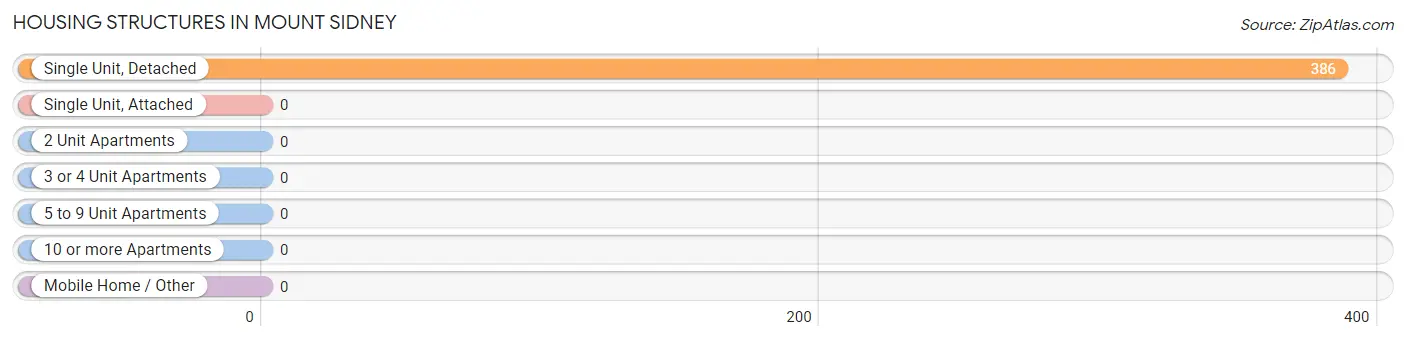
| Structure Type | # Housing Units | % Housing Units |
| Single Unit, Detached | 386 | 100.0% |
| Single Unit, Attached | 0 | 0.0% |
| 2 Unit Apartments | 0 | 0.0% |
| 3 or 4 Unit Apartments | 0 | 0.0% |
| 5 to 9 Unit Apartments | 0 | 0.0% |
| 10 or more Apartments | 0 | 0.0% |
| Mobile Home / Other | 0 | 0.0% |
| Total | 386 | 100.0% |
Housing Structures by Occupancy in Mount Sidney
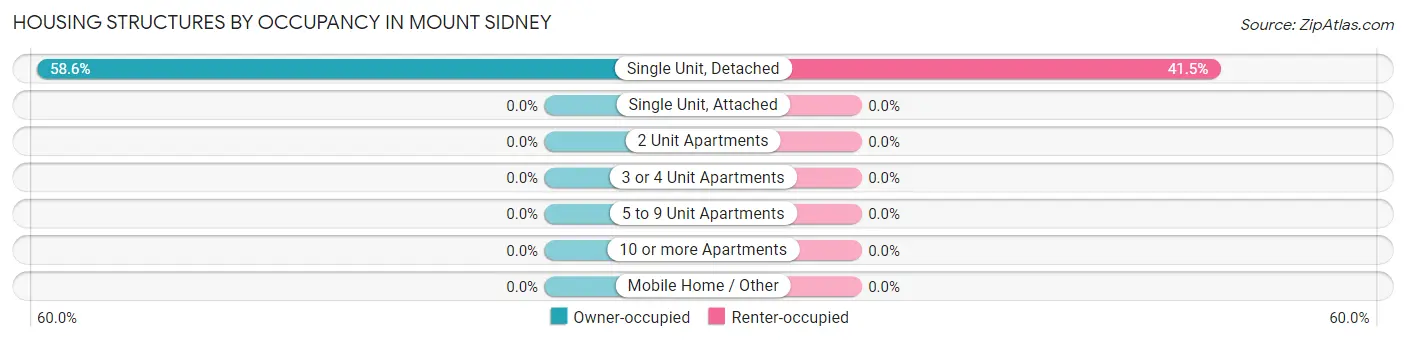
| Structure Type | Owner-occupied | Renter-occupied |
| Single Unit, Detached | 226 (58.6%) | 160 (41.4%) |
| Single Unit, Attached | 0 (0.0%) | 0 (0.0%) |
| 2 Unit Apartments | 0 (0.0%) | 0 (0.0%) |
| 3 or 4 Unit Apartments | 0 (0.0%) | 0 (0.0%) |
| 5 to 9 Unit Apartments | 0 (0.0%) | 0 (0.0%) |
| 10 or more Apartments | 0 (0.0%) | 0 (0.0%) |
| Mobile Home / Other | 0 (0.0%) | 0 (0.0%) |
| Total | 226 (58.6%) | 160 (41.4%) |
Housing Structures by Number of Rooms in Mount Sidney
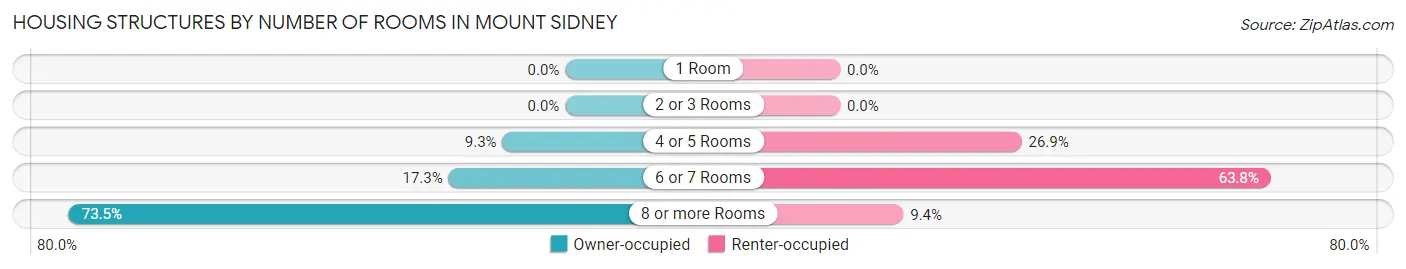
| Number of Rooms | Owner-occupied | Renter-occupied |
| 1 Room | 0 (0.0%) | 0 (0.0%) |
| 2 or 3 Rooms | 0 (0.0%) | 0 (0.0%) |
| 4 or 5 Rooms | 21 (9.3%) | 43 (26.9%) |
| 6 or 7 Rooms | 39 (17.3%) | 102 (63.7%) |
| 8 or more Rooms | 166 (73.5%) | 15 (9.4%) |
| Total | 226 (100.0%) | 160 (100.0%) |
Housing Structure by Heating Type in Mount Sidney
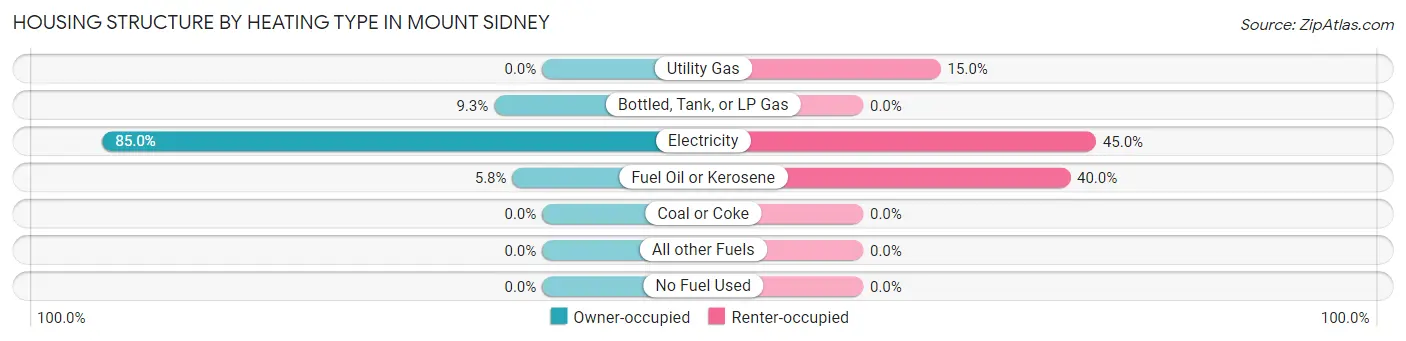
| Heating Type | Owner-occupied | Renter-occupied |
| Utility Gas | 0 (0.0%) | 24 (15.0%) |
| Bottled, Tank, or LP Gas | 21 (9.3%) | 0 (0.0%) |
| Electricity | 192 (85.0%) | 72 (45.0%) |
| Fuel Oil or Kerosene | 13 (5.8%) | 64 (40.0%) |
| Coal or Coke | 0 (0.0%) | 0 (0.0%) |
| All other Fuels | 0 (0.0%) | 0 (0.0%) |
| No Fuel Used | 0 (0.0%) | 0 (0.0%) |
| Total | 226 (100.0%) | 160 (100.0%) |
Household Vehicle Usage in Mount Sidney
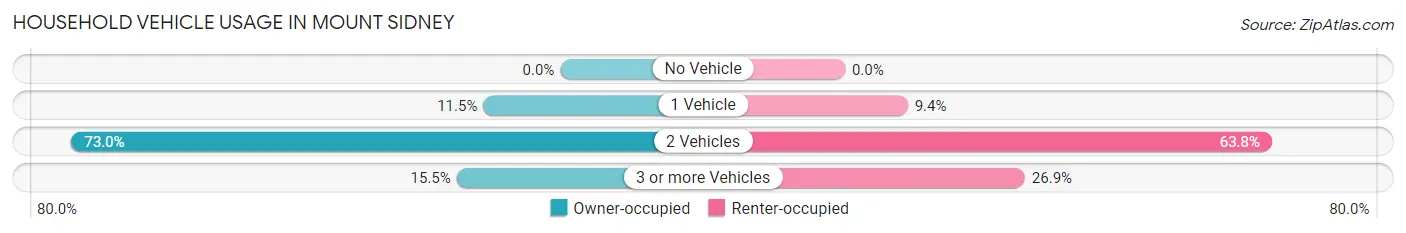
| Vehicles per Household | Owner-occupied | Renter-occupied |
| No Vehicle | 0 (0.0%) | 0 (0.0%) |
| 1 Vehicle | 26 (11.5%) | 15 (9.4%) |
| 2 Vehicles | 165 (73.0%) | 102 (63.7%) |
| 3 or more Vehicles | 35 (15.5%) | 43 (26.9%) |
| Total | 226 (100.0%) | 160 (100.0%) |
Real Estate & Mortgages in Mount Sidney
Real Estate and Mortgage Overview in Mount Sidney
| Characteristic | Without Mortgage | With Mortgage |
| Housing Units | 13 | 213 |
| Median Property Value | - | - |
| Median Household Income | - | - |
| Monthly Housing Costs | - | - |
| Real Estate Taxes | - | - |
Property Value by Mortgage Status in Mount Sidney
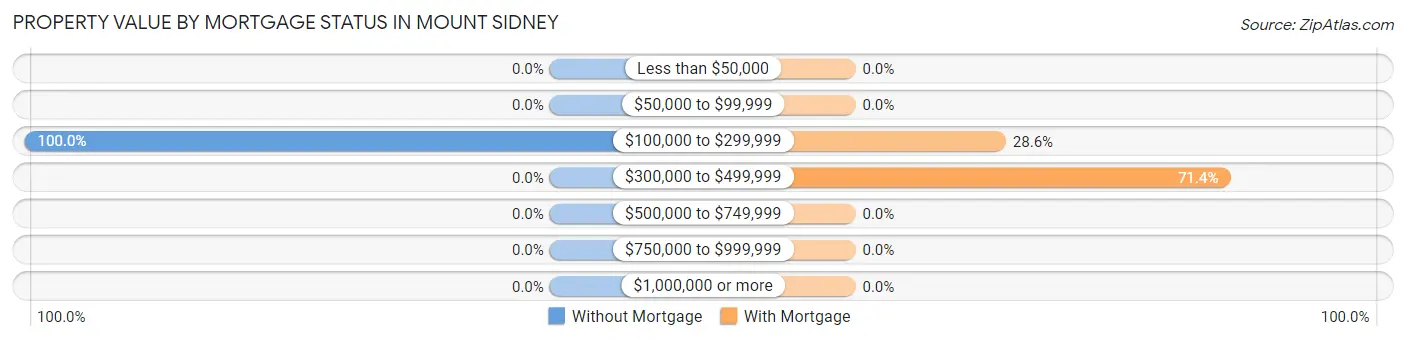
| Property Value | Without Mortgage | With Mortgage |
| Less than $50,000 | 0 (0.0%) | 0 (0.0%) |
| $50,000 to $99,999 | 0 (0.0%) | 0 (0.0%) |
| $100,000 to $299,999 | 13 (100.0%) | 61 (28.6%) |
| $300,000 to $499,999 | 0 (0.0%) | 152 (71.4%) |
| $500,000 to $749,999 | 0 (0.0%) | 0 (0.0%) |
| $750,000 to $999,999 | 0 (0.0%) | 0 (0.0%) |
| $1,000,000 or more | 0 (0.0%) | 0 (0.0%) |
| Total | 13 (100.0%) | 213 (100.0%) |
Household Income by Mortgage Status in Mount Sidney
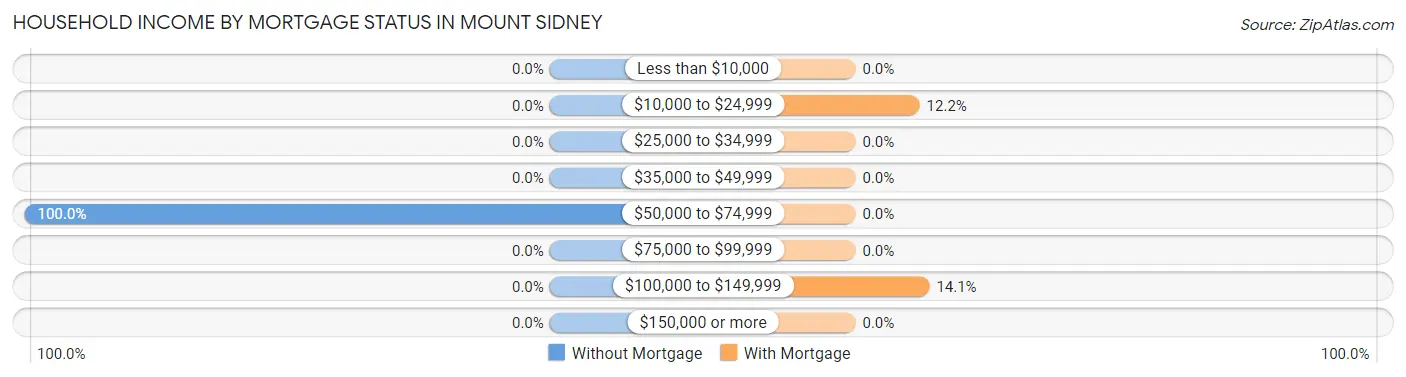
| Household Income | Without Mortgage | With Mortgage |
| Less than $10,000 | 0 (0.0%) | 0 (0.0%) |
| $10,000 to $24,999 | 0 (0.0%) | 26 (12.2%) |
| $25,000 to $34,999 | 0 (0.0%) | 0 (0.0%) |
| $35,000 to $49,999 | 0 (0.0%) | 0 (0.0%) |
| $50,000 to $74,999 | 13 (100.0%) | 0 (0.0%) |
| $75,000 to $99,999 | 0 (0.0%) | 0 (0.0%) |
| $100,000 to $149,999 | 0 (0.0%) | 30 (14.1%) |
| $150,000 or more | 0 (0.0%) | 0 (0.0%) |
| Total | 13 (100.0%) | 213 (100.0%) |
Property Value to Household Income Ratio in Mount Sidney
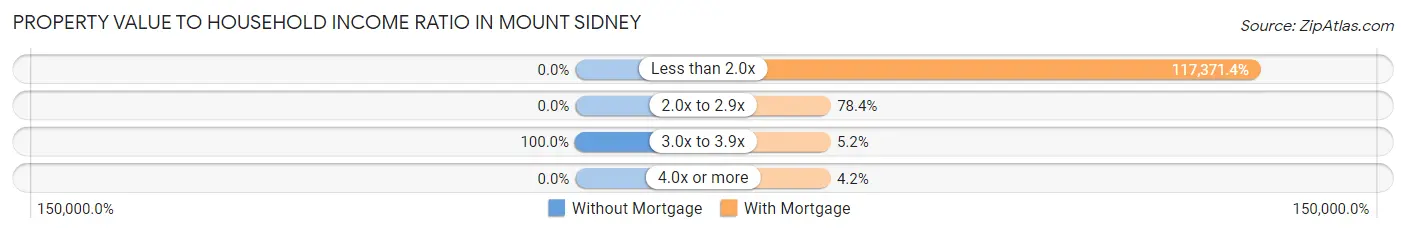
| Value-to-Income Ratio | Without Mortgage | With Mortgage |
| Less than 2.0x | 0 (0.0%) | 250,001 (117,371.4%) |
| 2.0x to 2.9x | 0 (0.0%) | 167 (78.4%) |
| 3.0x to 3.9x | 13 (100.0%) | 11 (5.2%) |
| 4.0x or more | 0 (0.0%) | 9 (4.2%) |
| Total | 13 (100.0%) | 213 (100.0%) |
Real Estate Taxes by Mortgage Status in Mount Sidney
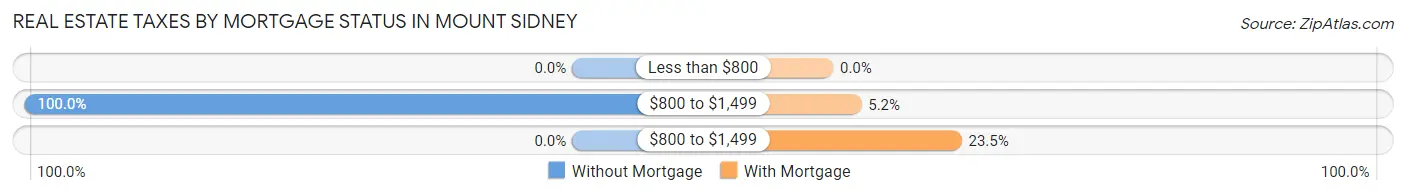
| Property Taxes | Without Mortgage | With Mortgage |
| Less than $800 | 0 (0.0%) | 0 (0.0%) |
| $800 to $1,499 | 13 (100.0%) | 11 (5.2%) |
| $800 to $1,499 | 0 (0.0%) | 50 (23.5%) |
| Total | 13 (100.0%) | 213 (100.0%) |
Health & Disability in Mount Sidney
Health Insurance Coverage by Age in Mount Sidney
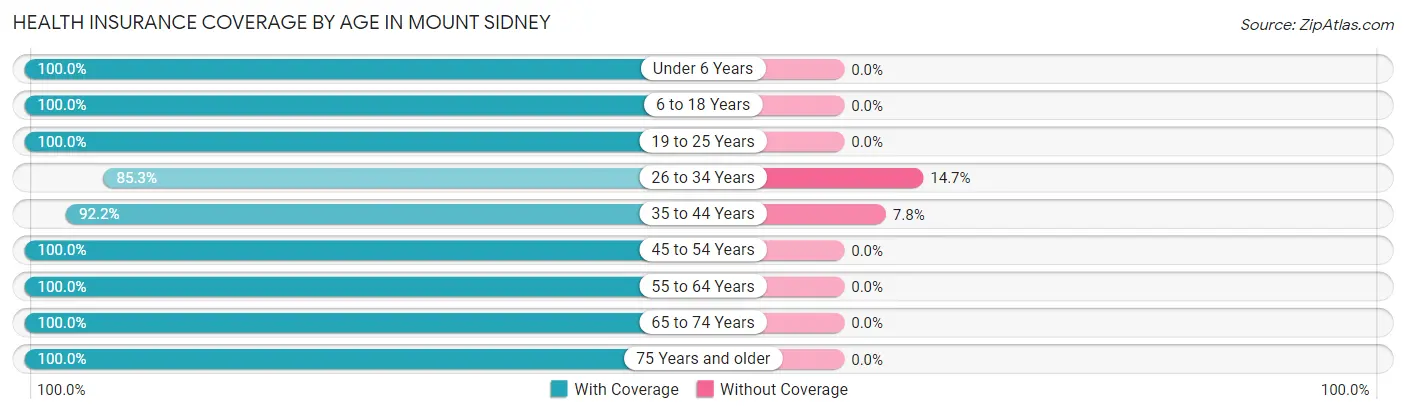
| Age Bracket | With Coverage | Without Coverage |
| Under 6 Years | 13 (100.0%) | 0 (0.0%) |
| 6 to 18 Years | 124 (100.0%) | 0 (0.0%) |
| 19 to 25 Years | 150 (100.0%) | 0 (0.0%) |
| 26 to 34 Years | 81 (85.3%) | 14 (14.7%) |
| 35 to 44 Years | 202 (92.2%) | 17 (7.8%) |
| 45 to 54 Years | 35 (100.0%) | 0 (0.0%) |
| 55 to 64 Years | 165 (100.0%) | 0 (0.0%) |
| 65 to 74 Years | 77 (100.0%) | 0 (0.0%) |
| 75 Years and older | 16 (100.0%) | 0 (0.0%) |
| Total | 863 (96.5%) | 31 (3.5%) |
Health Insurance Coverage by Citizenship Status in Mount Sidney
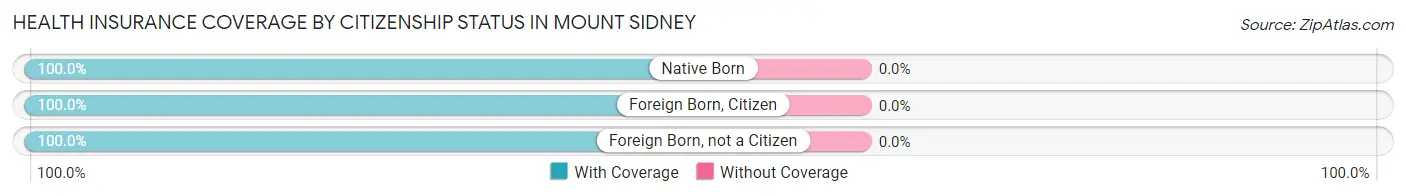
| Citizenship Status | With Coverage | Without Coverage |
| Native Born | 13 (100.0%) | 0 (0.0%) |
| Foreign Born, Citizen | 124 (100.0%) | 0 (0.0%) |
| Foreign Born, not a Citizen | 150 (100.0%) | 0 (0.0%) |
Health Insurance Coverage by Household Income in Mount Sidney
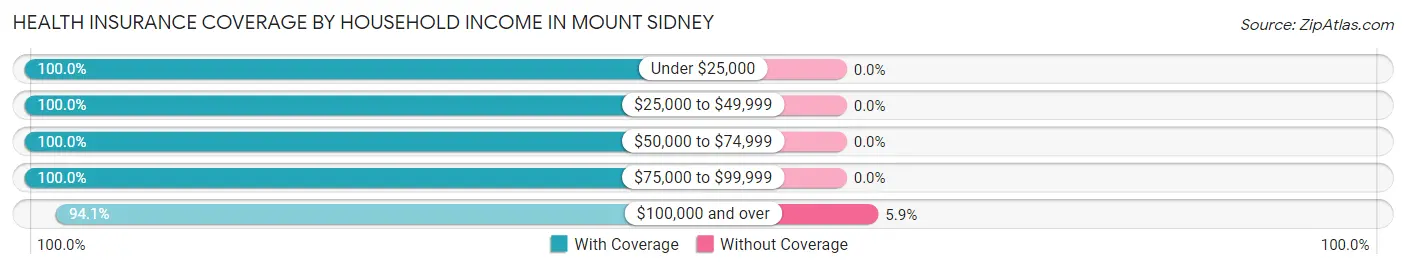
| Household Income | With Coverage | Without Coverage |
| Under $25,000 | 41 (100.0%) | 0 (0.0%) |
| $25,000 to $49,999 | 47 (100.0%) | 0 (0.0%) |
| $50,000 to $74,999 | 29 (100.0%) | 0 (0.0%) |
| $75,000 to $99,999 | 253 (100.0%) | 0 (0.0%) |
| $100,000 and over | 493 (94.1%) | 31 (5.9%) |
Public vs Private Health Insurance Coverage by Age in Mount Sidney
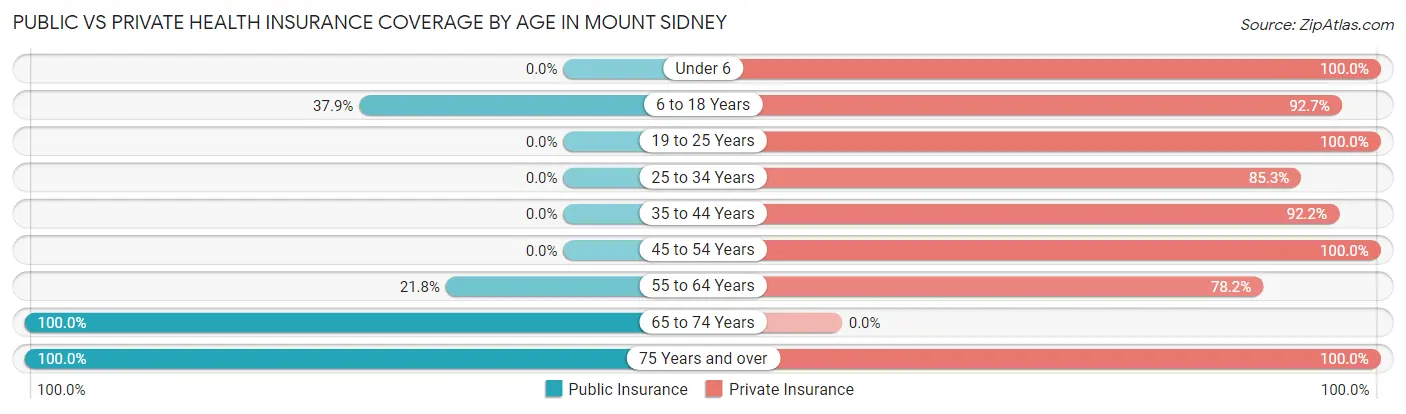
| Age Bracket | Public Insurance | Private Insurance |
| Under 6 | 0 (0.0%) | 13 (100.0%) |
| 6 to 18 Years | 47 (37.9%) | 115 (92.7%) |
| 19 to 25 Years | 0 (0.0%) | 150 (100.0%) |
| 25 to 34 Years | 0 (0.0%) | 81 (85.3%) |
| 35 to 44 Years | 0 (0.0%) | 202 (92.2%) |
| 45 to 54 Years | 0 (0.0%) | 35 (100.0%) |
| 55 to 64 Years | 36 (21.8%) | 129 (78.2%) |
| 65 to 74 Years | 77 (100.0%) | 0 (0.0%) |
| 75 Years and over | 16 (100.0%) | 16 (100.0%) |
| Total | 176 (19.7%) | 741 (82.9%) |
Disability Status by Sex by Age in Mount Sidney
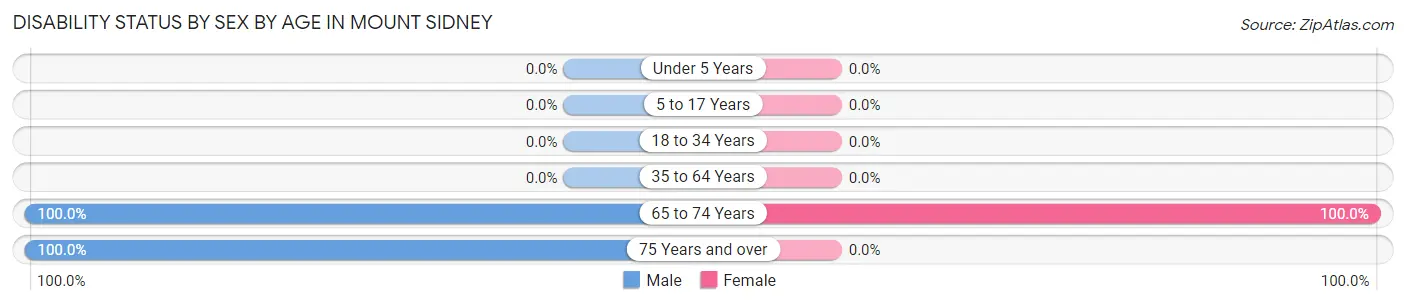
| Age Bracket | Male | Female |
| Under 5 Years | 0 (0.0%) | 0 (0.0%) |
| 5 to 17 Years | 0 (0.0%) | 0 (0.0%) |
| 18 to 34 Years | 0 (0.0%) | 0 (0.0%) |
| 35 to 64 Years | 0 (0.0%) | 0 (0.0%) |
| 65 to 74 Years | 64 (100.0%) | 13 (100.0%) |
| 75 Years and over | 16 (100.0%) | 0 (0.0%) |
Disability Class by Sex by Age in Mount Sidney
Disability Class: Hearing Difficulty
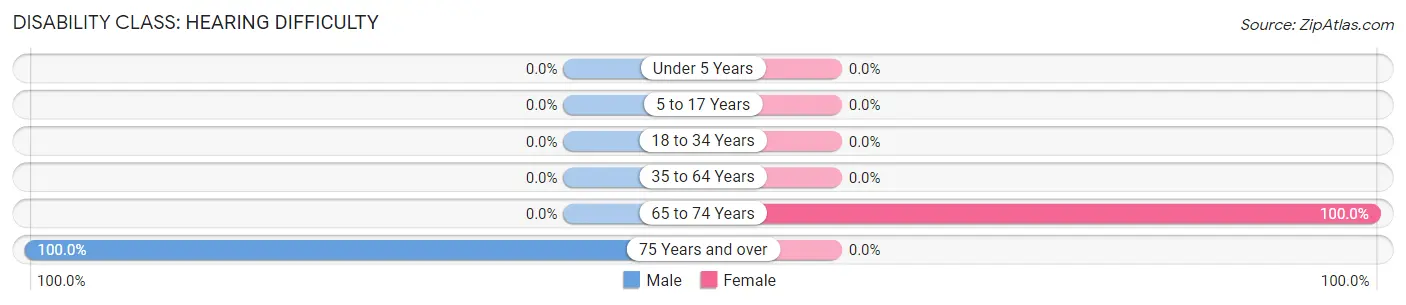
| Age Bracket | Male | Female |
| Under 5 Years | 0 (0.0%) | 0 (0.0%) |
| 5 to 17 Years | 0 (0.0%) | 0 (0.0%) |
| 18 to 34 Years | 0 (0.0%) | 0 (0.0%) |
| 35 to 64 Years | 0 (0.0%) | 0 (0.0%) |
| 65 to 74 Years | 0 (0.0%) | 13 (100.0%) |
| 75 Years and over | 16 (100.0%) | 0 (0.0%) |
Disability Class: Vision Difficulty
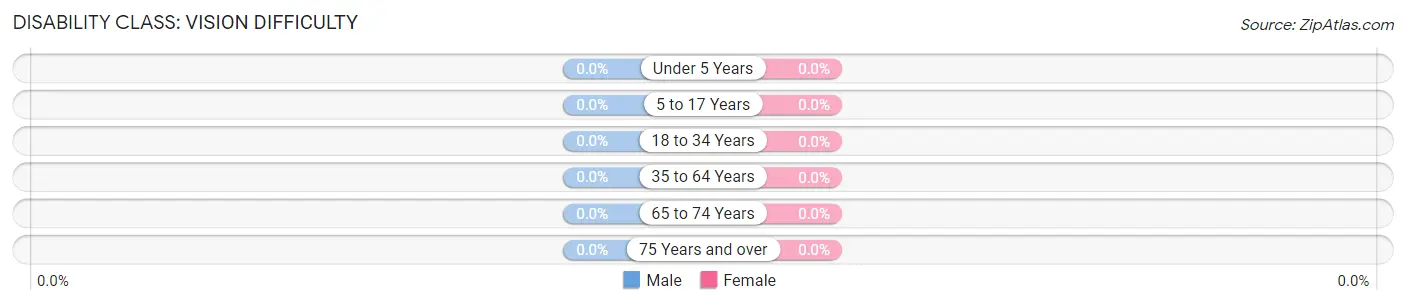
| Age Bracket | Male | Female |
| Under 5 Years | 0 (0.0%) | 0 (0.0%) |
| 5 to 17 Years | 0 (0.0%) | 0 (0.0%) |
| 18 to 34 Years | 0 (0.0%) | 0 (0.0%) |
| 35 to 64 Years | 0 (0.0%) | 0 (0.0%) |
| 65 to 74 Years | 0 (0.0%) | 0 (0.0%) |
| 75 Years and over | 0 (0.0%) | 0 (0.0%) |
Disability Class: Cognitive Difficulty
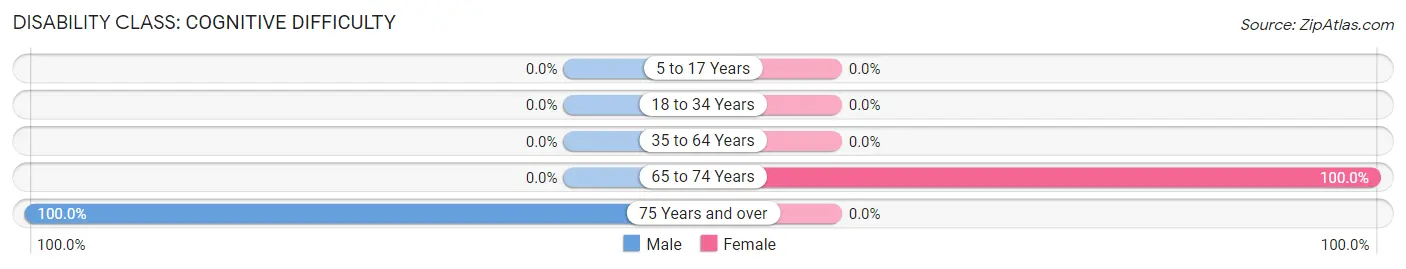
| Age Bracket | Male | Female |
| 5 to 17 Years | 0 (0.0%) | 0 (0.0%) |
| 18 to 34 Years | 0 (0.0%) | 0 (0.0%) |
| 35 to 64 Years | 0 (0.0%) | 0 (0.0%) |
| 65 to 74 Years | 0 (0.0%) | 13 (100.0%) |
| 75 Years and over | 16 (100.0%) | 0 (0.0%) |
Disability Class: Ambulatory Difficulty
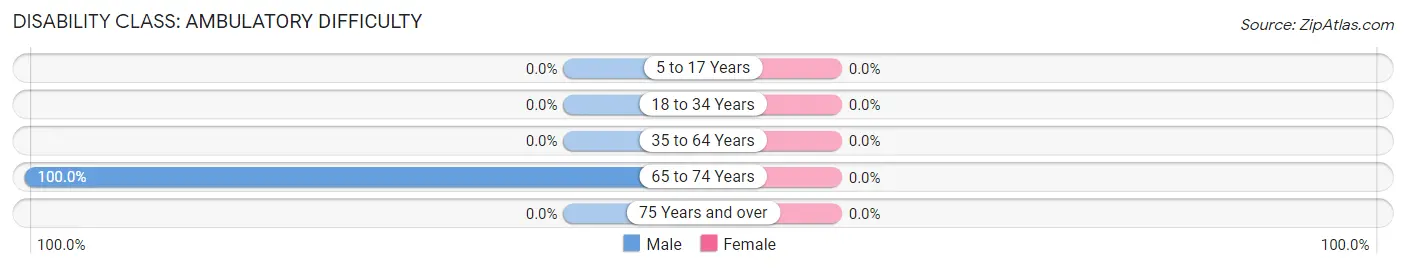
| Age Bracket | Male | Female |
| 5 to 17 Years | 0 (0.0%) | 0 (0.0%) |
| 18 to 34 Years | 0 (0.0%) | 0 (0.0%) |
| 35 to 64 Years | 0 (0.0%) | 0 (0.0%) |
| 65 to 74 Years | 64 (100.0%) | 0 (0.0%) |
| 75 Years and over | 0 (0.0%) | 0 (0.0%) |
Disability Class: Self-Care Difficulty
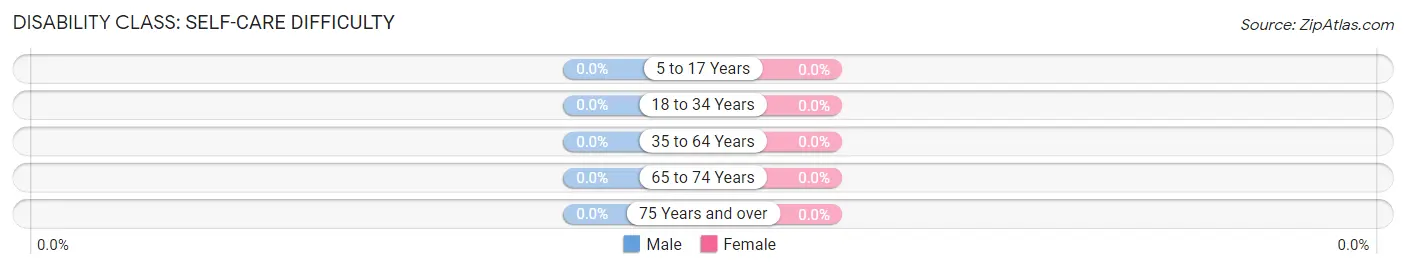
| Age Bracket | Male | Female |
| 5 to 17 Years | 0 (0.0%) | 0 (0.0%) |
| 18 to 34 Years | 0 (0.0%) | 0 (0.0%) |
| 35 to 64 Years | 0 (0.0%) | 0 (0.0%) |
| 65 to 74 Years | 0 (0.0%) | 0 (0.0%) |
| 75 Years and over | 0 (0.0%) | 0 (0.0%) |
Technology Access in Mount Sidney
Computing Device Access in Mount Sidney
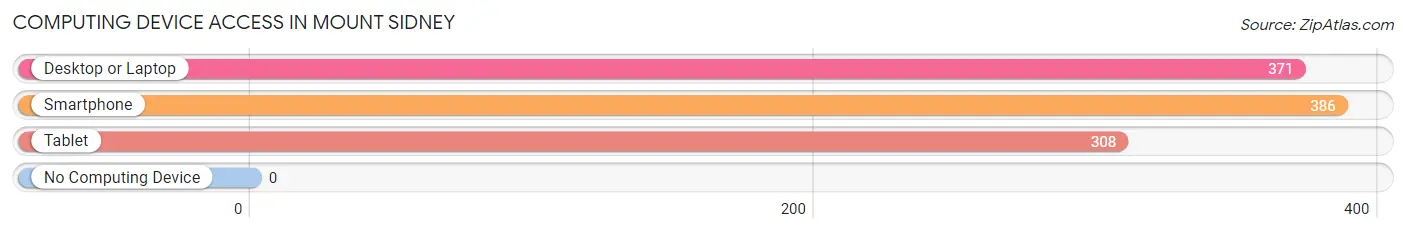
| Device Type | # Households | % Households |
| Desktop or Laptop | 371 | 96.1% |
| Smartphone | 386 | 100.0% |
| Tablet | 308 | 79.8% |
| No Computing Device | 0 | 0.0% |
| Total | 386 | 100.0% |
Internet Access in Mount Sidney
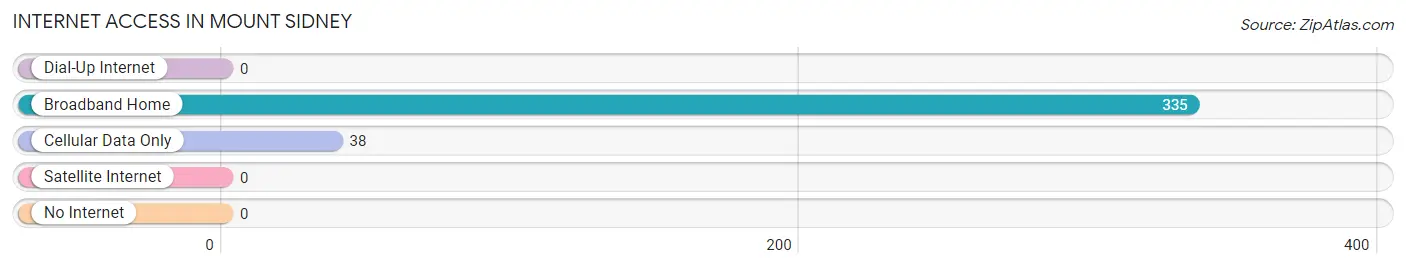
| Internet Type | # Households | % Households |
| Dial-Up Internet | 0 | 0.0% |
| Broadband Home | 335 | 86.8% |
| Cellular Data Only | 38 | 9.8% |
| Satellite Internet | 0 | 0.0% |
| No Internet | 0 | 0.0% |
| Total | 386 | 100.0% |
Mount Sidney Summary
Sidney, Virginia is a small town located in the Shenandoah Valley of Virginia. It is situated in the northern part of Rockingham County, about 10 miles south of Harrisonburg. The town was founded in 1790 and named after Sir Sidney Smith, a British naval officer. Sidney is a small, rural community with a population of just over 1,000 people.
History
Sidney was founded in 1790 by a group of settlers from Pennsylvania. The town was named after Sir Sidney Smith, a British naval officer who had served in the American Revolution. The town was originally part of Rockingham County, but in 1807 it was annexed to Augusta County. In 1836, the town was incorporated as a town and the first mayor was elected.
In the early 19th century, Sidney was a thriving agricultural community. The town was known for its production of wheat, corn, and other grains. In the late 19th century, the town began to experience a decline in its agricultural production. This was due to the introduction of new farming techniques and the introduction of the railroad.
In the early 20th century, Sidney began to experience a resurgence in its economy. This was due to the introduction of the automobile and the development of the nearby Shenandoah National Park. The town also experienced a population boom during this time, as many people moved to the area to take advantage of the new opportunities.
Geography
Sidney is located in the northern part of Rockingham County, about 10 miles south of Harrisonburg. The town is situated in the Shenandoah Valley, which is a large valley that stretches from the Blue Ridge Mountains to the Allegheny Mountains. The town is surrounded by rolling hills and is located near the North Fork of the Shenandoah River.
The climate in Sidney is temperate, with hot summers and cold winters. The average temperature in the summer is around 80 degrees Fahrenheit, while the average temperature in the winter is around 40 degrees Fahrenheit.
Economy
Sidney’s economy is largely based on agriculture and tourism. The town is home to several farms, which produce a variety of crops, including wheat, corn, and hay. The town is also home to several wineries, which produce a variety of wines.
Tourism is also an important part of the economy in Sidney. The town is home to several attractions, including the Shenandoah National Park, the Luray Caverns, and the Skyline Drive. The town also hosts several festivals throughout the year, including the Apple Blossom Festival and the Rockingham County Fair.
Demographics
As of the 2010 census, the population of Sidney was 1,072. The racial makeup of the town was 95.3% White, 1.2% African American, 0.3% Native American, 0.7% Asian, 0.1% Pacific Islander, and 2.4% from other races. The median household income in the town was $41,250, and the median family income was $50,000.
Sidney is a small, rural community with a population of just over 1,000 people. The town is home to a variety of businesses, including farms, wineries, and tourist attractions. The town is also home to several churches, schools, and other organizations. Sidney is a great place to live, work, and visit.
Common Questions
What is Per Capita Income in Mount Sidney?
Per Capita income in Mount Sidney is $47,189.
What is Income or Wage Gap in Mount Sidney?
Income or Wage Gap in Mount Sidney is 13.1%.
Women in Mount Sidney earn 86.9 cents for every dollar earned by a man.
What is Inequality or Gini Index in Mount Sidney?
Inequality or Gini Index in Mount Sidney is 0.38.
What is the Total Population of Mount Sidney?
Total Population of Mount Sidney is 894.
What is the Total Male Population of Mount Sidney?
Total Male Population of Mount Sidney is 368.
What is the Total Female Population of Mount Sidney?
Total Female Population of Mount Sidney is 526.
What is the Ratio of Males per 100 Females in Mount Sidney?
There are 69.96 Males per 100 Females in Mount Sidney.
What is the Ratio of Females per 100 Males in Mount Sidney?
There are 142.93 Females per 100 Males in Mount Sidney.
What is the Median Population Age in Mount Sidney?
Median Population Age in Mount Sidney is 42.0 Years.
What is the Average Family Size in Mount Sidney
Average Family Size in Mount Sidney is 2.4 People.
What is the Average Household Size in Mount Sidney
Average Household Size in Mount Sidney is 2.3 People.
How Large is the Labor Force in Mount Sidney?
There are 638 People in the Labor Forcein in Mount Sidney.
What is the Percentage of People in the Labor Force in Mount Sidney?
79.4% of People are in the Labor Force in Mount Sidney.