Glasgow, VA Map & Demographics
Glasgow Map
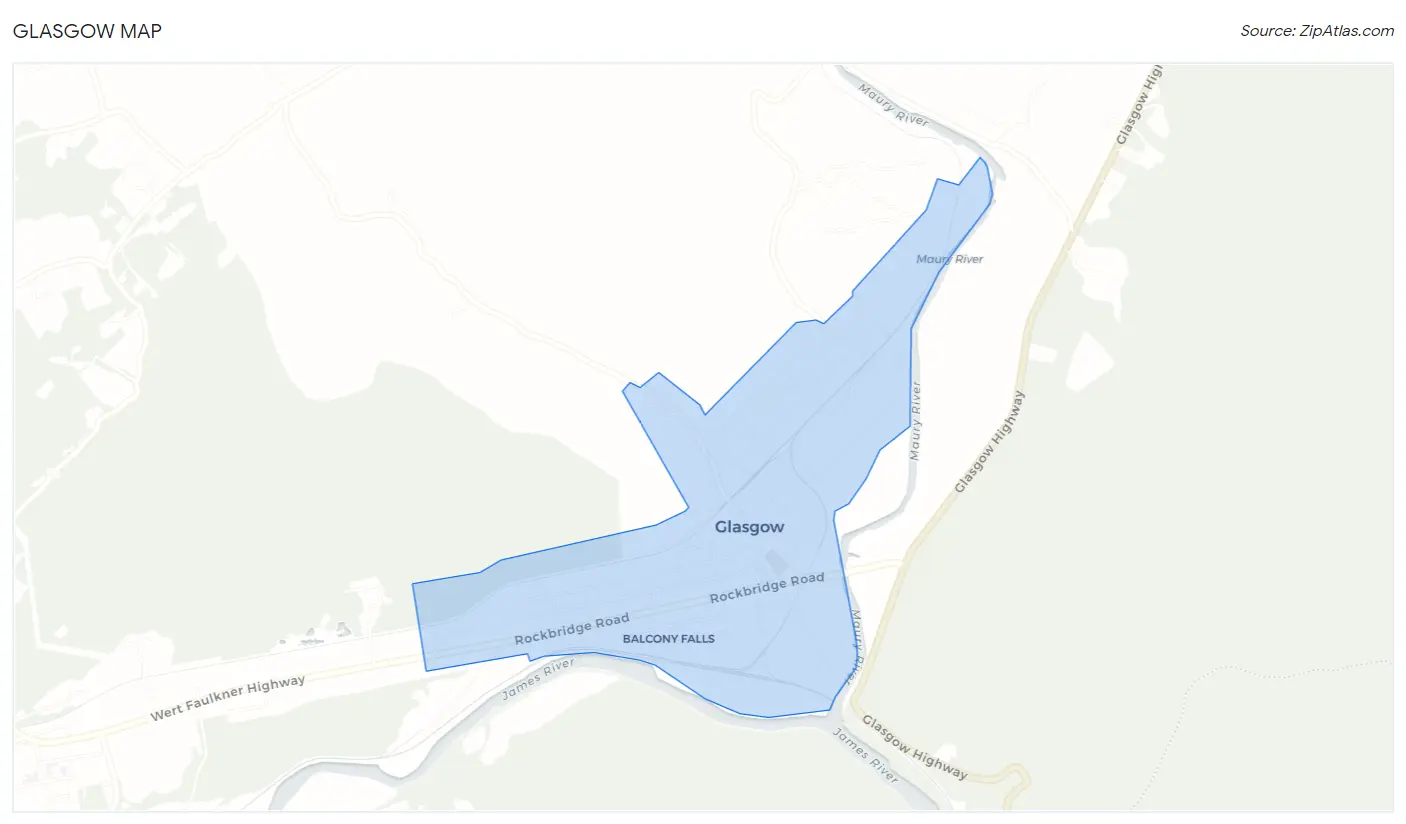
Glasgow Overview
$23,471
PER CAPITA INCOME
$54,375
AVG FAMILY INCOME
$40,769
AVG HOUSEHOLD INCOME
29.0%
WAGE / INCOME GAP [ % ]
71.0¢/ $1
WAGE / INCOME GAP [ $ ]
0.43
INEQUALITY / GINI INDEX
1,376
TOTAL POPULATION
621
MALE POPULATION
755
FEMALE POPULATION
82.25
MALES / 100 FEMALES
121.58
FEMALES / 100 MALES
44.6
MEDIAN AGE
3.5
AVG FAMILY SIZE
2.7
AVG HOUSEHOLD SIZE
635
LABOR FORCE [ PEOPLE ]
58.3%
PERCENT IN LABOR FORCE
13.2%
UNEMPLOYMENT RATE
Glasgow Zip Codes
Glasgow Area Codes
Income in Glasgow
Income Overview in Glasgow
Per Capita Income in Glasgow is $23,471, while median incomes of families and households are $54,375 and $40,769 respectively.
| Characteristic | Number | Measure |
| Per Capita Income | 1,376 | $23,471 |
| Median Family Income | 330 | $54,375 |
| Mean Family Income | 330 | $65,407 |
| Median Household Income | 514 | $40,769 |
| Mean Household Income | 514 | $54,878 |
| Income Deficit | 330 | $0 |
| Wage / Income Gap (%) | 1,376 | 29.00% |
| Wage / Income Gap ($) | 1,376 | 71.00¢ per $1 |
| Gini / Inequality Index | 1,376 | 0.43 |
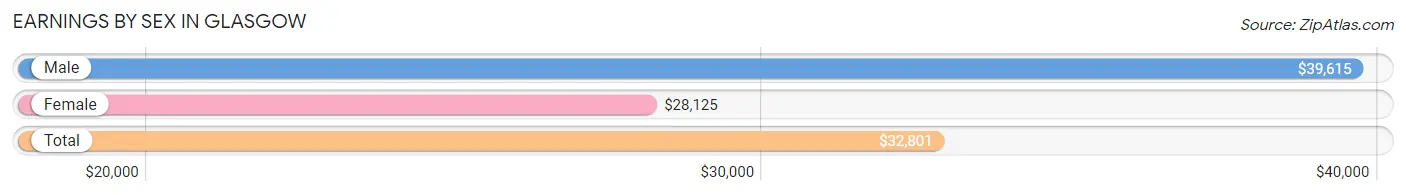
Earnings by Sex in Glasgow
Average Earnings in Glasgow are $32,801, $39,615 for men and $28,125 for women, a difference of 29.0%.
| Sex | Number | Average Earnings |
| Male | 246 (41.9%) | $39,615 |
| Female | 341 (58.1%) | $28,125 |
| Total | 587 (100.0%) | $32,801 |
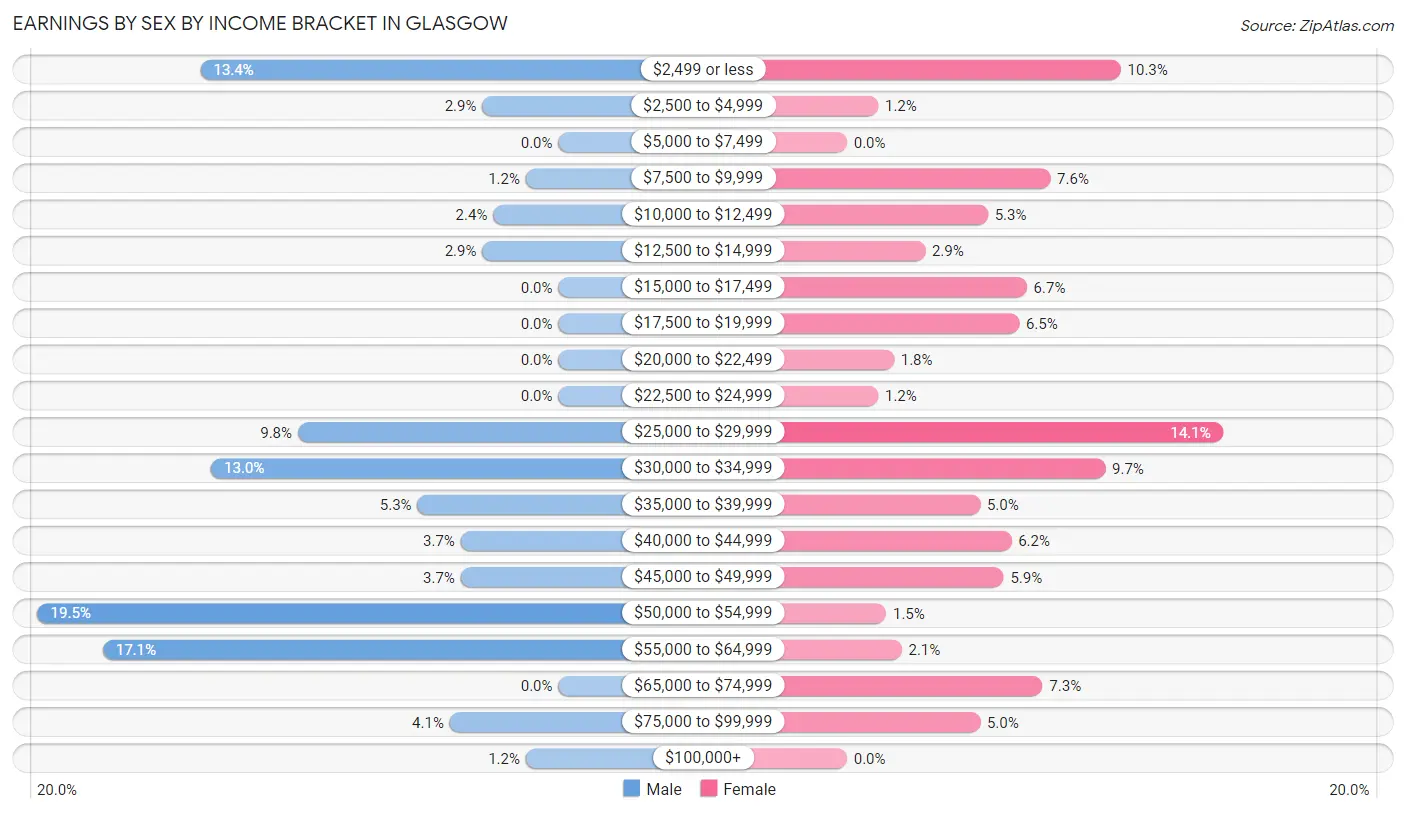
Earnings by Sex by Income Bracket in Glasgow
The most common earnings brackets in Glasgow are $50,000 to $54,999 for men (48 | 19.5%) and $25,000 to $29,999 for women (48 | 14.1%).
| Income | Male | Female |
| $2,499 or less | 33 (13.4%) | 35 (10.3%) |
| $2,500 to $4,999 | 7 (2.9%) | 4 (1.2%) |
| $5,000 to $7,499 | 0 (0.0%) | 0 (0.0%) |
| $7,500 to $9,999 | 3 (1.2%) | 26 (7.6%) |
| $10,000 to $12,499 | 6 (2.4%) | 18 (5.3%) |
| $12,500 to $14,999 | 7 (2.9%) | 10 (2.9%) |
| $15,000 to $17,499 | 0 (0.0%) | 23 (6.7%) |
| $17,500 to $19,999 | 0 (0.0%) | 22 (6.5%) |
| $20,000 to $22,499 | 0 (0.0%) | 6 (1.8%) |
| $22,500 to $24,999 | 0 (0.0%) | 4 (1.2%) |
| $25,000 to $29,999 | 24 (9.8%) | 48 (14.1%) |
| $30,000 to $34,999 | 32 (13.0%) | 33 (9.7%) |
| $35,000 to $39,999 | 13 (5.3%) | 17 (5.0%) |
| $40,000 to $44,999 | 9 (3.7%) | 21 (6.2%) |
| $45,000 to $49,999 | 9 (3.7%) | 20 (5.9%) |
| $50,000 to $54,999 | 48 (19.5%) | 5 (1.5%) |
| $55,000 to $64,999 | 42 (17.1%) | 7 (2.1%) |
| $65,000 to $74,999 | 0 (0.0%) | 25 (7.3%) |
| $75,000 to $99,999 | 10 (4.1%) | 17 (5.0%) |
| $100,000+ | 3 (1.2%) | 0 (0.0%) |
| Total | 246 (100.0%) | 341 (100.0%) |
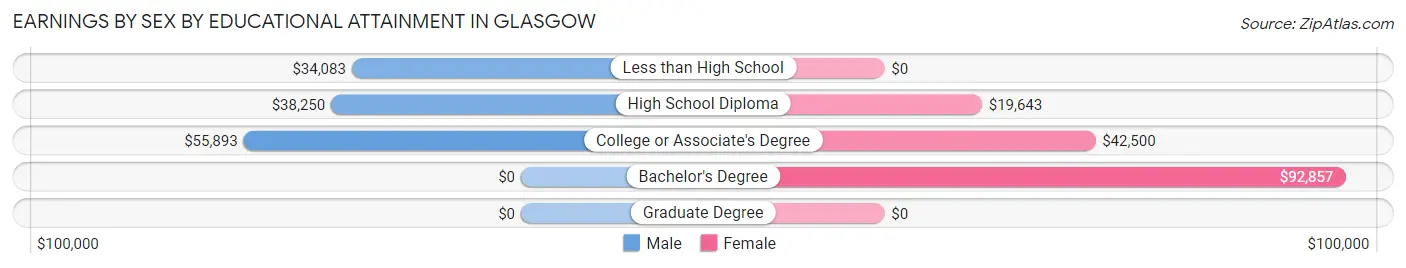
Earnings by Sex by Educational Attainment in Glasgow
Average earnings in Glasgow are $40,833 for men and $29,743 for women, a difference of 27.2%. Men with an educational attainment of college or associate's degree enjoy the highest average annual earnings of $55,893, while those with less than high school education earn the least with $34,083. Women with an educational attainment of bachelor's degree earn the most with the average annual earnings of $92,857, while those with high school diploma education have the smallest earnings of $19,643.
| Educational Attainment | Male Income | Female Income |
| Less than High School | $34,083 | $0 |
| High School Diploma | $38,250 | $19,643 |
| College or Associate's Degree | $55,893 | $42,500 |
| Bachelor's Degree | - | - |
| Graduate Degree | - | - |
| Total | $40,833 | $29,743 |
Family Income in Glasgow
Family Income Brackets in Glasgow
According to the Glasgow family income data, there are 71 families falling into the $25,000 to $34,999 income range, which is the most common income bracket and makes up 21.5% of all families.
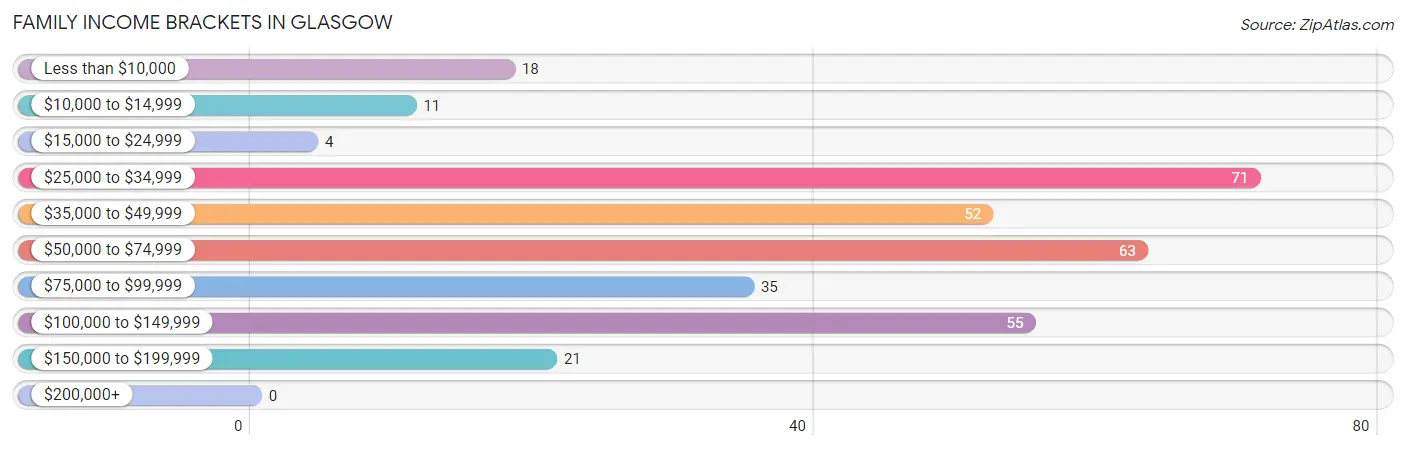
| Income Bracket | # Families | % Families |
| Less than $10,000 | 18 | 5.5% |
| $10,000 to $14,999 | 11 | 3.3% |
| $15,000 to $24,999 | 4 | 1.2% |
| $25,000 to $34,999 | 71 | 21.5% |
| $35,000 to $49,999 | 52 | 15.8% |
| $50,000 to $74,999 | 63 | 19.1% |
| $75,000 to $99,999 | 35 | 10.6% |
| $100,000 to $149,999 | 55 | 16.7% |
| $150,000 to $199,999 | 21 | 6.4% |
| $200,000+ | 0 | 0.0% |
Family Income by Famaliy Size in Glasgow
3-person families (64 | 19.4%) account for the highest median family income in Glasgow with $73,750 per family, while 3-person families (64 | 19.4%) have the highest median income of $24,583 per family member.
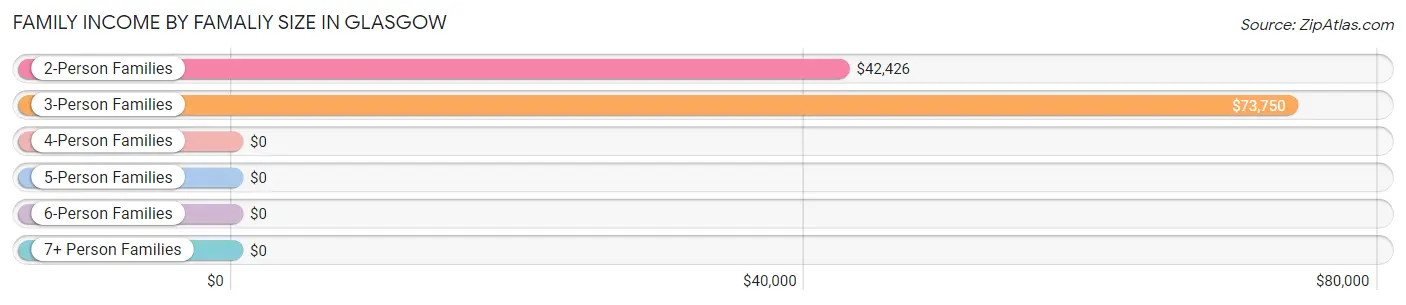
| Income Bracket | # Families | Median Income |
| 2-Person Families | 159 (48.2%) | $42,426 |
| 3-Person Families | 64 (19.4%) | $73,750 |
| 4-Person Families | 75 (22.7%) | $0 |
| 5-Person Families | 32 (9.7%) | $0 |
| 6-Person Families | 0 (0.0%) | $0 |
| 7+ Person Families | 0 (0.0%) | $0 |
| Total | 330 (100.0%) | $54,375 |
Family Income by Number of Earners in Glasgow
The median family income in Glasgow is $54,375, with families comprising 3+ earners (43) having the highest median family income of $115,938, while families with no earners (48) have the lowest median family income of $32,679, accounting for 13.0% and 14.5% of families, respectively.
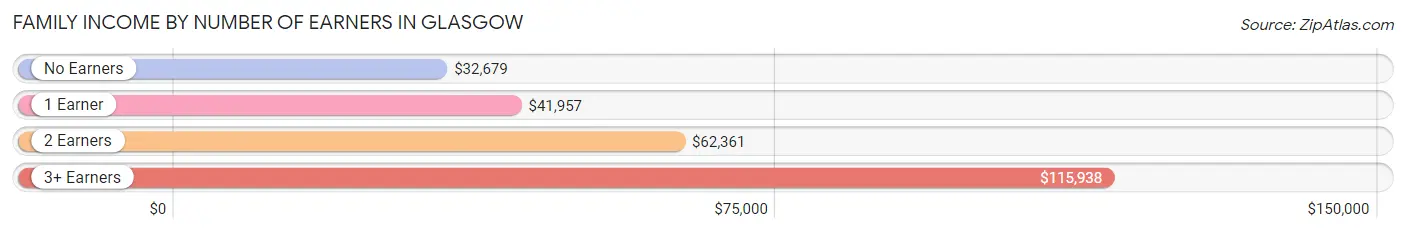
| Number of Earners | # Families | Median Income |
| No Earners | 48 (14.5%) | $32,679 |
| 1 Earner | 146 (44.2%) | $41,957 |
| 2 Earners | 93 (28.2%) | $62,361 |
| 3+ Earners | 43 (13.0%) | $115,938 |
| Total | 330 (100.0%) | $54,375 |
Household Income in Glasgow
Household Income Brackets in Glasgow
With 87 households falling in the category, the $50,000 to $74,999 income range is the most frequent in Glasgow, accounting for 16.9% of all households.
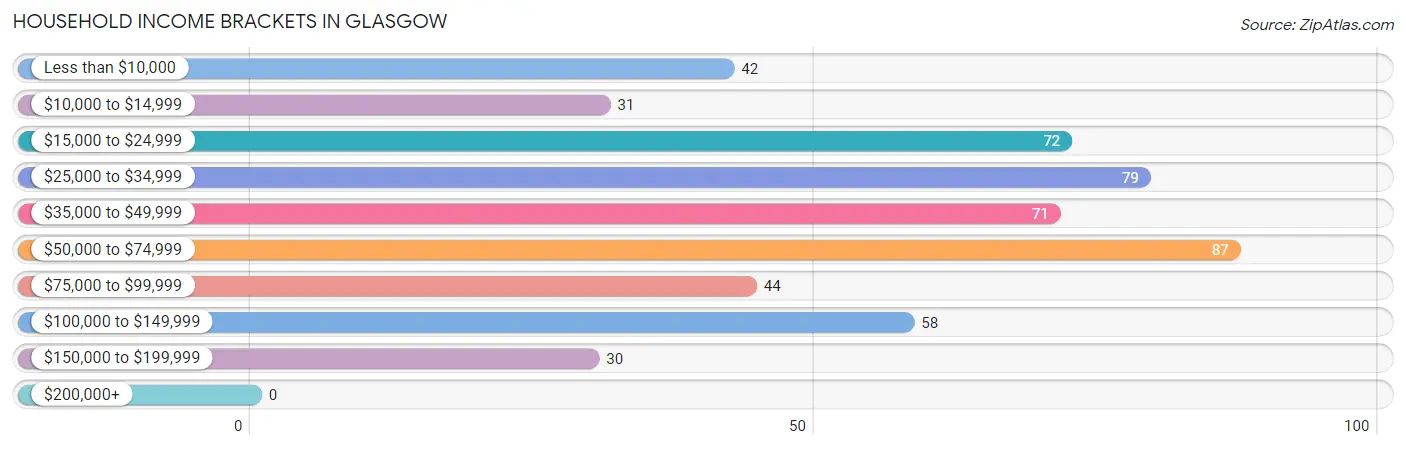
| Income Bracket | # Households | % Households |
| Less than $10,000 | 42 | 8.2% |
| $10,000 to $14,999 | 31 | 6.0% |
| $15,000 to $24,999 | 72 | 14.0% |
| $25,000 to $34,999 | 79 | 15.4% |
| $35,000 to $49,999 | 71 | 13.8% |
| $50,000 to $74,999 | 87 | 16.9% |
| $75,000 to $99,999 | 44 | 8.6% |
| $100,000 to $149,999 | 58 | 11.3% |
| $150,000 to $199,999 | 30 | 5.8% |
| $200,000+ | 0 | 0.0% |
Household Income by Householder Age in Glasgow
The median household income in Glasgow is $40,769, with the highest median household income of $49,688 found in the 25 to 44 years age bracket for the primary householder. A total of 107 households (20.8%) fall into this category. Meanwhile, the 15 to 24 years age bracket for the primary householder has the lowest median household income of $0, with 7 households (1.4%) in this group.
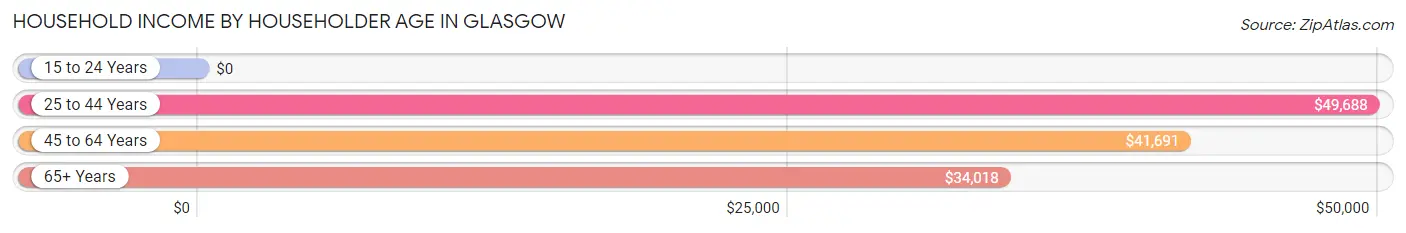
| Income Bracket | # Households | Median Income |
| 15 to 24 Years | 7 (1.4%) | $0 |
| 25 to 44 Years | 107 (20.8%) | $49,688 |
| 45 to 64 Years | 233 (45.3%) | $41,691 |
| 65+ Years | 167 (32.5%) | $34,018 |
| Total | 514 (100.0%) | $40,769 |
Poverty in Glasgow
Income Below Poverty by Sex and Age in Glasgow
With 15.8% poverty level for males and 20.7% for females among the residents of Glasgow, 16 and 17 year old males and 5 year old females are the most vulnerable to poverty, with 6 males (60.0%) and 4 females (100.0%) in their respective age groups living below the poverty level.
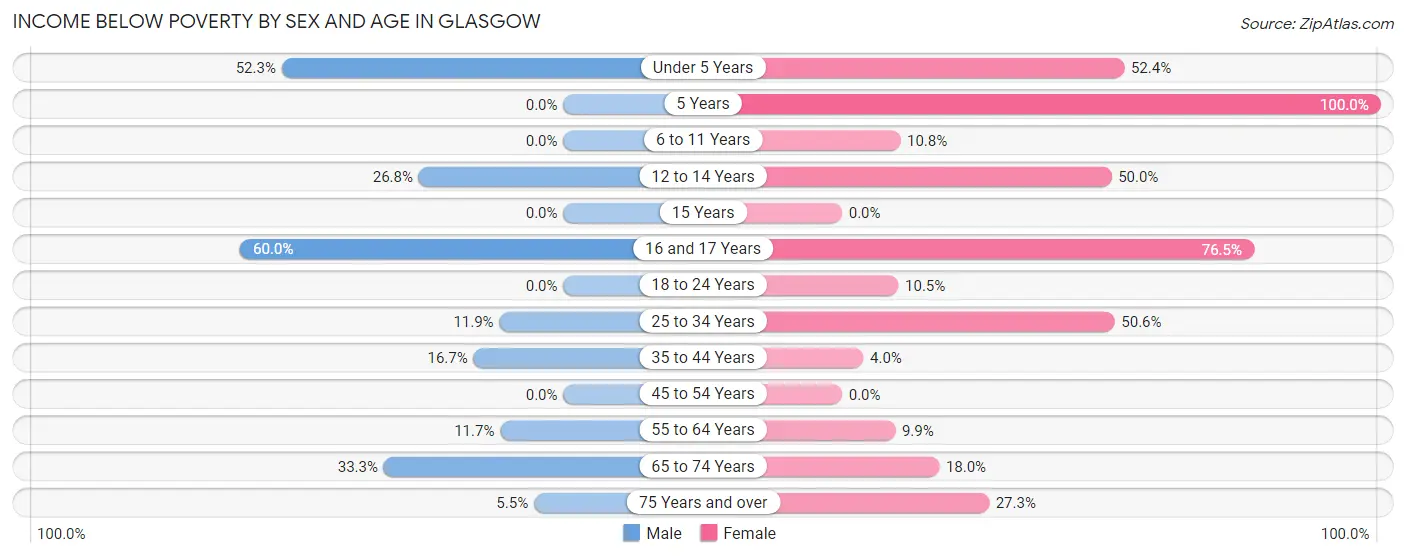
| Age Bracket | Male | Female |
| Under 5 Years | 23 (52.3%) | 22 (52.4%) |
| 5 Years | 0 (0.0%) | 4 (100.0%) |
| 6 to 11 Years | 0 (0.0%) | 8 (10.8%) |
| 12 to 14 Years | 11 (26.8%) | 6 (50.0%) |
| 15 Years | 0 (0.0%) | 0 (0.0%) |
| 16 and 17 Years | 6 (60.0%) | 13 (76.5%) |
| 18 to 24 Years | 0 (0.0%) | 7 (10.4%) |
| 25 to 34 Years | 7 (11.9%) | 43 (50.6%) |
| 35 to 44 Years | 7 (16.7%) | 3 (4.0%) |
| 45 to 54 Years | 0 (0.0%) | 0 (0.0%) |
| 55 to 64 Years | 17 (11.7%) | 15 (9.9%) |
| 65 to 74 Years | 24 (33.3%) | 11 (18.0%) |
| 75 Years and over | 3 (5.4%) | 24 (27.3%) |
| Total | 98 (15.8%) | 156 (20.7%) |
Income Above Poverty by Sex and Age in Glasgow
According to the poverty statistics in Glasgow, males aged 5 years and females aged 15 years are the age groups that are most secure financially, with 100.0% of males and 100.0% of females in these age groups living above the poverty line.
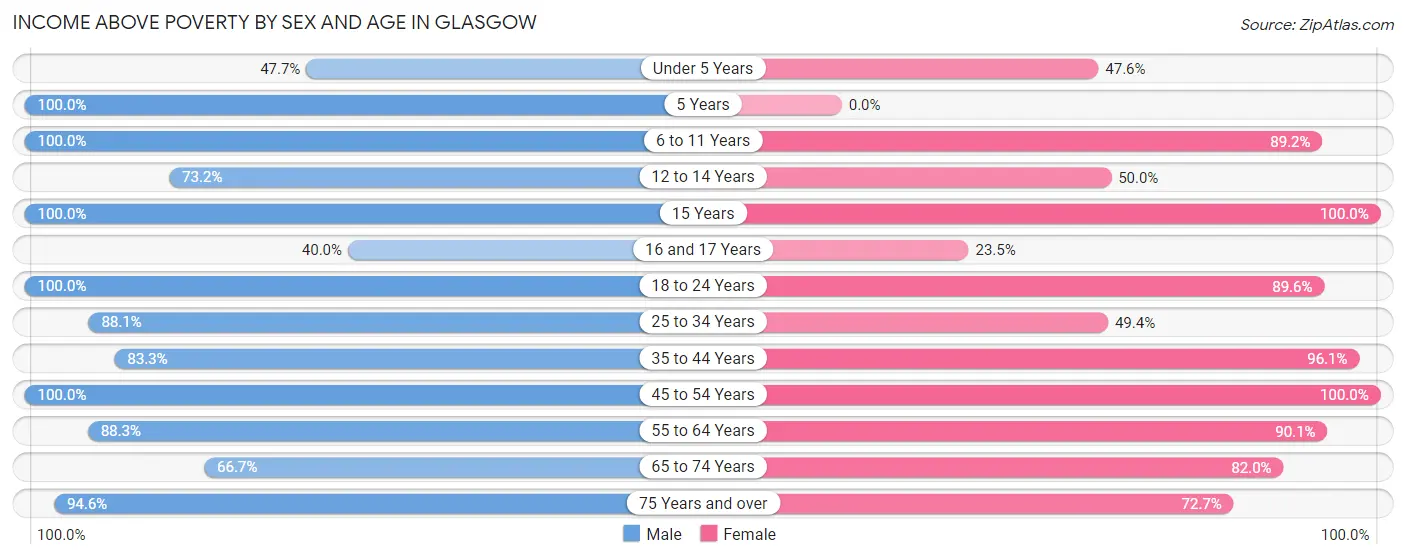
| Age Bracket | Male | Female |
| Under 5 Years | 21 (47.7%) | 20 (47.6%) |
| 5 Years | 18 (100.0%) | 0 (0.0%) |
| 6 to 11 Years | 28 (100.0%) | 66 (89.2%) |
| 12 to 14 Years | 30 (73.2%) | 6 (50.0%) |
| 15 Years | 10 (100.0%) | 13 (100.0%) |
| 16 and 17 Years | 4 (40.0%) | 4 (23.5%) |
| 18 to 24 Years | 53 (100.0%) | 60 (89.5%) |
| 25 to 34 Years | 52 (88.1%) | 42 (49.4%) |
| 35 to 44 Years | 35 (83.3%) | 73 (96.1%) |
| 45 to 54 Years | 44 (100.0%) | 64 (100.0%) |
| 55 to 64 Years | 128 (88.3%) | 137 (90.1%) |
| 65 to 74 Years | 48 (66.7%) | 50 (82.0%) |
| 75 Years and over | 52 (94.6%) | 64 (72.7%) |
| Total | 523 (84.2%) | 599 (79.3%) |
Income Below Poverty Among Married-Couple Families in Glasgow
The poverty statistics for married-couple families in Glasgow show that 5.9% or 13 of the total 220 families live below the poverty line. Families with 1 or 2 children have the highest poverty rate of 22.5%, comprising of 11 families. On the other hand, families with 3 or 4 children have the lowest poverty rate of 0.0%, which includes 0 families.
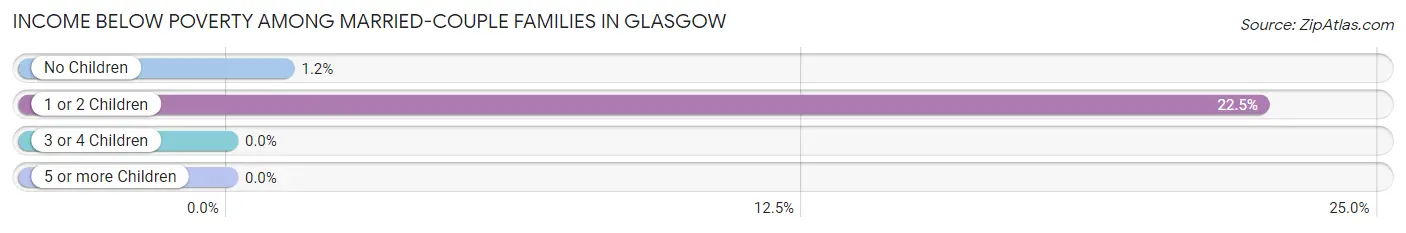
| Children | Above Poverty | Below Poverty |
| No Children | 161 (98.8%) | 2 (1.2%) |
| 1 or 2 Children | 38 (77.5%) | 11 (22.5%) |
| 3 or 4 Children | 8 (100.0%) | 0 (0.0%) |
| 5 or more Children | 0 (0.0%) | 0 (0.0%) |
| Total | 207 (94.1%) | 13 (5.9%) |
Income Below Poverty Among Single-Parent Households in Glasgow
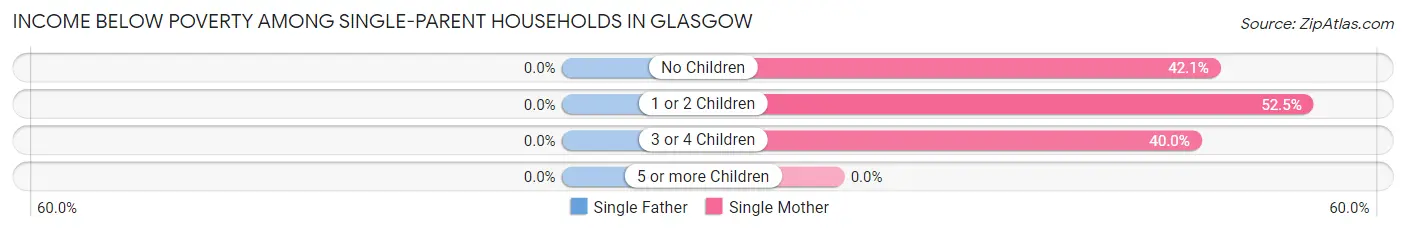
| Children | Single Father | Single Mother |
| No Children | 0 (0.0%) | 8 (42.1%) |
| 1 or 2 Children | 0 (0.0%) | 21 (52.5%) |
| 3 or 4 Children | 0 (0.0%) | 4 (40.0%) |
| 5 or more Children | 0 (0.0%) | 0 (0.0%) |
| Total | 0 (0.0%) | 33 (47.8%) |
Income Below Poverty Among Married-Couple vs Single-Parent Households in Glasgow
The poverty data for Glasgow shows that 13 of the married-couple family households (5.9%) and 33 of the single-parent households (30.0%) are living below the poverty level. Within the married-couple family households, those with 1 or 2 children have the highest poverty rate, with 11 households (22.5%) falling below the poverty line. Among the single-parent households, those with 3 or 4 children have the highest poverty rate, with 4 household (40.0%) living below poverty.
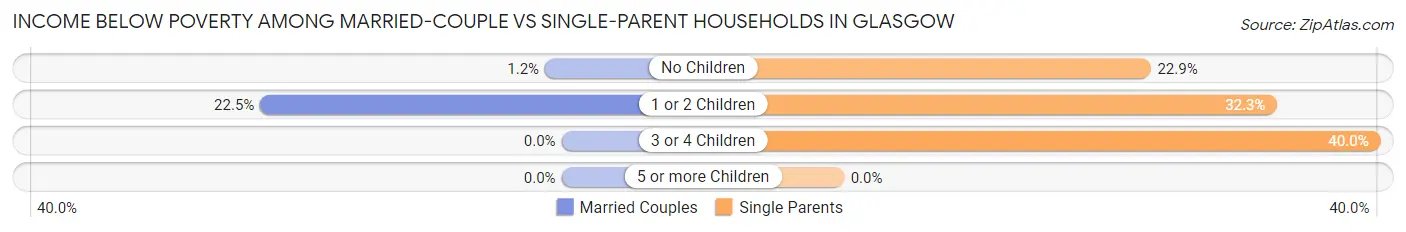
| Children | Married-Couple Families | Single-Parent Households |
| No Children | 2 (1.2%) | 8 (22.9%) |
| 1 or 2 Children | 11 (22.5%) | 21 (32.3%) |
| 3 or 4 Children | 0 (0.0%) | 4 (40.0%) |
| 5 or more Children | 0 (0.0%) | 0 (0.0%) |
| Total | 13 (5.9%) | 33 (30.0%) |
Race in Glasgow
The most populous races in Glasgow are White / Caucasian (1,053 | 76.5%), Black / African American (270 | 19.6%), and Two or more Races (53 | 3.8%).
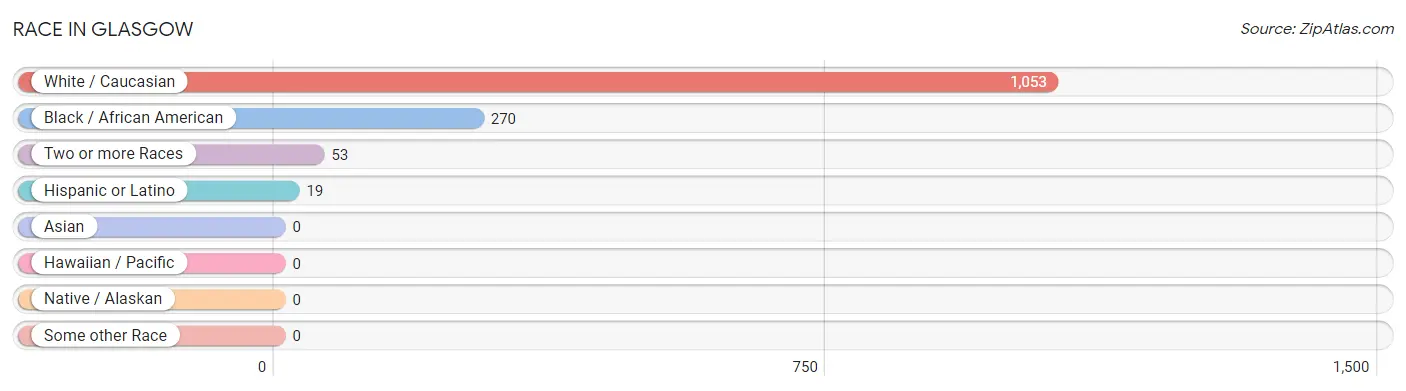
| Race | # Population | % Population |
| Asian | 0 | 0.0% |
| Black / African American | 270 | 19.6% |
| Hawaiian / Pacific | 0 | 0.0% |
| Hispanic or Latino | 19 | 1.4% |
| Native / Alaskan | 0 | 0.0% |
| White / Caucasian | 1,053 | 76.5% |
| Two or more Races | 53 | 3.8% |
| Some other Race | 0 | 0.0% |
| Total | 1,376 | 100.0% |
Ancestry in Glasgow
The most populous ancestries reported in Glasgow are American (417 | 30.3%), English (95 | 6.9%), German (91 | 6.6%), Irish (89 | 6.5%), and Scotch-Irish (44 | 3.2%), together accounting for 53.5% of all Glasgow residents.
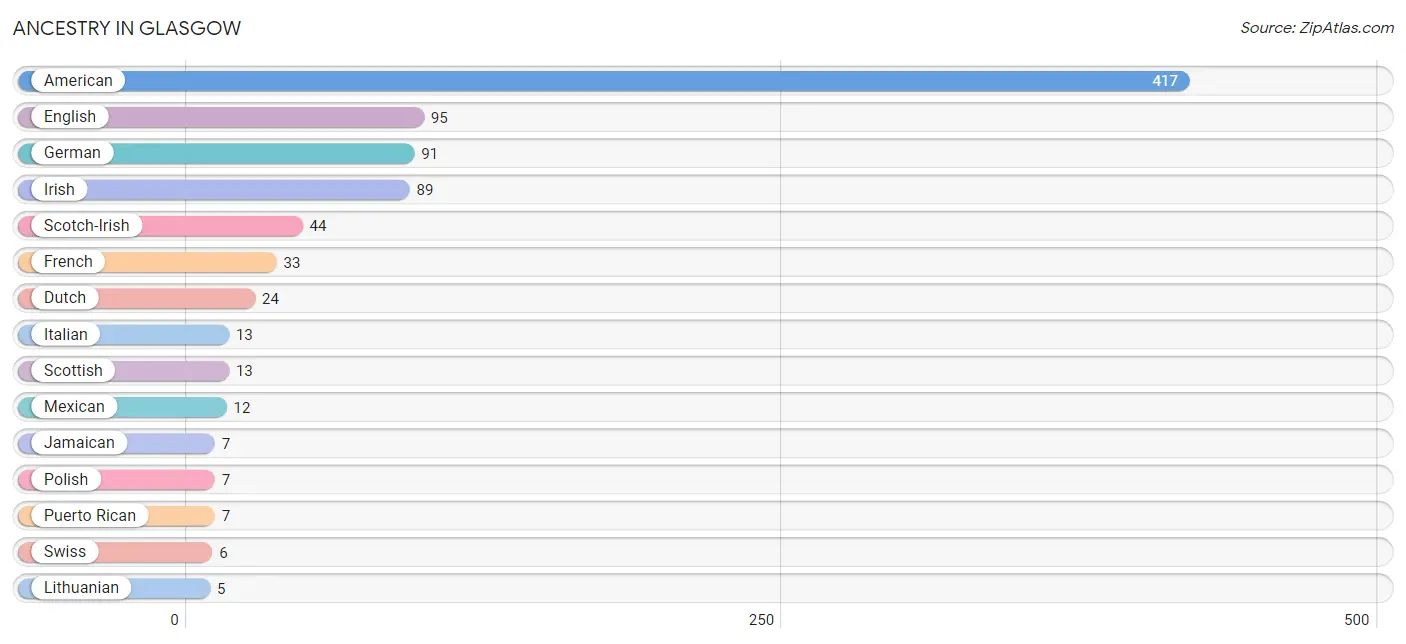
| Ancestry | # Population | % Population |
| American | 417 | 30.3% |
| British | 2 | 0.2% |
| Dutch | 24 | 1.7% |
| English | 95 | 6.9% |
| European | 3 | 0.2% |
| French | 33 | 2.4% |
| French Canadian | 4 | 0.3% |
| German | 91 | 6.6% |
| Irish | 89 | 6.5% |
| Italian | 13 | 0.9% |
| Jamaican | 7 | 0.5% |
| Lithuanian | 5 | 0.4% |
| Mexican | 12 | 0.9% |
| Pennsylvania German | 4 | 0.3% |
| Polish | 7 | 0.5% |
| Puerto Rican | 7 | 0.5% |
| Scotch-Irish | 44 | 3.2% |
| Scottish | 13 | 0.9% |
| Swiss | 6 | 0.4% | View All 19 Rows |
Immigrants in Glasgow
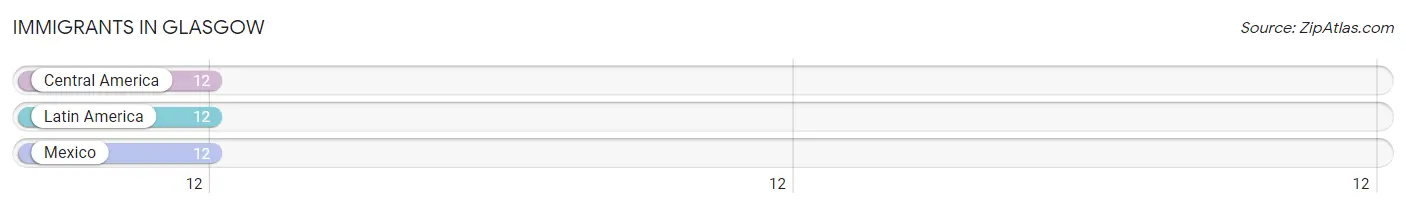
The most numerous immigrant groups reported in Glasgow came from Central America (12 | 0.9%), Latin America (12 | 0.9%), and Mexico (12 | 0.9%), together accounting for 2.6% of all Glasgow residents.
| Immigration Origin | # Population | % Population |
| Central America | 12 | 0.9% |
| Latin America | 12 | 0.9% |
| Mexico | 12 | 0.9% | View All 3 Rows |
Sex and Age in Glasgow
Sex and Age in Glasgow
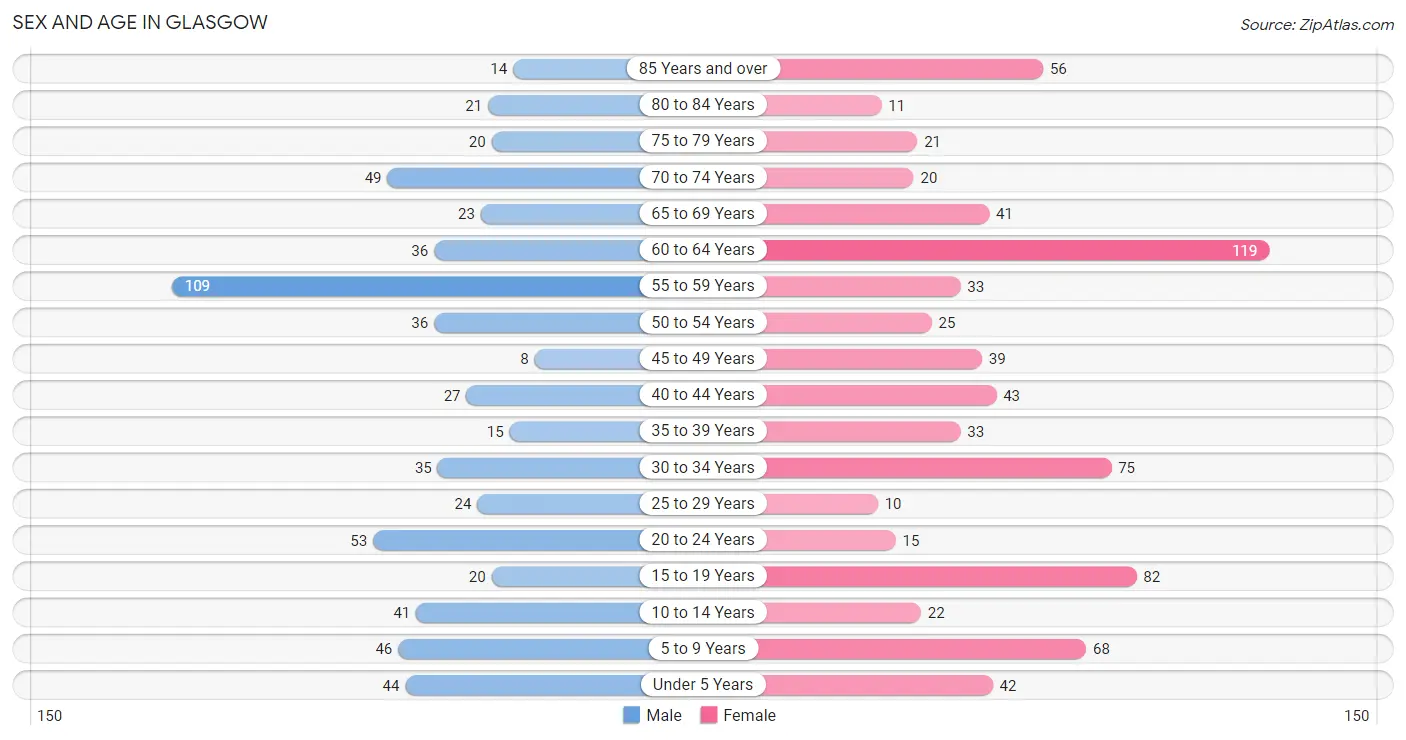
The most populous age groups in Glasgow are 55 to 59 Years (109 | 17.5%) for men and 60 to 64 Years (119 | 15.8%) for women.
| Age Bracket | Male | Female |
| Under 5 Years | 44 (7.1%) | 42 (5.6%) |
| 5 to 9 Years | 46 (7.4%) | 68 (9.0%) |
| 10 to 14 Years | 41 (6.6%) | 22 (2.9%) |
| 15 to 19 Years | 20 (3.2%) | 82 (10.9%) |
| 20 to 24 Years | 53 (8.5%) | 15 (2.0%) |
| 25 to 29 Years | 24 (3.9%) | 10 (1.3%) |
| 30 to 34 Years | 35 (5.6%) | 75 (9.9%) |
| 35 to 39 Years | 15 (2.4%) | 33 (4.4%) |
| 40 to 44 Years | 27 (4.3%) | 43 (5.7%) |
| 45 to 49 Years | 8 (1.3%) | 39 (5.2%) |
| 50 to 54 Years | 36 (5.8%) | 25 (3.3%) |
| 55 to 59 Years | 109 (17.5%) | 33 (4.4%) |
| 60 to 64 Years | 36 (5.8%) | 119 (15.8%) |
| 65 to 69 Years | 23 (3.7%) | 41 (5.4%) |
| 70 to 74 Years | 49 (7.9%) | 20 (2.6%) |
| 75 to 79 Years | 20 (3.2%) | 21 (2.8%) |
| 80 to 84 Years | 21 (3.4%) | 11 (1.5%) |
| 85 Years and over | 14 (2.2%) | 56 (7.4%) |
| Total | 621 (100.0%) | 755 (100.0%) |
Families and Households in Glasgow
Median Family Size in Glasgow
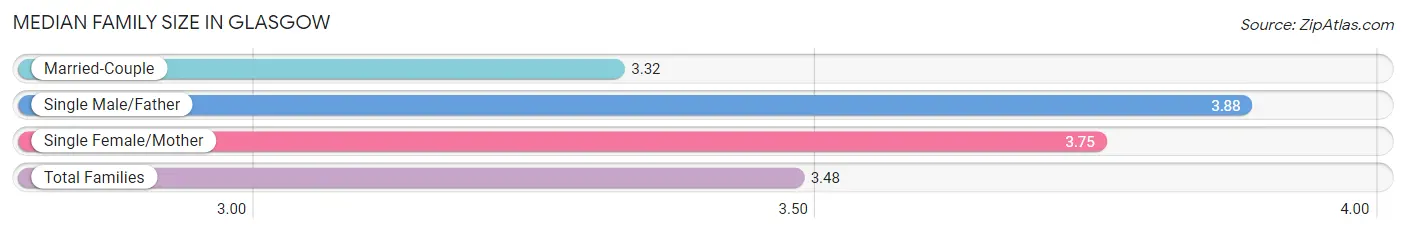
The median family size in Glasgow is 3.48 persons per family, with single male/father families (41 | 12.4%) accounting for the largest median family size of 3.88 persons per family. On the other hand, married-couple families (220 | 66.7%) represent the smallest median family size with 3.32 persons per family.
| Family Type | # Families | Family Size |
| Married-Couple | 220 (66.7%) | 3.32 |
| Single Male/Father | 41 (12.4%) | 3.88 |
| Single Female/Mother | 69 (20.9%) | 3.75 |
| Total Families | 330 (100.0%) | 3.48 |
Median Household Size in Glasgow
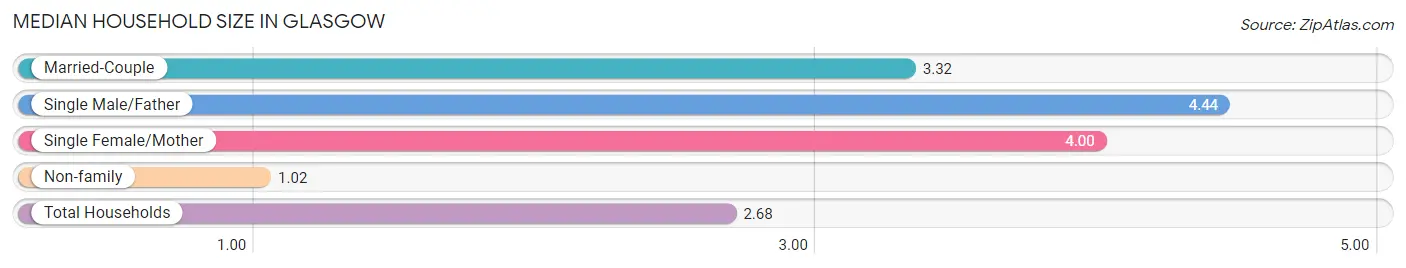
The median household size in Glasgow is 2.68 persons per household, with single male/father households (41 | 8.0%) accounting for the largest median household size of 4.44 persons per household. non-family households (184 | 35.8%) represent the smallest median household size with 1.02 persons per household.
| Household Type | # Households | Household Size |
| Married-Couple | 220 (42.8%) | 3.32 |
| Single Male/Father | 41 (8.0%) | 4.44 |
| Single Female/Mother | 69 (13.4%) | 4.00 |
| Non-family | 184 (35.8%) | 1.02 |
| Total Households | 514 (100.0%) | 2.68 |
Household Size by Marriage Status in Glasgow
Out of a total of 514 households in Glasgow, 330 (64.2%) are family households, while 184 (35.8%) are nonfamily households. The most numerous type of family households are 2-person households, comprising 136, and the most common type of nonfamily households are 1-person households, comprising 181.
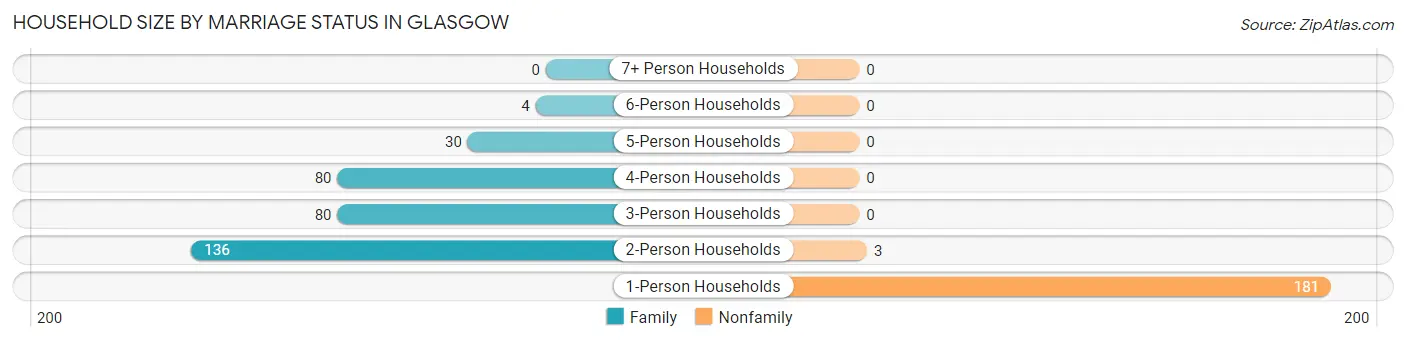
| Household Size | Family Households | Nonfamily Households |
| 1-Person Households | - | 181 (35.2%) |
| 2-Person Households | 136 (26.5%) | 3 (0.6%) |
| 3-Person Households | 80 (15.6%) | 0 (0.0%) |
| 4-Person Households | 80 (15.6%) | 0 (0.0%) |
| 5-Person Households | 30 (5.8%) | 0 (0.0%) |
| 6-Person Households | 4 (0.8%) | 0 (0.0%) |
| 7+ Person Households | 0 (0.0%) | 0 (0.0%) |
| Total | 330 (64.2%) | 184 (35.8%) |
Female Fertility in Glasgow
Fertility by Age in Glasgow
Average fertility rate in Glasgow is 98.0 births per 1,000 women. Women in the age bracket of 20 to 34 years have the highest fertility rate with 250.0 births per 1,000 women. Women in the age bracket of 20 to 34 years acount for 86.2% of all women with births.
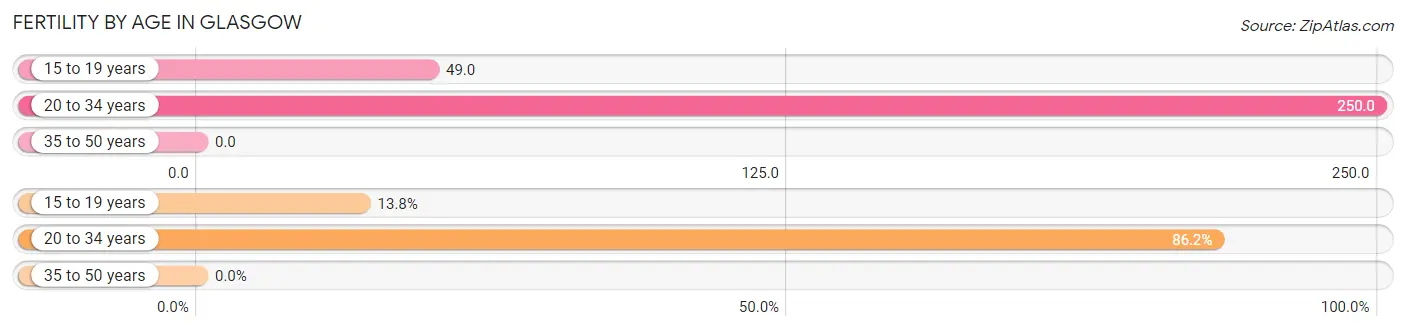
| Age Bracket | Women with Births | Births / 1,000 Women |
| 15 to 19 years | 4 (13.8%) | 49.0 |
| 20 to 34 years | 25 (86.2%) | 250.0 |
| 35 to 50 years | 0 (0.0%) | 0.0 |
| Total | 29 (100.0%) | 98.0 |
Fertility by Age by Marriage Status in Glasgow
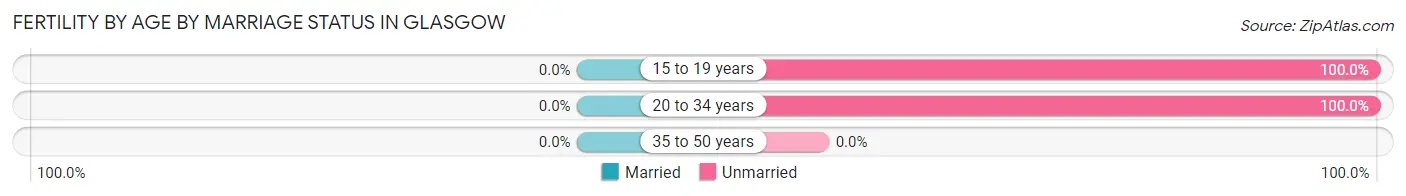
| Age Bracket | Married | Unmarried |
| 15 to 19 years | 0 (0.0%) | 4 (100.0%) |
| 20 to 34 years | 0 (0.0%) | 25 (100.0%) |
| 35 to 50 years | 0 (0.0%) | 0 (0.0%) |
| Total | 0 (0.0%) | 29 (100.0%) |
Fertility by Education in Glasgow
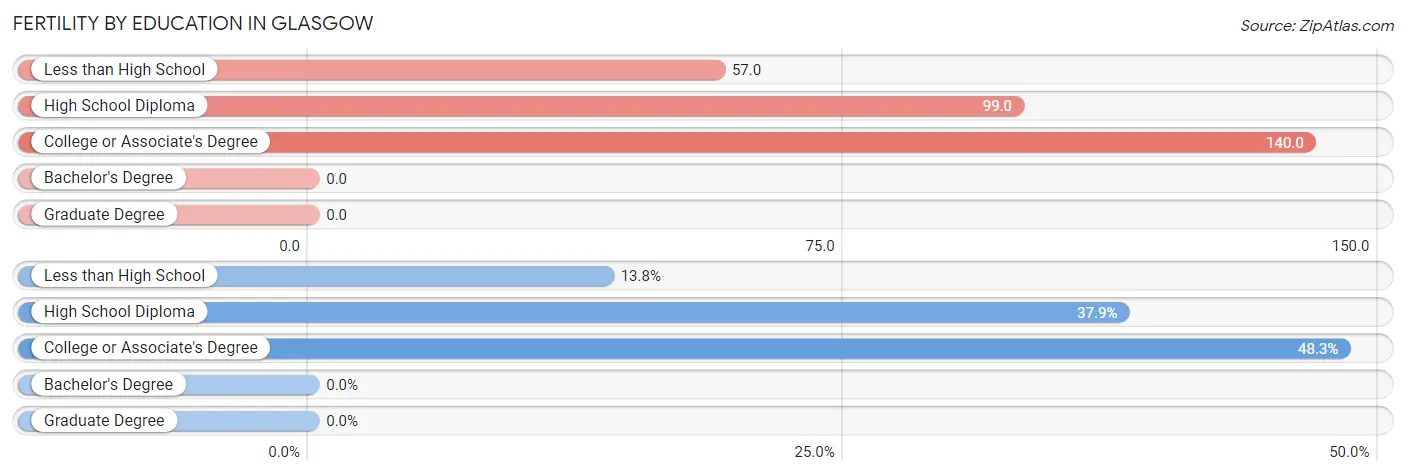
| Educational Attainment | Women with Births | Births / 1,000 Women |
| Less than High School | 4 (13.8%) | 57.0 |
| High School Diploma | 11 (37.9%) | 99.0 |
| College or Associate's Degree | 14 (48.3%) | 140.0 |
| Bachelor's Degree | 0 (0.0%) | 0.0 |
| Graduate Degree | 0 (0.0%) | 0.0 |
| Total | 29 (100.0%) | 98.0 |
Fertility by Education by Marriage Status in Glasgow
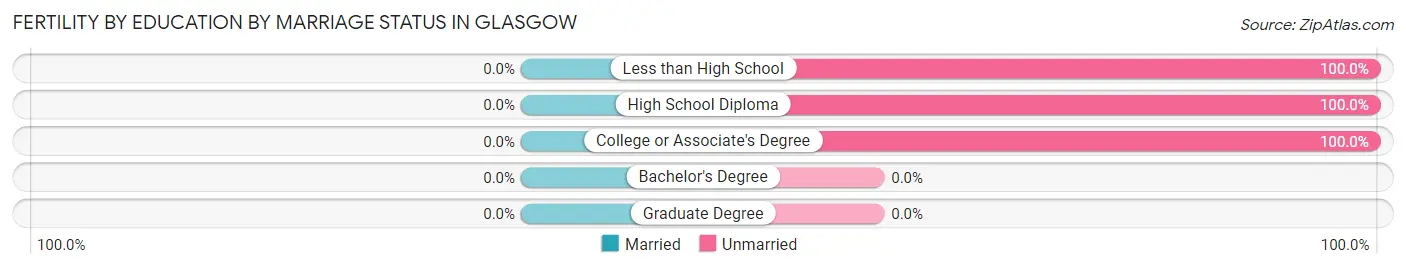
| Educational Attainment | Married | Unmarried |
| Less than High School | 0 (0.0%) | 4 (100.0%) |
| High School Diploma | 0 (0.0%) | 11 (100.0%) |
| College or Associate's Degree | 0 (0.0%) | 14 (100.0%) |
| Bachelor's Degree | 0 (0.0%) | 0 (0.0%) |
| Graduate Degree | 0 (0.0%) | 0 (0.0%) |
| Total | 0 (0.0%) | 29 (100.0%) |
Employment Characteristics in Glasgow
Employment by Class of Employer in Glasgow
Among the 532 employed individuals in Glasgow, private company employees (377 | 70.9%), local government employees (54 | 10.2%), and not-for-profit organizations (40 | 7.5%) make up the most common classes of employment.
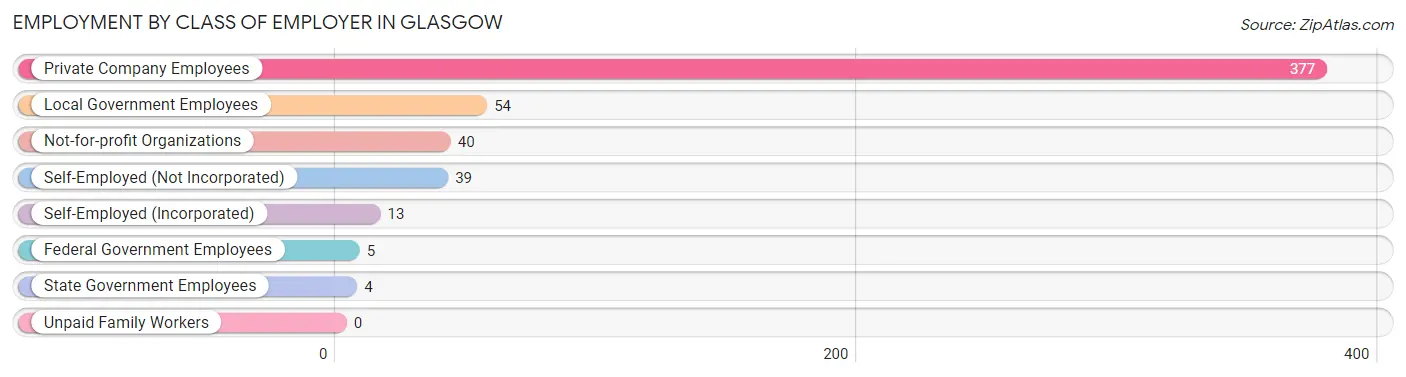
| Employer Class | # Employees | % Employees |
| Private Company Employees | 377 | 70.9% |
| Self-Employed (Incorporated) | 13 | 2.4% |
| Self-Employed (Not Incorporated) | 39 | 7.3% |
| Not-for-profit Organizations | 40 | 7.5% |
| Local Government Employees | 54 | 10.2% |
| State Government Employees | 4 | 0.7% |
| Federal Government Employees | 5 | 0.9% |
| Unpaid Family Workers | 0 | 0.0% |
| Total | 532 | 100.0% |
Employment Status by Age in Glasgow
According to the labor force statistics for Glasgow, out of the total population over 16 years of age (1,090), 58.3% or 635 individuals are in the labor force, with 13.2% or 84 of them unemployed. The age group with the highest labor force participation rate is 30 to 34 years, with 90.9% or 100 individuals in the labor force. Within the labor force, the 16 to 19 years age range has the highest percentage of unemployed individuals, with 40.4% or 23 of them being unemployed.
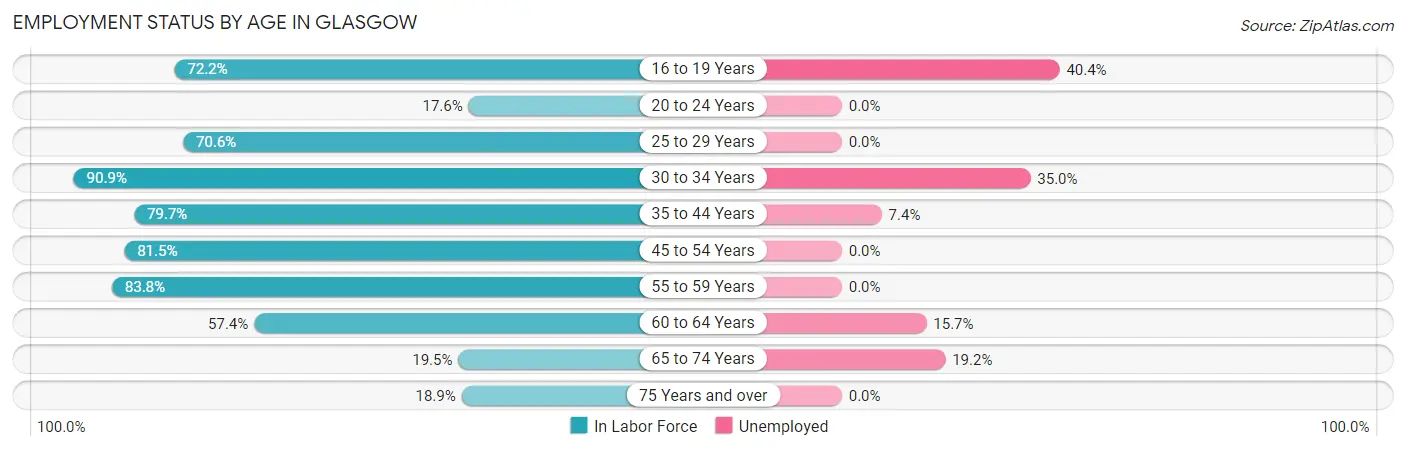
| Age Bracket | In Labor Force | Unemployed |
| 16 to 19 Years | 57 (72.2%) | 23 (40.4%) |
| 20 to 24 Years | 12 (17.6%) | 0 (0.0%) |
| 25 to 29 Years | 24 (70.6%) | 0 (0.0%) |
| 30 to 34 Years | 100 (90.9%) | 35 (35.0%) |
| 35 to 44 Years | 94 (79.7%) | 7 (7.4%) |
| 45 to 54 Years | 88 (81.5%) | 0 (0.0%) |
| 55 to 59 Years | 119 (83.8%) | 0 (0.0%) |
| 60 to 64 Years | 89 (57.4%) | 14 (15.7%) |
| 65 to 74 Years | 26 (19.5%) | 5 (19.2%) |
| 75 Years and over | 27 (18.9%) | 0 (0.0%) |
| Total | 635 (58.3%) | 84 (13.2%) |
Employment Status by Educational Attainment in Glasgow
According to labor force statistics for Glasgow, 77.1% of individuals (514) out of the total population between 25 and 64 years of age (667) are in the labor force, with 10.9% or 56 of them being unemployed. The group with the highest labor force participation rate are those with the educational attainment of college / associate degree, with 84.0% or 137 individuals in the labor force. Within the labor force, individuals with high school diploma education have the highest percentage of unemployment, with 17.8% or 49 of them being unemployed.
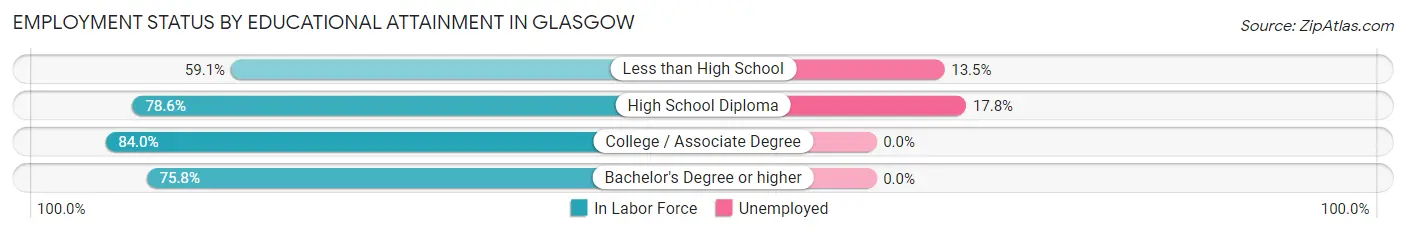
| Educational Attainment | In Labor Force | Unemployed |
| Less than High School | 52 (59.1%) | 12 (13.5%) |
| High School Diploma | 275 (78.6%) | 62 (17.8%) |
| College / Associate Degree | 137 (84.0%) | 0 (0.0%) |
| Bachelor's Degree or higher | 50 (75.8%) | 0 (0.0%) |
| Total | 514 (77.1%) | 73 (10.9%) |
Employment Occupations by Sex in Glasgow
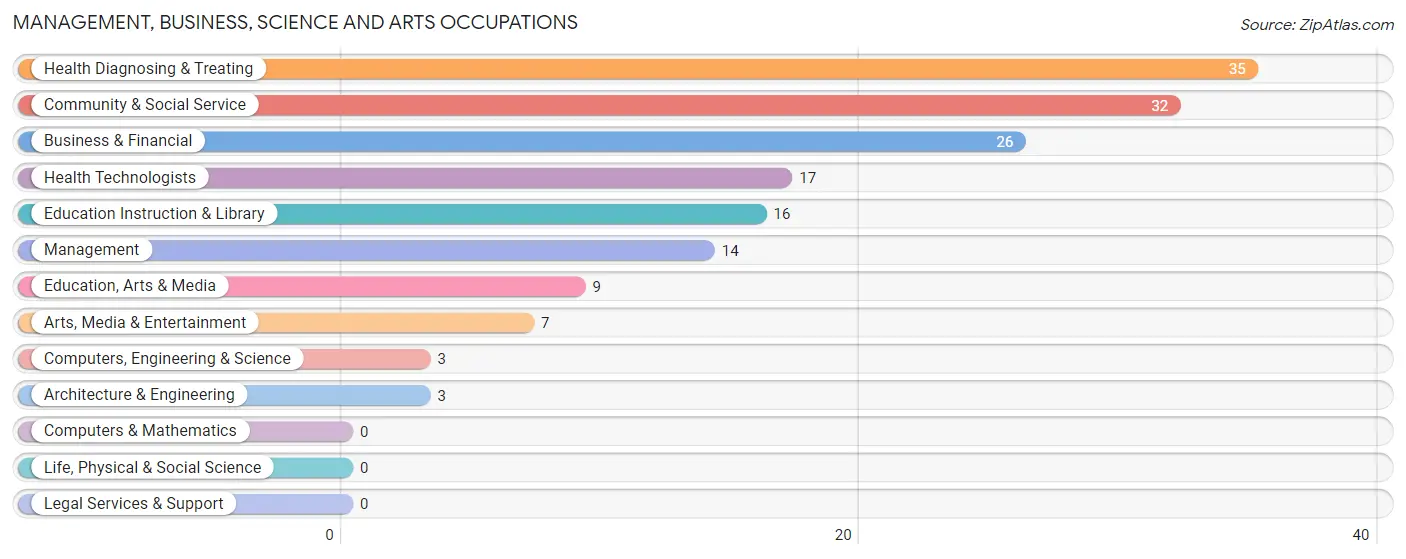
Management, Business, Science and Arts Occupations
The most common Management, Business, Science and Arts occupations in Glasgow are Health Diagnosing & Treating (35 | 6.3%), Community & Social Service (32 | 5.8%), Business & Financial (26 | 4.7%), Health Technologists (17 | 3.1%), and Education Instruction & Library (16 | 2.9%).
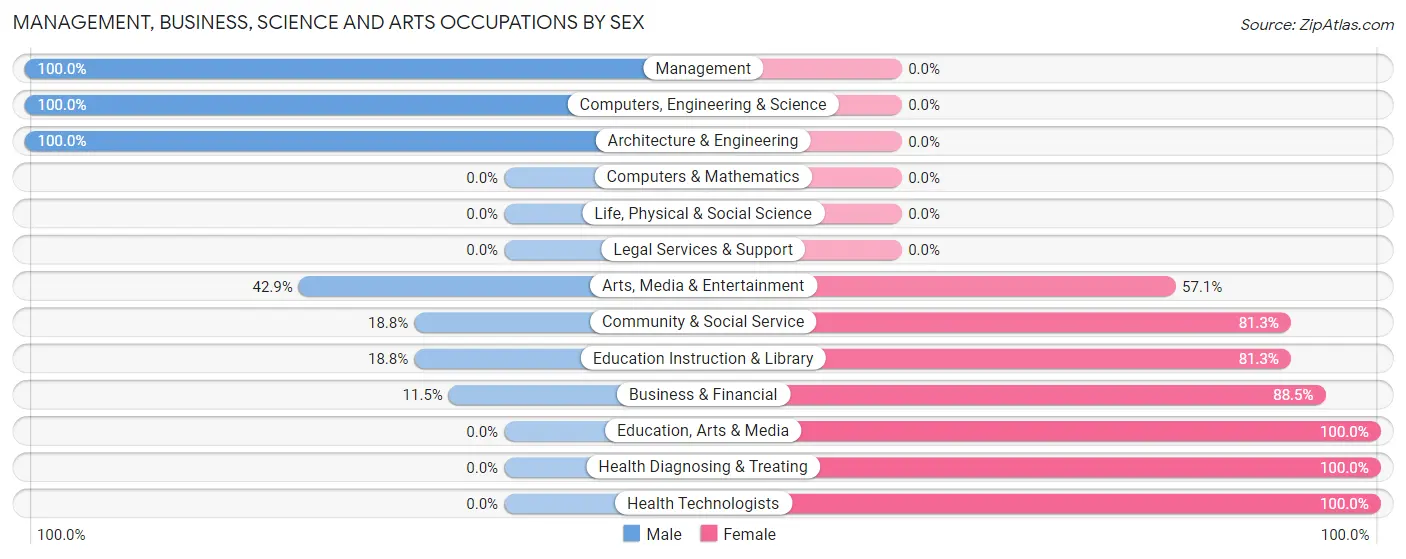
Management, Business, Science and Arts Occupations by Sex
Within the Management, Business, Science and Arts occupations in Glasgow, the most male-oriented occupations are Management (100.0%), Computers, Engineering & Science (100.0%), and Architecture & Engineering (100.0%), while the most female-oriented occupations are Education, Arts & Media (100.0%), Health Diagnosing & Treating (100.0%), and Health Technologists (100.0%).
| Occupation | Male | Female |
| Management | 14 (100.0%) | 0 (0.0%) |
| Business & Financial | 3 (11.5%) | 23 (88.5%) |
| Computers, Engineering & Science | 3 (100.0%) | 0 (0.0%) |
| Computers & Mathematics | 0 (0.0%) | 0 (0.0%) |
| Architecture & Engineering | 3 (100.0%) | 0 (0.0%) |
| Life, Physical & Social Science | 0 (0.0%) | 0 (0.0%) |
| Community & Social Service | 6 (18.8%) | 26 (81.2%) |
| Education, Arts & Media | 0 (0.0%) | 9 (100.0%) |
| Legal Services & Support | 0 (0.0%) | 0 (0.0%) |
| Education Instruction & Library | 3 (18.8%) | 13 (81.2%) |
| Arts, Media & Entertainment | 3 (42.9%) | 4 (57.1%) |
| Health Diagnosing & Treating | 0 (0.0%) | 35 (100.0%) |
| Health Technologists | 0 (0.0%) | 17 (100.0%) |
| Total (Category) | 26 (23.6%) | 84 (76.4%) |
| Total (Overall) | 236 (42.7%) | 316 (57.3%) |
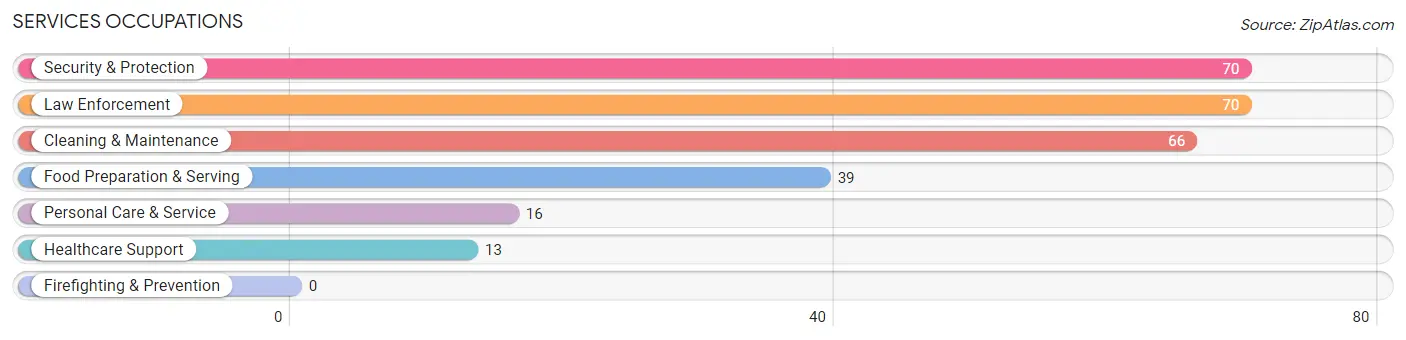
Services Occupations
The most common Services occupations in Glasgow are Security & Protection (70 | 12.7%), Law Enforcement (70 | 12.7%), Cleaning & Maintenance (66 | 12.0%), Food Preparation & Serving (39 | 7.1%), and Personal Care & Service (16 | 2.9%).
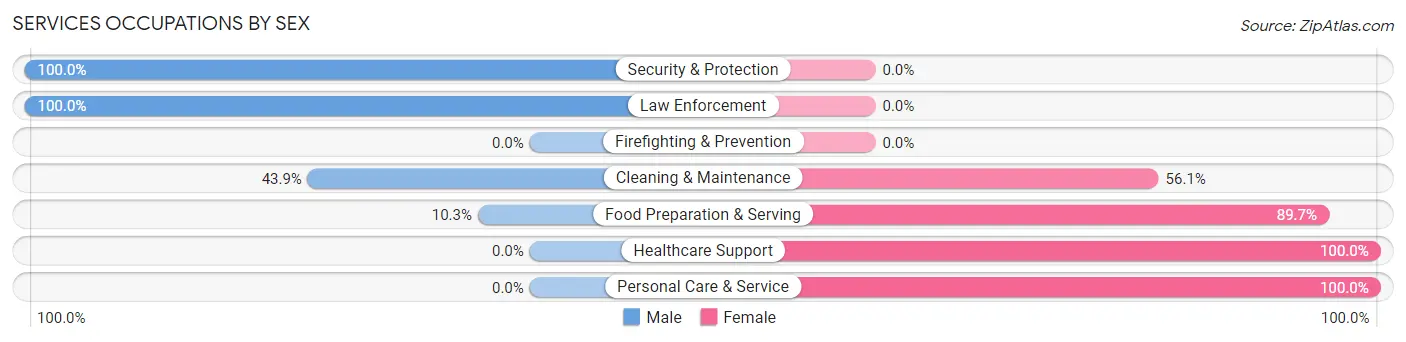
Services Occupations by Sex
Within the Services occupations in Glasgow, the most male-oriented occupations are Security & Protection (100.0%), Law Enforcement (100.0%), and Cleaning & Maintenance (43.9%), while the most female-oriented occupations are Healthcare Support (100.0%), Personal Care & Service (100.0%), and Food Preparation & Serving (89.7%).
| Occupation | Male | Female |
| Healthcare Support | 0 (0.0%) | 13 (100.0%) |
| Security & Protection | 70 (100.0%) | 0 (0.0%) |
| Firefighting & Prevention | 0 (0.0%) | 0 (0.0%) |
| Law Enforcement | 70 (100.0%) | 0 (0.0%) |
| Food Preparation & Serving | 4 (10.3%) | 35 (89.7%) |
| Cleaning & Maintenance | 29 (43.9%) | 37 (56.1%) |
| Personal Care & Service | 0 (0.0%) | 16 (100.0%) |
| Total (Category) | 103 (50.5%) | 101 (49.5%) |
| Total (Overall) | 236 (42.7%) | 316 (57.3%) |
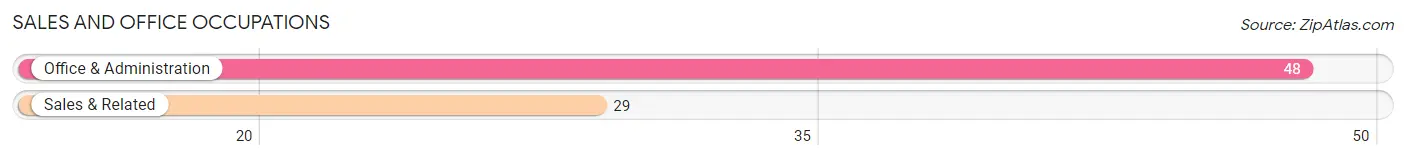
Sales and Office Occupations
The most common Sales and Office occupations in Glasgow are Office & Administration (48 | 8.7%), and Sales & Related (29 | 5.2%).
Sales and Office Occupations by Sex
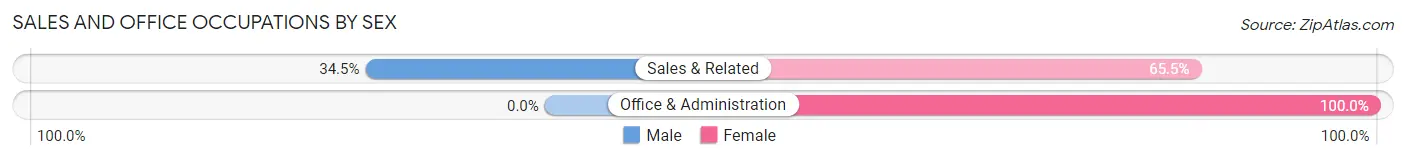
| Occupation | Male | Female |
| Sales & Related | 10 (34.5%) | 19 (65.5%) |
| Office & Administration | 0 (0.0%) | 48 (100.0%) |
| Total (Category) | 10 (13.0%) | 67 (87.0%) |
| Total (Overall) | 236 (42.7%) | 316 (57.3%) |
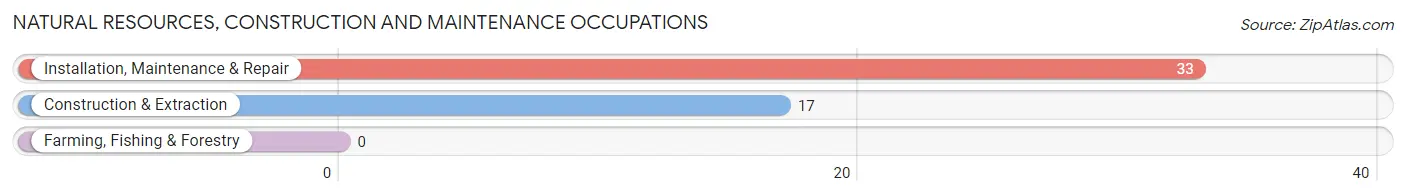
Natural Resources, Construction and Maintenance Occupations
The most common Natural Resources, Construction and Maintenance occupations in Glasgow are Installation, Maintenance & Repair (33 | 6.0%), and Construction & Extraction (17 | 3.1%).
Natural Resources, Construction and Maintenance Occupations by Sex
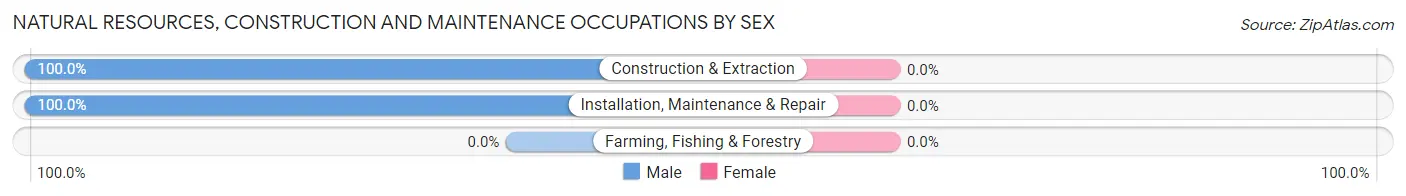
| Occupation | Male | Female |
| Farming, Fishing & Forestry | 0 (0.0%) | 0 (0.0%) |
| Construction & Extraction | 17 (100.0%) | 0 (0.0%) |
| Installation, Maintenance & Repair | 33 (100.0%) | 0 (0.0%) |
| Total (Category) | 50 (100.0%) | 0 (0.0%) |
| Total (Overall) | 236 (42.7%) | 316 (57.3%) |
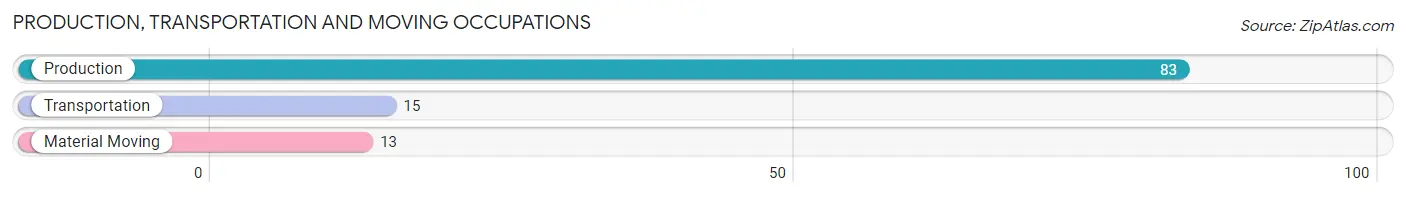
Production, Transportation and Moving Occupations
The most common Production, Transportation and Moving occupations in Glasgow are Production (83 | 15.0%), Transportation (15 | 2.7%), and Material Moving (13 | 2.4%).
Production, Transportation and Moving Occupations by Sex
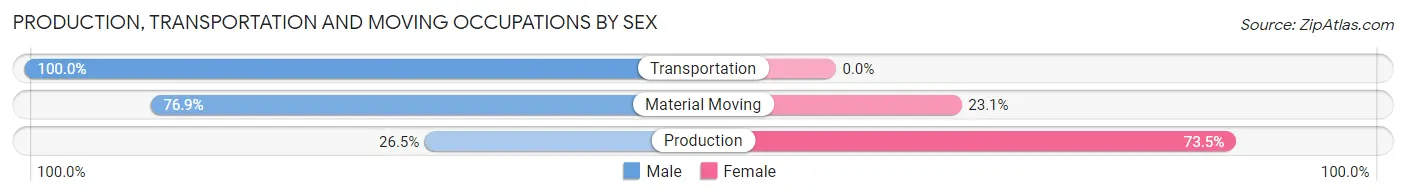
| Occupation | Male | Female |
| Production | 22 (26.5%) | 61 (73.5%) |
| Transportation | 15 (100.0%) | 0 (0.0%) |
| Material Moving | 10 (76.9%) | 3 (23.1%) |
| Total (Category) | 47 (42.3%) | 64 (57.7%) |
| Total (Overall) | 236 (42.7%) | 316 (57.3%) |
Employment Industries by Sex in Glasgow
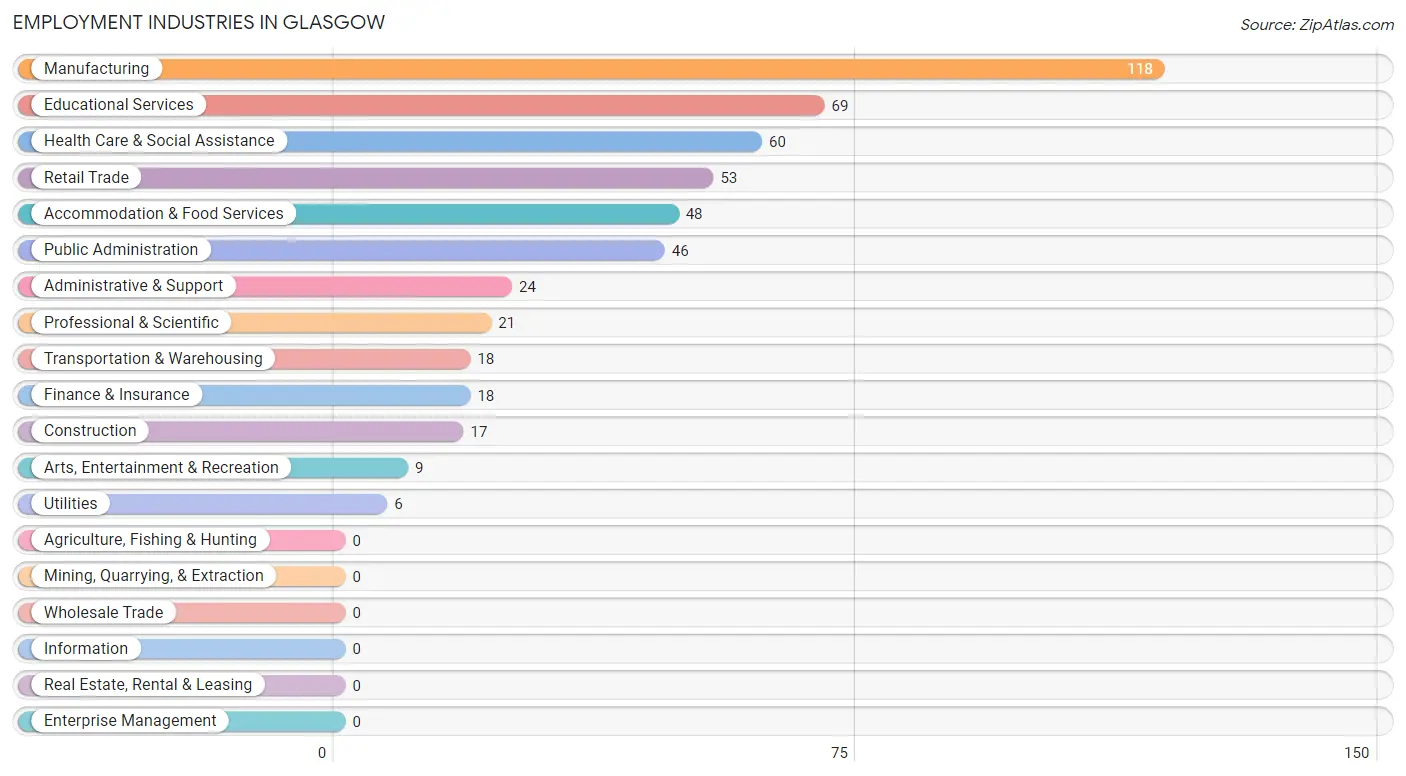
Employment Industries in Glasgow
The major employment industries in Glasgow include Manufacturing (118 | 21.4%), Educational Services (69 | 12.5%), Health Care & Social Assistance (60 | 10.9%), Retail Trade (53 | 9.6%), and Accommodation & Food Services (48 | 8.7%).
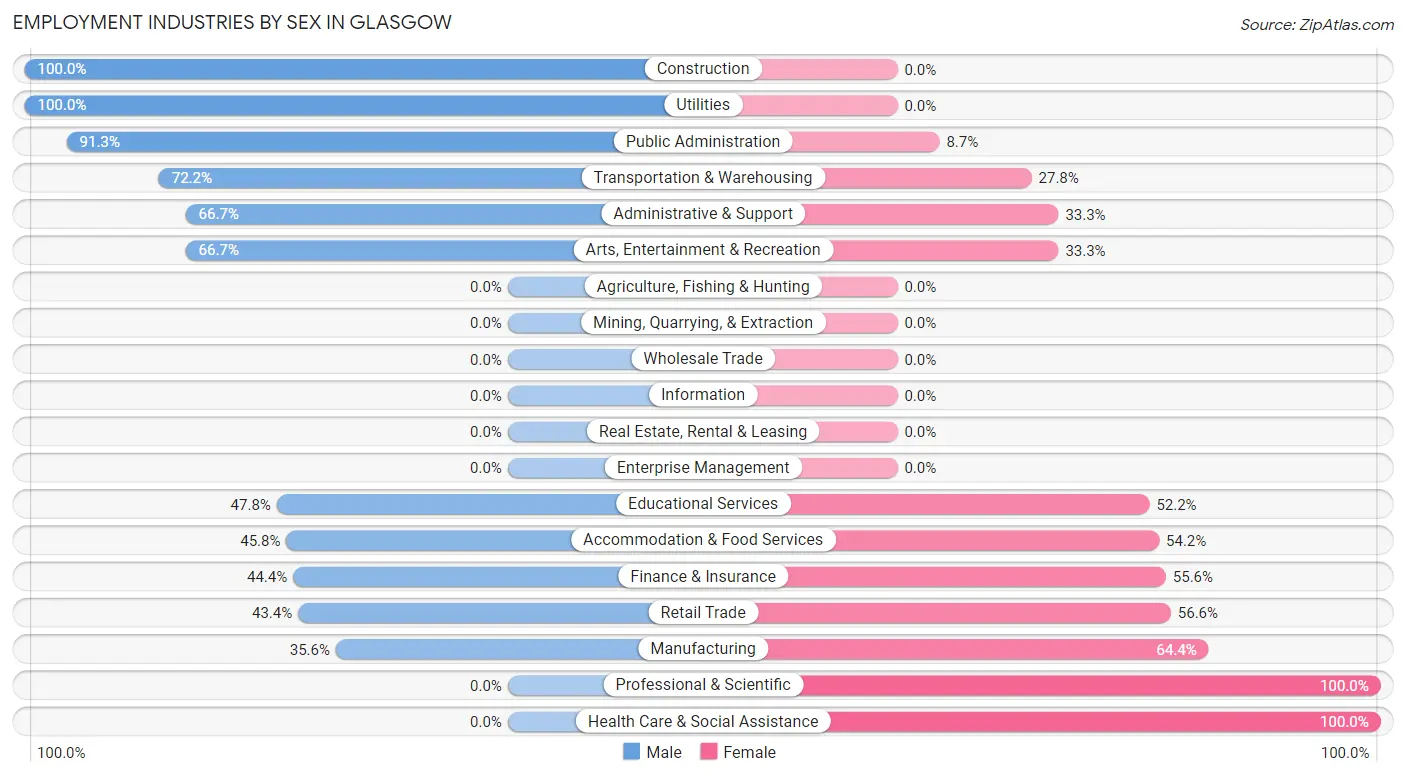
Employment Industries by Sex in Glasgow
The Glasgow industries that see more men than women are Construction (100.0%), Utilities (100.0%), and Public Administration (91.3%), whereas the industries that tend to have a higher number of women are Professional & Scientific (100.0%), Health Care & Social Assistance (100.0%), and Manufacturing (64.4%).
| Industry | Male | Female |
| Agriculture, Fishing & Hunting | 0 (0.0%) | 0 (0.0%) |
| Mining, Quarrying, & Extraction | 0 (0.0%) | 0 (0.0%) |
| Construction | 17 (100.0%) | 0 (0.0%) |
| Manufacturing | 42 (35.6%) | 76 (64.4%) |
| Wholesale Trade | 0 (0.0%) | 0 (0.0%) |
| Retail Trade | 23 (43.4%) | 30 (56.6%) |
| Transportation & Warehousing | 13 (72.2%) | 5 (27.8%) |
| Utilities | 6 (100.0%) | 0 (0.0%) |
| Information | 0 (0.0%) | 0 (0.0%) |
| Finance & Insurance | 8 (44.4%) | 10 (55.6%) |
| Real Estate, Rental & Leasing | 0 (0.0%) | 0 (0.0%) |
| Professional & Scientific | 0 (0.0%) | 21 (100.0%) |
| Enterprise Management | 0 (0.0%) | 0 (0.0%) |
| Administrative & Support | 16 (66.7%) | 8 (33.3%) |
| Educational Services | 33 (47.8%) | 36 (52.2%) |
| Health Care & Social Assistance | 0 (0.0%) | 60 (100.0%) |
| Arts, Entertainment & Recreation | 6 (66.7%) | 3 (33.3%) |
| Accommodation & Food Services | 22 (45.8%) | 26 (54.2%) |
| Public Administration | 42 (91.3%) | 4 (8.7%) |
| Total | 236 (42.7%) | 316 (57.3%) |
Education in Glasgow
School Enrollment in Glasgow
The most common levels of schooling among the 307 students in Glasgow are elementary school (76 | 24.8%), high school (74 | 24.1%), and college / undergraduate (69 | 22.5%).
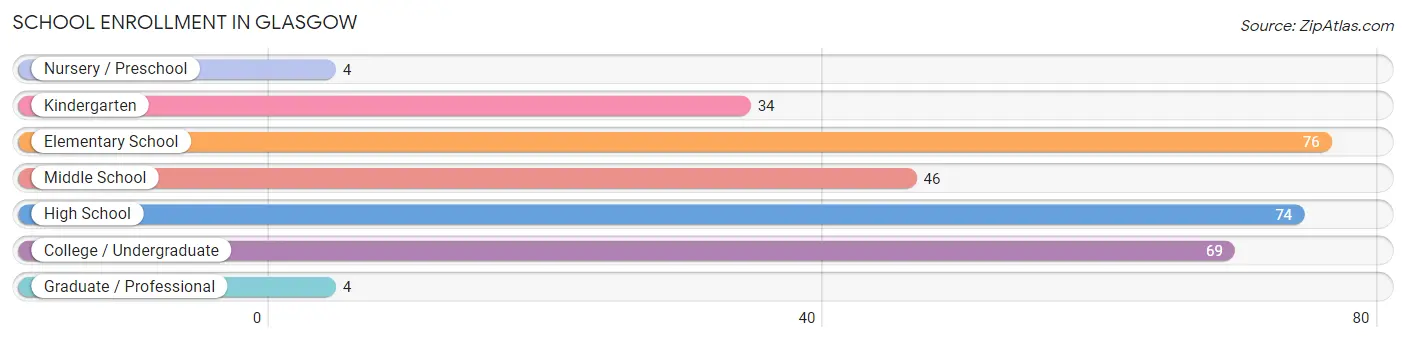
| School Level | # Students | % Students |
| Nursery / Preschool | 4 | 1.3% |
| Kindergarten | 34 | 11.1% |
| Elementary School | 76 | 24.8% |
| Middle School | 46 | 15.0% |
| High School | 74 | 24.1% |
| College / Undergraduate | 69 | 22.5% |
| Graduate / Professional | 4 | 1.3% |
| Total | 307 | 100.0% |
School Enrollment by Age by Funding Source in Glasgow
Out of a total of 307 students who are enrolled in schools in Glasgow, 22 (7.2%) attend a private institution, while the remaining 285 (92.8%) are enrolled in public schools. The age group of 35 years and over has the highest likelihood of being enrolled in private schools, with 7 (33.3% in the age bracket) enrolled. Conversely, the age group of 18 to 19 year olds has the lowest likelihood of being enrolled in a private school, with 30 (100.0% in the age bracket) attending a public institution.
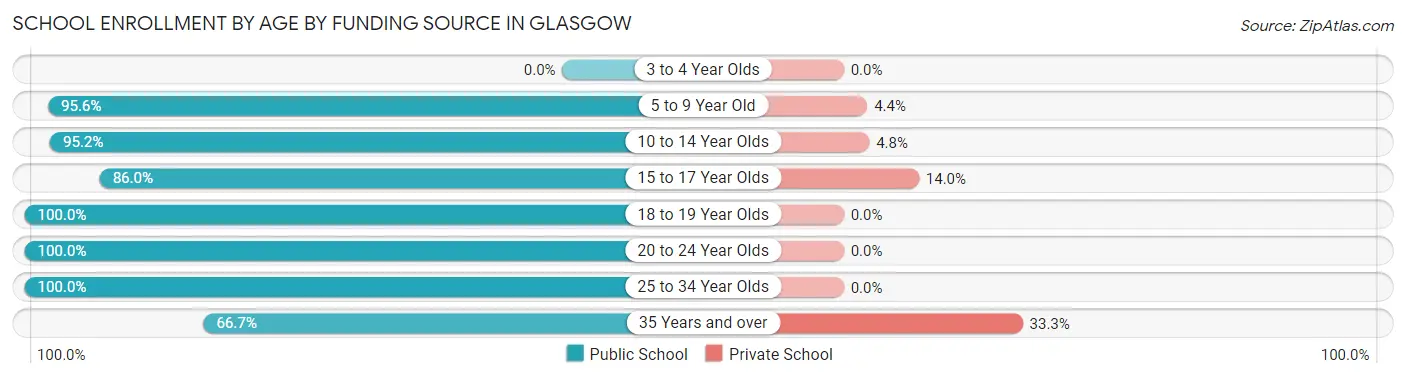
| Age Bracket | Public School | Private School |
| 3 to 4 Year Olds | 0 (0.0%) | 0 (0.0%) |
| 5 to 9 Year Old | 109 (95.6%) | 5 (4.4%) |
| 10 to 14 Year Olds | 60 (95.2%) | 3 (4.8%) |
| 15 to 17 Year Olds | 43 (86.0%) | 7 (14.0%) |
| 18 to 19 Year Olds | 30 (100.0%) | 0 (0.0%) |
| 20 to 24 Year Olds | 8 (100.0%) | 0 (0.0%) |
| 25 to 34 Year Olds | 21 (100.0%) | 0 (0.0%) |
| 35 Years and over | 14 (66.7%) | 7 (33.3%) |
| Total | 285 (92.8%) | 22 (7.2%) |
Educational Attainment by Field of Study in Glasgow
Science & technology (22 | 18.3%), business (19 | 15.8%), education (19 | 15.8%), physical & health sciences (13 | 10.8%), and engineering (13 | 10.8%) are the most common fields of study among 120 individuals in Glasgow who have obtained a bachelor's degree or higher.
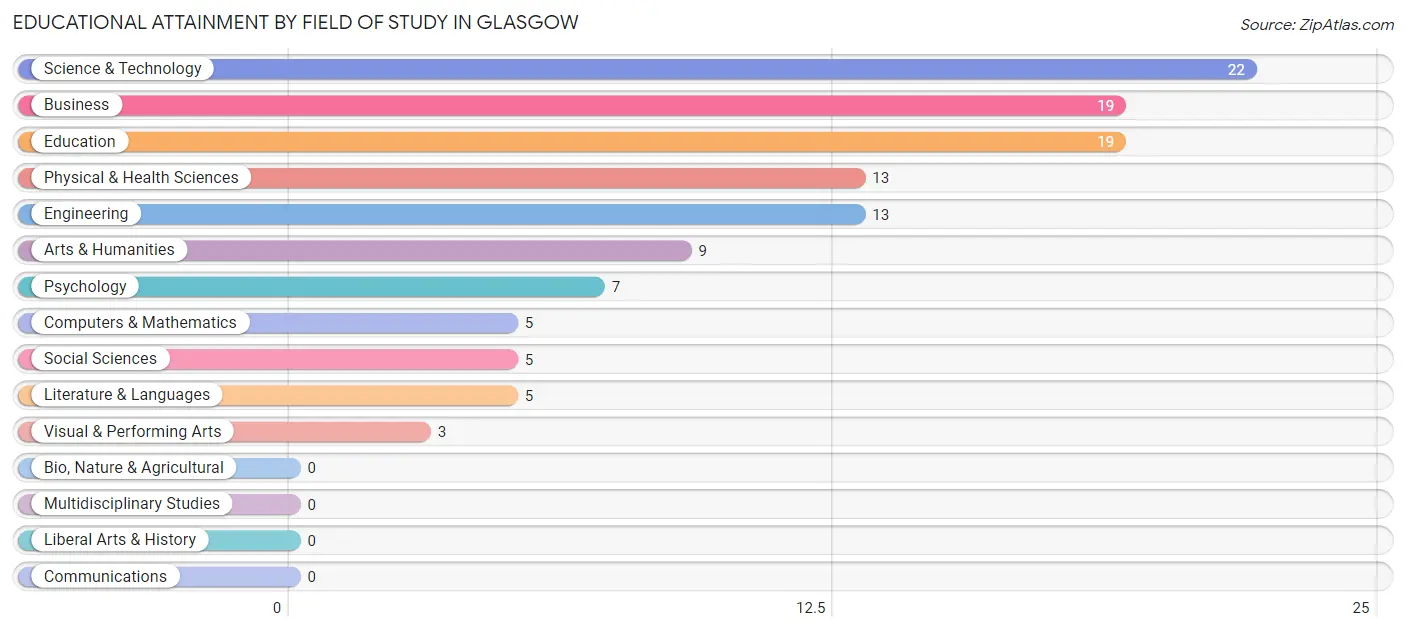
| Field of Study | # Graduates | % Graduates |
| Computers & Mathematics | 5 | 4.2% |
| Bio, Nature & Agricultural | 0 | 0.0% |
| Physical & Health Sciences | 13 | 10.8% |
| Psychology | 7 | 5.8% |
| Social Sciences | 5 | 4.2% |
| Engineering | 13 | 10.8% |
| Multidisciplinary Studies | 0 | 0.0% |
| Science & Technology | 22 | 18.3% |
| Business | 19 | 15.8% |
| Education | 19 | 15.8% |
| Literature & Languages | 5 | 4.2% |
| Liberal Arts & History | 0 | 0.0% |
| Visual & Performing Arts | 3 | 2.5% |
| Communications | 0 | 0.0% |
| Arts & Humanities | 9 | 7.5% |
| Total | 120 | 100.0% |
Transportation & Commute in Glasgow
Vehicle Availability by Sex in Glasgow
The most prevalent vehicle ownership categories in Glasgow are males with 2 vehicles (74, accounting for 31.9%) and females with 2 vehicles (104, making up 24.7%).
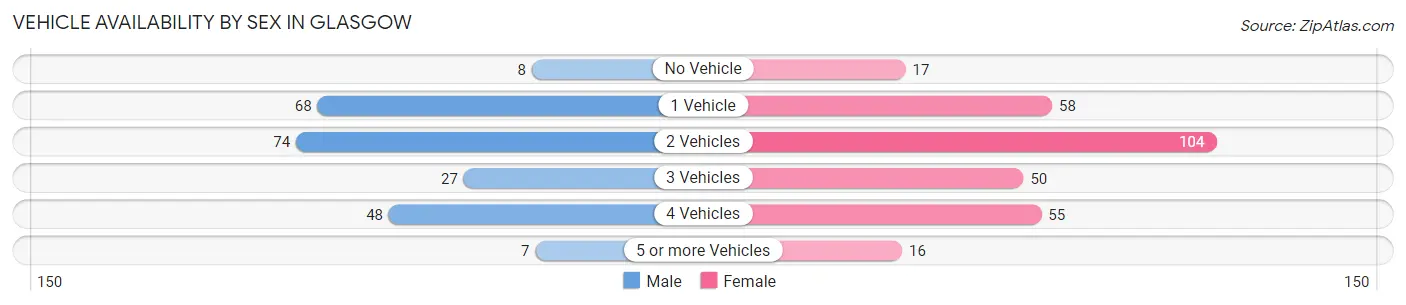
| Vehicles Available | Male | Female |
| No Vehicle | 8 (3.5%) | 17 (5.7%) |
| 1 Vehicle | 68 (29.3%) | 58 (19.3%) |
| 2 Vehicles | 74 (31.9%) | 104 (34.7%) |
| 3 Vehicles | 27 (11.6%) | 50 (16.7%) |
| 4 Vehicles | 48 (20.7%) | 55 (18.3%) |
| 5 or more Vehicles | 7 (3.0%) | 16 (5.3%) |
| Total | 232 (100.0%) | 300 (100.0%) |
Commute Time in Glasgow
The most frequently occuring commute durations in Glasgow are 25 to 29 minutes (97 commuters, 18.9%), 30 to 34 minutes (87 commuters, 16.9%), and 15 to 19 minutes (78 commuters, 15.2%).
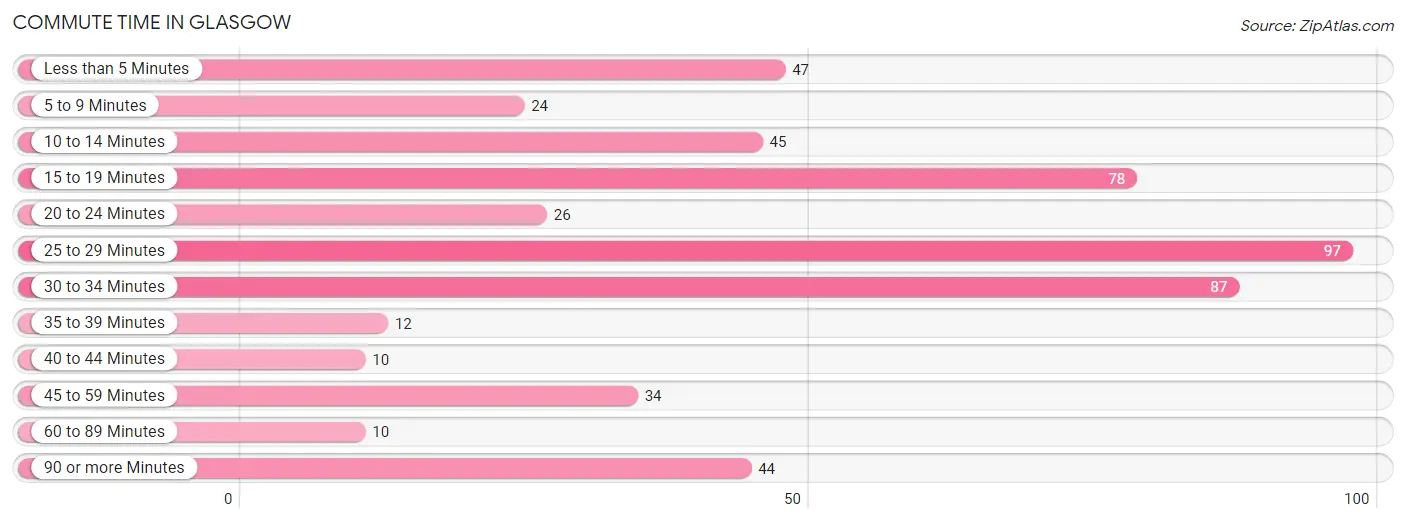
| Commute Time | # Commuters | % Commuters |
| Less than 5 Minutes | 47 | 9.1% |
| 5 to 9 Minutes | 24 | 4.7% |
| 10 to 14 Minutes | 45 | 8.7% |
| 15 to 19 Minutes | 78 | 15.2% |
| 20 to 24 Minutes | 26 | 5.1% |
| 25 to 29 Minutes | 97 | 18.9% |
| 30 to 34 Minutes | 87 | 16.9% |
| 35 to 39 Minutes | 12 | 2.3% |
| 40 to 44 Minutes | 10 | 1.9% |
| 45 to 59 Minutes | 34 | 6.6% |
| 60 to 89 Minutes | 10 | 1.9% |
| 90 or more Minutes | 44 | 8.6% |
Commute Time by Sex in Glasgow
The most common commute times in Glasgow are 25 to 29 minutes (52 commuters, 23.8%) for males and 30 to 34 minutes (64 commuters, 21.6%) for females.
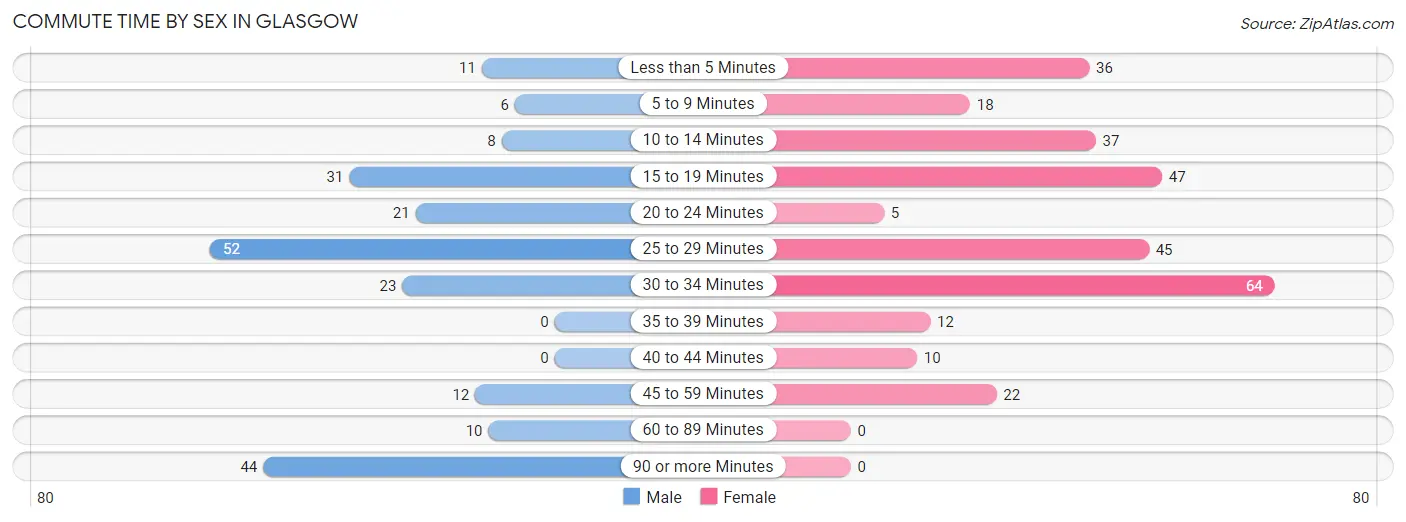
| Commute Time | Male | Female |
| Less than 5 Minutes | 11 (5.1%) | 36 (12.2%) |
| 5 to 9 Minutes | 6 (2.8%) | 18 (6.1%) |
| 10 to 14 Minutes | 8 (3.7%) | 37 (12.5%) |
| 15 to 19 Minutes | 31 (14.2%) | 47 (15.9%) |
| 20 to 24 Minutes | 21 (9.6%) | 5 (1.7%) |
| 25 to 29 Minutes | 52 (23.8%) | 45 (15.2%) |
| 30 to 34 Minutes | 23 (10.5%) | 64 (21.6%) |
| 35 to 39 Minutes | 0 (0.0%) | 12 (4.1%) |
| 40 to 44 Minutes | 0 (0.0%) | 10 (3.4%) |
| 45 to 59 Minutes | 12 (5.5%) | 22 (7.4%) |
| 60 to 89 Minutes | 10 (4.6%) | 0 (0.0%) |
| 90 or more Minutes | 44 (20.2%) | 0 (0.0%) |
Time of Departure to Work by Sex in Glasgow
The most frequent times of departure to work in Glasgow are 6:30 AM to 6:59 AM (60, 27.5%) for males and 6:30 AM to 6:59 AM (61, 20.6%) for females.
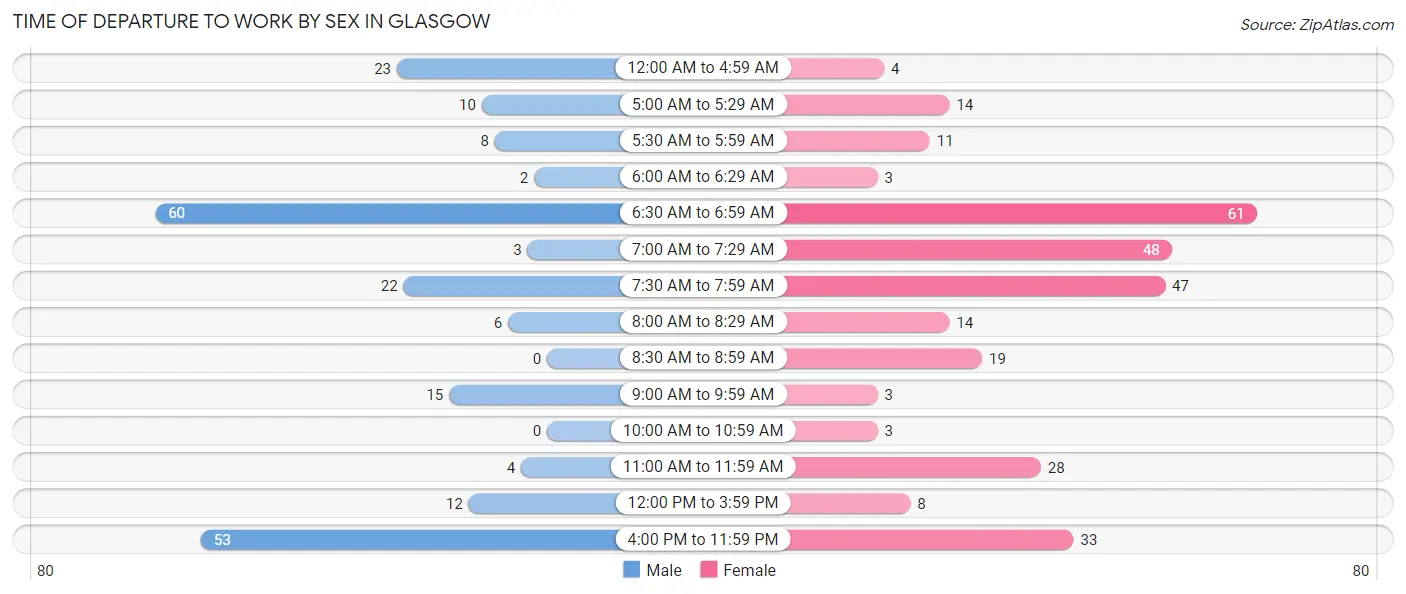
| Time of Departure | Male | Female |
| 12:00 AM to 4:59 AM | 23 (10.5%) | 4 (1.3%) |
| 5:00 AM to 5:29 AM | 10 (4.6%) | 14 (4.7%) |
| 5:30 AM to 5:59 AM | 8 (3.7%) | 11 (3.7%) |
| 6:00 AM to 6:29 AM | 2 (0.9%) | 3 (1.0%) |
| 6:30 AM to 6:59 AM | 60 (27.5%) | 61 (20.6%) |
| 7:00 AM to 7:29 AM | 3 (1.4%) | 48 (16.2%) |
| 7:30 AM to 7:59 AM | 22 (10.1%) | 47 (15.9%) |
| 8:00 AM to 8:29 AM | 6 (2.8%) | 14 (4.7%) |
| 8:30 AM to 8:59 AM | 0 (0.0%) | 19 (6.4%) |
| 9:00 AM to 9:59 AM | 15 (6.9%) | 3 (1.0%) |
| 10:00 AM to 10:59 AM | 0 (0.0%) | 3 (1.0%) |
| 11:00 AM to 11:59 AM | 4 (1.8%) | 28 (9.5%) |
| 12:00 PM to 3:59 PM | 12 (5.5%) | 8 (2.7%) |
| 4:00 PM to 11:59 PM | 53 (24.3%) | 33 (11.2%) |
| Total | 218 (100.0%) | 296 (100.0%) |
Housing Occupancy in Glasgow
Occupancy by Ownership in Glasgow
Of the total 514 dwellings in Glasgow, owner-occupied units account for 377 (73.4%), while renter-occupied units make up 137 (26.7%).
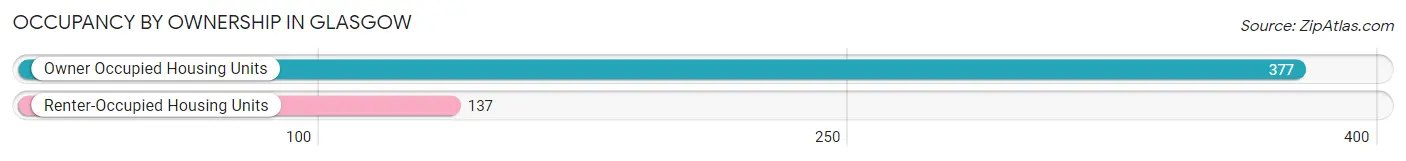
| Occupancy | # Housing Units | % Housing Units |
| Owner Occupied Housing Units | 377 | 73.4% |
| Renter-Occupied Housing Units | 137 | 26.7% |
| Total Occupied Housing Units | 514 | 100.0% |
Occupancy by Household Size in Glasgow
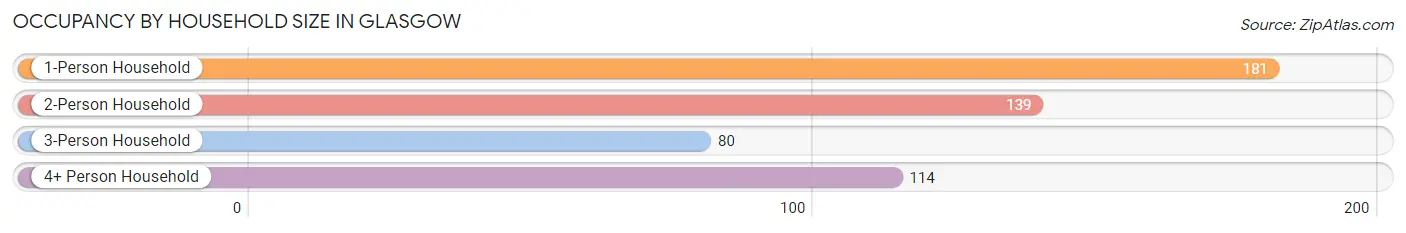
| Household Size | # Housing Units | % Housing Units |
| 1-Person Household | 181 | 35.2% |
| 2-Person Household | 139 | 27.0% |
| 3-Person Household | 80 | 15.6% |
| 4+ Person Household | 114 | 22.2% |
| Total Housing Units | 514 | 100.0% |
Occupancy by Ownership by Household Size in Glasgow
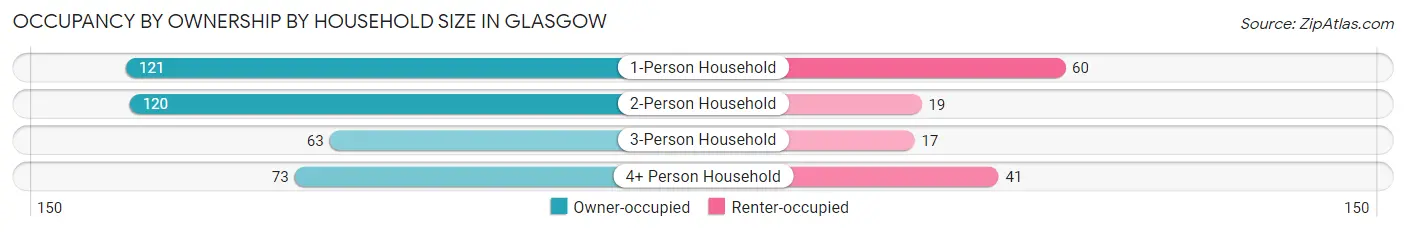
| Household Size | Owner-occupied | Renter-occupied |
| 1-Person Household | 121 (66.8%) | 60 (33.2%) |
| 2-Person Household | 120 (86.3%) | 19 (13.7%) |
| 3-Person Household | 63 (78.7%) | 17 (21.2%) |
| 4+ Person Household | 73 (64.0%) | 41 (36.0%) |
| Total Housing Units | 377 (73.4%) | 137 (26.7%) |
Occupancy by Educational Attainment in Glasgow
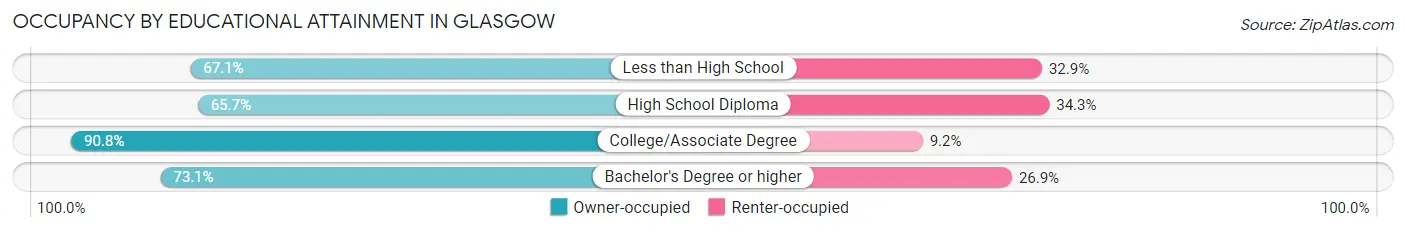
| Household Size | Owner-occupied | Renter-occupied |
| Less than High School | 49 (67.1%) | 24 (32.9%) |
| High School Diploma | 153 (65.7%) | 80 (34.3%) |
| College/Associate Degree | 118 (90.8%) | 12 (9.2%) |
| Bachelor's Degree or higher | 57 (73.1%) | 21 (26.9%) |
Occupancy by Age of Householder in Glasgow
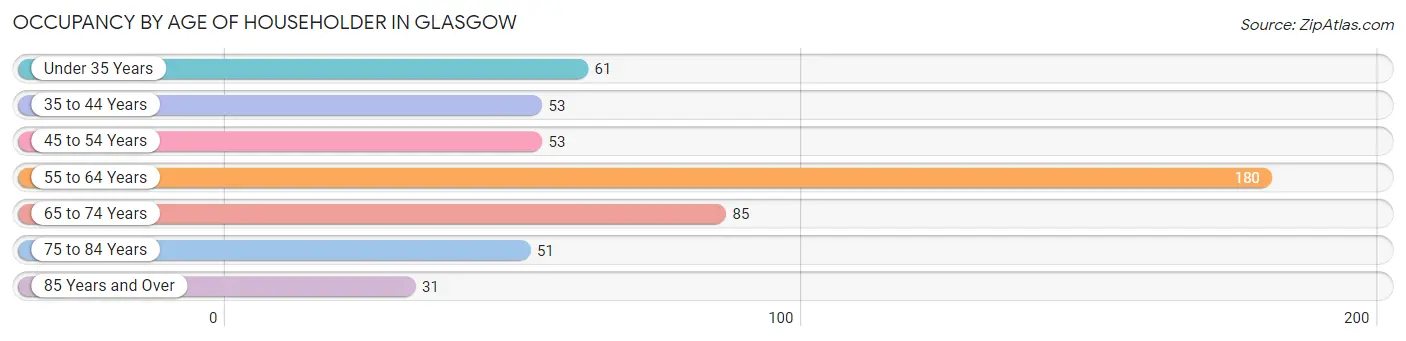
| Age Bracket | # Households | % Households |
| Under 35 Years | 61 | 11.9% |
| 35 to 44 Years | 53 | 10.3% |
| 45 to 54 Years | 53 | 10.3% |
| 55 to 64 Years | 180 | 35.0% |
| 65 to 74 Years | 85 | 16.5% |
| 75 to 84 Years | 51 | 9.9% |
| 85 Years and Over | 31 | 6.0% |
| Total | 514 | 100.0% |
Housing Finances in Glasgow
Median Income by Occupancy in Glasgow
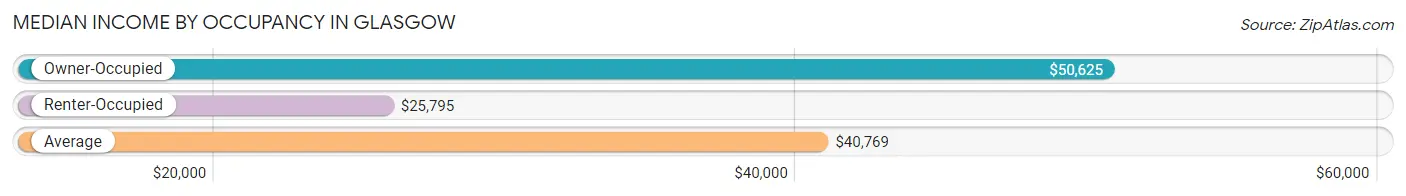
| Occupancy Type | # Households | Median Income |
| Owner-Occupied | 377 (73.4%) | $50,625 |
| Renter-Occupied | 137 (26.7%) | $25,795 |
| Average | 514 (100.0%) | $40,769 |
Occupancy by Householder Income Bracket in Glasgow
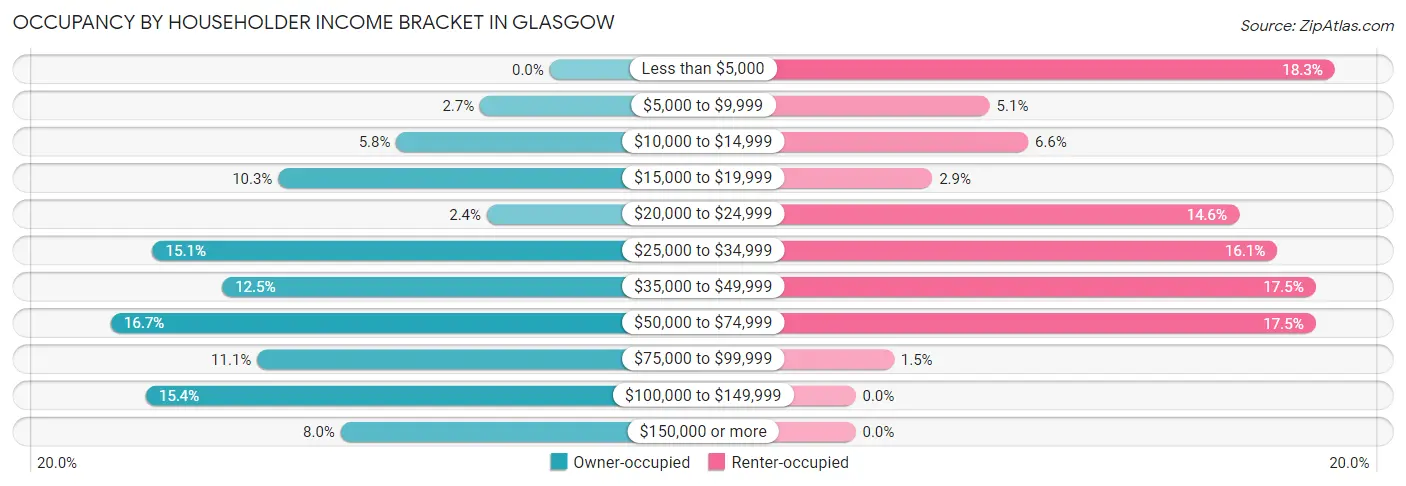
| Income Bracket | Owner-occupied | Renter-occupied |
| Less than $5,000 | 0 (0.0%) | 25 (18.2%) |
| $5,000 to $9,999 | 10 (2.6%) | 7 (5.1%) |
| $10,000 to $14,999 | 22 (5.8%) | 9 (6.6%) |
| $15,000 to $19,999 | 39 (10.3%) | 4 (2.9%) |
| $20,000 to $24,999 | 9 (2.4%) | 20 (14.6%) |
| $25,000 to $34,999 | 57 (15.1%) | 22 (16.1%) |
| $35,000 to $49,999 | 47 (12.5%) | 24 (17.5%) |
| $50,000 to $74,999 | 63 (16.7%) | 24 (17.5%) |
| $75,000 to $99,999 | 42 (11.1%) | 2 (1.5%) |
| $100,000 to $149,999 | 58 (15.4%) | 0 (0.0%) |
| $150,000 or more | 30 (8.0%) | 0 (0.0%) |
| Total | 377 (100.0%) | 137 (100.0%) |
Monthly Housing Cost Tiers in Glasgow
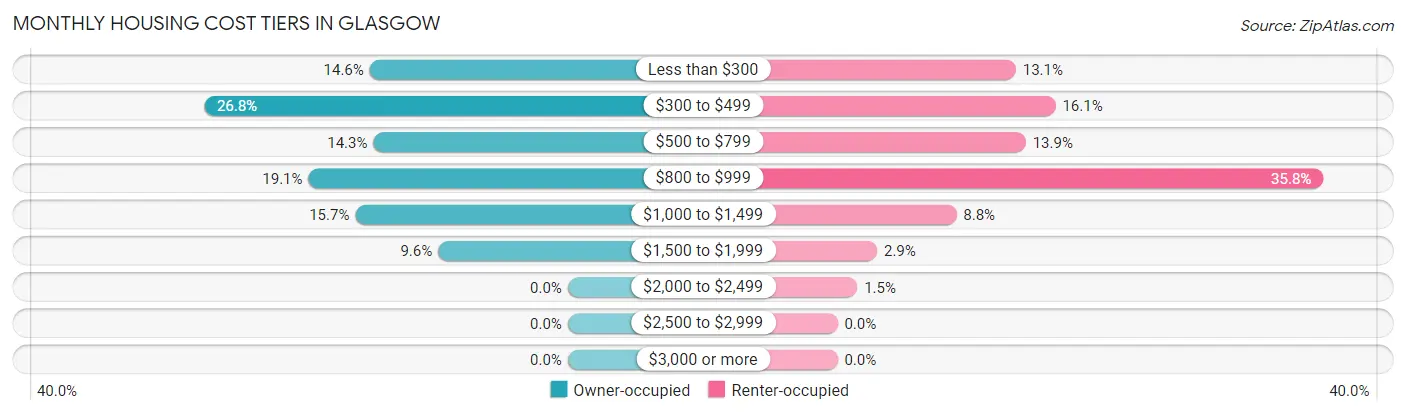
| Monthly Cost | Owner-occupied | Renter-occupied |
| Less than $300 | 55 (14.6%) | 18 (13.1%) |
| $300 to $499 | 101 (26.8%) | 22 (16.1%) |
| $500 to $799 | 54 (14.3%) | 19 (13.9%) |
| $800 to $999 | 72 (19.1%) | 49 (35.8%) |
| $1,000 to $1,499 | 59 (15.7%) | 12 (8.8%) |
| $1,500 to $1,999 | 36 (9.6%) | 4 (2.9%) |
| $2,000 to $2,499 | 0 (0.0%) | 2 (1.5%) |
| $2,500 to $2,999 | 0 (0.0%) | 0 (0.0%) |
| $3,000 or more | 0 (0.0%) | 0 (0.0%) |
| Total | 377 (100.0%) | 137 (100.0%) |
Physical Housing Characteristics in Glasgow
Housing Structures in Glasgow
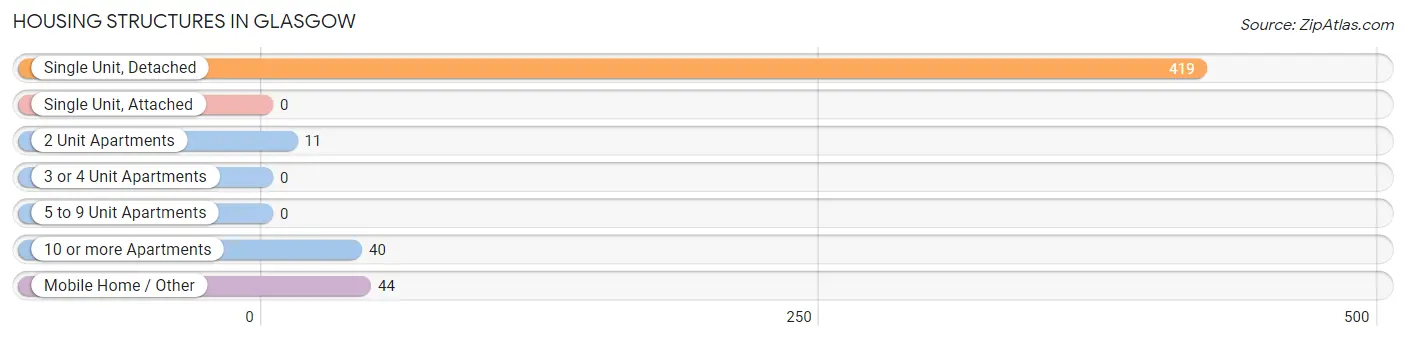
| Structure Type | # Housing Units | % Housing Units |
| Single Unit, Detached | 419 | 81.5% |
| Single Unit, Attached | 0 | 0.0% |
| 2 Unit Apartments | 11 | 2.1% |
| 3 or 4 Unit Apartments | 0 | 0.0% |
| 5 to 9 Unit Apartments | 0 | 0.0% |
| 10 or more Apartments | 40 | 7.8% |
| Mobile Home / Other | 44 | 8.6% |
| Total | 514 | 100.0% |
Housing Structures by Occupancy in Glasgow
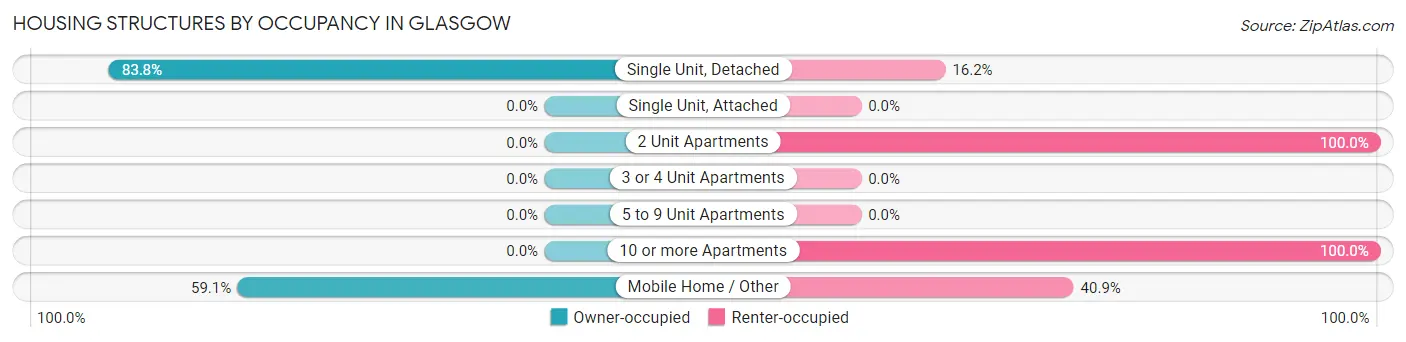
| Structure Type | Owner-occupied | Renter-occupied |
| Single Unit, Detached | 351 (83.8%) | 68 (16.2%) |
| Single Unit, Attached | 0 (0.0%) | 0 (0.0%) |
| 2 Unit Apartments | 0 (0.0%) | 11 (100.0%) |
| 3 or 4 Unit Apartments | 0 (0.0%) | 0 (0.0%) |
| 5 to 9 Unit Apartments | 0 (0.0%) | 0 (0.0%) |
| 10 or more Apartments | 0 (0.0%) | 40 (100.0%) |
| Mobile Home / Other | 26 (59.1%) | 18 (40.9%) |
| Total | 377 (73.4%) | 137 (26.7%) |
Housing Structures by Number of Rooms in Glasgow
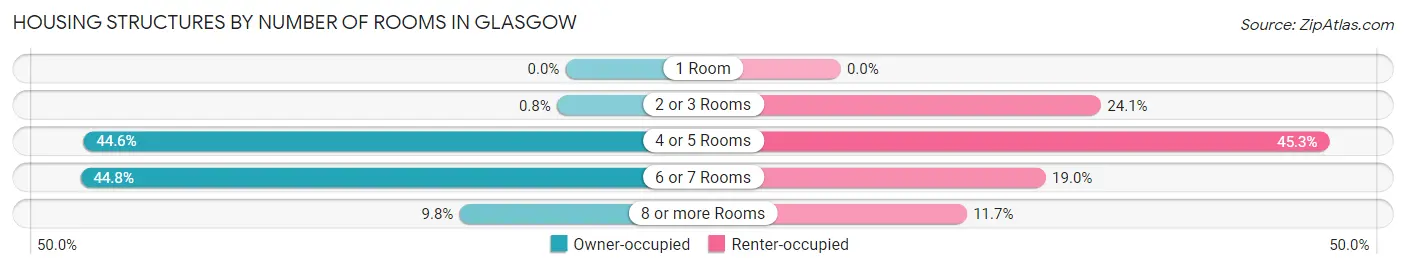
| Number of Rooms | Owner-occupied | Renter-occupied |
| 1 Room | 0 (0.0%) | 0 (0.0%) |
| 2 or 3 Rooms | 3 (0.8%) | 33 (24.1%) |
| 4 or 5 Rooms | 168 (44.6%) | 62 (45.3%) |
| 6 or 7 Rooms | 169 (44.8%) | 26 (19.0%) |
| 8 or more Rooms | 37 (9.8%) | 16 (11.7%) |
| Total | 377 (100.0%) | 137 (100.0%) |
Housing Structure by Heating Type in Glasgow
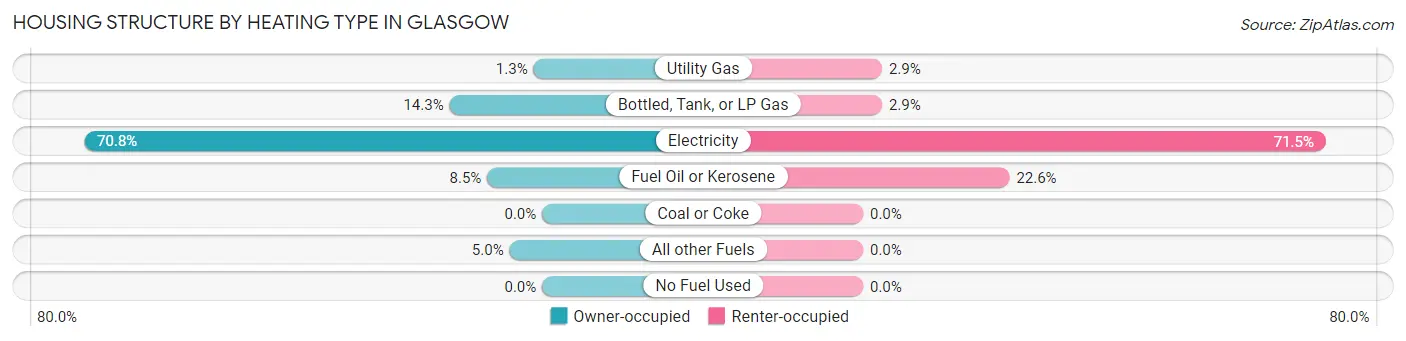
| Heating Type | Owner-occupied | Renter-occupied |
| Utility Gas | 5 (1.3%) | 4 (2.9%) |
| Bottled, Tank, or LP Gas | 54 (14.3%) | 4 (2.9%) |
| Electricity | 267 (70.8%) | 98 (71.5%) |
| Fuel Oil or Kerosene | 32 (8.5%) | 31 (22.6%) |
| Coal or Coke | 0 (0.0%) | 0 (0.0%) |
| All other Fuels | 19 (5.0%) | 0 (0.0%) |
| No Fuel Used | 0 (0.0%) | 0 (0.0%) |
| Total | 377 (100.0%) | 137 (100.0%) |
Household Vehicle Usage in Glasgow
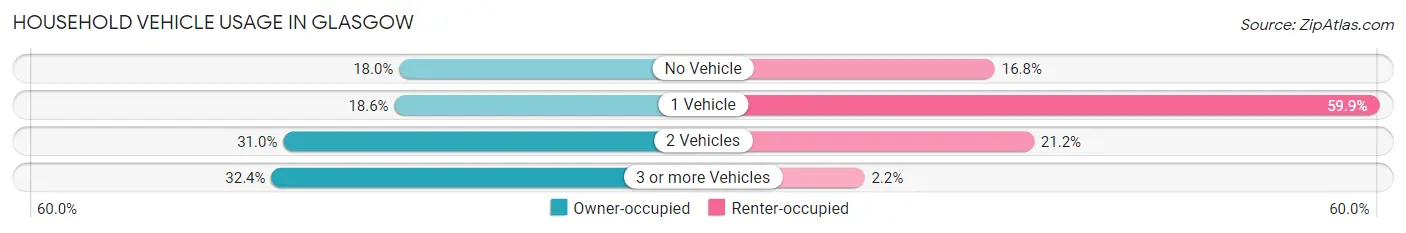
| Vehicles per Household | Owner-occupied | Renter-occupied |
| No Vehicle | 68 (18.0%) | 23 (16.8%) |
| 1 Vehicle | 70 (18.6%) | 82 (59.9%) |
| 2 Vehicles | 117 (31.0%) | 29 (21.2%) |
| 3 or more Vehicles | 122 (32.4%) | 3 (2.2%) |
| Total | 377 (100.0%) | 137 (100.0%) |
Real Estate & Mortgages in Glasgow
Real Estate and Mortgage Overview in Glasgow
| Characteristic | Without Mortgage | With Mortgage |
| Housing Units | 138 | 239 |
| Median Property Value | $96,700 | $156,300 |
| Median Household Income | - | - |
| Monthly Housing Costs | $392 | $0 |
| Real Estate Taxes | $796 | $5 |
Property Value by Mortgage Status in Glasgow
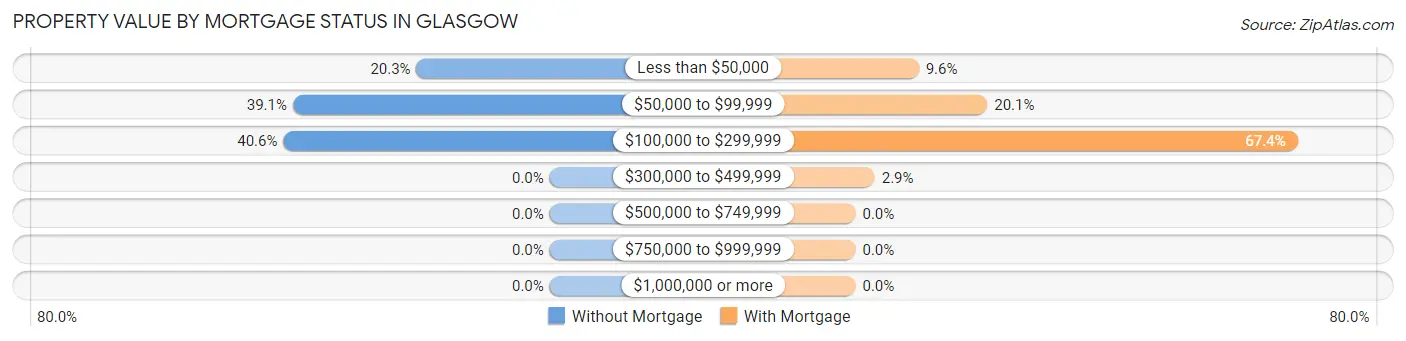
| Property Value | Without Mortgage | With Mortgage |
| Less than $50,000 | 28 (20.3%) | 23 (9.6%) |
| $50,000 to $99,999 | 54 (39.1%) | 48 (20.1%) |
| $100,000 to $299,999 | 56 (40.6%) | 161 (67.4%) |
| $300,000 to $499,999 | 0 (0.0%) | 7 (2.9%) |
| $500,000 to $749,999 | 0 (0.0%) | 0 (0.0%) |
| $750,000 to $999,999 | 0 (0.0%) | 0 (0.0%) |
| $1,000,000 or more | 0 (0.0%) | 0 (0.0%) |
| Total | 138 (100.0%) | 239 (100.0%) |
Household Income by Mortgage Status in Glasgow
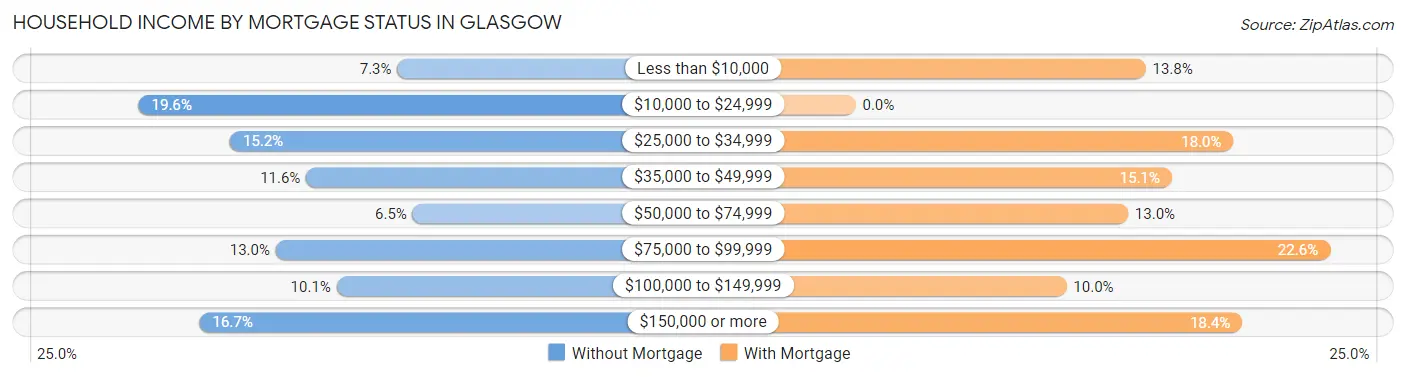
| Household Income | Without Mortgage | With Mortgage |
| Less than $10,000 | 10 (7.2%) | 33 (13.8%) |
| $10,000 to $24,999 | 27 (19.6%) | 0 (0.0%) |
| $25,000 to $34,999 | 21 (15.2%) | 43 (18.0%) |
| $35,000 to $49,999 | 16 (11.6%) | 36 (15.1%) |
| $50,000 to $74,999 | 9 (6.5%) | 31 (13.0%) |
| $75,000 to $99,999 | 18 (13.0%) | 54 (22.6%) |
| $100,000 to $149,999 | 14 (10.1%) | 24 (10.0%) |
| $150,000 or more | 23 (16.7%) | 44 (18.4%) |
| Total | 138 (100.0%) | 239 (100.0%) |
Property Value to Household Income Ratio in Glasgow
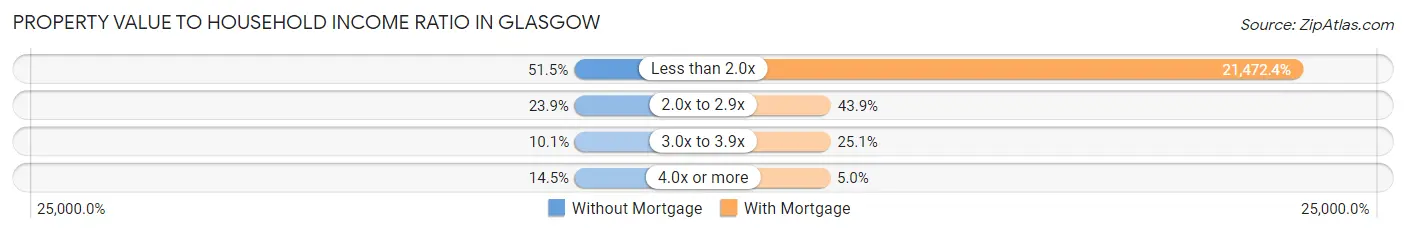
| Value-to-Income Ratio | Without Mortgage | With Mortgage |
| Less than 2.0x | 71 (51.4%) | 51,319 (21,472.4%) |
| 2.0x to 2.9x | 33 (23.9%) | 105 (43.9%) |
| 3.0x to 3.9x | 14 (10.1%) | 60 (25.1%) |
| 4.0x or more | 20 (14.5%) | 12 (5.0%) |
| Total | 138 (100.0%) | 239 (100.0%) |
Real Estate Taxes by Mortgage Status in Glasgow
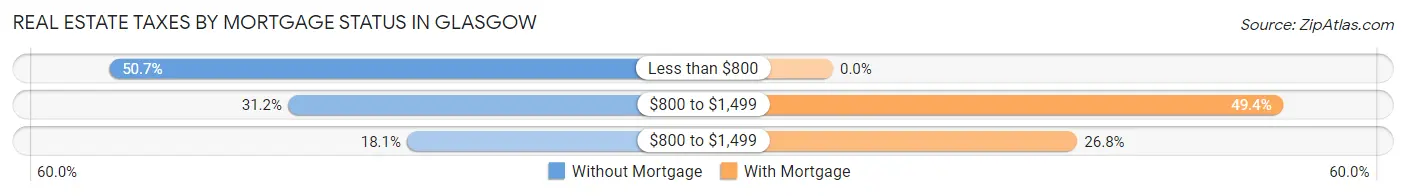
| Property Taxes | Without Mortgage | With Mortgage |
| Less than $800 | 70 (50.7%) | 0 (0.0%) |
| $800 to $1,499 | 43 (31.2%) | 118 (49.4%) |
| $800 to $1,499 | 25 (18.1%) | 64 (26.8%) |
| Total | 138 (100.0%) | 239 (100.0%) |
Health & Disability in Glasgow
Health Insurance Coverage by Age in Glasgow
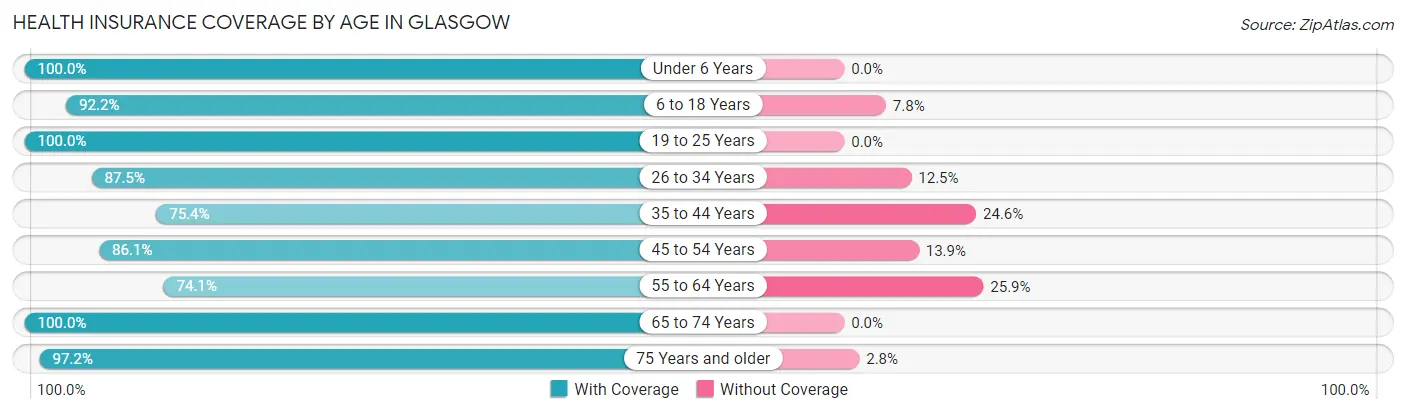
| Age Bracket | With Coverage | Without Coverage |
| Under 6 Years | 108 (100.0%) | 0 (0.0%) |
| 6 to 18 Years | 202 (92.2%) | 17 (7.8%) |
| 19 to 25 Years | 106 (100.0%) | 0 (0.0%) |
| 26 to 34 Years | 126 (87.5%) | 18 (12.5%) |
| 35 to 44 Years | 89 (75.4%) | 29 (24.6%) |
| 45 to 54 Years | 93 (86.1%) | 15 (13.9%) |
| 55 to 64 Years | 220 (74.1%) | 77 (25.9%) |
| 65 to 74 Years | 133 (100.0%) | 0 (0.0%) |
| 75 Years and older | 139 (97.2%) | 4 (2.8%) |
| Total | 1,216 (88.4%) | 160 (11.6%) |
Health Insurance Coverage by Citizenship Status in Glasgow
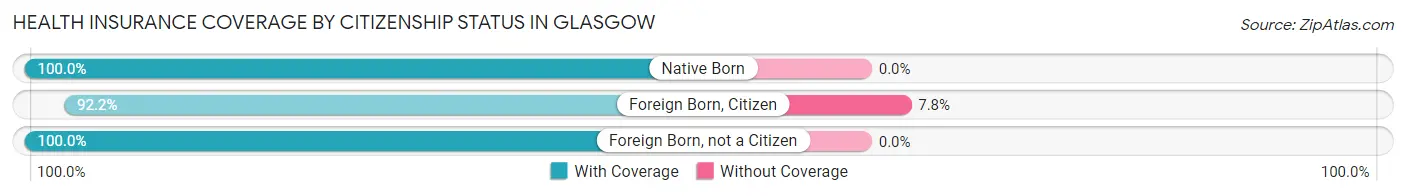
| Citizenship Status | With Coverage | Without Coverage |
| Native Born | 108 (100.0%) | 0 (0.0%) |
| Foreign Born, Citizen | 202 (92.2%) | 17 (7.8%) |
| Foreign Born, not a Citizen | 106 (100.0%) | 0 (0.0%) |
Health Insurance Coverage by Household Income in Glasgow
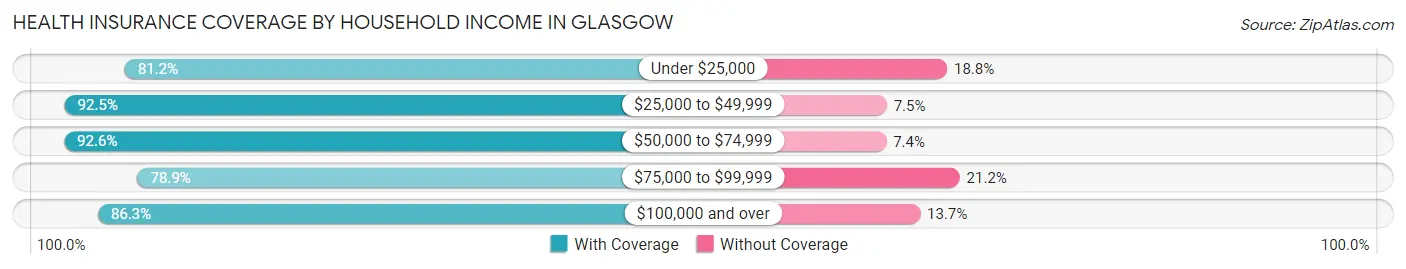
| Household Income | With Coverage | Without Coverage |
| Under $25,000 | 173 (81.2%) | 40 (18.8%) |
| $25,000 to $49,999 | 371 (92.5%) | 30 (7.5%) |
| $50,000 to $74,999 | 326 (92.6%) | 26 (7.4%) |
| $75,000 to $99,999 | 82 (78.8%) | 22 (21.1%) |
| $100,000 and over | 264 (86.3%) | 42 (13.7%) |
Public vs Private Health Insurance Coverage by Age in Glasgow
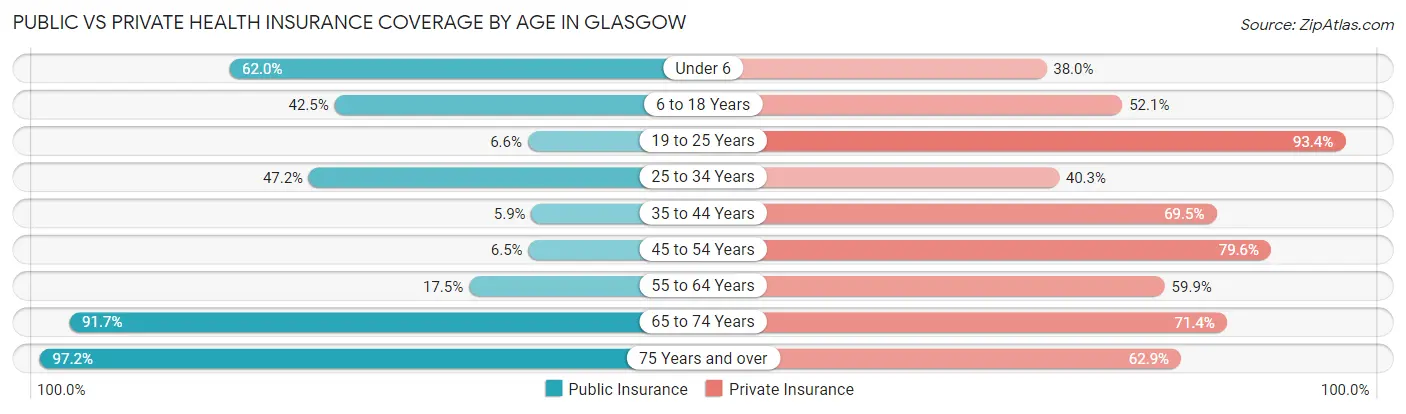
| Age Bracket | Public Insurance | Private Insurance |
| Under 6 | 67 (62.0%) | 41 (38.0%) |
| 6 to 18 Years | 93 (42.5%) | 114 (52.0%) |
| 19 to 25 Years | 7 (6.6%) | 99 (93.4%) |
| 25 to 34 Years | 68 (47.2%) | 58 (40.3%) |
| 35 to 44 Years | 7 (5.9%) | 82 (69.5%) |
| 45 to 54 Years | 7 (6.5%) | 86 (79.6%) |
| 55 to 64 Years | 52 (17.5%) | 178 (59.9%) |
| 65 to 74 Years | 122 (91.7%) | 95 (71.4%) |
| 75 Years and over | 139 (97.2%) | 90 (62.9%) |
| Total | 562 (40.8%) | 843 (61.3%) |
Disability Status by Sex by Age in Glasgow
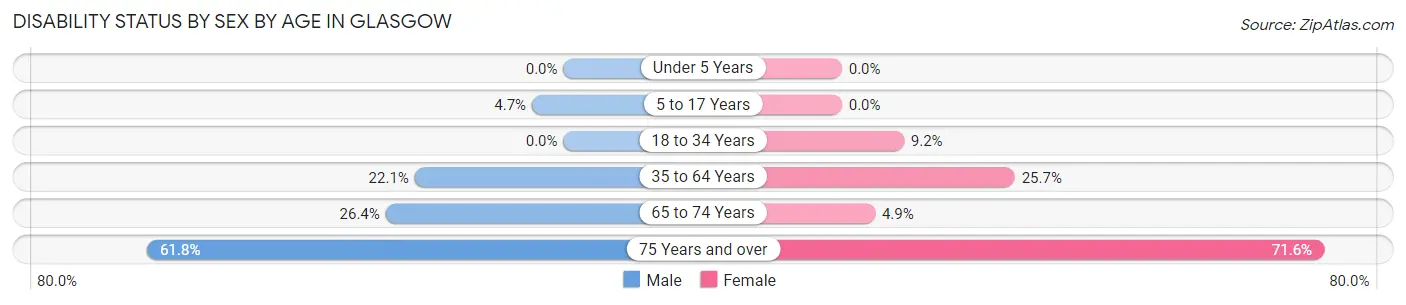
| Age Bracket | Male | Female |
| Under 5 Years | 0 (0.0%) | 0 (0.0%) |
| 5 to 17 Years | 5 (4.7%) | 0 (0.0%) |
| 18 to 34 Years | 0 (0.0%) | 14 (9.2%) |
| 35 to 64 Years | 51 (22.1%) | 75 (25.7%) |
| 65 to 74 Years | 19 (26.4%) | 3 (4.9%) |
| 75 Years and over | 34 (61.8%) | 63 (71.6%) |
Disability Class by Sex by Age in Glasgow
Disability Class: Hearing Difficulty
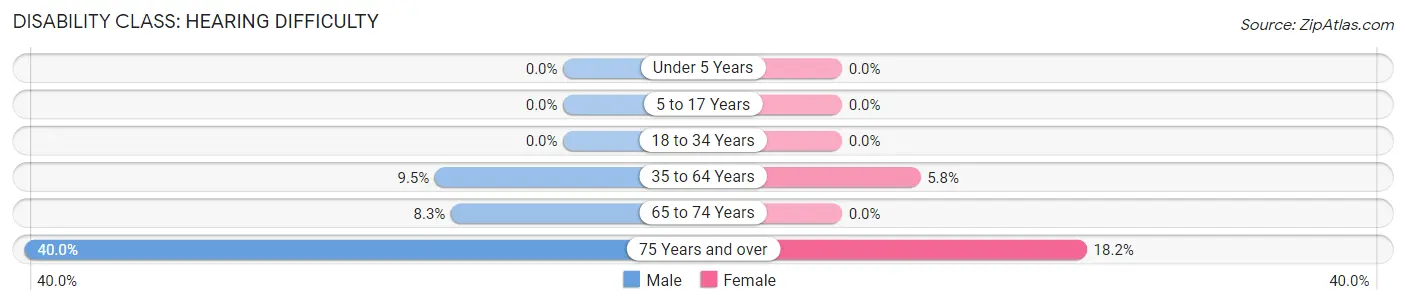
| Age Bracket | Male | Female |
| Under 5 Years | 0 (0.0%) | 0 (0.0%) |
| 5 to 17 Years | 0 (0.0%) | 0 (0.0%) |
| 18 to 34 Years | 0 (0.0%) | 0 (0.0%) |
| 35 to 64 Years | 22 (9.5%) | 17 (5.8%) |
| 65 to 74 Years | 6 (8.3%) | 0 (0.0%) |
| 75 Years and over | 22 (40.0%) | 16 (18.2%) |
Disability Class: Vision Difficulty
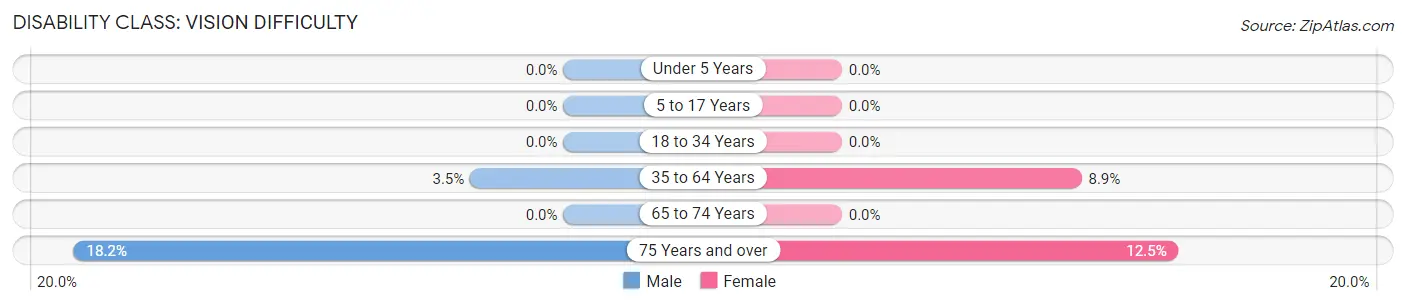
| Age Bracket | Male | Female |
| Under 5 Years | 0 (0.0%) | 0 (0.0%) |
| 5 to 17 Years | 0 (0.0%) | 0 (0.0%) |
| 18 to 34 Years | 0 (0.0%) | 0 (0.0%) |
| 35 to 64 Years | 8 (3.5%) | 26 (8.9%) |
| 65 to 74 Years | 0 (0.0%) | 0 (0.0%) |
| 75 Years and over | 10 (18.2%) | 11 (12.5%) |
Disability Class: Cognitive Difficulty
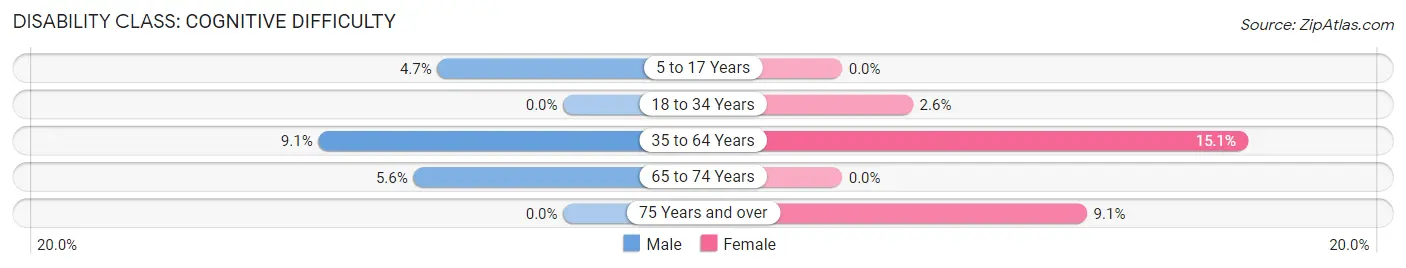
| Age Bracket | Male | Female |
| 5 to 17 Years | 5 (4.7%) | 0 (0.0%) |
| 18 to 34 Years | 0 (0.0%) | 4 (2.6%) |
| 35 to 64 Years | 21 (9.1%) | 44 (15.1%) |
| 65 to 74 Years | 4 (5.6%) | 0 (0.0%) |
| 75 Years and over | 0 (0.0%) | 8 (9.1%) |
Disability Class: Ambulatory Difficulty
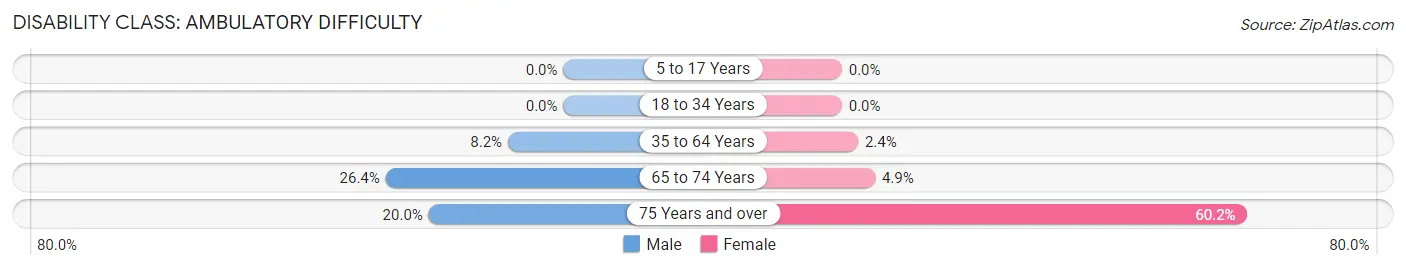
| Age Bracket | Male | Female |
| 5 to 17 Years | 0 (0.0%) | 0 (0.0%) |
| 18 to 34 Years | 0 (0.0%) | 0 (0.0%) |
| 35 to 64 Years | 19 (8.2%) | 7 (2.4%) |
| 65 to 74 Years | 19 (26.4%) | 3 (4.9%) |
| 75 Years and over | 11 (20.0%) | 53 (60.2%) |
Disability Class: Self-Care Difficulty
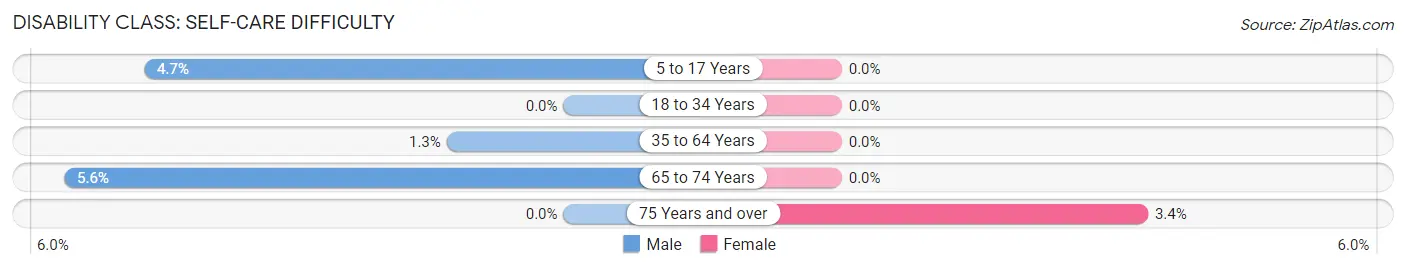
| Age Bracket | Male | Female |
| 5 to 17 Years | 5 (4.7%) | 0 (0.0%) |
| 18 to 34 Years | 0 (0.0%) | 0 (0.0%) |
| 35 to 64 Years | 3 (1.3%) | 0 (0.0%) |
| 65 to 74 Years | 4 (5.6%) | 0 (0.0%) |
| 75 Years and over | 0 (0.0%) | 3 (3.4%) |
Technology Access in Glasgow
Computing Device Access in Glasgow
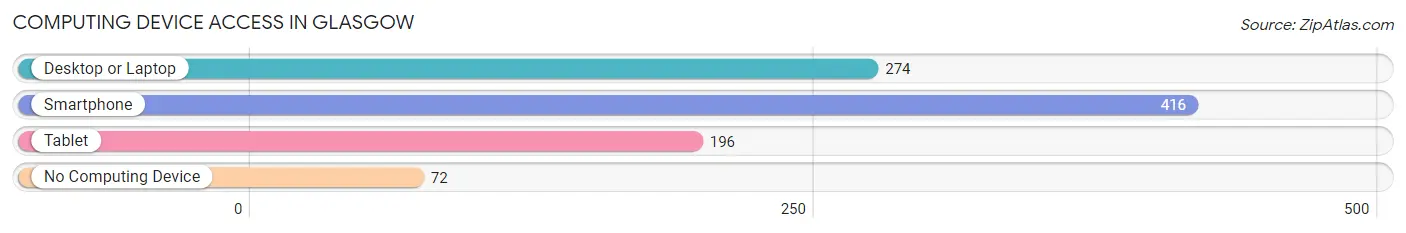
| Device Type | # Households | % Households |
| Desktop or Laptop | 274 | 53.3% |
| Smartphone | 416 | 80.9% |
| Tablet | 196 | 38.1% |
| No Computing Device | 72 | 14.0% |
| Total | 514 | 100.0% |
Internet Access in Glasgow
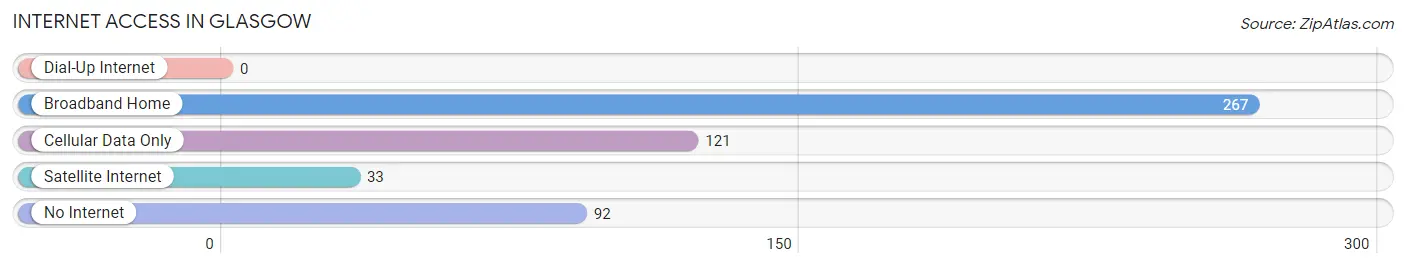
| Internet Type | # Households | % Households |
| Dial-Up Internet | 0 | 0.0% |
| Broadband Home | 267 | 51.9% |
| Cellular Data Only | 121 | 23.5% |
| Satellite Internet | 33 | 6.4% |
| No Internet | 92 | 17.9% |
| Total | 514 | 100.0% |
Glasgow Summary
Glasgow, Virginia is a small town located in Rockbridge County, Virginia. It is situated in the Shenandoah Valley, approximately 20 miles north of Lexington and about 50 miles south of Harrisonburg. The town was founded in 1790 and is named after the city of Glasgow, Scotland. Glasgow is a small, rural community with a population of just over 1,000 people.
Geography
Glasgow is located in the Shenandoah Valley, which is a large valley that runs through the Appalachian Mountains. The valley is known for its rolling hills and lush green pastures. The town is situated on the banks of the Maury River, which is a tributary of the James River. The Maury River is a popular destination for fishing, canoeing, and kayaking. The town is surrounded by the George Washington and Jefferson National Forests, which provide a variety of outdoor activities such as hiking, camping, and hunting.
Economy
The economy of Glasgow is largely based on agriculture and tourism. The town is home to several farms, which produce a variety of crops such as corn, soybeans, and hay. The town is also home to several wineries, which produce a variety of wines. Tourism is also an important part of the local economy, as the town is a popular destination for outdoor activities such as fishing, canoeing, and hiking.
Demographics
As of the 2010 census, the population of Glasgow was 1,072. The racial makeup of the town was 95.3% White, 2.2% African American, 0.3% Native American, 0.2% Asian, 0.1% Pacific Islander, 0.7% from other races, and 1.3% from two or more races. The median household income was $37,500 and the median family income was $45,000. The per capita income was $19,000.
Conclusion
Glasgow, Virginia is a small, rural town located in the Shenandoah Valley. The town is known for its rolling hills and lush green pastures, and is a popular destination for outdoor activities such as fishing, canoeing, and hiking. The economy of Glasgow is largely based on agriculture and tourism, and the town has a population of just over 1,000 people. The racial makeup of the town is predominantly White, with a small percentage of African American, Native American, Asian, and Pacific Islander residents. The median household income is $37,500 and the median family income is $45,000.
Common Questions
What is Per Capita Income in Glasgow?
Per Capita income in Glasgow is $23,471.
What is the Median Family Income in Glasgow?
Median Family Income in Glasgow is $54,375.
What is the Median Household income in Glasgow?
Median Household Income in Glasgow is $40,769.
What is Income or Wage Gap in Glasgow?
Income or Wage Gap in Glasgow is 29.0%.
Women in Glasgow earn 71.0 cents for every dollar earned by a man.
What is Inequality or Gini Index in Glasgow?
Inequality or Gini Index in Glasgow is 0.43.
What is the Total Population of Glasgow?
Total Population of Glasgow is 1,376.
What is the Total Male Population of Glasgow?
Total Male Population of Glasgow is 621.
What is the Total Female Population of Glasgow?
Total Female Population of Glasgow is 755.
What is the Ratio of Males per 100 Females in Glasgow?
There are 82.25 Males per 100 Females in Glasgow.
What is the Ratio of Females per 100 Males in Glasgow?
There are 121.58 Females per 100 Males in Glasgow.
What is the Median Population Age in Glasgow?
Median Population Age in Glasgow is 44.6 Years.
What is the Average Family Size in Glasgow
Average Family Size in Glasgow is 3.5 People.
What is the Average Household Size in Glasgow
Average Household Size in Glasgow is 2.7 People.
How Large is the Labor Force in Glasgow?
There are 635 People in the Labor Forcein in Glasgow.
What is the Percentage of People in the Labor Force in Glasgow?
58.3% of People are in the Labor Force in Glasgow.
What is the Unemployment Rate in Glasgow?
Unemployment Rate in Glasgow is 13.2%.