Cedar Bluff, VA Map & Demographics
Cedar Bluff Map
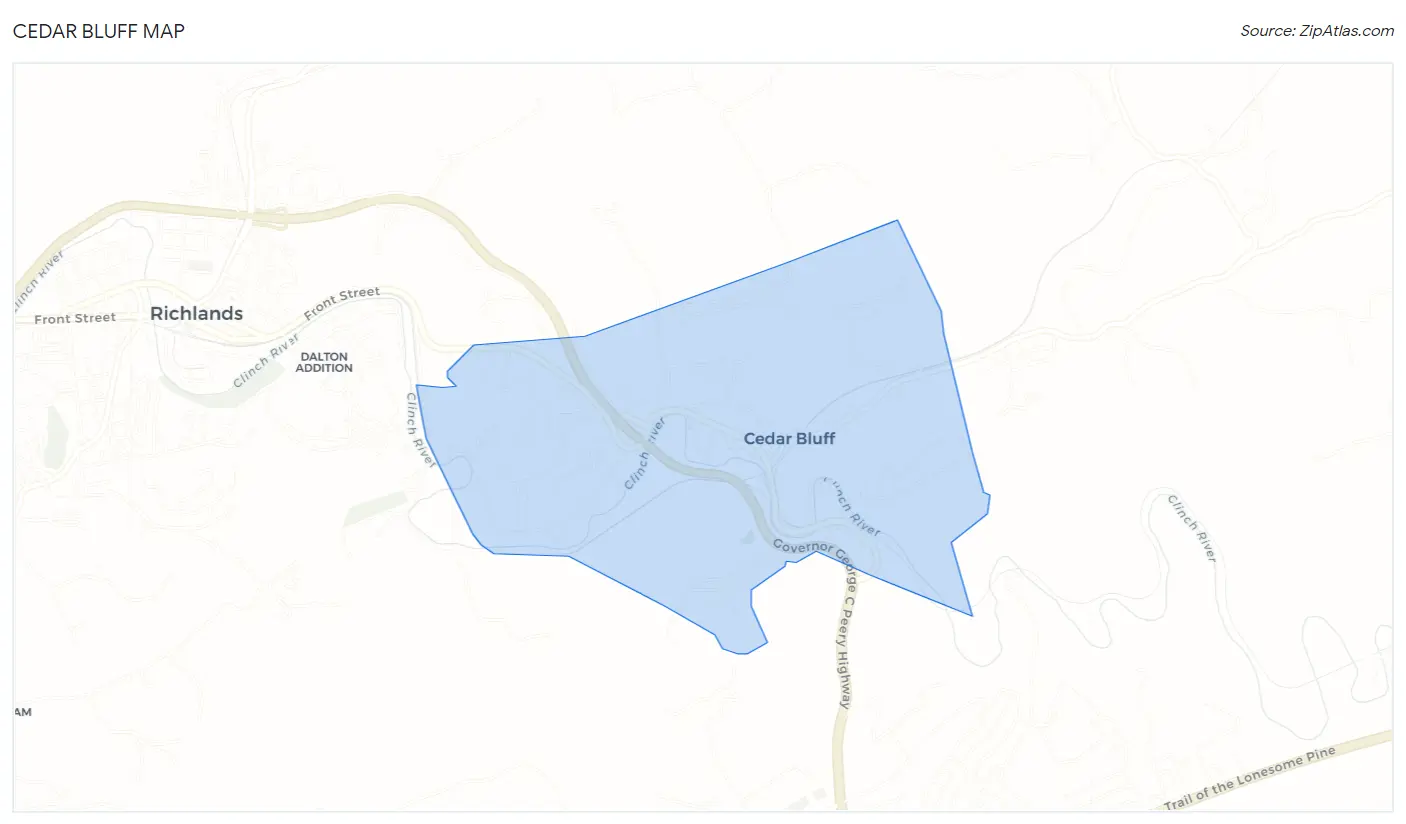
Cedar Bluff Overview
$23,741
PER CAPITA INCOME
$53,370
AVG FAMILY INCOME
$41,094
AVG HOUSEHOLD INCOME
36.7%
WAGE / INCOME GAP [ % ]
63.3¢/ $1
WAGE / INCOME GAP [ $ ]
$12,495
FAMILY INCOME DEFICIT
0.41
INEQUALITY / GINI INDEX
1,210
TOTAL POPULATION
632
MALE POPULATION
578
FEMALE POPULATION
109.34
MALES / 100 FEMALES
91.46
FEMALES / 100 MALES
48.9
MEDIAN AGE
2.8
AVG FAMILY SIZE
2.2
AVG HOUSEHOLD SIZE
447
LABOR FORCE [ PEOPLE ]
43.0%
PERCENT IN LABOR FORCE
5.8%
UNEMPLOYMENT RATE
Cedar Bluff Zip Codes
Cedar Bluff Area Codes
Income in Cedar Bluff
Income Overview in Cedar Bluff
Per Capita Income in Cedar Bluff is $23,741, while median incomes of families and households are $53,370 and $41,094 respectively.
| Characteristic | Number | Measure |
| Per Capita Income | 1,210 | $23,741 |
| Median Family Income | 350 | $53,370 |
| Mean Family Income | 350 | $62,689 |
| Median Household Income | 541 | $41,094 |
| Mean Household Income | 541 | $52,146 |
| Income Deficit | 350 | $12,495 |
| Wage / Income Gap (%) | 1,210 | 36.73% |
| Wage / Income Gap ($) | 1,210 | 63.27¢ per $1 |
| Gini / Inequality Index | 1,210 | 0.41 |
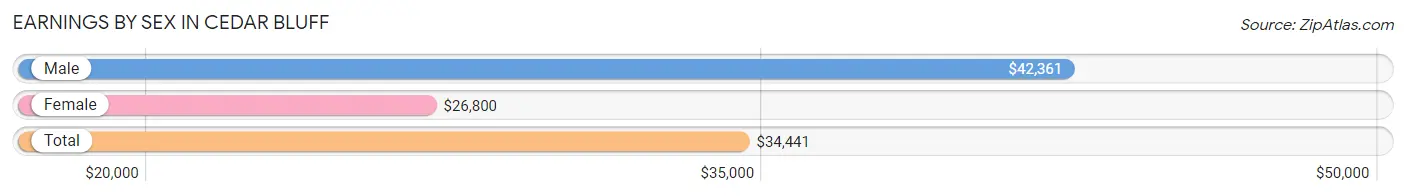
Earnings by Sex in Cedar Bluff
Average Earnings in Cedar Bluff are $34,441, $42,361 for men and $26,800 for women, a difference of 36.7%.
| Sex | Number | Average Earnings |
| Male | 245 (54.1%) | $42,361 |
| Female | 208 (45.9%) | $26,800 |
| Total | 453 (100.0%) | $34,441 |
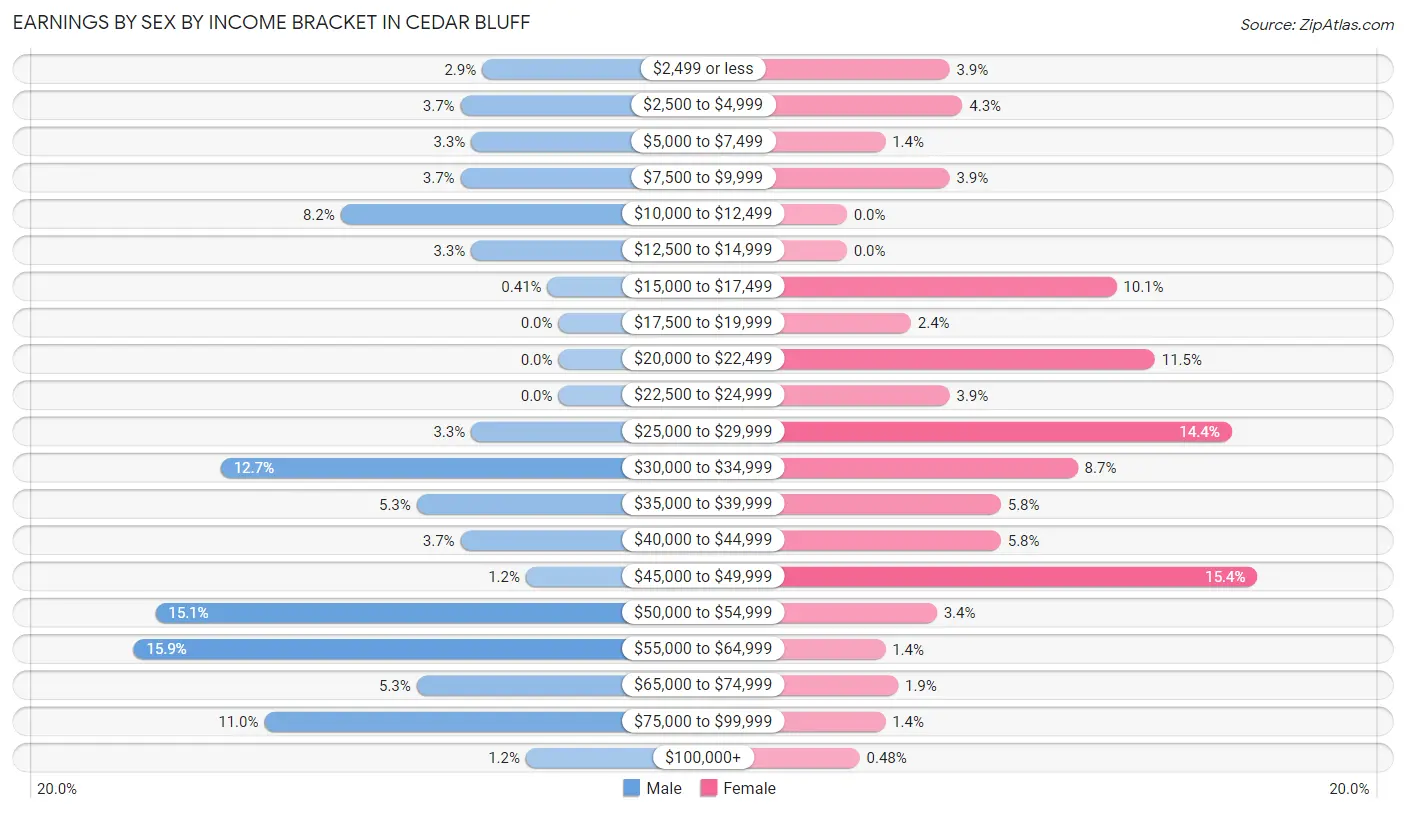
Earnings by Sex by Income Bracket in Cedar Bluff
The most common earnings brackets in Cedar Bluff are $55,000 to $64,999 for men (39 | 15.9%) and $45,000 to $49,999 for women (32 | 15.4%).
| Income | Male | Female |
| $2,499 or less | 7 (2.9%) | 8 (3.8%) |
| $2,500 to $4,999 | 9 (3.7%) | 9 (4.3%) |
| $5,000 to $7,499 | 8 (3.3%) | 3 (1.4%) |
| $7,500 to $9,999 | 9 (3.7%) | 8 (3.8%) |
| $10,000 to $12,499 | 20 (8.2%) | 0 (0.0%) |
| $12,500 to $14,999 | 8 (3.3%) | 0 (0.0%) |
| $15,000 to $17,499 | 1 (0.4%) | 21 (10.1%) |
| $17,500 to $19,999 | 0 (0.0%) | 5 (2.4%) |
| $20,000 to $22,499 | 0 (0.0%) | 24 (11.5%) |
| $22,500 to $24,999 | 0 (0.0%) | 8 (3.8%) |
| $25,000 to $29,999 | 8 (3.3%) | 30 (14.4%) |
| $30,000 to $34,999 | 31 (12.7%) | 18 (8.6%) |
| $35,000 to $39,999 | 13 (5.3%) | 12 (5.8%) |
| $40,000 to $44,999 | 9 (3.7%) | 12 (5.8%) |
| $45,000 to $49,999 | 3 (1.2%) | 32 (15.4%) |
| $50,000 to $54,999 | 37 (15.1%) | 7 (3.4%) |
| $55,000 to $64,999 | 39 (15.9%) | 3 (1.4%) |
| $65,000 to $74,999 | 13 (5.3%) | 4 (1.9%) |
| $75,000 to $99,999 | 27 (11.0%) | 3 (1.4%) |
| $100,000+ | 3 (1.2%) | 1 (0.5%) |
| Total | 245 (100.0%) | 208 (100.0%) |
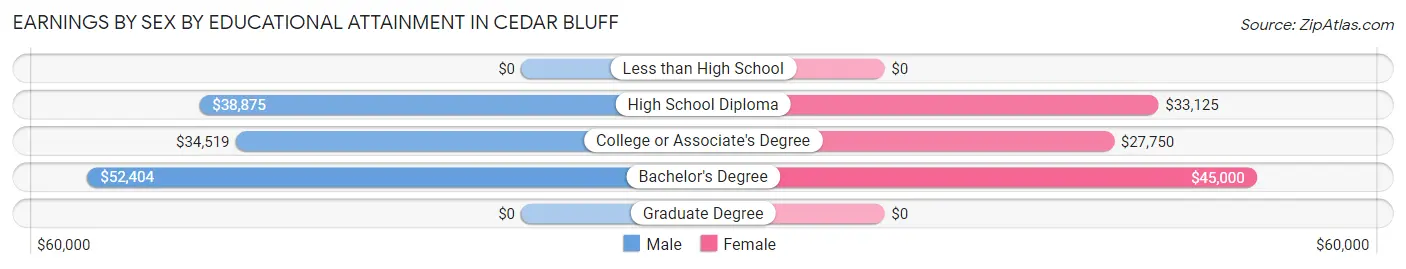
Earnings by Sex by Educational Attainment in Cedar Bluff
Average earnings in Cedar Bluff are $47,917 for men and $28,000 for women, a difference of 41.6%. Men with an educational attainment of bachelor's degree enjoy the highest average annual earnings of $52,404, while those with college or associate's degree education earn the least with $34,519. Women with an educational attainment of bachelor's degree earn the most with the average annual earnings of $45,000, while those with college or associate's degree education have the smallest earnings of $27,750.
| Educational Attainment | Male Income | Female Income |
| Less than High School | - | - |
| High School Diploma | $38,875 | $33,125 |
| College or Associate's Degree | $34,519 | $27,750 |
| Bachelor's Degree | $52,404 | $45,000 |
| Graduate Degree | - | - |
| Total | $47,917 | $28,000 |
Family Income in Cedar Bluff
Family Income Brackets in Cedar Bluff
According to the Cedar Bluff family income data, there are 66 families falling into the $50,000 to $74,999 income range, which is the most common income bracket and makes up 18.9% of all families. Conversely, the $200,000+ income bracket is the least frequent group with only 3 families (0.9%) belonging to this category.
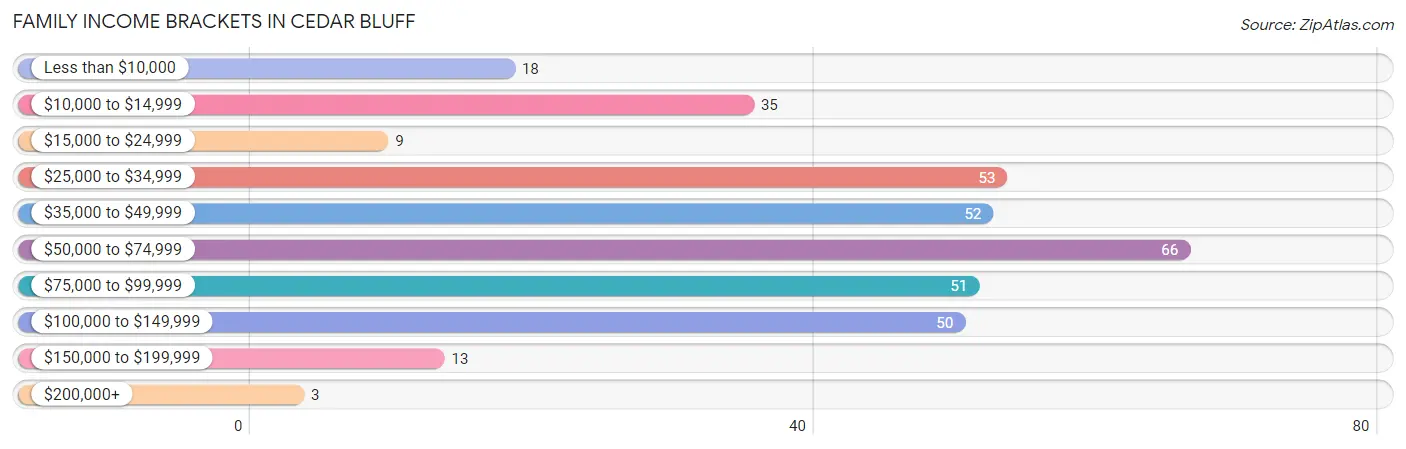
| Income Bracket | # Families | % Families |
| Less than $10,000 | 18 | 5.1% |
| $10,000 to $14,999 | 35 | 10.0% |
| $15,000 to $24,999 | 9 | 2.6% |
| $25,000 to $34,999 | 53 | 15.1% |
| $35,000 to $49,999 | 52 | 14.9% |
| $50,000 to $74,999 | 66 | 18.9% |
| $75,000 to $99,999 | 51 | 14.6% |
| $100,000 to $149,999 | 50 | 14.3% |
| $150,000 to $199,999 | 13 | 3.7% |
| $200,000+ | 3 | 0.9% |
Family Income by Famaliy Size in Cedar Bluff
3-person families (53 | 15.1%) account for the highest median family income in Cedar Bluff with $58,854 per family, while 2-person families (205 | 58.6%) have the highest median income of $27,156 per family member.
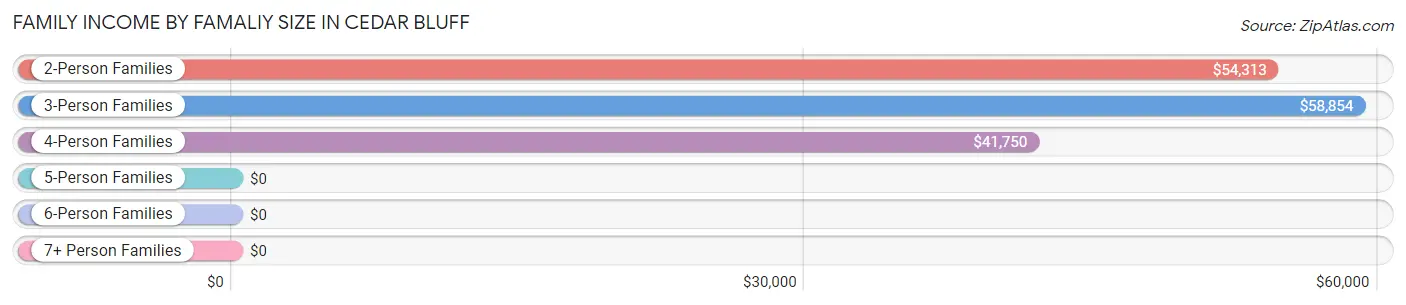
| Income Bracket | # Families | Median Income |
| 2-Person Families | 205 (58.6%) | $54,313 |
| 3-Person Families | 53 (15.1%) | $58,854 |
| 4-Person Families | 85 (24.3%) | $41,750 |
| 5-Person Families | 0 (0.0%) | $0 |
| 6-Person Families | 7 (2.0%) | $0 |
| 7+ Person Families | 0 (0.0%) | $0 |
| Total | 350 (100.0%) | $53,370 |
Family Income by Number of Earners in Cedar Bluff
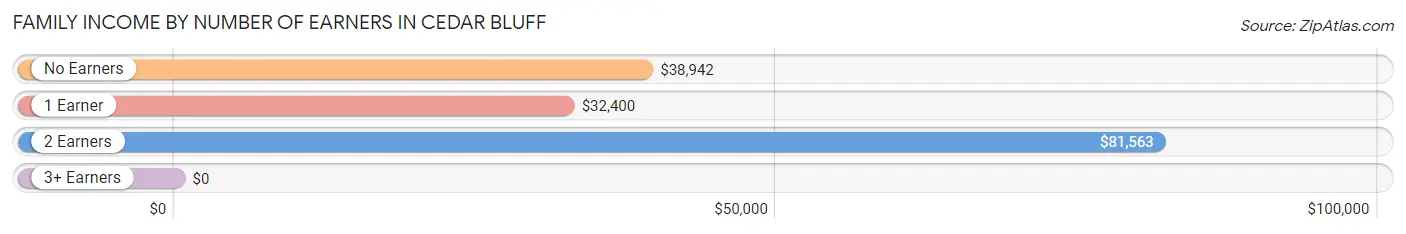
| Number of Earners | # Families | Median Income |
| No Earners | 121 (34.6%) | $38,942 |
| 1 Earner | 116 (33.1%) | $32,400 |
| 2 Earners | 109 (31.1%) | $81,563 |
| 3+ Earners | 4 (1.1%) | $0 |
| Total | 350 (100.0%) | $53,370 |
Household Income in Cedar Bluff
Household Income Brackets in Cedar Bluff
With 110 households falling in the category, the $25,000 to $34,999 income range is the most frequent in Cedar Bluff, accounting for 20.3% of all households. In contrast, only 3 households (0.5%) fall into the $200,000+ income bracket, making it the least populous group.
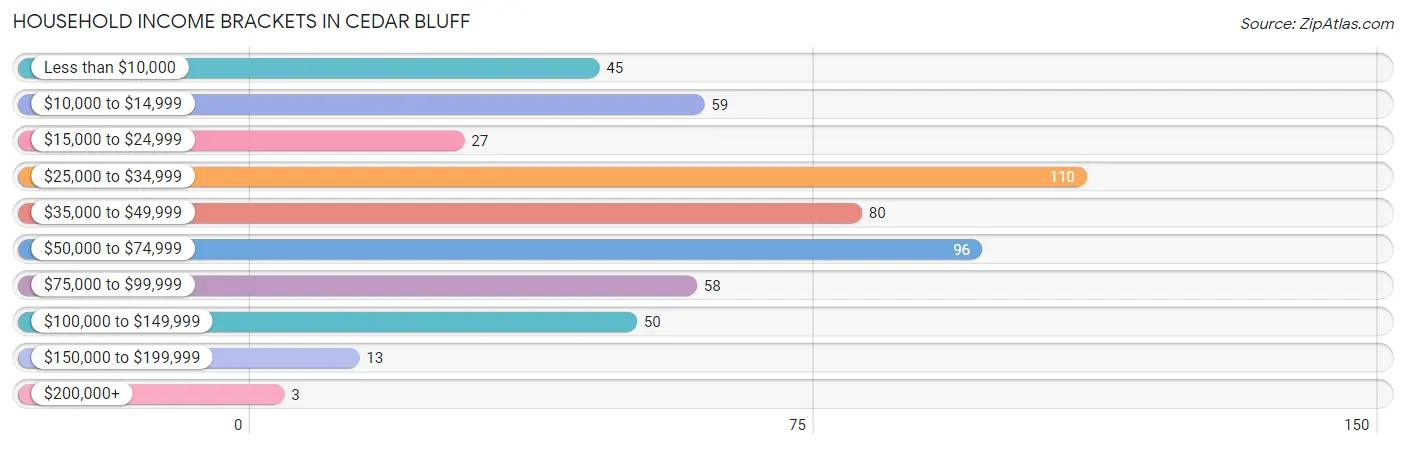
| Income Bracket | # Households | % Households |
| Less than $10,000 | 45 | 8.3% |
| $10,000 to $14,999 | 59 | 10.9% |
| $15,000 to $24,999 | 27 | 5.0% |
| $25,000 to $34,999 | 110 | 20.3% |
| $35,000 to $49,999 | 80 | 14.8% |
| $50,000 to $74,999 | 96 | 17.7% |
| $75,000 to $99,999 | 58 | 10.7% |
| $100,000 to $149,999 | 50 | 9.2% |
| $150,000 to $199,999 | 13 | 2.4% |
| $200,000+ | 3 | 0.6% |
Household Income by Householder Age in Cedar Bluff
The median household income in Cedar Bluff is $41,094, with the highest median household income of $54,028 found in the 25 to 44 years age bracket for the primary householder. A total of 149 households (27.5%) fall into this category. Meanwhile, the 15 to 24 years age bracket for the primary householder has the lowest median household income of $0, with 38 households (7.0%) in this group.
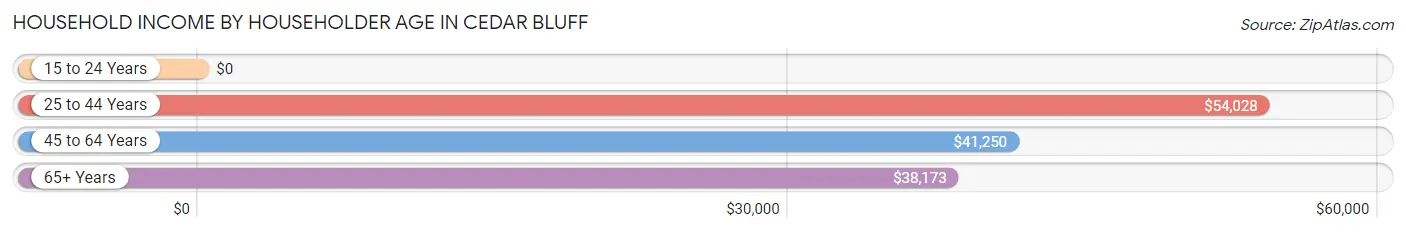
| Income Bracket | # Households | Median Income |
| 15 to 24 Years | 38 (7.0%) | $0 |
| 25 to 44 Years | 149 (27.5%) | $54,028 |
| 45 to 64 Years | 175 (32.4%) | $41,250 |
| 65+ Years | 179 (33.1%) | $38,173 |
| Total | 541 (100.0%) | $41,094 |
Poverty in Cedar Bluff
Income Below Poverty by Sex and Age in Cedar Bluff
With 22.5% poverty level for males and 24.2% for females among the residents of Cedar Bluff, 12 to 14 year old males and 16 and 17 year old females are the most vulnerable to poverty, with 18 males (100.0%) and 3 females (100.0%) in their respective age groups living below the poverty level.
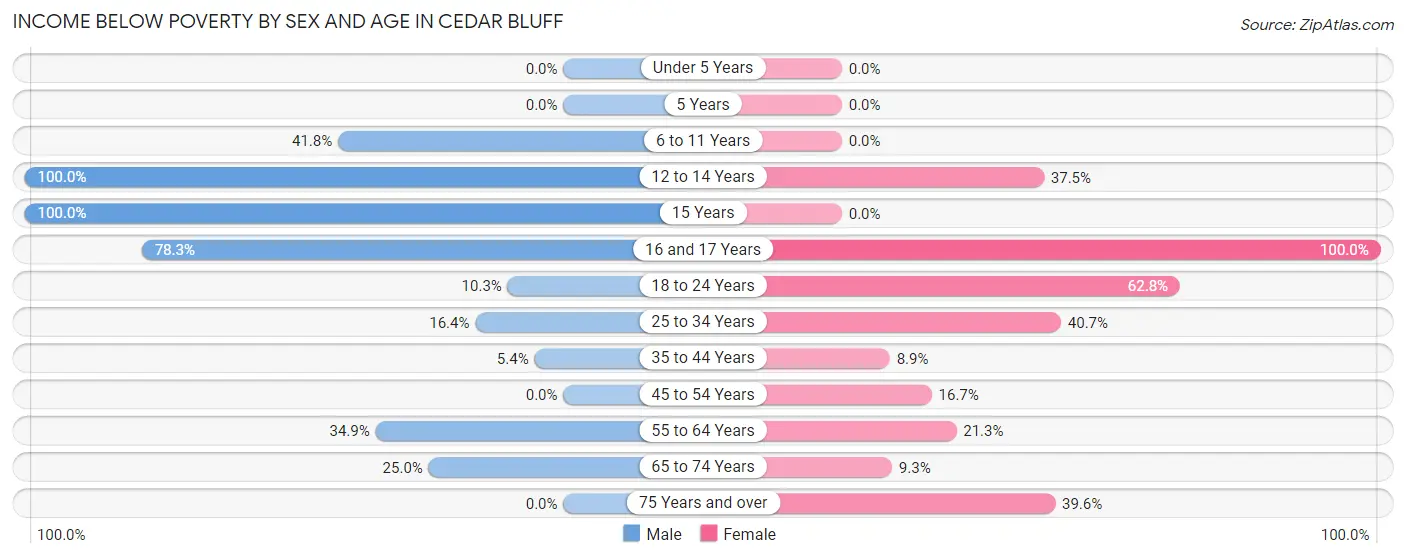
| Age Bracket | Male | Female |
| Under 5 Years | 0 (0.0%) | 0 (0.0%) |
| 5 Years | 0 (0.0%) | 0 (0.0%) |
| 6 to 11 Years | 23 (41.8%) | 0 (0.0%) |
| 12 to 14 Years | 18 (100.0%) | 3 (37.5%) |
| 15 Years | 4 (100.0%) | 0 (0.0%) |
| 16 and 17 Years | 18 (78.3%) | 3 (100.0%) |
| 18 to 24 Years | 3 (10.3%) | 32 (62.7%) |
| 25 to 34 Years | 17 (16.4%) | 37 (40.7%) |
| 35 to 44 Years | 3 (5.4%) | 4 (8.9%) |
| 45 to 54 Years | 0 (0.0%) | 17 (16.7%) |
| 55 to 64 Years | 38 (34.9%) | 17 (21.2%) |
| 65 to 74 Years | 18 (25.0%) | 8 (9.3%) |
| 75 Years and over | 0 (0.0%) | 19 (39.6%) |
| Total | 142 (22.5%) | 140 (24.2%) |
Income Above Poverty by Sex and Age in Cedar Bluff
According to the poverty statistics in Cedar Bluff, males aged under 5 years and females aged under 5 years are the age groups that are most secure financially, with 100.0% of males and 100.0% of females in these age groups living above the poverty line.
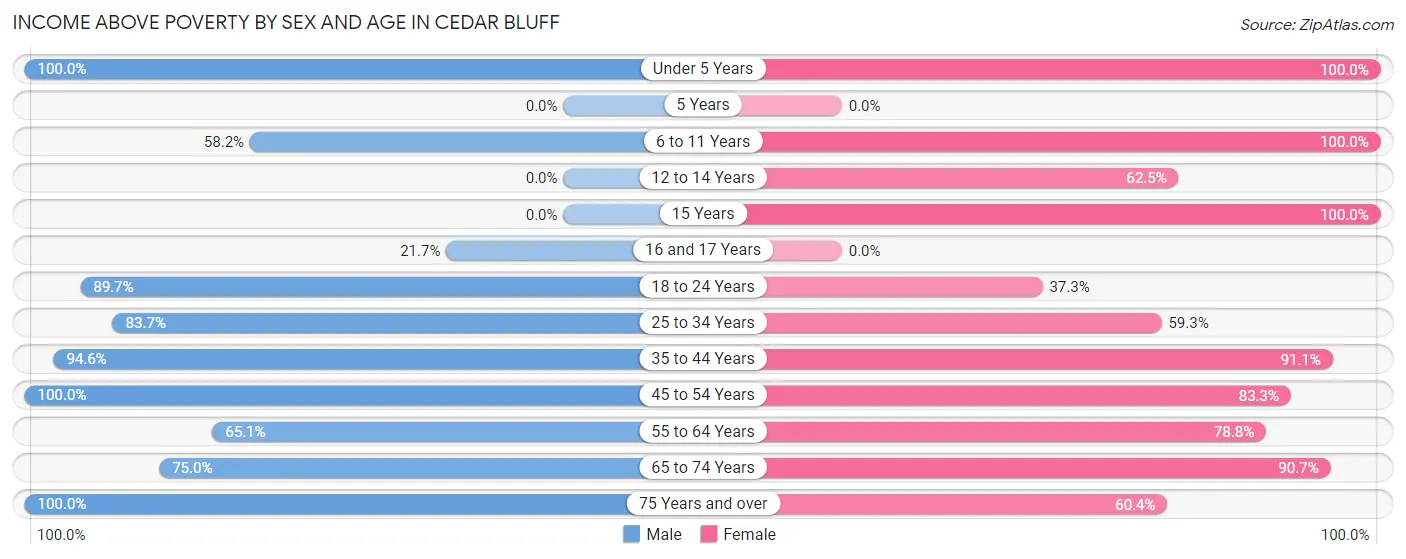
| Age Bracket | Male | Female |
| Under 5 Years | 21 (100.0%) | 20 (100.0%) |
| 5 Years | 0 (0.0%) | 0 (0.0%) |
| 6 to 11 Years | 32 (58.2%) | 22 (100.0%) |
| 12 to 14 Years | 0 (0.0%) | 5 (62.5%) |
| 15 Years | 0 (0.0%) | 22 (100.0%) |
| 16 and 17 Years | 5 (21.7%) | 0 (0.0%) |
| 18 to 24 Years | 26 (89.7%) | 19 (37.2%) |
| 25 to 34 Years | 87 (83.7%) | 54 (59.3%) |
| 35 to 44 Years | 53 (94.6%) | 41 (91.1%) |
| 45 to 54 Years | 91 (100.0%) | 85 (83.3%) |
| 55 to 64 Years | 71 (65.1%) | 63 (78.7%) |
| 65 to 74 Years | 54 (75.0%) | 78 (90.7%) |
| 75 Years and over | 50 (100.0%) | 29 (60.4%) |
| Total | 490 (77.5%) | 438 (75.8%) |
Income Below Poverty Among Married-Couple Families in Cedar Bluff
The poverty statistics for married-couple families in Cedar Bluff show that 9.8% or 25 of the total 255 families live below the poverty line. Families with 3 or 4 children have the highest poverty rate of 42.9%, comprising of 3 families. On the other hand, families with 1 or 2 children have the lowest poverty rate of 0.0%, which includes 0 families.
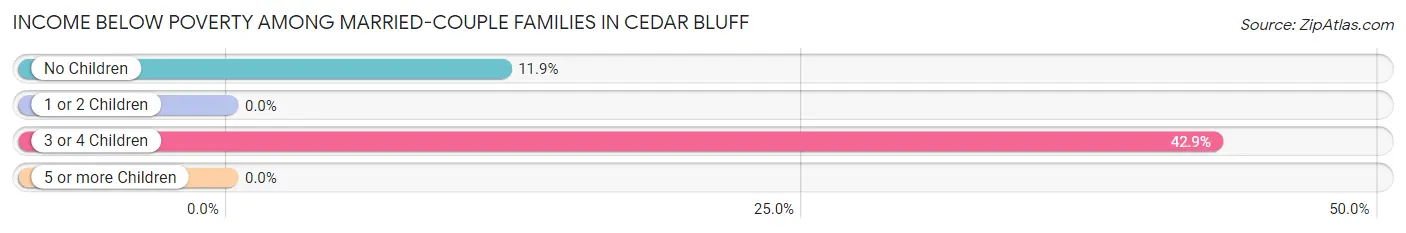
| Children | Above Poverty | Below Poverty |
| No Children | 163 (88.1%) | 22 (11.9%) |
| 1 or 2 Children | 63 (100.0%) | 0 (0.0%) |
| 3 or 4 Children | 4 (57.1%) | 3 (42.9%) |
| 5 or more Children | 0 (0.0%) | 0 (0.0%) |
| Total | 230 (90.2%) | 25 (9.8%) |
Income Below Poverty Among Single-Parent Households in Cedar Bluff
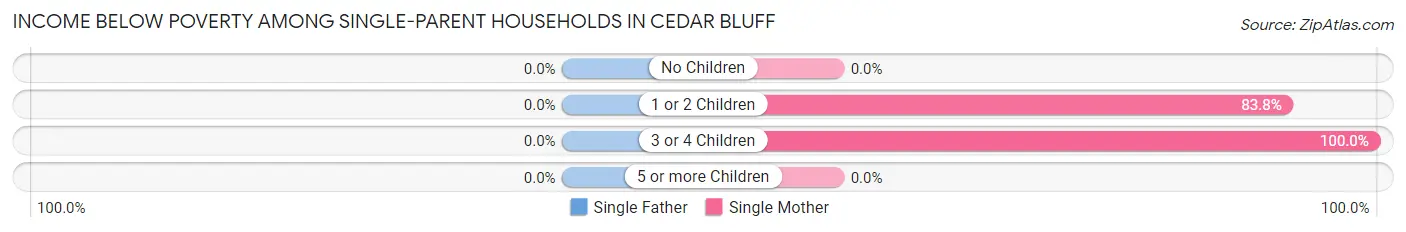
| Children | Single Father | Single Mother |
| No Children | 0 (0.0%) | 0 (0.0%) |
| 1 or 2 Children | 0 (0.0%) | 31 (83.8%) |
| 3 or 4 Children | 0 (0.0%) | 9 (100.0%) |
| 5 or more Children | 0 (0.0%) | 0 (0.0%) |
| Total | 0 (0.0%) | 40 (58.0%) |
Income Below Poverty Among Married-Couple vs Single-Parent Households in Cedar Bluff
The poverty data for Cedar Bluff shows that 25 of the married-couple family households (9.8%) and 40 of the single-parent households (42.1%) are living below the poverty level. Within the married-couple family households, those with 3 or 4 children have the highest poverty rate, with 3 households (42.9%) falling below the poverty line. Among the single-parent households, those with 3 or 4 children have the highest poverty rate, with 9 household (100.0%) living below poverty.
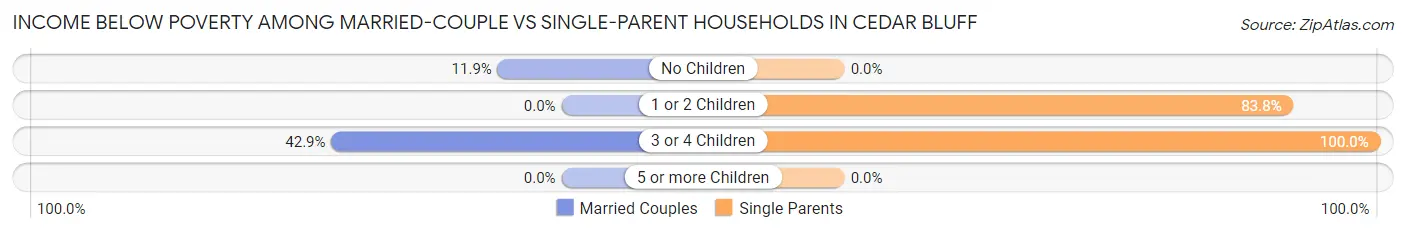
| Children | Married-Couple Families | Single-Parent Households |
| No Children | 22 (11.9%) | 0 (0.0%) |
| 1 or 2 Children | 0 (0.0%) | 31 (83.8%) |
| 3 or 4 Children | 3 (42.9%) | 9 (100.0%) |
| 5 or more Children | 0 (0.0%) | 0 (0.0%) |
| Total | 25 (9.8%) | 40 (42.1%) |
Race in Cedar Bluff
The most populous races in Cedar Bluff are , and White / Caucasian (1,210 | 100.0%).
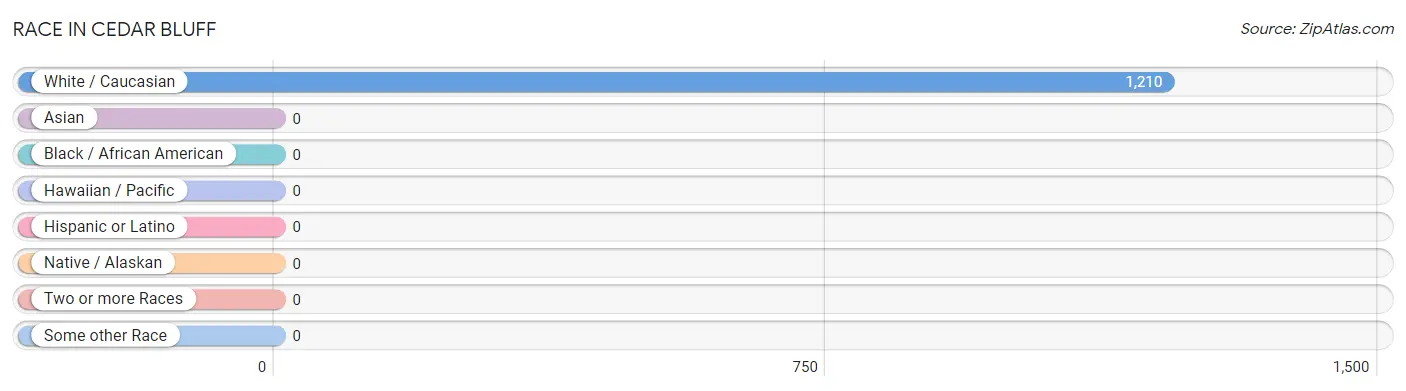
| Race | # Population | % Population |
| Asian | 0 | 0.0% |
| Black / African American | 0 | 0.0% |
| Hawaiian / Pacific | 0 | 0.0% |
| Hispanic or Latino | 0 | 0.0% |
| Native / Alaskan | 0 | 0.0% |
| White / Caucasian | 1,210 | 100.0% |
| Two or more Races | 0 | 0.0% |
| Some other Race | 0 | 0.0% |
| Total | 1,210 | 100.0% |
Ancestry in Cedar Bluff
The most populous ancestries reported in Cedar Bluff are German (201 | 16.6%), American (200 | 16.5%), Irish (167 | 13.8%), English (80 | 6.6%), and Dutch (18 | 1.5%), together accounting for 55.0% of all Cedar Bluff residents.
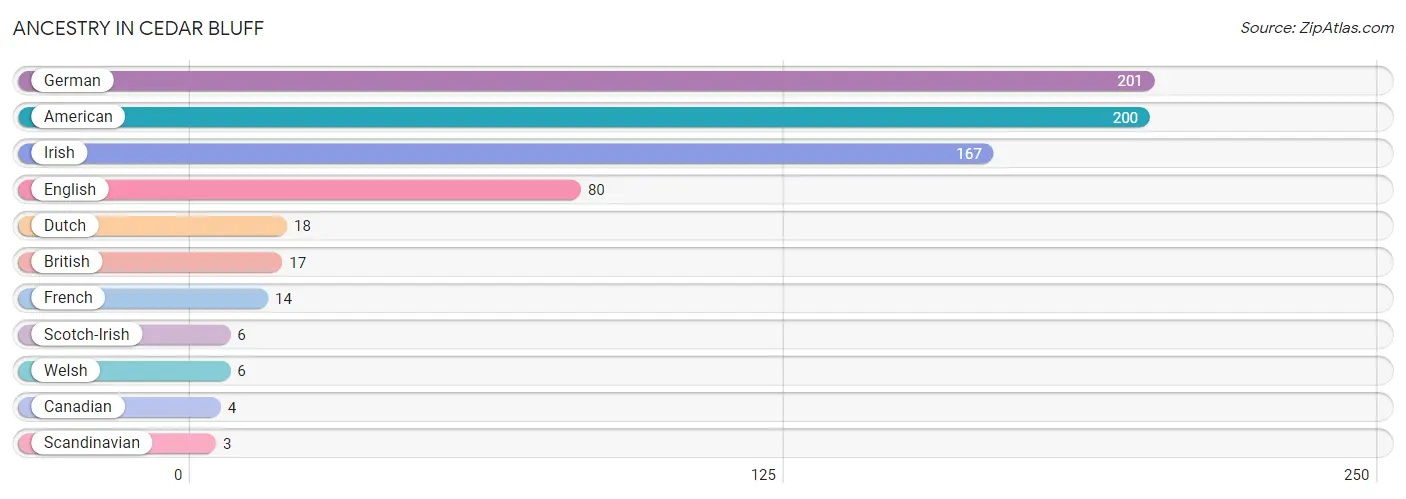
| Ancestry | # Population | % Population |
| American | 200 | 16.5% |
| British | 17 | 1.4% |
| Canadian | 4 | 0.3% |
| Dutch | 18 | 1.5% |
| English | 80 | 6.6% |
| French | 14 | 1.2% |
| German | 201 | 16.6% |
| Irish | 167 | 13.8% |
| Scandinavian | 3 | 0.3% |
| Scotch-Irish | 6 | 0.5% |
| Welsh | 6 | 0.5% | View All 11 Rows |
Immigrants in Cedar Bluff
The most numerous immigrant groups reported in Cedar Bluff came from , and Canada (4 | 0.3%), together accounting for 0.3% of all Cedar Bluff residents.

| Immigration Origin | # Population | % Population |
| Canada | 4 | 0.3% | View All 1 Rows |
Sex and Age in Cedar Bluff
Sex and Age in Cedar Bluff
The most populous age groups in Cedar Bluff are 50 to 54 Years (63 | 10.0%) for men and 50 to 54 Years (67 | 11.6%) for women.
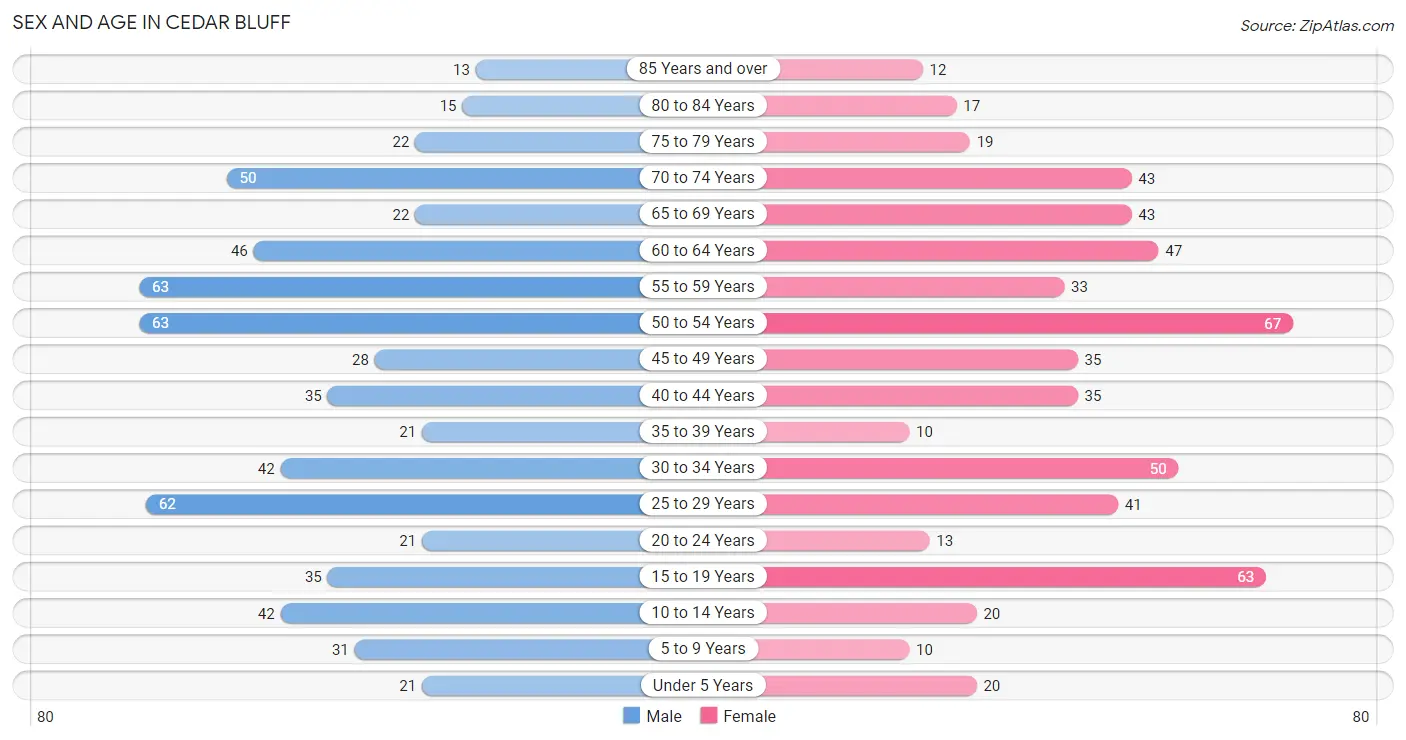
| Age Bracket | Male | Female |
| Under 5 Years | 21 (3.3%) | 20 (3.5%) |
| 5 to 9 Years | 31 (4.9%) | 10 (1.7%) |
| 10 to 14 Years | 42 (6.7%) | 20 (3.5%) |
| 15 to 19 Years | 35 (5.5%) | 63 (10.9%) |
| 20 to 24 Years | 21 (3.3%) | 13 (2.2%) |
| 25 to 29 Years | 62 (9.8%) | 41 (7.1%) |
| 30 to 34 Years | 42 (6.7%) | 50 (8.6%) |
| 35 to 39 Years | 21 (3.3%) | 10 (1.7%) |
| 40 to 44 Years | 35 (5.5%) | 35 (6.1%) |
| 45 to 49 Years | 28 (4.4%) | 35 (6.1%) |
| 50 to 54 Years | 63 (10.0%) | 67 (11.6%) |
| 55 to 59 Years | 63 (10.0%) | 33 (5.7%) |
| 60 to 64 Years | 46 (7.3%) | 47 (8.1%) |
| 65 to 69 Years | 22 (3.5%) | 43 (7.4%) |
| 70 to 74 Years | 50 (7.9%) | 43 (7.4%) |
| 75 to 79 Years | 22 (3.5%) | 19 (3.3%) |
| 80 to 84 Years | 15 (2.4%) | 17 (2.9%) |
| 85 Years and over | 13 (2.1%) | 12 (2.1%) |
| Total | 632 (100.0%) | 578 (100.0%) |
Families and Households in Cedar Bluff
Median Family Size in Cedar Bluff
The median family size in Cedar Bluff is 2.78 persons per family, with single female/mother families (69 | 19.7%) accounting for the largest median family size of 2.9 persons per family. On the other hand, single male/father families (26 | 7.4%) represent the smallest median family size with 2.15 persons per family.
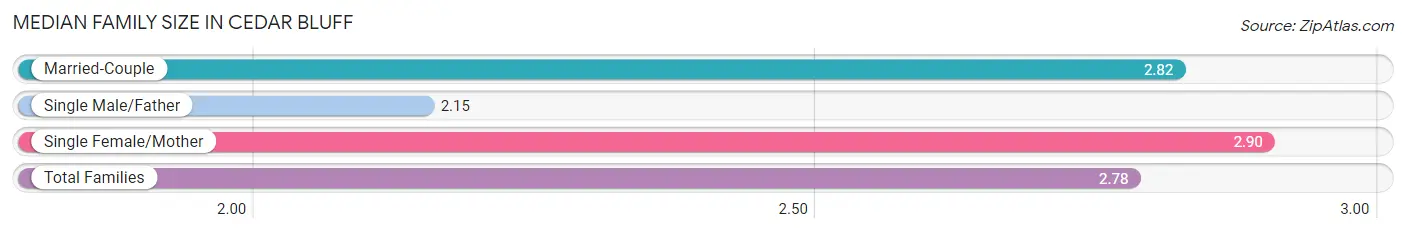
| Family Type | # Families | Family Size |
| Married-Couple | 255 (72.9%) | 2.82 |
| Single Male/Father | 26 (7.4%) | 2.15 |
| Single Female/Mother | 69 (19.7%) | 2.90 |
| Total Families | 350 (100.0%) | 2.78 |
Median Household Size in Cedar Bluff
The median household size in Cedar Bluff is 2.24 persons per household, with single female/mother households (69 | 12.8%) accounting for the largest median household size of 2.94 persons per household. non-family households (191 | 35.3%) represent the smallest median household size with 1.22 persons per household.
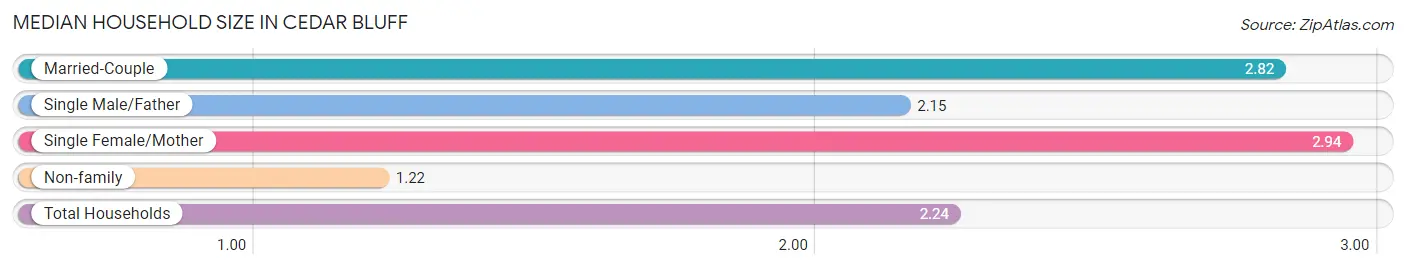
| Household Type | # Households | Household Size |
| Married-Couple | 255 (47.1%) | 2.82 |
| Single Male/Father | 26 (4.8%) | 2.15 |
| Single Female/Mother | 69 (12.8%) | 2.94 |
| Non-family | 191 (35.3%) | 1.22 |
| Total Households | 541 (100.0%) | 2.24 |
Household Size by Marriage Status in Cedar Bluff
Out of a total of 541 households in Cedar Bluff, 350 (64.7%) are family households, while 191 (35.3%) are nonfamily households. The most numerous type of family households are 2-person households, comprising 205, and the most common type of nonfamily households are 1-person households, comprising 153.
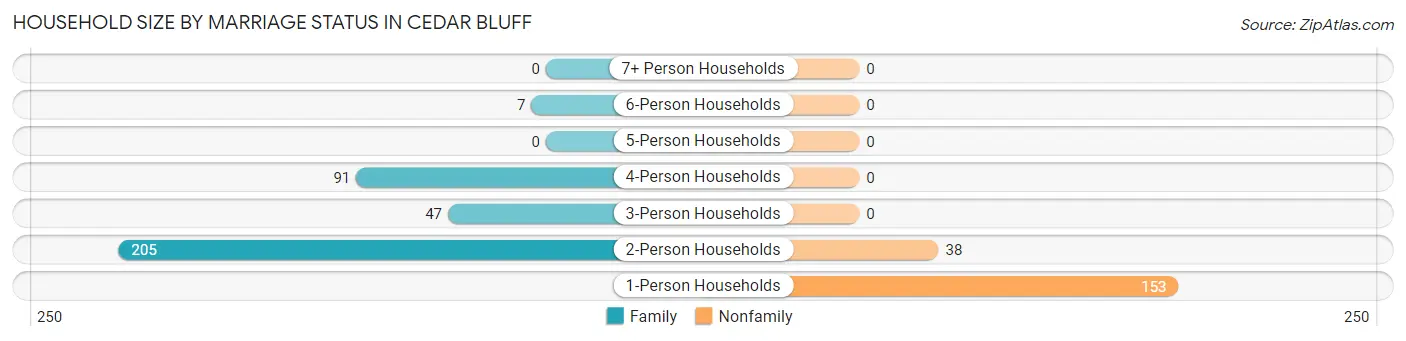
| Household Size | Family Households | Nonfamily Households |
| 1-Person Households | - | 153 (28.3%) |
| 2-Person Households | 205 (37.9%) | 38 (7.0%) |
| 3-Person Households | 47 (8.7%) | 0 (0.0%) |
| 4-Person Households | 91 (16.8%) | 0 (0.0%) |
| 5-Person Households | 0 (0.0%) | 0 (0.0%) |
| 6-Person Households | 7 (1.3%) | 0 (0.0%) |
| 7+ Person Households | 0 (0.0%) | 0 (0.0%) |
| Total | 350 (64.7%) | 191 (35.3%) |
Female Fertility in Cedar Bluff
Fertility by Age in Cedar Bluff
| Age Bracket | Women with Births | Births / 1,000 Women |
| 15 to 19 years | 0 (0.0%) | 0.0 |
| 20 to 34 years | 0 (0.0%) | 0.0 |
| 35 to 50 years | 0 (0.0%) | 0.0 |
| Total | 0 (0.0%) | 0.0 |
Fertility by Age by Marriage Status in Cedar Bluff
| Age Bracket | Married | Unmarried |
| 15 to 19 years | 0 (0.0%) | 0 (0.0%) |
| 20 to 34 years | 0 (0.0%) | 0 (0.0%) |
| 35 to 50 years | 0 (0.0%) | 0 (0.0%) |
| Total | 0 (0.0%) | 0 (0.0%) |
Fertility by Education in Cedar Bluff
| Educational Attainment | Women with Births | Births / 1,000 Women |
| Less than High School | 0 (0.0%) | 0.0 |
| High School Diploma | 0 (0.0%) | 0.0 |
| College or Associate's Degree | 0 (0.0%) | 0.0 |
| Bachelor's Degree | 0 (0.0%) | 0.0 |
| Graduate Degree | 0 (0.0%) | 0.0 |
| Total | 0 (0.0%) | 0.0 |
Fertility by Education by Marriage Status in Cedar Bluff
| Educational Attainment | Married | Unmarried |
| Less than High School | 0 (0.0%) | 0 (0.0%) |
| High School Diploma | 0 (0.0%) | 0 (0.0%) |
| College or Associate's Degree | 0 (0.0%) | 0 (0.0%) |
| Bachelor's Degree | 0 (0.0%) | 0 (0.0%) |
| Graduate Degree | 0 (0.0%) | 0 (0.0%) |
| Total | 0 (0.0%) | 0 (0.0%) |
Employment Characteristics in Cedar Bluff
Employment by Class of Employer in Cedar Bluff
Among the 421 employed individuals in Cedar Bluff, private company employees (249 | 59.1%), state government employees (50 | 11.9%), and self-employed (incorporated) (40 | 9.5%) make up the most common classes of employment.
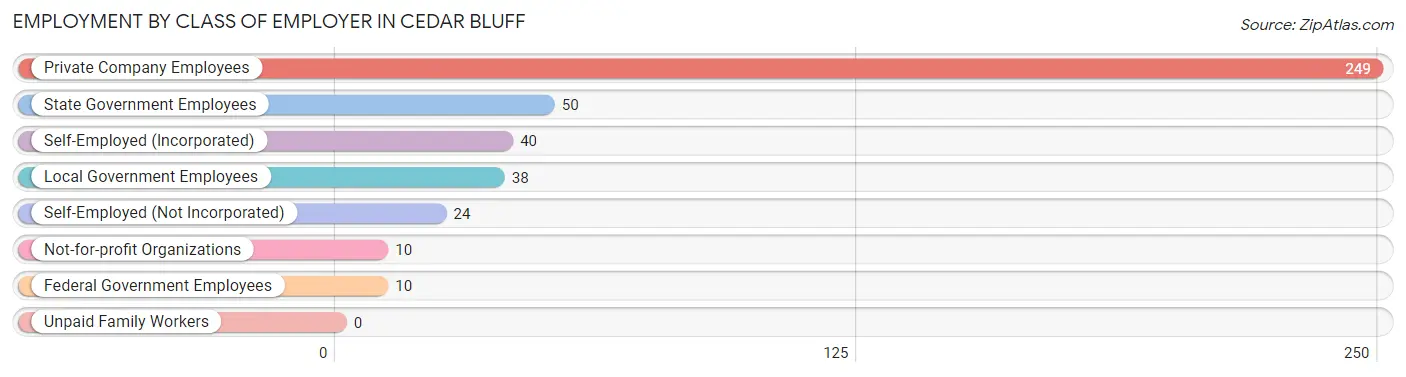
| Employer Class | # Employees | % Employees |
| Private Company Employees | 249 | 59.1% |
| Self-Employed (Incorporated) | 40 | 9.5% |
| Self-Employed (Not Incorporated) | 24 | 5.7% |
| Not-for-profit Organizations | 10 | 2.4% |
| Local Government Employees | 38 | 9.0% |
| State Government Employees | 50 | 11.9% |
| Federal Government Employees | 10 | 2.4% |
| Unpaid Family Workers | 0 | 0.0% |
| Total | 421 | 100.0% |
Employment Status by Age in Cedar Bluff
According to the labor force statistics for Cedar Bluff, out of the total population over 16 years of age (1,040), 43.0% or 447 individuals are in the labor force, with 5.8% or 26 of them unemployed. The age group with the highest labor force participation rate is 30 to 34 years, with 67.4% or 62 individuals in the labor force. Within the labor force, the 45 to 54 years age range has the highest percentage of unemployed individuals, with 15.1% or 18 of them being unemployed.
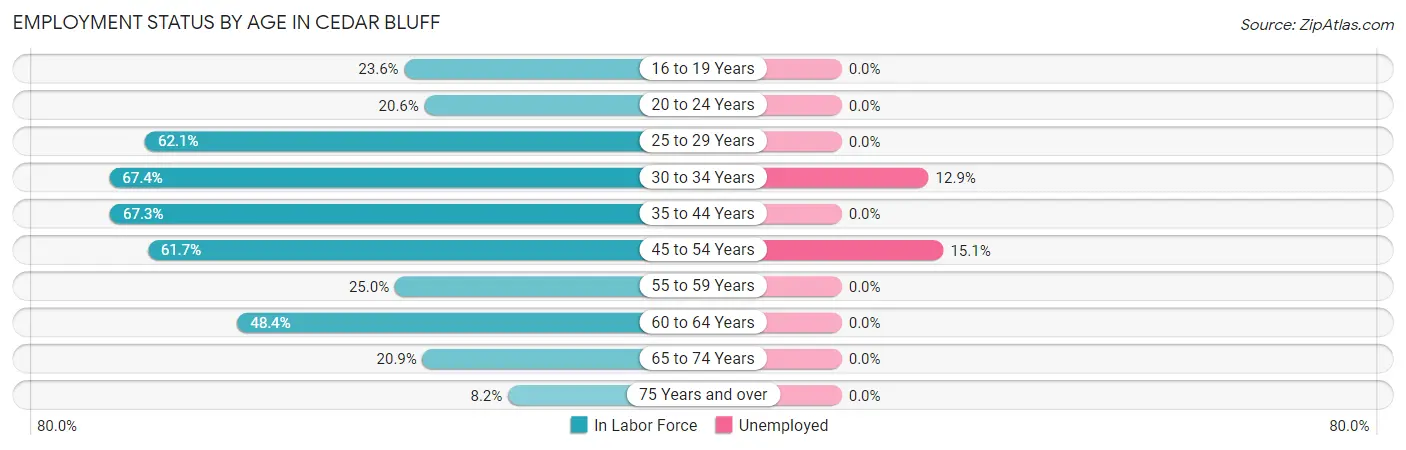
| Age Bracket | In Labor Force | Unemployed |
| 16 to 19 Years | 17 (23.6%) | 0 (0.0%) |
| 20 to 24 Years | 7 (20.6%) | 0 (0.0%) |
| 25 to 29 Years | 64 (62.1%) | 0 (0.0%) |
| 30 to 34 Years | 62 (67.4%) | 8 (12.9%) |
| 35 to 44 Years | 68 (67.3%) | 0 (0.0%) |
| 45 to 54 Years | 119 (61.7%) | 18 (15.1%) |
| 55 to 59 Years | 24 (25.0%) | 0 (0.0%) |
| 60 to 64 Years | 45 (48.4%) | 0 (0.0%) |
| 65 to 74 Years | 33 (20.9%) | 0 (0.0%) |
| 75 Years and over | 8 (8.2%) | 0 (0.0%) |
| Total | 447 (43.0%) | 26 (5.8%) |
Employment Status by Educational Attainment in Cedar Bluff
According to labor force statistics for Cedar Bluff, 56.3% of individuals (382) out of the total population between 25 and 64 years of age (678) are in the labor force, with 6.8% or 26 of them being unemployed. The group with the highest labor force participation rate are those with the educational attainment of bachelor's degree or higher, with 64.6% or 64 individuals in the labor force. Within the labor force, individuals with college / associate degree education have the highest percentage of unemployment, with 9.1% or 12 of them being unemployed.
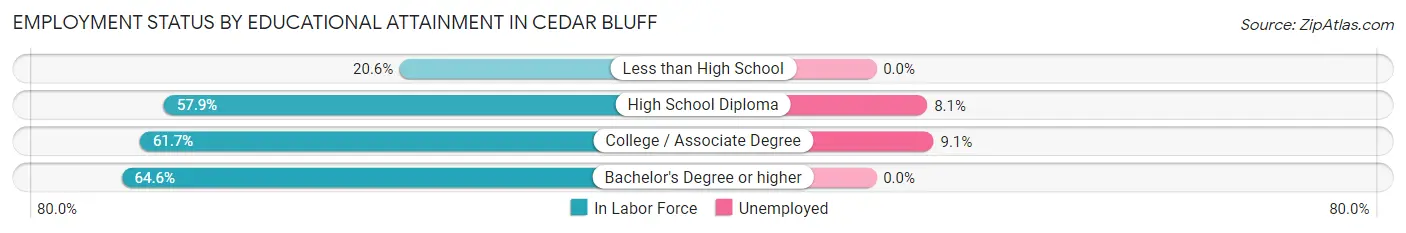
| Educational Attainment | In Labor Force | Unemployed |
| Less than High School | 14 (20.6%) | 0 (0.0%) |
| High School Diploma | 172 (57.9%) | 24 (8.1%) |
| College / Associate Degree | 132 (61.7%) | 19 (9.1%) |
| Bachelor's Degree or higher | 64 (64.6%) | 0 (0.0%) |
| Total | 382 (56.3%) | 46 (6.8%) |
Employment Occupations by Sex in Cedar Bluff
Management, Business, Science and Arts Occupations
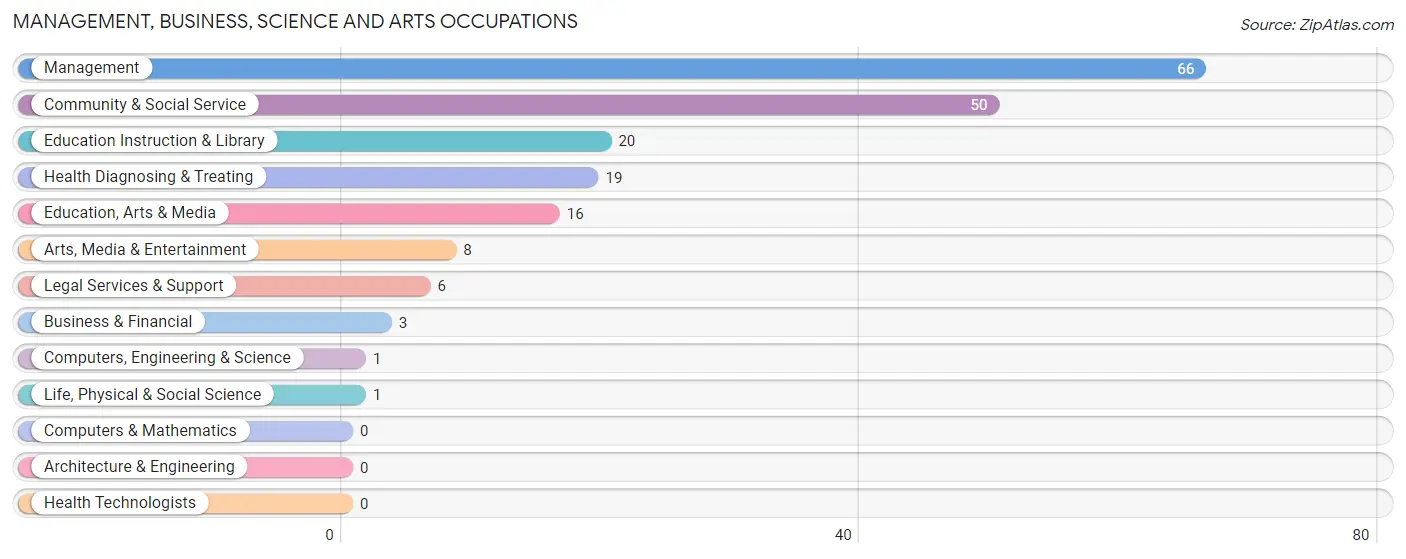
The most common Management, Business, Science and Arts occupations in Cedar Bluff are Management (66 | 15.7%), Community & Social Service (50 | 11.9%), Education Instruction & Library (20 | 4.8%), Health Diagnosing & Treating (19 | 4.5%), and Education, Arts & Media (16 | 3.8%).
Management, Business, Science and Arts Occupations by Sex
Within the Management, Business, Science and Arts occupations in Cedar Bluff, the most male-oriented occupations are Business & Financial (100.0%), Legal Services & Support (100.0%), and Education Instruction & Library (100.0%), while the most female-oriented occupations are Computers, Engineering & Science (100.0%), Life, Physical & Social Science (100.0%), and Health Diagnosing & Treating (100.0%).
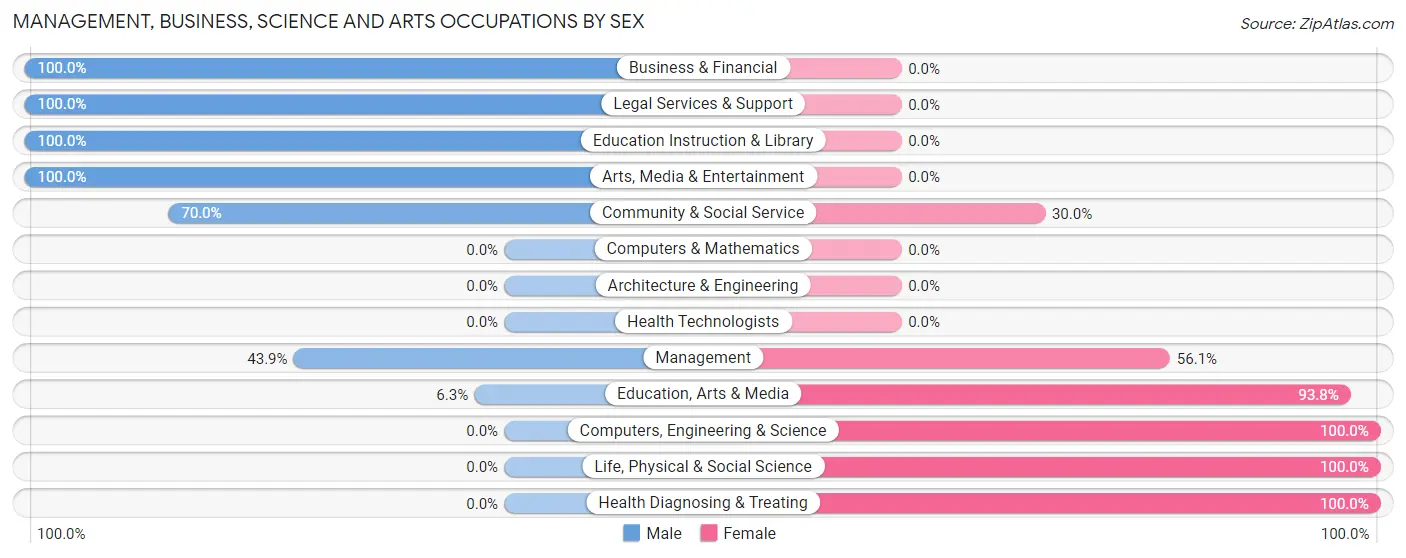
| Occupation | Male | Female |
| Management | 29 (43.9%) | 37 (56.1%) |
| Business & Financial | 3 (100.0%) | 0 (0.0%) |
| Computers, Engineering & Science | 0 (0.0%) | 1 (100.0%) |
| Computers & Mathematics | 0 (0.0%) | 0 (0.0%) |
| Architecture & Engineering | 0 (0.0%) | 0 (0.0%) |
| Life, Physical & Social Science | 0 (0.0%) | 1 (100.0%) |
| Community & Social Service | 35 (70.0%) | 15 (30.0%) |
| Education, Arts & Media | 1 (6.2%) | 15 (93.8%) |
| Legal Services & Support | 6 (100.0%) | 0 (0.0%) |
| Education Instruction & Library | 20 (100.0%) | 0 (0.0%) |
| Arts, Media & Entertainment | 8 (100.0%) | 0 (0.0%) |
| Health Diagnosing & Treating | 0 (0.0%) | 19 (100.0%) |
| Health Technologists | 0 (0.0%) | 0 (0.0%) |
| Total (Category) | 67 (48.2%) | 72 (51.8%) |
| Total (Overall) | 222 (52.7%) | 199 (47.3%) |
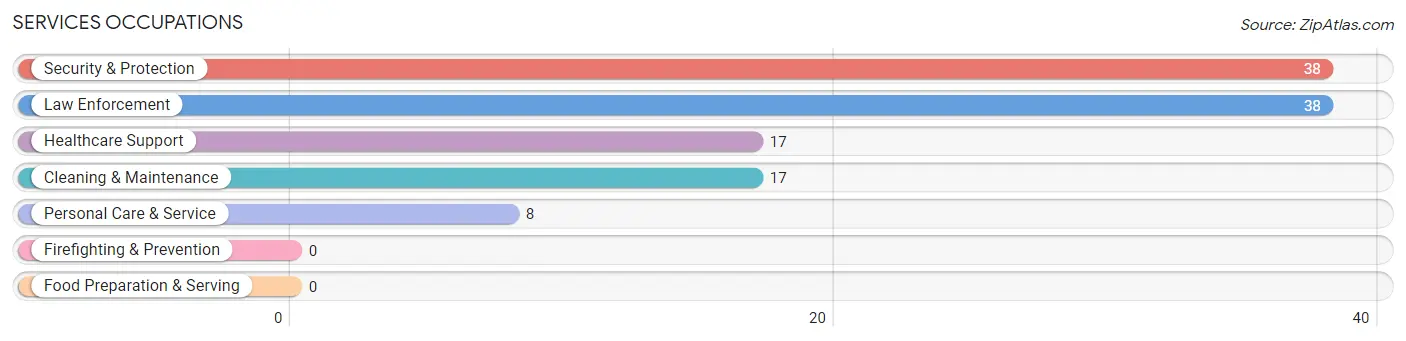
Services Occupations
The most common Services occupations in Cedar Bluff are Security & Protection (38 | 9.0%), Law Enforcement (38 | 9.0%), Healthcare Support (17 | 4.0%), Cleaning & Maintenance (17 | 4.0%), and Personal Care & Service (8 | 1.9%).
Services Occupations by Sex
Within the Services occupations in Cedar Bluff, the most male-oriented occupations are Cleaning & Maintenance (100.0%), Security & Protection (71.1%), and Law Enforcement (71.1%), while the most female-oriented occupations are Healthcare Support (100.0%), Personal Care & Service (100.0%), and Security & Protection (28.9%).
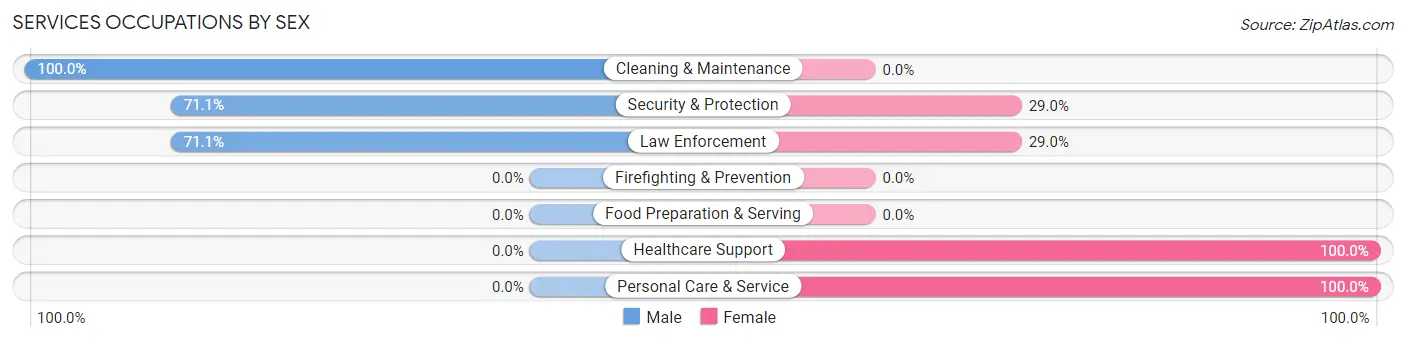
| Occupation | Male | Female |
| Healthcare Support | 0 (0.0%) | 17 (100.0%) |
| Security & Protection | 27 (71.1%) | 11 (28.9%) |
| Firefighting & Prevention | 0 (0.0%) | 0 (0.0%) |
| Law Enforcement | 27 (71.1%) | 11 (28.9%) |
| Food Preparation & Serving | 0 (0.0%) | 0 (0.0%) |
| Cleaning & Maintenance | 17 (100.0%) | 0 (0.0%) |
| Personal Care & Service | 0 (0.0%) | 8 (100.0%) |
| Total (Category) | 44 (55.0%) | 36 (45.0%) |
| Total (Overall) | 222 (52.7%) | 199 (47.3%) |
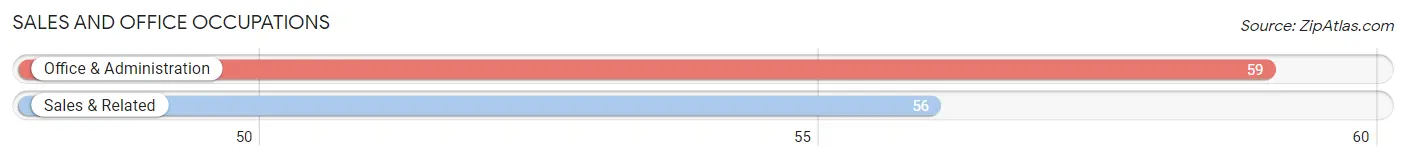
Sales and Office Occupations
The most common Sales and Office occupations in Cedar Bluff are Office & Administration (59 | 14.0%), and Sales & Related (56 | 13.3%).
Sales and Office Occupations by Sex

| Occupation | Male | Female |
| Sales & Related | 27 (48.2%) | 29 (51.8%) |
| Office & Administration | 6 (10.2%) | 53 (89.8%) |
| Total (Category) | 33 (28.7%) | 82 (71.3%) |
| Total (Overall) | 222 (52.7%) | 199 (47.3%) |
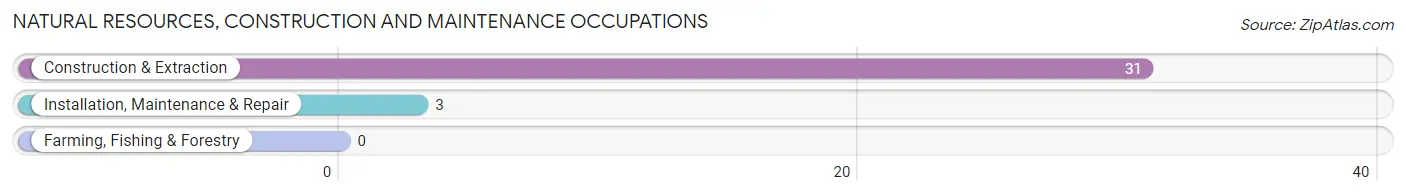
Natural Resources, Construction and Maintenance Occupations
The most common Natural Resources, Construction and Maintenance occupations in Cedar Bluff are Construction & Extraction (31 | 7.4%), and Installation, Maintenance & Repair (3 | 0.7%).
Natural Resources, Construction and Maintenance Occupations by Sex
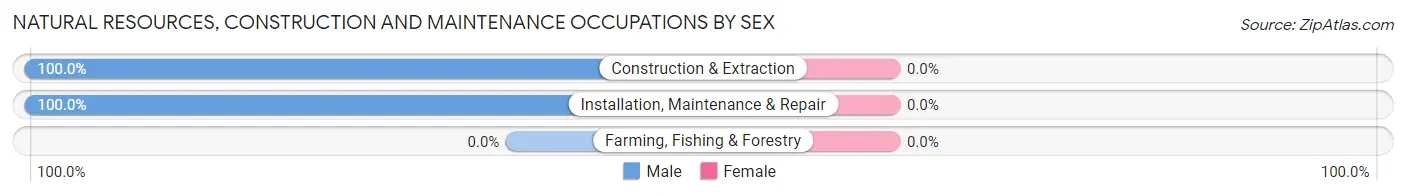
| Occupation | Male | Female |
| Farming, Fishing & Forestry | 0 (0.0%) | 0 (0.0%) |
| Construction & Extraction | 31 (100.0%) | 0 (0.0%) |
| Installation, Maintenance & Repair | 3 (100.0%) | 0 (0.0%) |
| Total (Category) | 34 (100.0%) | 0 (0.0%) |
| Total (Overall) | 222 (52.7%) | 199 (47.3%) |
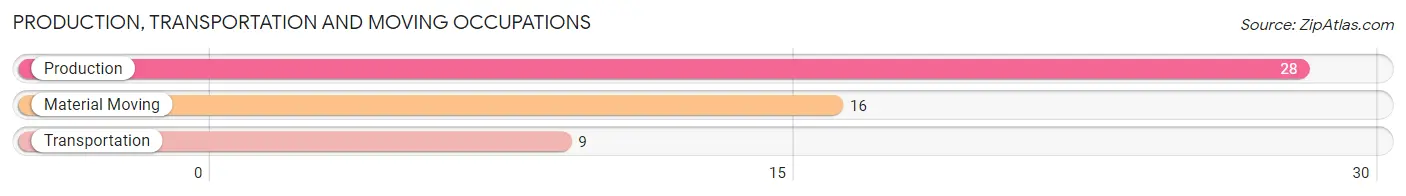
Production, Transportation and Moving Occupations
The most common Production, Transportation and Moving occupations in Cedar Bluff are Production (28 | 6.7%), Material Moving (16 | 3.8%), and Transportation (9 | 2.1%).
Production, Transportation and Moving Occupations by Sex
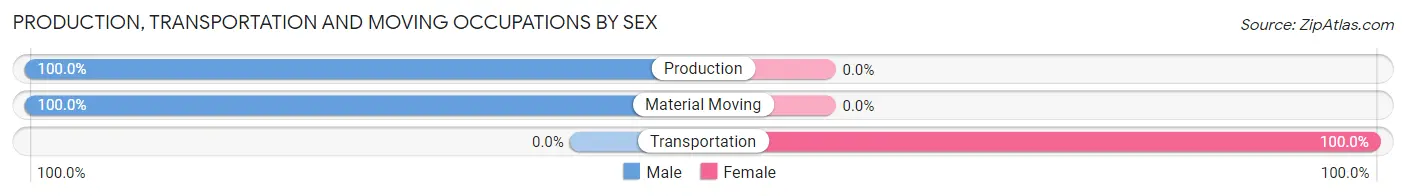
| Occupation | Male | Female |
| Production | 28 (100.0%) | 0 (0.0%) |
| Transportation | 0 (0.0%) | 9 (100.0%) |
| Material Moving | 16 (100.0%) | 0 (0.0%) |
| Total (Category) | 44 (83.0%) | 9 (17.0%) |
| Total (Overall) | 222 (52.7%) | 199 (47.3%) |
Employment Industries by Sex in Cedar Bluff
Employment Industries in Cedar Bluff
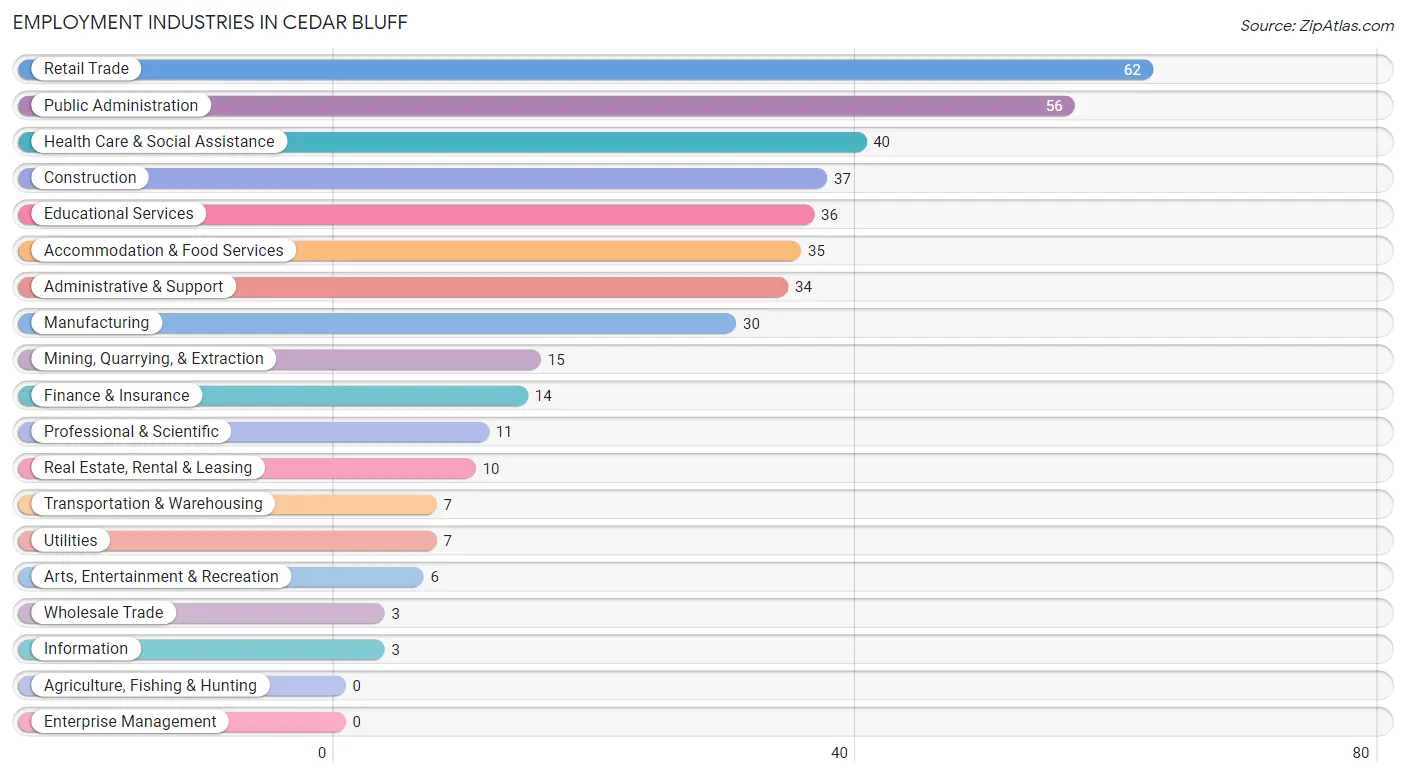
The major employment industries in Cedar Bluff include Retail Trade (62 | 14.7%), Public Administration (56 | 13.3%), Health Care & Social Assistance (40 | 9.5%), Construction (37 | 8.8%), and Educational Services (36 | 8.6%).
Employment Industries by Sex in Cedar Bluff
The Cedar Bluff industries that see more men than women are Mining, Quarrying, & Extraction (100.0%), Manufacturing (100.0%), and Utilities (100.0%), whereas the industries that tend to have a higher number of women are Wholesale Trade (100.0%), Transportation & Warehousing (100.0%), and Health Care & Social Assistance (100.0%).
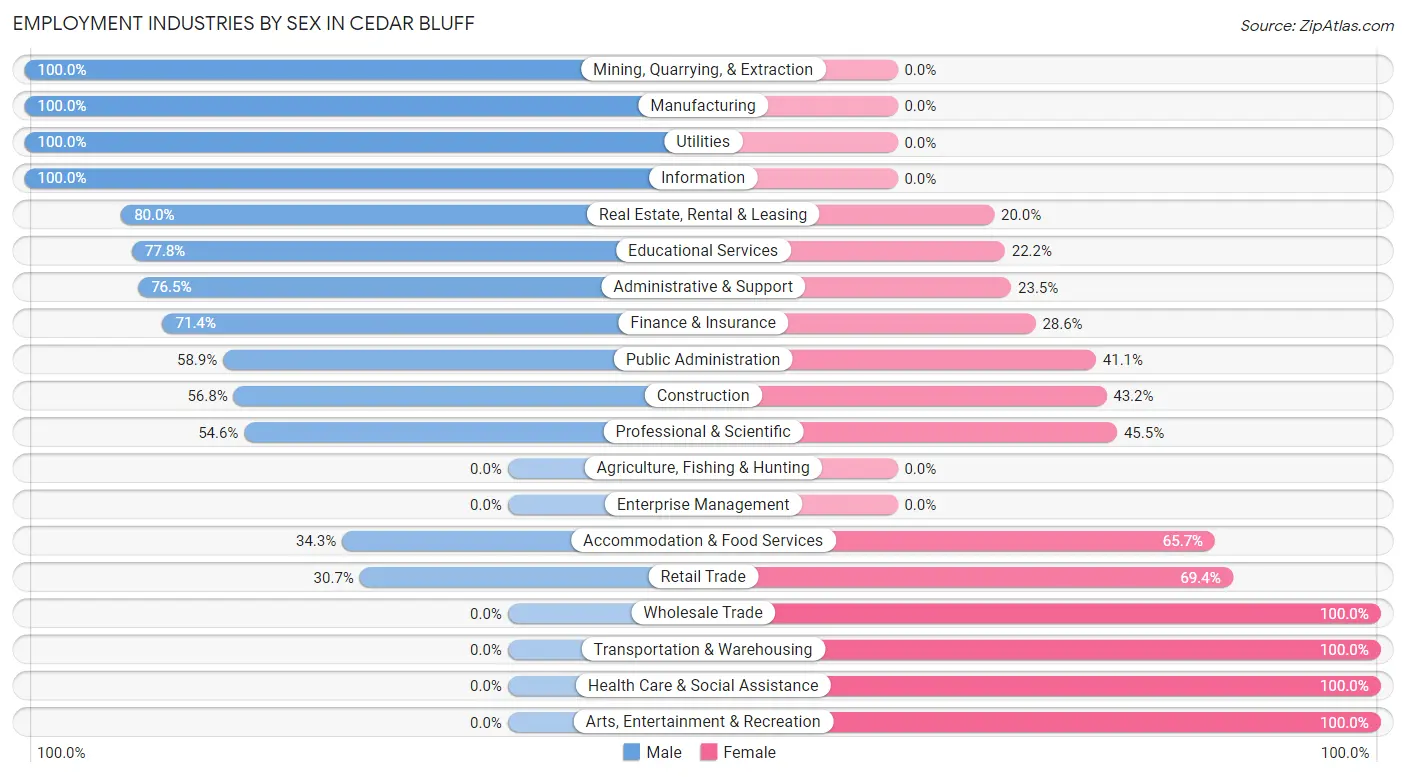
| Industry | Male | Female |
| Agriculture, Fishing & Hunting | 0 (0.0%) | 0 (0.0%) |
| Mining, Quarrying, & Extraction | 15 (100.0%) | 0 (0.0%) |
| Construction | 21 (56.8%) | 16 (43.2%) |
| Manufacturing | 30 (100.0%) | 0 (0.0%) |
| Wholesale Trade | 0 (0.0%) | 3 (100.0%) |
| Retail Trade | 19 (30.6%) | 43 (69.4%) |
| Transportation & Warehousing | 0 (0.0%) | 7 (100.0%) |
| Utilities | 7 (100.0%) | 0 (0.0%) |
| Information | 3 (100.0%) | 0 (0.0%) |
| Finance & Insurance | 10 (71.4%) | 4 (28.6%) |
| Real Estate, Rental & Leasing | 8 (80.0%) | 2 (20.0%) |
| Professional & Scientific | 6 (54.5%) | 5 (45.5%) |
| Enterprise Management | 0 (0.0%) | 0 (0.0%) |
| Administrative & Support | 26 (76.5%) | 8 (23.5%) |
| Educational Services | 28 (77.8%) | 8 (22.2%) |
| Health Care & Social Assistance | 0 (0.0%) | 40 (100.0%) |
| Arts, Entertainment & Recreation | 0 (0.0%) | 6 (100.0%) |
| Accommodation & Food Services | 12 (34.3%) | 23 (65.7%) |
| Public Administration | 33 (58.9%) | 23 (41.1%) |
| Total | 222 (52.7%) | 199 (47.3%) |
Education in Cedar Bluff
School Enrollment in Cedar Bluff
The most common levels of schooling among the 225 students in Cedar Bluff are high school (90 | 40.0%), middle school (49 | 21.8%), and elementary school (45 | 20.0%).
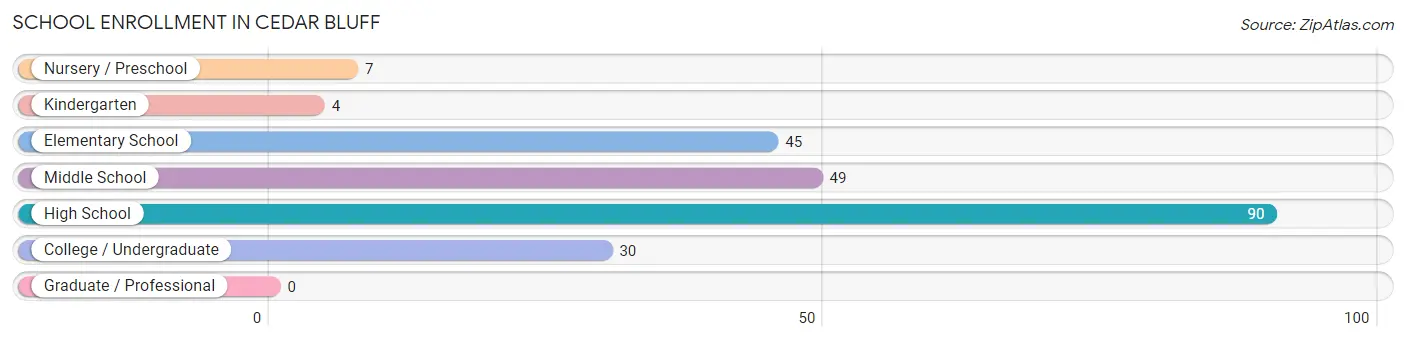
| School Level | # Students | % Students |
| Nursery / Preschool | 7 | 3.1% |
| Kindergarten | 4 | 1.8% |
| Elementary School | 45 | 20.0% |
| Middle School | 49 | 21.8% |
| High School | 90 | 40.0% |
| College / Undergraduate | 30 | 13.3% |
| Graduate / Professional | 0 | 0.0% |
| Total | 225 | 100.0% |
School Enrollment by Age by Funding Source in Cedar Bluff
Out of a total of 225 students who are enrolled in schools in Cedar Bluff, 28 (12.4%) attend a private institution, while the remaining 197 (87.6%) are enrolled in public schools. The age group of 10 to 14 year olds has the highest likelihood of being enrolled in private schools, with 15 (24.2% in the age bracket) enrolled. Conversely, the age group of 3 to 4 year olds has the lowest likelihood of being enrolled in a private school, with 7 (100.0% in the age bracket) attending a public institution.
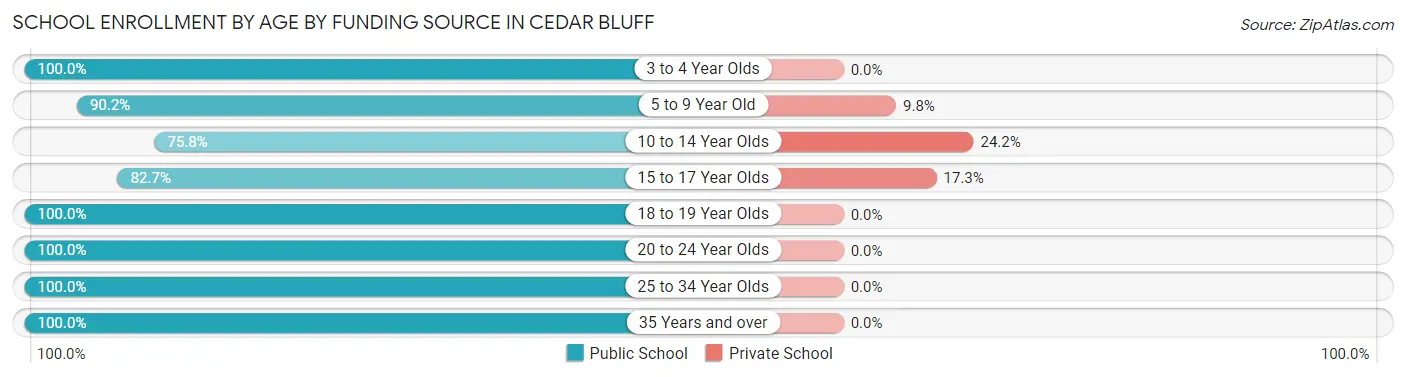
| Age Bracket | Public School | Private School |
| 3 to 4 Year Olds | 7 (100.0%) | 0 (0.0%) |
| 5 to 9 Year Old | 37 (90.2%) | 4 (9.8%) |
| 10 to 14 Year Olds | 47 (75.8%) | 15 (24.2%) |
| 15 to 17 Year Olds | 43 (82.7%) | 9 (17.3%) |
| 18 to 19 Year Olds | 27 (100.0%) | 0 (0.0%) |
| 20 to 24 Year Olds | 8 (100.0%) | 0 (0.0%) |
| 25 to 34 Year Olds | 12 (100.0%) | 0 (0.0%) |
| 35 Years and over | 16 (100.0%) | 0 (0.0%) |
| Total | 197 (87.6%) | 28 (12.4%) |
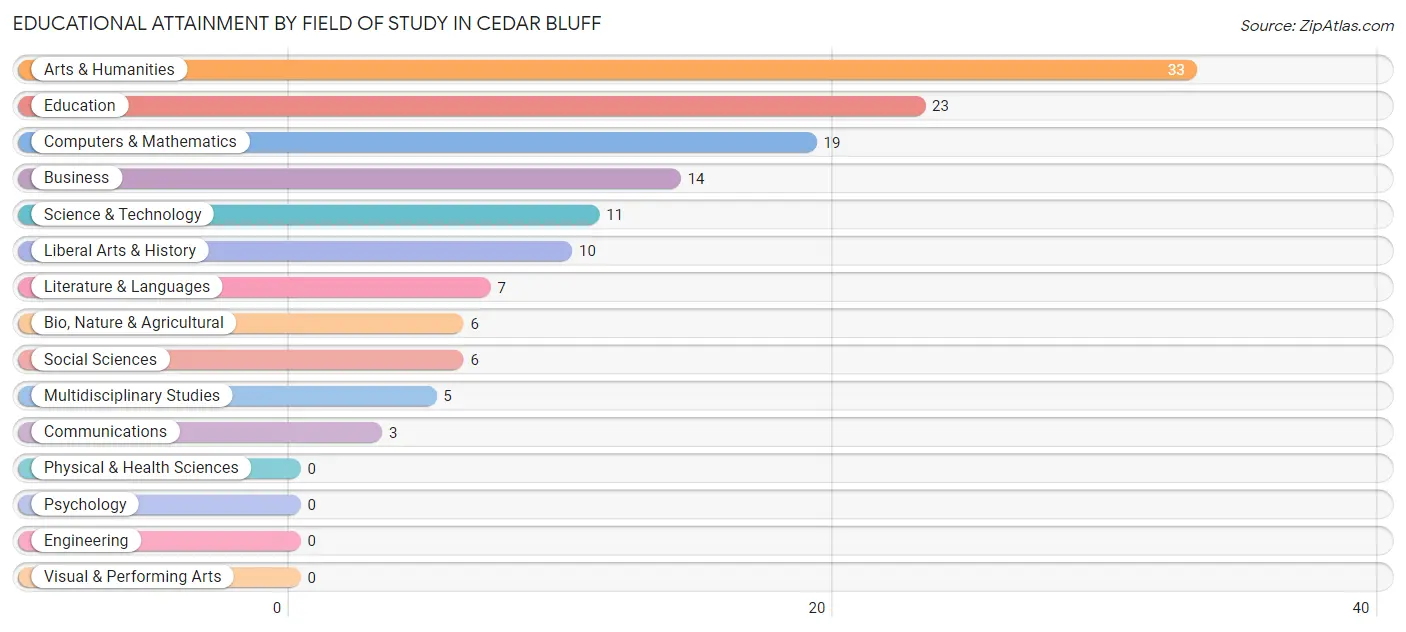
Educational Attainment by Field of Study in Cedar Bluff
Arts & humanities (33 | 24.1%), education (23 | 16.8%), computers & mathematics (19 | 13.9%), business (14 | 10.2%), and science & technology (11 | 8.0%) are the most common fields of study among 137 individuals in Cedar Bluff who have obtained a bachelor's degree or higher.
| Field of Study | # Graduates | % Graduates |
| Computers & Mathematics | 19 | 13.9% |
| Bio, Nature & Agricultural | 6 | 4.4% |
| Physical & Health Sciences | 0 | 0.0% |
| Psychology | 0 | 0.0% |
| Social Sciences | 6 | 4.4% |
| Engineering | 0 | 0.0% |
| Multidisciplinary Studies | 5 | 3.6% |
| Science & Technology | 11 | 8.0% |
| Business | 14 | 10.2% |
| Education | 23 | 16.8% |
| Literature & Languages | 7 | 5.1% |
| Liberal Arts & History | 10 | 7.3% |
| Visual & Performing Arts | 0 | 0.0% |
| Communications | 3 | 2.2% |
| Arts & Humanities | 33 | 24.1% |
| Total | 137 | 100.0% |
Transportation & Commute in Cedar Bluff
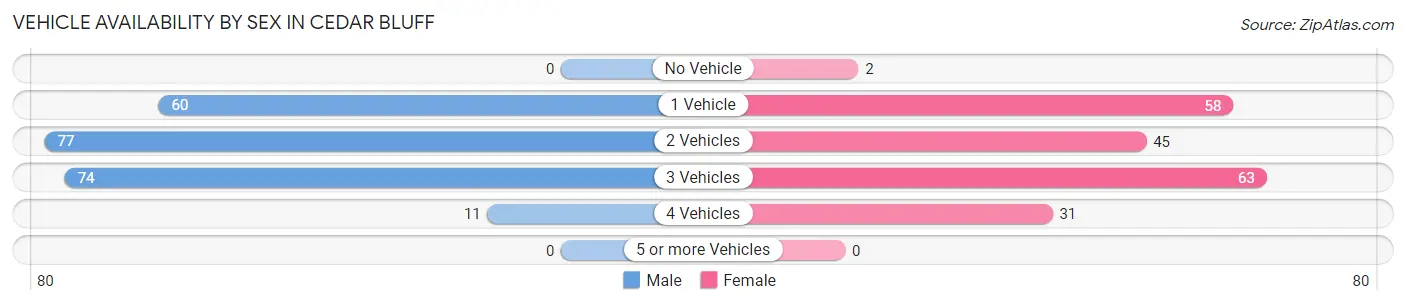
Vehicle Availability by Sex in Cedar Bluff
The most prevalent vehicle ownership categories in Cedar Bluff are males with 2 vehicles (77, accounting for 34.7%) and females with 2 vehicles (45, making up 38.7%).
| Vehicles Available | Male | Female |
| No Vehicle | 0 (0.0%) | 2 (1.0%) |
| 1 Vehicle | 60 (27.0%) | 58 (29.1%) |
| 2 Vehicles | 77 (34.7%) | 45 (22.6%) |
| 3 Vehicles | 74 (33.3%) | 63 (31.7%) |
| 4 Vehicles | 11 (5.0%) | 31 (15.6%) |
| 5 or more Vehicles | 0 (0.0%) | 0 (0.0%) |
| Total | 222 (100.0%) | 199 (100.0%) |
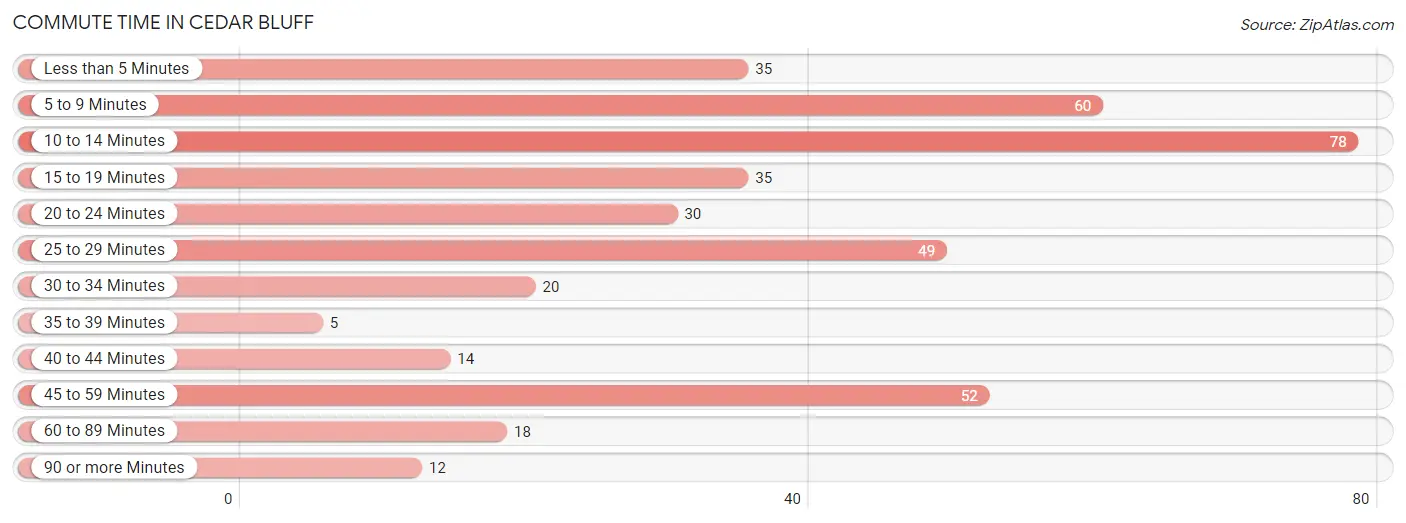
Commute Time in Cedar Bluff
The most frequently occuring commute durations in Cedar Bluff are 10 to 14 minutes (78 commuters, 19.1%), 5 to 9 minutes (60 commuters, 14.7%), and 45 to 59 minutes (52 commuters, 12.8%).
| Commute Time | # Commuters | % Commuters |
| Less than 5 Minutes | 35 | 8.6% |
| 5 to 9 Minutes | 60 | 14.7% |
| 10 to 14 Minutes | 78 | 19.1% |
| 15 to 19 Minutes | 35 | 8.6% |
| 20 to 24 Minutes | 30 | 7.3% |
| 25 to 29 Minutes | 49 | 12.0% |
| 30 to 34 Minutes | 20 | 4.9% |
| 35 to 39 Minutes | 5 | 1.2% |
| 40 to 44 Minutes | 14 | 3.4% |
| 45 to 59 Minutes | 52 | 12.8% |
| 60 to 89 Minutes | 18 | 4.4% |
| 90 or more Minutes | 12 | 2.9% |
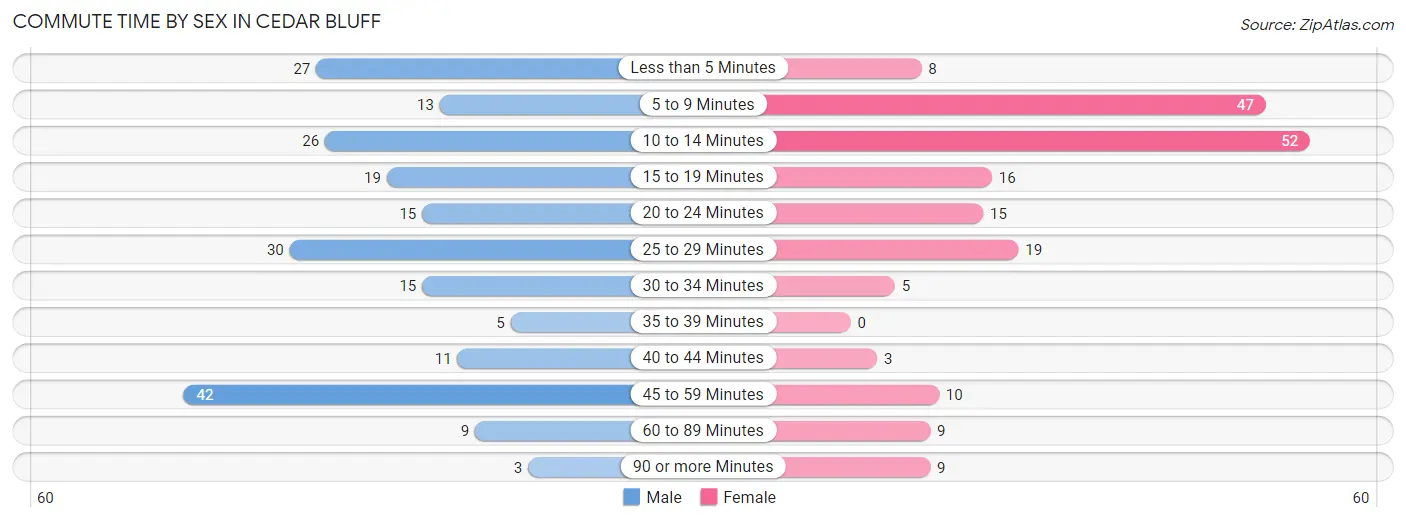
Commute Time by Sex in Cedar Bluff
The most common commute times in Cedar Bluff are 45 to 59 minutes (42 commuters, 19.5%) for males and 10 to 14 minutes (52 commuters, 26.9%) for females.
| Commute Time | Male | Female |
| Less than 5 Minutes | 27 (12.6%) | 8 (4.2%) |
| 5 to 9 Minutes | 13 (6.0%) | 47 (24.3%) |
| 10 to 14 Minutes | 26 (12.1%) | 52 (26.9%) |
| 15 to 19 Minutes | 19 (8.8%) | 16 (8.3%) |
| 20 to 24 Minutes | 15 (7.0%) | 15 (7.8%) |
| 25 to 29 Minutes | 30 (14.0%) | 19 (9.8%) |
| 30 to 34 Minutes | 15 (7.0%) | 5 (2.6%) |
| 35 to 39 Minutes | 5 (2.3%) | 0 (0.0%) |
| 40 to 44 Minutes | 11 (5.1%) | 3 (1.5%) |
| 45 to 59 Minutes | 42 (19.5%) | 10 (5.2%) |
| 60 to 89 Minutes | 9 (4.2%) | 9 (4.7%) |
| 90 or more Minutes | 3 (1.4%) | 9 (4.7%) |
Time of Departure to Work by Sex in Cedar Bluff
The most frequent times of departure to work in Cedar Bluff are 8:00 AM to 8:29 AM (41, 19.1%) for males and 8:00 AM to 8:29 AM (55, 28.5%) for females.
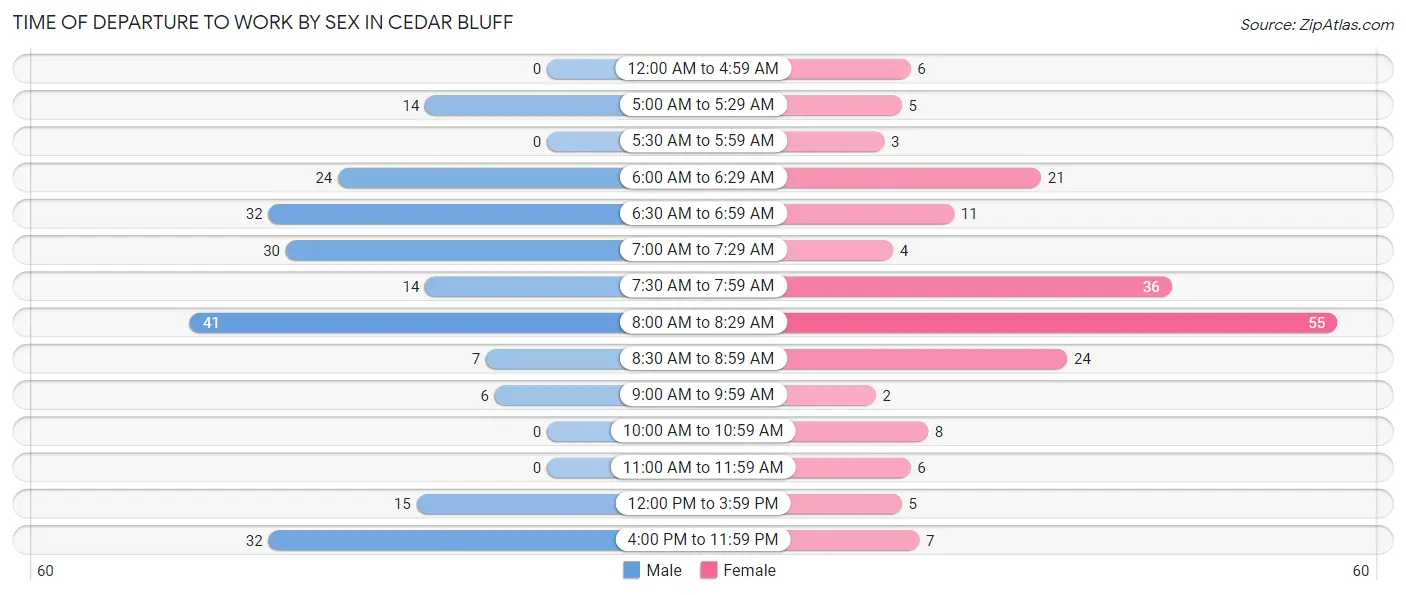
| Time of Departure | Male | Female |
| 12:00 AM to 4:59 AM | 0 (0.0%) | 6 (3.1%) |
| 5:00 AM to 5:29 AM | 14 (6.5%) | 5 (2.6%) |
| 5:30 AM to 5:59 AM | 0 (0.0%) | 3 (1.5%) |
| 6:00 AM to 6:29 AM | 24 (11.2%) | 21 (10.9%) |
| 6:30 AM to 6:59 AM | 32 (14.9%) | 11 (5.7%) |
| 7:00 AM to 7:29 AM | 30 (14.0%) | 4 (2.1%) |
| 7:30 AM to 7:59 AM | 14 (6.5%) | 36 (18.6%) |
| 8:00 AM to 8:29 AM | 41 (19.1%) | 55 (28.5%) |
| 8:30 AM to 8:59 AM | 7 (3.3%) | 24 (12.4%) |
| 9:00 AM to 9:59 AM | 6 (2.8%) | 2 (1.0%) |
| 10:00 AM to 10:59 AM | 0 (0.0%) | 8 (4.2%) |
| 11:00 AM to 11:59 AM | 0 (0.0%) | 6 (3.1%) |
| 12:00 PM to 3:59 PM | 15 (7.0%) | 5 (2.6%) |
| 4:00 PM to 11:59 PM | 32 (14.9%) | 7 (3.6%) |
| Total | 215 (100.0%) | 193 (100.0%) |
Housing Occupancy in Cedar Bluff
Occupancy by Ownership in Cedar Bluff
Of the total 541 dwellings in Cedar Bluff, owner-occupied units account for 353 (65.2%), while renter-occupied units make up 188 (34.7%).
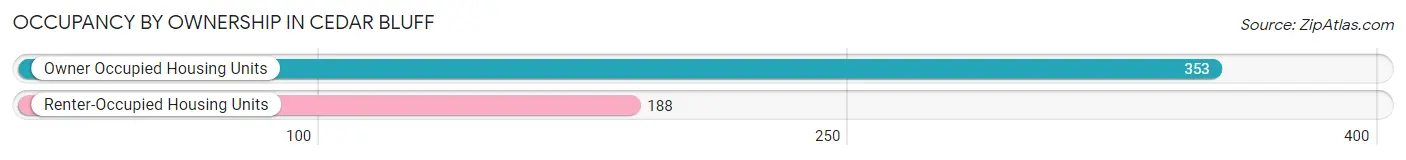
| Occupancy | # Housing Units | % Housing Units |
| Owner Occupied Housing Units | 353 | 65.2% |
| Renter-Occupied Housing Units | 188 | 34.7% |
| Total Occupied Housing Units | 541 | 100.0% |
Occupancy by Household Size in Cedar Bluff
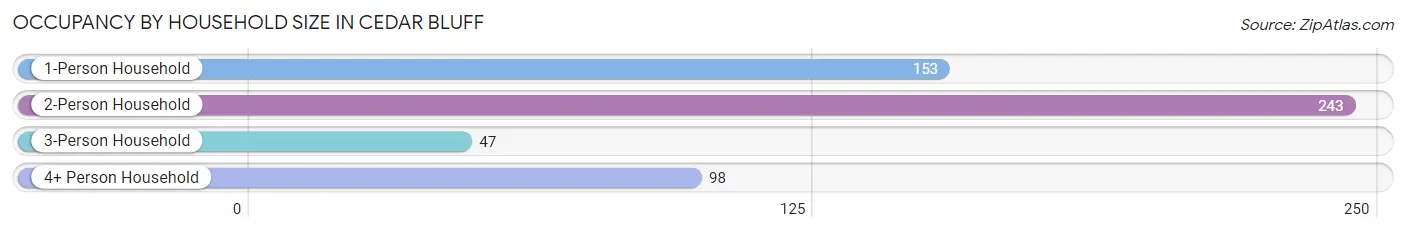
| Household Size | # Housing Units | % Housing Units |
| 1-Person Household | 153 | 28.3% |
| 2-Person Household | 243 | 44.9% |
| 3-Person Household | 47 | 8.7% |
| 4+ Person Household | 98 | 18.1% |
| Total Housing Units | 541 | 100.0% |
Occupancy by Ownership by Household Size in Cedar Bluff
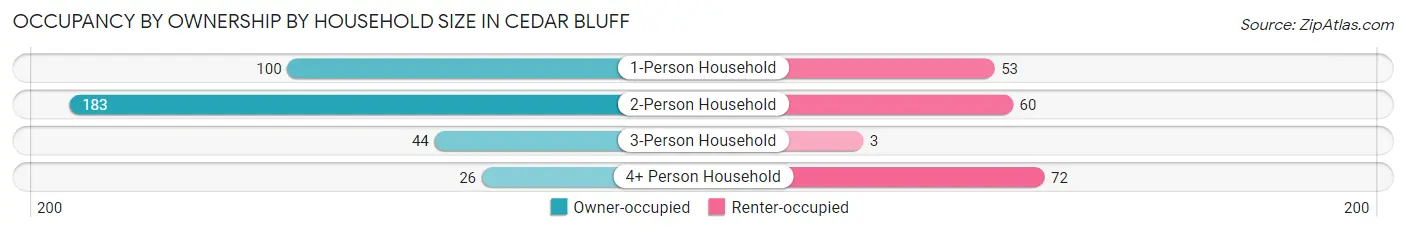
| Household Size | Owner-occupied | Renter-occupied |
| 1-Person Household | 100 (65.4%) | 53 (34.6%) |
| 2-Person Household | 183 (75.3%) | 60 (24.7%) |
| 3-Person Household | 44 (93.6%) | 3 (6.4%) |
| 4+ Person Household | 26 (26.5%) | 72 (73.5%) |
| Total Housing Units | 353 (65.2%) | 188 (34.7%) |
Occupancy by Educational Attainment in Cedar Bluff
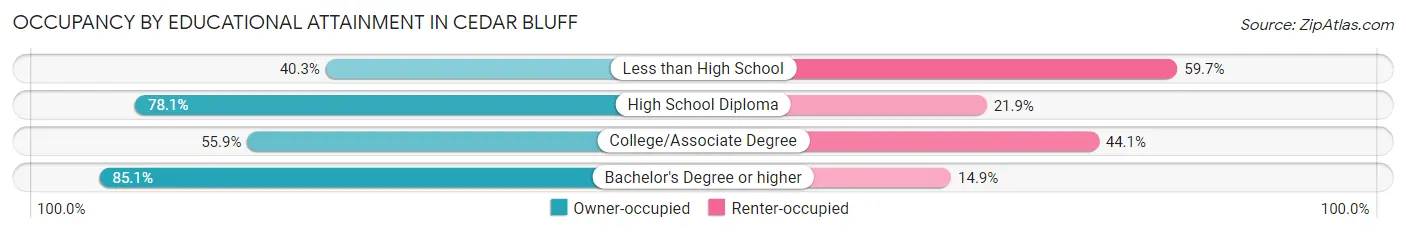
| Household Size | Owner-occupied | Renter-occupied |
| Less than High School | 27 (40.3%) | 40 (59.7%) |
| High School Diploma | 139 (78.1%) | 39 (21.9%) |
| College/Associate Degree | 124 (55.9%) | 98 (44.1%) |
| Bachelor's Degree or higher | 63 (85.1%) | 11 (14.9%) |
Occupancy by Age of Householder in Cedar Bluff
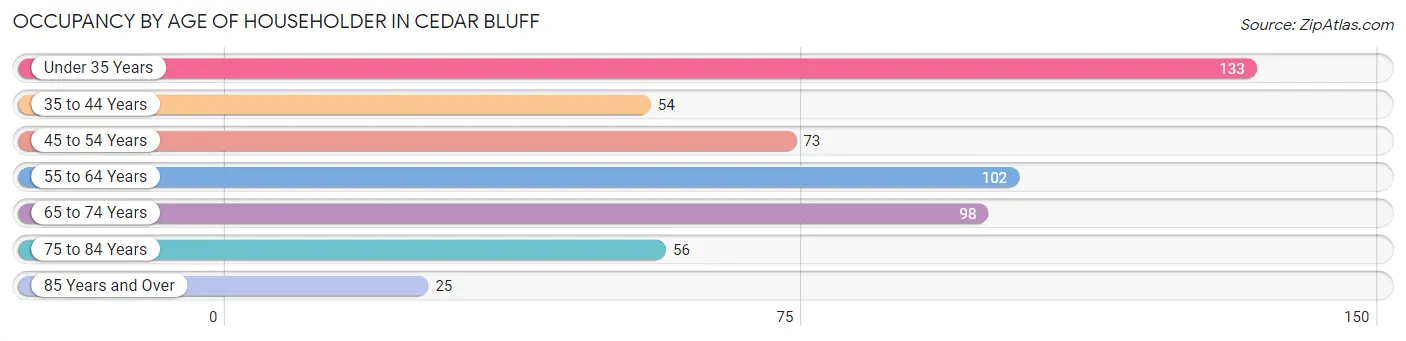
| Age Bracket | # Households | % Households |
| Under 35 Years | 133 | 24.6% |
| 35 to 44 Years | 54 | 10.0% |
| 45 to 54 Years | 73 | 13.5% |
| 55 to 64 Years | 102 | 18.9% |
| 65 to 74 Years | 98 | 18.1% |
| 75 to 84 Years | 56 | 10.3% |
| 85 Years and Over | 25 | 4.6% |
| Total | 541 | 100.0% |
Housing Finances in Cedar Bluff
Median Income by Occupancy in Cedar Bluff
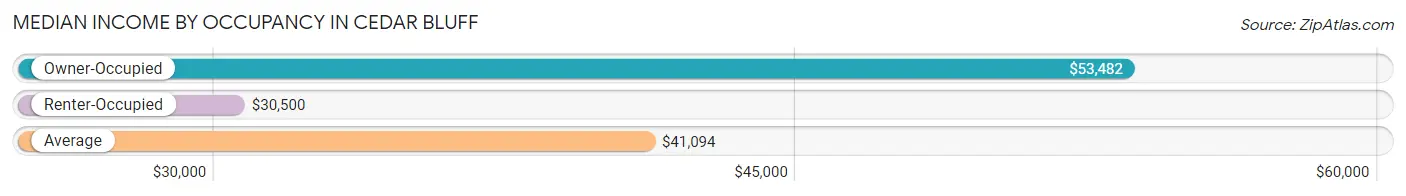
| Occupancy Type | # Households | Median Income |
| Owner-Occupied | 353 (65.2%) | $53,482 |
| Renter-Occupied | 188 (34.7%) | $30,500 |
| Average | 541 (100.0%) | $41,094 |
Occupancy by Householder Income Bracket in Cedar Bluff
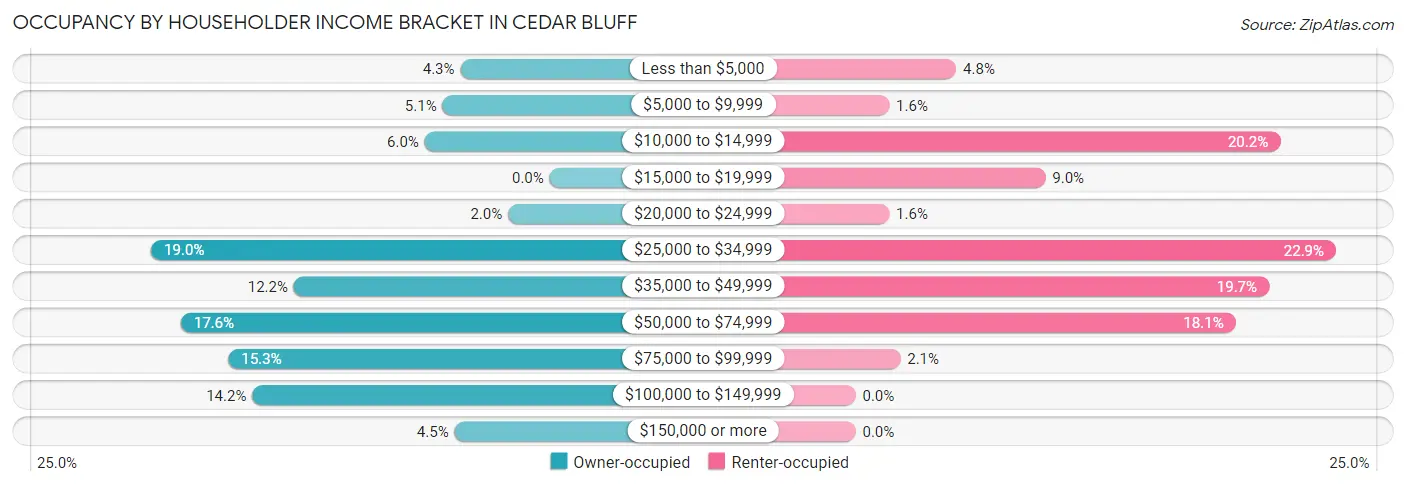
| Income Bracket | Owner-occupied | Renter-occupied |
| Less than $5,000 | 15 (4.3%) | 9 (4.8%) |
| $5,000 to $9,999 | 18 (5.1%) | 3 (1.6%) |
| $10,000 to $14,999 | 21 (5.9%) | 38 (20.2%) |
| $15,000 to $19,999 | 0 (0.0%) | 17 (9.0%) |
| $20,000 to $24,999 | 7 (2.0%) | 3 (1.6%) |
| $25,000 to $34,999 | 67 (19.0%) | 43 (22.9%) |
| $35,000 to $49,999 | 43 (12.2%) | 37 (19.7%) |
| $50,000 to $74,999 | 62 (17.6%) | 34 (18.1%) |
| $75,000 to $99,999 | 54 (15.3%) | 4 (2.1%) |
| $100,000 to $149,999 | 50 (14.2%) | 0 (0.0%) |
| $150,000 or more | 16 (4.5%) | 0 (0.0%) |
| Total | 353 (100.0%) | 188 (100.0%) |
Monthly Housing Cost Tiers in Cedar Bluff
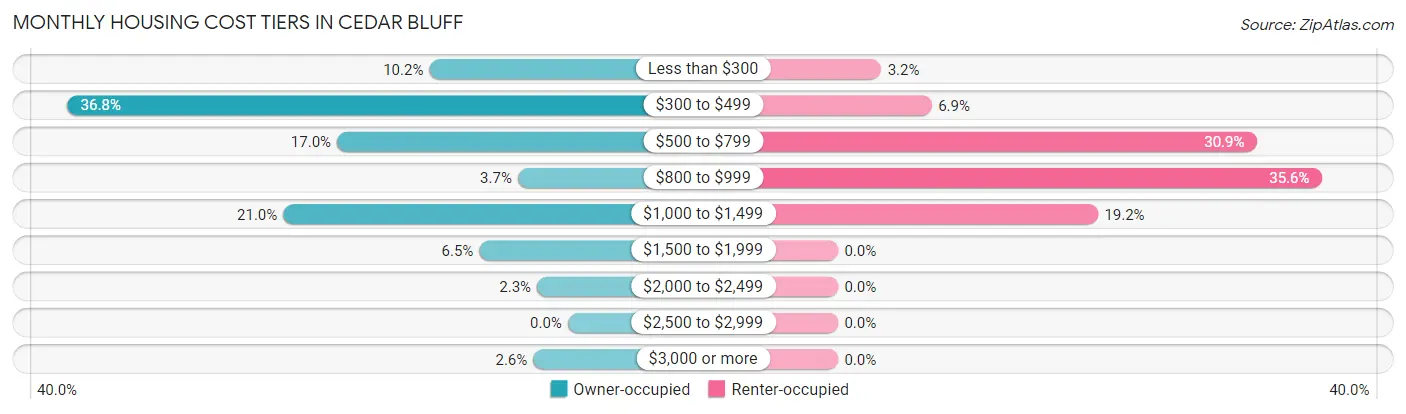
| Monthly Cost | Owner-occupied | Renter-occupied |
| Less than $300 | 36 (10.2%) | 6 (3.2%) |
| $300 to $499 | 130 (36.8%) | 13 (6.9%) |
| $500 to $799 | 60 (17.0%) | 58 (30.8%) |
| $800 to $999 | 13 (3.7%) | 67 (35.6%) |
| $1,000 to $1,499 | 74 (21.0%) | 36 (19.2%) |
| $1,500 to $1,999 | 23 (6.5%) | 0 (0.0%) |
| $2,000 to $2,499 | 8 (2.3%) | 0 (0.0%) |
| $2,500 to $2,999 | 0 (0.0%) | 0 (0.0%) |
| $3,000 or more | 9 (2.5%) | 0 (0.0%) |
| Total | 353 (100.0%) | 188 (100.0%) |
Physical Housing Characteristics in Cedar Bluff
Housing Structures in Cedar Bluff
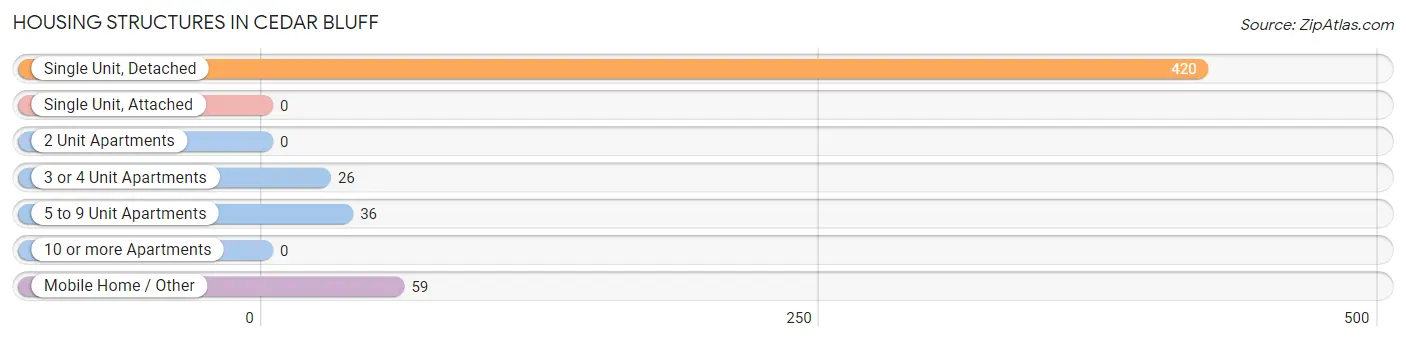
| Structure Type | # Housing Units | % Housing Units |
| Single Unit, Detached | 420 | 77.6% |
| Single Unit, Attached | 0 | 0.0% |
| 2 Unit Apartments | 0 | 0.0% |
| 3 or 4 Unit Apartments | 26 | 4.8% |
| 5 to 9 Unit Apartments | 36 | 6.7% |
| 10 or more Apartments | 0 | 0.0% |
| Mobile Home / Other | 59 | 10.9% |
| Total | 541 | 100.0% |
Housing Structures by Occupancy in Cedar Bluff
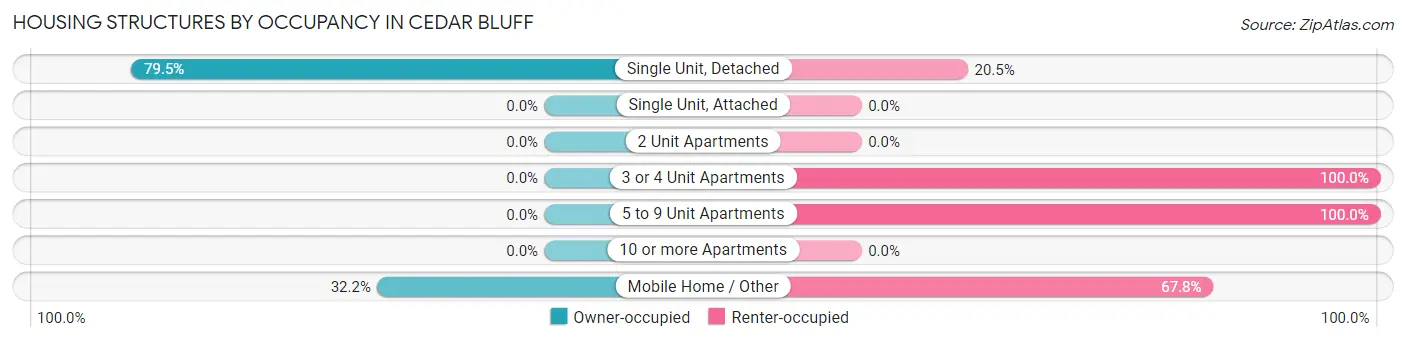
| Structure Type | Owner-occupied | Renter-occupied |
| Single Unit, Detached | 334 (79.5%) | 86 (20.5%) |
| Single Unit, Attached | 0 (0.0%) | 0 (0.0%) |
| 2 Unit Apartments | 0 (0.0%) | 0 (0.0%) |
| 3 or 4 Unit Apartments | 0 (0.0%) | 26 (100.0%) |
| 5 to 9 Unit Apartments | 0 (0.0%) | 36 (100.0%) |
| 10 or more Apartments | 0 (0.0%) | 0 (0.0%) |
| Mobile Home / Other | 19 (32.2%) | 40 (67.8%) |
| Total | 353 (65.2%) | 188 (34.7%) |
Housing Structures by Number of Rooms in Cedar Bluff
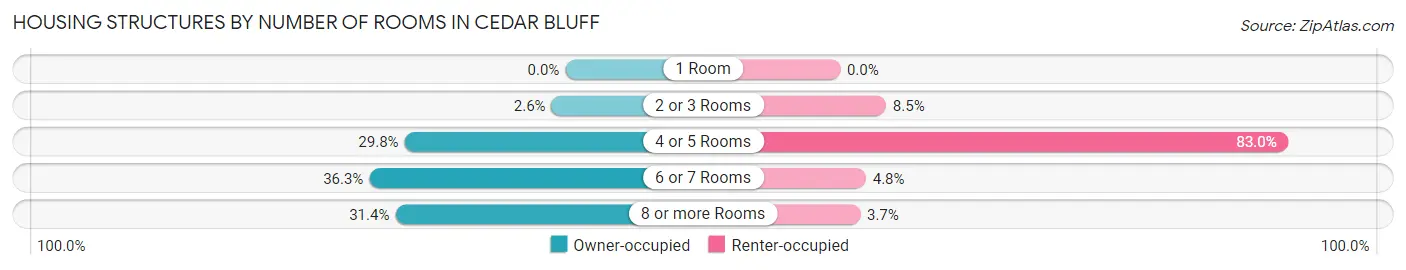
| Number of Rooms | Owner-occupied | Renter-occupied |
| 1 Room | 0 (0.0%) | 0 (0.0%) |
| 2 or 3 Rooms | 9 (2.5%) | 16 (8.5%) |
| 4 or 5 Rooms | 105 (29.7%) | 156 (83.0%) |
| 6 or 7 Rooms | 128 (36.3%) | 9 (4.8%) |
| 8 or more Rooms | 111 (31.4%) | 7 (3.7%) |
| Total | 353 (100.0%) | 188 (100.0%) |
Housing Structure by Heating Type in Cedar Bluff
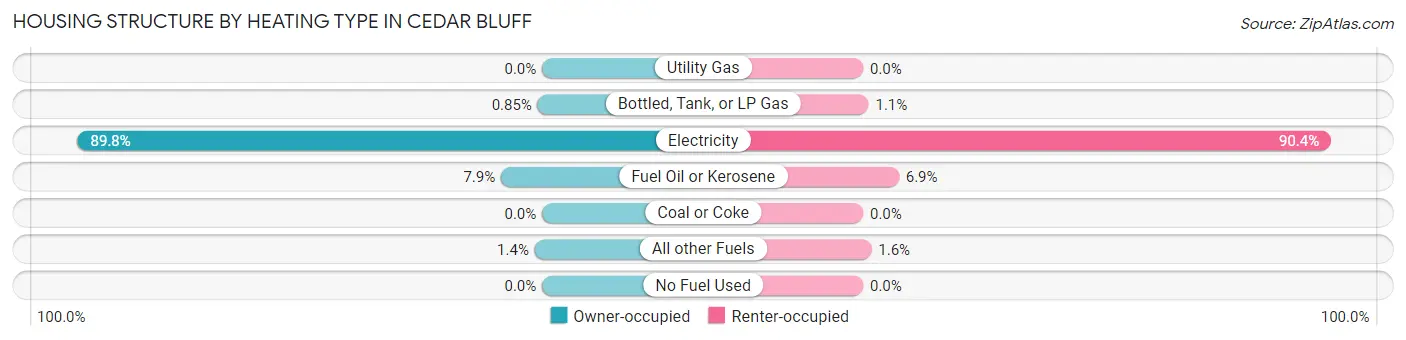
| Heating Type | Owner-occupied | Renter-occupied |
| Utility Gas | 0 (0.0%) | 0 (0.0%) |
| Bottled, Tank, or LP Gas | 3 (0.9%) | 2 (1.1%) |
| Electricity | 317 (89.8%) | 170 (90.4%) |
| Fuel Oil or Kerosene | 28 (7.9%) | 13 (6.9%) |
| Coal or Coke | 0 (0.0%) | 0 (0.0%) |
| All other Fuels | 5 (1.4%) | 3 (1.6%) |
| No Fuel Used | 0 (0.0%) | 0 (0.0%) |
| Total | 353 (100.0%) | 188 (100.0%) |
Household Vehicle Usage in Cedar Bluff
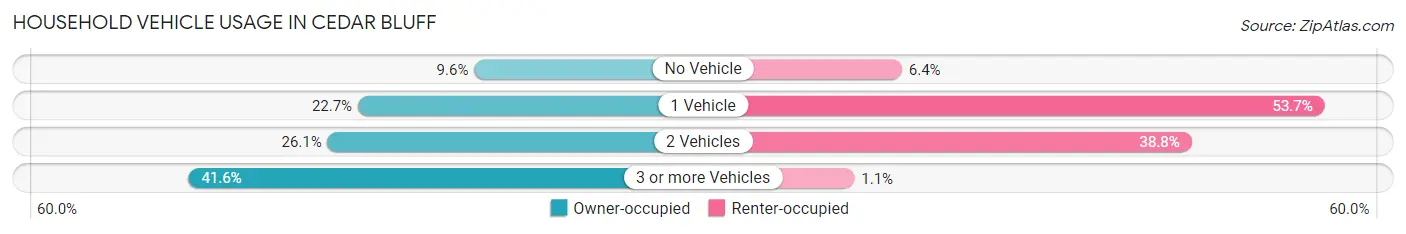
| Vehicles per Household | Owner-occupied | Renter-occupied |
| No Vehicle | 34 (9.6%) | 12 (6.4%) |
| 1 Vehicle | 80 (22.7%) | 101 (53.7%) |
| 2 Vehicles | 92 (26.1%) | 73 (38.8%) |
| 3 or more Vehicles | 147 (41.6%) | 2 (1.1%) |
| Total | 353 (100.0%) | 188 (100.0%) |
Real Estate & Mortgages in Cedar Bluff
Real Estate and Mortgage Overview in Cedar Bluff
| Characteristic | Without Mortgage | With Mortgage |
| Housing Units | 235 | 118 |
| Median Property Value | $114,700 | $176,600 |
| Median Household Income | $34,306 | $13 |
| Monthly Housing Costs | $434 | $9 |
| Real Estate Taxes | $698 | $5 |
Property Value by Mortgage Status in Cedar Bluff
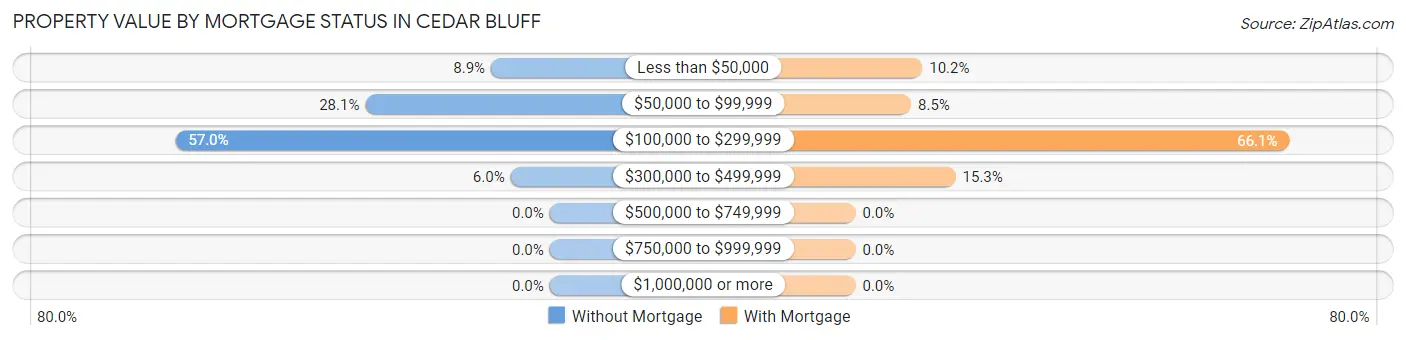
| Property Value | Without Mortgage | With Mortgage |
| Less than $50,000 | 21 (8.9%) | 12 (10.2%) |
| $50,000 to $99,999 | 66 (28.1%) | 10 (8.5%) |
| $100,000 to $299,999 | 134 (57.0%) | 78 (66.1%) |
| $300,000 to $499,999 | 14 (6.0%) | 18 (15.2%) |
| $500,000 to $749,999 | 0 (0.0%) | 0 (0.0%) |
| $750,000 to $999,999 | 0 (0.0%) | 0 (0.0%) |
| $1,000,000 or more | 0 (0.0%) | 0 (0.0%) |
| Total | 235 (100.0%) | 118 (100.0%) |
Household Income by Mortgage Status in Cedar Bluff
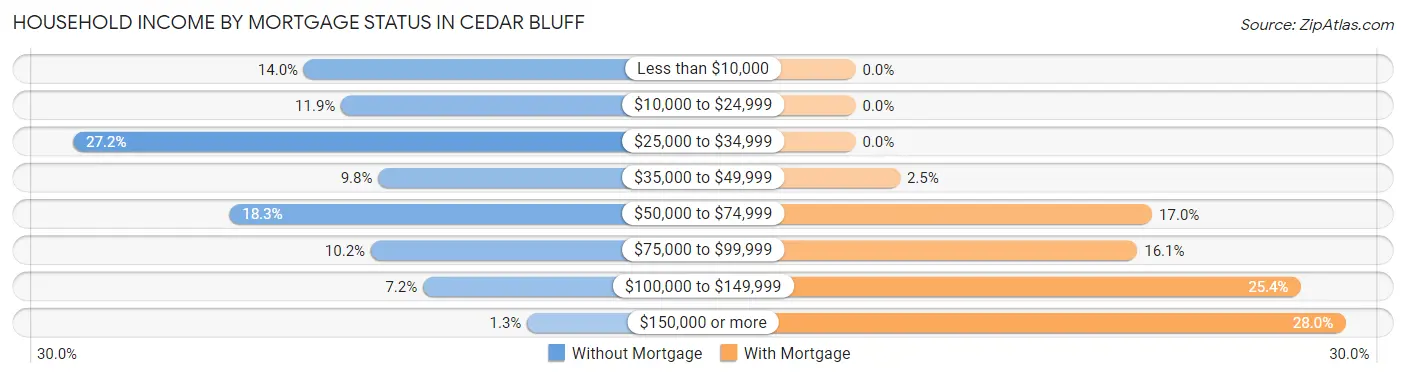
| Household Income | Without Mortgage | With Mortgage |
| Less than $10,000 | 33 (14.0%) | 0 (0.0%) |
| $10,000 to $24,999 | 28 (11.9%) | 0 (0.0%) |
| $25,000 to $34,999 | 64 (27.2%) | 0 (0.0%) |
| $35,000 to $49,999 | 23 (9.8%) | 3 (2.5%) |
| $50,000 to $74,999 | 43 (18.3%) | 20 (17.0%) |
| $75,000 to $99,999 | 24 (10.2%) | 19 (16.1%) |
| $100,000 to $149,999 | 17 (7.2%) | 30 (25.4%) |
| $150,000 or more | 3 (1.3%) | 33 (28.0%) |
| Total | 235 (100.0%) | 118 (100.0%) |
Property Value to Household Income Ratio in Cedar Bluff
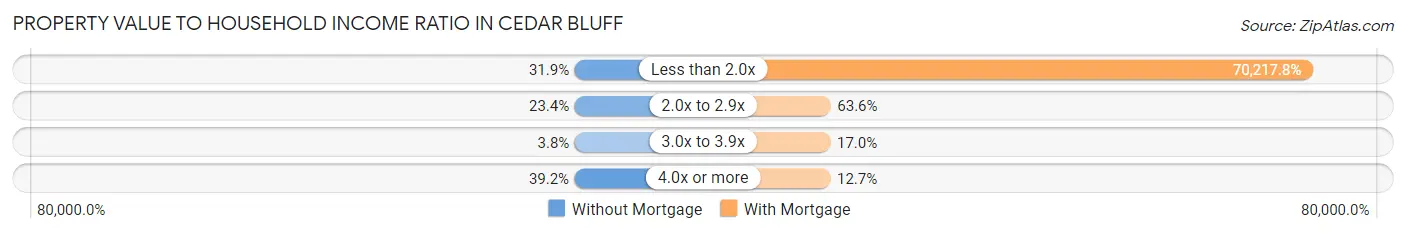
| Value-to-Income Ratio | Without Mortgage | With Mortgage |
| Less than 2.0x | 75 (31.9%) | 82,857 (70,217.8%) |
| 2.0x to 2.9x | 55 (23.4%) | 75 (63.6%) |
| 3.0x to 3.9x | 9 (3.8%) | 20 (17.0%) |
| 4.0x or more | 92 (39.2%) | 15 (12.7%) |
| Total | 235 (100.0%) | 118 (100.0%) |
Real Estate Taxes by Mortgage Status in Cedar Bluff
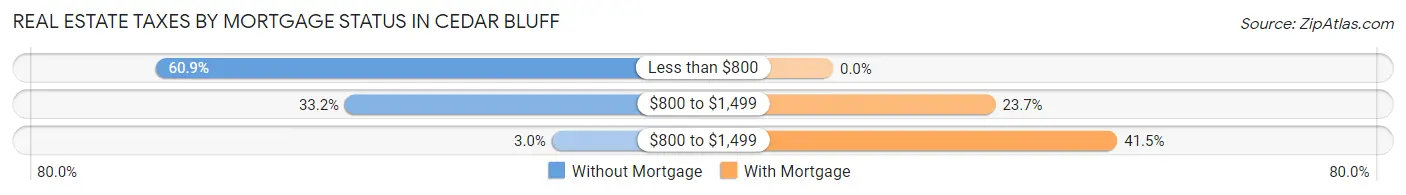
| Property Taxes | Without Mortgage | With Mortgage |
| Less than $800 | 143 (60.9%) | 0 (0.0%) |
| $800 to $1,499 | 78 (33.2%) | 28 (23.7%) |
| $800 to $1,499 | 7 (3.0%) | 49 (41.5%) |
| Total | 235 (100.0%) | 118 (100.0%) |
Health & Disability in Cedar Bluff
Health Insurance Coverage by Age in Cedar Bluff
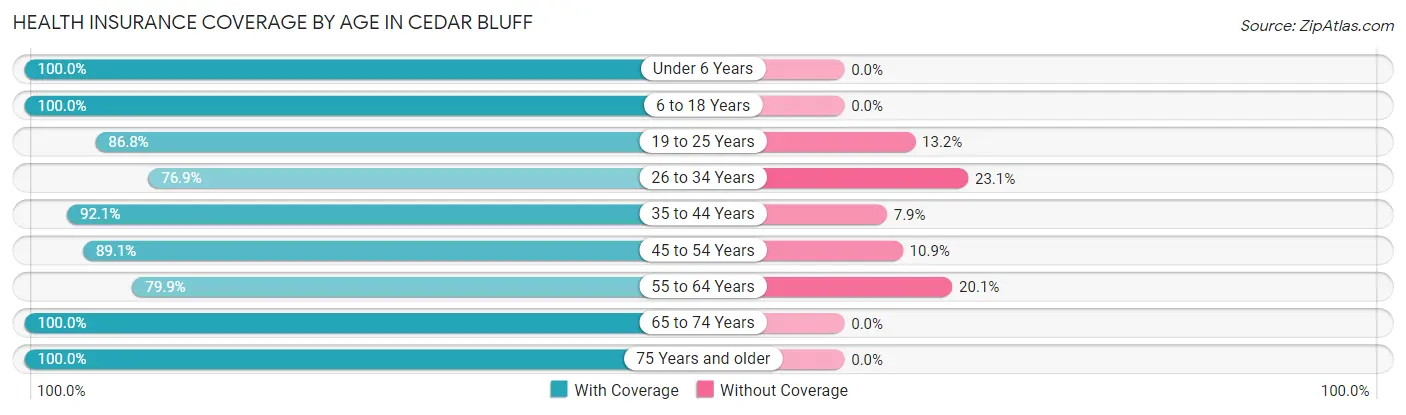
| Age Bracket | With Coverage | Without Coverage |
| Under 6 Years | 41 (100.0%) | 0 (0.0%) |
| 6 to 18 Years | 182 (100.0%) | 0 (0.0%) |
| 19 to 25 Years | 46 (86.8%) | 7 (13.2%) |
| 26 to 34 Years | 150 (76.9%) | 45 (23.1%) |
| 35 to 44 Years | 93 (92.1%) | 8 (7.9%) |
| 45 to 54 Years | 172 (89.1%) | 21 (10.9%) |
| 55 to 64 Years | 151 (79.9%) | 38 (20.1%) |
| 65 to 74 Years | 158 (100.0%) | 0 (0.0%) |
| 75 Years and older | 98 (100.0%) | 0 (0.0%) |
| Total | 1,091 (90.2%) | 119 (9.8%) |
Health Insurance Coverage by Citizenship Status in Cedar Bluff
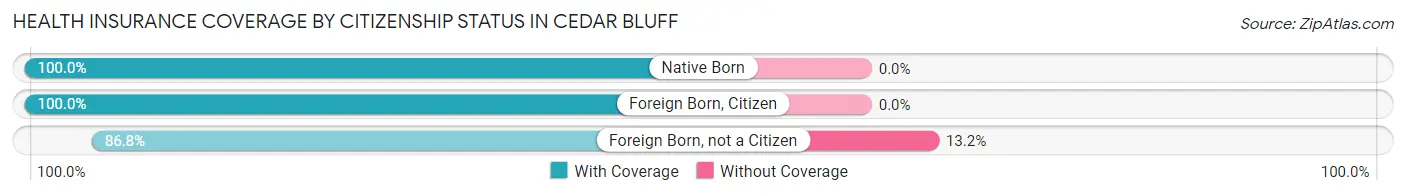
| Citizenship Status | With Coverage | Without Coverage |
| Native Born | 41 (100.0%) | 0 (0.0%) |
| Foreign Born, Citizen | 182 (100.0%) | 0 (0.0%) |
| Foreign Born, not a Citizen | 46 (86.8%) | 7 (13.2%) |
Health Insurance Coverage by Household Income in Cedar Bluff
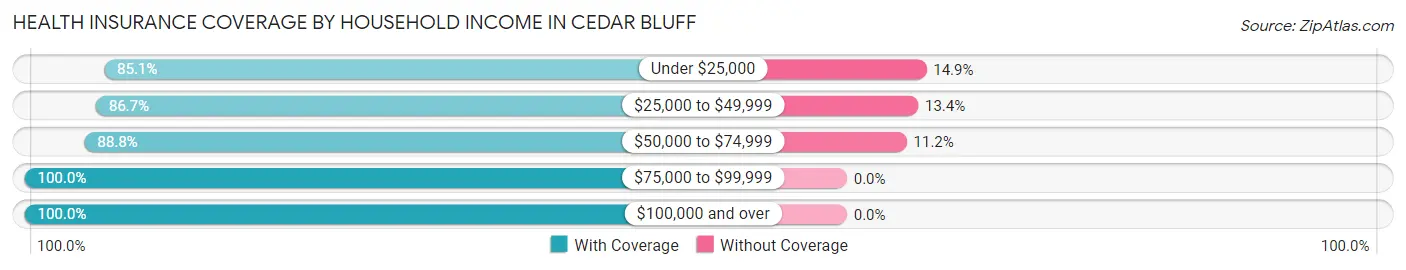
| Household Income | With Coverage | Without Coverage |
| Under $25,000 | 217 (85.1%) | 38 (14.9%) |
| $25,000 to $49,999 | 370 (86.7%) | 57 (13.4%) |
| $50,000 to $74,999 | 190 (88.8%) | 24 (11.2%) |
| $75,000 to $99,999 | 161 (100.0%) | 0 (0.0%) |
| $100,000 and over | 153 (100.0%) | 0 (0.0%) |
Public vs Private Health Insurance Coverage by Age in Cedar Bluff
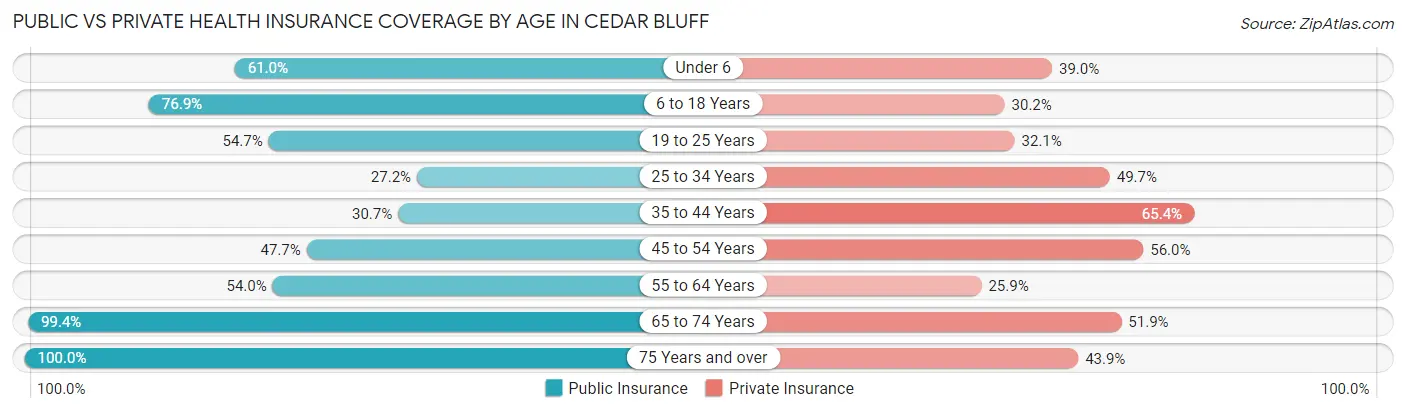
| Age Bracket | Public Insurance | Private Insurance |
| Under 6 | 25 (61.0%) | 16 (39.0%) |
| 6 to 18 Years | 140 (76.9%) | 55 (30.2%) |
| 19 to 25 Years | 29 (54.7%) | 17 (32.1%) |
| 25 to 34 Years | 53 (27.2%) | 97 (49.7%) |
| 35 to 44 Years | 31 (30.7%) | 66 (65.3%) |
| 45 to 54 Years | 92 (47.7%) | 108 (56.0%) |
| 55 to 64 Years | 102 (54.0%) | 49 (25.9%) |
| 65 to 74 Years | 157 (99.4%) | 82 (51.9%) |
| 75 Years and over | 98 (100.0%) | 43 (43.9%) |
| Total | 727 (60.1%) | 533 (44.1%) |
Disability Status by Sex by Age in Cedar Bluff
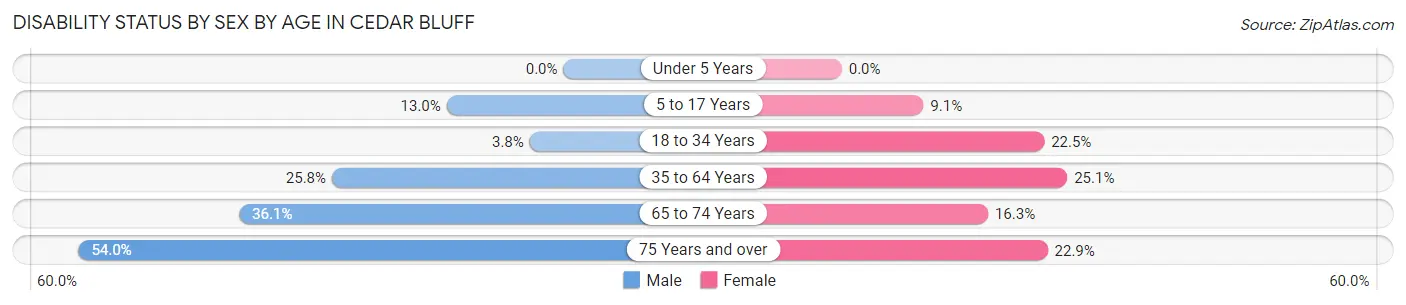
| Age Bracket | Male | Female |
| Under 5 Years | 0 (0.0%) | 0 (0.0%) |
| 5 to 17 Years | 13 (13.0%) | 5 (9.1%) |
| 18 to 34 Years | 5 (3.8%) | 32 (22.5%) |
| 35 to 64 Years | 66 (25.8%) | 57 (25.1%) |
| 65 to 74 Years | 26 (36.1%) | 14 (16.3%) |
| 75 Years and over | 27 (54.0%) | 11 (22.9%) |
Disability Class by Sex by Age in Cedar Bluff
Disability Class: Hearing Difficulty
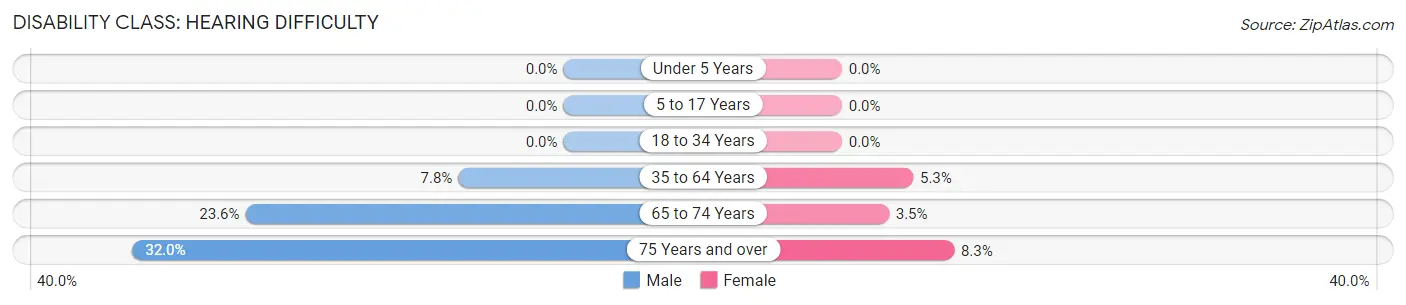
| Age Bracket | Male | Female |
| Under 5 Years | 0 (0.0%) | 0 (0.0%) |
| 5 to 17 Years | 0 (0.0%) | 0 (0.0%) |
| 18 to 34 Years | 0 (0.0%) | 0 (0.0%) |
| 35 to 64 Years | 20 (7.8%) | 12 (5.3%) |
| 65 to 74 Years | 17 (23.6%) | 3 (3.5%) |
| 75 Years and over | 16 (32.0%) | 4 (8.3%) |
Disability Class: Vision Difficulty
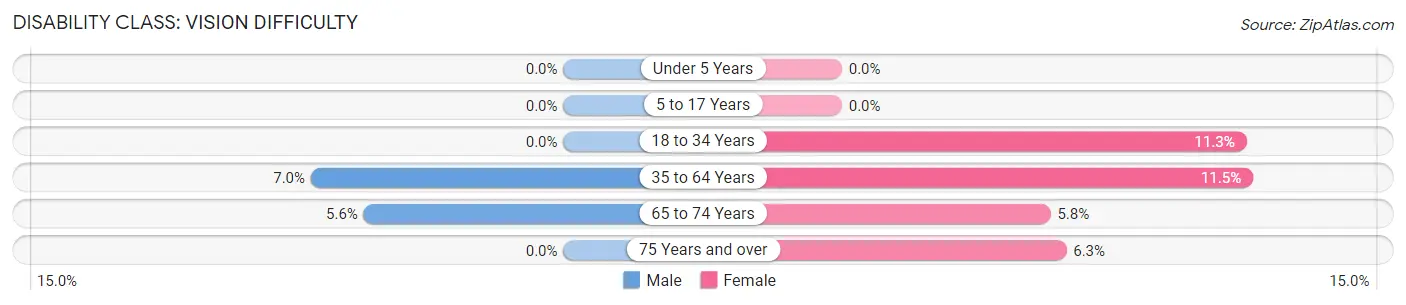
| Age Bracket | Male | Female |
| Under 5 Years | 0 (0.0%) | 0 (0.0%) |
| 5 to 17 Years | 0 (0.0%) | 0 (0.0%) |
| 18 to 34 Years | 0 (0.0%) | 16 (11.3%) |
| 35 to 64 Years | 18 (7.0%) | 26 (11.5%) |
| 65 to 74 Years | 4 (5.6%) | 5 (5.8%) |
| 75 Years and over | 0 (0.0%) | 3 (6.2%) |
Disability Class: Cognitive Difficulty
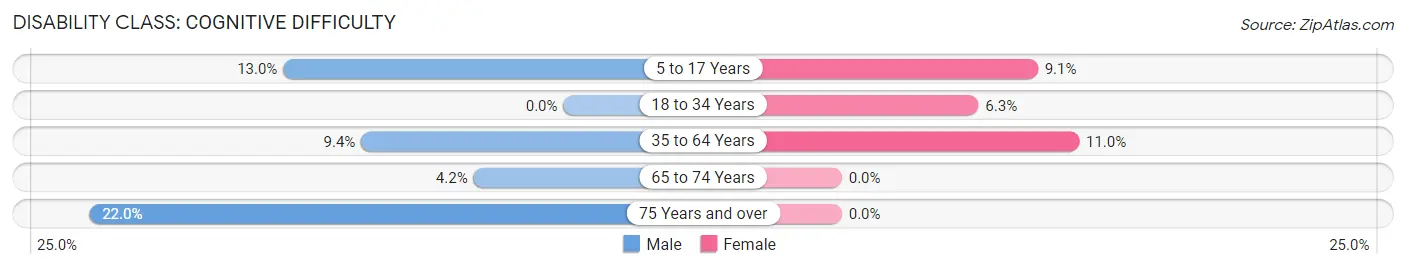
| Age Bracket | Male | Female |
| 5 to 17 Years | 13 (13.0%) | 5 (9.1%) |
| 18 to 34 Years | 0 (0.0%) | 9 (6.3%) |
| 35 to 64 Years | 24 (9.4%) | 25 (11.0%) |
| 65 to 74 Years | 3 (4.2%) | 0 (0.0%) |
| 75 Years and over | 11 (22.0%) | 0 (0.0%) |
Disability Class: Ambulatory Difficulty
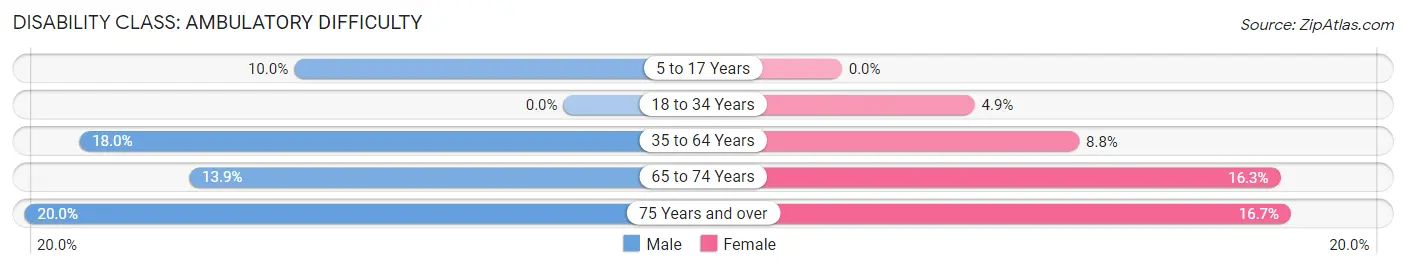
| Age Bracket | Male | Female |
| 5 to 17 Years | 10 (10.0%) | 0 (0.0%) |
| 18 to 34 Years | 0 (0.0%) | 7 (4.9%) |
| 35 to 64 Years | 46 (18.0%) | 20 (8.8%) |
| 65 to 74 Years | 10 (13.9%) | 14 (16.3%) |
| 75 Years and over | 10 (20.0%) | 8 (16.7%) |
Disability Class: Self-Care Difficulty
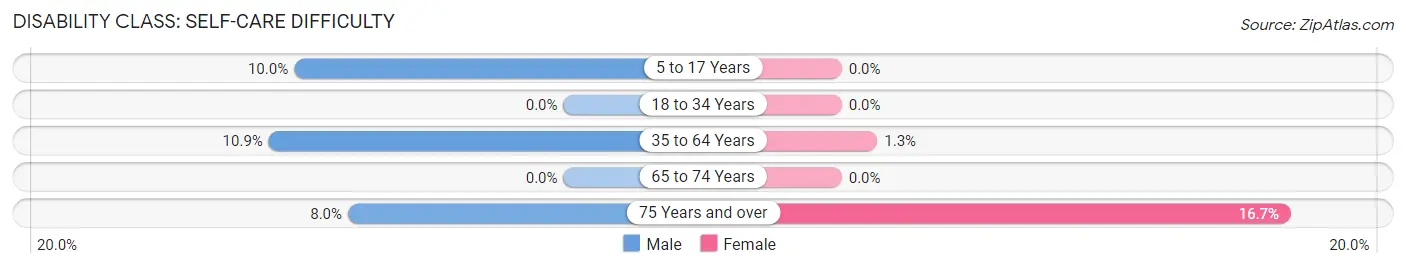
| Age Bracket | Male | Female |
| 5 to 17 Years | 10 (10.0%) | 0 (0.0%) |
| 18 to 34 Years | 0 (0.0%) | 0 (0.0%) |
| 35 to 64 Years | 28 (10.9%) | 3 (1.3%) |
| 65 to 74 Years | 0 (0.0%) | 0 (0.0%) |
| 75 Years and over | 4 (8.0%) | 8 (16.7%) |
Technology Access in Cedar Bluff
Computing Device Access in Cedar Bluff
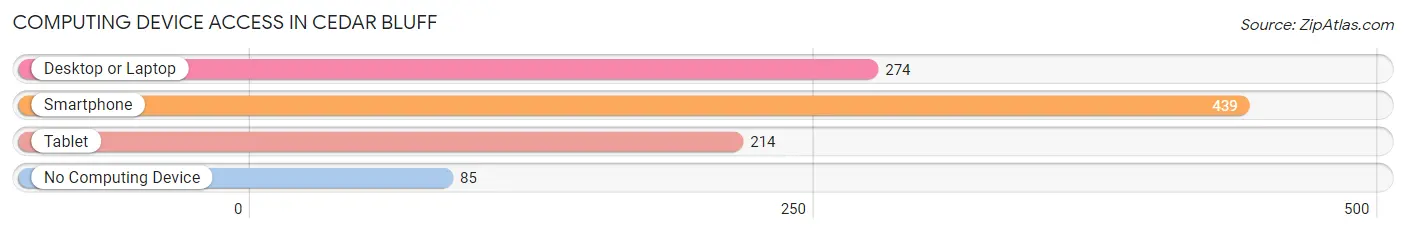
| Device Type | # Households | % Households |
| Desktop or Laptop | 274 | 50.6% |
| Smartphone | 439 | 81.1% |
| Tablet | 214 | 39.6% |
| No Computing Device | 85 | 15.7% |
| Total | 541 | 100.0% |
Internet Access in Cedar Bluff
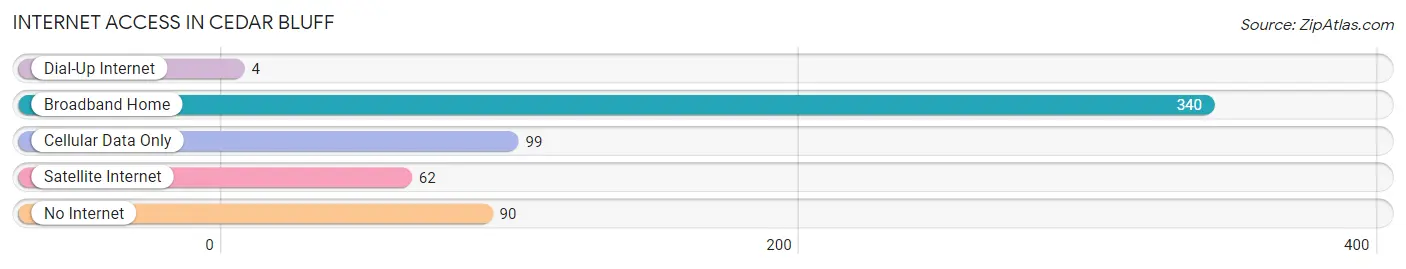
| Internet Type | # Households | % Households |
| Dial-Up Internet | 4 | 0.7% |
| Broadband Home | 340 | 62.8% |
| Cellular Data Only | 99 | 18.3% |
| Satellite Internet | 62 | 11.5% |
| No Internet | 90 | 16.6% |
| Total | 541 | 100.0% |
Cedar Bluff Summary
Cedar Bluff is a small town located in Tazewell County, Virginia. It is situated in the Appalachian Mountains, near the border of West Virginia. The town has a population of just over 1,000 people and is known for its rural charm and scenic beauty.
History
Cedar Bluff was first settled in the late 1700s by a group of settlers from North Carolina. The town was originally known as “Cedar Creek” and was named after the nearby creek. The town was officially incorporated in 1883 and was named after the nearby Cedar Bluff Mountain.
The town was a major stop on the Norfolk and Western Railway, which ran through the area in the late 1800s. The railway brought many new settlers to the area, and the town grew rapidly. By the early 1900s, Cedar Bluff had become a thriving community with a variety of businesses, including a hotel, a general store, a post office, and a bank.
In the early 1900s, the town was also home to a large coal mining industry. The coal mines provided jobs for many of the town’s residents and helped to fuel the local economy. The coal industry declined in the mid-1900s, however, and the town’s population began to decline as well.
Geography
Cedar Bluff is located in the Appalachian Mountains of southwestern Virginia. The town is situated in the Clinch River Valley, near the border of West Virginia. The town is surrounded by rolling hills and mountains, and is home to several creeks and streams.
The town is located at an elevation of 1,400 feet above sea level. The climate in Cedar Bluff is mild, with temperatures ranging from the low 30s in the winter to the mid-80s in the summer.
Economy
Cedar Bluff’s economy is largely based on tourism and agriculture. The town is home to several small businesses, including restaurants, shops, and lodging. The town also has a small manufacturing sector, which produces furniture and other wood products.
The town is also home to several farms, which produce a variety of crops, including corn, soybeans, and hay. The town is also home to several wineries, which produce a variety of wines.
Demographics
As of the 2010 census, Cedar Bluff had a population of 1,072 people. The town is predominantly white, with 92.3% of the population identifying as white. The town also has a small Hispanic population, with 4.2% of the population identifying as Hispanic or Latino.
The median household income in Cedar Bluff is $35,000, and the median home value is $90,000. The town has a poverty rate of 17.3%, which is higher than the national average.
Conclusion
Cedar Bluff is a small town located in the Appalachian Mountains of southwestern Virginia. The town has a population of just over 1,000 people and is known for its rural charm and scenic beauty. The town’s economy is largely based on tourism and agriculture, and the town is home to several small businesses, farms, and wineries. The town is predominantly white, with a small Hispanic population. The median household income in Cedar Bluff is $35,000, and the median home value is $90,000.
Common Questions
What is Per Capita Income in Cedar Bluff?
Per Capita income in Cedar Bluff is $23,741.
What is the Median Family Income in Cedar Bluff?
Median Family Income in Cedar Bluff is $53,370.
What is the Median Household income in Cedar Bluff?
Median Household Income in Cedar Bluff is $41,094.
What is Income or Wage Gap in Cedar Bluff?
Income or Wage Gap in Cedar Bluff is 36.7%.
Women in Cedar Bluff earn 63.3 cents for every dollar earned by a man.
What is Family Income Deficit in Cedar Bluff?
Family Income Deficit in Cedar Bluff is $12,495.
Families that are below poverty line in Cedar Bluff earn $12,495 less on average than the poverty threshold level.
What is Inequality or Gini Index in Cedar Bluff?
Inequality or Gini Index in Cedar Bluff is 0.41.
What is the Total Population of Cedar Bluff?
Total Population of Cedar Bluff is 1,210.
What is the Total Male Population of Cedar Bluff?
Total Male Population of Cedar Bluff is 632.
What is the Total Female Population of Cedar Bluff?
Total Female Population of Cedar Bluff is 578.
What is the Ratio of Males per 100 Females in Cedar Bluff?
There are 109.34 Males per 100 Females in Cedar Bluff.
What is the Ratio of Females per 100 Males in Cedar Bluff?
There are 91.46 Females per 100 Males in Cedar Bluff.
What is the Median Population Age in Cedar Bluff?
Median Population Age in Cedar Bluff is 48.9 Years.
What is the Average Family Size in Cedar Bluff
Average Family Size in Cedar Bluff is 2.8 People.
What is the Average Household Size in Cedar Bluff
Average Household Size in Cedar Bluff is 2.2 People.
How Large is the Labor Force in Cedar Bluff?
There are 447 People in the Labor Forcein in Cedar Bluff.
What is the Percentage of People in the Labor Force in Cedar Bluff?
43.0% of People are in the Labor Force in Cedar Bluff.
What is the Unemployment Rate in Cedar Bluff?
Unemployment Rate in Cedar Bluff is 5.8%.