Zip Codes with the Highest Percentage of Population Employed in Security & Protection in Chantilly, VA
RELATED REPORTS & OPTIONS
Security & Protection
Chantilly
Compare Zip Codes
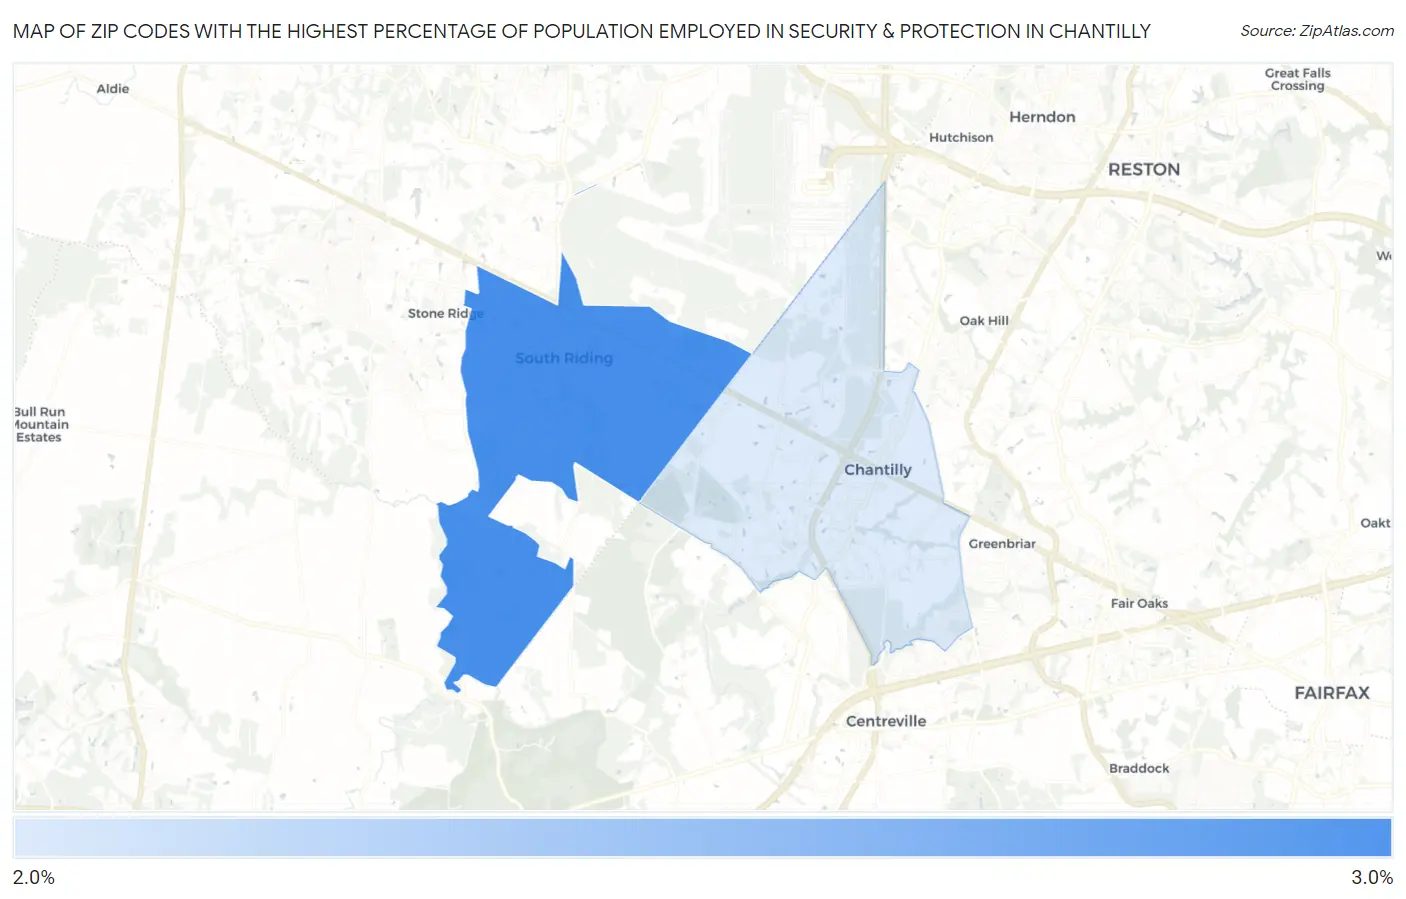
Map of Zip Codes with the Highest Percentage of Population Employed in Security & Protection in Chantilly
2.2%
2.5%
Zip Codes with the Highest Percentage of Population Employed in Security & Protection in Chantilly, VA
| Zip Code | % Employed | vs State | vs National | |
| 1. | 20152 | 2.5% | 2.7%(-0.147)#362 | 2.1%(+0.387)#9,327 |
| 2. | 20151 | 2.2% | 2.7%(-0.494)#412 | 2.1%(+0.040)#11,324 |
1
Common Questions
What are the Top Zip Codes with the Highest Percentage of Population Employed in Security & Protection in Chantilly, VA?
Top Zip Codes with the Highest Percentage of Population Employed in Security & Protection in Chantilly, VA are:
What zip code has the Highest Percentage of Population Employed in Security & Protection in Chantilly, VA?
20152 has the Highest Percentage of Population Employed in Security & Protection in Chantilly, VA with 2.5%.
What is the Percentage of Population Employed in Security & Protection in Chantilly, VA?
Percentage of Population Employed in Security & Protection in Chantilly is 2.2%.
What is the Percentage of Population Employed in Security & Protection in Virginia?
Percentage of Population Employed in Security & Protection in Virginia is 2.7%.
What is the Percentage of Population Employed in Security & Protection in the United States?
Percentage of Population Employed in Security & Protection in the United States is 2.1%.