Springville, VA Map & Demographics
Springville Map
Springville Overview
$24,979
PER CAPITA INCOME
$65,625
AVG FAMILY INCOME
$41,250
AVG HOUSEHOLD INCOME
4.1%
WAGE / INCOME GAP [ % ]
95.9¢/ $1
WAGE / INCOME GAP [ $ ]
0.43
INEQUALITY / GINI INDEX
1,017
TOTAL POPULATION
490
MALE POPULATION
527
FEMALE POPULATION
92.98
MALES / 100 FEMALES
107.55
FEMALES / 100 MALES
31.8
MEDIAN AGE
3.5
AVG FAMILY SIZE
2.5
AVG HOUSEHOLD SIZE
543
LABOR FORCE [ PEOPLE ]
61.5%
PERCENT IN LABOR FORCE
1.1%
UNEMPLOYMENT RATE
Income in Springville
Income Overview in Springville
Per Capita Income in Springville is $24,979, while median incomes of families and households are $65,625 and $41,250 respectively.
| Characteristic | Number | Measure |
| Per Capita Income | 1,017 | $24,979 |
| Median Family Income | 239 | $65,625 |
| Mean Family Income | 239 | $64,305 |
| Median Household Income | 413 | $41,250 |
| Mean Household Income | 413 | $51,892 |
| Income Deficit | 239 | $0 |
| Wage / Income Gap (%) | 1,017 | 4.14% |
| Wage / Income Gap ($) | 1,017 | 95.86¢ per $1 |
| Gini / Inequality Index | 1,017 | 0.43 |
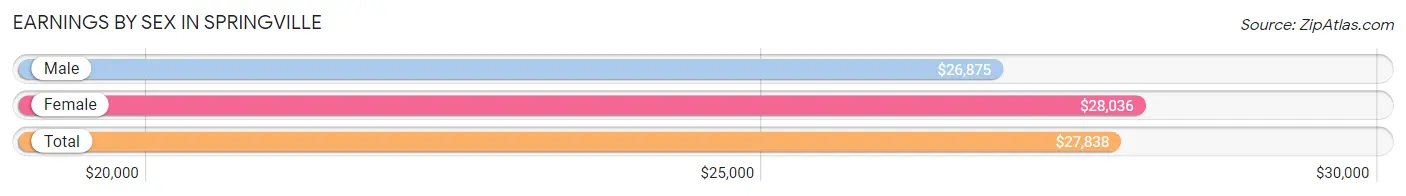
Earnings by Sex in Springville
Average Earnings in Springville are $27,838, $26,875 for men and $28,036 for women, a difference of 4.1%.
| Sex | Number | Average Earnings |
| Male | 275 (50.2%) | $26,875 |
| Female | 273 (49.8%) | $28,036 |
| Total | 548 (100.0%) | $27,838 |
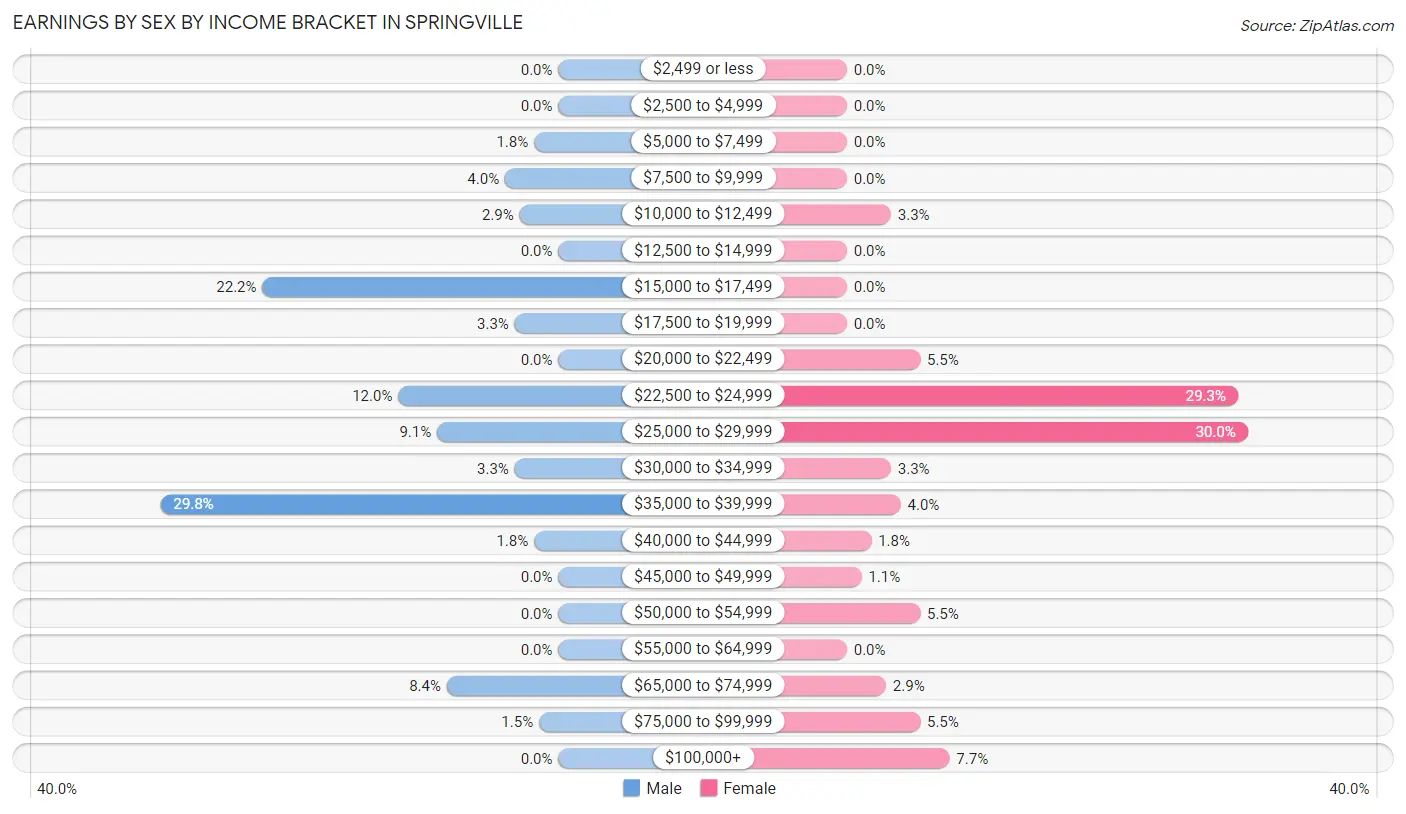
Earnings by Sex by Income Bracket in Springville
The most common earnings brackets in Springville are $35,000 to $39,999 for men (82 | 29.8%) and $25,000 to $29,999 for women (82 | 30.0%).
| Income | Male | Female |
| $2,499 or less | 0 (0.0%) | 0 (0.0%) |
| $2,500 to $4,999 | 0 (0.0%) | 0 (0.0%) |
| $5,000 to $7,499 | 5 (1.8%) | 0 (0.0%) |
| $7,500 to $9,999 | 11 (4.0%) | 0 (0.0%) |
| $10,000 to $12,499 | 8 (2.9%) | 9 (3.3%) |
| $12,500 to $14,999 | 0 (0.0%) | 0 (0.0%) |
| $15,000 to $17,499 | 61 (22.2%) | 0 (0.0%) |
| $17,500 to $19,999 | 9 (3.3%) | 0 (0.0%) |
| $20,000 to $22,499 | 0 (0.0%) | 15 (5.5%) |
| $22,500 to $24,999 | 33 (12.0%) | 80 (29.3%) |
| $25,000 to $29,999 | 25 (9.1%) | 82 (30.0%) |
| $30,000 to $34,999 | 9 (3.3%) | 9 (3.3%) |
| $35,000 to $39,999 | 82 (29.8%) | 11 (4.0%) |
| $40,000 to $44,999 | 5 (1.8%) | 5 (1.8%) |
| $45,000 to $49,999 | 0 (0.0%) | 3 (1.1%) |
| $50,000 to $54,999 | 0 (0.0%) | 15 (5.5%) |
| $55,000 to $64,999 | 0 (0.0%) | 0 (0.0%) |
| $65,000 to $74,999 | 23 (8.4%) | 8 (2.9%) |
| $75,000 to $99,999 | 4 (1.5%) | 15 (5.5%) |
| $100,000+ | 0 (0.0%) | 21 (7.7%) |
| Total | 275 (100.0%) | 273 (100.0%) |
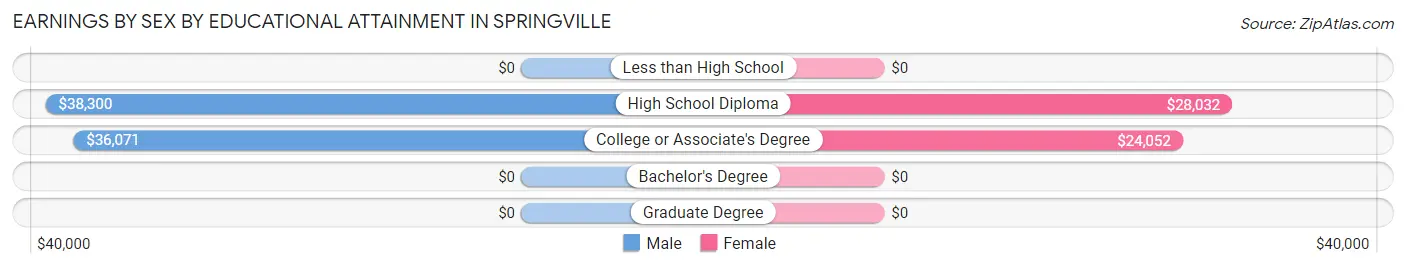
Earnings by Sex by Educational Attainment in Springville
Average earnings in Springville are $37,833 for men and $28,009 for women, a difference of 26.0%. Men with an educational attainment of high school diploma enjoy the highest average annual earnings of $38,300, while those with college or associate's degree education earn the least with $36,071. Women with an educational attainment of high school diploma earn the most with the average annual earnings of $28,032, while those with college or associate's degree education have the smallest earnings of $24,052.
| Educational Attainment | Male Income | Female Income |
| Less than High School | - | - |
| High School Diploma | $38,300 | $28,032 |
| College or Associate's Degree | $36,071 | $24,052 |
| Bachelor's Degree | - | - |
| Graduate Degree | - | - |
| Total | $37,833 | $28,009 |
Family Income in Springville
Family Income Brackets in Springville
According to the Springville family income data, there are 93 families falling into the $50,000 to $74,999 income range, which is the most common income bracket and makes up 38.9% of all families.
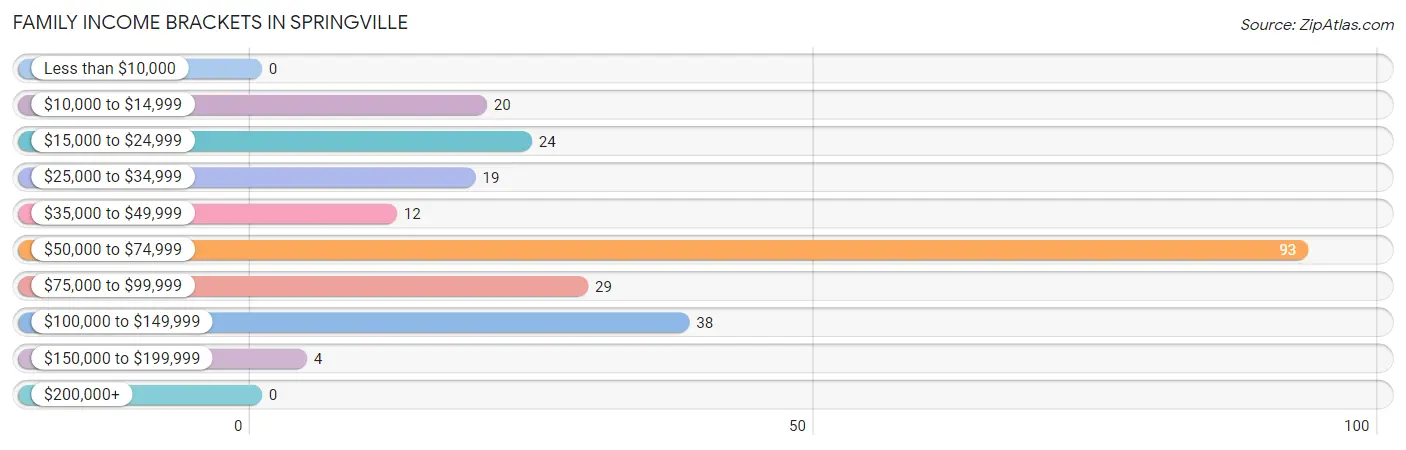
| Income Bracket | # Families | % Families |
| Less than $10,000 | 0 | 0.0% |
| $10,000 to $14,999 | 20 | 8.4% |
| $15,000 to $24,999 | 24 | 10.0% |
| $25,000 to $34,999 | 19 | 7.9% |
| $35,000 to $49,999 | 12 | 5.0% |
| $50,000 to $74,999 | 93 | 38.9% |
| $75,000 to $99,999 | 29 | 12.1% |
| $100,000 to $149,999 | 38 | 15.9% |
| $150,000 to $199,999 | 4 | 1.7% |
| $200,000+ | 0 | 0.0% |
Family Income by Famaliy Size in Springville
2-person families (152 | 63.6%) account for the highest median family income in Springville with $65,787 per family, while 2-person families (152 | 63.6%) have the highest median income of $32,894 per family member.
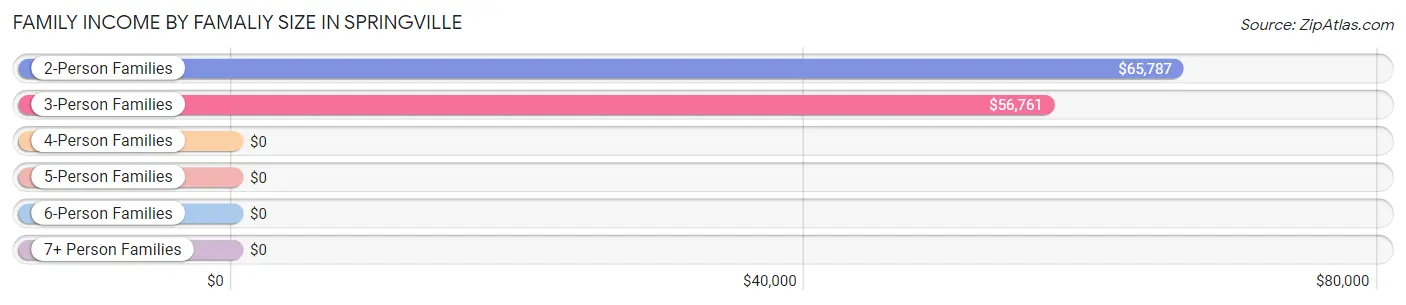
| Income Bracket | # Families | Median Income |
| 2-Person Families | 152 (63.6%) | $65,787 |
| 3-Person Families | 41 (17.2%) | $56,761 |
| 4-Person Families | 22 (9.2%) | $0 |
| 5-Person Families | 20 (8.4%) | $0 |
| 6-Person Families | 4 (1.7%) | $0 |
| 7+ Person Families | 0 (0.0%) | $0 |
| Total | 239 (100.0%) | $65,625 |
Family Income by Number of Earners in Springville
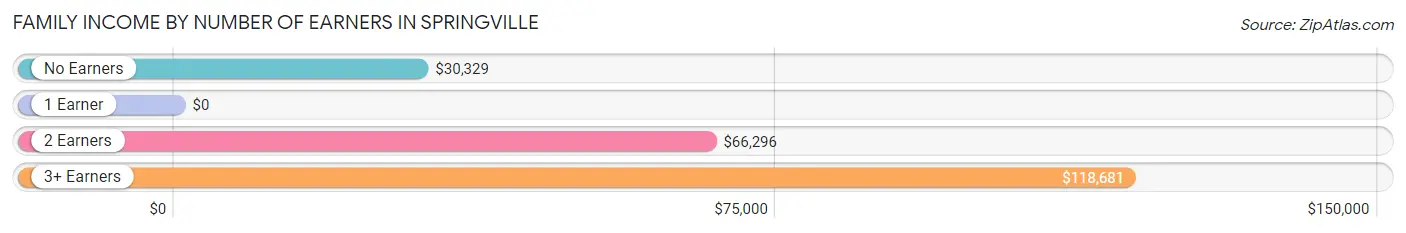
| Number of Earners | # Families | Median Income |
| No Earners | 41 (17.2%) | $30,329 |
| 1 Earner | 61 (25.5%) | $0 |
| 2 Earners | 110 (46.0%) | $66,296 |
| 3+ Earners | 27 (11.3%) | $118,681 |
| Total | 239 (100.0%) | $65,625 |
Household Income in Springville
Household Income Brackets in Springville
With 101 households falling in the category, the $50,000 to $74,999 income range is the most frequent in Springville, accounting for 24.5% of all households.
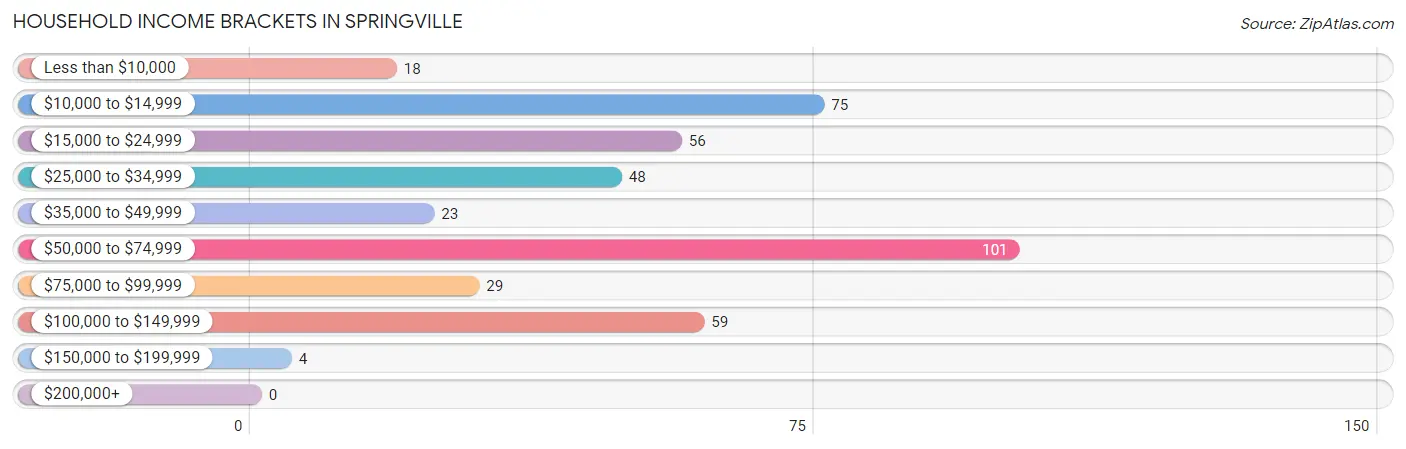
| Income Bracket | # Households | % Households |
| Less than $10,000 | 18 | 4.4% |
| $10,000 to $14,999 | 75 | 18.2% |
| $15,000 to $24,999 | 56 | 13.6% |
| $25,000 to $34,999 | 48 | 11.6% |
| $35,000 to $49,999 | 23 | 5.6% |
| $50,000 to $74,999 | 101 | 24.5% |
| $75,000 to $99,999 | 29 | 7.0% |
| $100,000 to $149,999 | 59 | 14.3% |
| $150,000 to $199,999 | 4 | 1.0% |
| $200,000+ | 0 | 0.0% |
Household Income by Householder Age in Springville
The median household income in Springville is $41,250, with the highest median household income of $66,759 found in the 25 to 44 years age bracket for the primary householder. A total of 134 households (32.5%) fall into this category. Meanwhile, the 15 to 24 years age bracket for the primary householder has the lowest median household income of $0, with 29 households (7.0%) in this group.
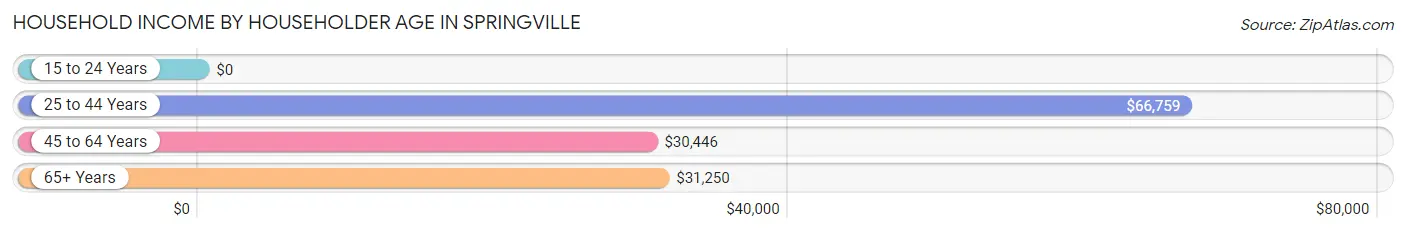
| Income Bracket | # Households | Median Income |
| 15 to 24 Years | 29 (7.0%) | $0 |
| 25 to 44 Years | 134 (32.5%) | $66,759 |
| 45 to 64 Years | 179 (43.3%) | $30,446 |
| 65+ Years | 71 (17.2%) | $31,250 |
| Total | 413 (100.0%) | $41,250 |
Poverty in Springville
Income Below Poverty by Sex and Age in Springville
With 35.1% poverty level for males and 18.8% for females among the residents of Springville, 5 year old males and 18 to 24 year old females are the most vulnerable to poverty, with 13 males (100.0%) and 18 females (56.2%) in their respective age groups living below the poverty level.
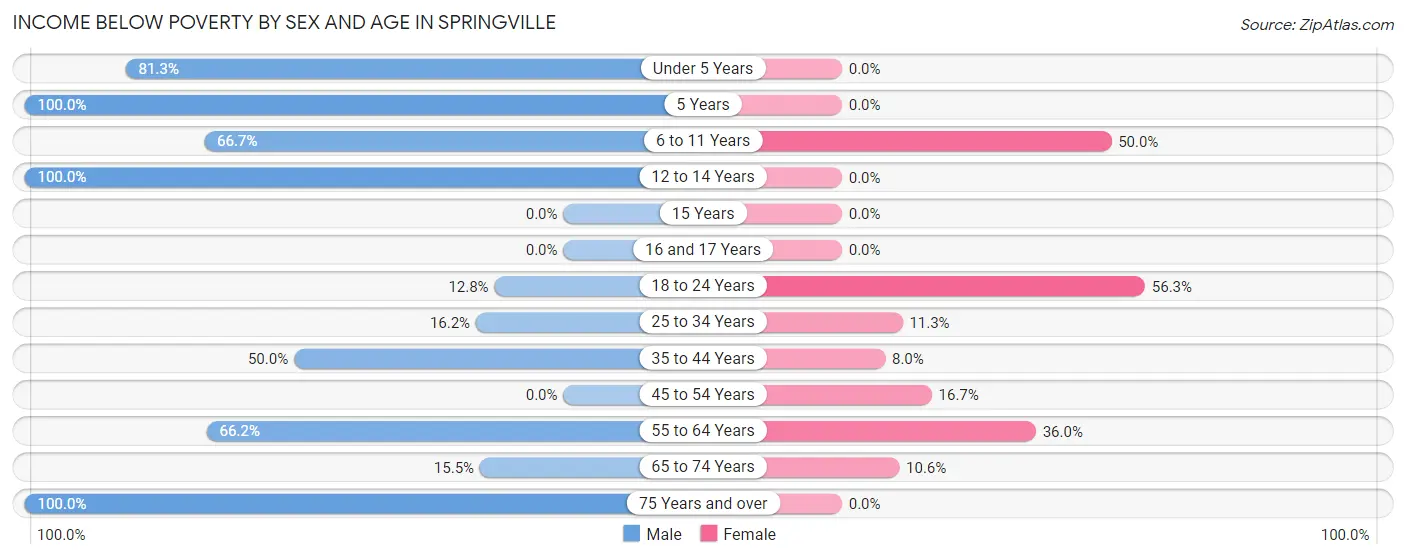
| Age Bracket | Male | Female |
| Under 5 Years | 26 (81.2%) | 0 (0.0%) |
| 5 Years | 13 (100.0%) | 0 (0.0%) |
| 6 to 11 Years | 14 (66.7%) | 22 (50.0%) |
| 12 to 14 Years | 12 (100.0%) | 0 (0.0%) |
| 15 Years | 0 (0.0%) | 0 (0.0%) |
| 16 and 17 Years | 0 (0.0%) | 0 (0.0%) |
| 18 to 24 Years | 11 (12.8%) | 18 (56.2%) |
| 25 to 34 Years | 18 (16.2%) | 17 (11.3%) |
| 35 to 44 Years | 9 (50.0%) | 11 (8.0%) |
| 45 to 54 Years | 0 (0.0%) | 8 (16.7%) |
| 55 to 64 Years | 51 (66.2%) | 18 (36.0%) |
| 65 to 74 Years | 11 (15.5%) | 5 (10.6%) |
| 75 Years and over | 7 (100.0%) | 0 (0.0%) |
| Total | 172 (35.1%) | 99 (18.8%) |
Income Above Poverty by Sex and Age in Springville
According to the poverty statistics in Springville, males aged 45 to 54 years and females aged under 5 years are the age groups that are most secure financially, with 100.0% of males and 100.0% of females in these age groups living above the poverty line.
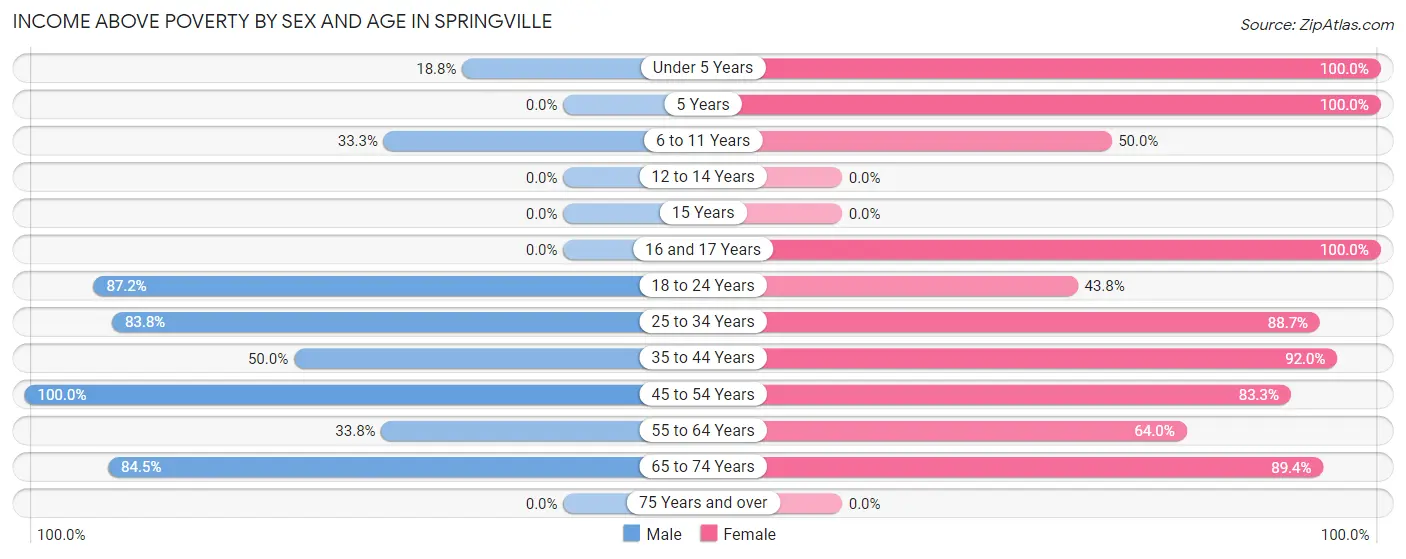
| Age Bracket | Male | Female |
| Under 5 Years | 6 (18.8%) | 6 (100.0%) |
| 5 Years | 0 (0.0%) | 6 (100.0%) |
| 6 to 11 Years | 7 (33.3%) | 22 (50.0%) |
| 12 to 14 Years | 0 (0.0%) | 0 (0.0%) |
| 15 Years | 0 (0.0%) | 0 (0.0%) |
| 16 and 17 Years | 0 (0.0%) | 6 (100.0%) |
| 18 to 24 Years | 75 (87.2%) | 14 (43.8%) |
| 25 to 34 Years | 93 (83.8%) | 134 (88.7%) |
| 35 to 44 Years | 9 (50.0%) | 126 (92.0%) |
| 45 to 54 Years | 42 (100.0%) | 40 (83.3%) |
| 55 to 64 Years | 26 (33.8%) | 32 (64.0%) |
| 65 to 74 Years | 60 (84.5%) | 42 (89.4%) |
| 75 Years and over | 0 (0.0%) | 0 (0.0%) |
| Total | 318 (64.9%) | 428 (81.2%) |
Income Below Poverty Among Married-Couple Families in Springville
The poverty statistics for married-couple families in Springville show that 20.7% or 35 of the total 169 families live below the poverty line. Families with 3 or 4 children have the highest poverty rate of 73.3%, comprising of 11 families. On the other hand, families with 1 or 2 children have the lowest poverty rate of 0.0%, which includes 0 families.
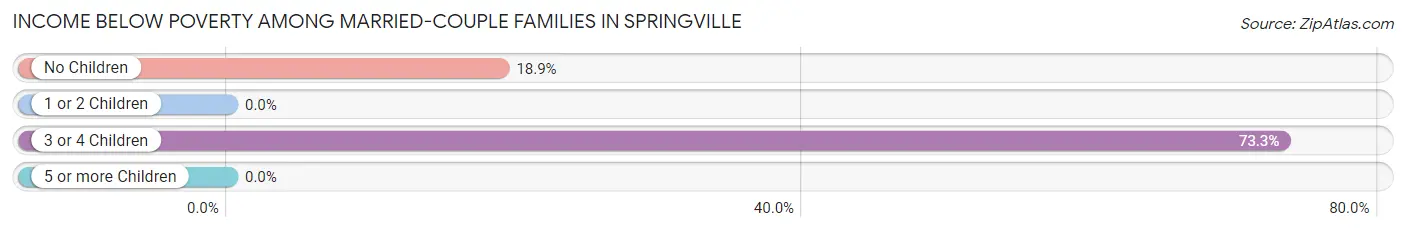
| Children | Above Poverty | Below Poverty |
| No Children | 103 (81.1%) | 24 (18.9%) |
| 1 or 2 Children | 27 (100.0%) | 0 (0.0%) |
| 3 or 4 Children | 4 (26.7%) | 11 (73.3%) |
| 5 or more Children | 0 (0.0%) | 0 (0.0%) |
| Total | 134 (79.3%) | 35 (20.7%) |
Income Below Poverty Among Single-Parent Households in Springville
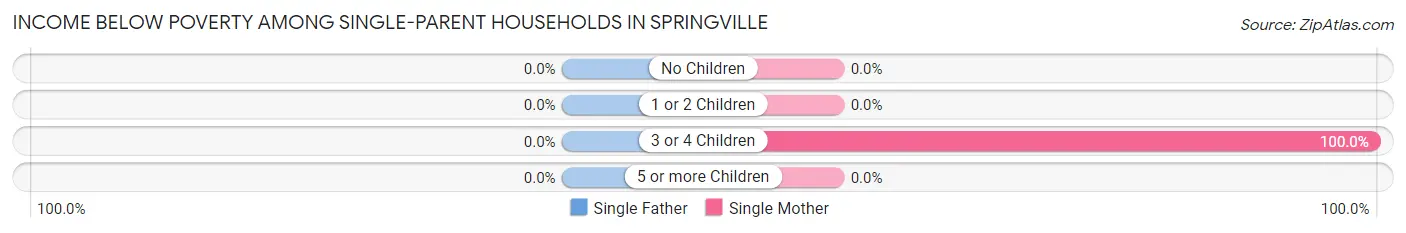
| Children | Single Father | Single Mother |
| No Children | 0 (0.0%) | 0 (0.0%) |
| 1 or 2 Children | 0 (0.0%) | 0 (0.0%) |
| 3 or 4 Children | 0 (0.0%) | 9 (100.0%) |
| 5 or more Children | 0 (0.0%) | 0 (0.0%) |
| Total | 0 (0.0%) | 9 (17.6%) |
Income Below Poverty Among Married-Couple vs Single-Parent Households in Springville
The poverty data for Springville shows that 35 of the married-couple family households (20.7%) and 9 of the single-parent households (12.9%) are living below the poverty level. Within the married-couple family households, those with 3 or 4 children have the highest poverty rate, with 11 households (73.3%) falling below the poverty line. Among the single-parent households, those with 3 or 4 children have the highest poverty rate, with 9 household (100.0%) living below poverty.
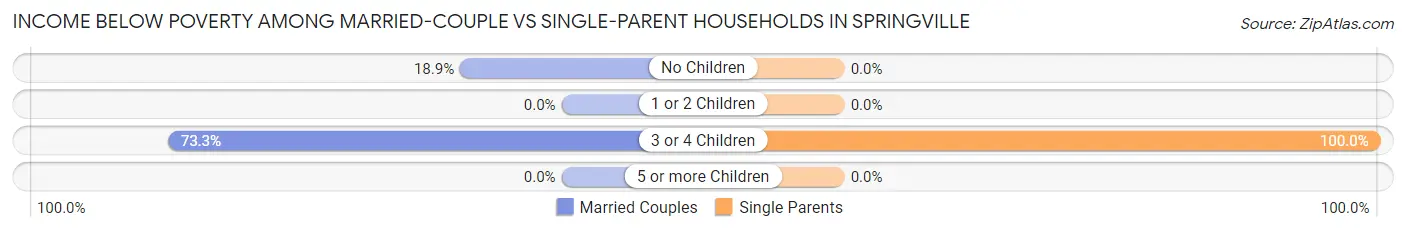
| Children | Married-Couple Families | Single-Parent Households |
| No Children | 24 (18.9%) | 0 (0.0%) |
| 1 or 2 Children | 0 (0.0%) | 0 (0.0%) |
| 3 or 4 Children | 11 (73.3%) | 9 (100.0%) |
| 5 or more Children | 0 (0.0%) | 0 (0.0%) |
| Total | 35 (20.7%) | 9 (12.9%) |
Race in Springville
The most populous races in Springville are White / Caucasian (753 | 74.0%), Black / African American (145 | 14.3%), and Two or more Races (62 | 6.1%).
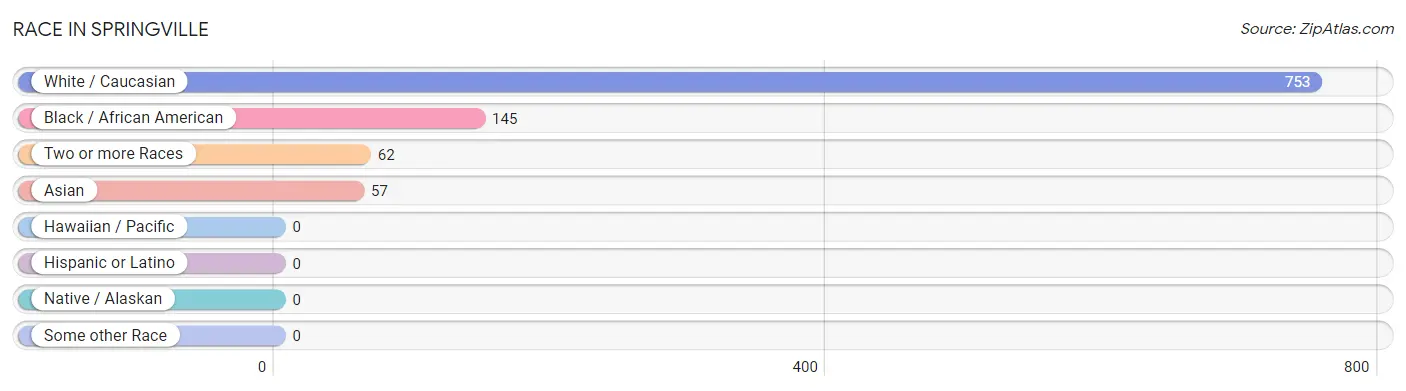
| Race | # Population | % Population |
| Asian | 57 | 5.6% |
| Black / African American | 145 | 14.3% |
| Hawaiian / Pacific | 0 | 0.0% |
| Hispanic or Latino | 0 | 0.0% |
| Native / Alaskan | 0 | 0.0% |
| White / Caucasian | 753 | 74.0% |
| Two or more Races | 62 | 6.1% |
| Some other Race | 0 | 0.0% |
| Total | 1,017 | 100.0% |
Ancestry in Springville
The most populous ancestries reported in Springville are American (155 | 15.2%), Korean (119 | 11.7%), Italian (118 | 11.6%), English (103 | 10.1%), and German (98 | 9.6%), together accounting for 58.3% of all Springville residents.
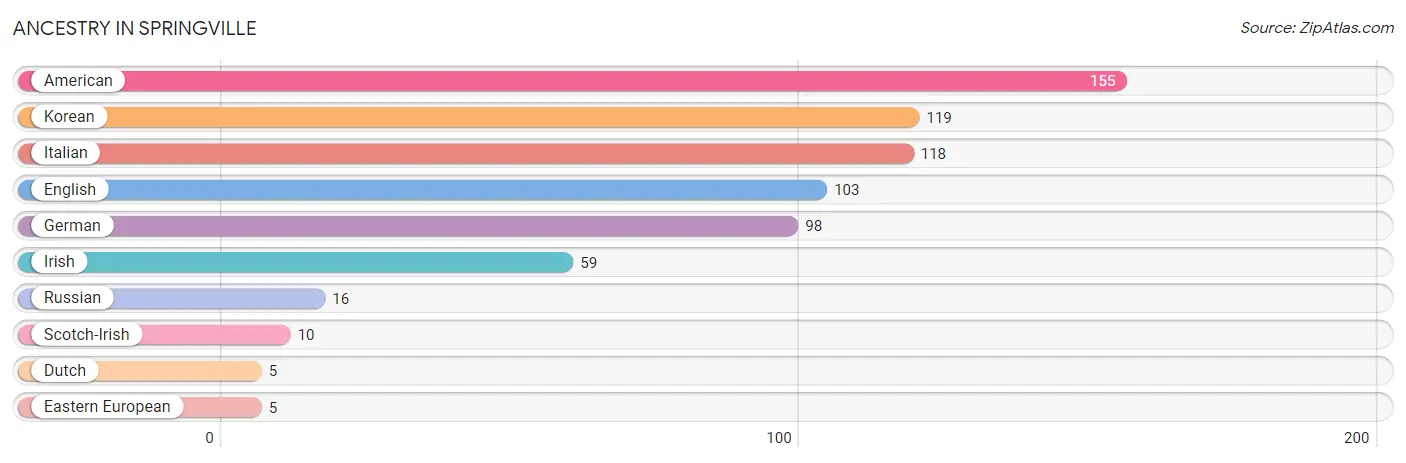
| Ancestry | # Population | % Population |
| American | 155 | 15.2% |
| Dutch | 5 | 0.5% |
| Eastern European | 5 | 0.5% |
| English | 103 | 10.1% |
| German | 98 | 9.6% |
| Irish | 59 | 5.8% |
| Italian | 118 | 11.6% |
| Korean | 119 | 11.7% |
| Russian | 16 | 1.6% |
| Scotch-Irish | 10 | 1.0% | View All 10 Rows |
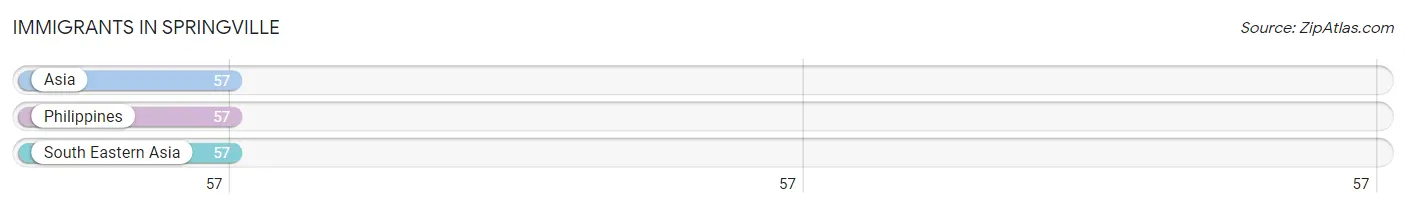
Immigrants in Springville
The most numerous immigrant groups reported in Springville came from Asia (57 | 5.6%), Philippines (57 | 5.6%), and South Eastern Asia (57 | 5.6%), together accounting for 16.8% of all Springville residents.
| Immigration Origin | # Population | % Population |
| Asia | 57 | 5.6% |
| Philippines | 57 | 5.6% |
| South Eastern Asia | 57 | 5.6% | View All 3 Rows |
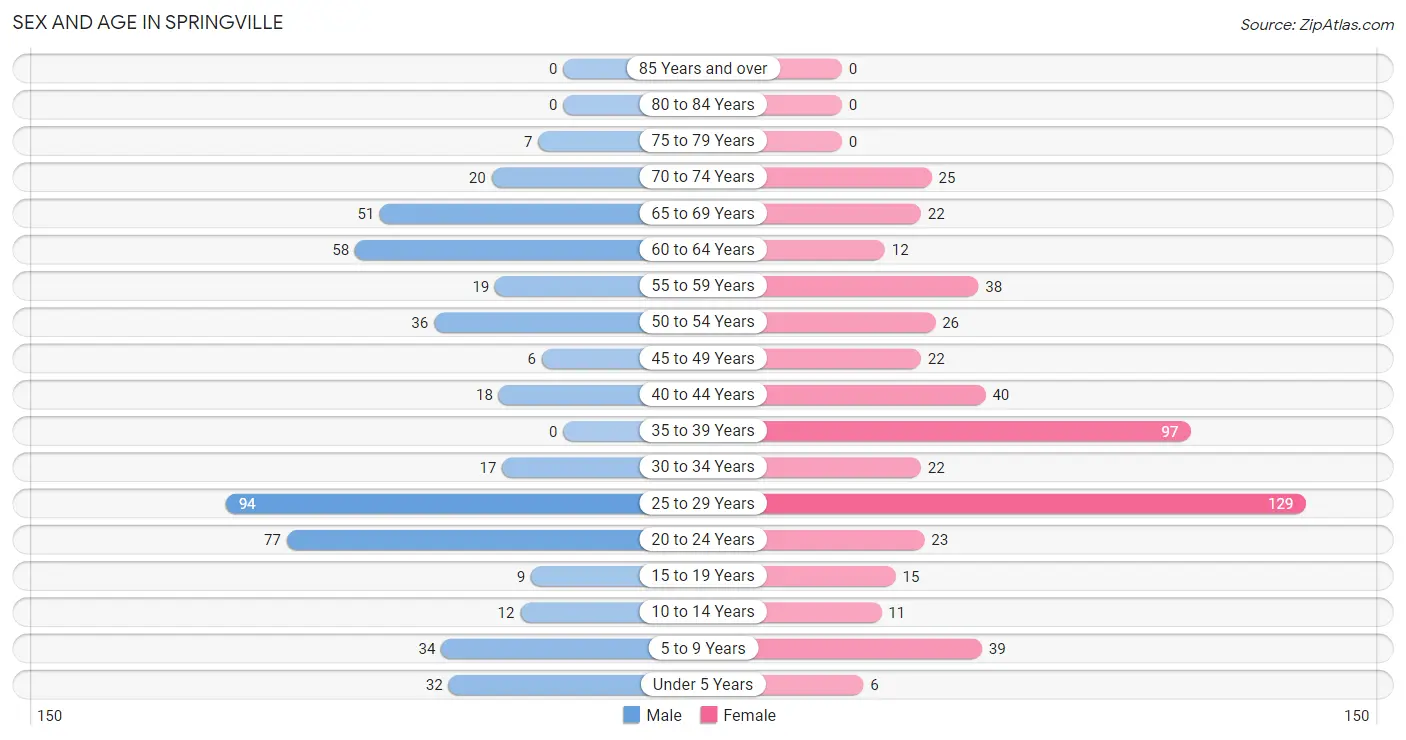
Sex and Age in Springville
Sex and Age in Springville
The most populous age groups in Springville are 25 to 29 Years (94 | 19.2%) for men and 25 to 29 Years (129 | 24.5%) for women.
| Age Bracket | Male | Female |
| Under 5 Years | 32 (6.5%) | 6 (1.1%) |
| 5 to 9 Years | 34 (6.9%) | 39 (7.4%) |
| 10 to 14 Years | 12 (2.5%) | 11 (2.1%) |
| 15 to 19 Years | 9 (1.8%) | 15 (2.9%) |
| 20 to 24 Years | 77 (15.7%) | 23 (4.4%) |
| 25 to 29 Years | 94 (19.2%) | 129 (24.5%) |
| 30 to 34 Years | 17 (3.5%) | 22 (4.2%) |
| 35 to 39 Years | 0 (0.0%) | 97 (18.4%) |
| 40 to 44 Years | 18 (3.7%) | 40 (7.6%) |
| 45 to 49 Years | 6 (1.2%) | 22 (4.2%) |
| 50 to 54 Years | 36 (7.3%) | 26 (4.9%) |
| 55 to 59 Years | 19 (3.9%) | 38 (7.2%) |
| 60 to 64 Years | 58 (11.8%) | 12 (2.3%) |
| 65 to 69 Years | 51 (10.4%) | 22 (4.2%) |
| 70 to 74 Years | 20 (4.1%) | 25 (4.7%) |
| 75 to 79 Years | 7 (1.4%) | 0 (0.0%) |
| 80 to 84 Years | 0 (0.0%) | 0 (0.0%) |
| 85 Years and over | 0 (0.0%) | 0 (0.0%) |
| Total | 490 (100.0%) | 527 (100.0%) |
Families and Households in Springville
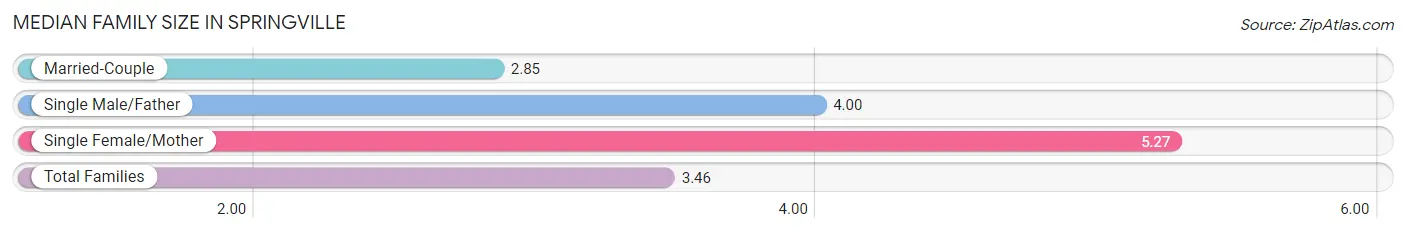
Median Family Size in Springville
The median family size in Springville is 3.46 persons per family, with single female/mother families (51 | 21.3%) accounting for the largest median family size of 5.27 persons per family. On the other hand, married-couple families (169 | 70.7%) represent the smallest median family size with 2.85 persons per family.
| Family Type | # Families | Family Size |
| Married-Couple | 169 (70.7%) | 2.85 |
| Single Male/Father | 19 (8.0%) | 4.00 |
| Single Female/Mother | 51 (21.3%) | 5.27 |
| Total Families | 239 (100.0%) | 3.46 |
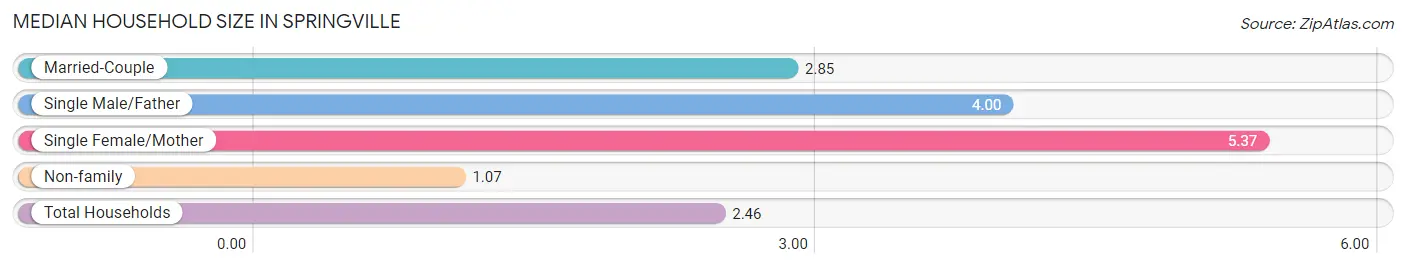
Median Household Size in Springville
The median household size in Springville is 2.46 persons per household, with single female/mother households (51 | 12.3%) accounting for the largest median household size of 5.37 persons per household. non-family households (174 | 42.1%) represent the smallest median household size with 1.07 persons per household.
| Household Type | # Households | Household Size |
| Married-Couple | 169 (40.9%) | 2.85 |
| Single Male/Father | 19 (4.6%) | 4.00 |
| Single Female/Mother | 51 (12.3%) | 5.37 |
| Non-family | 174 (42.1%) | 1.07 |
| Total Households | 413 (100.0%) | 2.46 |
Household Size by Marriage Status in Springville
Out of a total of 413 households in Springville, 239 (57.9%) are family households, while 174 (42.1%) are nonfamily households. The most numerous type of family households are 2-person households, comprising 152, and the most common type of nonfamily households are 1-person households, comprising 166.
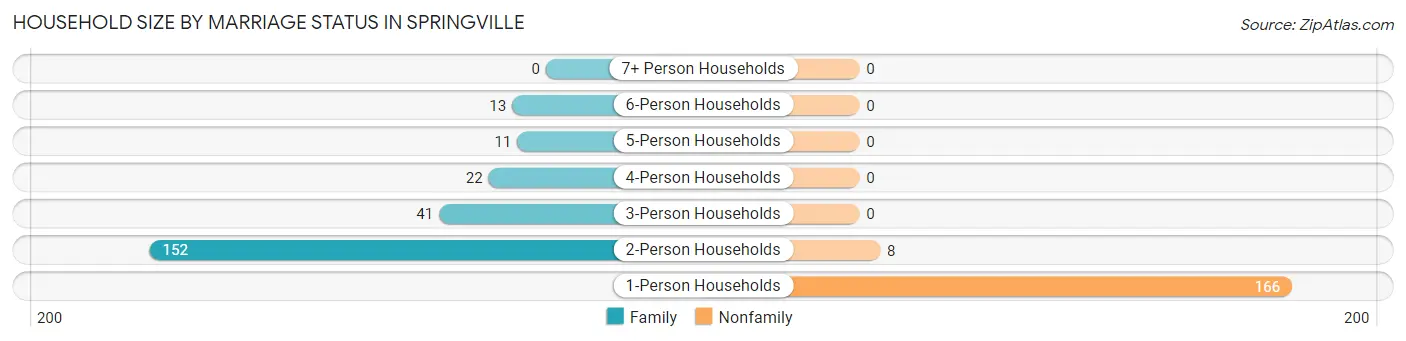
| Household Size | Family Households | Nonfamily Households |
| 1-Person Households | - | 166 (40.2%) |
| 2-Person Households | 152 (36.8%) | 8 (1.9%) |
| 3-Person Households | 41 (9.9%) | 0 (0.0%) |
| 4-Person Households | 22 (5.3%) | 0 (0.0%) |
| 5-Person Households | 11 (2.7%) | 0 (0.0%) |
| 6-Person Households | 13 (3.2%) | 0 (0.0%) |
| 7+ Person Households | 0 (0.0%) | 0 (0.0%) |
| Total | 239 (57.9%) | 174 (42.1%) |
Female Fertility in Springville
Fertility by Age in Springville
Average fertility rate in Springville is 26.0 births per 1,000 women. Women in the age bracket of 20 to 34 years have the highest fertility rate with 52.0 births per 1,000 women. Women in the age bracket of 20 to 34 years acount for 100.0% of all women with births.
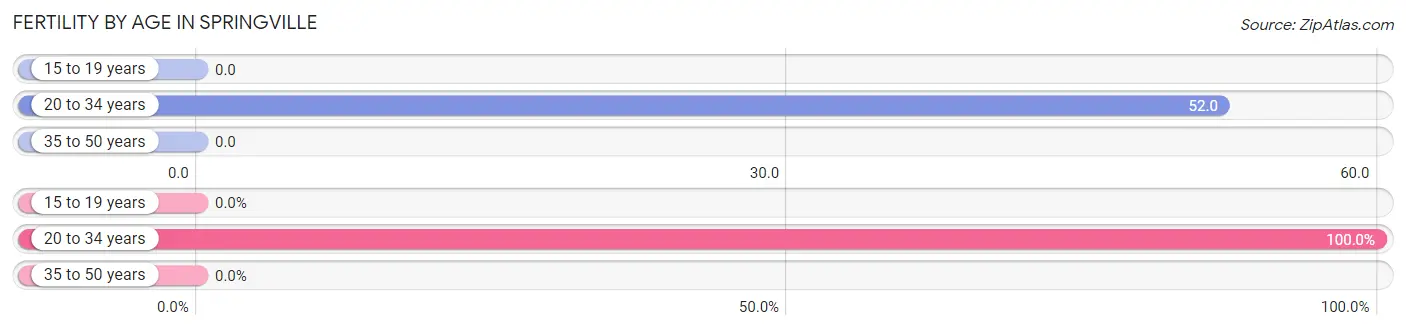
| Age Bracket | Women with Births | Births / 1,000 Women |
| 15 to 19 years | 0 (0.0%) | 0.0 |
| 20 to 34 years | 9 (100.0%) | 52.0 |
| 35 to 50 years | 0 (0.0%) | 0.0 |
| Total | 9 (100.0%) | 26.0 |
Fertility by Age by Marriage Status in Springville
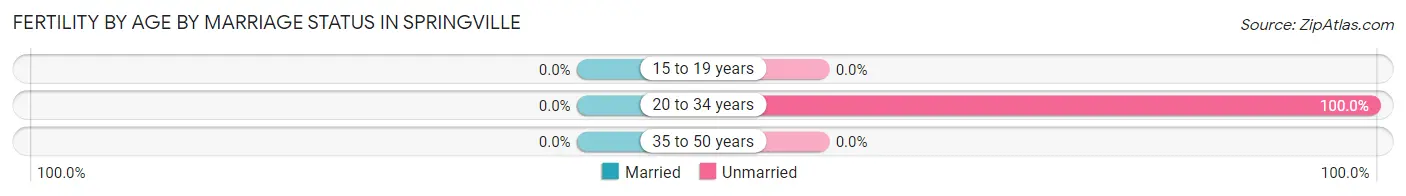
| Age Bracket | Married | Unmarried |
| 15 to 19 years | 0 (0.0%) | 0 (0.0%) |
| 20 to 34 years | 0 (0.0%) | 9 (100.0%) |
| 35 to 50 years | 0 (0.0%) | 0 (0.0%) |
| Total | 0 (0.0%) | 9 (100.0%) |
Fertility by Education in Springville
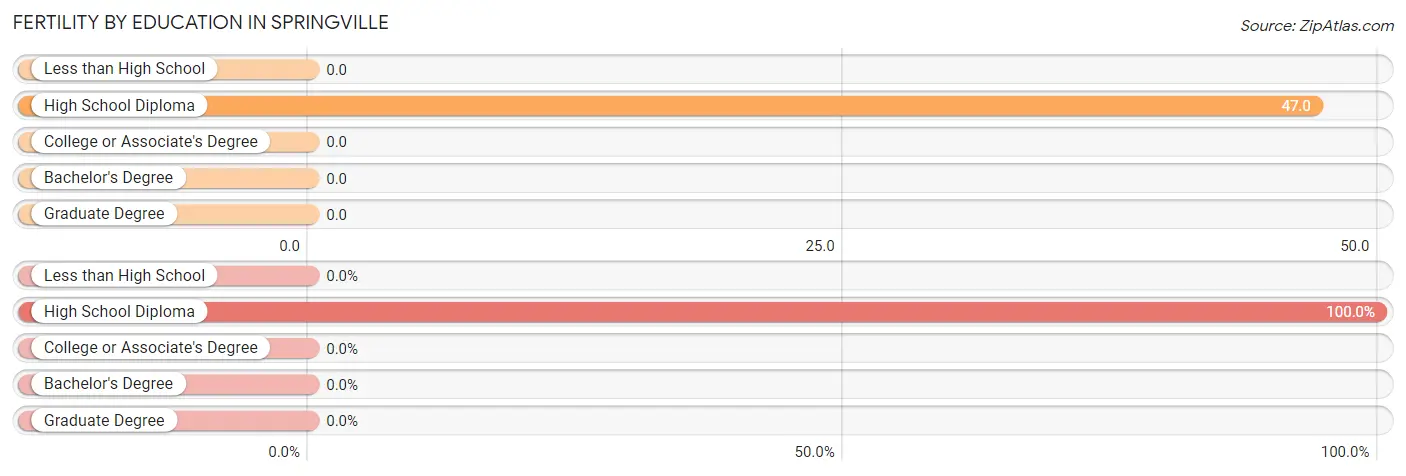
| Educational Attainment | Women with Births | Births / 1,000 Women |
| Less than High School | 0 (0.0%) | 0.0 |
| High School Diploma | 9 (100.0%) | 47.0 |
| College or Associate's Degree | 0 (0.0%) | 0.0 |
| Bachelor's Degree | 0 (0.0%) | 0.0 |
| Graduate Degree | 0 (0.0%) | 0.0 |
| Total | 9 (100.0%) | 26.0 |
Fertility by Education by Marriage Status in Springville
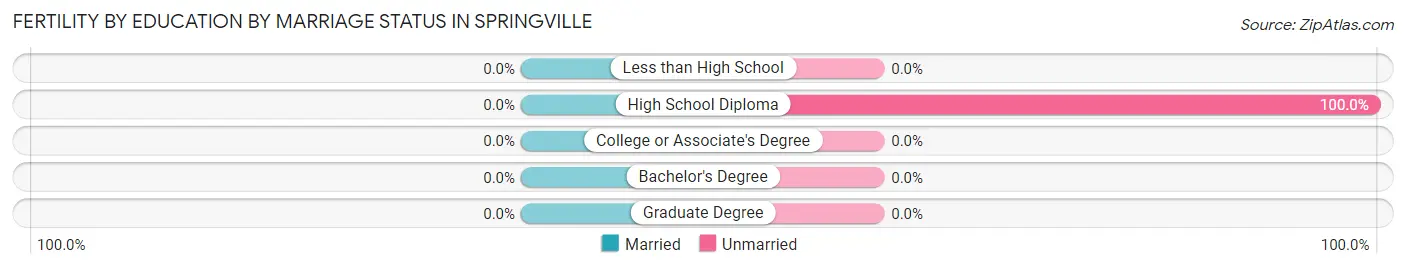
| Educational Attainment | Married | Unmarried |
| Less than High School | 0 (0.0%) | 0 (0.0%) |
| High School Diploma | 0 (0.0%) | 9 (100.0%) |
| College or Associate's Degree | 0 (0.0%) | 0 (0.0%) |
| Bachelor's Degree | 0 (0.0%) | 0 (0.0%) |
| Graduate Degree | 0 (0.0%) | 0 (0.0%) |
| Total | 0 (0.0%) | 9 (100.0%) |
Employment Characteristics in Springville
Employment by Class of Employer in Springville
Among the 537 employed individuals in Springville, private company employees (249 | 46.4%), state government employees (129 | 24.0%), and federal government employees (69 | 12.9%) make up the most common classes of employment.
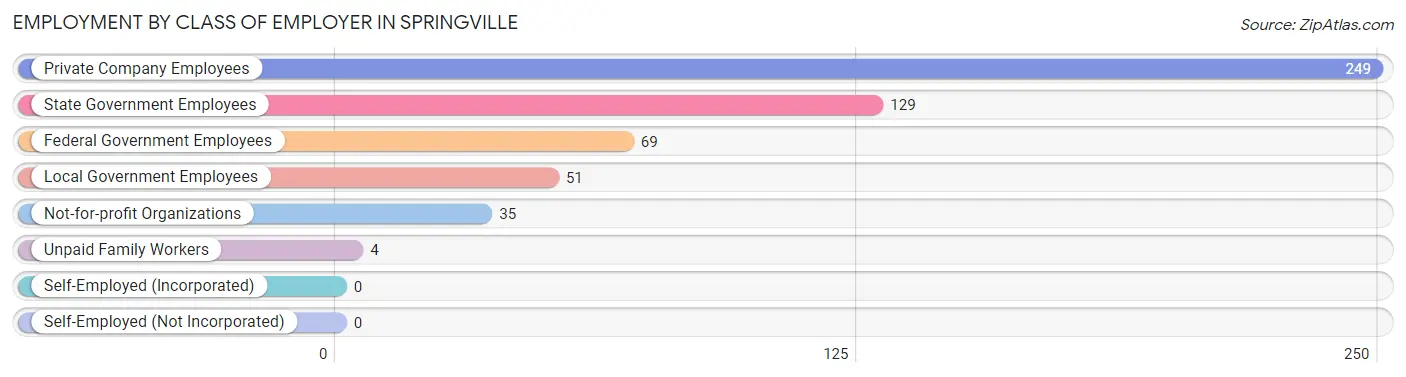
| Employer Class | # Employees | % Employees |
| Private Company Employees | 249 | 46.4% |
| Self-Employed (Incorporated) | 0 | 0.0% |
| Self-Employed (Not Incorporated) | 0 | 0.0% |
| Not-for-profit Organizations | 35 | 6.5% |
| Local Government Employees | 51 | 9.5% |
| State Government Employees | 129 | 24.0% |
| Federal Government Employees | 69 | 12.9% |
| Unpaid Family Workers | 4 | 0.7% |
| Total | 537 | 100.0% |
Employment Status by Age in Springville
According to the labor force statistics for Springville, out of the total population over 16 years of age (883), 61.5% or 543 individuals are in the labor force, with 1.1% or 6 of them unemployed. The age group with the highest labor force participation rate is 20 to 24 years, with 100.0% or 100 individuals in the labor force. Within the labor force, the 20 to 24 years age range has the highest percentage of unemployed individuals, with 6.0% or 6 of them being unemployed.
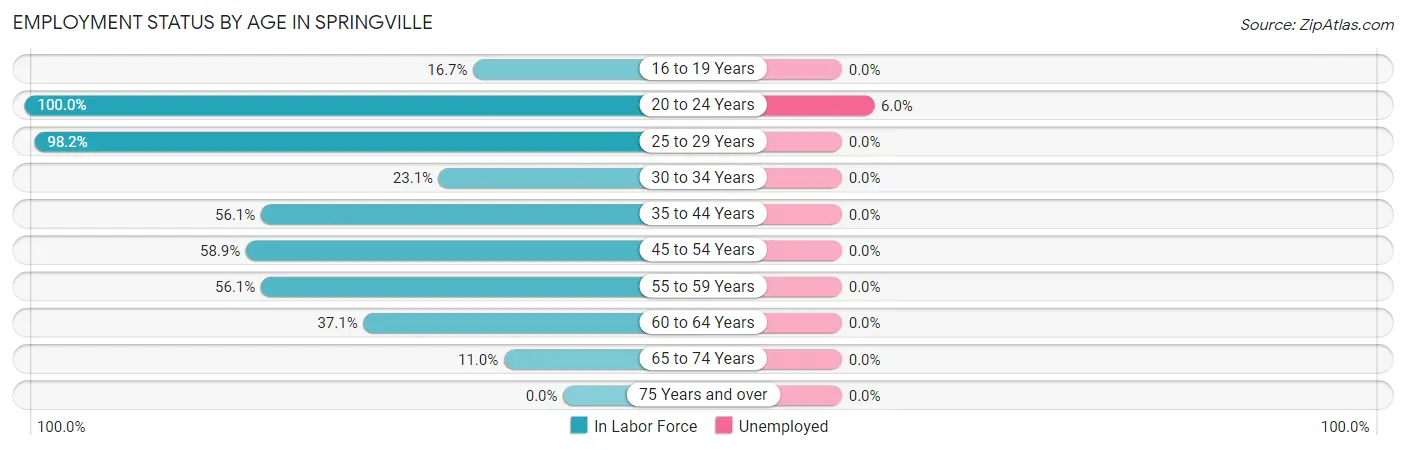
| Age Bracket | In Labor Force | Unemployed |
| 16 to 19 Years | 4 (16.7%) | 0 (0.0%) |
| 20 to 24 Years | 100 (100.0%) | 6 (6.0%) |
| 25 to 29 Years | 219 (98.2%) | 0 (0.0%) |
| 30 to 34 Years | 9 (23.1%) | 0 (0.0%) |
| 35 to 44 Years | 87 (56.1%) | 0 (0.0%) |
| 45 to 54 Years | 53 (58.9%) | 0 (0.0%) |
| 55 to 59 Years | 32 (56.1%) | 0 (0.0%) |
| 60 to 64 Years | 26 (37.1%) | 0 (0.0%) |
| 65 to 74 Years | 13 (11.0%) | 0 (0.0%) |
| 75 Years and over | 0 (0.0%) | 0 (0.0%) |
| Total | 543 (61.5%) | 6 (1.1%) |
Employment Status by Educational Attainment in Springville
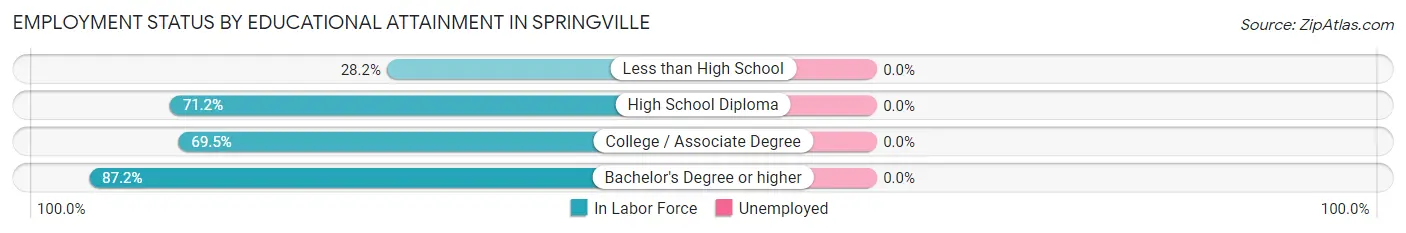
| Educational Attainment | In Labor Force | Unemployed |
| Less than High School | 20 (28.2%) | 0 (0.0%) |
| High School Diploma | 274 (71.2%) | 0 (0.0%) |
| College / Associate Degree | 91 (69.5%) | 0 (0.0%) |
| Bachelor's Degree or higher | 41 (87.2%) | 0 (0.0%) |
| Total | 426 (67.2%) | 0 (0.0%) |
Employment Occupations by Sex in Springville
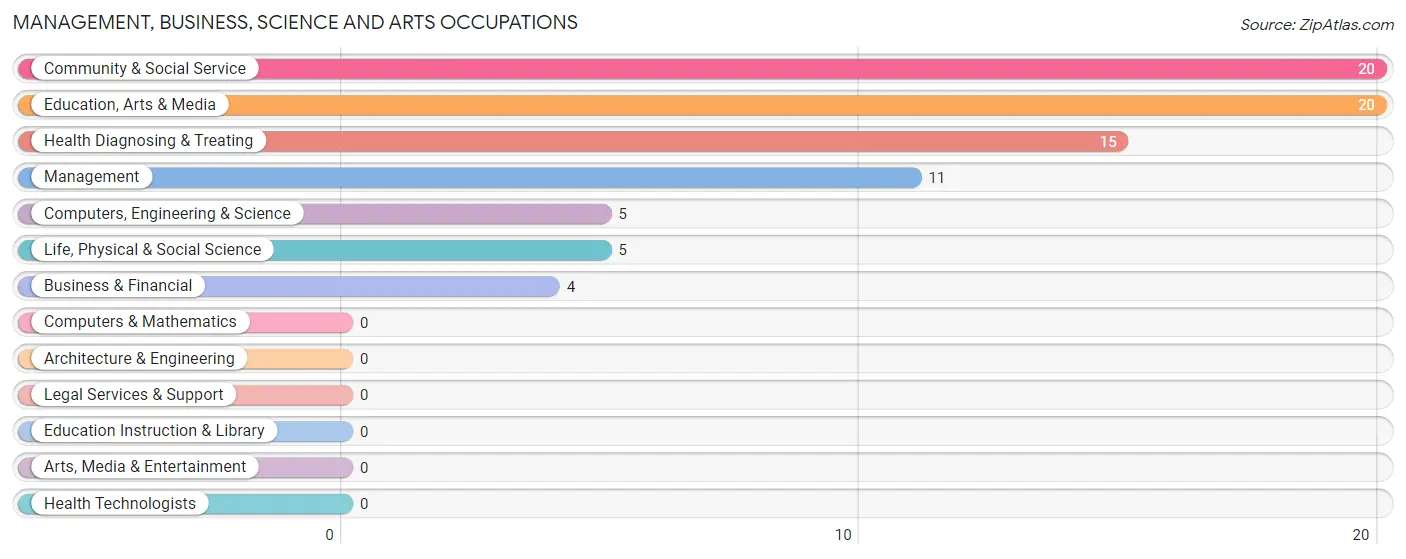
Management, Business, Science and Arts Occupations
The most common Management, Business, Science and Arts occupations in Springville are Community & Social Service (20 | 3.7%), Education, Arts & Media (20 | 3.7%), Health Diagnosing & Treating (15 | 2.8%), Management (11 | 2.1%), and Computers, Engineering & Science (5 | 0.9%).
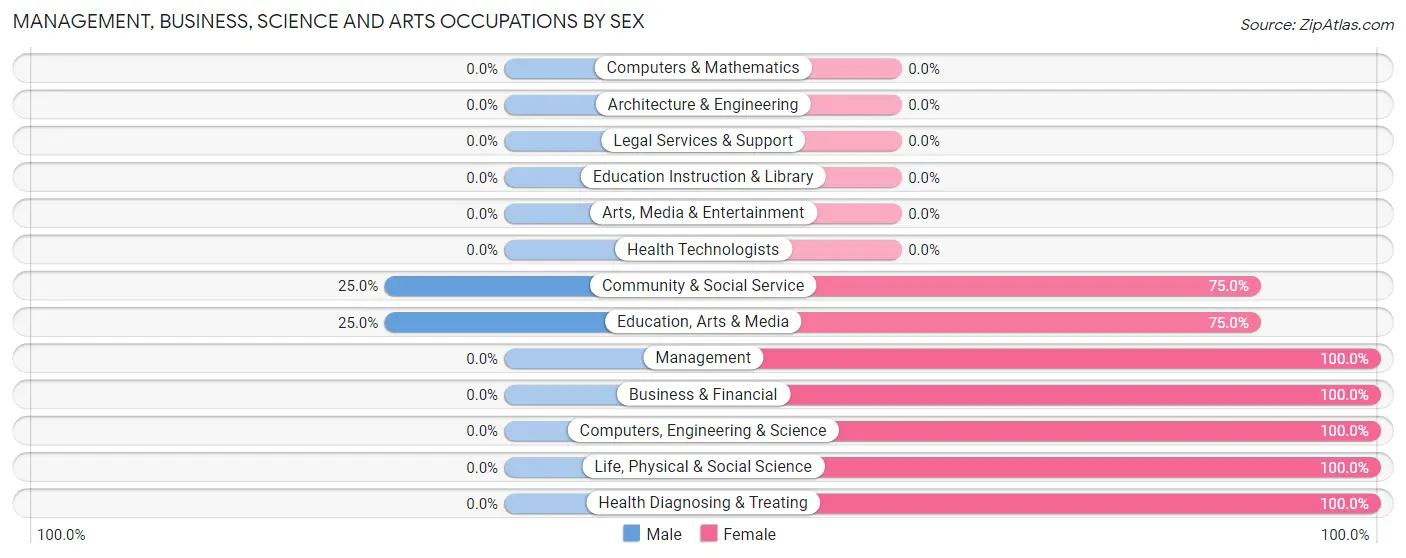
Management, Business, Science and Arts Occupations by Sex
Within the Management, Business, Science and Arts occupations in Springville, the most male-oriented occupations are Community & Social Service (25.0%), and Education, Arts & Media (25.0%), while the most female-oriented occupations are Management (100.0%), Business & Financial (100.0%), and Computers, Engineering & Science (100.0%).
| Occupation | Male | Female |
| Management | 0 (0.0%) | 11 (100.0%) |
| Business & Financial | 0 (0.0%) | 4 (100.0%) |
| Computers, Engineering & Science | 0 (0.0%) | 5 (100.0%) |
| Computers & Mathematics | 0 (0.0%) | 0 (0.0%) |
| Architecture & Engineering | 0 (0.0%) | 0 (0.0%) |
| Life, Physical & Social Science | 0 (0.0%) | 5 (100.0%) |
| Community & Social Service | 5 (25.0%) | 15 (75.0%) |
| Education, Arts & Media | 5 (25.0%) | 15 (75.0%) |
| Legal Services & Support | 0 (0.0%) | 0 (0.0%) |
| Education Instruction & Library | 0 (0.0%) | 0 (0.0%) |
| Arts, Media & Entertainment | 0 (0.0%) | 0 (0.0%) |
| Health Diagnosing & Treating | 0 (0.0%) | 15 (100.0%) |
| Health Technologists | 0 (0.0%) | 0 (0.0%) |
| Total (Category) | 5 (9.1%) | 50 (90.9%) |
| Total (Overall) | 264 (49.2%) | 273 (50.8%) |
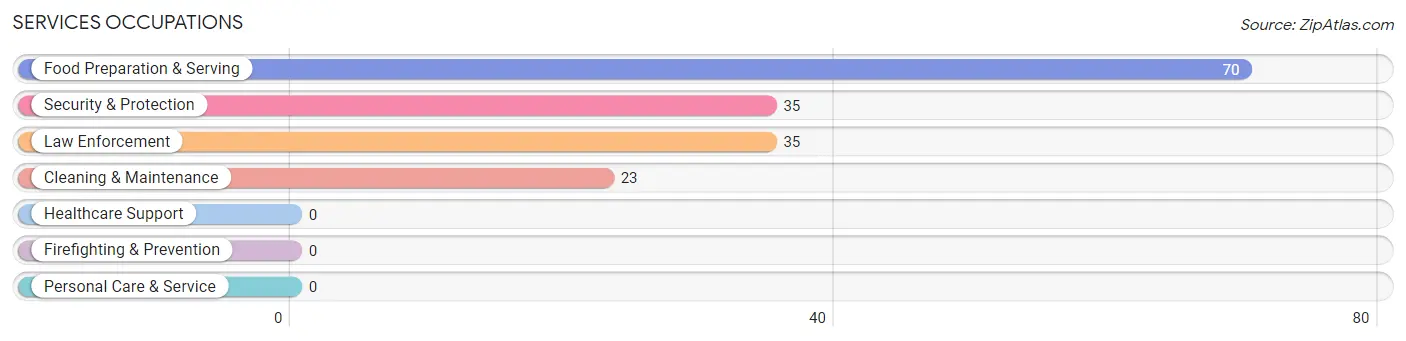
Services Occupations
The most common Services occupations in Springville are Food Preparation & Serving (70 | 13.0%), Security & Protection (35 | 6.5%), Law Enforcement (35 | 6.5%), and Cleaning & Maintenance (23 | 4.3%).
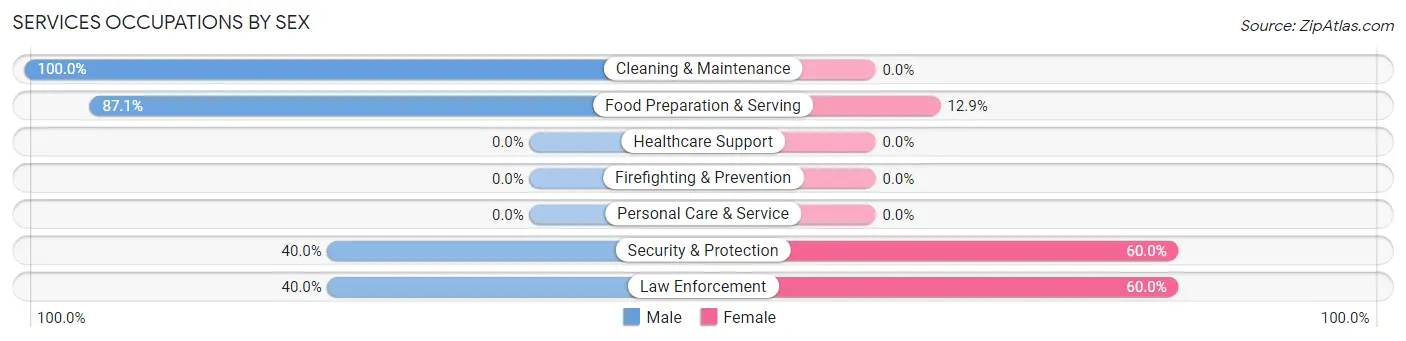
Services Occupations by Sex
Within the Services occupations in Springville, the most male-oriented occupations are Cleaning & Maintenance (100.0%), Food Preparation & Serving (87.1%), and Security & Protection (40.0%), while the most female-oriented occupations are Security & Protection (60.0%), Law Enforcement (60.0%), and Food Preparation & Serving (12.9%).
| Occupation | Male | Female |
| Healthcare Support | 0 (0.0%) | 0 (0.0%) |
| Security & Protection | 14 (40.0%) | 21 (60.0%) |
| Firefighting & Prevention | 0 (0.0%) | 0 (0.0%) |
| Law Enforcement | 14 (40.0%) | 21 (60.0%) |
| Food Preparation & Serving | 61 (87.1%) | 9 (12.9%) |
| Cleaning & Maintenance | 23 (100.0%) | 0 (0.0%) |
| Personal Care & Service | 0 (0.0%) | 0 (0.0%) |
| Total (Category) | 98 (76.6%) | 30 (23.4%) |
| Total (Overall) | 264 (49.2%) | 273 (50.8%) |
Sales and Office Occupations
The most common Sales and Office occupations in Springville are , and Office & Administration (192 | 35.7%).
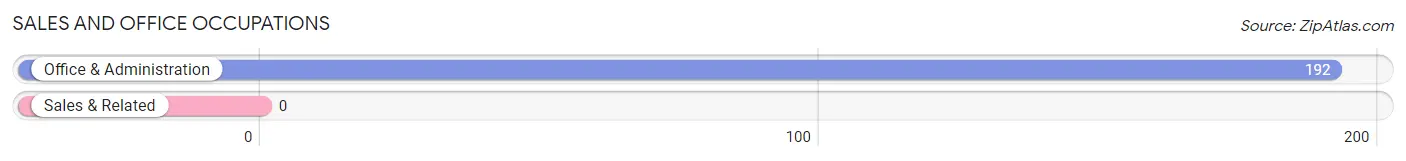
Sales and Office Occupations by Sex
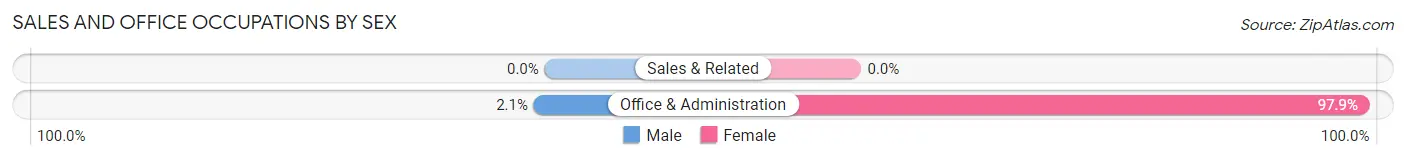
| Occupation | Male | Female |
| Sales & Related | 0 (0.0%) | 0 (0.0%) |
| Office & Administration | 4 (2.1%) | 188 (97.9%) |
| Total (Category) | 4 (2.1%) | 188 (97.9%) |
| Total (Overall) | 264 (49.2%) | 273 (50.8%) |
Natural Resources, Construction and Maintenance Occupations
The most common Natural Resources, Construction and Maintenance occupations in Springville are Construction & Extraction (105 | 19.6%), and Installation, Maintenance & Repair (15 | 2.8%).
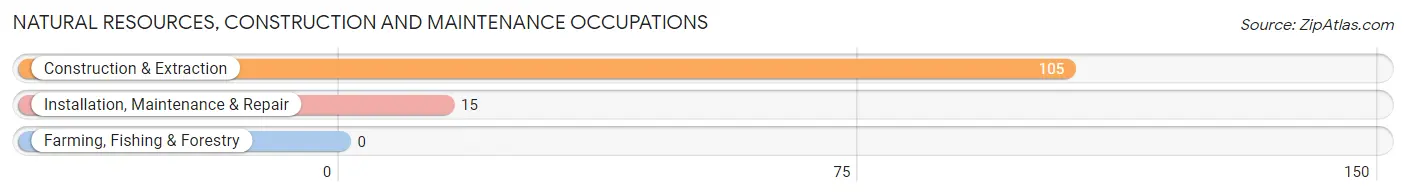
Natural Resources, Construction and Maintenance Occupations by Sex
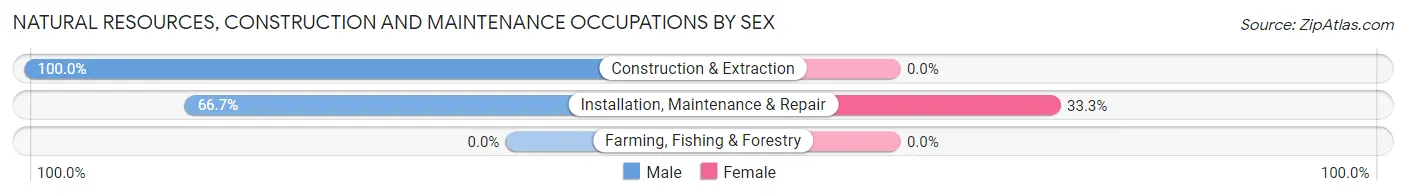
| Occupation | Male | Female |
| Farming, Fishing & Forestry | 0 (0.0%) | 0 (0.0%) |
| Construction & Extraction | 105 (100.0%) | 0 (0.0%) |
| Installation, Maintenance & Repair | 10 (66.7%) | 5 (33.3%) |
| Total (Category) | 115 (95.8%) | 5 (4.2%) |
| Total (Overall) | 264 (49.2%) | 273 (50.8%) |
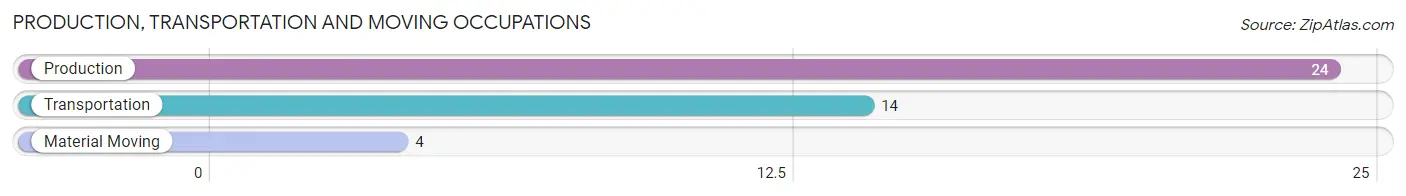
Production, Transportation and Moving Occupations
The most common Production, Transportation and Moving occupations in Springville are Production (24 | 4.5%), Transportation (14 | 2.6%), and Material Moving (4 | 0.7%).
Production, Transportation and Moving Occupations by Sex
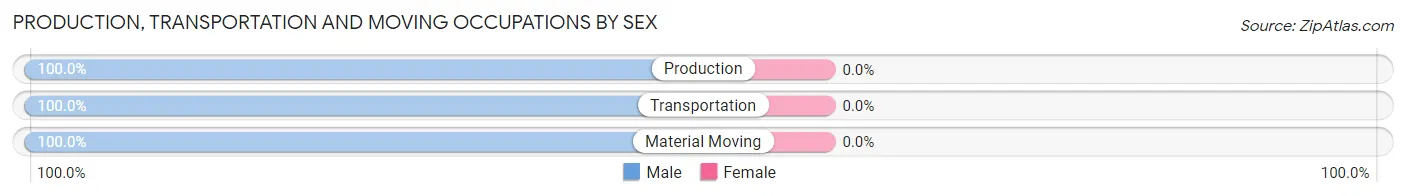
| Occupation | Male | Female |
| Production | 24 (100.0%) | 0 (0.0%) |
| Transportation | 14 (100.0%) | 0 (0.0%) |
| Material Moving | 4 (100.0%) | 0 (0.0%) |
| Total (Category) | 42 (100.0%) | 0 (0.0%) |
| Total (Overall) | 264 (49.2%) | 273 (50.8%) |
Employment Industries by Sex in Springville
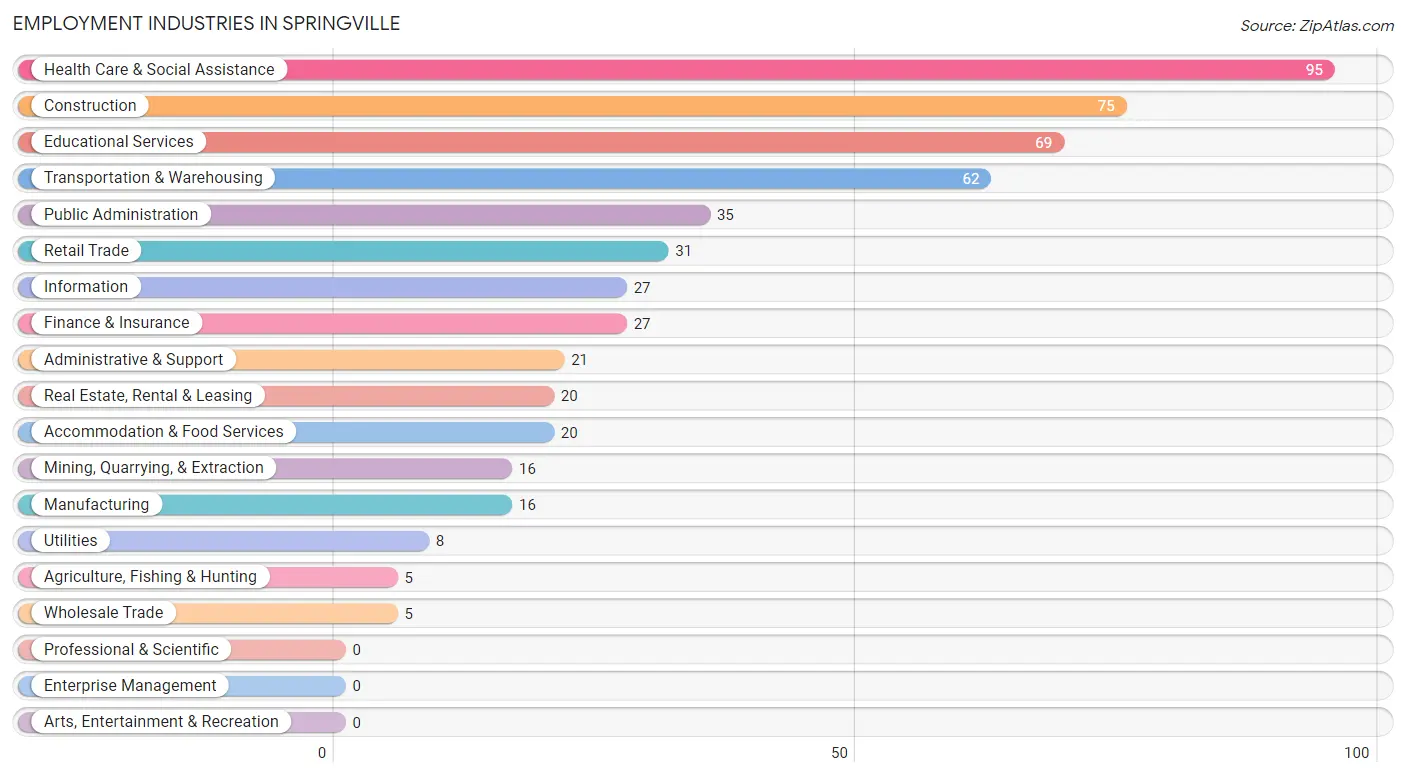
Employment Industries in Springville
The major employment industries in Springville include Health Care & Social Assistance (95 | 17.7%), Construction (75 | 14.0%), Educational Services (69 | 12.9%), Transportation & Warehousing (62 | 11.6%), and Public Administration (35 | 6.5%).
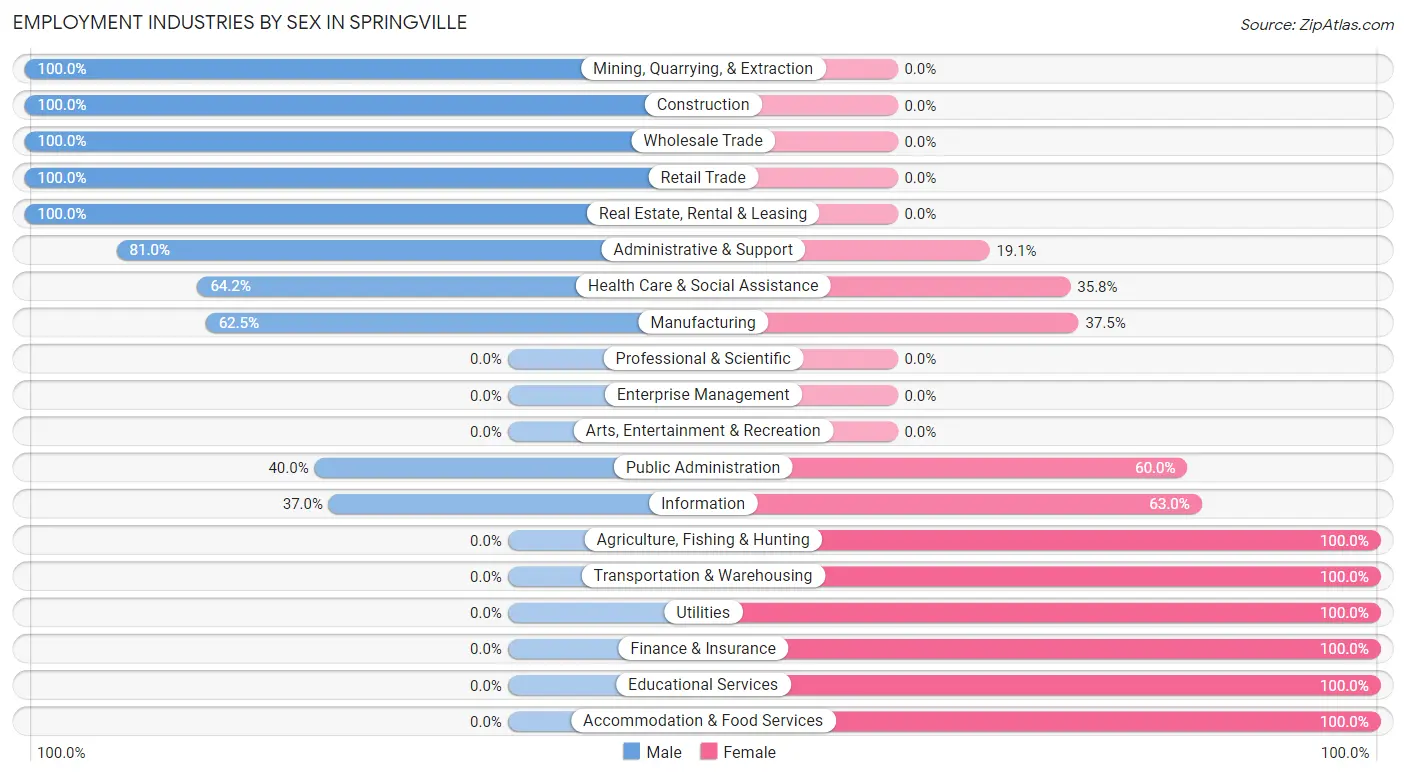
Employment Industries by Sex in Springville
The Springville industries that see more men than women are Mining, Quarrying, & Extraction (100.0%), Construction (100.0%), and Wholesale Trade (100.0%), whereas the industries that tend to have a higher number of women are Agriculture, Fishing & Hunting (100.0%), Transportation & Warehousing (100.0%), and Utilities (100.0%).
| Industry | Male | Female |
| Agriculture, Fishing & Hunting | 0 (0.0%) | 5 (100.0%) |
| Mining, Quarrying, & Extraction | 16 (100.0%) | 0 (0.0%) |
| Construction | 75 (100.0%) | 0 (0.0%) |
| Manufacturing | 10 (62.5%) | 6 (37.5%) |
| Wholesale Trade | 5 (100.0%) | 0 (0.0%) |
| Retail Trade | 31 (100.0%) | 0 (0.0%) |
| Transportation & Warehousing | 0 (0.0%) | 62 (100.0%) |
| Utilities | 0 (0.0%) | 8 (100.0%) |
| Information | 10 (37.0%) | 17 (63.0%) |
| Finance & Insurance | 0 (0.0%) | 27 (100.0%) |
| Real Estate, Rental & Leasing | 20 (100.0%) | 0 (0.0%) |
| Professional & Scientific | 0 (0.0%) | 0 (0.0%) |
| Enterprise Management | 0 (0.0%) | 0 (0.0%) |
| Administrative & Support | 17 (80.9%) | 4 (19.1%) |
| Educational Services | 0 (0.0%) | 69 (100.0%) |
| Health Care & Social Assistance | 61 (64.2%) | 34 (35.8%) |
| Arts, Entertainment & Recreation | 0 (0.0%) | 0 (0.0%) |
| Accommodation & Food Services | 0 (0.0%) | 20 (100.0%) |
| Public Administration | 14 (40.0%) | 21 (60.0%) |
| Total | 264 (49.2%) | 273 (50.8%) |
Education in Springville
School Enrollment in Springville
The most common levels of schooling among the 159 students in Springville are elementary school (54 | 34.0%), college / undergraduate (46 | 28.9%), and high school (23 | 14.5%).
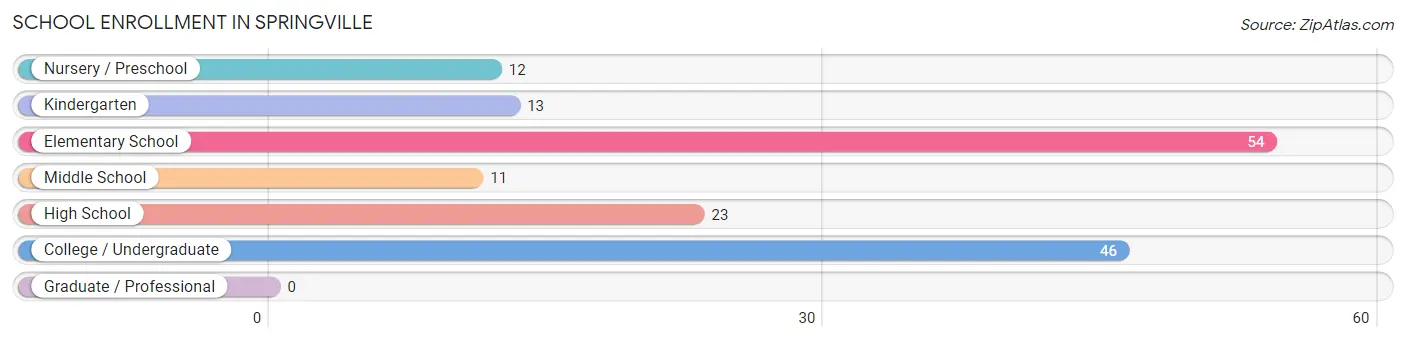
| School Level | # Students | % Students |
| Nursery / Preschool | 12 | 7.5% |
| Kindergarten | 13 | 8.2% |
| Elementary School | 54 | 34.0% |
| Middle School | 11 | 6.9% |
| High School | 23 | 14.5% |
| College / Undergraduate | 46 | 28.9% |
| Graduate / Professional | 0 | 0.0% |
| Total | 159 | 100.0% |
School Enrollment by Age by Funding Source in Springville
Out of a total of 159 students who are enrolled in schools in Springville, 42 (26.4%) attend a private institution, while the remaining 117 (73.6%) are enrolled in public schools. The age group of 3 to 4 year olds has the highest likelihood of being enrolled in private schools, with 6 (100.0% in the age bracket) enrolled. Conversely, the age group of 10 to 14 year olds has the lowest likelihood of being enrolled in a private school, with 23 (100.0% in the age bracket) attending a public institution.
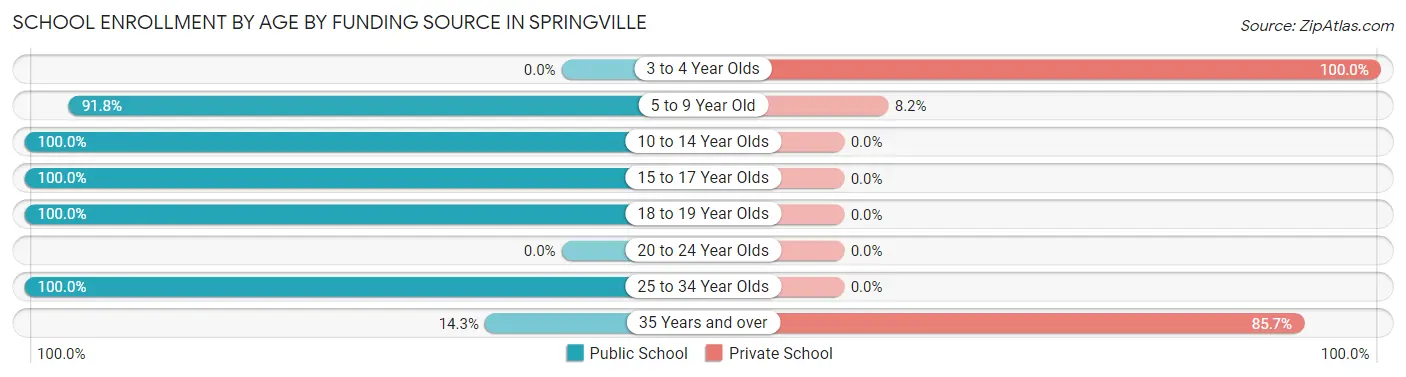
| Age Bracket | Public School | Private School |
| 3 to 4 Year Olds | 0 (0.0%) | 6 (100.0%) |
| 5 to 9 Year Old | 67 (91.8%) | 6 (8.2%) |
| 10 to 14 Year Olds | 23 (100.0%) | 0 (0.0%) |
| 15 to 17 Year Olds | 6 (100.0%) | 0 (0.0%) |
| 18 to 19 Year Olds | 9 (100.0%) | 0 (0.0%) |
| 20 to 24 Year Olds | 0 (0.0%) | 0 (0.0%) |
| 25 to 34 Year Olds | 7 (100.0%) | 0 (0.0%) |
| 35 Years and over | 5 (14.3%) | 30 (85.7%) |
| Total | 117 (73.6%) | 42 (26.4%) |
Educational Attainment by Field of Study in Springville
Education (22 | 37.3%), arts & humanities (21 | 35.6%), science & technology (6 | 10.2%), bio, nature & agricultural (5 | 8.5%), and communications (5 | 8.5%) are the most common fields of study among 59 individuals in Springville who have obtained a bachelor's degree or higher.
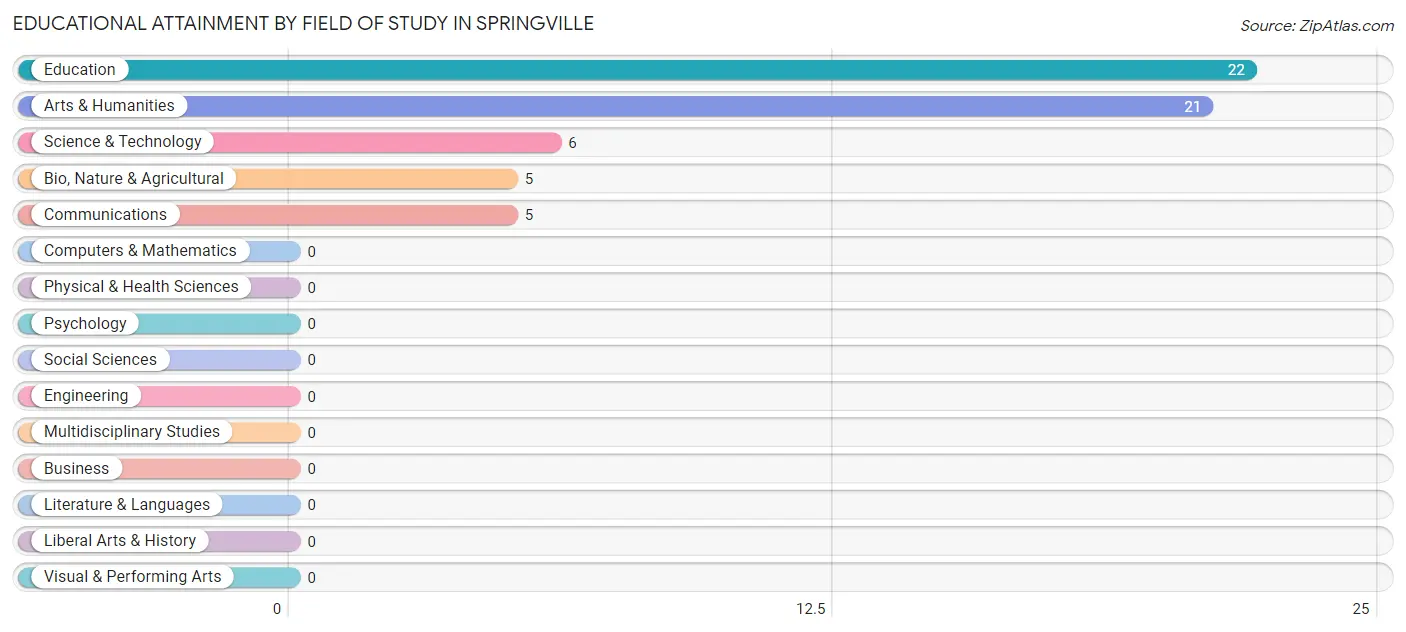
| Field of Study | # Graduates | % Graduates |
| Computers & Mathematics | 0 | 0.0% |
| Bio, Nature & Agricultural | 5 | 8.5% |
| Physical & Health Sciences | 0 | 0.0% |
| Psychology | 0 | 0.0% |
| Social Sciences | 0 | 0.0% |
| Engineering | 0 | 0.0% |
| Multidisciplinary Studies | 0 | 0.0% |
| Science & Technology | 6 | 10.2% |
| Business | 0 | 0.0% |
| Education | 22 | 37.3% |
| Literature & Languages | 0 | 0.0% |
| Liberal Arts & History | 0 | 0.0% |
| Visual & Performing Arts | 0 | 0.0% |
| Communications | 5 | 8.5% |
| Arts & Humanities | 21 | 35.6% |
| Total | 59 | 100.0% |
Transportation & Commute in Springville
Vehicle Availability by Sex in Springville
The most prevalent vehicle ownership categories in Springville are males with 2 vehicles (181, accounting for 68.6%) and females with 2 vehicles (150, making up 66.3%).
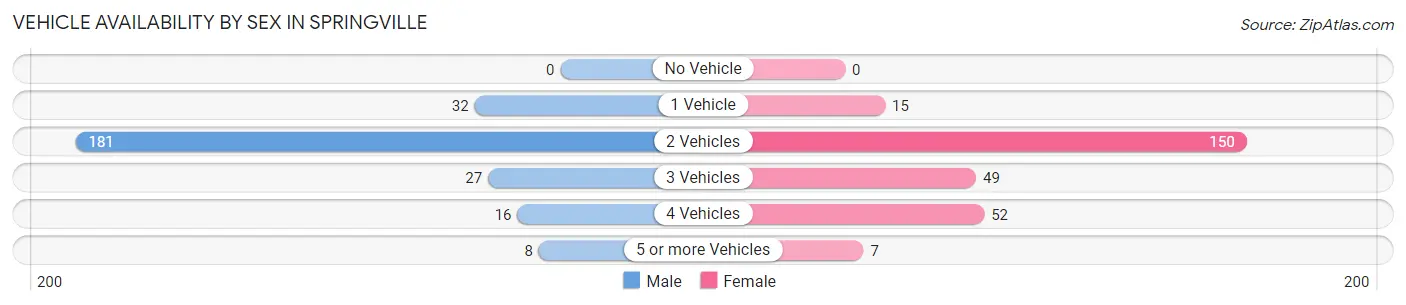
| Vehicles Available | Male | Female |
| No Vehicle | 0 (0.0%) | 0 (0.0%) |
| 1 Vehicle | 32 (12.1%) | 15 (5.5%) |
| 2 Vehicles | 181 (68.6%) | 150 (54.9%) |
| 3 Vehicles | 27 (10.2%) | 49 (17.9%) |
| 4 Vehicles | 16 (6.1%) | 52 (19.1%) |
| 5 or more Vehicles | 8 (3.0%) | 7 (2.6%) |
| Total | 264 (100.0%) | 273 (100.0%) |
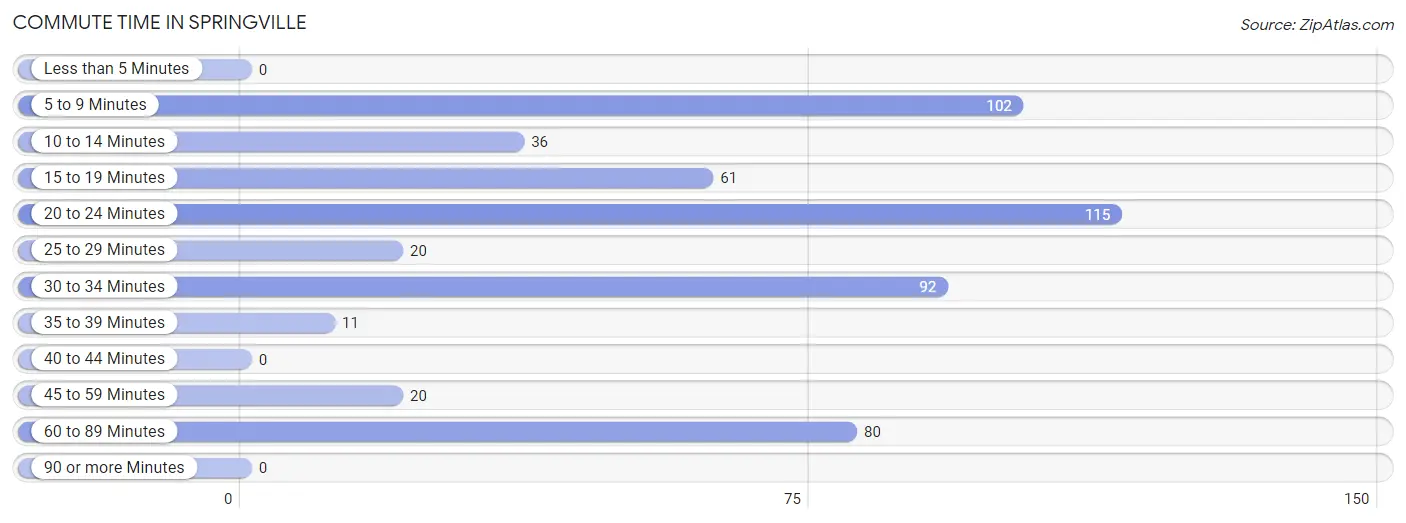
Commute Time in Springville
The most frequently occuring commute durations in Springville are 20 to 24 minutes (115 commuters, 21.4%), 5 to 9 minutes (102 commuters, 19.0%), and 30 to 34 minutes (92 commuters, 17.1%).
| Commute Time | # Commuters | % Commuters |
| Less than 5 Minutes | 0 | 0.0% |
| 5 to 9 Minutes | 102 | 19.0% |
| 10 to 14 Minutes | 36 | 6.7% |
| 15 to 19 Minutes | 61 | 11.4% |
| 20 to 24 Minutes | 115 | 21.4% |
| 25 to 29 Minutes | 20 | 3.7% |
| 30 to 34 Minutes | 92 | 17.1% |
| 35 to 39 Minutes | 11 | 2.1% |
| 40 to 44 Minutes | 0 | 0.0% |
| 45 to 59 Minutes | 20 | 3.7% |
| 60 to 89 Minutes | 80 | 14.9% |
| 90 or more Minutes | 0 | 0.0% |
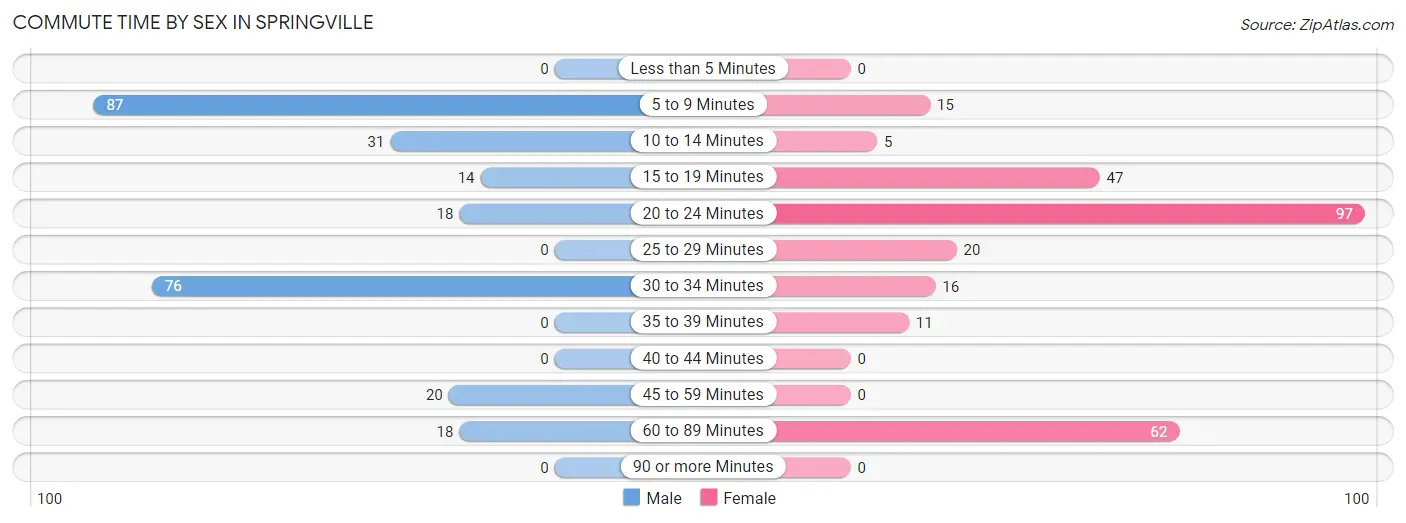
Commute Time by Sex in Springville
The most common commute times in Springville are 5 to 9 minutes (87 commuters, 33.0%) for males and 20 to 24 minutes (97 commuters, 35.5%) for females.
| Commute Time | Male | Female |
| Less than 5 Minutes | 0 (0.0%) | 0 (0.0%) |
| 5 to 9 Minutes | 87 (33.0%) | 15 (5.5%) |
| 10 to 14 Minutes | 31 (11.7%) | 5 (1.8%) |
| 15 to 19 Minutes | 14 (5.3%) | 47 (17.2%) |
| 20 to 24 Minutes | 18 (6.8%) | 97 (35.5%) |
| 25 to 29 Minutes | 0 (0.0%) | 20 (7.3%) |
| 30 to 34 Minutes | 76 (28.8%) | 16 (5.9%) |
| 35 to 39 Minutes | 0 (0.0%) | 11 (4.0%) |
| 40 to 44 Minutes | 0 (0.0%) | 0 (0.0%) |
| 45 to 59 Minutes | 20 (7.6%) | 0 (0.0%) |
| 60 to 89 Minutes | 18 (6.8%) | 62 (22.7%) |
| 90 or more Minutes | 0 (0.0%) | 0 (0.0%) |
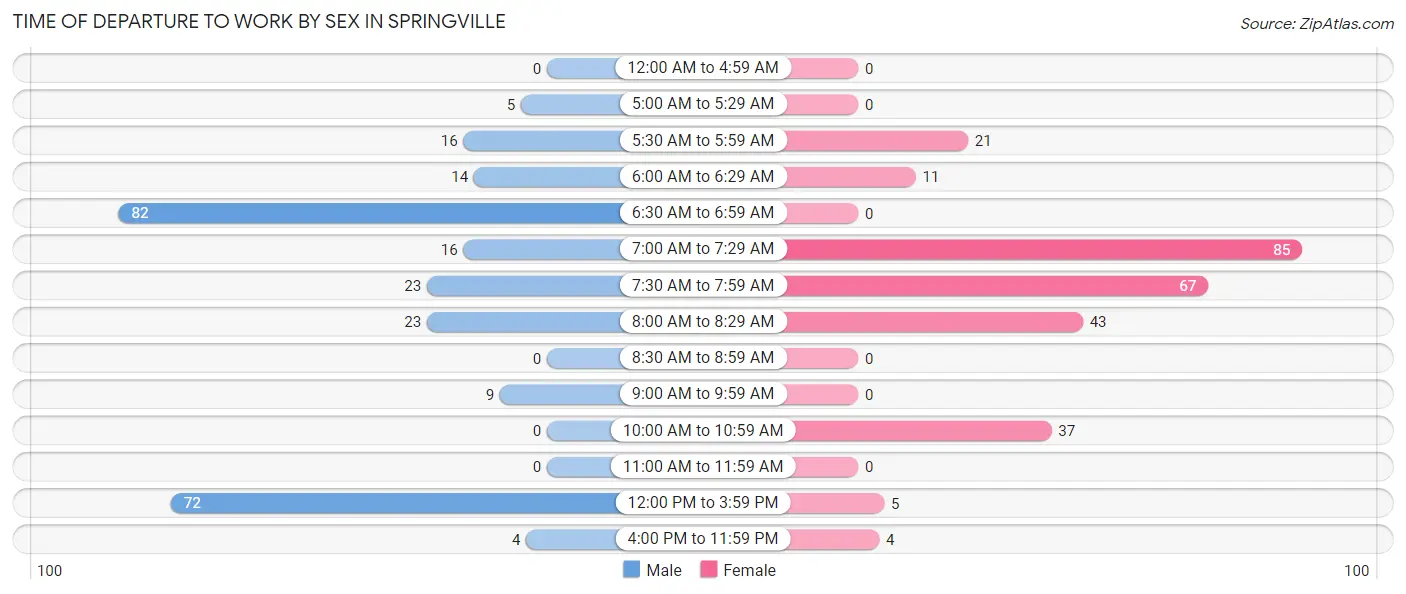
Time of Departure to Work by Sex in Springville
The most frequent times of departure to work in Springville are 6:30 AM to 6:59 AM (82, 31.1%) for males and 7:00 AM to 7:29 AM (85, 31.1%) for females.
| Time of Departure | Male | Female |
| 12:00 AM to 4:59 AM | 0 (0.0%) | 0 (0.0%) |
| 5:00 AM to 5:29 AM | 5 (1.9%) | 0 (0.0%) |
| 5:30 AM to 5:59 AM | 16 (6.1%) | 21 (7.7%) |
| 6:00 AM to 6:29 AM | 14 (5.3%) | 11 (4.0%) |
| 6:30 AM to 6:59 AM | 82 (31.1%) | 0 (0.0%) |
| 7:00 AM to 7:29 AM | 16 (6.1%) | 85 (31.1%) |
| 7:30 AM to 7:59 AM | 23 (8.7%) | 67 (24.5%) |
| 8:00 AM to 8:29 AM | 23 (8.7%) | 43 (15.8%) |
| 8:30 AM to 8:59 AM | 0 (0.0%) | 0 (0.0%) |
| 9:00 AM to 9:59 AM | 9 (3.4%) | 0 (0.0%) |
| 10:00 AM to 10:59 AM | 0 (0.0%) | 37 (13.6%) |
| 11:00 AM to 11:59 AM | 0 (0.0%) | 0 (0.0%) |
| 12:00 PM to 3:59 PM | 72 (27.3%) | 5 (1.8%) |
| 4:00 PM to 11:59 PM | 4 (1.5%) | 4 (1.5%) |
| Total | 264 (100.0%) | 273 (100.0%) |
Housing Occupancy in Springville
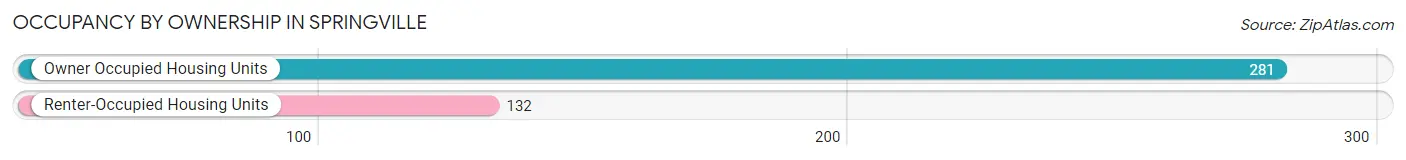
Occupancy by Ownership in Springville
Of the total 413 dwellings in Springville, owner-occupied units account for 281 (68.0%), while renter-occupied units make up 132 (32.0%).
| Occupancy | # Housing Units | % Housing Units |
| Owner Occupied Housing Units | 281 | 68.0% |
| Renter-Occupied Housing Units | 132 | 32.0% |
| Total Occupied Housing Units | 413 | 100.0% |
Occupancy by Household Size in Springville
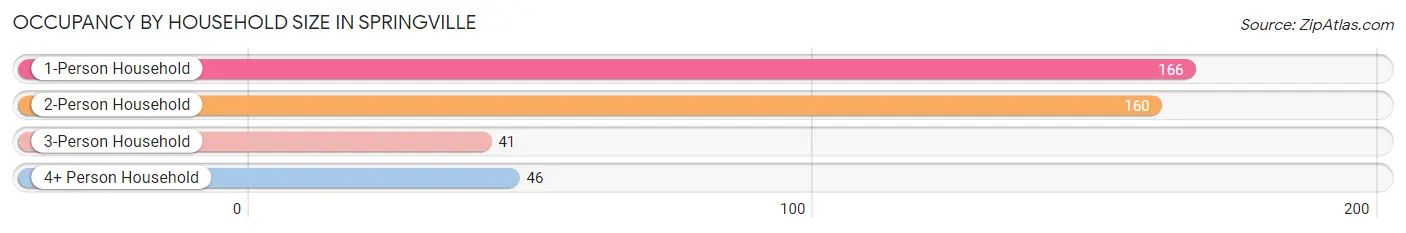
| Household Size | # Housing Units | % Housing Units |
| 1-Person Household | 166 | 40.2% |
| 2-Person Household | 160 | 38.7% |
| 3-Person Household | 41 | 9.9% |
| 4+ Person Household | 46 | 11.1% |
| Total Housing Units | 413 | 100.0% |
Occupancy by Ownership by Household Size in Springville
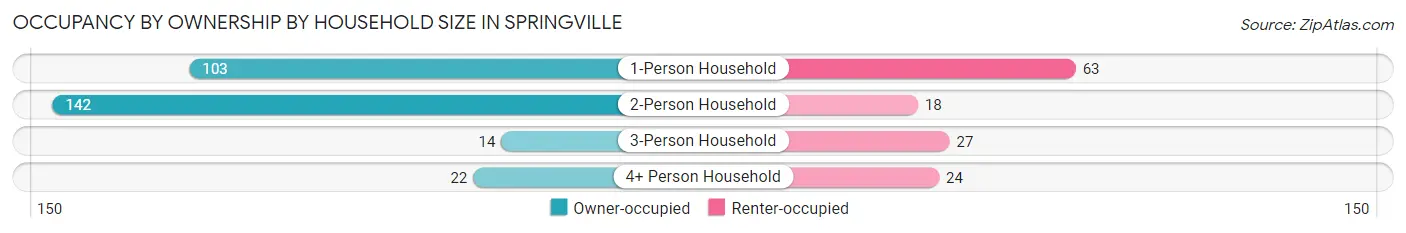
| Household Size | Owner-occupied | Renter-occupied |
| 1-Person Household | 103 (62.1%) | 63 (38.0%) |
| 2-Person Household | 142 (88.7%) | 18 (11.3%) |
| 3-Person Household | 14 (34.2%) | 27 (65.8%) |
| 4+ Person Household | 22 (47.8%) | 24 (52.2%) |
| Total Housing Units | 281 (68.0%) | 132 (32.0%) |
Occupancy by Educational Attainment in Springville
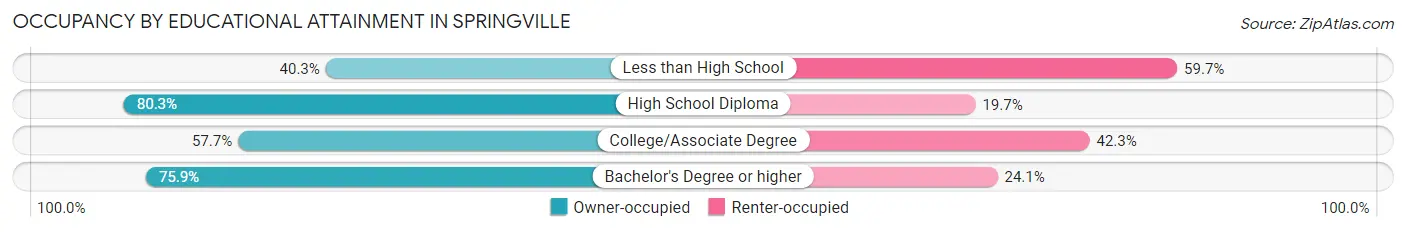
| Household Size | Owner-occupied | Renter-occupied |
| Less than High School | 25 (40.3%) | 37 (59.7%) |
| High School Diploma | 155 (80.3%) | 38 (19.7%) |
| College/Associate Degree | 60 (57.7%) | 44 (42.3%) |
| Bachelor's Degree or higher | 41 (75.9%) | 13 (24.1%) |
Occupancy by Age of Householder in Springville
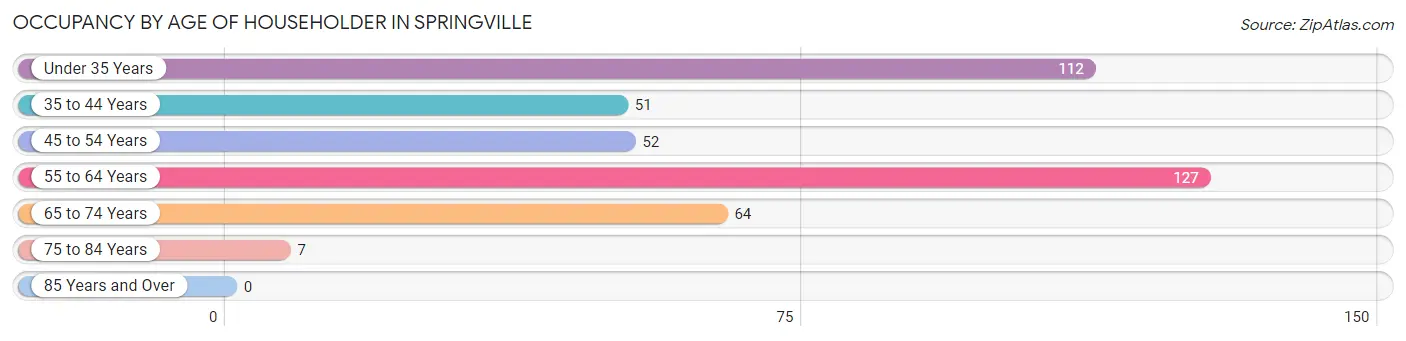
| Age Bracket | # Households | % Households |
| Under 35 Years | 112 | 27.1% |
| 35 to 44 Years | 51 | 12.3% |
| 45 to 54 Years | 52 | 12.6% |
| 55 to 64 Years | 127 | 30.7% |
| 65 to 74 Years | 64 | 15.5% |
| 75 to 84 Years | 7 | 1.7% |
| 85 Years and Over | 0 | 0.0% |
| Total | 413 | 100.0% |
Housing Finances in Springville
Median Income by Occupancy in Springville
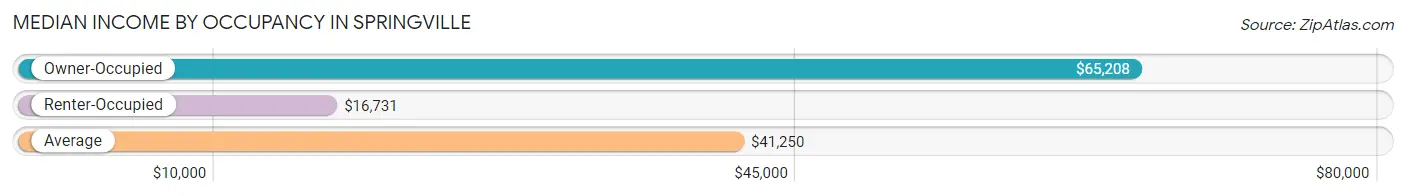
| Occupancy Type | # Households | Median Income |
| Owner-Occupied | 281 (68.0%) | $65,208 |
| Renter-Occupied | 132 (32.0%) | $16,731 |
| Average | 413 (100.0%) | $41,250 |
Occupancy by Householder Income Bracket in Springville
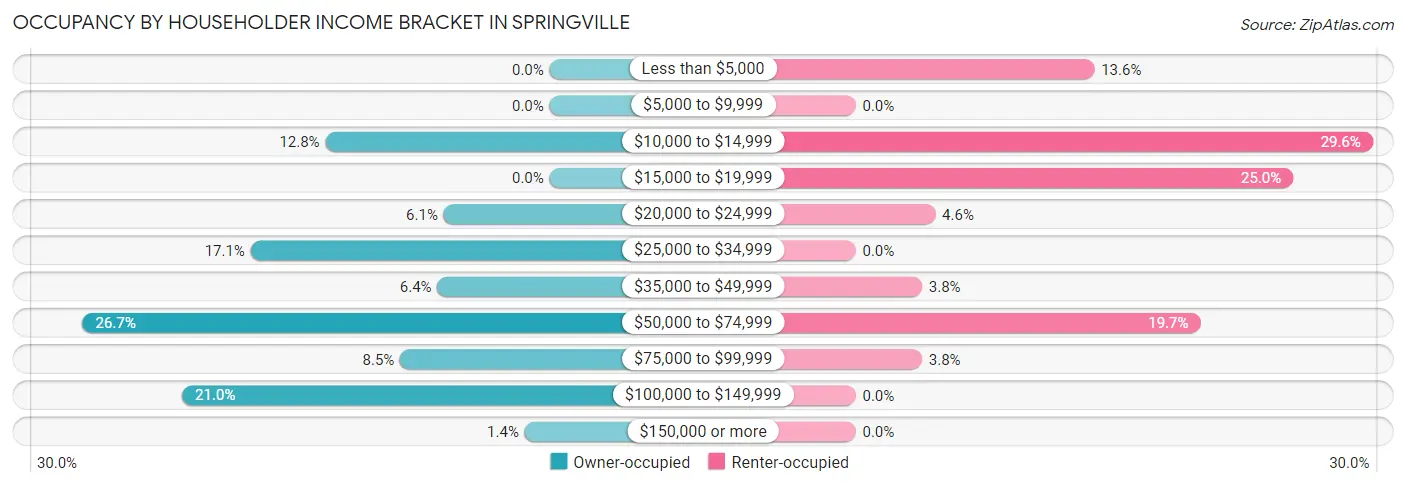
| Income Bracket | Owner-occupied | Renter-occupied |
| Less than $5,000 | 0 (0.0%) | 18 (13.6%) |
| $5,000 to $9,999 | 0 (0.0%) | 0 (0.0%) |
| $10,000 to $14,999 | 36 (12.8%) | 39 (29.5%) |
| $15,000 to $19,999 | 0 (0.0%) | 33 (25.0%) |
| $20,000 to $24,999 | 17 (6.0%) | 6 (4.5%) |
| $25,000 to $34,999 | 48 (17.1%) | 0 (0.0%) |
| $35,000 to $49,999 | 18 (6.4%) | 5 (3.8%) |
| $50,000 to $74,999 | 75 (26.7%) | 26 (19.7%) |
| $75,000 to $99,999 | 24 (8.5%) | 5 (3.8%) |
| $100,000 to $149,999 | 59 (21.0%) | 0 (0.0%) |
| $150,000 or more | 4 (1.4%) | 0 (0.0%) |
| Total | 281 (100.0%) | 132 (100.0%) |
Monthly Housing Cost Tiers in Springville
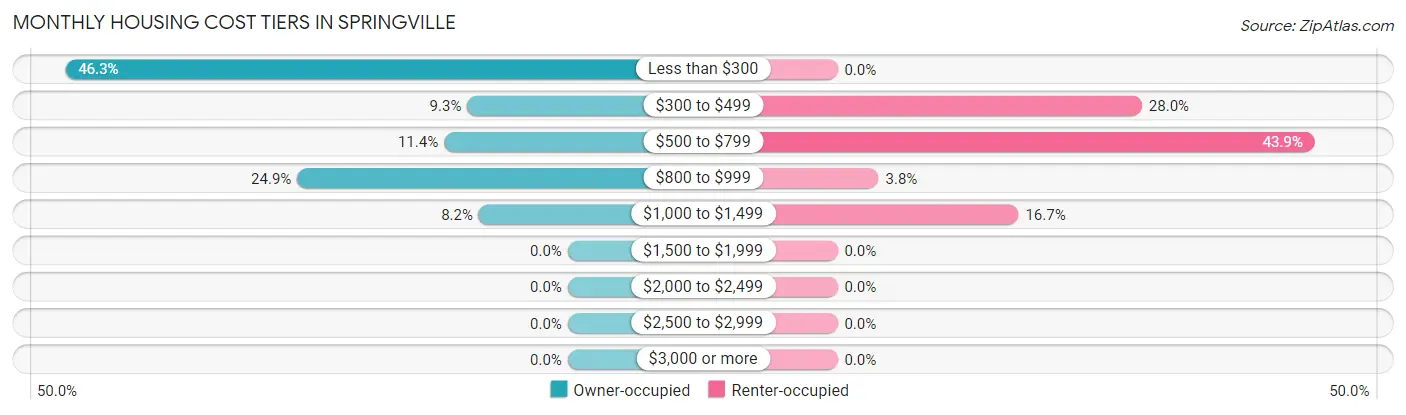
| Monthly Cost | Owner-occupied | Renter-occupied |
| Less than $300 | 130 (46.3%) | 0 (0.0%) |
| $300 to $499 | 26 (9.2%) | 37 (28.0%) |
| $500 to $799 | 32 (11.4%) | 58 (43.9%) |
| $800 to $999 | 70 (24.9%) | 5 (3.8%) |
| $1,000 to $1,499 | 23 (8.2%) | 22 (16.7%) |
| $1,500 to $1,999 | 0 (0.0%) | 0 (0.0%) |
| $2,000 to $2,499 | 0 (0.0%) | 0 (0.0%) |
| $2,500 to $2,999 | 0 (0.0%) | 0 (0.0%) |
| $3,000 or more | 0 (0.0%) | 0 (0.0%) |
| Total | 281 (100.0%) | 132 (100.0%) |
Physical Housing Characteristics in Springville
Housing Structures in Springville
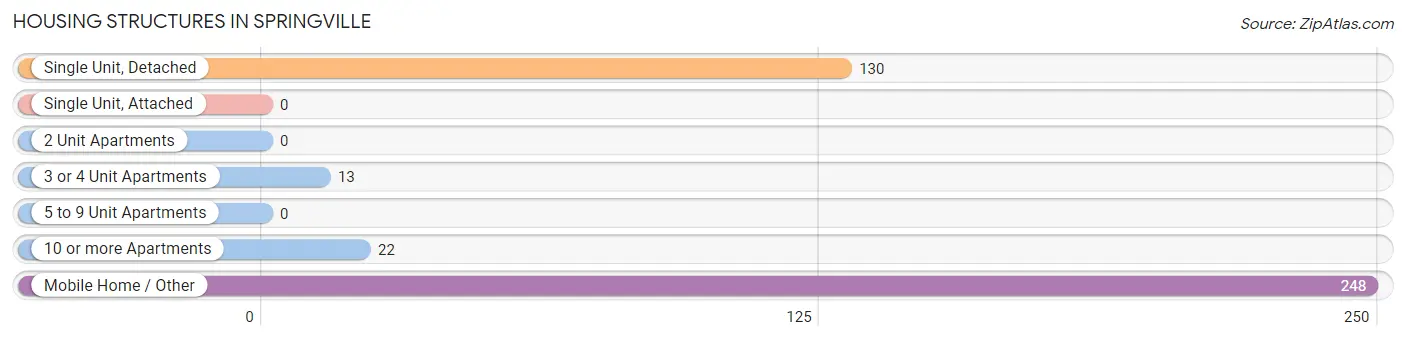
| Structure Type | # Housing Units | % Housing Units |
| Single Unit, Detached | 130 | 31.5% |
| Single Unit, Attached | 0 | 0.0% |
| 2 Unit Apartments | 0 | 0.0% |
| 3 or 4 Unit Apartments | 13 | 3.2% |
| 5 to 9 Unit Apartments | 0 | 0.0% |
| 10 or more Apartments | 22 | 5.3% |
| Mobile Home / Other | 248 | 60.1% |
| Total | 413 | 100.0% |
Housing Structures by Occupancy in Springville
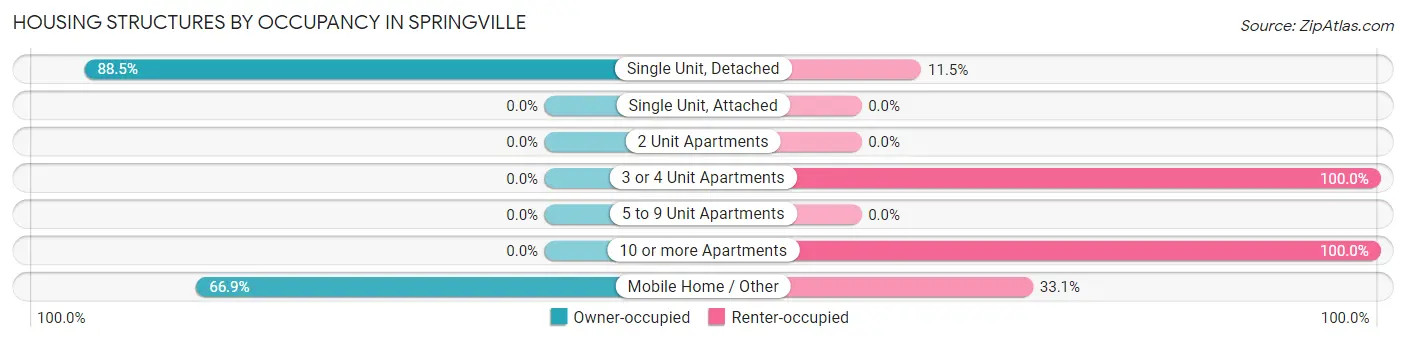
| Structure Type | Owner-occupied | Renter-occupied |
| Single Unit, Detached | 115 (88.5%) | 15 (11.5%) |
| Single Unit, Attached | 0 (0.0%) | 0 (0.0%) |
| 2 Unit Apartments | 0 (0.0%) | 0 (0.0%) |
| 3 or 4 Unit Apartments | 0 (0.0%) | 13 (100.0%) |
| 5 to 9 Unit Apartments | 0 (0.0%) | 0 (0.0%) |
| 10 or more Apartments | 0 (0.0%) | 22 (100.0%) |
| Mobile Home / Other | 166 (66.9%) | 82 (33.1%) |
| Total | 281 (68.0%) | 132 (32.0%) |
Housing Structures by Number of Rooms in Springville
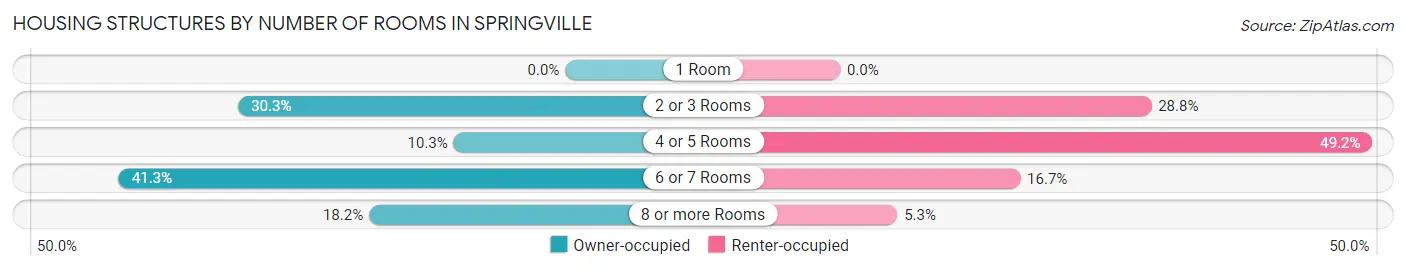
| Number of Rooms | Owner-occupied | Renter-occupied |
| 1 Room | 0 (0.0%) | 0 (0.0%) |
| 2 or 3 Rooms | 85 (30.2%) | 38 (28.8%) |
| 4 or 5 Rooms | 29 (10.3%) | 65 (49.2%) |
| 6 or 7 Rooms | 116 (41.3%) | 22 (16.7%) |
| 8 or more Rooms | 51 (18.1%) | 7 (5.3%) |
| Total | 281 (100.0%) | 132 (100.0%) |
Housing Structure by Heating Type in Springville
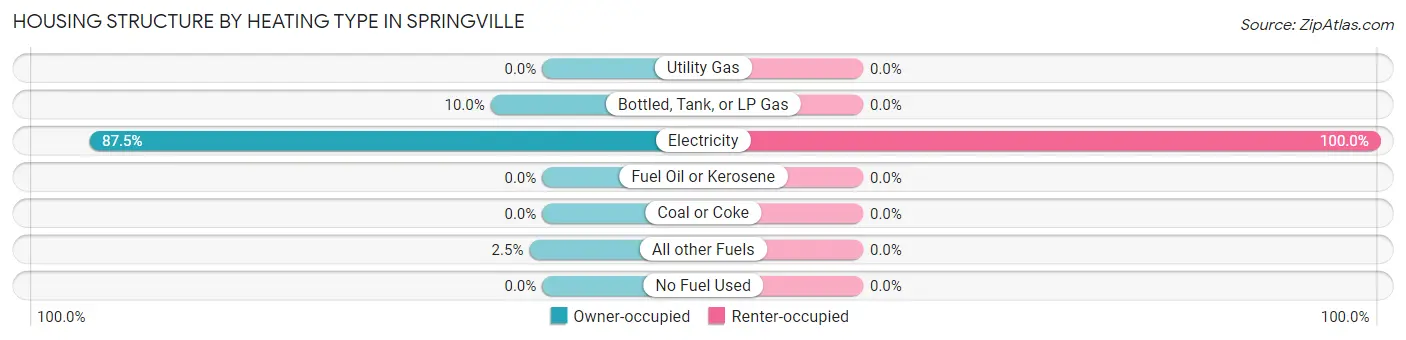
| Heating Type | Owner-occupied | Renter-occupied |
| Utility Gas | 0 (0.0%) | 0 (0.0%) |
| Bottled, Tank, or LP Gas | 28 (10.0%) | 0 (0.0%) |
| Electricity | 246 (87.5%) | 132 (100.0%) |
| Fuel Oil or Kerosene | 0 (0.0%) | 0 (0.0%) |
| Coal or Coke | 0 (0.0%) | 0 (0.0%) |
| All other Fuels | 7 (2.5%) | 0 (0.0%) |
| No Fuel Used | 0 (0.0%) | 0 (0.0%) |
| Total | 281 (100.0%) | 132 (100.0%) |
Household Vehicle Usage in Springville
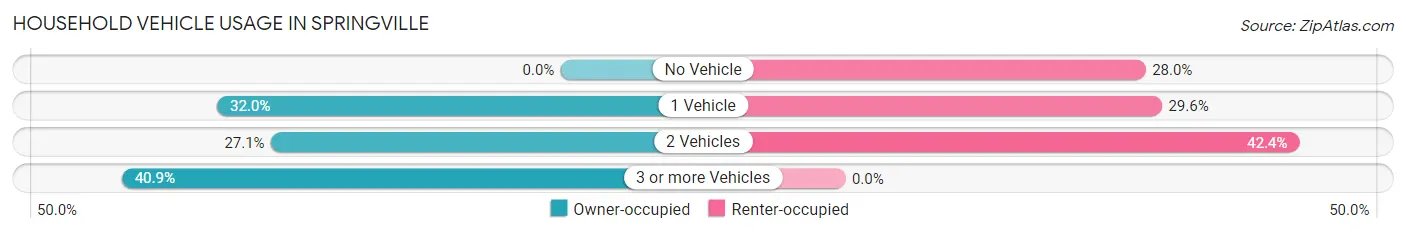
| Vehicles per Household | Owner-occupied | Renter-occupied |
| No Vehicle | 0 (0.0%) | 37 (28.0%) |
| 1 Vehicle | 90 (32.0%) | 39 (29.5%) |
| 2 Vehicles | 76 (27.1%) | 56 (42.4%) |
| 3 or more Vehicles | 115 (40.9%) | 0 (0.0%) |
| Total | 281 (100.0%) | 132 (100.0%) |
Real Estate & Mortgages in Springville
Real Estate and Mortgage Overview in Springville
| Characteristic | Without Mortgage | With Mortgage |
| Housing Units | 170 | 111 |
| Median Property Value | - | - |
| Median Household Income | $55,313 | $4 |
| Monthly Housing Costs | $245 | $0 |
| Real Estate Taxes | $313 | $0 |
Property Value by Mortgage Status in Springville
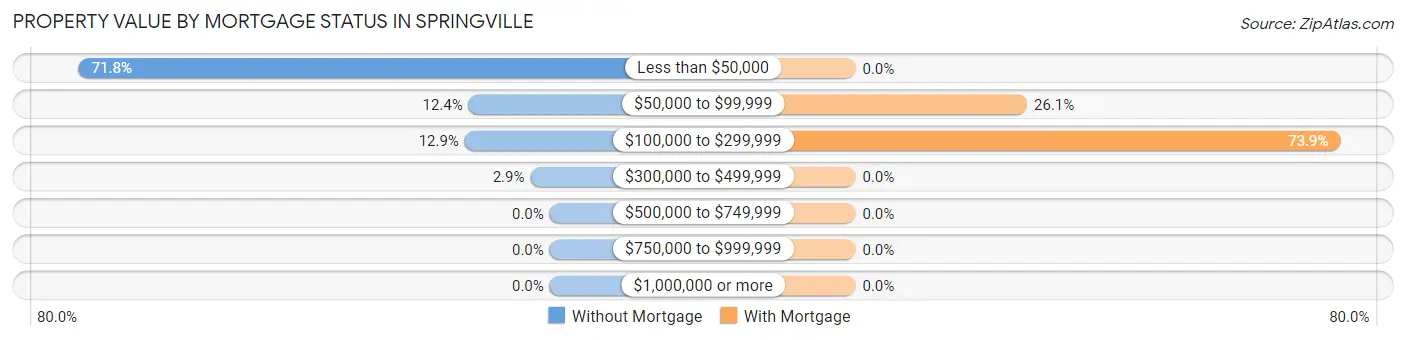
| Property Value | Without Mortgage | With Mortgage |
| Less than $50,000 | 122 (71.8%) | 0 (0.0%) |
| $50,000 to $99,999 | 21 (12.3%) | 29 (26.1%) |
| $100,000 to $299,999 | 22 (12.9%) | 82 (73.9%) |
| $300,000 to $499,999 | 5 (2.9%) | 0 (0.0%) |
| $500,000 to $749,999 | 0 (0.0%) | 0 (0.0%) |
| $750,000 to $999,999 | 0 (0.0%) | 0 (0.0%) |
| $1,000,000 or more | 0 (0.0%) | 0 (0.0%) |
| Total | 170 (100.0%) | 111 (100.0%) |
Household Income by Mortgage Status in Springville
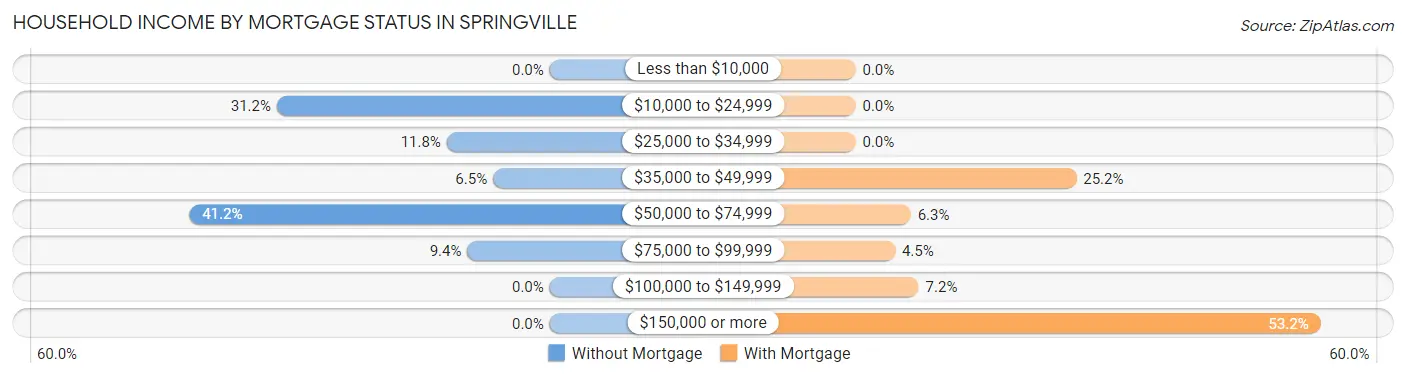
| Household Income | Without Mortgage | With Mortgage |
| Less than $10,000 | 0 (0.0%) | 0 (0.0%) |
| $10,000 to $24,999 | 53 (31.2%) | 0 (0.0%) |
| $25,000 to $34,999 | 20 (11.8%) | 0 (0.0%) |
| $35,000 to $49,999 | 11 (6.5%) | 28 (25.2%) |
| $50,000 to $74,999 | 70 (41.2%) | 7 (6.3%) |
| $75,000 to $99,999 | 16 (9.4%) | 5 (4.5%) |
| $100,000 to $149,999 | 0 (0.0%) | 8 (7.2%) |
| $150,000 or more | 0 (0.0%) | 59 (53.1%) |
| Total | 170 (100.0%) | 111 (100.0%) |
Property Value to Household Income Ratio in Springville
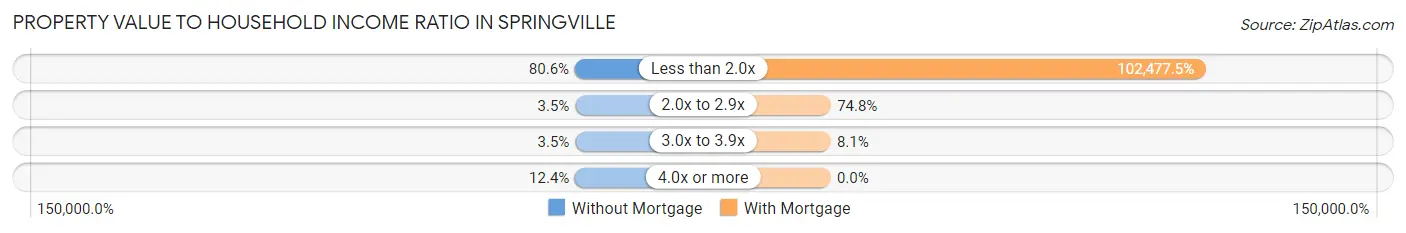
| Value-to-Income Ratio | Without Mortgage | With Mortgage |
| Less than 2.0x | 137 (80.6%) | 113,750 (102,477.5%) |
| 2.0x to 2.9x | 6 (3.5%) | 83 (74.8%) |
| 3.0x to 3.9x | 6 (3.5%) | 9 (8.1%) |
| 4.0x or more | 21 (12.3%) | 0 (0.0%) |
| Total | 170 (100.0%) | 111 (100.0%) |
Real Estate Taxes by Mortgage Status in Springville
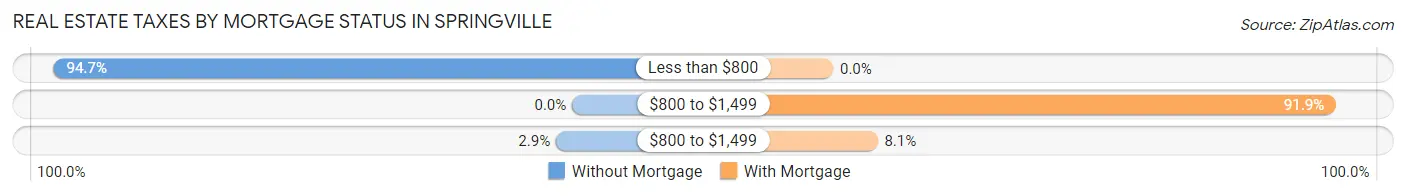
| Property Taxes | Without Mortgage | With Mortgage |
| Less than $800 | 161 (94.7%) | 0 (0.0%) |
| $800 to $1,499 | 0 (0.0%) | 102 (91.9%) |
| $800 to $1,499 | 5 (2.9%) | 9 (8.1%) |
| Total | 170 (100.0%) | 111 (100.0%) |
Health & Disability in Springville
Health Insurance Coverage by Age in Springville
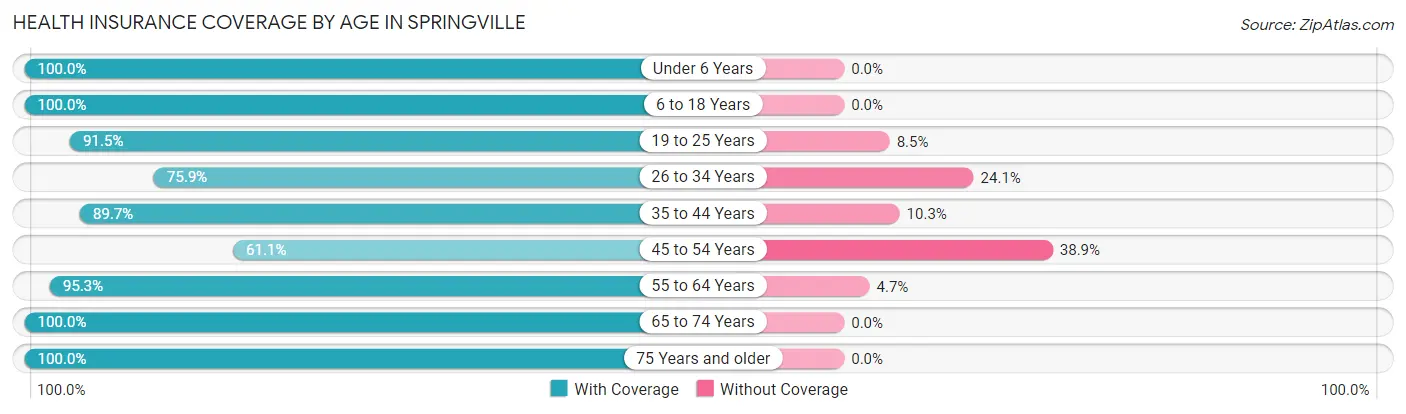
| Age Bracket | With Coverage | Without Coverage |
| Under 6 Years | 57 (100.0%) | 0 (0.0%) |
| 6 to 18 Years | 88 (100.0%) | 0 (0.0%) |
| 19 to 25 Years | 108 (91.5%) | 10 (8.5%) |
| 26 to 34 Years | 195 (75.9%) | 62 (24.1%) |
| 35 to 44 Years | 139 (89.7%) | 16 (10.3%) |
| 45 to 54 Years | 55 (61.1%) | 35 (38.9%) |
| 55 to 64 Years | 121 (95.3%) | 6 (4.7%) |
| 65 to 74 Years | 118 (100.0%) | 0 (0.0%) |
| 75 Years and older | 7 (100.0%) | 0 (0.0%) |
| Total | 888 (87.3%) | 129 (12.7%) |
Health Insurance Coverage by Citizenship Status in Springville
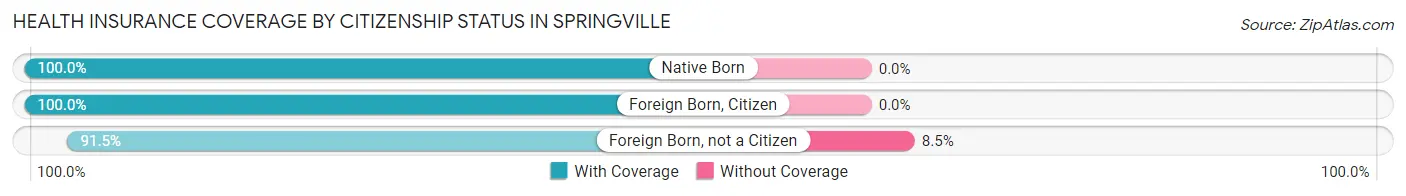
| Citizenship Status | With Coverage | Without Coverage |
| Native Born | 57 (100.0%) | 0 (0.0%) |
| Foreign Born, Citizen | 88 (100.0%) | 0 (0.0%) |
| Foreign Born, not a Citizen | 108 (91.5%) | 10 (8.5%) |
Health Insurance Coverage by Household Income in Springville
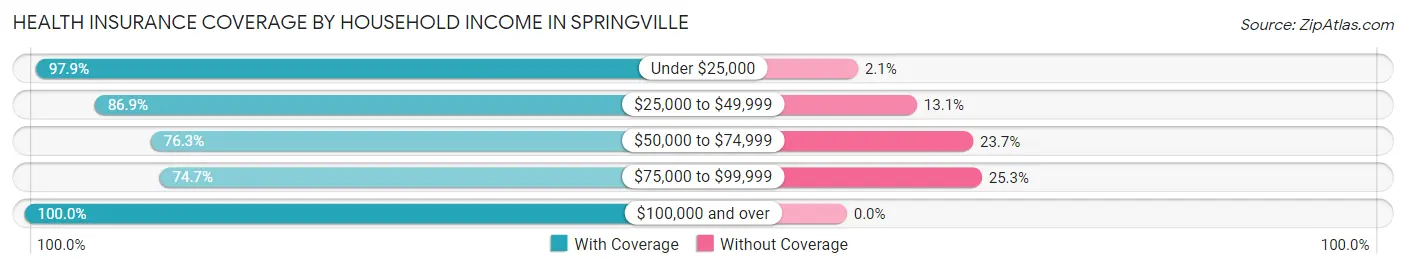
| Household Income | With Coverage | Without Coverage |
| Under $25,000 | 280 (97.9%) | 6 (2.1%) |
| $25,000 to $49,999 | 119 (86.9%) | 18 (13.1%) |
| $50,000 to $74,999 | 271 (76.3%) | 84 (23.7%) |
| $75,000 to $99,999 | 62 (74.7%) | 21 (25.3%) |
| $100,000 and over | 156 (100.0%) | 0 (0.0%) |
Public vs Private Health Insurance Coverage by Age in Springville
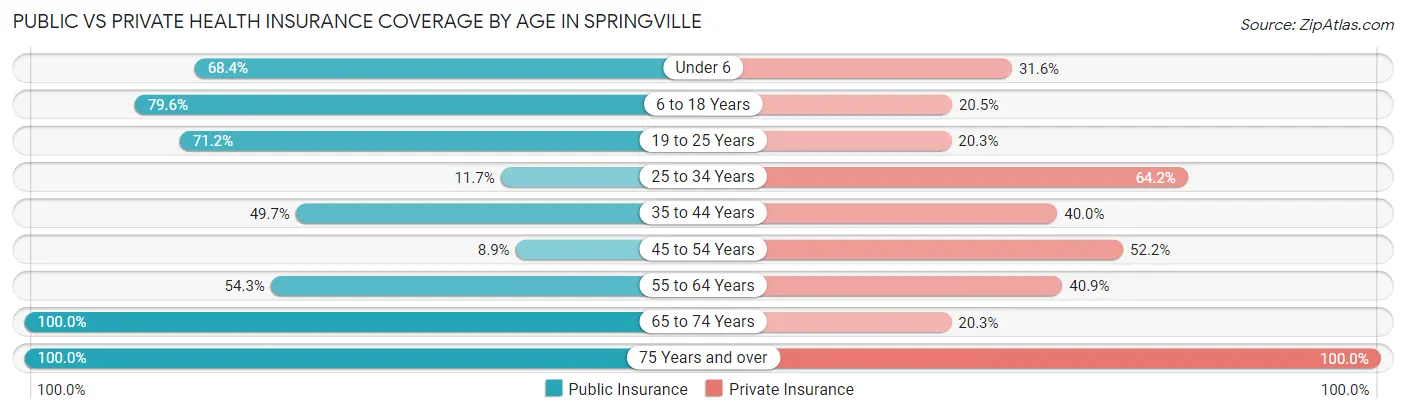
| Age Bracket | Public Insurance | Private Insurance |
| Under 6 | 39 (68.4%) | 18 (31.6%) |
| 6 to 18 Years | 70 (79.5%) | 18 (20.4%) |
| 19 to 25 Years | 84 (71.2%) | 24 (20.3%) |
| 25 to 34 Years | 30 (11.7%) | 165 (64.2%) |
| 35 to 44 Years | 77 (49.7%) | 62 (40.0%) |
| 45 to 54 Years | 8 (8.9%) | 47 (52.2%) |
| 55 to 64 Years | 69 (54.3%) | 52 (40.9%) |
| 65 to 74 Years | 118 (100.0%) | 24 (20.3%) |
| 75 Years and over | 7 (100.0%) | 7 (100.0%) |
| Total | 502 (49.4%) | 417 (41.0%) |
Disability Status by Sex by Age in Springville
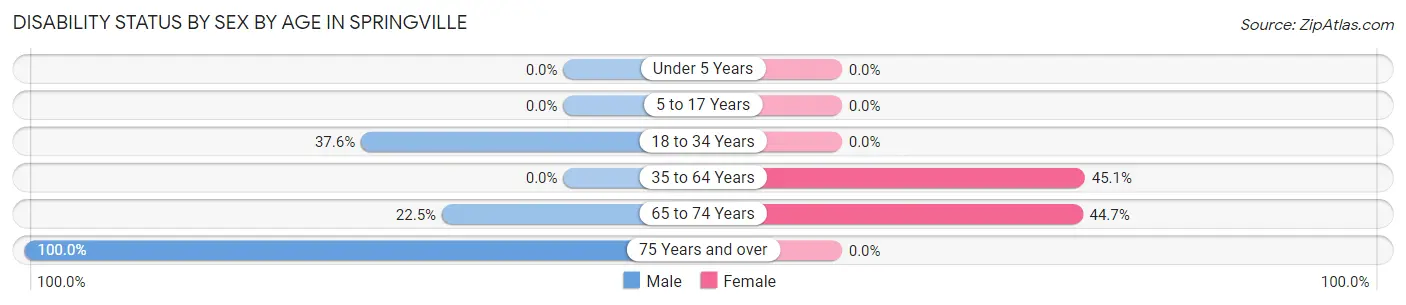
| Age Bracket | Male | Female |
| Under 5 Years | 0 (0.0%) | 0 (0.0%) |
| 5 to 17 Years | 0 (0.0%) | 0 (0.0%) |
| 18 to 34 Years | 74 (37.6%) | 0 (0.0%) |
| 35 to 64 Years | 0 (0.0%) | 106 (45.1%) |
| 65 to 74 Years | 16 (22.5%) | 21 (44.7%) |
| 75 Years and over | 7 (100.0%) | 0 (0.0%) |
Disability Class by Sex by Age in Springville
Disability Class: Hearing Difficulty
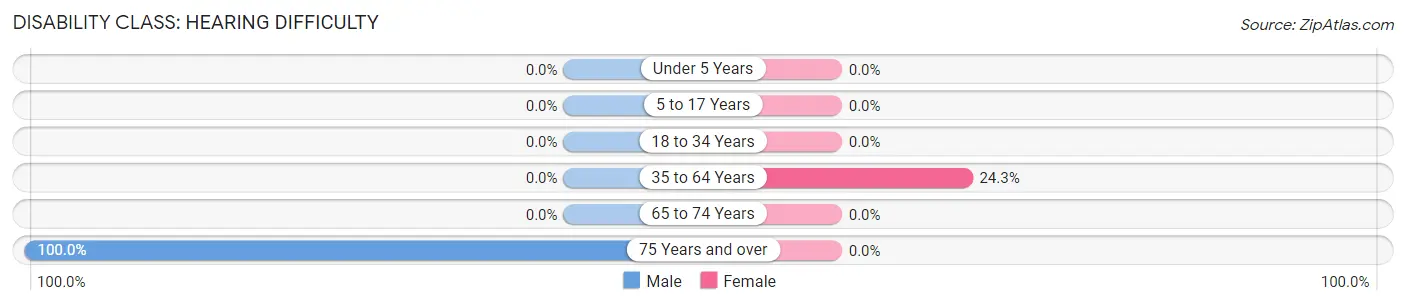
| Age Bracket | Male | Female |
| Under 5 Years | 0 (0.0%) | 0 (0.0%) |
| 5 to 17 Years | 0 (0.0%) | 0 (0.0%) |
| 18 to 34 Years | 0 (0.0%) | 0 (0.0%) |
| 35 to 64 Years | 0 (0.0%) | 57 (24.3%) |
| 65 to 74 Years | 0 (0.0%) | 0 (0.0%) |
| 75 Years and over | 7 (100.0%) | 0 (0.0%) |
Disability Class: Vision Difficulty
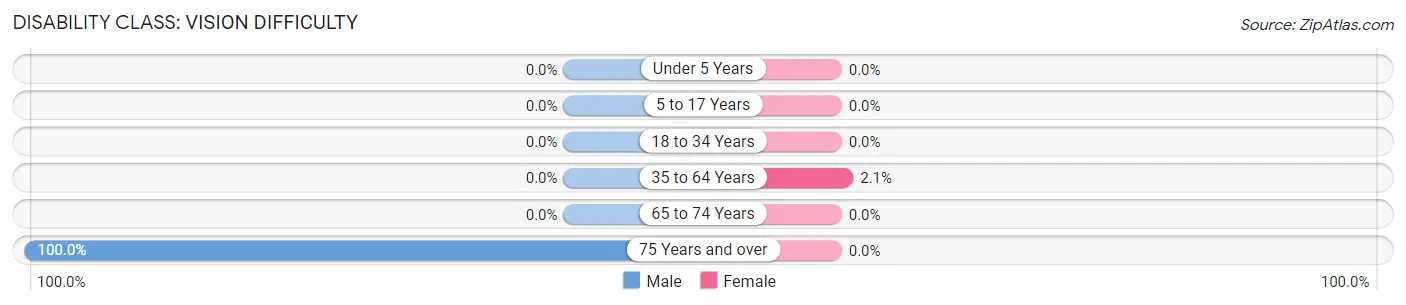
| Age Bracket | Male | Female |
| Under 5 Years | 0 (0.0%) | 0 (0.0%) |
| 5 to 17 Years | 0 (0.0%) | 0 (0.0%) |
| 18 to 34 Years | 0 (0.0%) | 0 (0.0%) |
| 35 to 64 Years | 0 (0.0%) | 5 (2.1%) |
| 65 to 74 Years | 0 (0.0%) | 0 (0.0%) |
| 75 Years and over | 7 (100.0%) | 0 (0.0%) |
Disability Class: Cognitive Difficulty
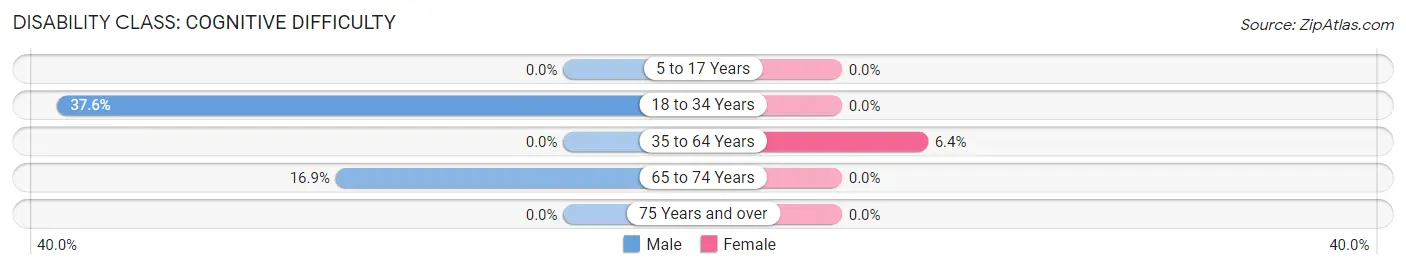
| Age Bracket | Male | Female |
| 5 to 17 Years | 0 (0.0%) | 0 (0.0%) |
| 18 to 34 Years | 74 (37.6%) | 0 (0.0%) |
| 35 to 64 Years | 0 (0.0%) | 15 (6.4%) |
| 65 to 74 Years | 12 (16.9%) | 0 (0.0%) |
| 75 Years and over | 0 (0.0%) | 0 (0.0%) |
Disability Class: Ambulatory Difficulty
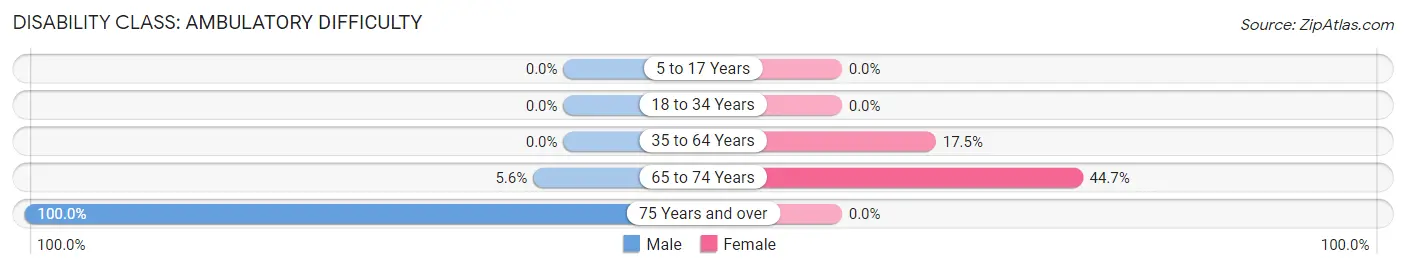
| Age Bracket | Male | Female |
| 5 to 17 Years | 0 (0.0%) | 0 (0.0%) |
| 18 to 34 Years | 0 (0.0%) | 0 (0.0%) |
| 35 to 64 Years | 0 (0.0%) | 41 (17.4%) |
| 65 to 74 Years | 4 (5.6%) | 21 (44.7%) |
| 75 Years and over | 7 (100.0%) | 0 (0.0%) |
Disability Class: Self-Care Difficulty
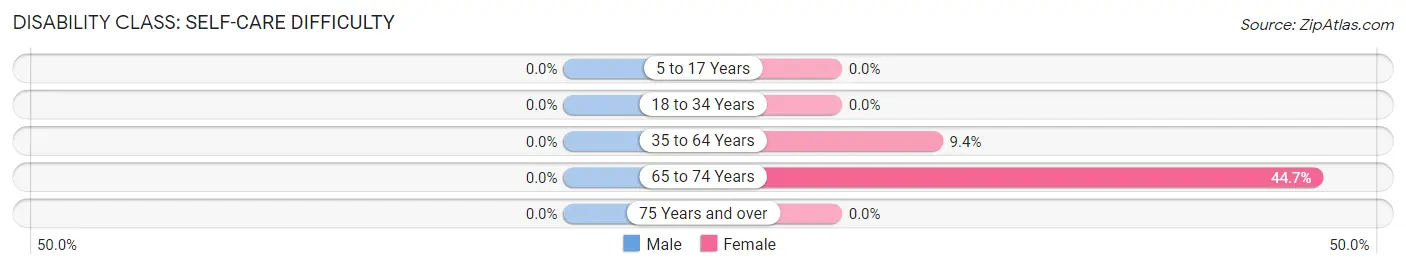
| Age Bracket | Male | Female |
| 5 to 17 Years | 0 (0.0%) | 0 (0.0%) |
| 18 to 34 Years | 0 (0.0%) | 0 (0.0%) |
| 35 to 64 Years | 0 (0.0%) | 22 (9.4%) |
| 65 to 74 Years | 0 (0.0%) | 21 (44.7%) |
| 75 Years and over | 0 (0.0%) | 0 (0.0%) |
Technology Access in Springville
Computing Device Access in Springville
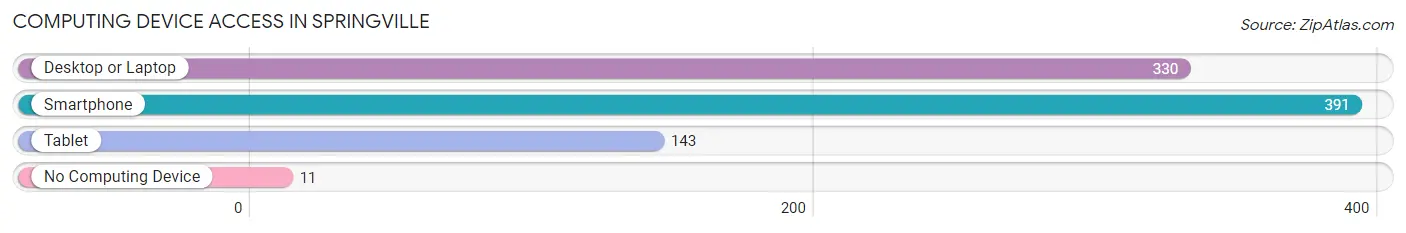
| Device Type | # Households | % Households |
| Desktop or Laptop | 330 | 79.9% |
| Smartphone | 391 | 94.7% |
| Tablet | 143 | 34.6% |
| No Computing Device | 11 | 2.7% |
| Total | 413 | 100.0% |
Internet Access in Springville
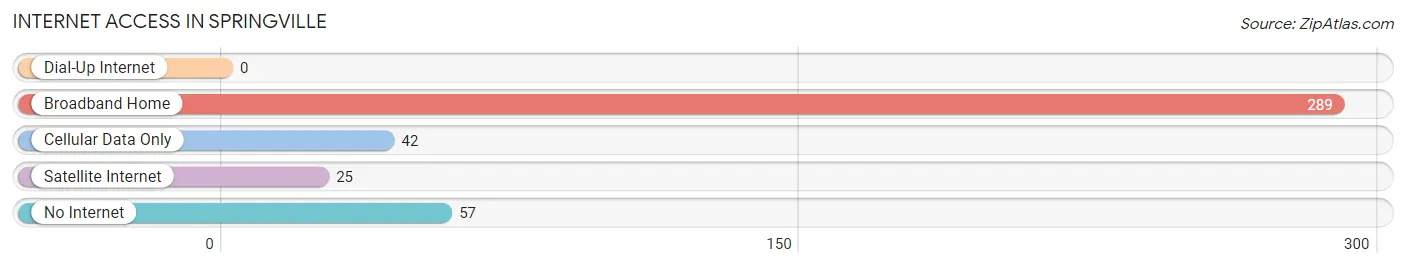
| Internet Type | # Households | % Households |
| Dial-Up Internet | 0 | 0.0% |
| Broadband Home | 289 | 70.0% |
| Cellular Data Only | 42 | 10.2% |
| Satellite Internet | 25 | 6.0% |
| No Internet | 57 | 13.8% |
| Total | 413 | 100.0% |
Springville Summary
History
The town of Springville, Virginia is located in the Shenandoah Valley of Virginia, and is part of Augusta County. The town was first settled in the late 1700s by German immigrants, and was originally known as “Springfield”. The town was officially incorporated in 1832, and was renamed “Springville” in 1837.
The town was a major stop on the Valley Turnpike, which was a major transportation route in the area. The turnpike was built in the early 1800s, and connected the Shenandoah Valley to the Potomac River. The town was also a major stop on the Staunton-Parkersburg Turnpike, which was built in the mid-1800s.
The town was a major agricultural center in the area, and was home to several mills and factories. The town was also home to several churches, including the Springville Methodist Church, which was founded in 1837.
The town was also home to several Civil War battles, including the Battle of Springville in 1862. The town was also the site of the Battle of Cedar Creek in 1864.
Geography
Springville is located in the Shenandoah Valley of Virginia, and is part of Augusta County. The town is situated at the intersection of the Valley Turnpike and the Staunton-Parkersburg Turnpike. The town is located approximately 25 miles south of Harrisonburg, and approximately 50 miles west of Charlottesville.
The town is located in a rural area, and is surrounded by rolling hills and farmland. The town is located at the base of the Blue Ridge Mountains, and is approximately 1,000 feet above sea level.
The town is located in a temperate climate, and has four distinct seasons. The average temperature in the summer is in the mid-80s, and the average temperature in the winter is in the mid-30s.
Economy
The economy of Springville is largely based on agriculture and tourism. The town is home to several farms, and is a major producer of apples, peaches, and other fruits and vegetables. The town is also home to several wineries, and is a popular destination for wine tours.
The town is also home to several small businesses, including restaurants, shops, and other services. The town is also home to several manufacturing companies, including a furniture factory and a woodworking shop.
The town is also home to several historic sites, including the Springville Methodist Church, which was founded in 1837. The town is also home to several Civil War sites, including the Battle of Springville in 1862.
Demographics
As of the 2010 census, the population of Springville was 1,845. The town has a population density of approximately 1,000 people per square mile. The median age of the population is 43.7 years, and the median household income is $45,000.
The town is predominantly white, with approximately 95% of the population identifying as white. The town is also home to a small African American population, with approximately 3% of the population identifying as African American. The town is also home to a small Hispanic population, with approximately 2% of the population identifying as Hispanic.
The town is also home to a small Native American population, with approximately 1% of the population identifying as Native American. The town is also home to a small Asian population, with approximately 1% of the population identifying as Asian.
Common Questions
What is Per Capita Income in Springville?
Per Capita income in Springville is $24,979.
What is the Median Family Income in Springville?
Median Family Income in Springville is $65,625.
What is the Median Household income in Springville?
Median Household Income in Springville is $41,250.
What is Income or Wage Gap in Springville?
Income or Wage Gap in Springville is 4.1%.
Women in Springville earn 95.9 cents for every dollar earned by a man.
What is Inequality or Gini Index in Springville?
Inequality or Gini Index in Springville is 0.43.
What is the Total Population of Springville?
Total Population of Springville is 1,017.
What is the Total Male Population of Springville?
Total Male Population of Springville is 490.
What is the Total Female Population of Springville?
Total Female Population of Springville is 527.
What is the Ratio of Males per 100 Females in Springville?
There are 92.98 Males per 100 Females in Springville.
What is the Ratio of Females per 100 Males in Springville?
There are 107.55 Females per 100 Males in Springville.
What is the Median Population Age in Springville?
Median Population Age in Springville is 31.8 Years.
What is the Average Family Size in Springville
Average Family Size in Springville is 3.5 People.
What is the Average Household Size in Springville
Average Household Size in Springville is 2.5 People.
How Large is the Labor Force in Springville?
There are 543 People in the Labor Forcein in Springville.
What is the Percentage of People in the Labor Force in Springville?
61.5% of People are in the Labor Force in Springville.
What is the Unemployment Rate in Springville?
Unemployment Rate in Springville is 1.1%.