Fries, VA Map & Demographics
Fries Map
Fries Overview
$26,167
PER CAPITA INCOME
$69,375
AVG FAMILY INCOME
$40,069
AVG HOUSEHOLD INCOME
16.1%
WAGE / INCOME GAP [ % ]
83.9¢/ $1
WAGE / INCOME GAP [ $ ]
0.48
INEQUALITY / GINI INDEX
364
TOTAL POPULATION
163
MALE POPULATION
201
FEMALE POPULATION
81.09
MALES / 100 FEMALES
123.31
FEMALES / 100 MALES
53.5
MEDIAN AGE
3.2
AVG FAMILY SIZE
2.1
AVG HOUSEHOLD SIZE
116
LABOR FORCE [ PEOPLE ]
41.9%
PERCENT IN LABOR FORCE
8.6%
UNEMPLOYMENT RATE
Fries Zip Codes
Fries Area Codes
Income in Fries
Income Overview in Fries
Per Capita Income in Fries is $26,167, while median incomes of families and households are $69,375 and $40,069 respectively.
| Characteristic | Number | Measure |
| Per Capita Income | 364 | $26,167 |
| Median Family Income | 89 | $69,375 |
| Mean Family Income | 89 | $75,039 |
| Median Household Income | 169 | $40,069 |
| Mean Household Income | 169 | $55,130 |
| Income Deficit | 89 | $0 |
| Wage / Income Gap (%) | 364 | 16.06% |
| Wage / Income Gap ($) | 364 | 83.94¢ per $1 |
| Gini / Inequality Index | 364 | 0.48 |
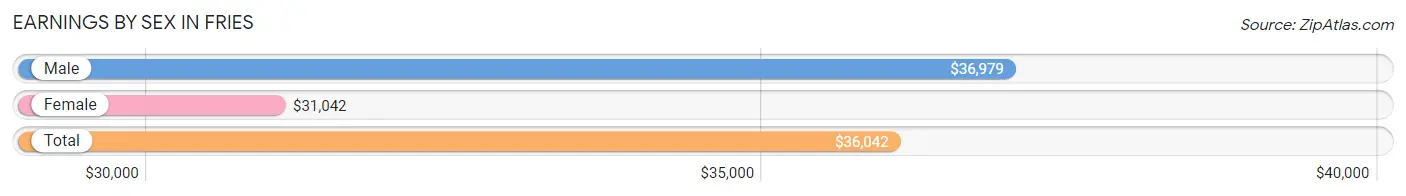
Earnings by Sex in Fries
Average Earnings in Fries are $36,042, $36,979 for men and $31,042 for women, a difference of 16.1%.
| Sex | Number | Average Earnings |
| Male | 69 (53.1%) | $36,979 |
| Female | 61 (46.9%) | $31,042 |
| Total | 130 (100.0%) | $36,042 |
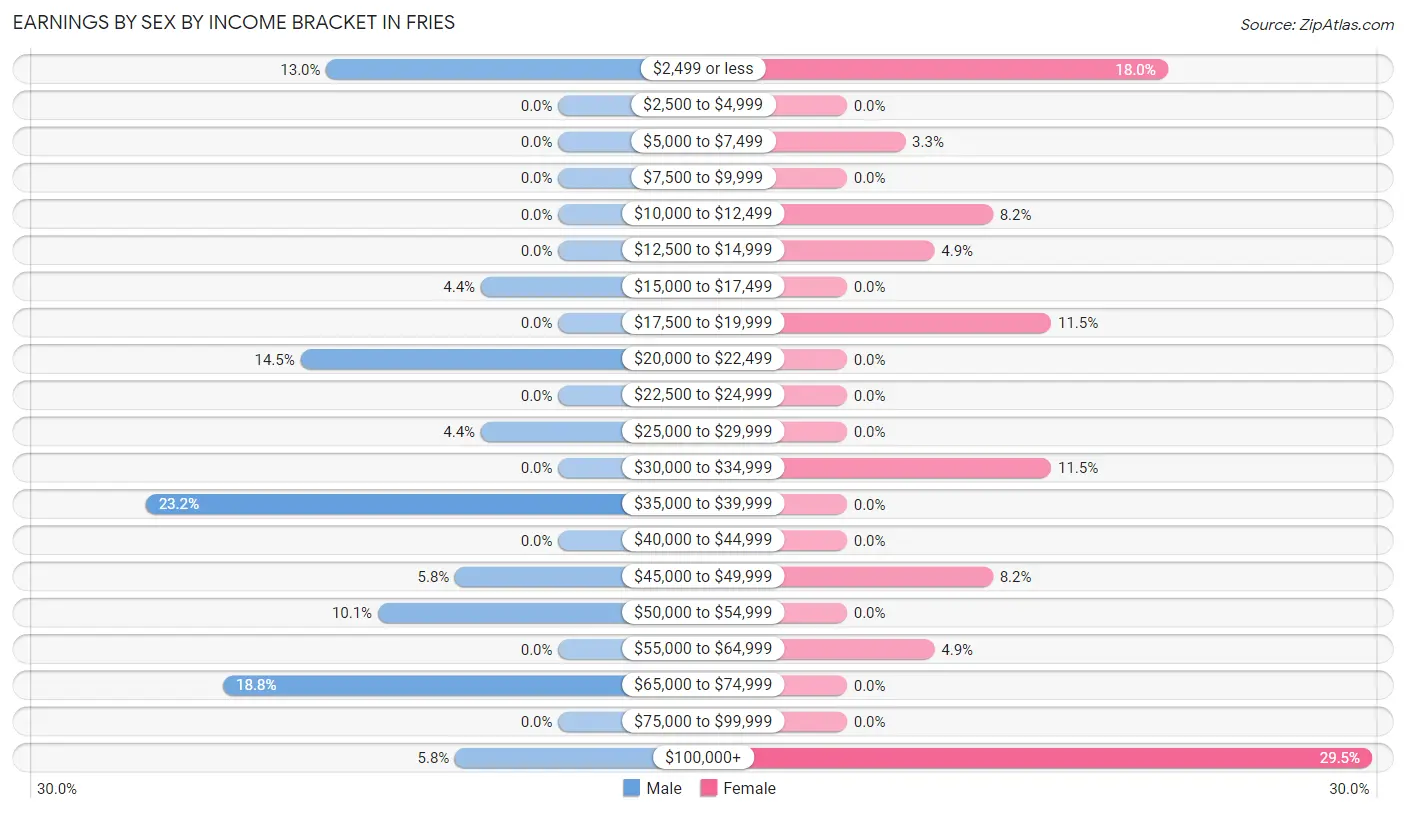
Earnings by Sex by Income Bracket in Fries
The most common earnings brackets in Fries are $35,000 to $39,999 for men (16 | 23.2%) and $100,000+ for women (18 | 29.5%).
| Income | Male | Female |
| $2,499 or less | 9 (13.0%) | 11 (18.0%) |
| $2,500 to $4,999 | 0 (0.0%) | 0 (0.0%) |
| $5,000 to $7,499 | 0 (0.0%) | 2 (3.3%) |
| $7,500 to $9,999 | 0 (0.0%) | 0 (0.0%) |
| $10,000 to $12,499 | 0 (0.0%) | 5 (8.2%) |
| $12,500 to $14,999 | 0 (0.0%) | 3 (4.9%) |
| $15,000 to $17,499 | 3 (4.3%) | 0 (0.0%) |
| $17,500 to $19,999 | 0 (0.0%) | 7 (11.5%) |
| $20,000 to $22,499 | 10 (14.5%) | 0 (0.0%) |
| $22,500 to $24,999 | 0 (0.0%) | 0 (0.0%) |
| $25,000 to $29,999 | 3 (4.3%) | 0 (0.0%) |
| $30,000 to $34,999 | 0 (0.0%) | 7 (11.5%) |
| $35,000 to $39,999 | 16 (23.2%) | 0 (0.0%) |
| $40,000 to $44,999 | 0 (0.0%) | 0 (0.0%) |
| $45,000 to $49,999 | 4 (5.8%) | 5 (8.2%) |
| $50,000 to $54,999 | 7 (10.1%) | 0 (0.0%) |
| $55,000 to $64,999 | 0 (0.0%) | 3 (4.9%) |
| $65,000 to $74,999 | 13 (18.8%) | 0 (0.0%) |
| $75,000 to $99,999 | 0 (0.0%) | 0 (0.0%) |
| $100,000+ | 4 (5.8%) | 18 (29.5%) |
| Total | 69 (100.0%) | 61 (100.0%) |
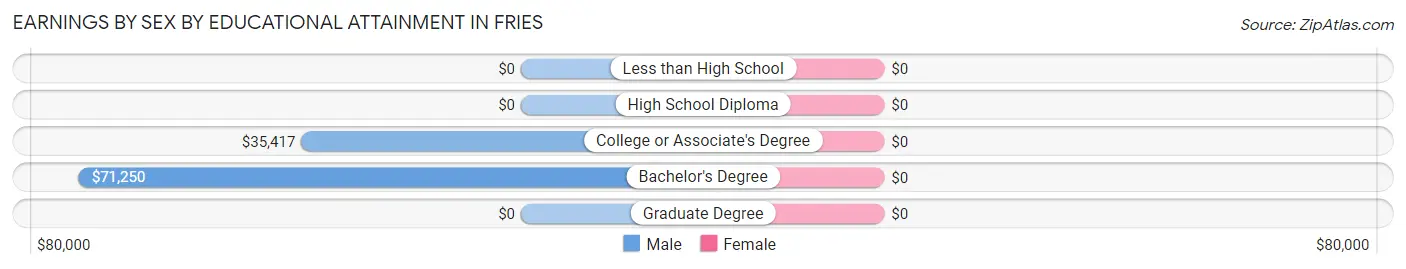
Earnings by Sex by Educational Attainment in Fries
| Educational Attainment | Male Income | Female Income |
| Less than High School | - | - |
| High School Diploma | - | - |
| College or Associate's Degree | $35,417 | $0 |
| Bachelor's Degree | $71,250 | $0 |
| Graduate Degree | - | - |
| Total | $37,500 | $31,042 |
Family Income in Fries
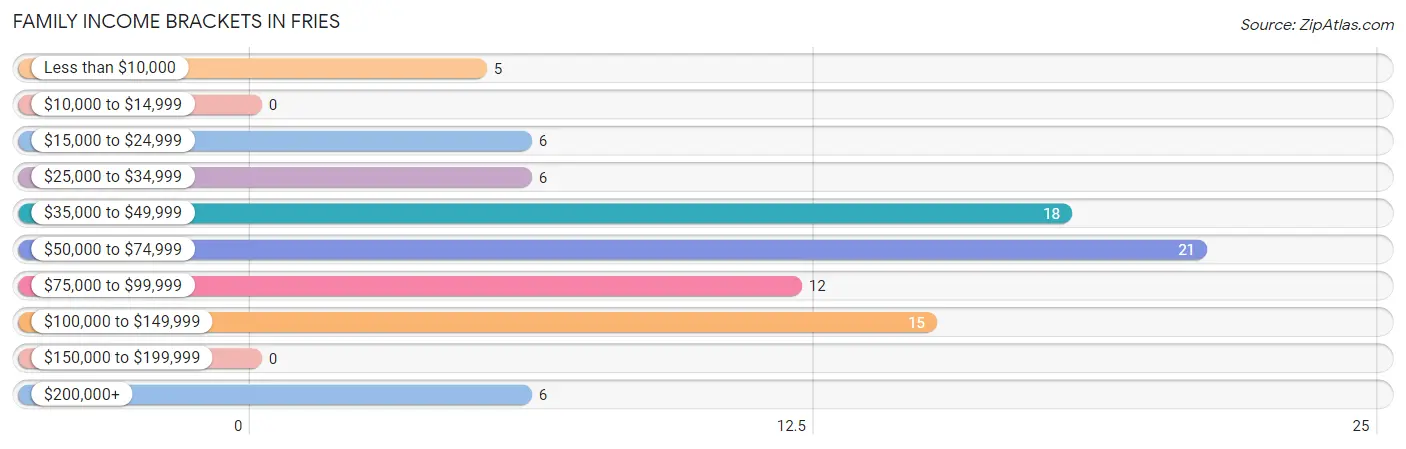
Family Income Brackets in Fries
According to the Fries family income data, there are 21 families falling into the $50,000 to $74,999 income range, which is the most common income bracket and makes up 23.6% of all families.
| Income Bracket | # Families | % Families |
| Less than $10,000 | 5 | 5.6% |
| $10,000 to $14,999 | 0 | 0.0% |
| $15,000 to $24,999 | 6 | 6.7% |
| $25,000 to $34,999 | 6 | 6.7% |
| $35,000 to $49,999 | 18 | 20.2% |
| $50,000 to $74,999 | 21 | 23.6% |
| $75,000 to $99,999 | 12 | 13.5% |
| $100,000 to $149,999 | 15 | 16.9% |
| $150,000 to $199,999 | 0 | 0.0% |
| $200,000+ | 6 | 6.7% |
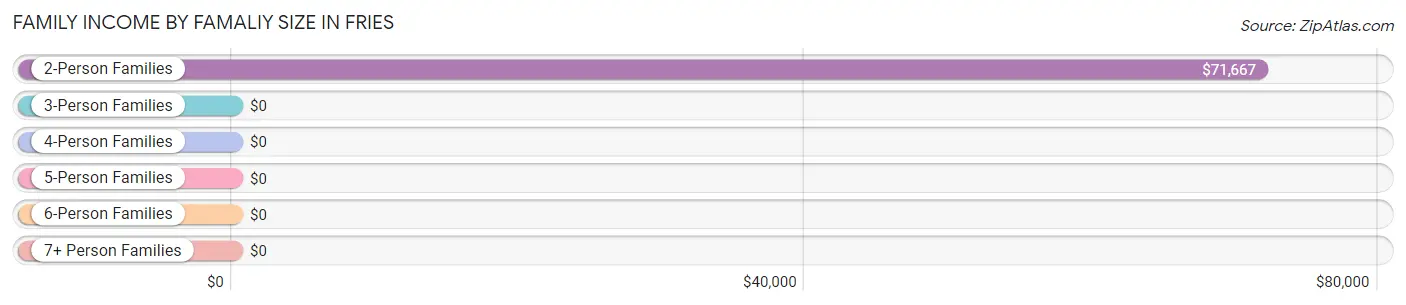
Family Income by Famaliy Size in Fries
2-person families (50 | 56.2%) account for the highest median family income in Fries with $71,667 per family, while 2-person families (50 | 56.2%) have the highest median income of $35,834 per family member.
| Income Bracket | # Families | Median Income |
| 2-Person Families | 50 (56.2%) | $71,667 |
| 3-Person Families | 19 (21.3%) | $0 |
| 4-Person Families | 6 (6.7%) | $0 |
| 5-Person Families | 0 (0.0%) | $0 |
| 6-Person Families | 2 (2.2%) | $0 |
| 7+ Person Families | 12 (13.5%) | $0 |
| Total | 89 (100.0%) | $69,375 |
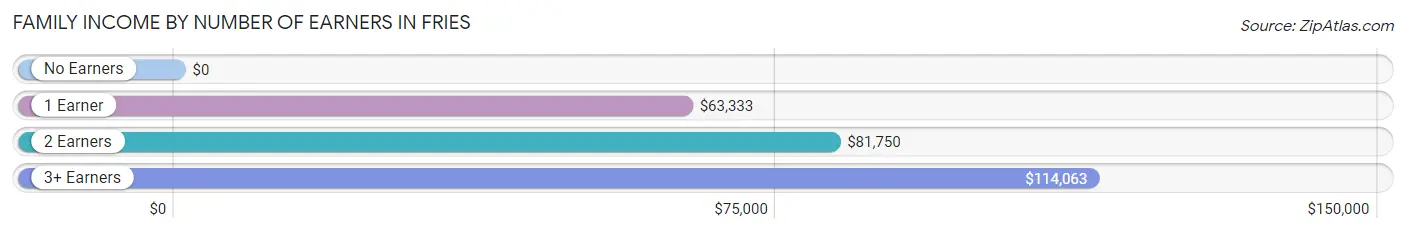
Family Income by Number of Earners in Fries
| Number of Earners | # Families | Median Income |
| No Earners | 23 (25.8%) | $0 |
| 1 Earner | 38 (42.7%) | $63,333 |
| 2 Earners | 19 (21.3%) | $81,750 |
| 3+ Earners | 9 (10.1%) | $114,063 |
| Total | 89 (100.0%) | $69,375 |
Household Income in Fries
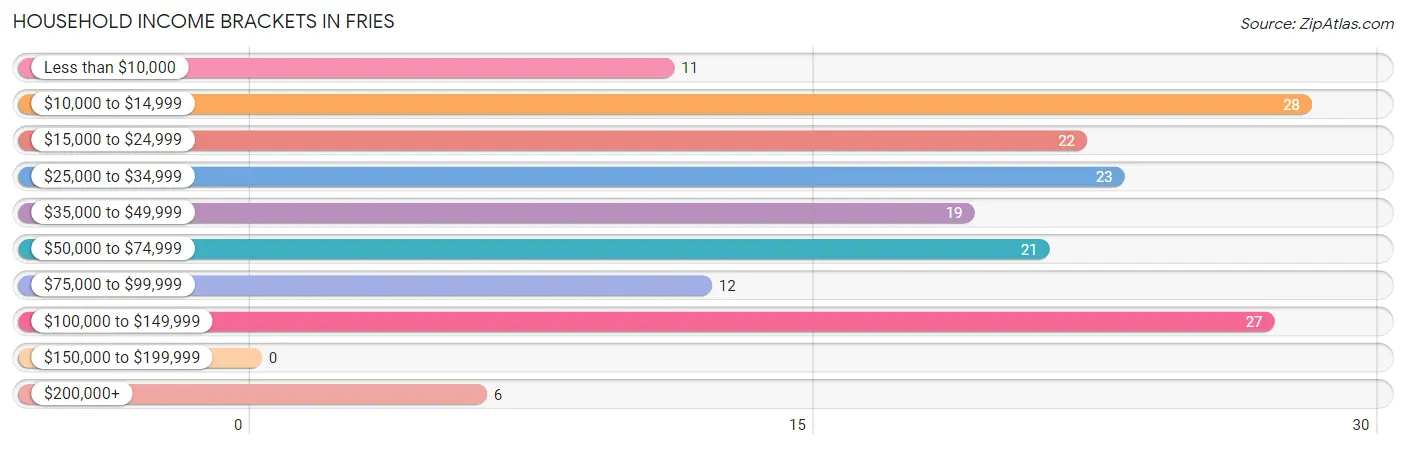
Household Income Brackets in Fries
With 28 households falling in the category, the $10,000 to $14,999 income range is the most frequent in Fries, accounting for 16.6% of all households.
| Income Bracket | # Households | % Households |
| Less than $10,000 | 11 | 6.5% |
| $10,000 to $14,999 | 28 | 16.6% |
| $15,000 to $24,999 | 22 | 13.0% |
| $25,000 to $34,999 | 23 | 13.6% |
| $35,000 to $49,999 | 19 | 11.2% |
| $50,000 to $74,999 | 21 | 12.4% |
| $75,000 to $99,999 | 12 | 7.1% |
| $100,000 to $149,999 | 27 | 16.0% |
| $150,000 to $199,999 | 0 | 0.0% |
| $200,000+ | 6 | 3.6% |
Household Income by Householder Age in Fries
The median household income in Fries is $40,069, with the highest median household income of $82,000 found in the 45 to 64 years age bracket for the primary householder. A total of 28 households (16.6%) fall into this category.
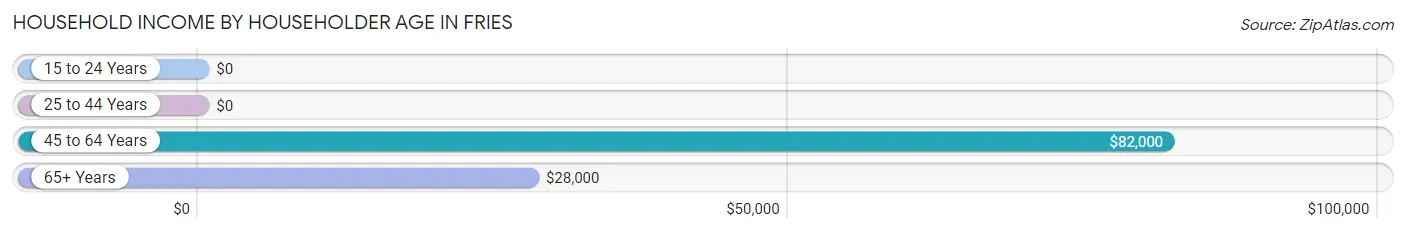
| Income Bracket | # Households | Median Income |
| 15 to 24 Years | 0 (0.0%) | $0 |
| 25 to 44 Years | 25 (14.8%) | $0 |
| 45 to 64 Years | 28 (16.6%) | $82,000 |
| 65+ Years | 116 (68.6%) | $28,000 |
| Total | 169 (100.0%) | $40,069 |
Poverty in Fries
Income Below Poverty by Sex and Age in Fries
With 29.4% poverty level for males and 36.3% for females among the residents of Fries, under 5 year old males and under 5 year old females are the most vulnerable to poverty, with 12 males (75.0%) and 33 females (100.0%) in their respective age groups living below the poverty level.
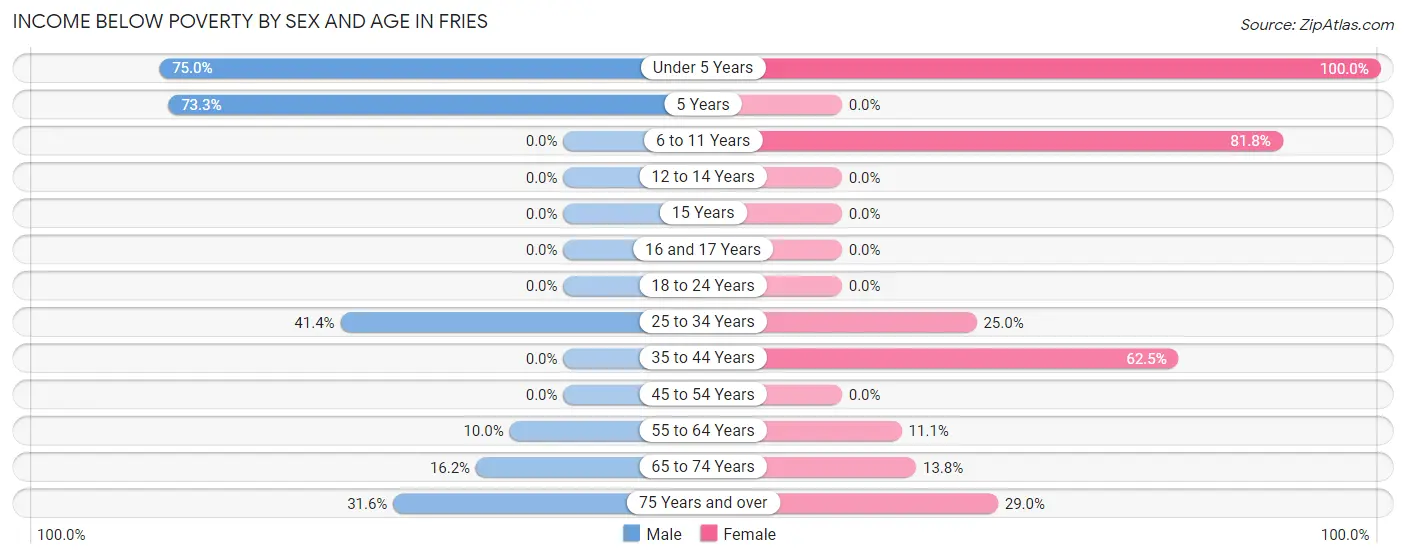
| Age Bracket | Male | Female |
| Under 5 Years | 12 (75.0%) | 33 (100.0%) |
| 5 Years | 11 (73.3%) | 0 (0.0%) |
| 6 to 11 Years | 0 (0.0%) | 9 (81.8%) |
| 12 to 14 Years | 0 (0.0%) | 0 (0.0%) |
| 15 Years | 0 (0.0%) | 0 (0.0%) |
| 16 and 17 Years | 0 (0.0%) | 0 (0.0%) |
| 18 to 24 Years | 0 (0.0%) | 0 (0.0%) |
| 25 to 34 Years | 12 (41.4%) | 5 (25.0%) |
| 35 to 44 Years | 0 (0.0%) | 5 (62.5%) |
| 45 to 54 Years | 0 (0.0%) | 0 (0.0%) |
| 55 to 64 Years | 1 (10.0%) | 2 (11.1%) |
| 65 to 74 Years | 6 (16.2%) | 8 (13.8%) |
| 75 Years and over | 6 (31.6%) | 11 (28.9%) |
| Total | 48 (29.4%) | 73 (36.3%) |
Income Above Poverty by Sex and Age in Fries
According to the poverty statistics in Fries, males aged 6 to 11 years and females aged 12 to 14 years are the age groups that are most secure financially, with 100.0% of males and 100.0% of females in these age groups living above the poverty line.
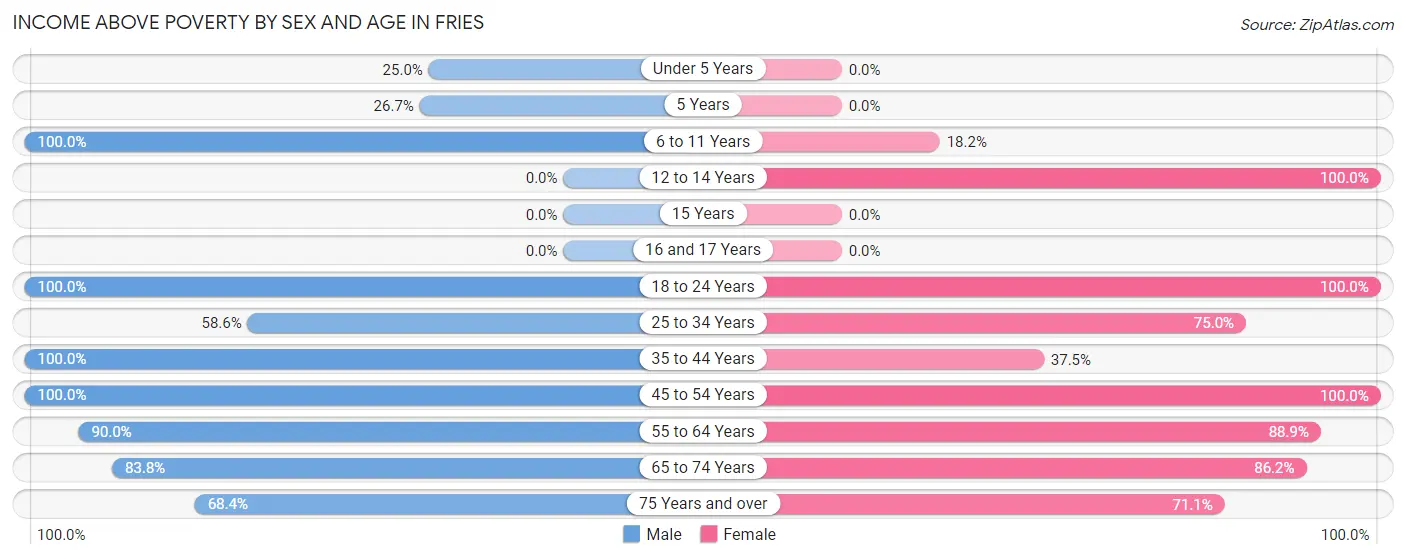
| Age Bracket | Male | Female |
| Under 5 Years | 4 (25.0%) | 0 (0.0%) |
| 5 Years | 4 (26.7%) | 0 (0.0%) |
| 6 to 11 Years | 10 (100.0%) | 2 (18.2%) |
| 12 to 14 Years | 0 (0.0%) | 2 (100.0%) |
| 15 Years | 0 (0.0%) | 0 (0.0%) |
| 16 and 17 Years | 0 (0.0%) | 0 (0.0%) |
| 18 to 24 Years | 5 (100.0%) | 3 (100.0%) |
| 25 to 34 Years | 17 (58.6%) | 15 (75.0%) |
| 35 to 44 Years | 9 (100.0%) | 3 (37.5%) |
| 45 to 54 Years | 13 (100.0%) | 10 (100.0%) |
| 55 to 64 Years | 9 (90.0%) | 16 (88.9%) |
| 65 to 74 Years | 31 (83.8%) | 50 (86.2%) |
| 75 Years and over | 13 (68.4%) | 27 (71.1%) |
| Total | 115 (70.6%) | 128 (63.7%) |
Income Below Poverty Among Married-Couple Families in Fries
The poverty statistics for married-couple families in Fries show that 17.6% or 12 of the total 68 families live below the poverty line. Families with 5 or more children have the highest poverty rate of 100.0%, comprising of 12 families. On the other hand, families with no children have the lowest poverty rate of 0.0%, which includes 0 families.
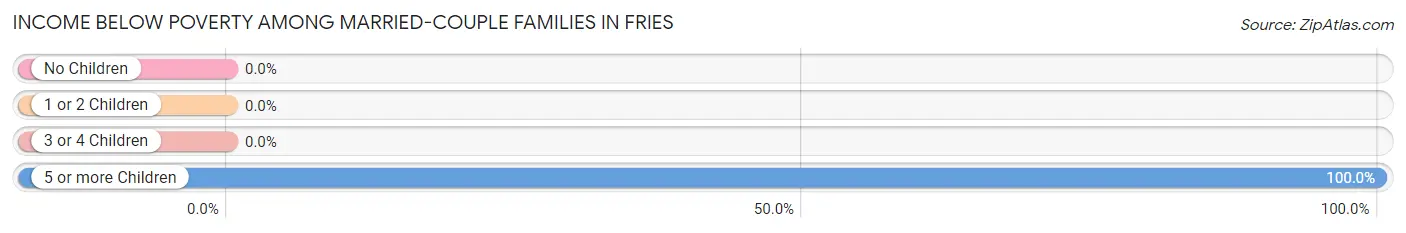
| Children | Above Poverty | Below Poverty |
| No Children | 46 (100.0%) | 0 (0.0%) |
| 1 or 2 Children | 10 (100.0%) | 0 (0.0%) |
| 3 or 4 Children | 0 (0.0%) | 0 (0.0%) |
| 5 or more Children | 0 (0.0%) | 12 (100.0%) |
| Total | 56 (82.4%) | 12 (17.6%) |
Income Below Poverty Among Single-Parent Households in Fries
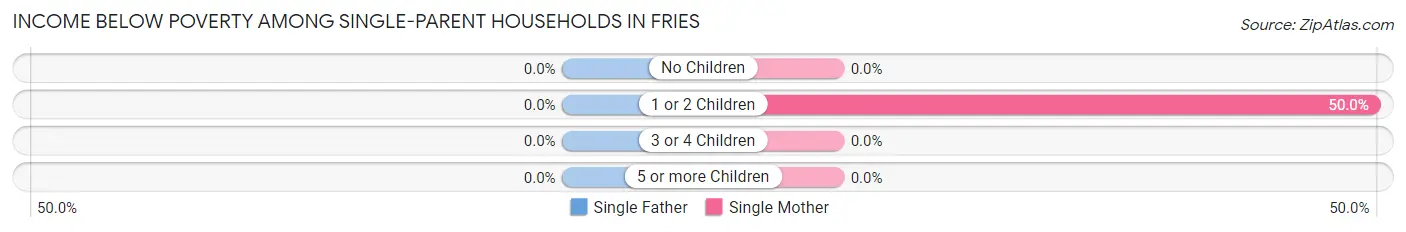
| Children | Single Father | Single Mother |
| No Children | 0 (0.0%) | 0 (0.0%) |
| 1 or 2 Children | 0 (0.0%) | 5 (50.0%) |
| 3 or 4 Children | 0 (0.0%) | 0 (0.0%) |
| 5 or more Children | 0 (0.0%) | 0 (0.0%) |
| Total | 0 (0.0%) | 5 (33.3%) |
Income Below Poverty Among Married-Couple vs Single-Parent Households in Fries
The poverty data for Fries shows that 12 of the married-couple family households (17.6%) and 5 of the single-parent households (23.8%) are living below the poverty level. Within the married-couple family households, those with 5 or more children have the highest poverty rate, with 12 households (100.0%) falling below the poverty line. Among the single-parent households, those with 1 or 2 children have the highest poverty rate, with 5 household (50.0%) living below poverty.
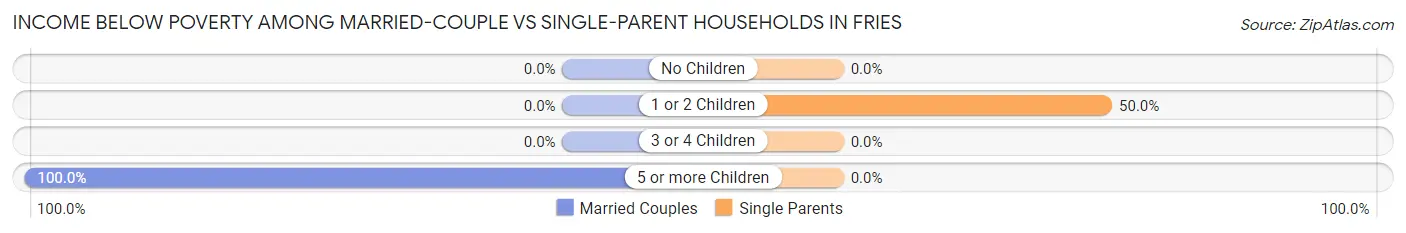
| Children | Married-Couple Families | Single-Parent Households |
| No Children | 0 (0.0%) | 0 (0.0%) |
| 1 or 2 Children | 0 (0.0%) | 5 (50.0%) |
| 3 or 4 Children | 0 (0.0%) | 0 (0.0%) |
| 5 or more Children | 12 (100.0%) | 0 (0.0%) |
| Total | 12 (17.6%) | 5 (23.8%) |
Race in Fries
The most populous races in Fries are White / Caucasian (354 | 97.3%), Hispanic or Latino (7 | 1.9%), and Two or more Races (7 | 1.9%).
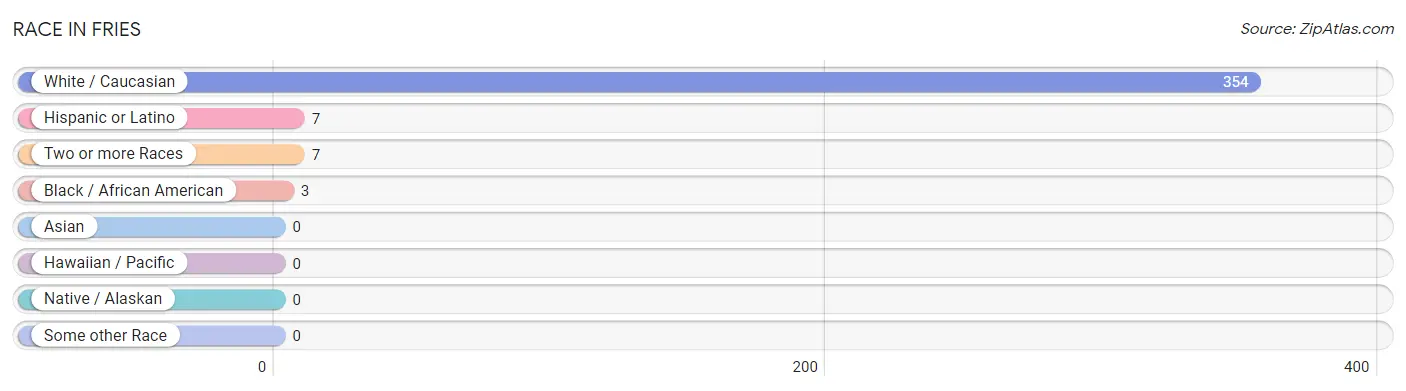
| Race | # Population | % Population |
| Asian | 0 | 0.0% |
| Black / African American | 3 | 0.8% |
| Hawaiian / Pacific | 0 | 0.0% |
| Hispanic or Latino | 7 | 1.9% |
| Native / Alaskan | 0 | 0.0% |
| White / Caucasian | 354 | 97.3% |
| Two or more Races | 7 | 1.9% |
| Some other Race | 0 | 0.0% |
| Total | 364 | 100.0% |
Ancestry in Fries
The most populous ancestries reported in Fries are American (201 | 55.2%), English (49 | 13.5%), Irish (47 | 12.9%), German (41 | 11.3%), and Italian (12 | 3.3%), together accounting for 96.2% of all Fries residents.
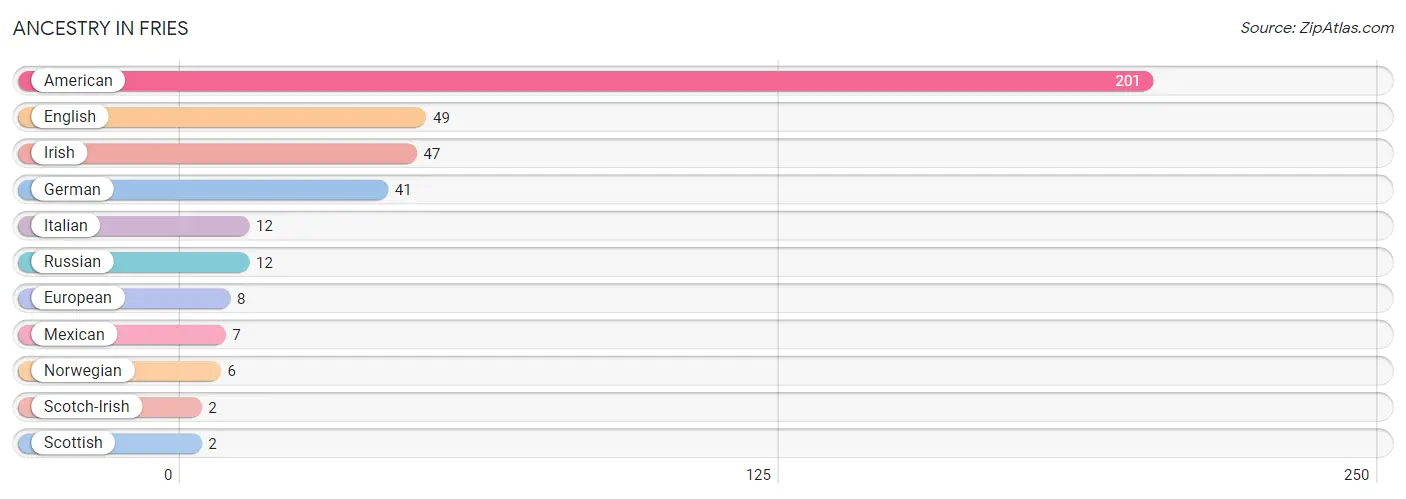
| Ancestry | # Population | % Population |
| American | 201 | 55.2% |
| English | 49 | 13.5% |
| European | 8 | 2.2% |
| German | 41 | 11.3% |
| Irish | 47 | 12.9% |
| Italian | 12 | 3.3% |
| Mexican | 7 | 1.9% |
| Norwegian | 6 | 1.7% |
| Russian | 12 | 3.3% |
| Scotch-Irish | 2 | 0.5% |
| Scottish | 2 | 0.5% | View All 11 Rows |
Immigrants in Fries

| Immigration Origin | # Population | % Population | View All 0 Rows |
Sex and Age in Fries
Sex and Age in Fries
The most populous age groups in Fries are 70 to 74 Years (22 | 13.5%) for men and 65 to 69 Years (39 | 19.4%) for women.
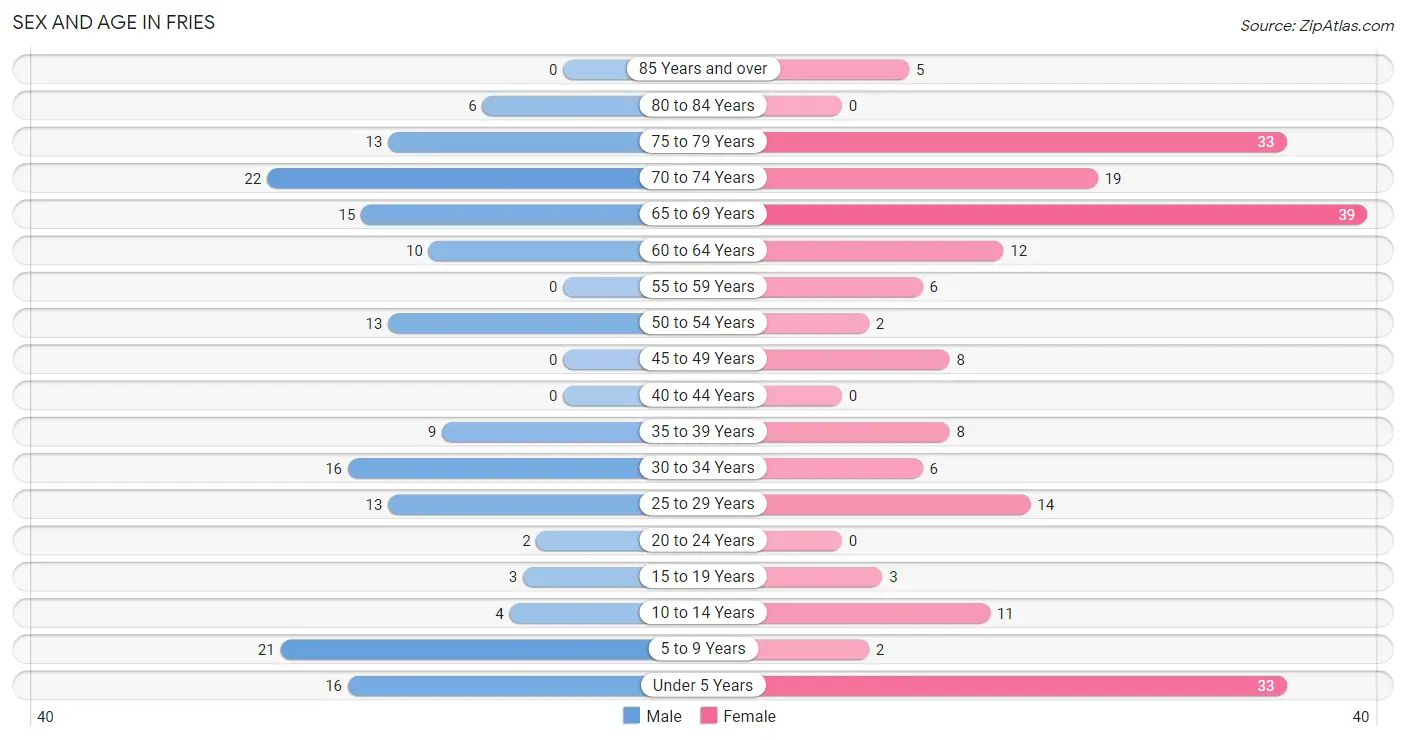
| Age Bracket | Male | Female |
| Under 5 Years | 16 (9.8%) | 33 (16.4%) |
| 5 to 9 Years | 21 (12.9%) | 2 (1.0%) |
| 10 to 14 Years | 4 (2.5%) | 11 (5.5%) |
| 15 to 19 Years | 3 (1.8%) | 3 (1.5%) |
| 20 to 24 Years | 2 (1.2%) | 0 (0.0%) |
| 25 to 29 Years | 13 (8.0%) | 14 (7.0%) |
| 30 to 34 Years | 16 (9.8%) | 6 (3.0%) |
| 35 to 39 Years | 9 (5.5%) | 8 (4.0%) |
| 40 to 44 Years | 0 (0.0%) | 0 (0.0%) |
| 45 to 49 Years | 0 (0.0%) | 8 (4.0%) |
| 50 to 54 Years | 13 (8.0%) | 2 (1.0%) |
| 55 to 59 Years | 0 (0.0%) | 6 (3.0%) |
| 60 to 64 Years | 10 (6.1%) | 12 (6.0%) |
| 65 to 69 Years | 15 (9.2%) | 39 (19.4%) |
| 70 to 74 Years | 22 (13.5%) | 19 (9.5%) |
| 75 to 79 Years | 13 (8.0%) | 33 (16.4%) |
| 80 to 84 Years | 6 (3.7%) | 0 (0.0%) |
| 85 Years and over | 0 (0.0%) | 5 (2.5%) |
| Total | 163 (100.0%) | 201 (100.0%) |
Families and Households in Fries
Median Family Size in Fries
The median family size in Fries is 3.19 persons per family, with married-couple families (68 | 76.4%) accounting for the largest median family size of 3.28 persons per family. On the other hand, single male/father families (6 | 6.7%) represent the smallest median family size with 2.00 persons per family.
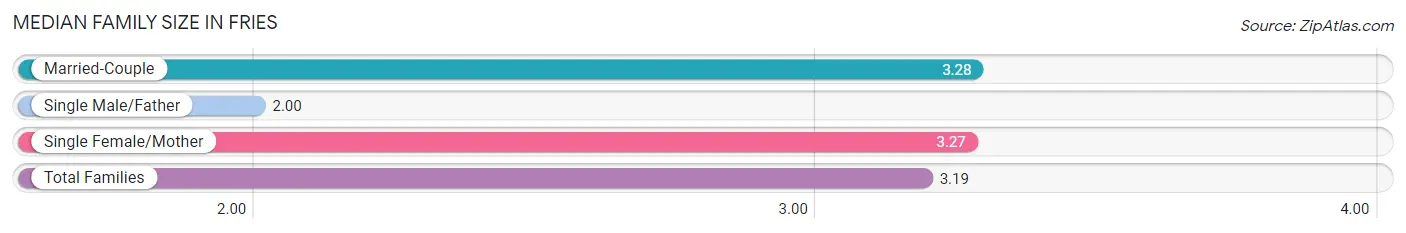
| Family Type | # Families | Family Size |
| Married-Couple | 68 (76.4%) | 3.28 |
| Single Male/Father | 6 (6.7%) | 2.00 |
| Single Female/Mother | 15 (16.9%) | 3.27 |
| Total Families | 89 (100.0%) | 3.19 |
Median Household Size in Fries
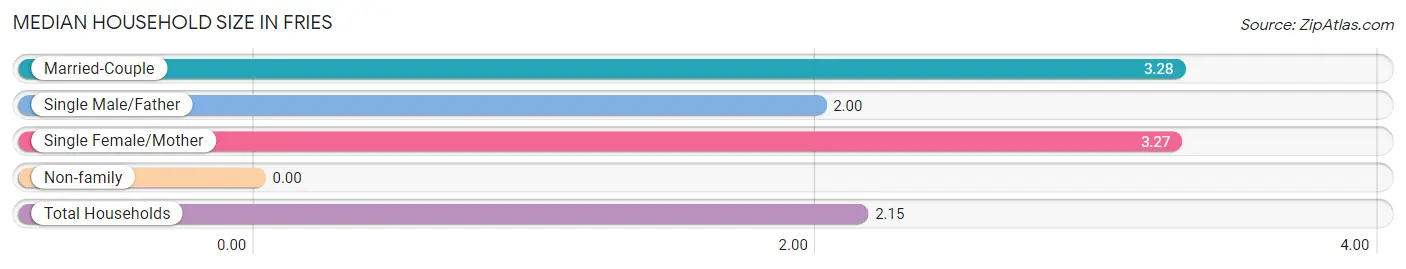
| Household Type | # Households | Household Size |
| Married-Couple | 68 (40.2%) | 3.28 |
| Single Male/Father | 6 (3.5%) | 2.00 |
| Single Female/Mother | 15 (8.9%) | 3.27 |
| Non-family | 80 (47.3%) | - |
| Total Households | 169 (100.0%) | 2.15 |
Household Size by Marriage Status in Fries
Out of a total of 169 households in Fries, 89 (52.7%) are family households, while 80 (47.3%) are nonfamily households. The most numerous type of family households are 2-person households, comprising 50, and the most common type of nonfamily households are 1-person households, comprising 80.
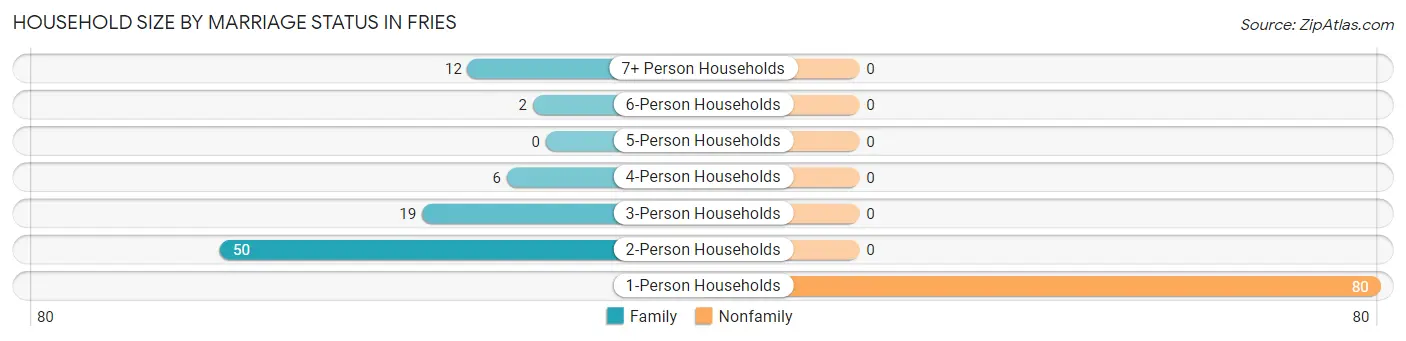
| Household Size | Family Households | Nonfamily Households |
| 1-Person Households | - | 80 (47.3%) |
| 2-Person Households | 50 (29.6%) | 0 (0.0%) |
| 3-Person Households | 19 (11.2%) | 0 (0.0%) |
| 4-Person Households | 6 (3.5%) | 0 (0.0%) |
| 5-Person Households | 0 (0.0%) | 0 (0.0%) |
| 6-Person Households | 2 (1.2%) | 0 (0.0%) |
| 7+ Person Households | 12 (7.1%) | 0 (0.0%) |
| Total | 89 (52.7%) | 80 (47.3%) |
Female Fertility in Fries
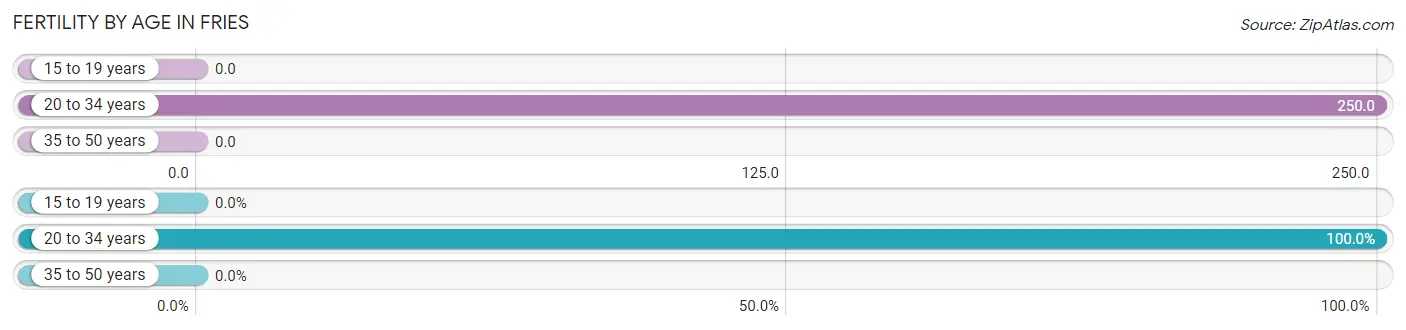
Fertility by Age in Fries
Average fertility rate in Fries is 128.0 births per 1,000 women. Women in the age bracket of 20 to 34 years have the highest fertility rate with 250.0 births per 1,000 women. Women in the age bracket of 20 to 34 years acount for 100.0% of all women with births.
| Age Bracket | Women with Births | Births / 1,000 Women |
| 15 to 19 years | 0 (0.0%) | 0.0 |
| 20 to 34 years | 5 (100.0%) | 250.0 |
| 35 to 50 years | 0 (0.0%) | 0.0 |
| Total | 5 (100.0%) | 128.0 |
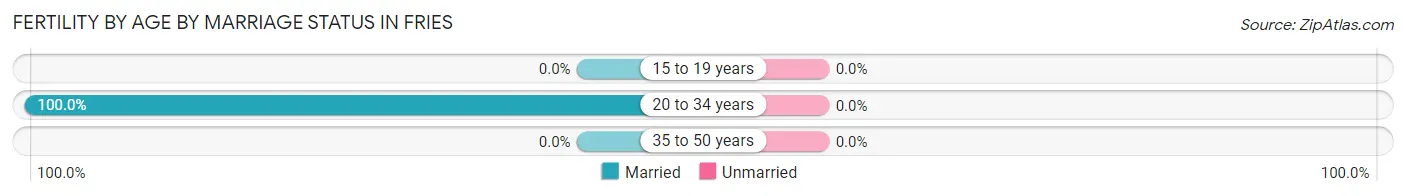
Fertility by Age by Marriage Status in Fries
| Age Bracket | Married | Unmarried |
| 15 to 19 years | 0 (0.0%) | 0 (0.0%) |
| 20 to 34 years | 5 (100.0%) | 0 (0.0%) |
| 35 to 50 years | 0 (0.0%) | 0 (0.0%) |
| Total | 5 (100.0%) | 0 (0.0%) |
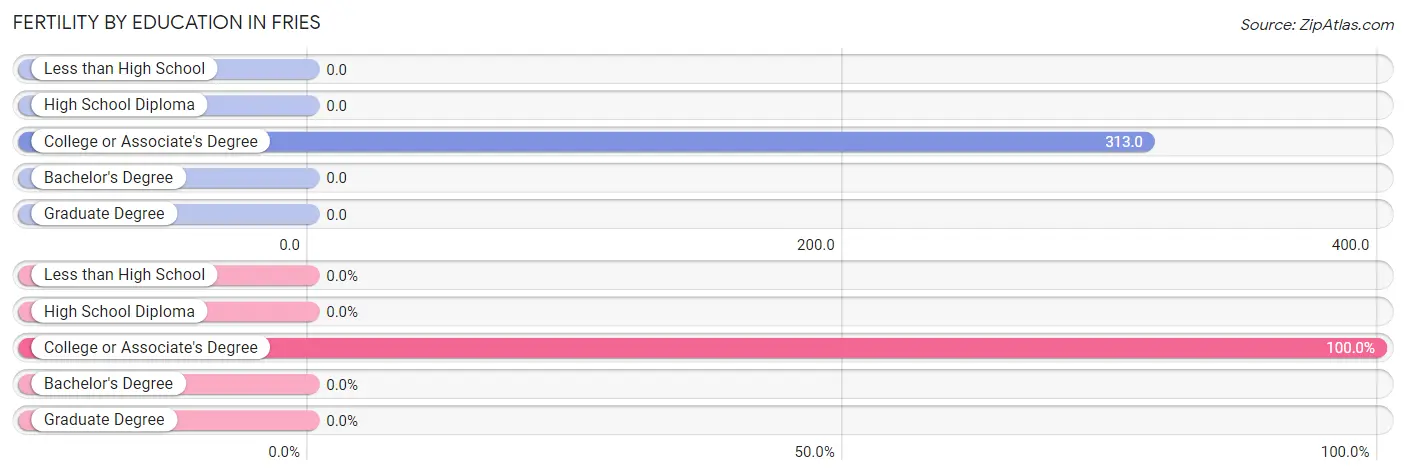
Fertility by Education in Fries
| Educational Attainment | Women with Births | Births / 1,000 Women |
| Less than High School | 0 (0.0%) | 0.0 |
| High School Diploma | 0 (0.0%) | 0.0 |
| College or Associate's Degree | 5 (100.0%) | 313.0 |
| Bachelor's Degree | 0 (0.0%) | 0.0 |
| Graduate Degree | 0 (0.0%) | 0.0 |
| Total | 5 (100.0%) | 128.0 |
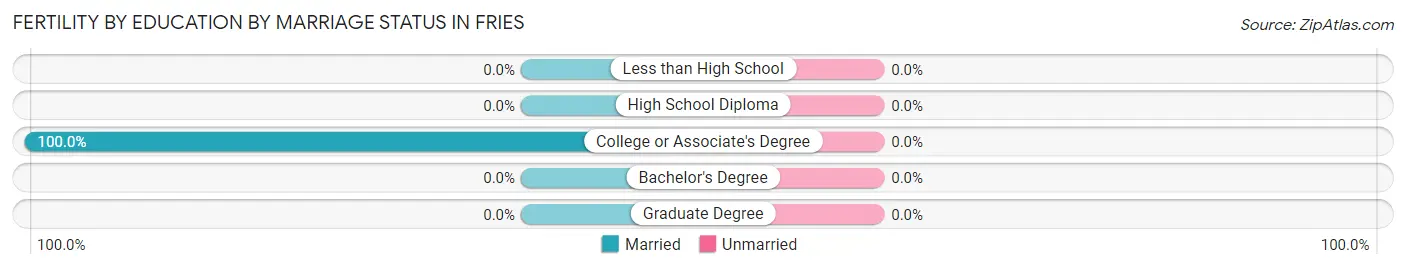
Fertility by Education by Marriage Status in Fries
| Educational Attainment | Married | Unmarried |
| Less than High School | 0 (0.0%) | 0 (0.0%) |
| High School Diploma | 0 (0.0%) | 0 (0.0%) |
| College or Associate's Degree | 5 (100.0%) | 0 (0.0%) |
| Bachelor's Degree | 0 (0.0%) | 0 (0.0%) |
| Graduate Degree | 0 (0.0%) | 0 (0.0%) |
| Total | 5 (100.0%) | 0 (0.0%) |
Employment Characteristics in Fries
Employment by Class of Employer in Fries
Among the 106 employed individuals in Fries, private company employees (62 | 58.5%), self-employed (not incorporated) (32 | 30.2%), and state government employees (9 | 8.5%) make up the most common classes of employment.
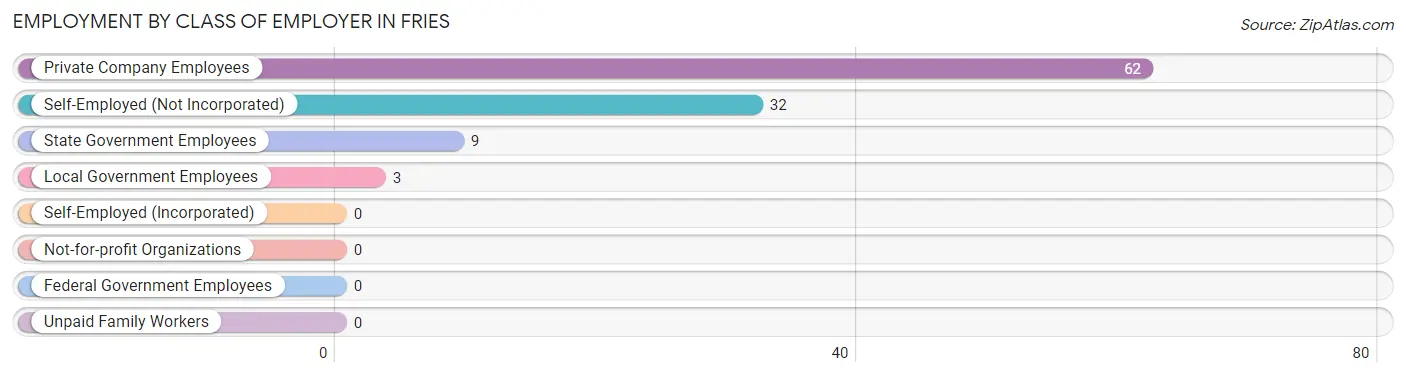
| Employer Class | # Employees | % Employees |
| Private Company Employees | 62 | 58.5% |
| Self-Employed (Incorporated) | 0 | 0.0% |
| Self-Employed (Not Incorporated) | 32 | 30.2% |
| Not-for-profit Organizations | 0 | 0.0% |
| Local Government Employees | 3 | 2.8% |
| State Government Employees | 9 | 8.5% |
| Federal Government Employees | 0 | 0.0% |
| Unpaid Family Workers | 0 | 0.0% |
| Total | 106 | 100.0% |
Employment Status by Age in Fries
According to the labor force statistics for Fries, out of the total population over 16 years of age (277), 41.9% or 116 individuals are in the labor force, with 8.6% or 10 of them unemployed. The age group with the highest labor force participation rate is 30 to 34 years, with 100.0% or 22 individuals in the labor force. Within the labor force, the 25 to 29 years age range has the highest percentage of unemployed individuals, with 45.5% or 10 of them being unemployed.
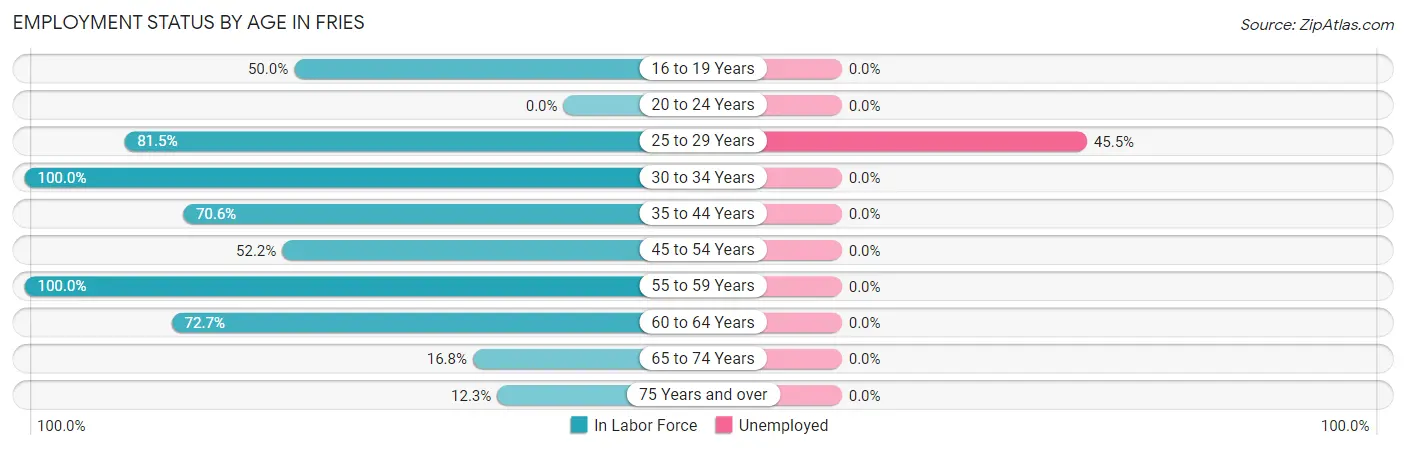
| Age Bracket | In Labor Force | Unemployed |
| 16 to 19 Years | 3 (50.0%) | 0 (0.0%) |
| 20 to 24 Years | 0 (0.0%) | 0 (0.0%) |
| 25 to 29 Years | 22 (81.5%) | 10 (45.5%) |
| 30 to 34 Years | 22 (100.0%) | 0 (0.0%) |
| 35 to 44 Years | 12 (70.6%) | 0 (0.0%) |
| 45 to 54 Years | 12 (52.2%) | 0 (0.0%) |
| 55 to 59 Years | 6 (100.0%) | 0 (0.0%) |
| 60 to 64 Years | 16 (72.7%) | 0 (0.0%) |
| 65 to 74 Years | 16 (16.8%) | 0 (0.0%) |
| 75 Years and over | 7 (12.3%) | 0 (0.0%) |
| Total | 116 (41.9%) | 10 (8.6%) |
Employment Status by Educational Attainment in Fries
According to labor force statistics for Fries, 76.9% of individuals (90) out of the total population between 25 and 64 years of age (117) are in the labor force, with 11.1% or 10 of them being unemployed. The group with the highest labor force participation rate are those with the educational attainment of high school diploma, with 100.0% or 9 individuals in the labor force. Within the labor force, individuals with college / associate degree education have the highest percentage of unemployment, with 17.9% or 10 of them being unemployed.
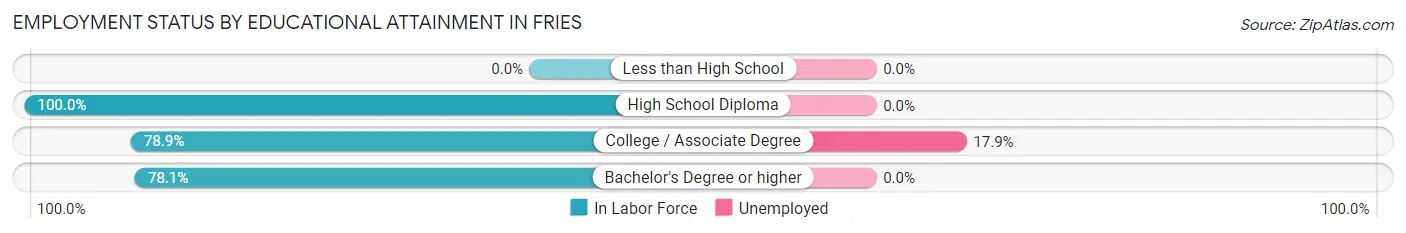
| Educational Attainment | In Labor Force | Unemployed |
| Less than High School | 0 (0.0%) | 0 (0.0%) |
| High School Diploma | 9 (100.0%) | 0 (0.0%) |
| College / Associate Degree | 56 (78.9%) | 13 (17.9%) |
| Bachelor's Degree or higher | 25 (78.1%) | 0 (0.0%) |
| Total | 90 (76.9%) | 13 (11.1%) |
Employment Occupations by Sex in Fries
Management, Business, Science and Arts Occupations
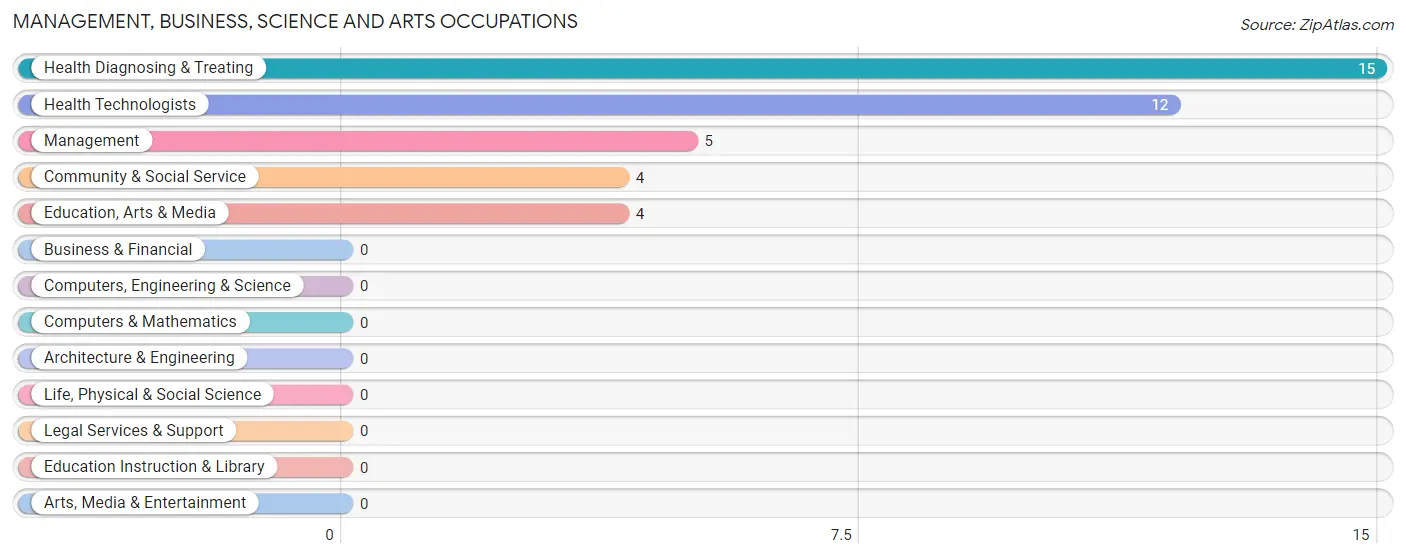
The most common Management, Business, Science and Arts occupations in Fries are Health Diagnosing & Treating (15 | 14.1%), Health Technologists (12 | 11.3%), Management (5 | 4.7%), Community & Social Service (4 | 3.8%), and Education, Arts & Media (4 | 3.8%).
Management, Business, Science and Arts Occupations by Sex
Within the Management, Business, Science and Arts occupations in Fries, the most male-oriented occupations are Management (100.0%), Community & Social Service (100.0%), and Education, Arts & Media (100.0%), while the most female-oriented occupations are Health Diagnosing & Treating (100.0%), and Health Technologists (100.0%).
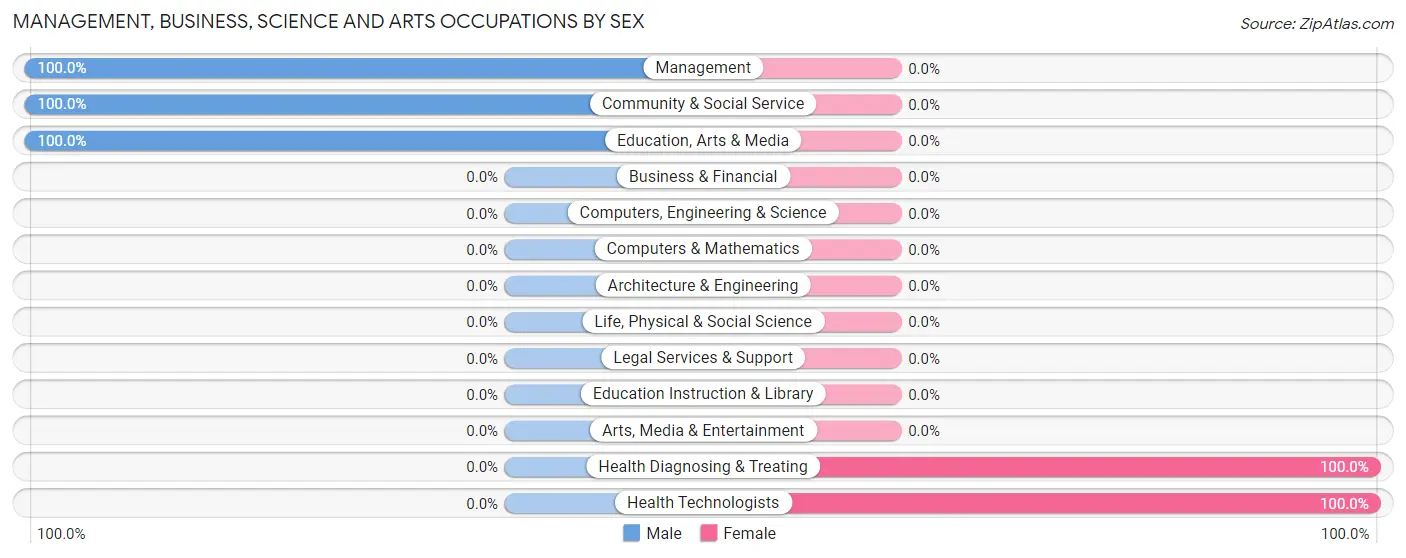
| Occupation | Male | Female |
| Management | 5 (100.0%) | 0 (0.0%) |
| Business & Financial | 0 (0.0%) | 0 (0.0%) |
| Computers, Engineering & Science | 0 (0.0%) | 0 (0.0%) |
| Computers & Mathematics | 0 (0.0%) | 0 (0.0%) |
| Architecture & Engineering | 0 (0.0%) | 0 (0.0%) |
| Life, Physical & Social Science | 0 (0.0%) | 0 (0.0%) |
| Community & Social Service | 4 (100.0%) | 0 (0.0%) |
| Education, Arts & Media | 4 (100.0%) | 0 (0.0%) |
| Legal Services & Support | 0 (0.0%) | 0 (0.0%) |
| Education Instruction & Library | 0 (0.0%) | 0 (0.0%) |
| Arts, Media & Entertainment | 0 (0.0%) | 0 (0.0%) |
| Health Diagnosing & Treating | 0 (0.0%) | 15 (100.0%) |
| Health Technologists | 0 (0.0%) | 12 (100.0%) |
| Total (Category) | 9 (37.5%) | 15 (62.5%) |
| Total (Overall) | 56 (52.8%) | 50 (47.2%) |
Services Occupations
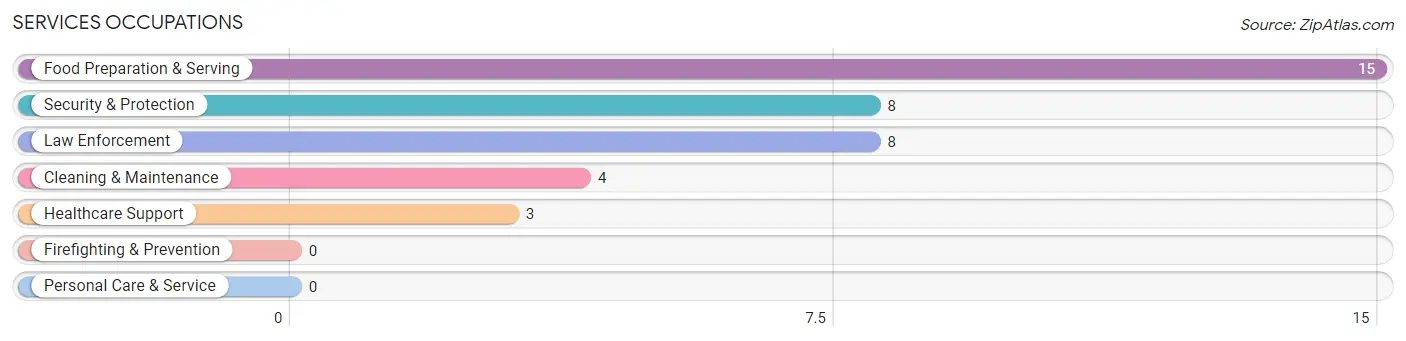
The most common Services occupations in Fries are Food Preparation & Serving (15 | 14.1%), Security & Protection (8 | 7.5%), Law Enforcement (8 | 7.5%), Cleaning & Maintenance (4 | 3.8%), and Healthcare Support (3 | 2.8%).
Services Occupations by Sex
Within the Services occupations in Fries, the most male-oriented occupations are Cleaning & Maintenance (100.0%), Food Preparation & Serving (60.0%), and Security & Protection (37.5%), while the most female-oriented occupations are Healthcare Support (100.0%), Security & Protection (62.5%), and Law Enforcement (62.5%).
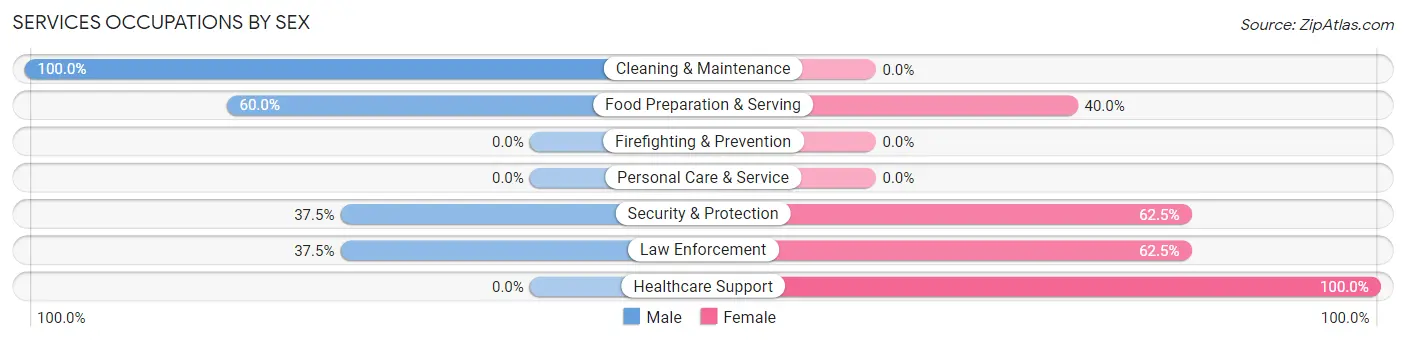
| Occupation | Male | Female |
| Healthcare Support | 0 (0.0%) | 3 (100.0%) |
| Security & Protection | 3 (37.5%) | 5 (62.5%) |
| Firefighting & Prevention | 0 (0.0%) | 0 (0.0%) |
| Law Enforcement | 3 (37.5%) | 5 (62.5%) |
| Food Preparation & Serving | 9 (60.0%) | 6 (40.0%) |
| Cleaning & Maintenance | 4 (100.0%) | 0 (0.0%) |
| Personal Care & Service | 0 (0.0%) | 0 (0.0%) |
| Total (Category) | 16 (53.3%) | 14 (46.7%) |
| Total (Overall) | 56 (52.8%) | 50 (47.2%) |
Sales and Office Occupations
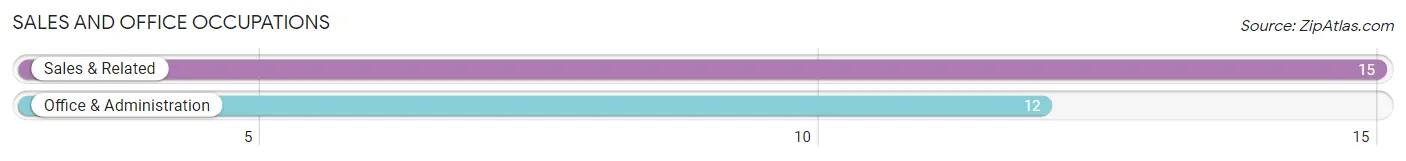
The most common Sales and Office occupations in Fries are Sales & Related (15 | 14.1%), and Office & Administration (12 | 11.3%).
Sales and Office Occupations by Sex

| Occupation | Male | Female |
| Sales & Related | 9 (60.0%) | 6 (40.0%) |
| Office & Administration | 12 (100.0%) | 0 (0.0%) |
| Total (Category) | 21 (77.8%) | 6 (22.2%) |
| Total (Overall) | 56 (52.8%) | 50 (47.2%) |
Natural Resources, Construction and Maintenance Occupations
The most common Natural Resources, Construction and Maintenance occupations in Fries are , and Installation, Maintenance & Repair (2 | 1.9%).
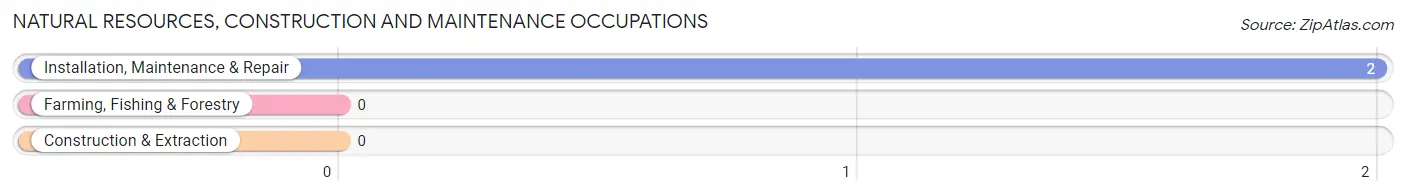
Natural Resources, Construction and Maintenance Occupations by Sex
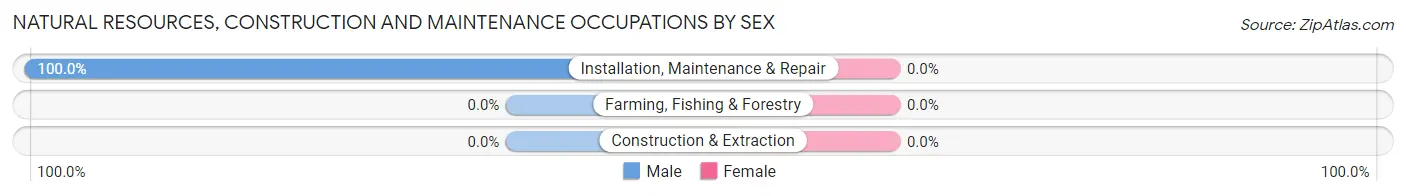
| Occupation | Male | Female |
| Farming, Fishing & Forestry | 0 (0.0%) | 0 (0.0%) |
| Construction & Extraction | 0 (0.0%) | 0 (0.0%) |
| Installation, Maintenance & Repair | 2 (100.0%) | 0 (0.0%) |
| Total (Category) | 2 (100.0%) | 0 (0.0%) |
| Total (Overall) | 56 (52.8%) | 50 (47.2%) |
Production, Transportation and Moving Occupations
The most common Production, Transportation and Moving occupations in Fries are Material Moving (9 | 8.5%), Production (8 | 7.5%), and Transportation (6 | 5.7%).
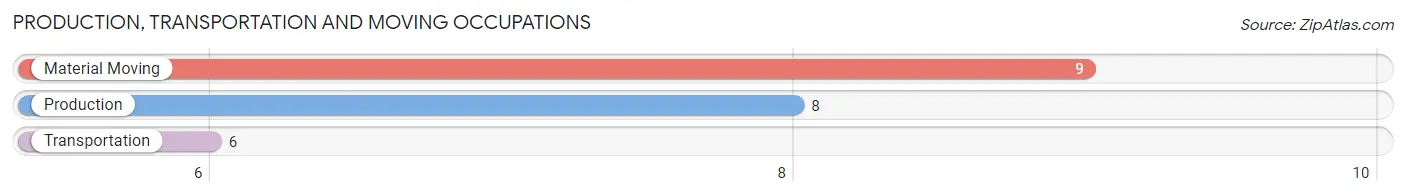
Production, Transportation and Moving Occupations by Sex
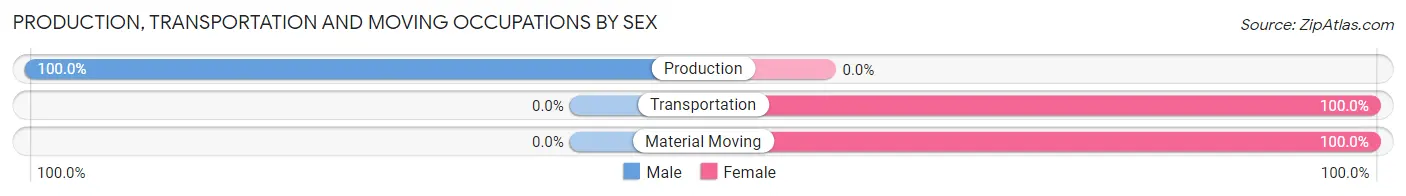
| Occupation | Male | Female |
| Production | 8 (100.0%) | 0 (0.0%) |
| Transportation | 0 (0.0%) | 6 (100.0%) |
| Material Moving | 0 (0.0%) | 9 (100.0%) |
| Total (Category) | 8 (34.8%) | 15 (65.2%) |
| Total (Overall) | 56 (52.8%) | 50 (47.2%) |
Employment Industries by Sex in Fries
Employment Industries in Fries
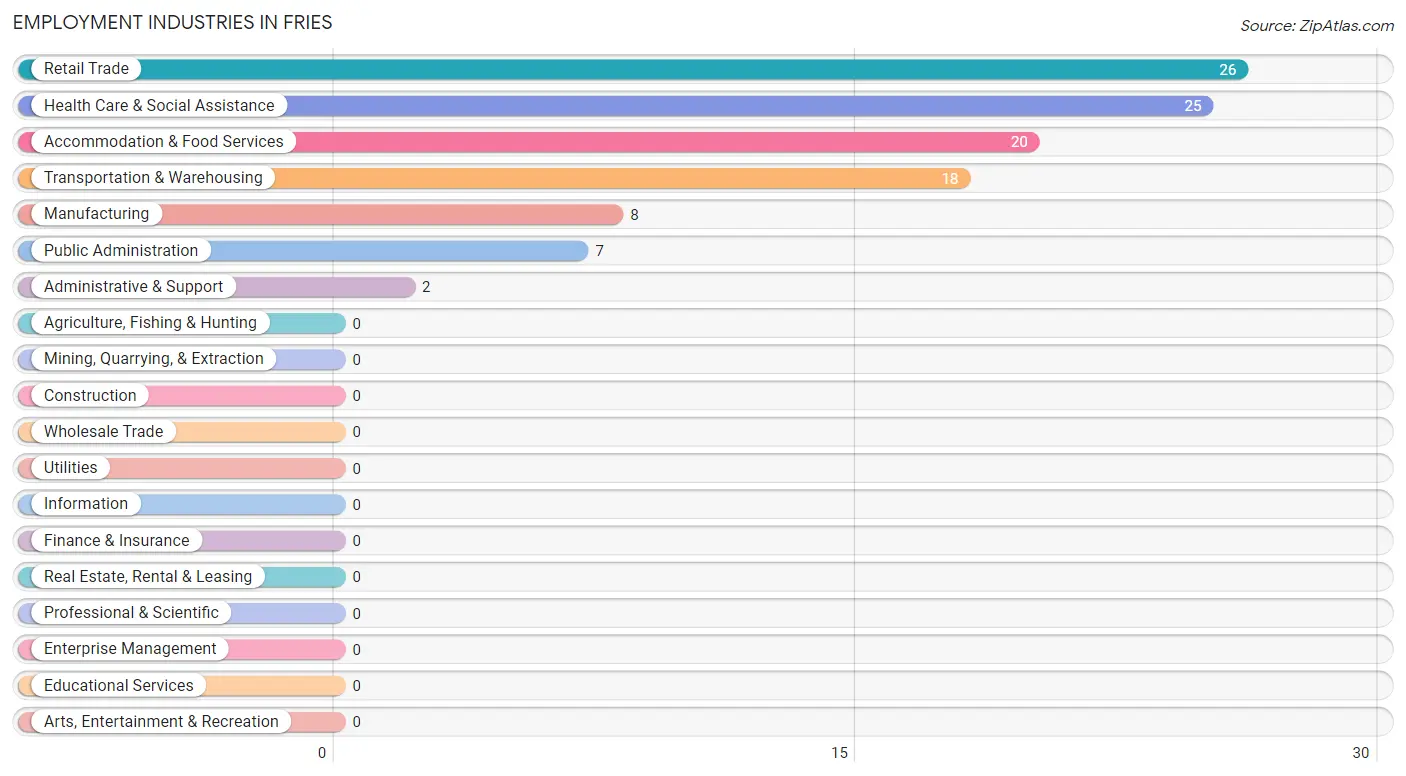
The major employment industries in Fries include Retail Trade (26 | 24.5%), Health Care & Social Assistance (25 | 23.6%), Accommodation & Food Services (20 | 18.9%), Transportation & Warehousing (18 | 17.0%), and Manufacturing (8 | 7.5%).
Employment Industries by Sex in Fries
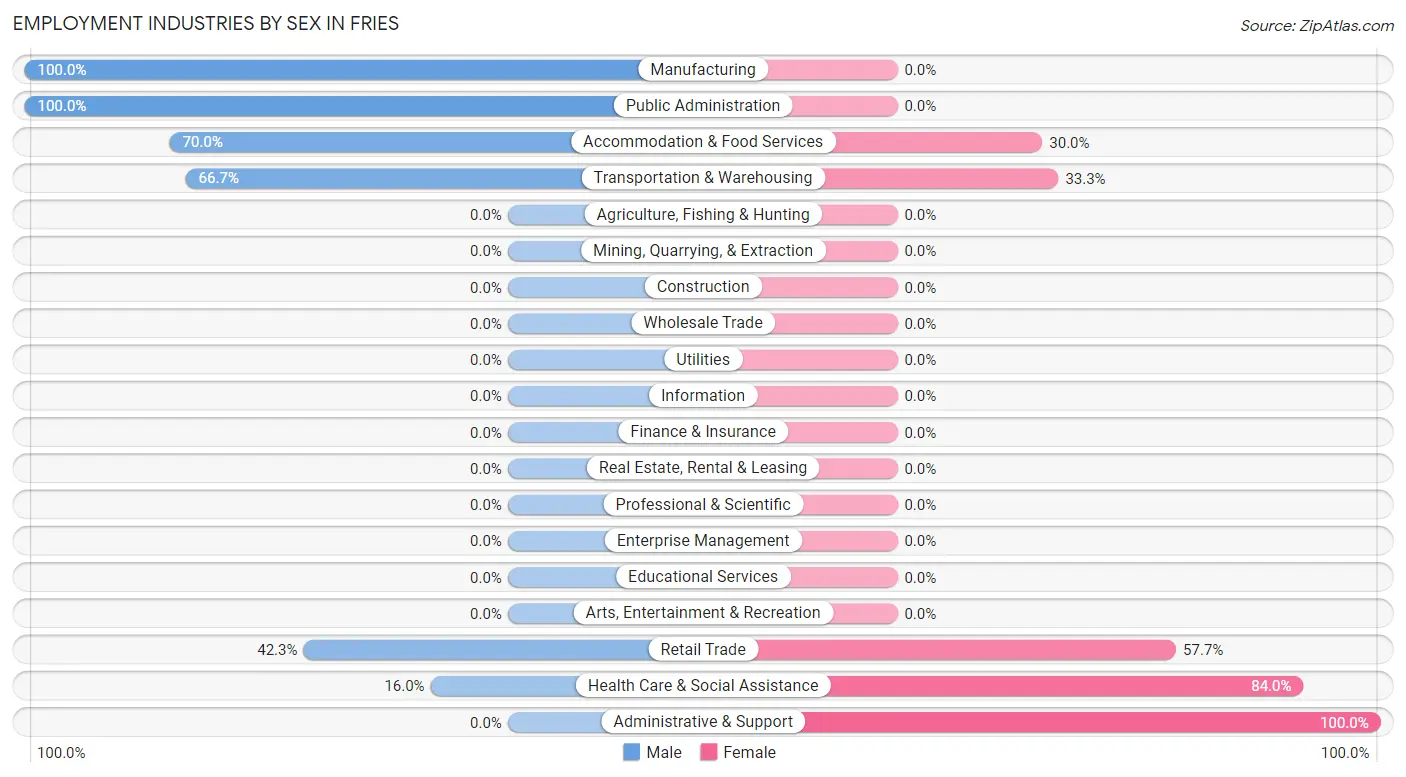
The Fries industries that see more men than women are Manufacturing (100.0%), Public Administration (100.0%), and Accommodation & Food Services (70.0%), whereas the industries that tend to have a higher number of women are Administrative & Support (100.0%), Health Care & Social Assistance (84.0%), and Retail Trade (57.7%).
| Industry | Male | Female |
| Agriculture, Fishing & Hunting | 0 (0.0%) | 0 (0.0%) |
| Mining, Quarrying, & Extraction | 0 (0.0%) | 0 (0.0%) |
| Construction | 0 (0.0%) | 0 (0.0%) |
| Manufacturing | 8 (100.0%) | 0 (0.0%) |
| Wholesale Trade | 0 (0.0%) | 0 (0.0%) |
| Retail Trade | 11 (42.3%) | 15 (57.7%) |
| Transportation & Warehousing | 12 (66.7%) | 6 (33.3%) |
| Utilities | 0 (0.0%) | 0 (0.0%) |
| Information | 0 (0.0%) | 0 (0.0%) |
| Finance & Insurance | 0 (0.0%) | 0 (0.0%) |
| Real Estate, Rental & Leasing | 0 (0.0%) | 0 (0.0%) |
| Professional & Scientific | 0 (0.0%) | 0 (0.0%) |
| Enterprise Management | 0 (0.0%) | 0 (0.0%) |
| Administrative & Support | 0 (0.0%) | 2 (100.0%) |
| Educational Services | 0 (0.0%) | 0 (0.0%) |
| Health Care & Social Assistance | 4 (16.0%) | 21 (84.0%) |
| Arts, Entertainment & Recreation | 0 (0.0%) | 0 (0.0%) |
| Accommodation & Food Services | 14 (70.0%) | 6 (30.0%) |
| Public Administration | 7 (100.0%) | 0 (0.0%) |
| Total | 56 (52.8%) | 50 (47.2%) |
Education in Fries
School Enrollment in Fries
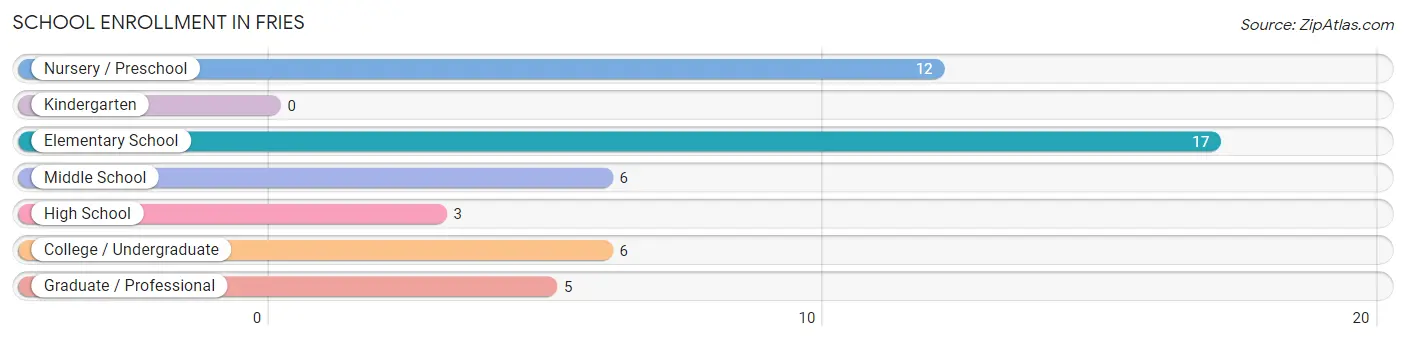
The most common levels of schooling among the 49 students in Fries are elementary school (17 | 34.7%), nursery / preschool (12 | 24.5%), and middle school (6 | 12.2%).
| School Level | # Students | % Students |
| Nursery / Preschool | 12 | 24.5% |
| Kindergarten | 0 | 0.0% |
| Elementary School | 17 | 34.7% |
| Middle School | 6 | 12.2% |
| High School | 3 | 6.1% |
| College / Undergraduate | 6 | 12.2% |
| Graduate / Professional | 5 | 10.2% |
| Total | 49 | 100.0% |
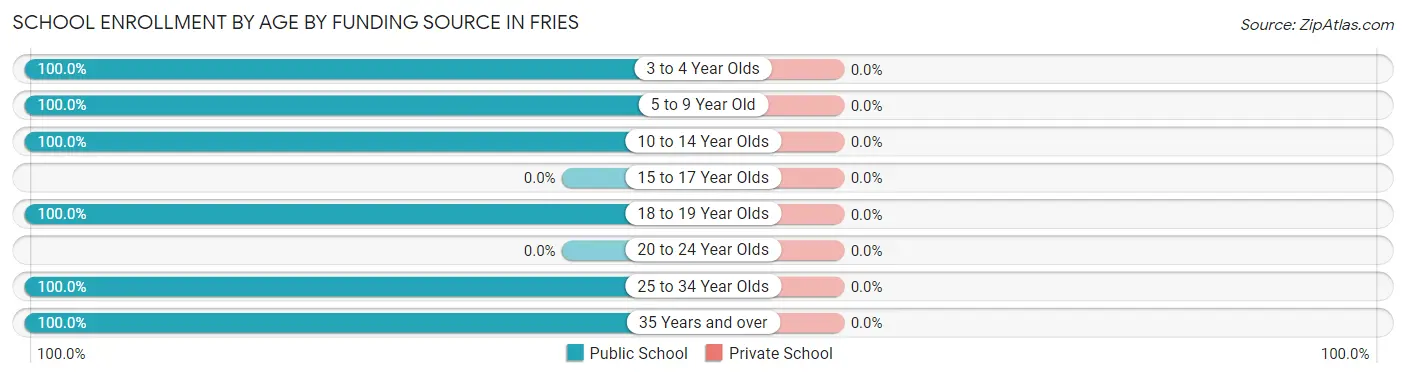
School Enrollment by Age by Funding Source in Fries
| Age Bracket | Public School | Private School |
| 3 to 4 Year Olds | 8 (100.0%) | 0 (0.0%) |
| 5 to 9 Year Old | 12 (100.0%) | 0 (0.0%) |
| 10 to 14 Year Olds | 15 (100.0%) | 0 (0.0%) |
| 15 to 17 Year Olds | 0 (0.0%) | 0 (0.0%) |
| 18 to 19 Year Olds | 6 (100.0%) | 0 (0.0%) |
| 20 to 24 Year Olds | 0 (0.0%) | 0 (0.0%) |
| 25 to 34 Year Olds | 3 (100.0%) | 0 (0.0%) |
| 35 Years and over | 5 (100.0%) | 0 (0.0%) |
| Total | 49 (100.0%) | 0 (0.0%) |
Educational Attainment by Field of Study in Fries
Business (16 | 22.2%), psychology (15 | 20.8%), science & technology (11 | 15.3%), arts & humanities (7 | 9.7%), and education (6 | 8.3%) are the most common fields of study among 72 individuals in Fries who have obtained a bachelor's degree or higher.
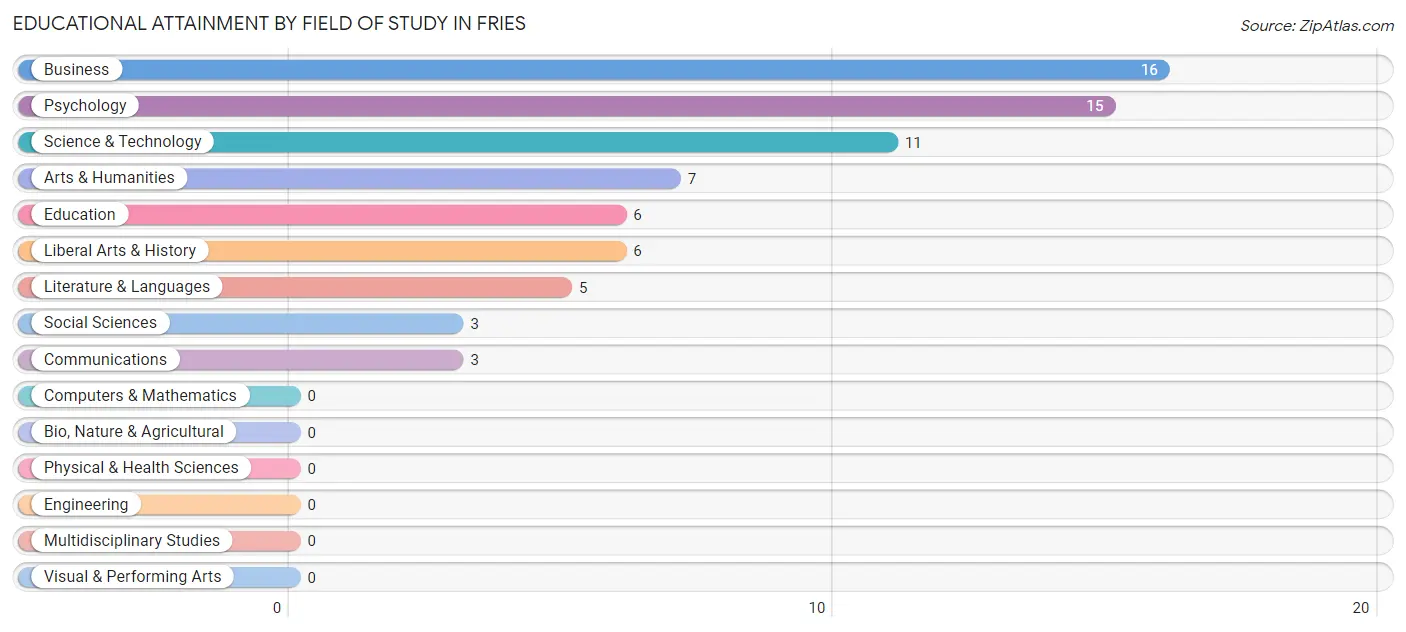
| Field of Study | # Graduates | % Graduates |
| Computers & Mathematics | 0 | 0.0% |
| Bio, Nature & Agricultural | 0 | 0.0% |
| Physical & Health Sciences | 0 | 0.0% |
| Psychology | 15 | 20.8% |
| Social Sciences | 3 | 4.2% |
| Engineering | 0 | 0.0% |
| Multidisciplinary Studies | 0 | 0.0% |
| Science & Technology | 11 | 15.3% |
| Business | 16 | 22.2% |
| Education | 6 | 8.3% |
| Literature & Languages | 5 | 6.9% |
| Liberal Arts & History | 6 | 8.3% |
| Visual & Performing Arts | 0 | 0.0% |
| Communications | 3 | 4.2% |
| Arts & Humanities | 7 | 9.7% |
| Total | 72 | 100.0% |
Transportation & Commute in Fries
Vehicle Availability by Sex in Fries
The most prevalent vehicle ownership categories in Fries are males with 2 vehicles (33, accounting for 58.9%) and females with 2 vehicles (35, making up 66.0%).
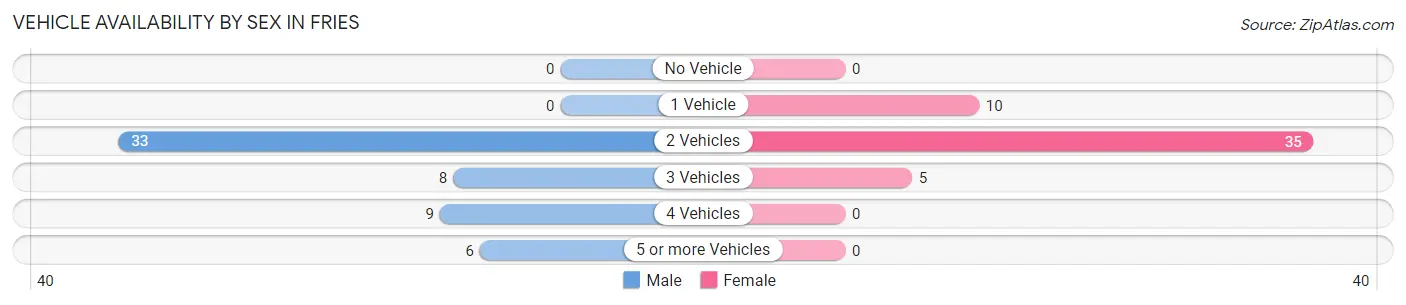
| Vehicles Available | Male | Female |
| No Vehicle | 0 (0.0%) | 0 (0.0%) |
| 1 Vehicle | 0 (0.0%) | 10 (20.0%) |
| 2 Vehicles | 33 (58.9%) | 35 (70.0%) |
| 3 Vehicles | 8 (14.3%) | 5 (10.0%) |
| 4 Vehicles | 9 (16.1%) | 0 (0.0%) |
| 5 or more Vehicles | 6 (10.7%) | 0 (0.0%) |
| Total | 56 (100.0%) | 50 (100.0%) |
Commute Time in Fries
The most frequently occuring commute durations in Fries are less than 5 minutes (24 commuters, 23.1%), 20 to 24 minutes (19 commuters, 18.3%), and 25 to 29 minutes (17 commuters, 16.4%).
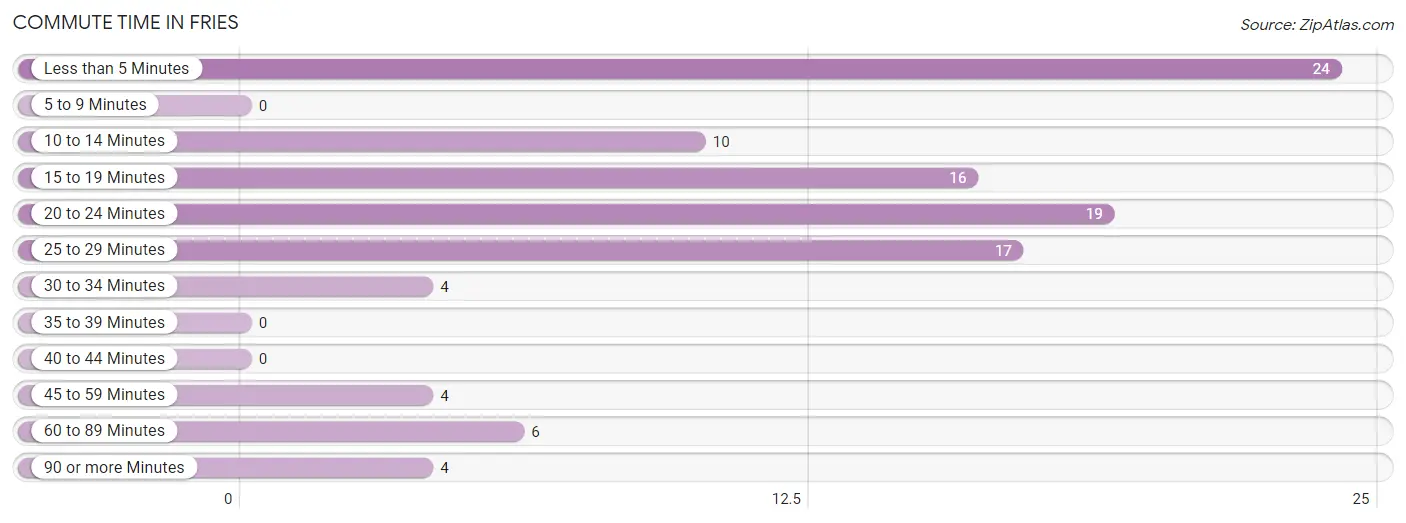
| Commute Time | # Commuters | % Commuters |
| Less than 5 Minutes | 24 | 23.1% |
| 5 to 9 Minutes | 0 | 0.0% |
| 10 to 14 Minutes | 10 | 9.6% |
| 15 to 19 Minutes | 16 | 15.4% |
| 20 to 24 Minutes | 19 | 18.3% |
| 25 to 29 Minutes | 17 | 16.4% |
| 30 to 34 Minutes | 4 | 3.8% |
| 35 to 39 Minutes | 0 | 0.0% |
| 40 to 44 Minutes | 0 | 0.0% |
| 45 to 59 Minutes | 4 | 3.8% |
| 60 to 89 Minutes | 6 | 5.8% |
| 90 or more Minutes | 4 | 3.8% |
Commute Time by Sex in Fries
The most common commute times in Fries are less than 5 minutes (18 commuters, 32.1%) for males and 20 to 24 minutes (13 commuters, 27.1%) for females.
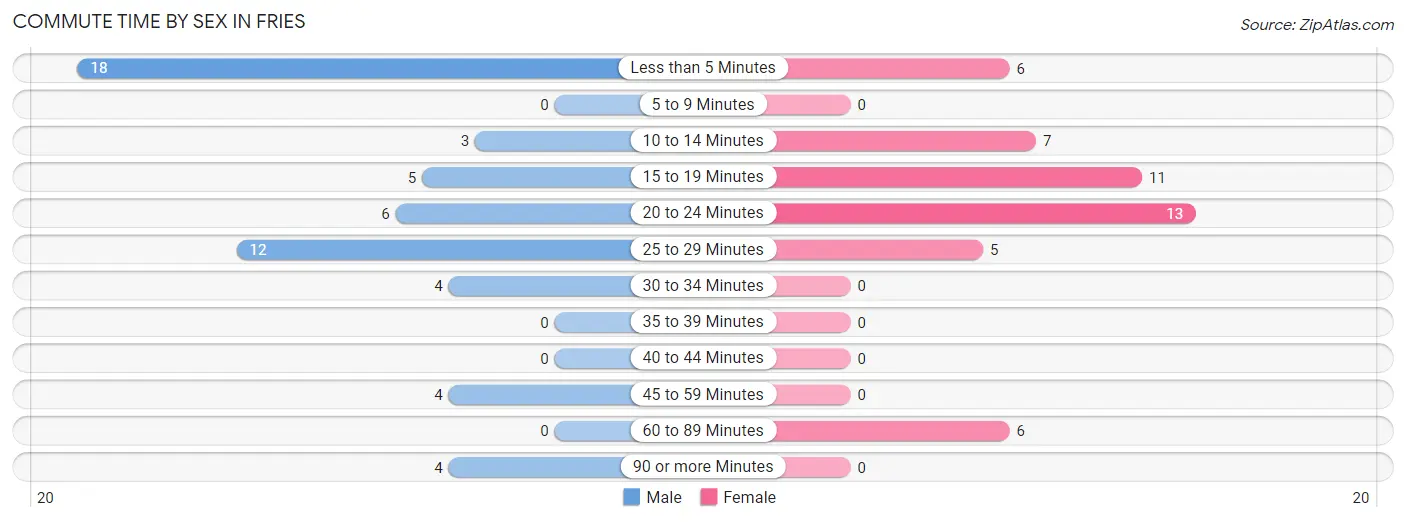
| Commute Time | Male | Female |
| Less than 5 Minutes | 18 (32.1%) | 6 (12.5%) |
| 5 to 9 Minutes | 0 (0.0%) | 0 (0.0%) |
| 10 to 14 Minutes | 3 (5.4%) | 7 (14.6%) |
| 15 to 19 Minutes | 5 (8.9%) | 11 (22.9%) |
| 20 to 24 Minutes | 6 (10.7%) | 13 (27.1%) |
| 25 to 29 Minutes | 12 (21.4%) | 5 (10.4%) |
| 30 to 34 Minutes | 4 (7.1%) | 0 (0.0%) |
| 35 to 39 Minutes | 0 (0.0%) | 0 (0.0%) |
| 40 to 44 Minutes | 0 (0.0%) | 0 (0.0%) |
| 45 to 59 Minutes | 4 (7.1%) | 0 (0.0%) |
| 60 to 89 Minutes | 0 (0.0%) | 6 (12.5%) |
| 90 or more Minutes | 4 (7.1%) | 0 (0.0%) |
Time of Departure to Work by Sex in Fries
The most frequent times of departure to work in Fries are 7:00 AM to 7:29 AM (12, 21.4%) for males and 10:00 AM to 10:59 AM (13, 27.1%) for females.
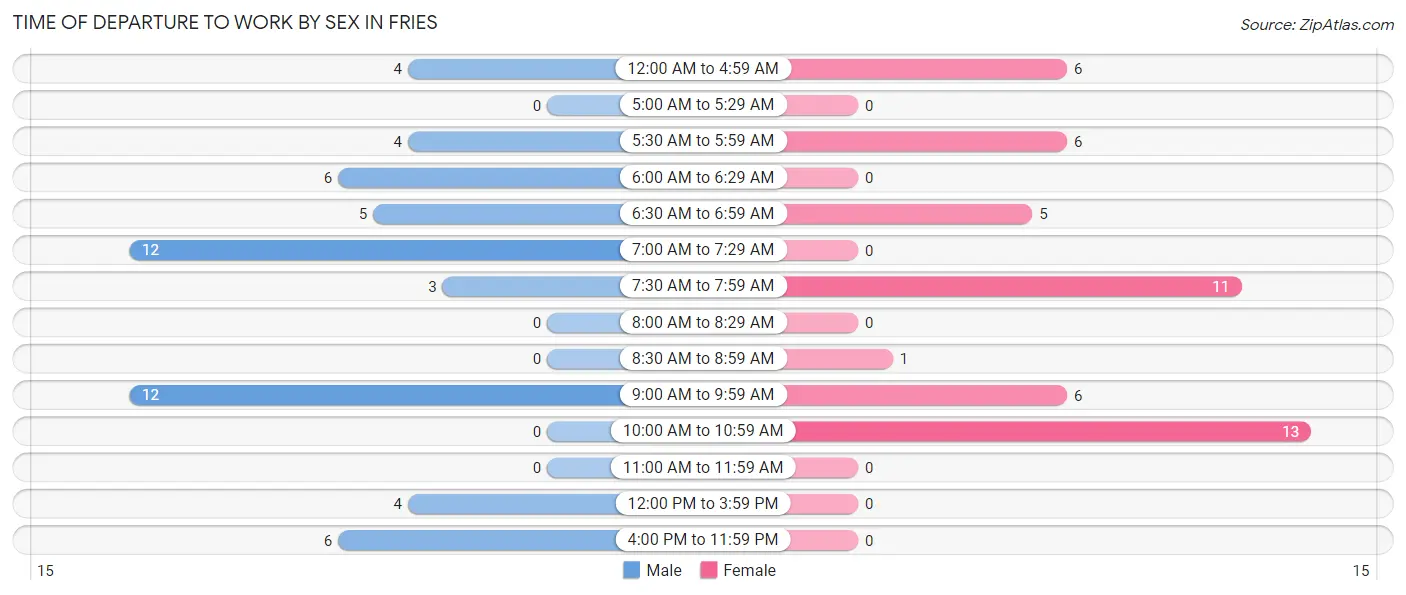
| Time of Departure | Male | Female |
| 12:00 AM to 4:59 AM | 4 (7.1%) | 6 (12.5%) |
| 5:00 AM to 5:29 AM | 0 (0.0%) | 0 (0.0%) |
| 5:30 AM to 5:59 AM | 4 (7.1%) | 6 (12.5%) |
| 6:00 AM to 6:29 AM | 6 (10.7%) | 0 (0.0%) |
| 6:30 AM to 6:59 AM | 5 (8.9%) | 5 (10.4%) |
| 7:00 AM to 7:29 AM | 12 (21.4%) | 0 (0.0%) |
| 7:30 AM to 7:59 AM | 3 (5.4%) | 11 (22.9%) |
| 8:00 AM to 8:29 AM | 0 (0.0%) | 0 (0.0%) |
| 8:30 AM to 8:59 AM | 0 (0.0%) | 1 (2.1%) |
| 9:00 AM to 9:59 AM | 12 (21.4%) | 6 (12.5%) |
| 10:00 AM to 10:59 AM | 0 (0.0%) | 13 (27.1%) |
| 11:00 AM to 11:59 AM | 0 (0.0%) | 0 (0.0%) |
| 12:00 PM to 3:59 PM | 4 (7.1%) | 0 (0.0%) |
| 4:00 PM to 11:59 PM | 6 (10.7%) | 0 (0.0%) |
| Total | 56 (100.0%) | 48 (100.0%) |
Housing Occupancy in Fries
Occupancy by Ownership in Fries
Of the total 169 dwellings in Fries, owner-occupied units account for 135 (79.9%), while renter-occupied units make up 34 (20.1%).
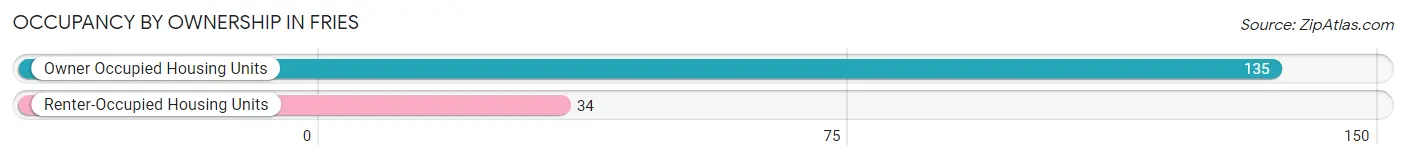
| Occupancy | # Housing Units | % Housing Units |
| Owner Occupied Housing Units | 135 | 79.9% |
| Renter-Occupied Housing Units | 34 | 20.1% |
| Total Occupied Housing Units | 169 | 100.0% |
Occupancy by Household Size in Fries
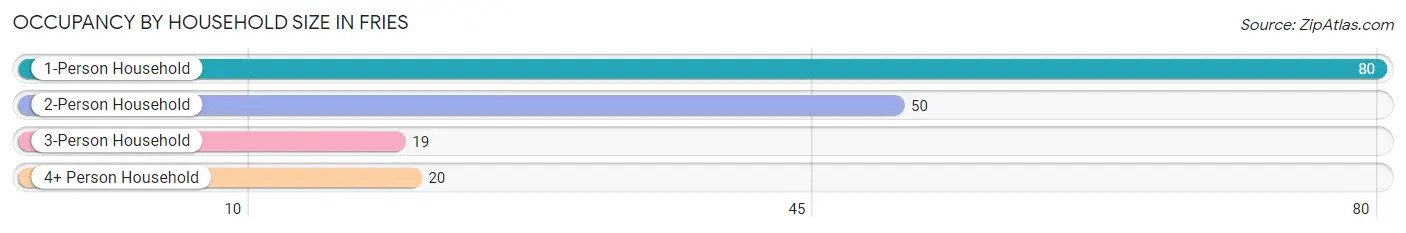
| Household Size | # Housing Units | % Housing Units |
| 1-Person Household | 80 | 47.3% |
| 2-Person Household | 50 | 29.6% |
| 3-Person Household | 19 | 11.2% |
| 4+ Person Household | 20 | 11.8% |
| Total Housing Units | 169 | 100.0% |
Occupancy by Ownership by Household Size in Fries
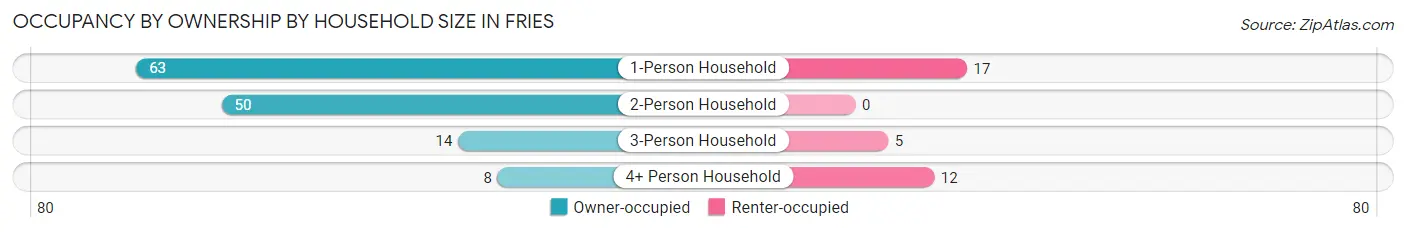
| Household Size | Owner-occupied | Renter-occupied |
| 1-Person Household | 63 (78.7%) | 17 (21.2%) |
| 2-Person Household | 50 (100.0%) | 0 (0.0%) |
| 3-Person Household | 14 (73.7%) | 5 (26.3%) |
| 4+ Person Household | 8 (40.0%) | 12 (60.0%) |
| Total Housing Units | 135 (79.9%) | 34 (20.1%) |
Occupancy by Educational Attainment in Fries
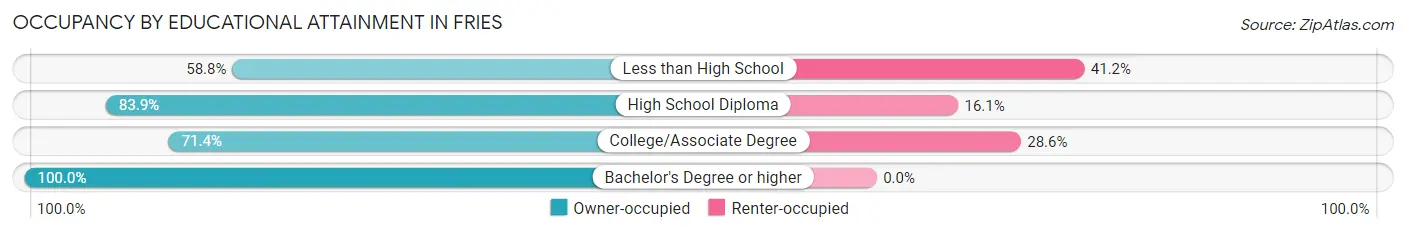
| Household Size | Owner-occupied | Renter-occupied |
| Less than High School | 10 (58.8%) | 7 (41.2%) |
| High School Diploma | 26 (83.9%) | 5 (16.1%) |
| College/Associate Degree | 55 (71.4%) | 22 (28.6%) |
| Bachelor's Degree or higher | 44 (100.0%) | 0 (0.0%) |
Occupancy by Age of Householder in Fries
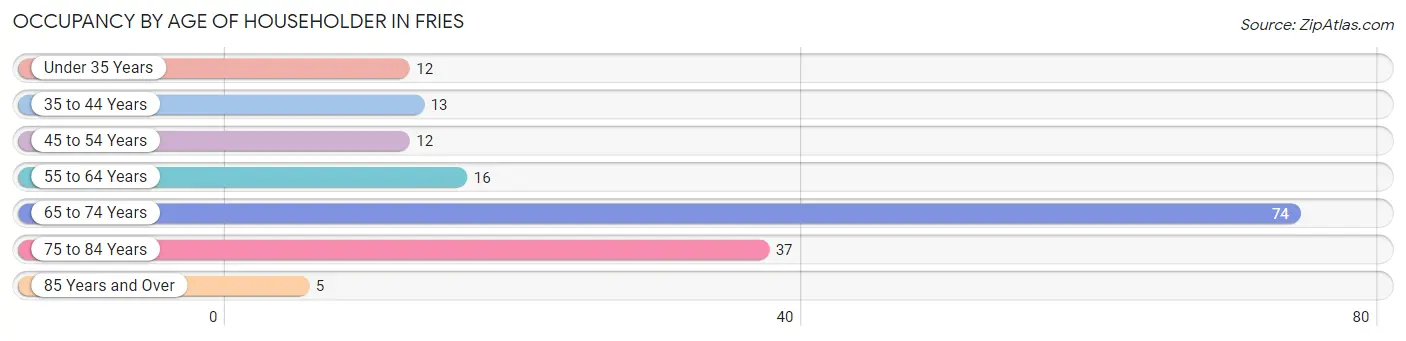
| Age Bracket | # Households | % Households |
| Under 35 Years | 12 | 7.1% |
| 35 to 44 Years | 13 | 7.7% |
| 45 to 54 Years | 12 | 7.1% |
| 55 to 64 Years | 16 | 9.5% |
| 65 to 74 Years | 74 | 43.8% |
| 75 to 84 Years | 37 | 21.9% |
| 85 Years and Over | 5 | 3.0% |
| Total | 169 | 100.0% |
Housing Finances in Fries
Median Income by Occupancy in Fries
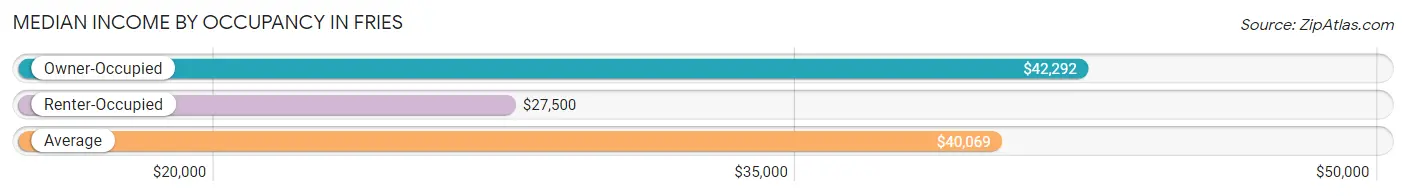
| Occupancy Type | # Households | Median Income |
| Owner-Occupied | 135 (79.9%) | $42,292 |
| Renter-Occupied | 34 (20.1%) | $27,500 |
| Average | 169 (100.0%) | $40,069 |
Occupancy by Householder Income Bracket in Fries
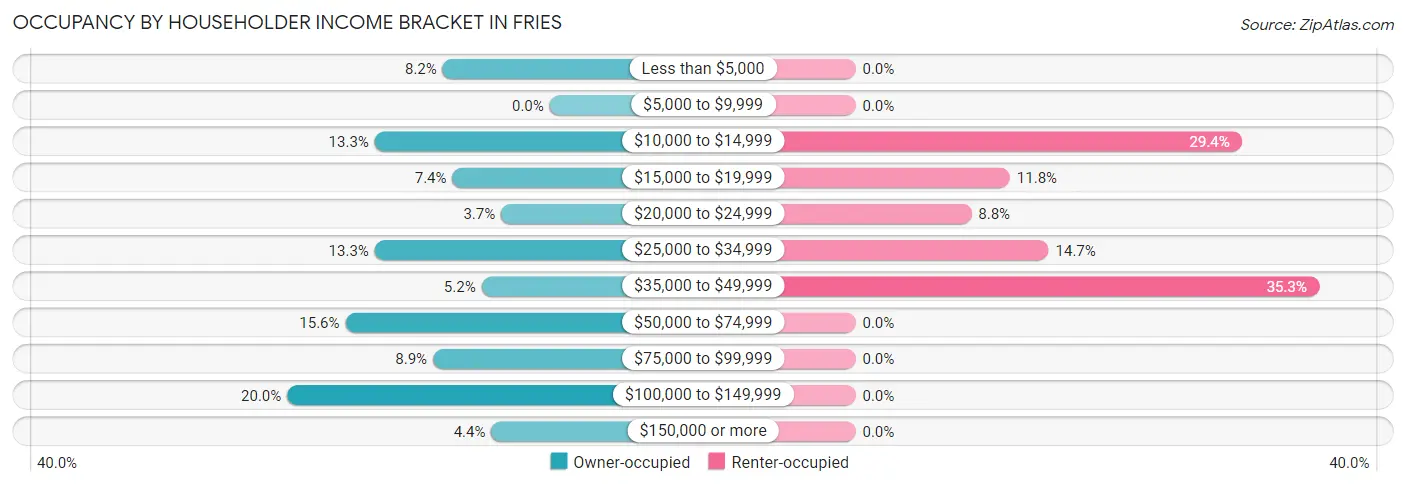
| Income Bracket | Owner-occupied | Renter-occupied |
| Less than $5,000 | 11 (8.2%) | 0 (0.0%) |
| $5,000 to $9,999 | 0 (0.0%) | 0 (0.0%) |
| $10,000 to $14,999 | 18 (13.3%) | 10 (29.4%) |
| $15,000 to $19,999 | 10 (7.4%) | 4 (11.8%) |
| $20,000 to $24,999 | 5 (3.7%) | 3 (8.8%) |
| $25,000 to $34,999 | 18 (13.3%) | 5 (14.7%) |
| $35,000 to $49,999 | 7 (5.2%) | 12 (35.3%) |
| $50,000 to $74,999 | 21 (15.6%) | 0 (0.0%) |
| $75,000 to $99,999 | 12 (8.9%) | 0 (0.0%) |
| $100,000 to $149,999 | 27 (20.0%) | 0 (0.0%) |
| $150,000 or more | 6 (4.4%) | 0 (0.0%) |
| Total | 135 (100.0%) | 34 (100.0%) |
Monthly Housing Cost Tiers in Fries
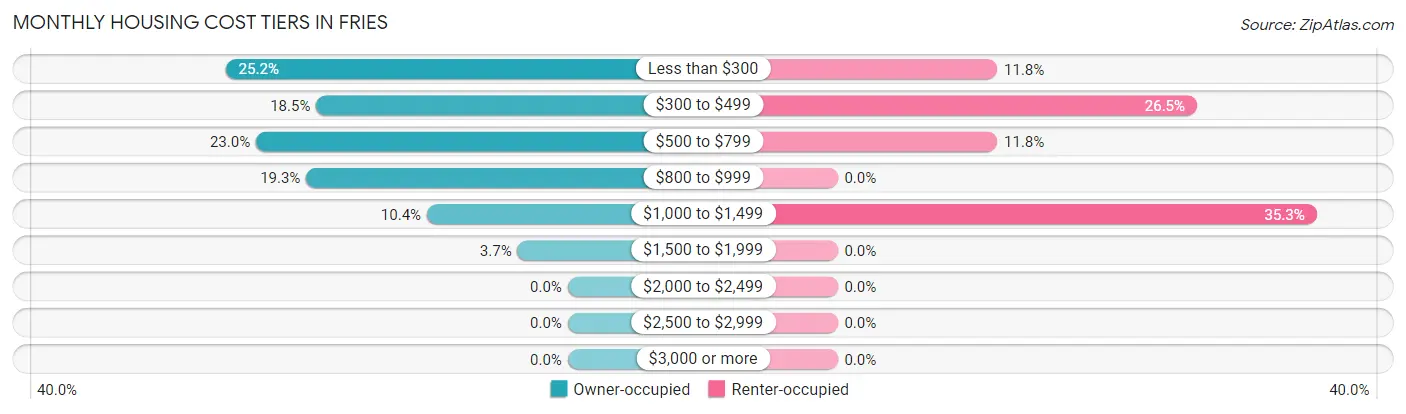
| Monthly Cost | Owner-occupied | Renter-occupied |
| Less than $300 | 34 (25.2%) | 4 (11.8%) |
| $300 to $499 | 25 (18.5%) | 9 (26.5%) |
| $500 to $799 | 31 (23.0%) | 4 (11.8%) |
| $800 to $999 | 26 (19.3%) | 0 (0.0%) |
| $1,000 to $1,499 | 14 (10.4%) | 12 (35.3%) |
| $1,500 to $1,999 | 5 (3.7%) | 0 (0.0%) |
| $2,000 to $2,499 | 0 (0.0%) | 0 (0.0%) |
| $2,500 to $2,999 | 0 (0.0%) | 0 (0.0%) |
| $3,000 or more | 0 (0.0%) | 0 (0.0%) |
| Total | 135 (100.0%) | 34 (100.0%) |
Physical Housing Characteristics in Fries
Housing Structures in Fries
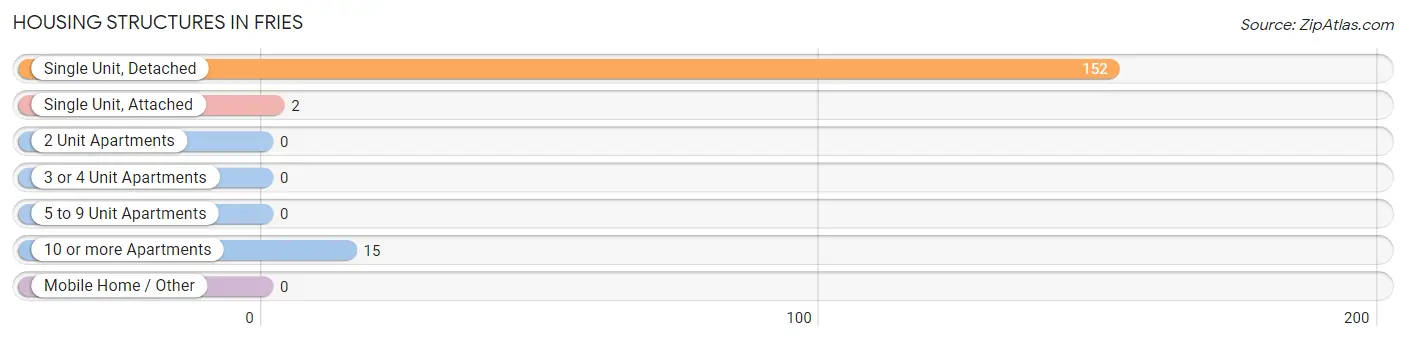
| Structure Type | # Housing Units | % Housing Units |
| Single Unit, Detached | 152 | 89.9% |
| Single Unit, Attached | 2 | 1.2% |
| 2 Unit Apartments | 0 | 0.0% |
| 3 or 4 Unit Apartments | 0 | 0.0% |
| 5 to 9 Unit Apartments | 0 | 0.0% |
| 10 or more Apartments | 15 | 8.9% |
| Mobile Home / Other | 0 | 0.0% |
| Total | 169 | 100.0% |
Housing Structures by Occupancy in Fries
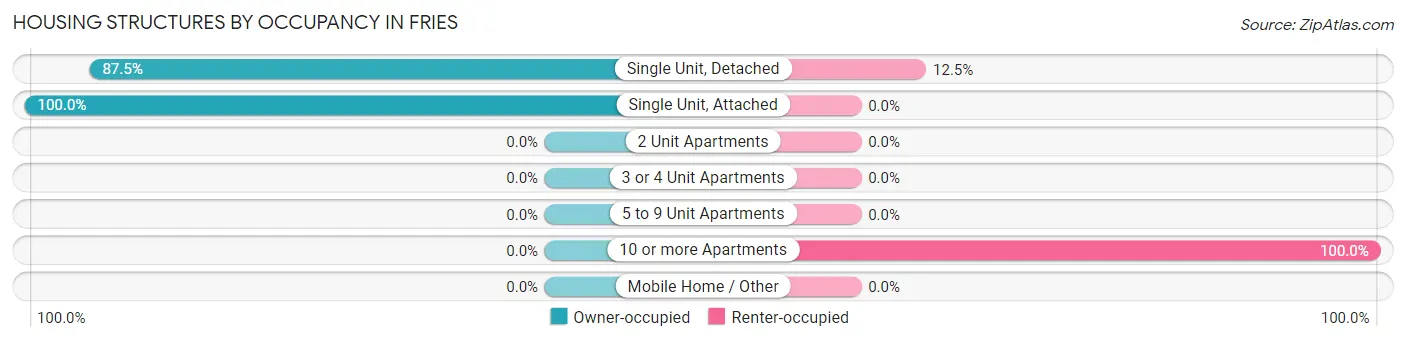
| Structure Type | Owner-occupied | Renter-occupied |
| Single Unit, Detached | 133 (87.5%) | 19 (12.5%) |
| Single Unit, Attached | 2 (100.0%) | 0 (0.0%) |
| 2 Unit Apartments | 0 (0.0%) | 0 (0.0%) |
| 3 or 4 Unit Apartments | 0 (0.0%) | 0 (0.0%) |
| 5 to 9 Unit Apartments | 0 (0.0%) | 0 (0.0%) |
| 10 or more Apartments | 0 (0.0%) | 15 (100.0%) |
| Mobile Home / Other | 0 (0.0%) | 0 (0.0%) |
| Total | 135 (79.9%) | 34 (20.1%) |
Housing Structures by Number of Rooms in Fries
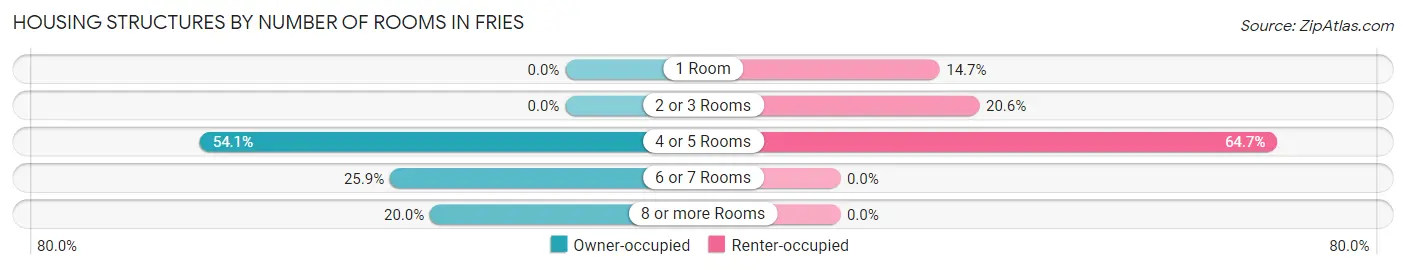
| Number of Rooms | Owner-occupied | Renter-occupied |
| 1 Room | 0 (0.0%) | 5 (14.7%) |
| 2 or 3 Rooms | 0 (0.0%) | 7 (20.6%) |
| 4 or 5 Rooms | 73 (54.1%) | 22 (64.7%) |
| 6 or 7 Rooms | 35 (25.9%) | 0 (0.0%) |
| 8 or more Rooms | 27 (20.0%) | 0 (0.0%) |
| Total | 135 (100.0%) | 34 (100.0%) |
Housing Structure by Heating Type in Fries
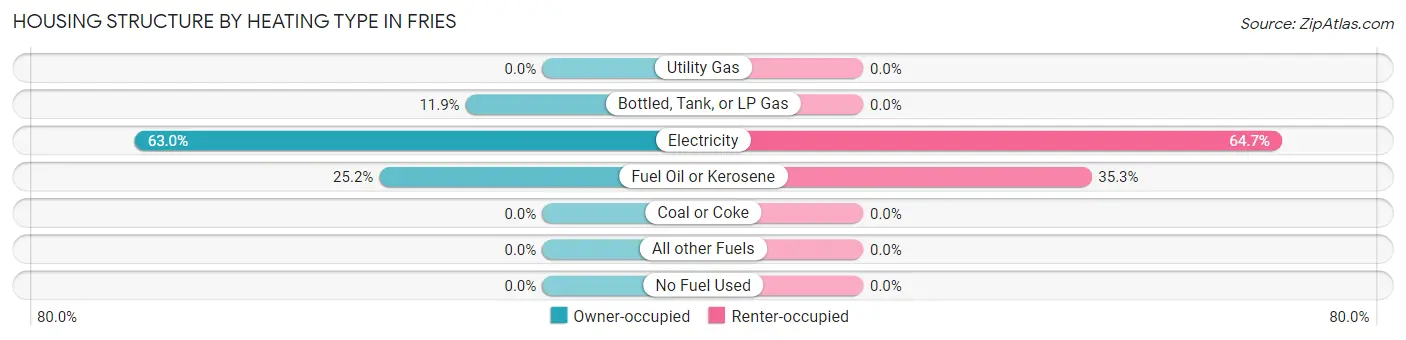
| Heating Type | Owner-occupied | Renter-occupied |
| Utility Gas | 0 (0.0%) | 0 (0.0%) |
| Bottled, Tank, or LP Gas | 16 (11.8%) | 0 (0.0%) |
| Electricity | 85 (63.0%) | 22 (64.7%) |
| Fuel Oil or Kerosene | 34 (25.2%) | 12 (35.3%) |
| Coal or Coke | 0 (0.0%) | 0 (0.0%) |
| All other Fuels | 0 (0.0%) | 0 (0.0%) |
| No Fuel Used | 0 (0.0%) | 0 (0.0%) |
| Total | 135 (100.0%) | 34 (100.0%) |
Household Vehicle Usage in Fries
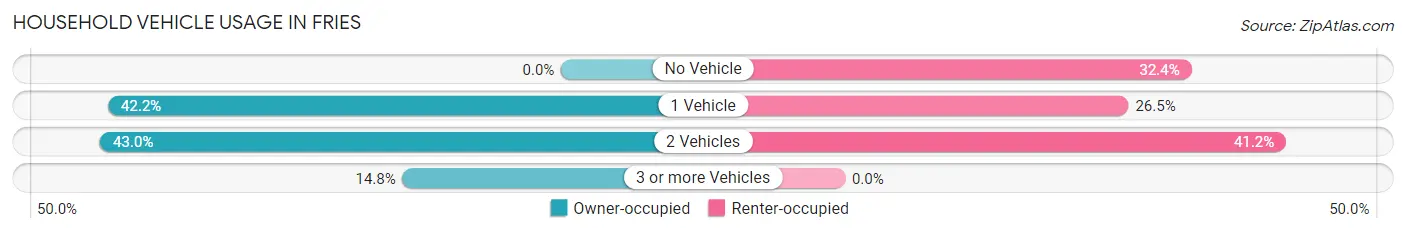
| Vehicles per Household | Owner-occupied | Renter-occupied |
| No Vehicle | 0 (0.0%) | 11 (32.4%) |
| 1 Vehicle | 57 (42.2%) | 9 (26.5%) |
| 2 Vehicles | 58 (43.0%) | 14 (41.2%) |
| 3 or more Vehicles | 20 (14.8%) | 0 (0.0%) |
| Total | 135 (100.0%) | 34 (100.0%) |
Real Estate & Mortgages in Fries
Real Estate and Mortgage Overview in Fries
| Characteristic | Without Mortgage | With Mortgage |
| Housing Units | 70 | 65 |
| Median Property Value | $95,700 | $148,800 |
| Median Household Income | $28,000 | $6 |
| Monthly Housing Costs | $305 | $0 |
| Real Estate Taxes | - | - |
Property Value by Mortgage Status in Fries
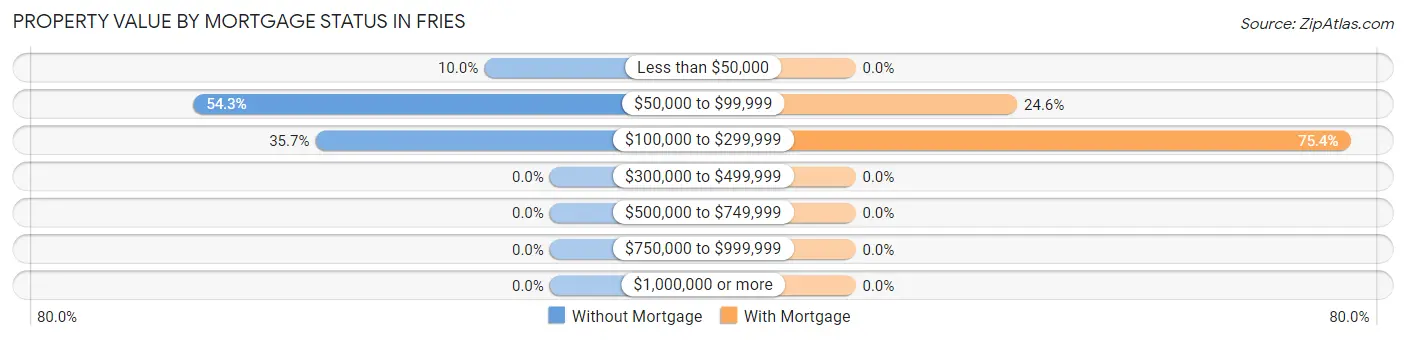
| Property Value | Without Mortgage | With Mortgage |
| Less than $50,000 | 7 (10.0%) | 0 (0.0%) |
| $50,000 to $99,999 | 38 (54.3%) | 16 (24.6%) |
| $100,000 to $299,999 | 25 (35.7%) | 49 (75.4%) |
| $300,000 to $499,999 | 0 (0.0%) | 0 (0.0%) |
| $500,000 to $749,999 | 0 (0.0%) | 0 (0.0%) |
| $750,000 to $999,999 | 0 (0.0%) | 0 (0.0%) |
| $1,000,000 or more | 0 (0.0%) | 0 (0.0%) |
| Total | 70 (100.0%) | 65 (100.0%) |
Household Income by Mortgage Status in Fries
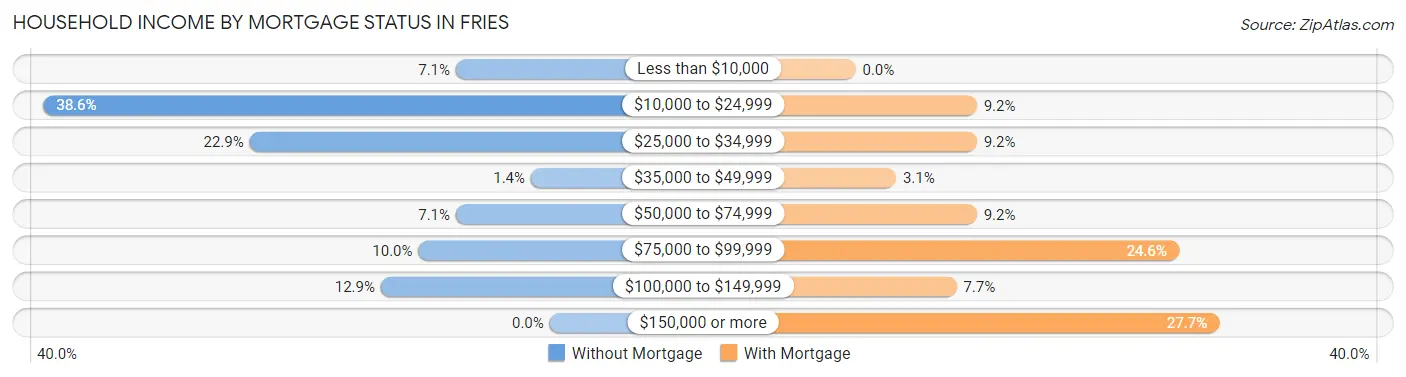
| Household Income | Without Mortgage | With Mortgage |
| Less than $10,000 | 5 (7.1%) | 0 (0.0%) |
| $10,000 to $24,999 | 27 (38.6%) | 6 (9.2%) |
| $25,000 to $34,999 | 16 (22.9%) | 6 (9.2%) |
| $35,000 to $49,999 | 1 (1.4%) | 2 (3.1%) |
| $50,000 to $74,999 | 5 (7.1%) | 6 (9.2%) |
| $75,000 to $99,999 | 7 (10.0%) | 16 (24.6%) |
| $100,000 to $149,999 | 9 (12.9%) | 5 (7.7%) |
| $150,000 or more | 0 (0.0%) | 18 (27.7%) |
| Total | 70 (100.0%) | 65 (100.0%) |
Property Value to Household Income Ratio in Fries
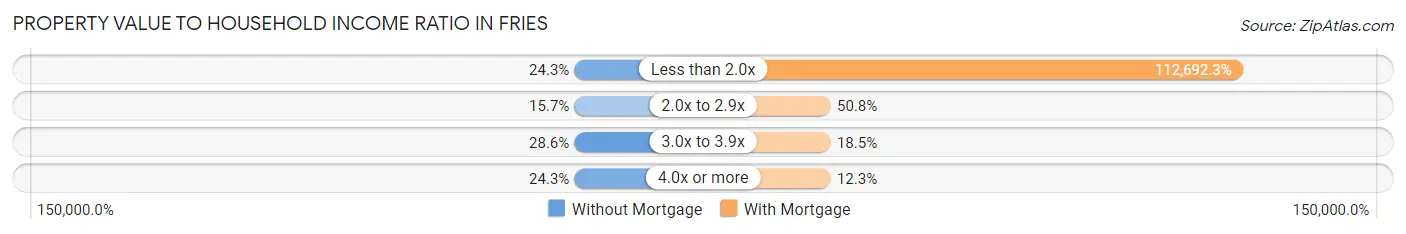
| Value-to-Income Ratio | Without Mortgage | With Mortgage |
| Less than 2.0x | 17 (24.3%) | 73,250 (112,692.3%) |
| 2.0x to 2.9x | 11 (15.7%) | 33 (50.8%) |
| 3.0x to 3.9x | 20 (28.6%) | 12 (18.5%) |
| 4.0x or more | 17 (24.3%) | 8 (12.3%) |
| Total | 70 (100.0%) | 65 (100.0%) |
Real Estate Taxes by Mortgage Status in Fries
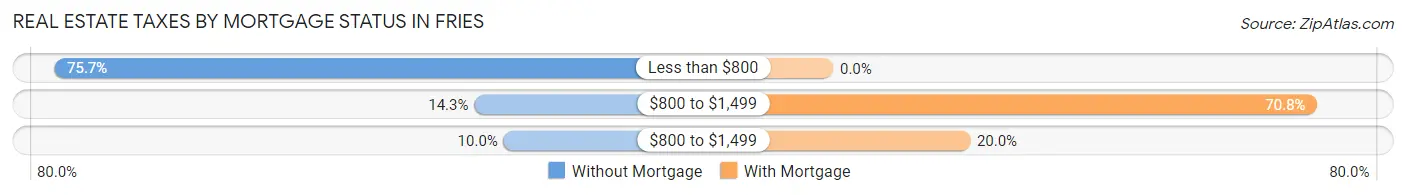
| Property Taxes | Without Mortgage | With Mortgage |
| Less than $800 | 53 (75.7%) | 0 (0.0%) |
| $800 to $1,499 | 10 (14.3%) | 46 (70.8%) |
| $800 to $1,499 | 7 (10.0%) | 13 (20.0%) |
| Total | 70 (100.0%) | 65 (100.0%) |
Health & Disability in Fries
Health Insurance Coverage by Age in Fries
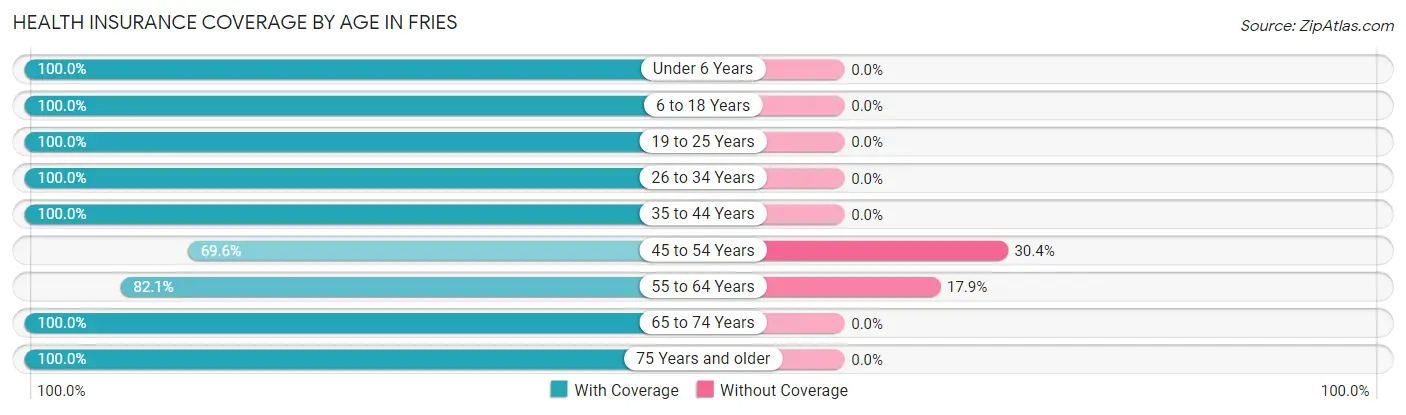
| Age Bracket | With Coverage | Without Coverage |
| Under 6 Years | 64 (100.0%) | 0 (0.0%) |
| 6 to 18 Years | 26 (100.0%) | 0 (0.0%) |
| 19 to 25 Years | 5 (100.0%) | 0 (0.0%) |
| 26 to 34 Years | 49 (100.0%) | 0 (0.0%) |
| 35 to 44 Years | 17 (100.0%) | 0 (0.0%) |
| 45 to 54 Years | 16 (69.6%) | 7 (30.4%) |
| 55 to 64 Years | 23 (82.1%) | 5 (17.9%) |
| 65 to 74 Years | 95 (100.0%) | 0 (0.0%) |
| 75 Years and older | 57 (100.0%) | 0 (0.0%) |
| Total | 352 (96.7%) | 12 (3.3%) |
Health Insurance Coverage by Citizenship Status in Fries
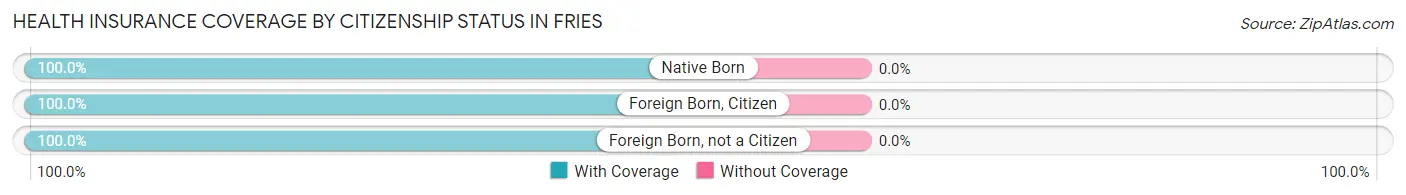
| Citizenship Status | With Coverage | Without Coverage |
| Native Born | 64 (100.0%) | 0 (0.0%) |
| Foreign Born, Citizen | 26 (100.0%) | 0 (0.0%) |
| Foreign Born, not a Citizen | 5 (100.0%) | 0 (0.0%) |
Health Insurance Coverage by Household Income in Fries
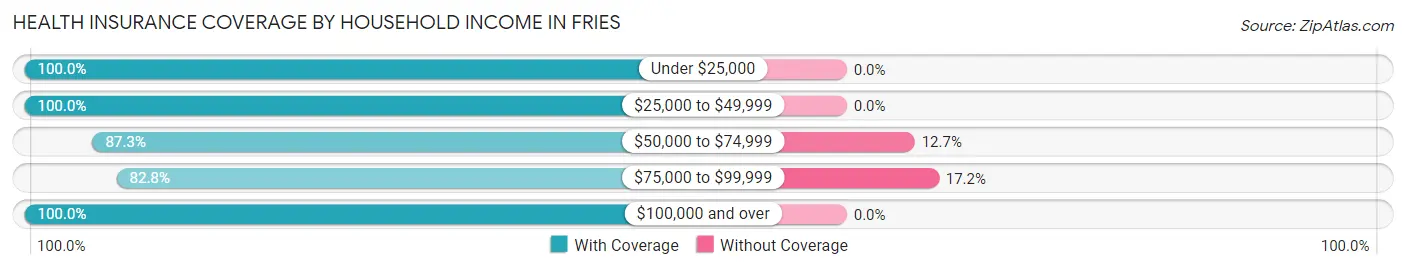
| Household Income | With Coverage | Without Coverage |
| Under $25,000 | 83 (100.0%) | 0 (0.0%) |
| $25,000 to $49,999 | 119 (100.0%) | 0 (0.0%) |
| $50,000 to $74,999 | 48 (87.3%) | 7 (12.7%) |
| $75,000 to $99,999 | 24 (82.8%) | 5 (17.2%) |
| $100,000 and over | 78 (100.0%) | 0 (0.0%) |
Public vs Private Health Insurance Coverage by Age in Fries
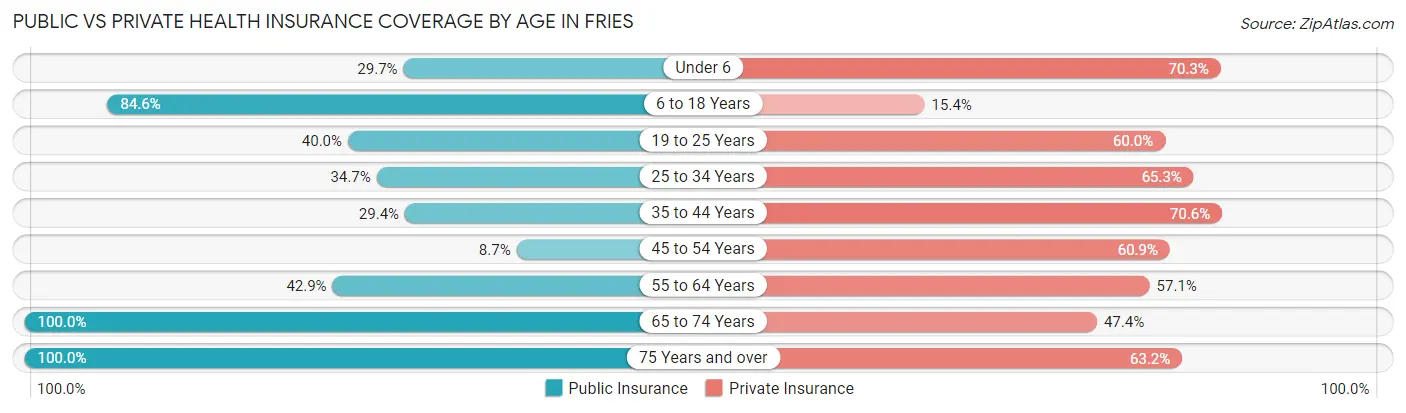
| Age Bracket | Public Insurance | Private Insurance |
| Under 6 | 19 (29.7%) | 45 (70.3%) |
| 6 to 18 Years | 22 (84.6%) | 4 (15.4%) |
| 19 to 25 Years | 2 (40.0%) | 3 (60.0%) |
| 25 to 34 Years | 17 (34.7%) | 32 (65.3%) |
| 35 to 44 Years | 5 (29.4%) | 12 (70.6%) |
| 45 to 54 Years | 2 (8.7%) | 14 (60.9%) |
| 55 to 64 Years | 12 (42.9%) | 16 (57.1%) |
| 65 to 74 Years | 95 (100.0%) | 45 (47.4%) |
| 75 Years and over | 57 (100.0%) | 36 (63.2%) |
| Total | 231 (63.5%) | 207 (56.9%) |
Disability Status by Sex by Age in Fries
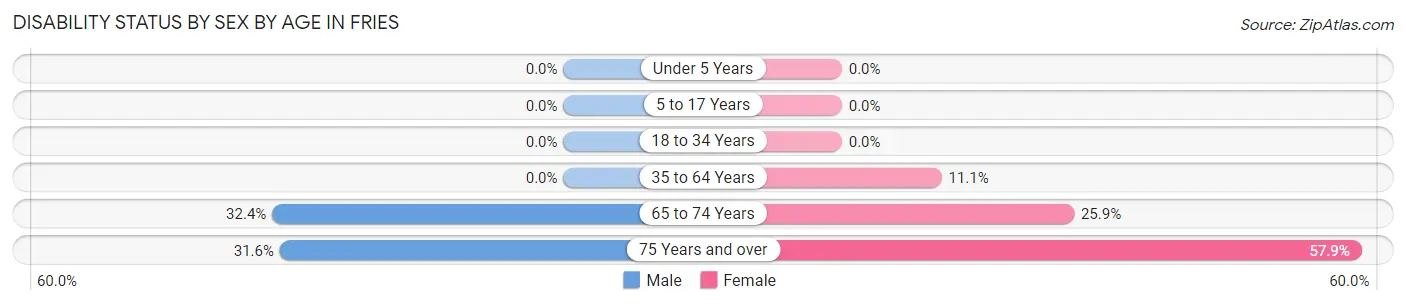
| Age Bracket | Male | Female |
| Under 5 Years | 0 (0.0%) | 0 (0.0%) |
| 5 to 17 Years | 0 (0.0%) | 0 (0.0%) |
| 18 to 34 Years | 0 (0.0%) | 0 (0.0%) |
| 35 to 64 Years | 0 (0.0%) | 4 (11.1%) |
| 65 to 74 Years | 12 (32.4%) | 15 (25.9%) |
| 75 Years and over | 6 (31.6%) | 22 (57.9%) |
Disability Class by Sex by Age in Fries
Disability Class: Hearing Difficulty
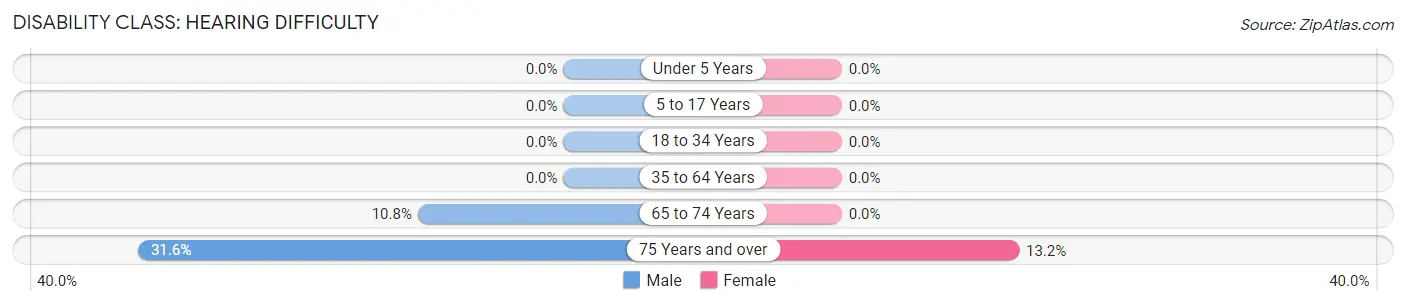
| Age Bracket | Male | Female |
| Under 5 Years | 0 (0.0%) | 0 (0.0%) |
| 5 to 17 Years | 0 (0.0%) | 0 (0.0%) |
| 18 to 34 Years | 0 (0.0%) | 0 (0.0%) |
| 35 to 64 Years | 0 (0.0%) | 0 (0.0%) |
| 65 to 74 Years | 4 (10.8%) | 0 (0.0%) |
| 75 Years and over | 6 (31.6%) | 5 (13.2%) |
Disability Class: Vision Difficulty
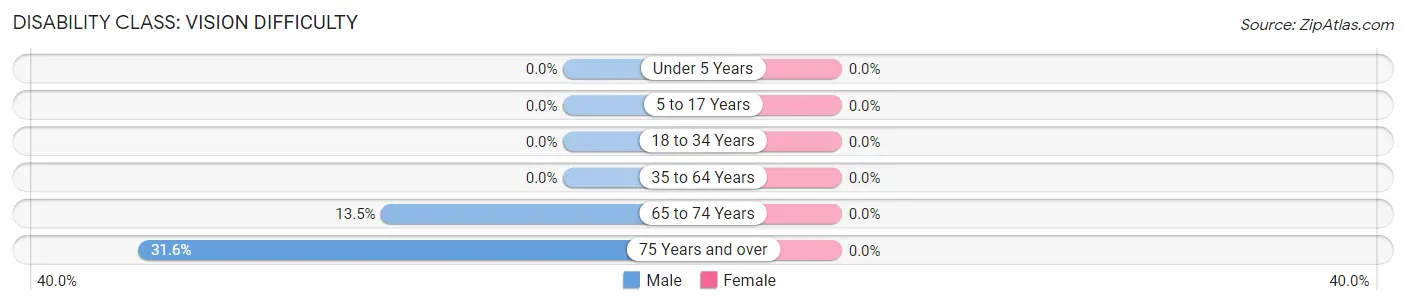
| Age Bracket | Male | Female |
| Under 5 Years | 0 (0.0%) | 0 (0.0%) |
| 5 to 17 Years | 0 (0.0%) | 0 (0.0%) |
| 18 to 34 Years | 0 (0.0%) | 0 (0.0%) |
| 35 to 64 Years | 0 (0.0%) | 0 (0.0%) |
| 65 to 74 Years | 5 (13.5%) | 0 (0.0%) |
| 75 Years and over | 6 (31.6%) | 0 (0.0%) |
Disability Class: Cognitive Difficulty
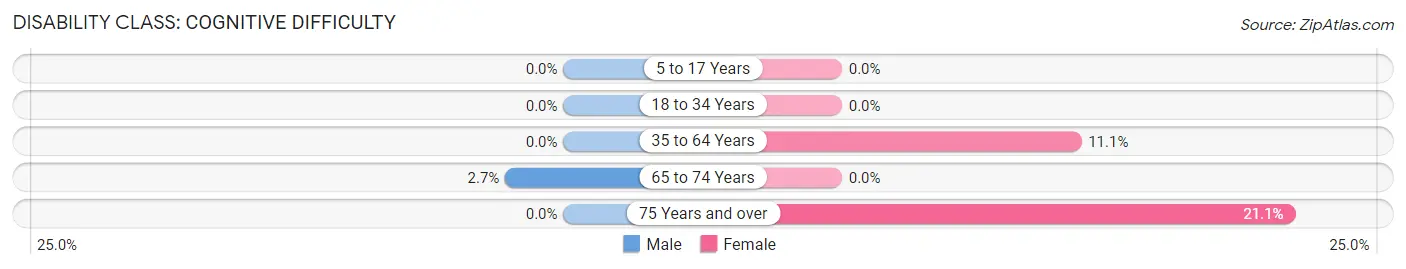
| Age Bracket | Male | Female |
| 5 to 17 Years | 0 (0.0%) | 0 (0.0%) |
| 18 to 34 Years | 0 (0.0%) | 0 (0.0%) |
| 35 to 64 Years | 0 (0.0%) | 4 (11.1%) |
| 65 to 74 Years | 1 (2.7%) | 0 (0.0%) |
| 75 Years and over | 0 (0.0%) | 8 (21.0%) |
Disability Class: Ambulatory Difficulty
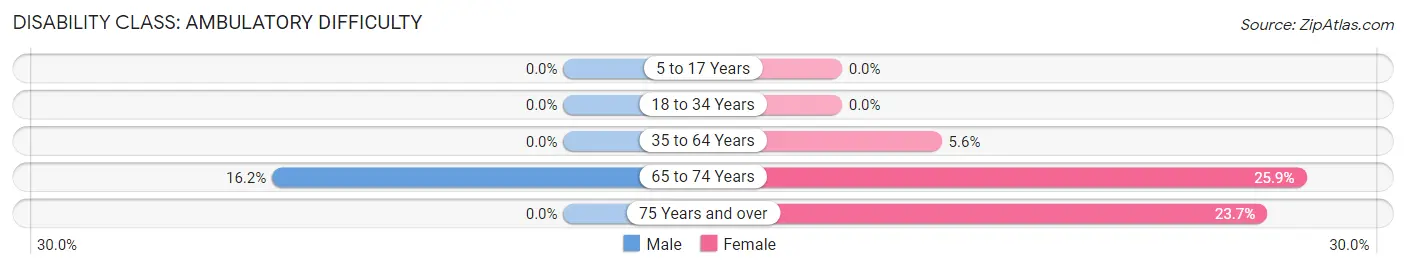
| Age Bracket | Male | Female |
| 5 to 17 Years | 0 (0.0%) | 0 (0.0%) |
| 18 to 34 Years | 0 (0.0%) | 0 (0.0%) |
| 35 to 64 Years | 0 (0.0%) | 2 (5.6%) |
| 65 to 74 Years | 6 (16.2%) | 15 (25.9%) |
| 75 Years and over | 0 (0.0%) | 9 (23.7%) |
Disability Class: Self-Care Difficulty
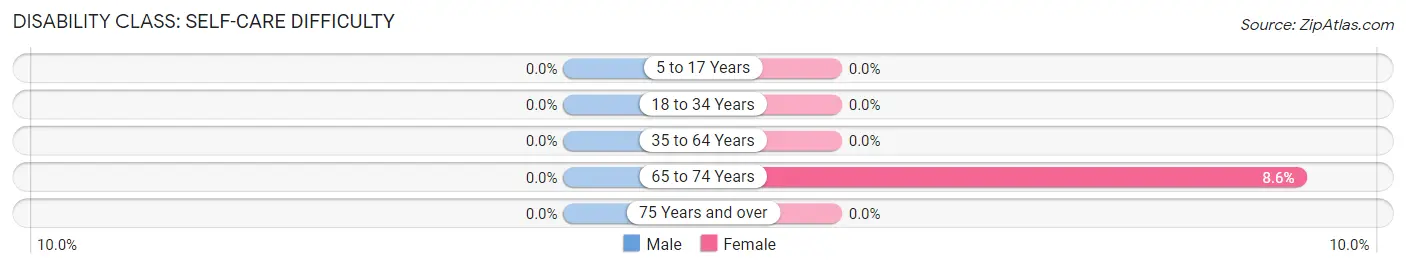
| Age Bracket | Male | Female |
| 5 to 17 Years | 0 (0.0%) | 0 (0.0%) |
| 18 to 34 Years | 0 (0.0%) | 0 (0.0%) |
| 35 to 64 Years | 0 (0.0%) | 0 (0.0%) |
| 65 to 74 Years | 0 (0.0%) | 5 (8.6%) |
| 75 Years and over | 0 (0.0%) | 0 (0.0%) |
Technology Access in Fries
Computing Device Access in Fries
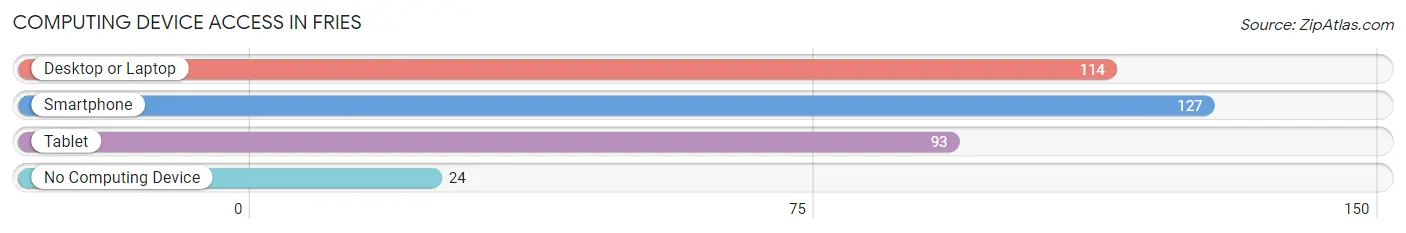
| Device Type | # Households | % Households |
| Desktop or Laptop | 114 | 67.5% |
| Smartphone | 127 | 75.1% |
| Tablet | 93 | 55.0% |
| No Computing Device | 24 | 14.2% |
| Total | 169 | 100.0% |
Internet Access in Fries
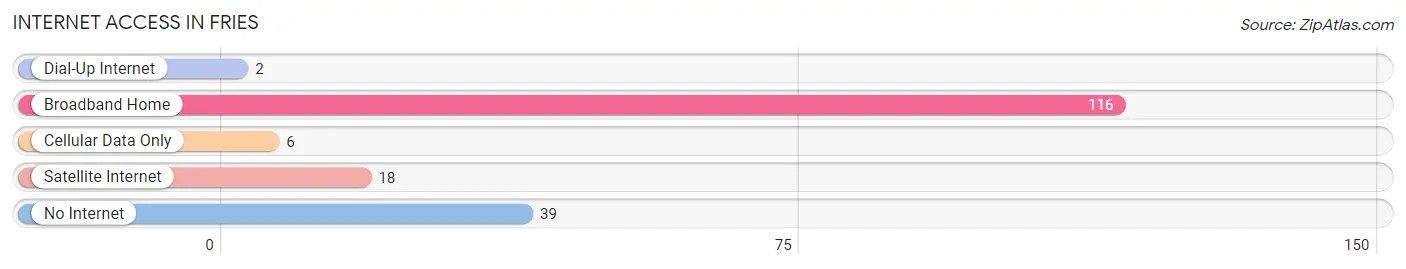
| Internet Type | # Households | % Households |
| Dial-Up Internet | 2 | 1.2% |
| Broadband Home | 116 | 68.6% |
| Cellular Data Only | 6 | 3.5% |
| Satellite Internet | 18 | 10.6% |
| No Internet | 39 | 23.1% |
| Total | 169 | 100.0% |
Fries Summary
Fries is a small town located in Grayson County, Virginia. It is situated in the Blue Ridge Mountains, and is part of the Mount Rogers National Recreation Area. The town has a population of approximately 1,000 people, and is known for its scenic beauty and outdoor recreation opportunities.
Geography
Fries is located in the Blue Ridge Mountains of southwestern Virginia, in Grayson County. It is situated at an elevation of 1,890 feet, and is surrounded by the Mount Rogers National Recreation Area. The town is located on the banks of the New River, and is approximately 30 miles from the city of Galax.
The town is situated in a rural area, and is surrounded by forests and mountains. The nearby Mount Rogers National Recreation Area offers a variety of outdoor activities, including hiking, camping, fishing, and horseback riding. The area is also home to a variety of wildlife, including deer, bear, and wild turkey.
History
Fries was founded in 1883 by a group of settlers from North Carolina. The town was named after a local landowner, John Fries, who donated the land for the town. The town quickly grew, and by the early 1900s, it had become a popular destination for tourists.
In the early 20th century, Fries was a major center for the timber industry. The town was home to several sawmills, and the surrounding forests provided an abundance of timber for the mills. The timber industry declined in the mid-20th century, and the town shifted its focus to tourism.
Economy
Fries is a small, rural town, and its economy is largely based on tourism. The town is home to several bed and breakfasts, as well as a variety of restaurants and shops. The nearby Mount Rogers National Recreation Area is a popular destination for outdoor recreation, and the town is also home to several wineries and craft breweries.
The town is also home to a variety of small businesses, including a hardware store, a grocery store, and a gas station. The town is also home to a small manufacturing plant, which produces furniture and other wood products.
Demographics
As of the 2010 census, Fries had a population of 1,000 people. The town is predominantly white, with approximately 95% of the population identifying as white. The median household income is $35,000, and the median age is 44.
Fries is a small, rural town, and its population is largely made up of families. The town is home to a variety of churches, and the local school system serves students from kindergarten through 12th grade. The town is also home to a small library, and a variety of community organizations.
Common Questions
What is Per Capita Income in Fries?
Per Capita income in Fries is $26,167.
What is the Median Family Income in Fries?
Median Family Income in Fries is $69,375.
What is the Median Household income in Fries?
Median Household Income in Fries is $40,069.
What is Income or Wage Gap in Fries?
Income or Wage Gap in Fries is 16.1%.
Women in Fries earn 83.9 cents for every dollar earned by a man.
What is Inequality or Gini Index in Fries?
Inequality or Gini Index in Fries is 0.48.
What is the Total Population of Fries?
Total Population of Fries is 364.
What is the Total Male Population of Fries?
Total Male Population of Fries is 163.
What is the Total Female Population of Fries?
Total Female Population of Fries is 201.
What is the Ratio of Males per 100 Females in Fries?
There are 81.09 Males per 100 Females in Fries.
What is the Ratio of Females per 100 Males in Fries?
There are 123.31 Females per 100 Males in Fries.
What is the Median Population Age in Fries?
Median Population Age in Fries is 53.5 Years.
What is the Average Family Size in Fries
Average Family Size in Fries is 3.2 People.
What is the Average Household Size in Fries
Average Household Size in Fries is 2.1 People.
How Large is the Labor Force in Fries?
There are 116 People in the Labor Forcein in Fries.
What is the Percentage of People in the Labor Force in Fries?
41.9% of People are in the Labor Force in Fries.
What is the Unemployment Rate in Fries?
Unemployment Rate in Fries is 8.6%.