Sussex, VA Map & Demographics
Sussex Map
Sussex Overview
$28,027
PER CAPITA INCOME
$78,581
AVG FAMILY INCOME
$54,803
AVG HOUSEHOLD INCOME
0.28
INEQUALITY / GINI INDEX
145
TOTAL POPULATION
76
MALE POPULATION
69
FEMALE POPULATION
110.14
MALES / 100 FEMALES
90.79
FEMALES / 100 MALES
58.3
MEDIAN AGE
2.0
AVG FAMILY SIZE
1.6
AVG HOUSEHOLD SIZE
111
LABOR FORCE [ PEOPLE ]
82.8%
PERCENT IN LABOR FORCE
2.7%
UNEMPLOYMENT RATE
Sussex Zip Codes
Income in Sussex
Income Overview in Sussex
Per Capita Income in Sussex is $28,027, while median incomes of families and households are $78,581 and $54,803 respectively.
| Characteristic | Number | Measure |
| Per Capita Income | 145 | $28,027 |
| Median Family Income | 48 | $78,581 |
| Mean Family Income | 48 | $74,650 |
| Median Household Income | 83 | $54,803 |
| Mean Household Income | 83 | $56,416 |
| Income Deficit | 48 | $0 |
| Wage / Income Gap (%) | 145 | 0.00% |
| Wage / Income Gap ($) | 145 | 100.00¢ per $1 |
| Gini / Inequality Index | 145 | 0.28 |
Earnings by Sex in Sussex
| Sex | Number | Average Earnings |
| Male | 62 (50.4%) | $0 |
| Female | 61 (49.6%) | $0 |
| Total | 123 (100.0%) | $0 |
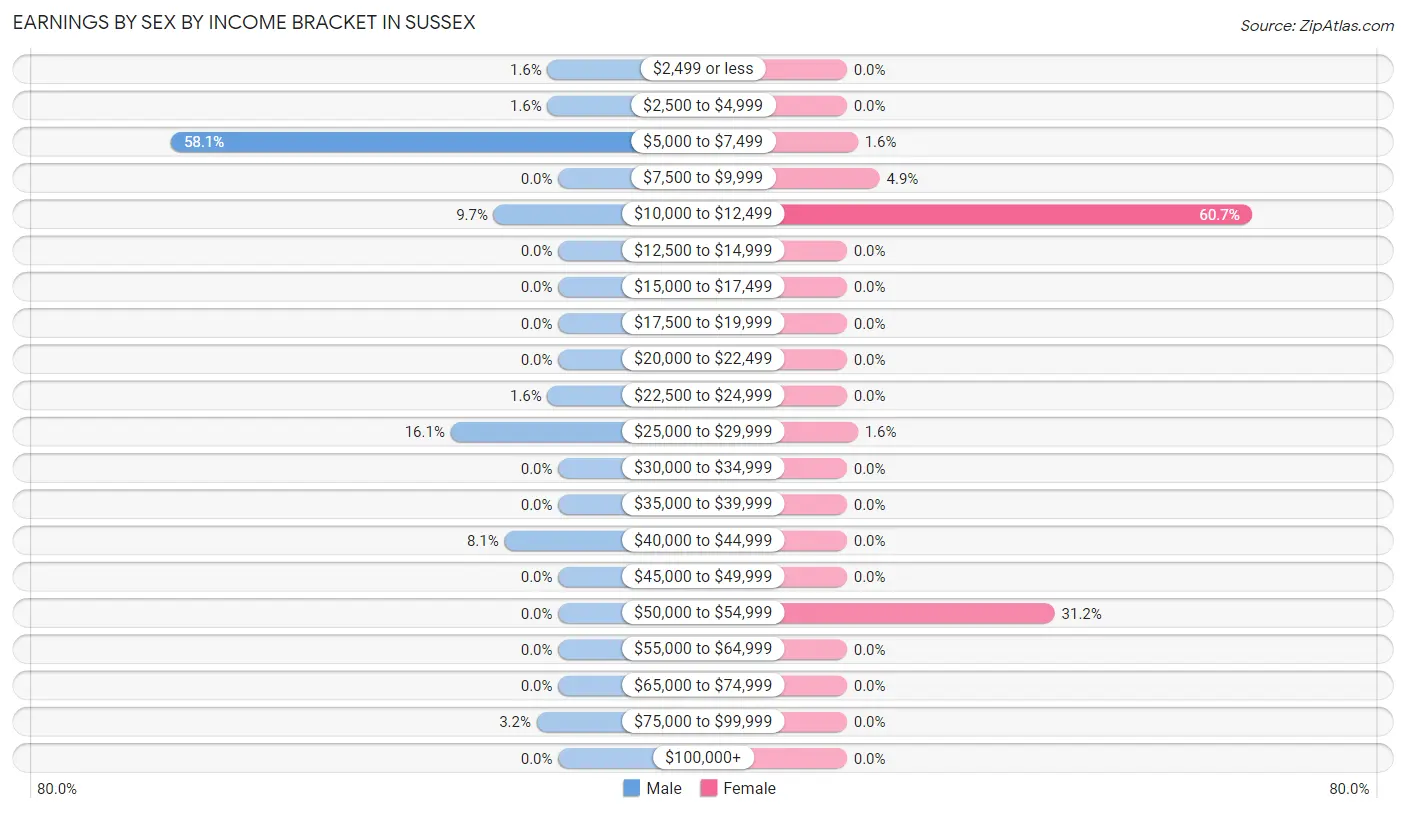
Earnings by Sex by Income Bracket in Sussex
The most common earnings brackets in Sussex are $5,000 to $7,499 for men (36 | 58.1%) and $10,000 to $12,499 for women (37 | 60.7%).
| Income | Male | Female |
| $2,499 or less | 1 (1.6%) | 0 (0.0%) |
| $2,500 to $4,999 | 1 (1.6%) | 0 (0.0%) |
| $5,000 to $7,499 | 36 (58.1%) | 1 (1.6%) |
| $7,500 to $9,999 | 0 (0.0%) | 3 (4.9%) |
| $10,000 to $12,499 | 6 (9.7%) | 37 (60.7%) |
| $12,500 to $14,999 | 0 (0.0%) | 0 (0.0%) |
| $15,000 to $17,499 | 0 (0.0%) | 0 (0.0%) |
| $17,500 to $19,999 | 0 (0.0%) | 0 (0.0%) |
| $20,000 to $22,499 | 0 (0.0%) | 0 (0.0%) |
| $22,500 to $24,999 | 1 (1.6%) | 0 (0.0%) |
| $25,000 to $29,999 | 10 (16.1%) | 1 (1.6%) |
| $30,000 to $34,999 | 0 (0.0%) | 0 (0.0%) |
| $35,000 to $39,999 | 0 (0.0%) | 0 (0.0%) |
| $40,000 to $44,999 | 5 (8.1%) | 0 (0.0%) |
| $45,000 to $49,999 | 0 (0.0%) | 0 (0.0%) |
| $50,000 to $54,999 | 0 (0.0%) | 19 (31.1%) |
| $55,000 to $64,999 | 0 (0.0%) | 0 (0.0%) |
| $65,000 to $74,999 | 0 (0.0%) | 0 (0.0%) |
| $75,000 to $99,999 | 2 (3.2%) | 0 (0.0%) |
| $100,000+ | 0 (0.0%) | 0 (0.0%) |
| Total | 62 (100.0%) | 61 (100.0%) |
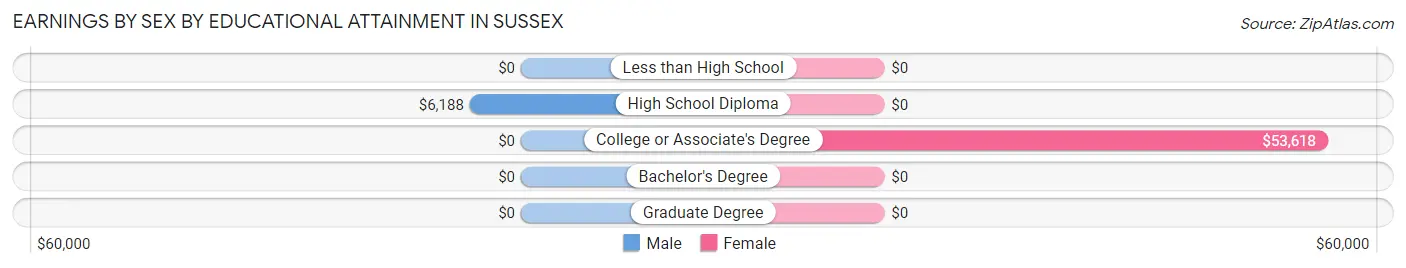
Earnings by Sex by Educational Attainment in Sussex
| Educational Attainment | Male Income | Female Income |
| Less than High School | - | - |
| High School Diploma | $6,188 | $0 |
| College or Associate's Degree | - | - |
| Bachelor's Degree | - | - |
| Graduate Degree | - | - |
| Total | - | - |
Family Income in Sussex
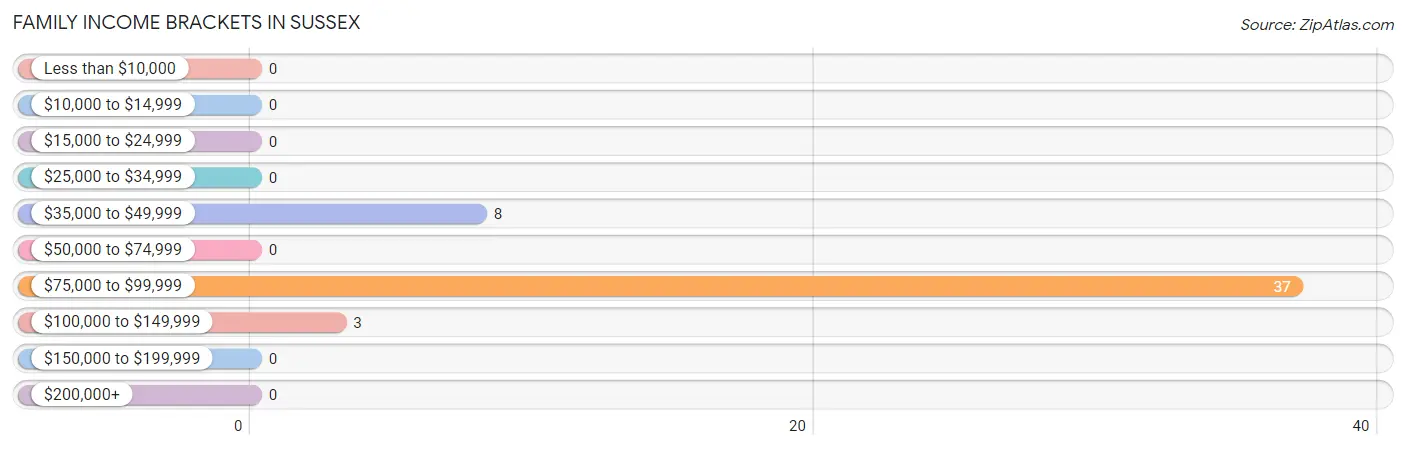
Family Income Brackets in Sussex
According to the Sussex family income data, there are 37 families falling into the $75,000 to $99,999 income range, which is the most common income bracket and makes up 77.1% of all families.
| Income Bracket | # Families | % Families |
| Less than $10,000 | 0 | 0.0% |
| $10,000 to $14,999 | 0 | 0.0% |
| $15,000 to $24,999 | 0 | 0.0% |
| $25,000 to $34,999 | 0 | 0.0% |
| $35,000 to $49,999 | 8 | 16.7% |
| $50,000 to $74,999 | 0 | 0.0% |
| $75,000 to $99,999 | 37 | 77.1% |
| $100,000 to $149,999 | 3 | 6.3% |
| $150,000 to $199,999 | 0 | 0.0% |
| $200,000+ | 0 | 0.0% |
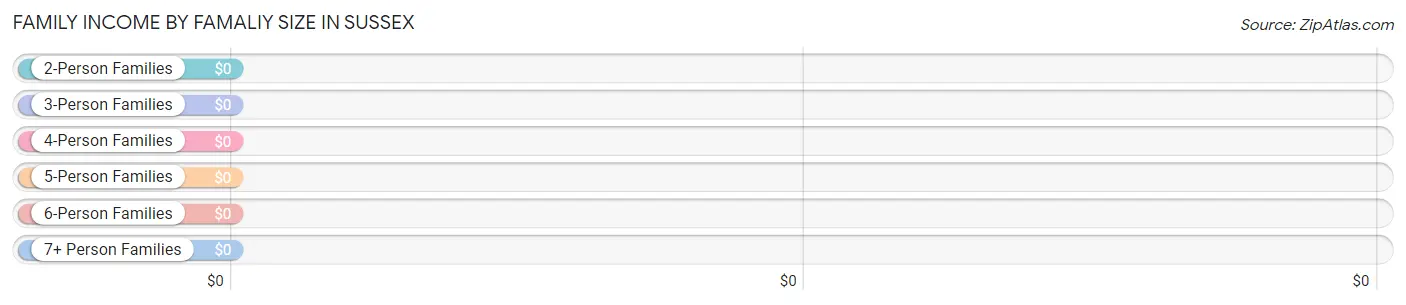
Family Income by Famaliy Size in Sussex
| Income Bracket | # Families | Median Income |
| 2-Person Families | 40 (83.3%) | $0 |
| 3-Person Families | 0 (0.0%) | $0 |
| 4-Person Families | 8 (16.7%) | $0 |
| 5-Person Families | 0 (0.0%) | $0 |
| 6-Person Families | 0 (0.0%) | $0 |
| 7+ Person Families | 0 (0.0%) | $0 |
| Total | 48 (100.0%) | $78,581 |
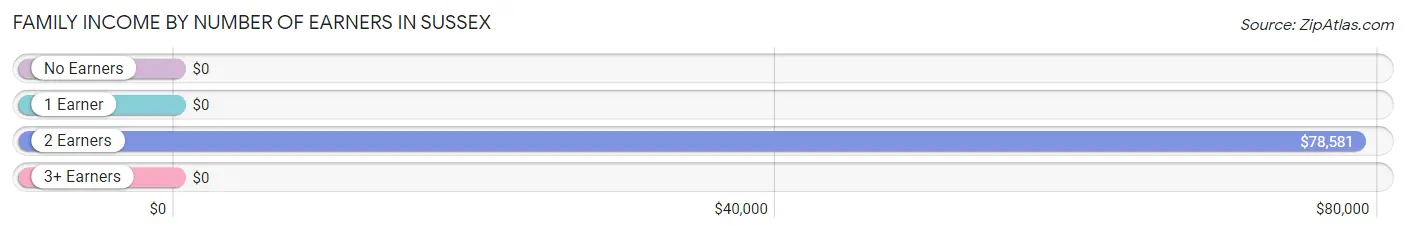
Family Income by Number of Earners in Sussex
| Number of Earners | # Families | Median Income |
| No Earners | 0 (0.0%) | $0 |
| 1 Earner | 0 (0.0%) | $0 |
| 2 Earners | 48 (100.0%) | $78,581 |
| 3+ Earners | 0 (0.0%) | $0 |
| Total | 48 (100.0%) | $78,581 |
Household Income in Sussex
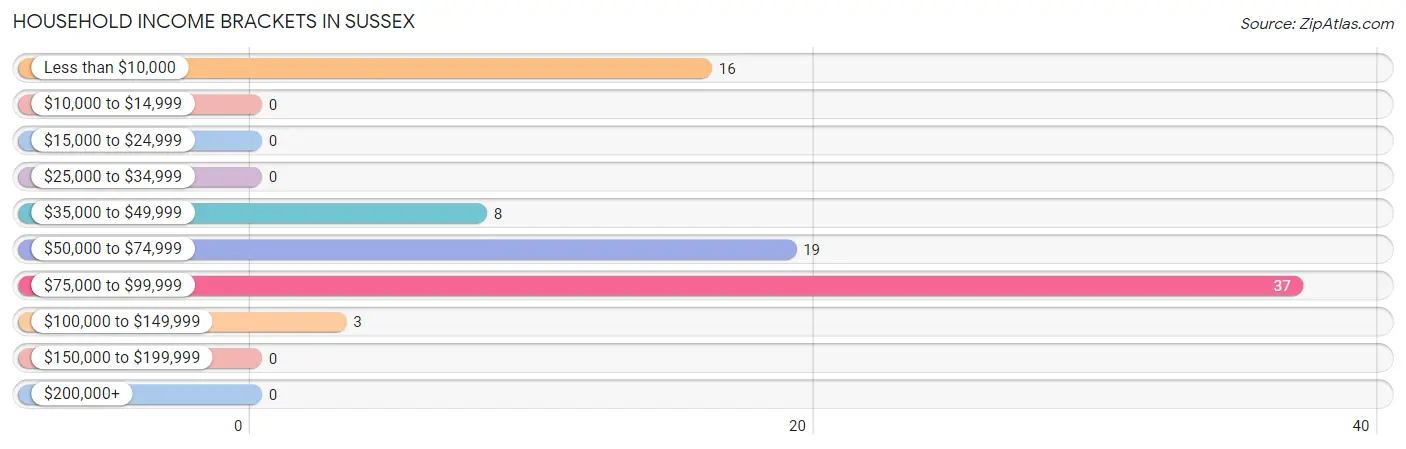
Household Income Brackets in Sussex
With 37 households falling in the category, the $75,000 to $99,999 income range is the most frequent in Sussex, accounting for 44.6% of all households.
| Income Bracket | # Households | % Households |
| Less than $10,000 | 16 | 19.3% |
| $10,000 to $14,999 | 0 | 0.0% |
| $15,000 to $24,999 | 0 | 0.0% |
| $25,000 to $34,999 | 0 | 0.0% |
| $35,000 to $49,999 | 8 | 9.6% |
| $50,000 to $74,999 | 19 | 22.9% |
| $75,000 to $99,999 | 37 | 44.6% |
| $100,000 to $149,999 | 3 | 3.6% |
| $150,000 to $199,999 | 0 | 0.0% |
| $200,000+ | 0 | 0.0% |
Household Income by Householder Age in Sussex
The median household income in Sussex is $54,803, with the highest median household income of $77,838 found in the 45 to 64 years age bracket for the primary householder. A total of 64 households (77.1%) fall into this category.
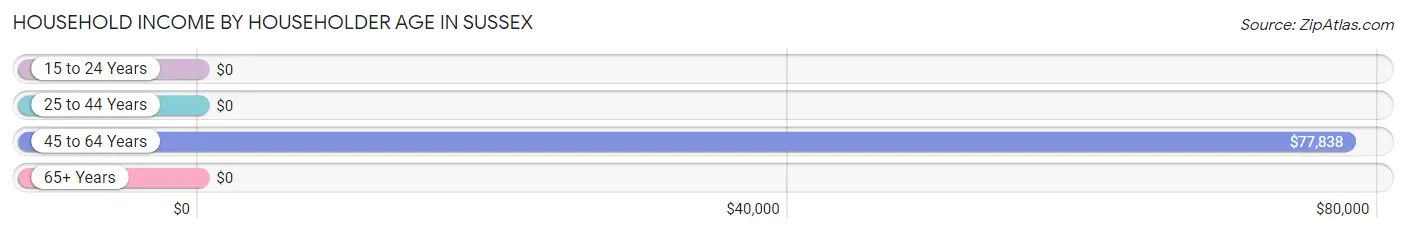
| Income Bracket | # Households | Median Income |
| 15 to 24 Years | 0 (0.0%) | $0 |
| 25 to 44 Years | 16 (19.3%) | $0 |
| 45 to 64 Years | 64 (77.1%) | $77,838 |
| 65+ Years | 3 (3.6%) | $0 |
| Total | 83 (100.0%) | $54,803 |
Poverty in Sussex
Income Below Poverty by Sex and Age in Sussex
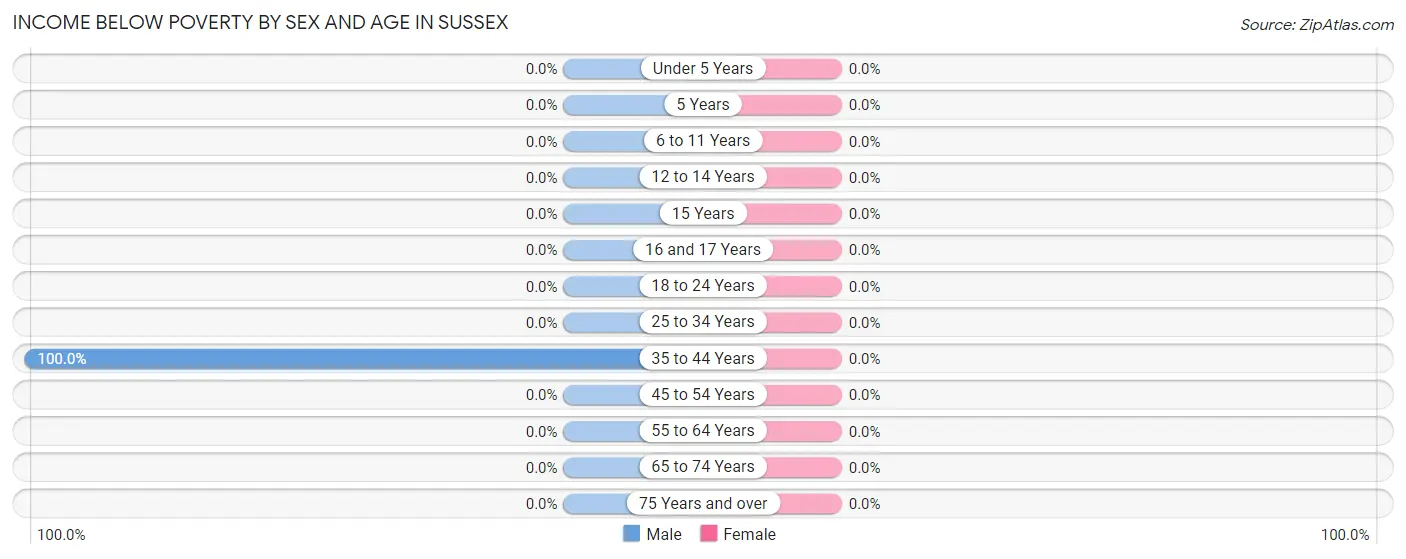
| Age Bracket | Male | Female |
| Under 5 Years | 0 (0.0%) | 0 (0.0%) |
| 5 Years | 0 (0.0%) | 0 (0.0%) |
| 6 to 11 Years | 0 (0.0%) | 0 (0.0%) |
| 12 to 14 Years | 0 (0.0%) | 0 (0.0%) |
| 15 Years | 0 (0.0%) | 0 (0.0%) |
| 16 and 17 Years | 0 (0.0%) | 0 (0.0%) |
| 18 to 24 Years | 0 (0.0%) | 0 (0.0%) |
| 25 to 34 Years | 0 (0.0%) | 0 (0.0%) |
| 35 to 44 Years | 16 (100.0%) | 0 (0.0%) |
| 45 to 54 Years | 0 (0.0%) | 0 (0.0%) |
| 55 to 64 Years | 0 (0.0%) | 0 (0.0%) |
| 65 to 74 Years | 0 (0.0%) | 0 (0.0%) |
| 75 Years and over | 0 (0.0%) | 0 (0.0%) |
| Total | 16 (25.4%) | 0 (0.0%) |
Income Above Poverty by Sex and Age in Sussex
According to the poverty statistics in Sussex, males aged 15 years and females aged 45 to 54 years are the age groups that are most secure financially, with 100.0% of males and 100.0% of females in these age groups living above the poverty line.
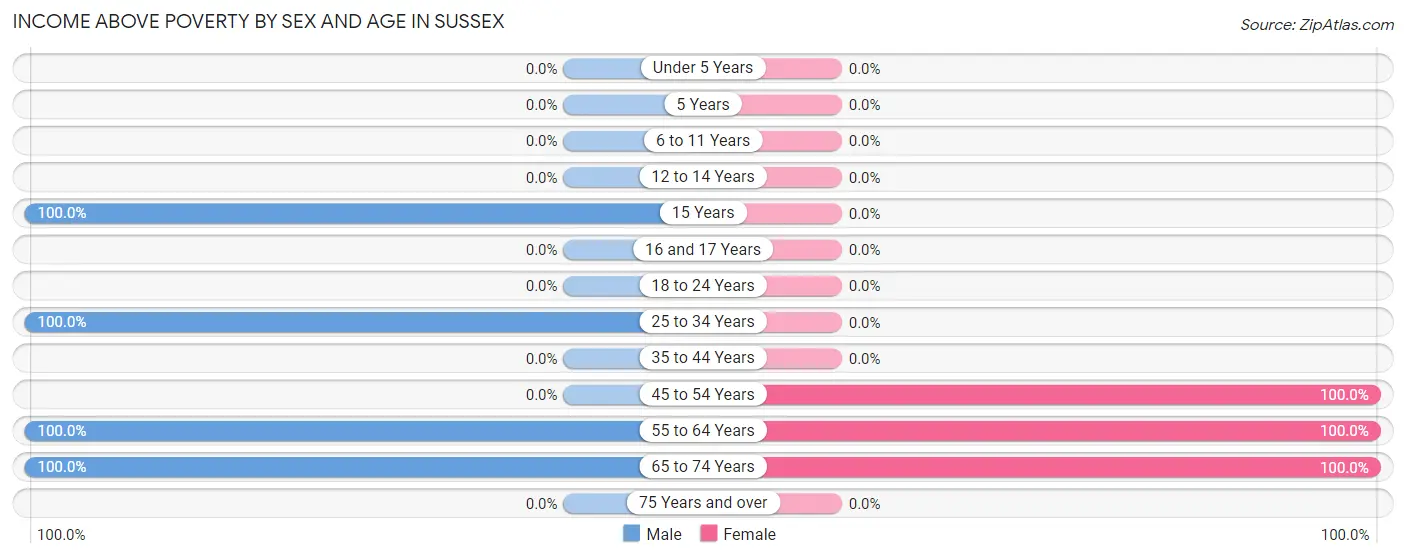
| Age Bracket | Male | Female |
| Under 5 Years | 0 (0.0%) | 0 (0.0%) |
| 5 Years | 0 (0.0%) | 0 (0.0%) |
| 6 to 11 Years | 0 (0.0%) | 0 (0.0%) |
| 12 to 14 Years | 0 (0.0%) | 0 (0.0%) |
| 15 Years | 11 (100.0%) | 0 (0.0%) |
| 16 and 17 Years | 0 (0.0%) | 0 (0.0%) |
| 18 to 24 Years | 0 (0.0%) | 0 (0.0%) |
| 25 to 34 Years | 9 (100.0%) | 0 (0.0%) |
| 35 to 44 Years | 0 (0.0%) | 0 (0.0%) |
| 45 to 54 Years | 0 (0.0%) | 19 (100.0%) |
| 55 to 64 Years | 3 (100.0%) | 45 (100.0%) |
| 65 to 74 Years | 24 (100.0%) | 3 (100.0%) |
| 75 Years and over | 0 (0.0%) | 0 (0.0%) |
| Total | 47 (74.6%) | 67 (100.0%) |
Income Below Poverty Among Married-Couple Families in Sussex
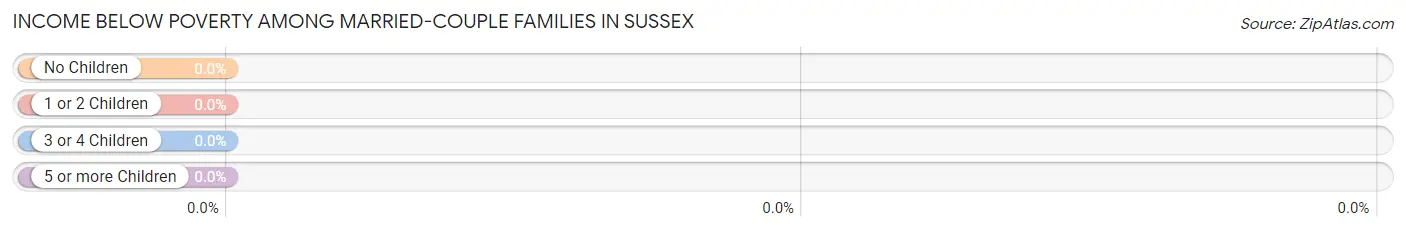
| Children | Above Poverty | Below Poverty |
| No Children | 40 (100.0%) | 0 (0.0%) |
| 1 or 2 Children | 8 (100.0%) | 0 (0.0%) |
| 3 or 4 Children | 0 (0.0%) | 0 (0.0%) |
| 5 or more Children | 0 (0.0%) | 0 (0.0%) |
| Total | 48 (100.0%) | 0 (0.0%) |
Income Below Poverty Among Single-Parent Households in Sussex
| Children | Single Father | Single Mother |
| No Children | 0 (0.0%) | 0 (0.0%) |
| 1 or 2 Children | 0 (0.0%) | 0 (0.0%) |
| 3 or 4 Children | 0 (0.0%) | 0 (0.0%) |
| 5 or more Children | 0 (0.0%) | 0 (0.0%) |
| Total | 0 (0.0%) | 0 (0.0%) |
Income Below Poverty Among Married-Couple vs Single-Parent Households in Sussex
| Children | Married-Couple Families | Single-Parent Households |
| No Children | 0 (0.0%) | 0 (0.0%) |
| 1 or 2 Children | 0 (0.0%) | 0 (0.0%) |
| 3 or 4 Children | 0 (0.0%) | 0 (0.0%) |
| 5 or more Children | 0 (0.0%) | 0 (0.0%) |
| Total | 0 (0.0%) | 0 (0.0%) |
Race in Sussex
The most populous races in Sussex are White / Caucasian (112 | 77.2%), Black / African American (28 | 19.3%), and Two or more Races (5 | 3.5%).
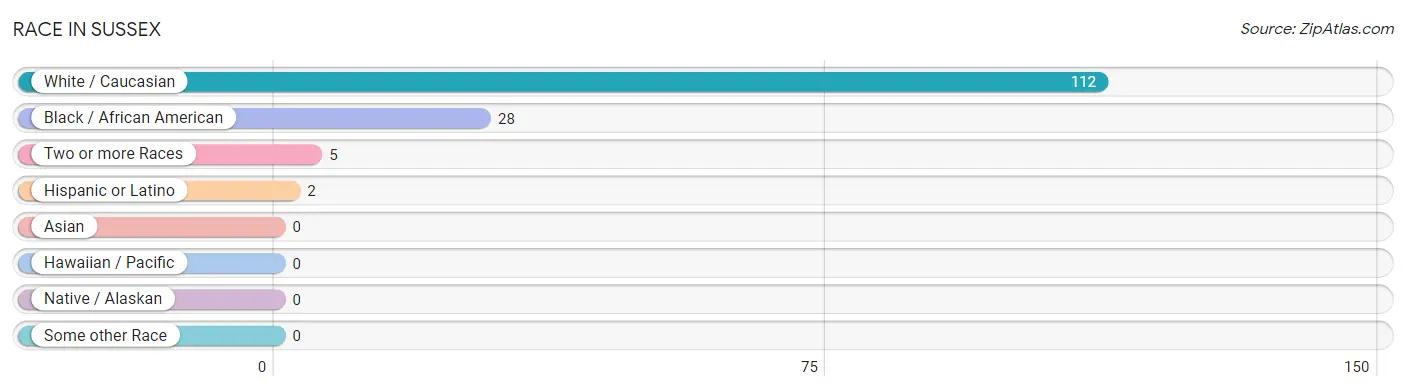
| Race | # Population | % Population |
| Asian | 0 | 0.0% |
| Black / African American | 28 | 19.3% |
| Hawaiian / Pacific | 0 | 0.0% |
| Hispanic or Latino | 2 | 1.4% |
| Native / Alaskan | 0 | 0.0% |
| White / Caucasian | 112 | 77.2% |
| Two or more Races | 5 | 3.5% |
| Some other Race | 0 | 0.0% |
| Total | 145 | 100.0% |
Ancestry in Sussex
The most populous ancestries reported in Sussex are English (37 | 25.5%), African (24 | 16.6%), Subsaharan African (24 | 16.6%), French (20 | 13.8%), and Cherokee (3 | 2.1%), together accounting for 74.5% of all Sussex residents.
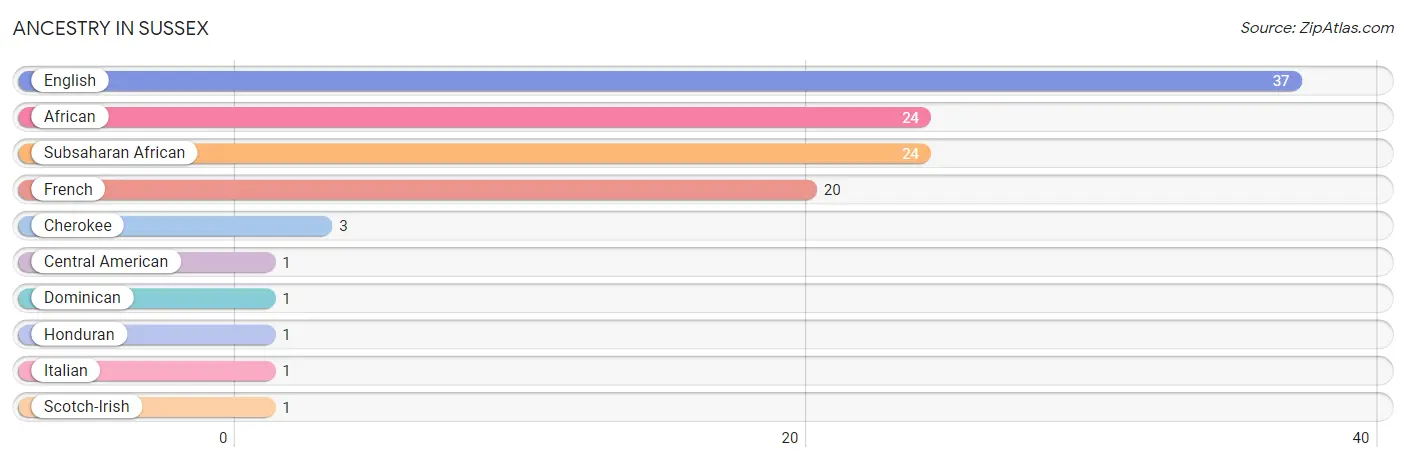
| Ancestry | # Population | % Population |
| African | 24 | 16.6% |
| Central American | 1 | 0.7% |
| Cherokee | 3 | 2.1% |
| Dominican | 1 | 0.7% |
| English | 37 | 25.5% |
| French | 20 | 13.8% |
| Honduran | 1 | 0.7% |
| Italian | 1 | 0.7% |
| Scotch-Irish | 1 | 0.7% |
| Subsaharan African | 24 | 16.6% | View All 10 Rows |
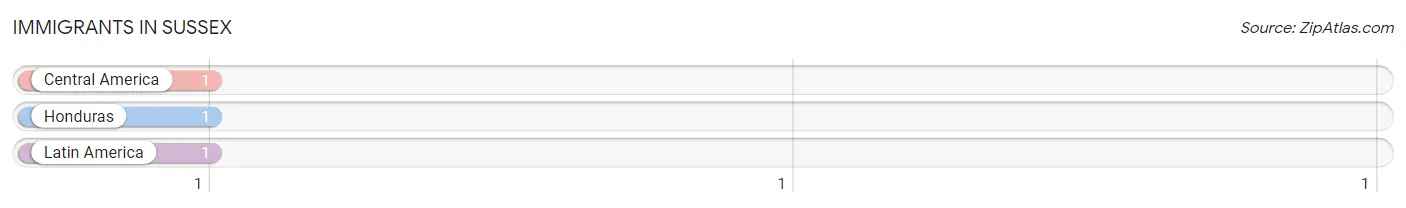
Immigrants in Sussex
The most numerous immigrant groups reported in Sussex came from Central America (1 | 0.7%), Honduras (1 | 0.7%), and Latin America (1 | 0.7%), together accounting for 2.1% of all Sussex residents.
| Immigration Origin | # Population | % Population |
| Central America | 1 | 0.7% |
| Honduras | 1 | 0.7% |
| Latin America | 1 | 0.7% | View All 3 Rows |
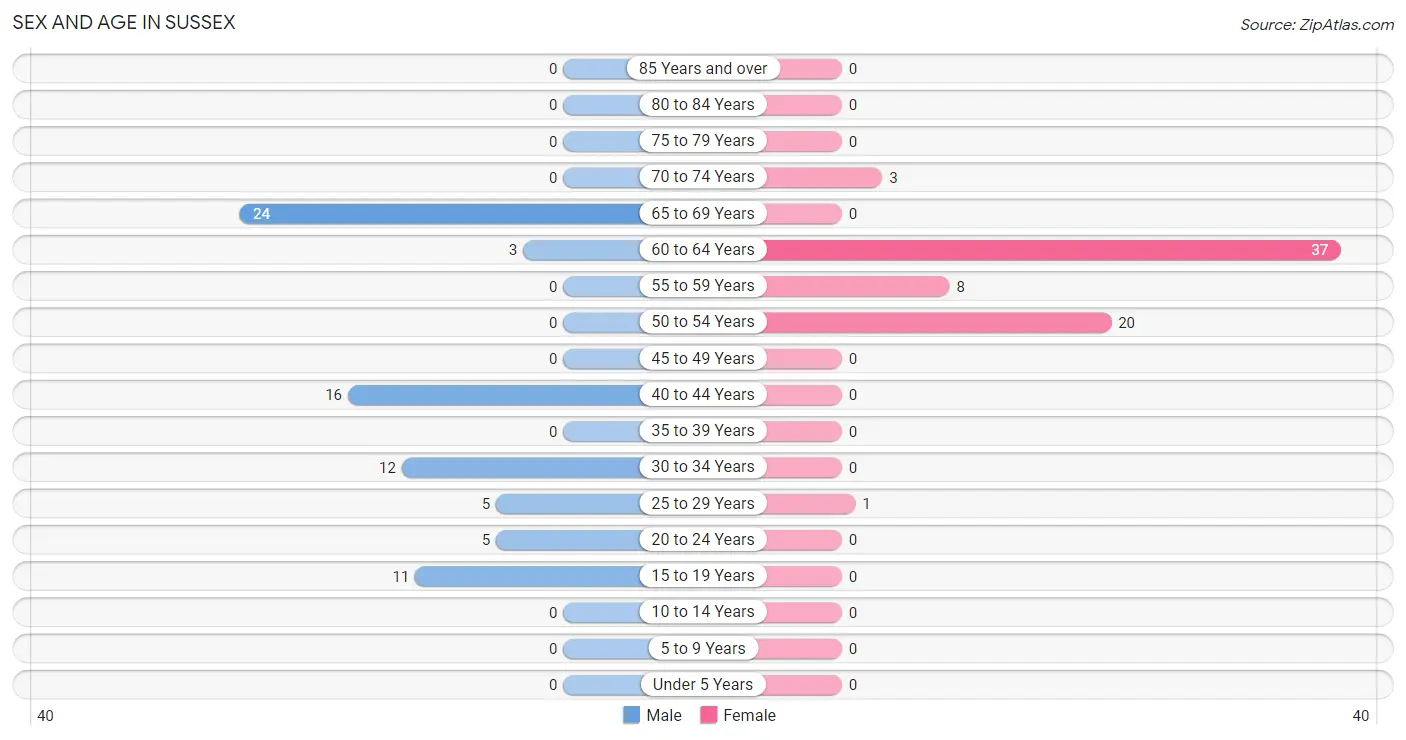
Sex and Age in Sussex
Sex and Age in Sussex
The most populous age groups in Sussex are 65 to 69 Years (24 | 31.6%) for men and 60 to 64 Years (37 | 53.6%) for women.
| Age Bracket | Male | Female |
| Under 5 Years | 0 (0.0%) | 0 (0.0%) |
| 5 to 9 Years | 0 (0.0%) | 0 (0.0%) |
| 10 to 14 Years | 0 (0.0%) | 0 (0.0%) |
| 15 to 19 Years | 11 (14.5%) | 0 (0.0%) |
| 20 to 24 Years | 5 (6.6%) | 0 (0.0%) |
| 25 to 29 Years | 5 (6.6%) | 1 (1.5%) |
| 30 to 34 Years | 12 (15.8%) | 0 (0.0%) |
| 35 to 39 Years | 0 (0.0%) | 0 (0.0%) |
| 40 to 44 Years | 16 (21.0%) | 0 (0.0%) |
| 45 to 49 Years | 0 (0.0%) | 0 (0.0%) |
| 50 to 54 Years | 0 (0.0%) | 20 (29.0%) |
| 55 to 59 Years | 0 (0.0%) | 8 (11.6%) |
| 60 to 64 Years | 3 (4.0%) | 37 (53.6%) |
| 65 to 69 Years | 24 (31.6%) | 0 (0.0%) |
| 70 to 74 Years | 0 (0.0%) | 3 (4.3%) |
| 75 to 79 Years | 0 (0.0%) | 0 (0.0%) |
| 80 to 84 Years | 0 (0.0%) | 0 (0.0%) |
| 85 Years and over | 0 (0.0%) | 0 (0.0%) |
| Total | 76 (100.0%) | 69 (100.0%) |
Families and Households in Sussex
Median Family Size in Sussex
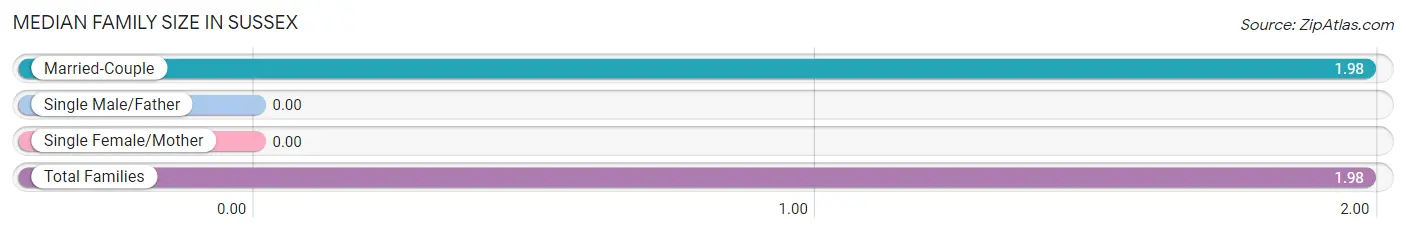
| Family Type | # Families | Family Size |
| Married-Couple | 48 (100.0%) | 1.98 |
| Single Male/Father | 0 (0.0%) | - |
| Single Female/Mother | 0 (0.0%) | - |
| Total Families | 48 (100.0%) | 1.98 |
Median Household Size in Sussex
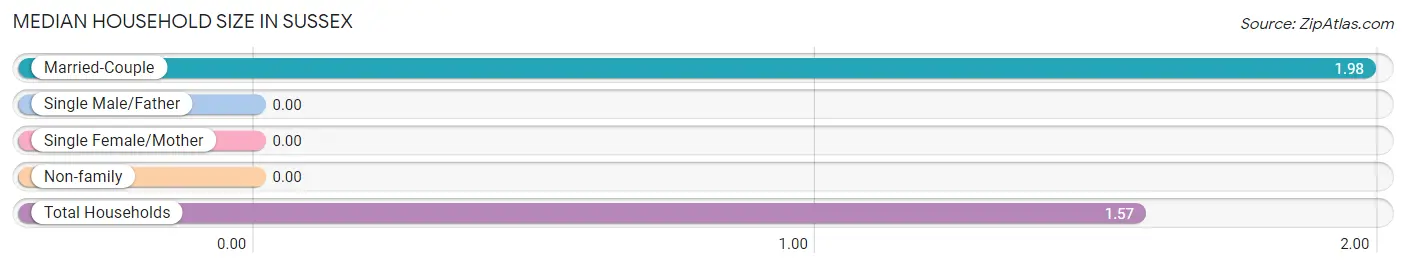
| Household Type | # Households | Household Size |
| Married-Couple | 48 (57.8%) | 1.98 |
| Single Male/Father | 0 (0.0%) | - |
| Single Female/Mother | 0 (0.0%) | - |
| Non-family | 35 (42.2%) | - |
| Total Households | 83 (100.0%) | 1.57 |
Household Size by Marriage Status in Sussex
Out of a total of 83 households in Sussex, 48 (57.8%) are family households, while 35 (42.2%) are nonfamily households. The most numerous type of family households are 2-person households, comprising 40, and the most common type of nonfamily households are 1-person households, comprising 35.
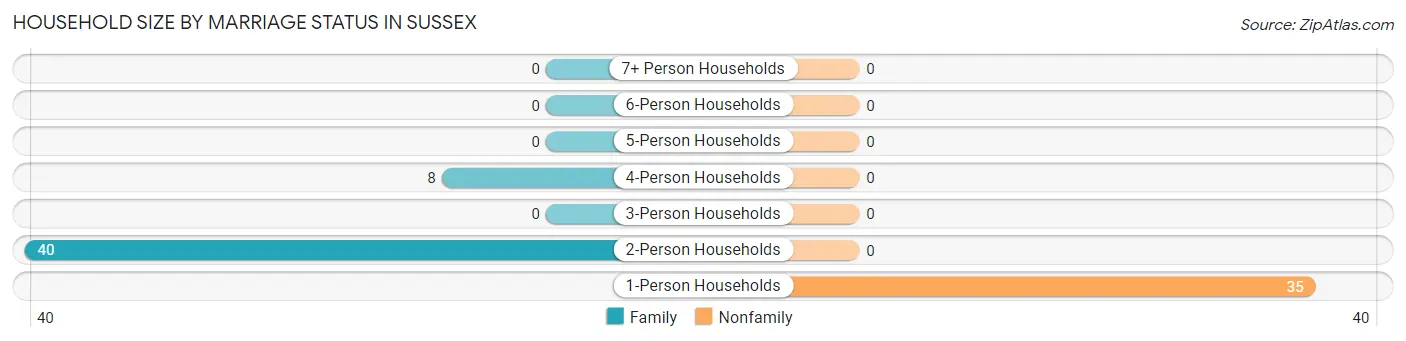
| Household Size | Family Households | Nonfamily Households |
| 1-Person Households | - | 35 (42.2%) |
| 2-Person Households | 40 (48.2%) | 0 (0.0%) |
| 3-Person Households | 0 (0.0%) | 0 (0.0%) |
| 4-Person Households | 8 (9.6%) | 0 (0.0%) |
| 5-Person Households | 0 (0.0%) | 0 (0.0%) |
| 6-Person Households | 0 (0.0%) | 0 (0.0%) |
| 7+ Person Households | 0 (0.0%) | 0 (0.0%) |
| Total | 48 (57.8%) | 35 (42.2%) |
Female Fertility in Sussex
Fertility by Age in Sussex
| Age Bracket | Women with Births | Births / 1,000 Women |
| 15 to 19 years | 0 (0.0%) | 0.0 |
| 20 to 34 years | 0 (0.0%) | 0.0 |
| 35 to 50 years | 0 (0.0%) | 0.0 |
| Total | 0 (0.0%) | 0.0 |
Fertility by Age by Marriage Status in Sussex
| Age Bracket | Married | Unmarried |
| 15 to 19 years | 0 (0.0%) | 0 (0.0%) |
| 20 to 34 years | 0 (0.0%) | 0 (0.0%) |
| 35 to 50 years | 0 (0.0%) | 0 (0.0%) |
| Total | 0 (0.0%) | 0 (0.0%) |
Fertility by Education in Sussex
| Educational Attainment | Women with Births | Births / 1,000 Women |
| Less than High School | 0 (0.0%) | 0.0 |
| High School Diploma | 0 (0.0%) | 0.0 |
| College or Associate's Degree | 0 (0.0%) | 0.0 |
| Bachelor's Degree | 0 (0.0%) | 0.0 |
| Graduate Degree | 0 (0.0%) | 0.0 |
| Total | 0 (0.0%) | 0.0 |
Fertility by Education by Marriage Status in Sussex
| Educational Attainment | Married | Unmarried |
| Less than High School | 0 (0.0%) | 0 (0.0%) |
| High School Diploma | 0 (0.0%) | 0 (0.0%) |
| College or Associate's Degree | 0 (0.0%) | 0 (0.0%) |
| Bachelor's Degree | 0 (0.0%) | 0 (0.0%) |
| Graduate Degree | 0 (0.0%) | 0 (0.0%) |
| Total | 0 (0.0%) | 0 (0.0%) |
Employment Characteristics in Sussex
Employment by Class of Employer in Sussex
Among the 108 employed individuals in Sussex, private company employees (64 | 59.3%), local government employees (40 | 37.0%), and self-employed (not incorporated) (4 | 3.7%) make up the most common classes of employment.
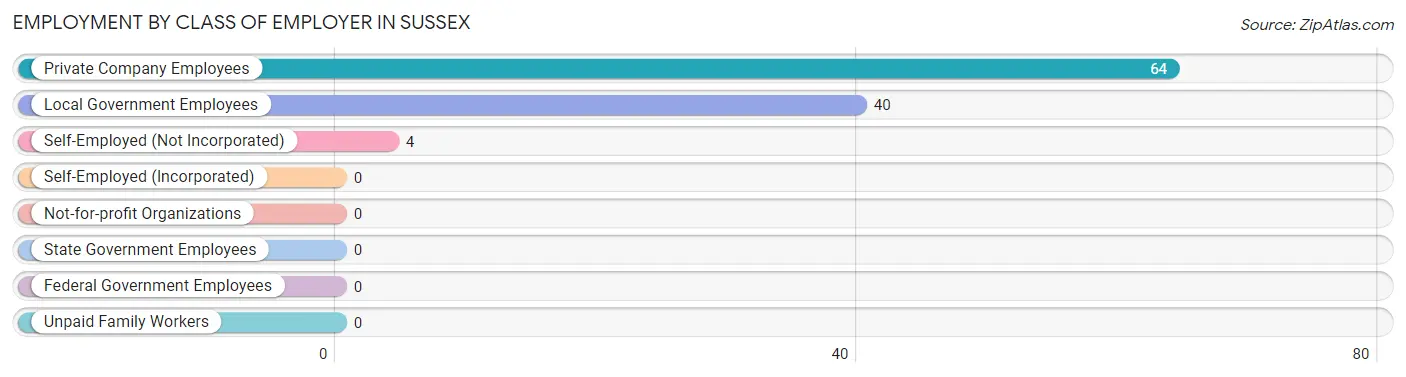
| Employer Class | # Employees | % Employees |
| Private Company Employees | 64 | 59.3% |
| Self-Employed (Incorporated) | 0 | 0.0% |
| Self-Employed (Not Incorporated) | 4 | 3.7% |
| Not-for-profit Organizations | 0 | 0.0% |
| Local Government Employees | 40 | 37.0% |
| State Government Employees | 0 | 0.0% |
| Federal Government Employees | 0 | 0.0% |
| Unpaid Family Workers | 0 | 0.0% |
| Total | 108 | 100.0% |
Employment Status by Age in Sussex
According to the labor force statistics for Sussex, out of the total population over 16 years of age (134), 82.8% or 111 individuals are in the labor force, with 2.7% or 3 of them unemployed. The age group with the highest labor force participation rate is 35 to 44 years, with 100.0% or 16 individuals in the labor force. Within the labor force, the 65 to 74 years age range has the highest percentage of unemployed individuals, with 11.1% or 3 of them being unemployed.
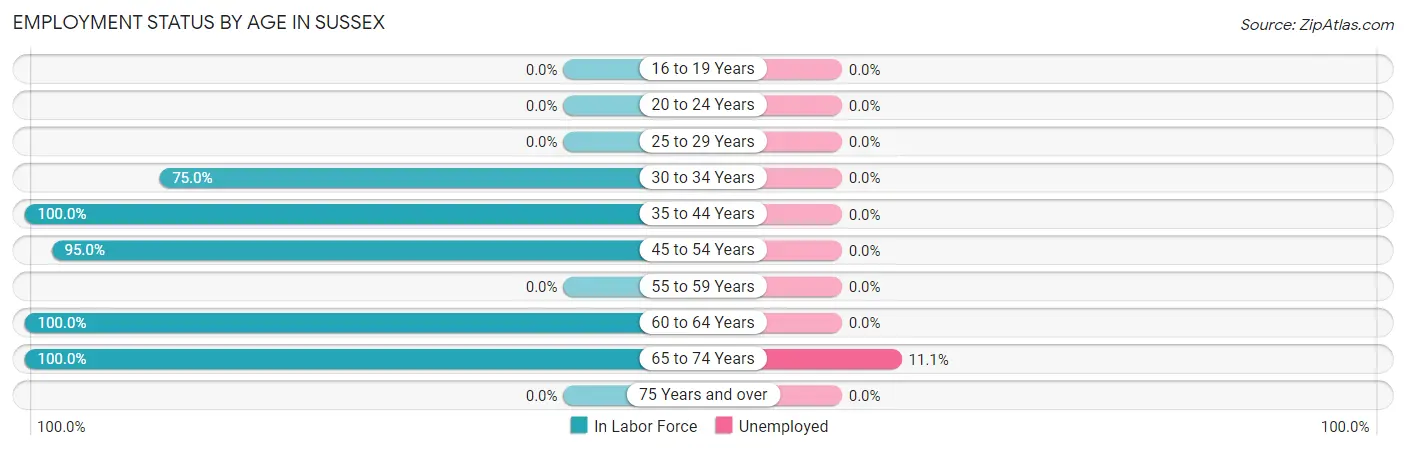
| Age Bracket | In Labor Force | Unemployed |
| 16 to 19 Years | 0 (0.0%) | 0 (0.0%) |
| 20 to 24 Years | 0 (0.0%) | 0 (0.0%) |
| 25 to 29 Years | 0 (0.0%) | 0 (0.0%) |
| 30 to 34 Years | 9 (75.0%) | 0 (0.0%) |
| 35 to 44 Years | 16 (100.0%) | 0 (0.0%) |
| 45 to 54 Years | 19 (95.0%) | 0 (0.0%) |
| 55 to 59 Years | 0 (0.0%) | 0 (0.0%) |
| 60 to 64 Years | 40 (100.0%) | 0 (0.0%) |
| 65 to 74 Years | 27 (100.0%) | 3 (11.1%) |
| 75 Years and over | 0 (0.0%) | 0 (0.0%) |
| Total | 111 (82.8%) | 3 (2.7%) |
Employment Status by Educational Attainment in Sussex
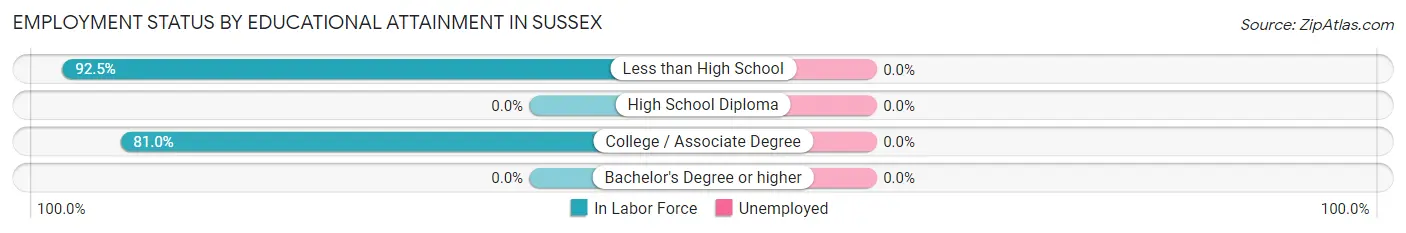
| Educational Attainment | In Labor Force | Unemployed |
| Less than High School | 37 (92.5%) | 0 (0.0%) |
| High School Diploma | 0 (0.0%) | 0 (0.0%) |
| College / Associate Degree | 47 (81.0%) | 0 (0.0%) |
| Bachelor's Degree or higher | 0 (0.0%) | 0 (0.0%) |
| Total | 84 (82.4%) | 0 (0.0%) |
Employment Occupations by Sex in Sussex
Management, Business, Science and Arts Occupations
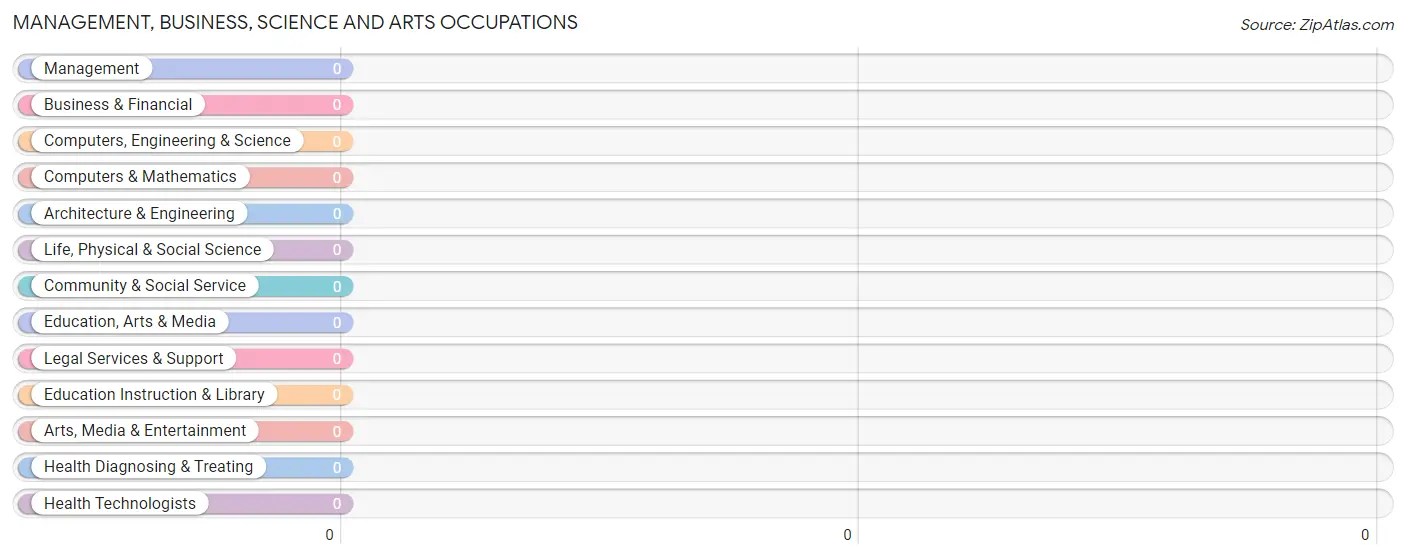
Management, Business, Science and Arts Occupations by Sex
| Occupation | Male | Female |
| Management | 0 (0.0%) | 0 (0.0%) |
| Business & Financial | 0 (0.0%) | 0 (0.0%) |
| Computers, Engineering & Science | 0 (0.0%) | 0 (0.0%) |
| Computers & Mathematics | 0 (0.0%) | 0 (0.0%) |
| Architecture & Engineering | 0 (0.0%) | 0 (0.0%) |
| Life, Physical & Social Science | 0 (0.0%) | 0 (0.0%) |
| Community & Social Service | 0 (0.0%) | 0 (0.0%) |
| Education, Arts & Media | 0 (0.0%) | 0 (0.0%) |
| Legal Services & Support | 0 (0.0%) | 0 (0.0%) |
| Education Instruction & Library | 0 (0.0%) | 0 (0.0%) |
| Arts, Media & Entertainment | 0 (0.0%) | 0 (0.0%) |
| Health Diagnosing & Treating | 0 (0.0%) | 0 (0.0%) |
| Health Technologists | 0 (0.0%) | 0 (0.0%) |
| Total (Category) | 0 (0.0%) | 0 (0.0%) |
| Total (Overall) | 52 (48.1%) | 56 (51.8%) |
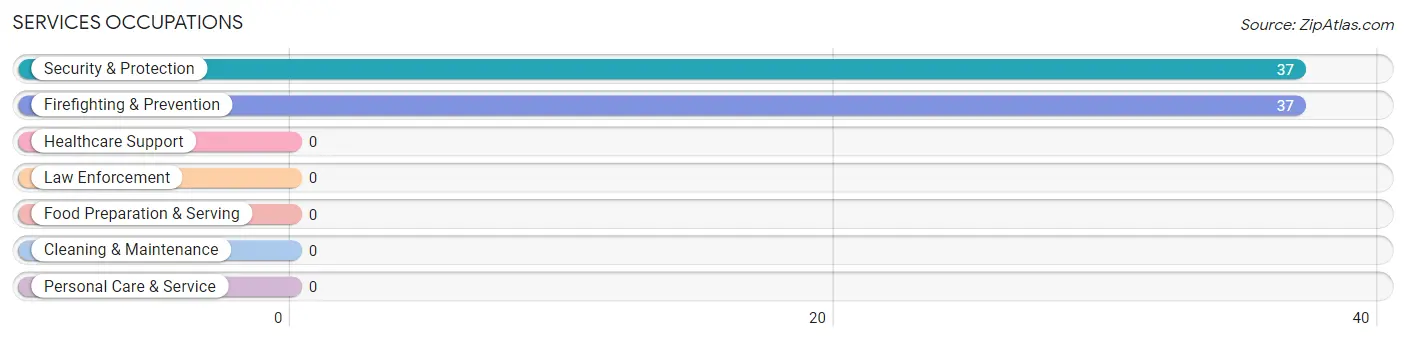
Services Occupations
The most common Services occupations in Sussex are Security & Protection (37 | 34.3%), and Firefighting & Prevention (37 | 34.3%).
Services Occupations by Sex
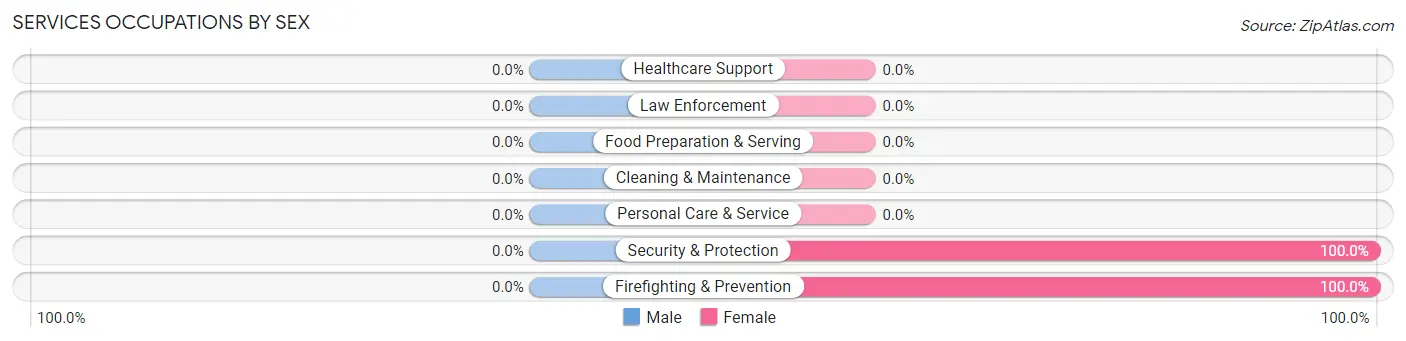
| Occupation | Male | Female |
| Healthcare Support | 0 (0.0%) | 0 (0.0%) |
| Security & Protection | 0 (0.0%) | 37 (100.0%) |
| Firefighting & Prevention | 0 (0.0%) | 37 (100.0%) |
| Law Enforcement | 0 (0.0%) | 0 (0.0%) |
| Food Preparation & Serving | 0 (0.0%) | 0 (0.0%) |
| Cleaning & Maintenance | 0 (0.0%) | 0 (0.0%) |
| Personal Care & Service | 0 (0.0%) | 0 (0.0%) |
| Total (Category) | 0 (0.0%) | 37 (100.0%) |
| Total (Overall) | 52 (48.1%) | 56 (51.8%) |
Sales and Office Occupations
The most common Sales and Office occupations in Sussex are Office & Administration (19 | 17.6%), and Sales & Related (4 | 3.7%).
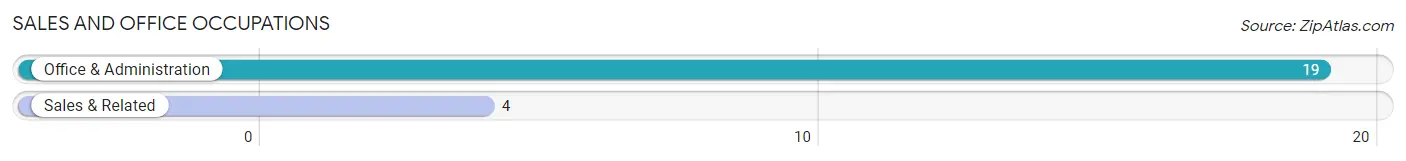
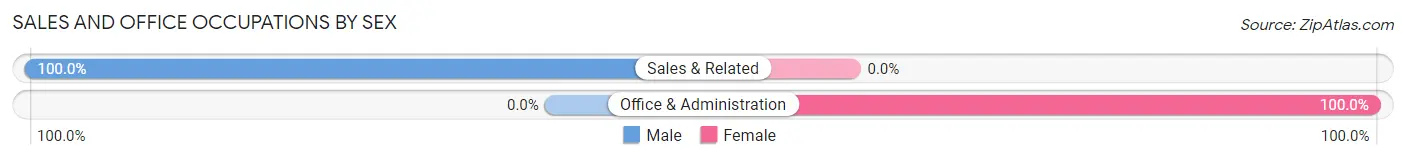
Sales and Office Occupations by Sex
| Occupation | Male | Female |
| Sales & Related | 4 (100.0%) | 0 (0.0%) |
| Office & Administration | 0 (0.0%) | 19 (100.0%) |
| Total (Category) | 4 (17.4%) | 19 (82.6%) |
| Total (Overall) | 52 (48.1%) | 56 (51.8%) |
Natural Resources, Construction and Maintenance Occupations
The most common Natural Resources, Construction and Maintenance occupations in Sussex are Construction & Extraction (25 | 23.2%), and Installation, Maintenance & Repair (3 | 2.8%).
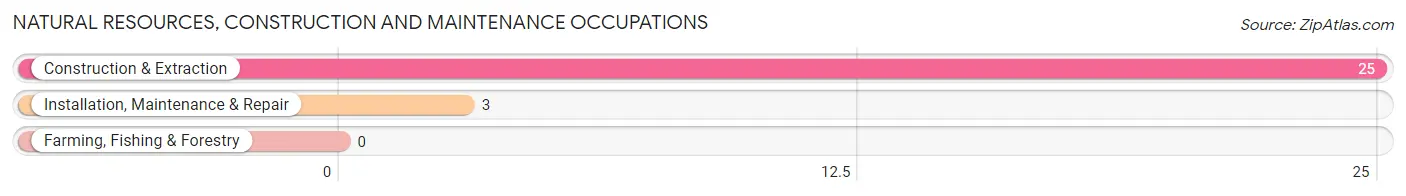
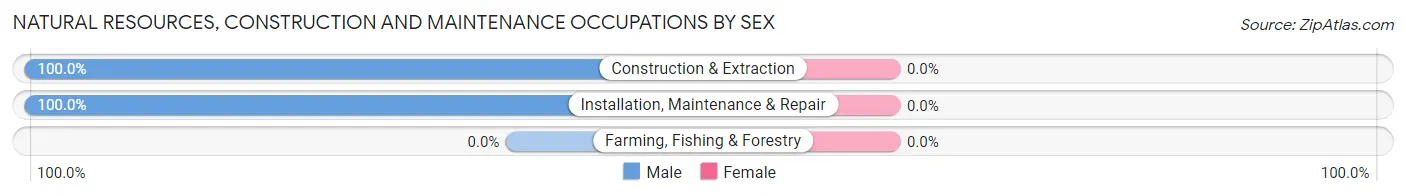
Natural Resources, Construction and Maintenance Occupations by Sex
| Occupation | Male | Female |
| Farming, Fishing & Forestry | 0 (0.0%) | 0 (0.0%) |
| Construction & Extraction | 25 (100.0%) | 0 (0.0%) |
| Installation, Maintenance & Repair | 3 (100.0%) | 0 (0.0%) |
| Total (Category) | 28 (100.0%) | 0 (0.0%) |
| Total (Overall) | 52 (48.1%) | 56 (51.8%) |
Production, Transportation and Moving Occupations
The most common Production, Transportation and Moving occupations in Sussex are , and Transportation (20 | 18.5%).
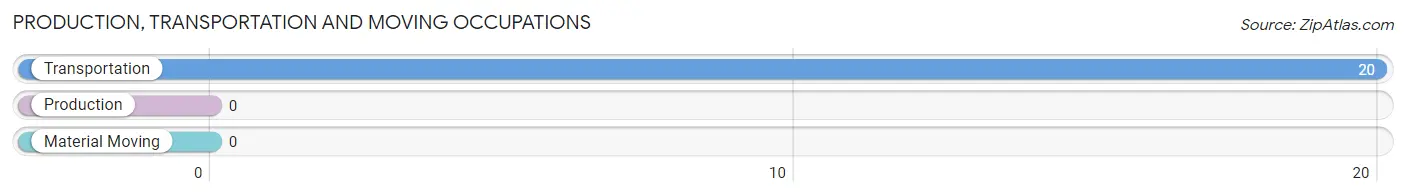
Production, Transportation and Moving Occupations by Sex
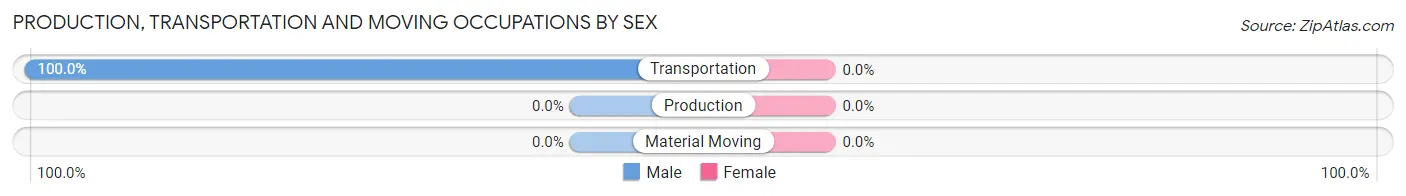
| Occupation | Male | Female |
| Production | 0 (0.0%) | 0 (0.0%) |
| Transportation | 20 (100.0%) | 0 (0.0%) |
| Material Moving | 0 (0.0%) | 0 (0.0%) |
| Total (Category) | 20 (100.0%) | 0 (0.0%) |
| Total (Overall) | 52 (48.1%) | 56 (51.8%) |
Employment Industries by Sex in Sussex
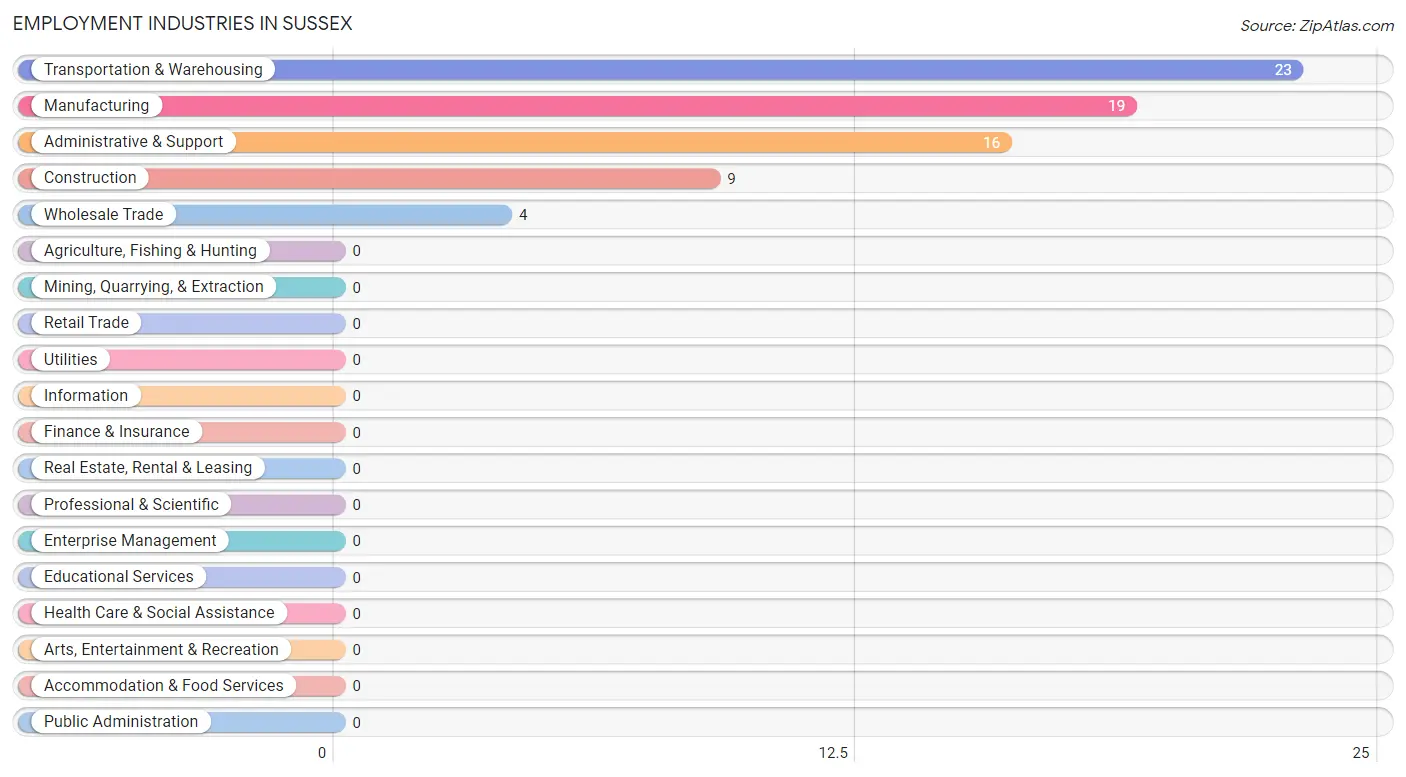
Employment Industries in Sussex
The major employment industries in Sussex include Transportation & Warehousing (23 | 21.3%), Manufacturing (19 | 17.6%), Administrative & Support (16 | 14.8%), Construction (9 | 8.3%), and Wholesale Trade (4 | 3.7%).
Employment Industries by Sex in Sussex
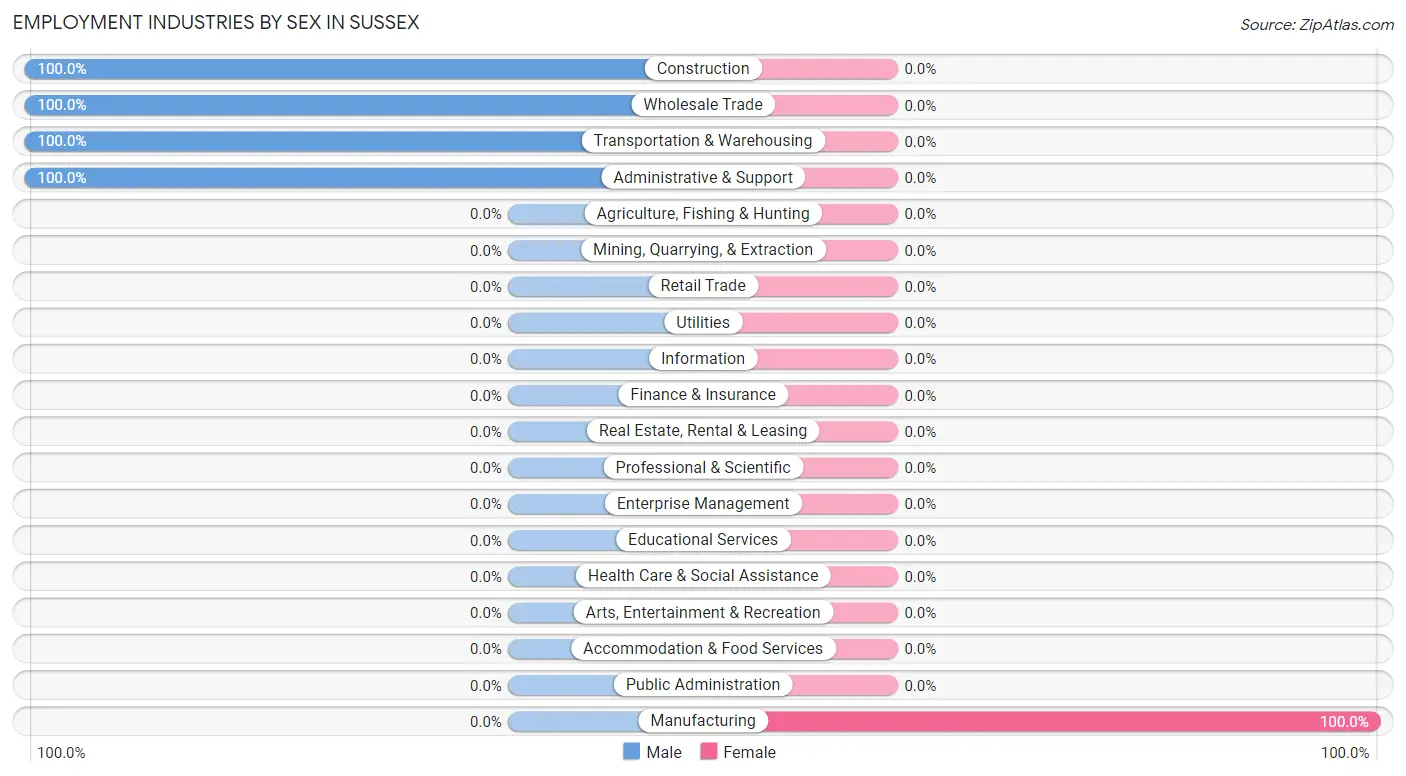
| Industry | Male | Female |
| Agriculture, Fishing & Hunting | 0 (0.0%) | 0 (0.0%) |
| Mining, Quarrying, & Extraction | 0 (0.0%) | 0 (0.0%) |
| Construction | 9 (100.0%) | 0 (0.0%) |
| Manufacturing | 0 (0.0%) | 19 (100.0%) |
| Wholesale Trade | 4 (100.0%) | 0 (0.0%) |
| Retail Trade | 0 (0.0%) | 0 (0.0%) |
| Transportation & Warehousing | 23 (100.0%) | 0 (0.0%) |
| Utilities | 0 (0.0%) | 0 (0.0%) |
| Information | 0 (0.0%) | 0 (0.0%) |
| Finance & Insurance | 0 (0.0%) | 0 (0.0%) |
| Real Estate, Rental & Leasing | 0 (0.0%) | 0 (0.0%) |
| Professional & Scientific | 0 (0.0%) | 0 (0.0%) |
| Enterprise Management | 0 (0.0%) | 0 (0.0%) |
| Administrative & Support | 16 (100.0%) | 0 (0.0%) |
| Educational Services | 0 (0.0%) | 0 (0.0%) |
| Health Care & Social Assistance | 0 (0.0%) | 0 (0.0%) |
| Arts, Entertainment & Recreation | 0 (0.0%) | 0 (0.0%) |
| Accommodation & Food Services | 0 (0.0%) | 0 (0.0%) |
| Public Administration | 0 (0.0%) | 0 (0.0%) |
| Total | 52 (48.1%) | 56 (51.8%) |
Education in Sussex
School Enrollment in Sussex
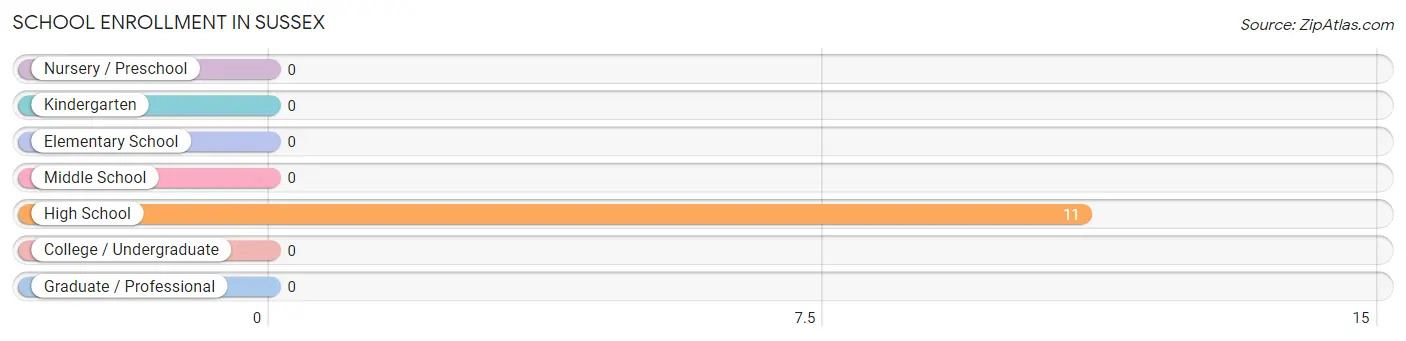
| School Level | # Students | % Students |
| Nursery / Preschool | 0 | 0.0% |
| Kindergarten | 0 | 0.0% |
| Elementary School | 0 | 0.0% |
| Middle School | 0 | 0.0% |
| High School | 11 | 100.0% |
| College / Undergraduate | 0 | 0.0% |
| Graduate / Professional | 0 | 0.0% |
| Total | 11 | 100.0% |
School Enrollment by Age by Funding Source in Sussex
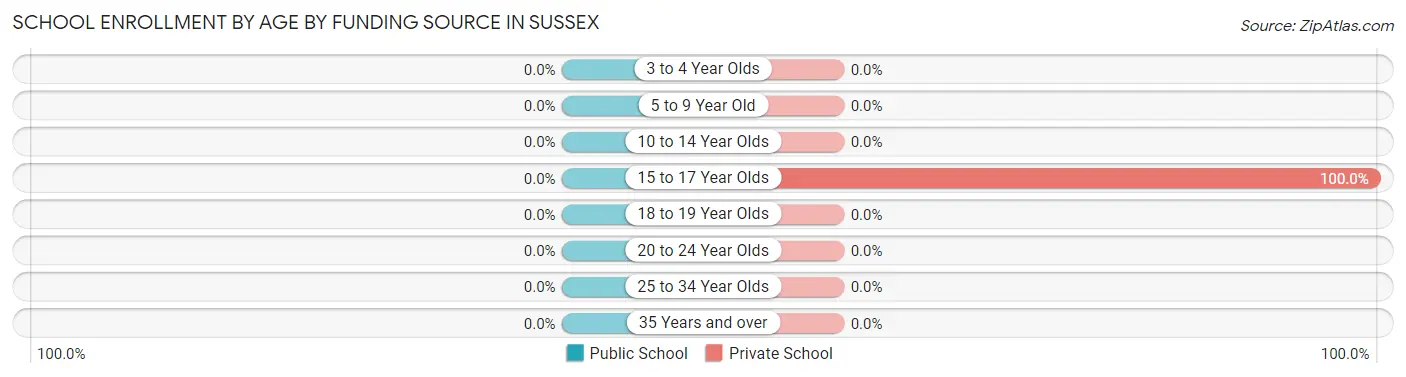
| Age Bracket | Public School | Private School |
| 3 to 4 Year Olds | 0 (0.0%) | 0 (0.0%) |
| 5 to 9 Year Old | 0 (0.0%) | 0 (0.0%) |
| 10 to 14 Year Olds | 0 (0.0%) | 0 (0.0%) |
| 15 to 17 Year Olds | 0 (0.0%) | 11 (100.0%) |
| 18 to 19 Year Olds | 0 (0.0%) | 0 (0.0%) |
| 20 to 24 Year Olds | 0 (0.0%) | 0 (0.0%) |
| 25 to 34 Year Olds | 0 (0.0%) | 0 (0.0%) |
| 35 Years and over | 0 (0.0%) | 0 (0.0%) |
| Total | 0 (0.0%) | 11 (100.0%) |
Educational Attainment by Field of Study in Sussex
Business (4 | 57.1%), and education (3 | 42.9%) are the most common fields of study among 7 individuals in Sussex who have obtained a bachelor's degree or higher.
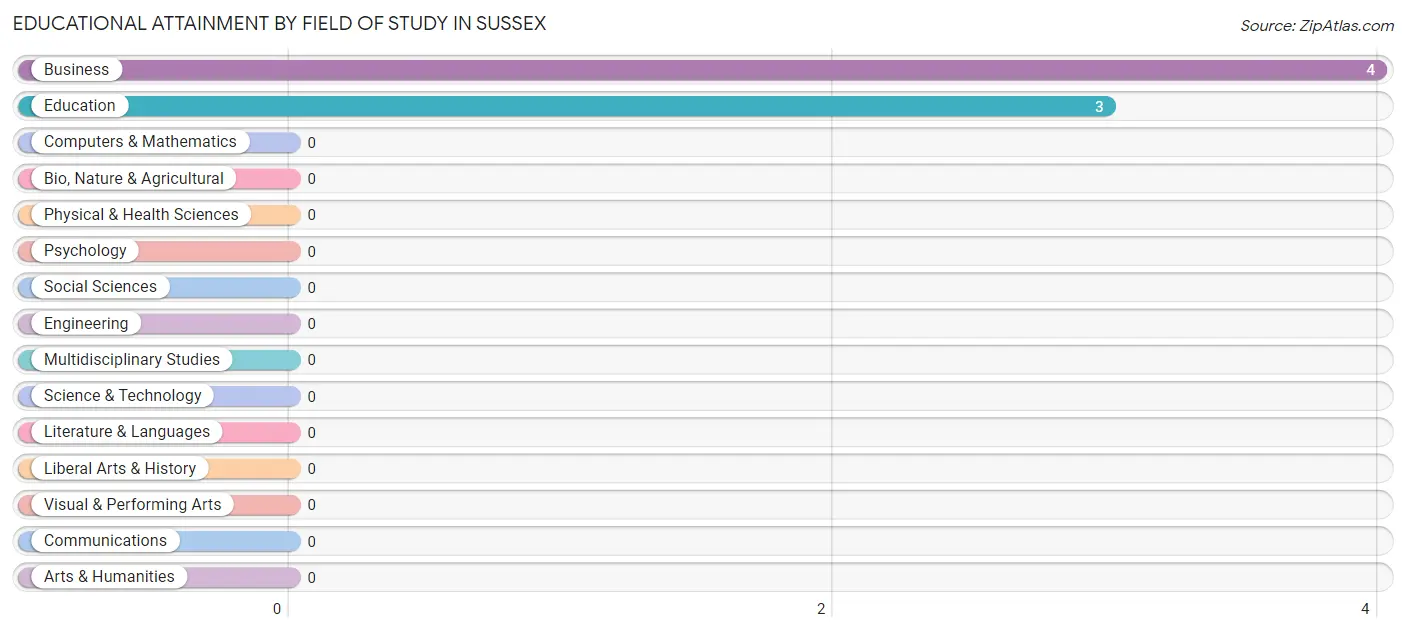
| Field of Study | # Graduates | % Graduates |
| Computers & Mathematics | 0 | 0.0% |
| Bio, Nature & Agricultural | 0 | 0.0% |
| Physical & Health Sciences | 0 | 0.0% |
| Psychology | 0 | 0.0% |
| Social Sciences | 0 | 0.0% |
| Engineering | 0 | 0.0% |
| Multidisciplinary Studies | 0 | 0.0% |
| Science & Technology | 0 | 0.0% |
| Business | 4 | 57.1% |
| Education | 3 | 42.9% |
| Literature & Languages | 0 | 0.0% |
| Liberal Arts & History | 0 | 0.0% |
| Visual & Performing Arts | 0 | 0.0% |
| Communications | 0 | 0.0% |
| Arts & Humanities | 0 | 0.0% |
| Total | 7 | 100.0% |
Transportation & Commute in Sussex
Vehicle Availability by Sex in Sussex
The most prevalent vehicle ownership categories in Sussex are males with 4 vehicles (23, accounting for 44.2%) and females with 4 vehicles (37, making up 41.1%).
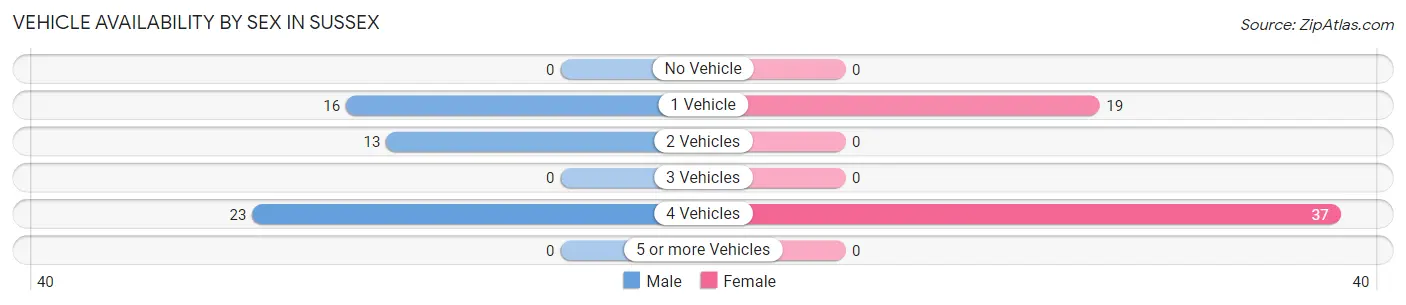
| Vehicles Available | Male | Female |
| No Vehicle | 0 (0.0%) | 0 (0.0%) |
| 1 Vehicle | 16 (30.8%) | 19 (33.9%) |
| 2 Vehicles | 13 (25.0%) | 0 (0.0%) |
| 3 Vehicles | 0 (0.0%) | 0 (0.0%) |
| 4 Vehicles | 23 (44.2%) | 37 (66.1%) |
| 5 or more Vehicles | 0 (0.0%) | 0 (0.0%) |
| Total | 52 (100.0%) | 56 (100.0%) |
Commute Time in Sussex
The most frequently occuring commute durations in Sussex are 5 to 9 minutes (37 commuters, 34.3%), 30 to 34 minutes (26 commuters, 24.1%), and 20 to 24 minutes (25 commuters, 23.2%).
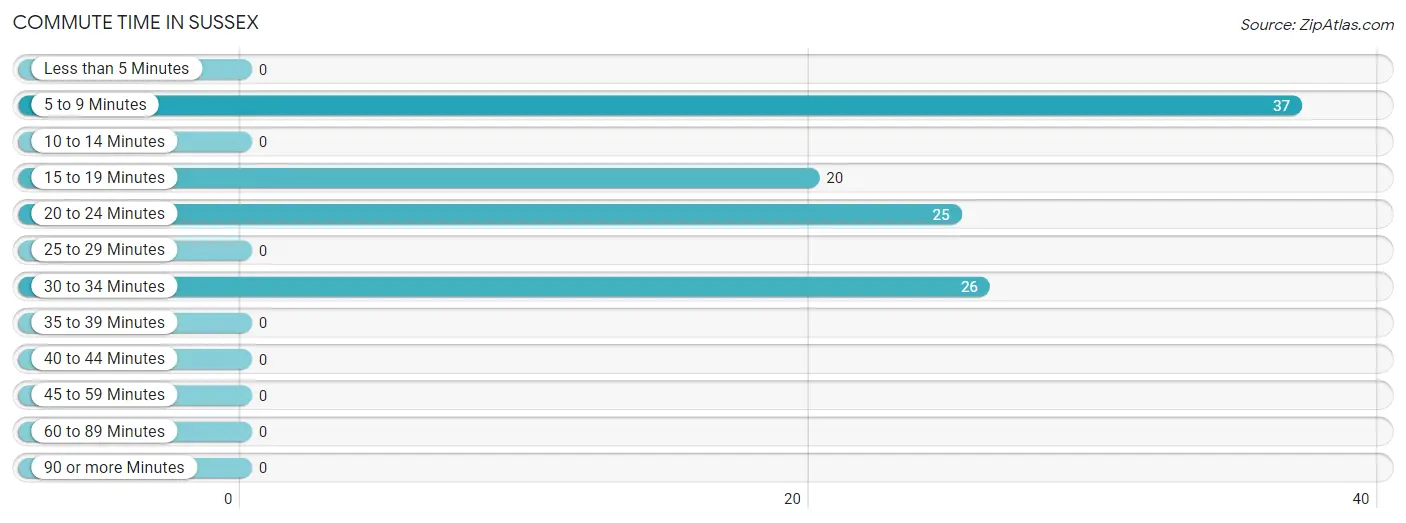
| Commute Time | # Commuters | % Commuters |
| Less than 5 Minutes | 0 | 0.0% |
| 5 to 9 Minutes | 37 | 34.3% |
| 10 to 14 Minutes | 0 | 0.0% |
| 15 to 19 Minutes | 20 | 18.5% |
| 20 to 24 Minutes | 25 | 23.2% |
| 25 to 29 Minutes | 0 | 0.0% |
| 30 to 34 Minutes | 26 | 24.1% |
| 35 to 39 Minutes | 0 | 0.0% |
| 40 to 44 Minutes | 0 | 0.0% |
| 45 to 59 Minutes | 0 | 0.0% |
| 60 to 89 Minutes | 0 | 0.0% |
| 90 or more Minutes | 0 | 0.0% |
Commute Time by Sex in Sussex
The most common commute times in Sussex are 20 to 24 minutes (25 commuters, 48.1%) for males and 5 to 9 minutes (37 commuters, 66.1%) for females.
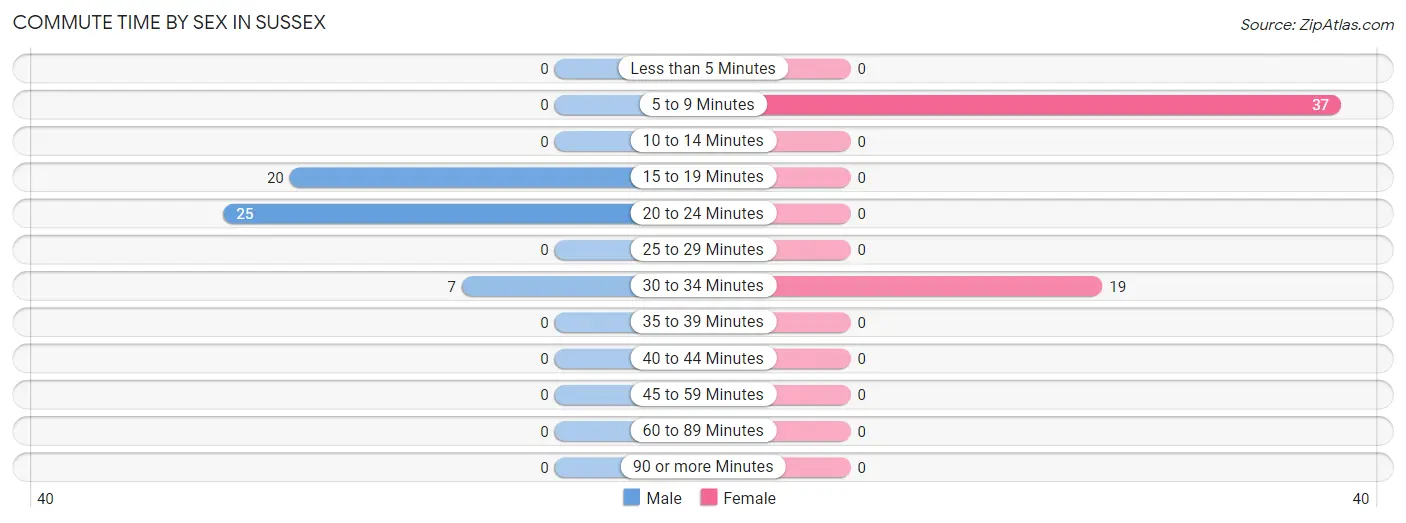
| Commute Time | Male | Female |
| Less than 5 Minutes | 0 (0.0%) | 0 (0.0%) |
| 5 to 9 Minutes | 0 (0.0%) | 37 (66.1%) |
| 10 to 14 Minutes | 0 (0.0%) | 0 (0.0%) |
| 15 to 19 Minutes | 20 (38.5%) | 0 (0.0%) |
| 20 to 24 Minutes | 25 (48.1%) | 0 (0.0%) |
| 25 to 29 Minutes | 0 (0.0%) | 0 (0.0%) |
| 30 to 34 Minutes | 7 (13.5%) | 19 (33.9%) |
| 35 to 39 Minutes | 0 (0.0%) | 0 (0.0%) |
| 40 to 44 Minutes | 0 (0.0%) | 0 (0.0%) |
| 45 to 59 Minutes | 0 (0.0%) | 0 (0.0%) |
| 60 to 89 Minutes | 0 (0.0%) | 0 (0.0%) |
| 90 or more Minutes | 0 (0.0%) | 0 (0.0%) |
Time of Departure to Work by Sex in Sussex
The most frequent times of departure to work in Sussex are 7:00 AM to 7:29 AM (20, 38.5%) for males and 8:30 AM to 8:59 AM (37, 66.1%) for females.
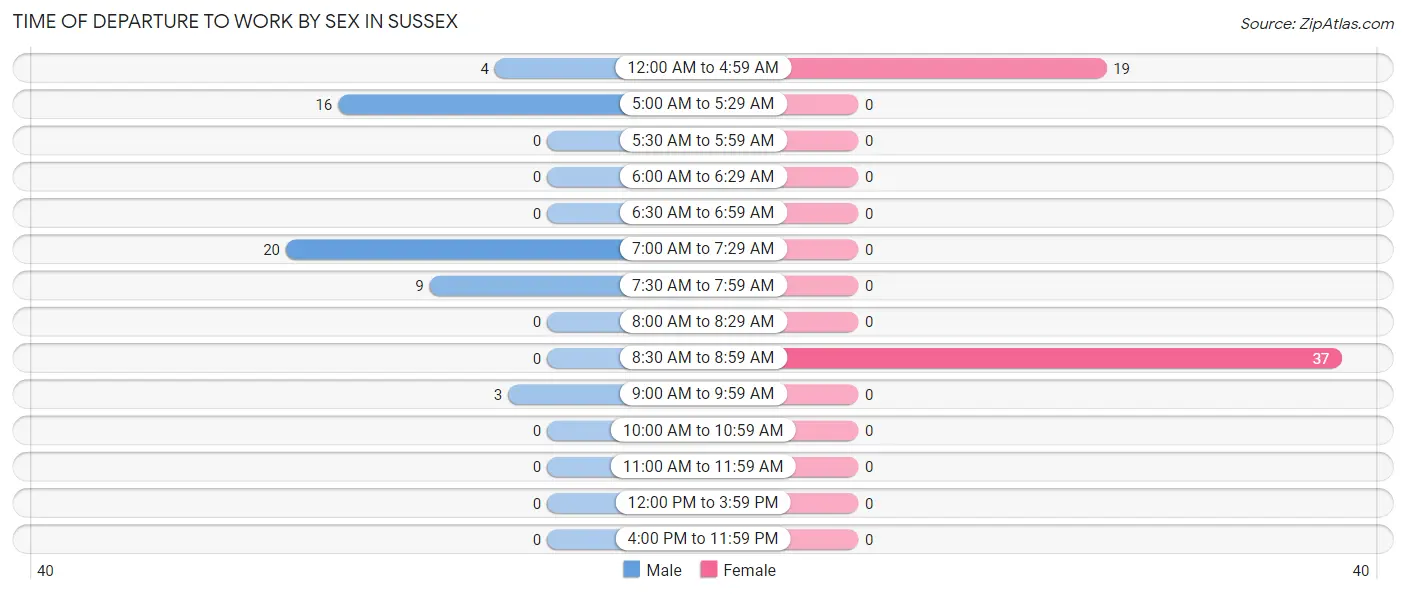
| Time of Departure | Male | Female |
| 12:00 AM to 4:59 AM | 4 (7.7%) | 19 (33.9%) |
| 5:00 AM to 5:29 AM | 16 (30.8%) | 0 (0.0%) |
| 5:30 AM to 5:59 AM | 0 (0.0%) | 0 (0.0%) |
| 6:00 AM to 6:29 AM | 0 (0.0%) | 0 (0.0%) |
| 6:30 AM to 6:59 AM | 0 (0.0%) | 0 (0.0%) |
| 7:00 AM to 7:29 AM | 20 (38.5%) | 0 (0.0%) |
| 7:30 AM to 7:59 AM | 9 (17.3%) | 0 (0.0%) |
| 8:00 AM to 8:29 AM | 0 (0.0%) | 0 (0.0%) |
| 8:30 AM to 8:59 AM | 0 (0.0%) | 37 (66.1%) |
| 9:00 AM to 9:59 AM | 3 (5.8%) | 0 (0.0%) |
| 10:00 AM to 10:59 AM | 0 (0.0%) | 0 (0.0%) |
| 11:00 AM to 11:59 AM | 0 (0.0%) | 0 (0.0%) |
| 12:00 PM to 3:59 PM | 0 (0.0%) | 0 (0.0%) |
| 4:00 PM to 11:59 PM | 0 (0.0%) | 0 (0.0%) |
| Total | 52 (100.0%) | 56 (100.0%) |
Housing Occupancy in Sussex
Occupancy by Ownership in Sussex
Of the total 83 dwellings in Sussex, owner-occupied units account for 67 (80.7%), while renter-occupied units make up 16 (19.3%).
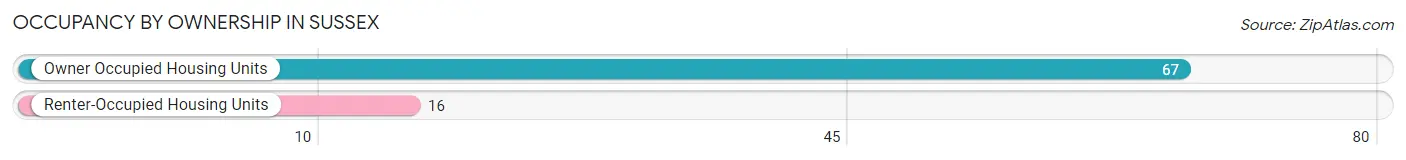
| Occupancy | # Housing Units | % Housing Units |
| Owner Occupied Housing Units | 67 | 80.7% |
| Renter-Occupied Housing Units | 16 | 19.3% |
| Total Occupied Housing Units | 83 | 100.0% |
Occupancy by Household Size in Sussex
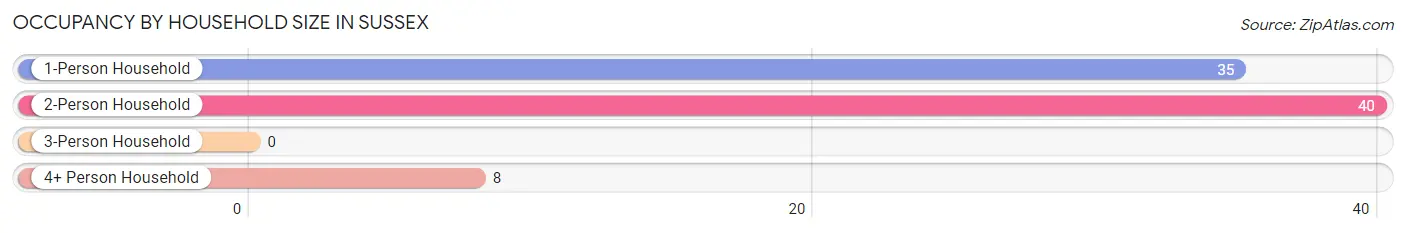
| Household Size | # Housing Units | % Housing Units |
| 1-Person Household | 35 | 42.2% |
| 2-Person Household | 40 | 48.2% |
| 3-Person Household | 0 | 0.0% |
| 4+ Person Household | 8 | 9.6% |
| Total Housing Units | 83 | 100.0% |
Occupancy by Ownership by Household Size in Sussex
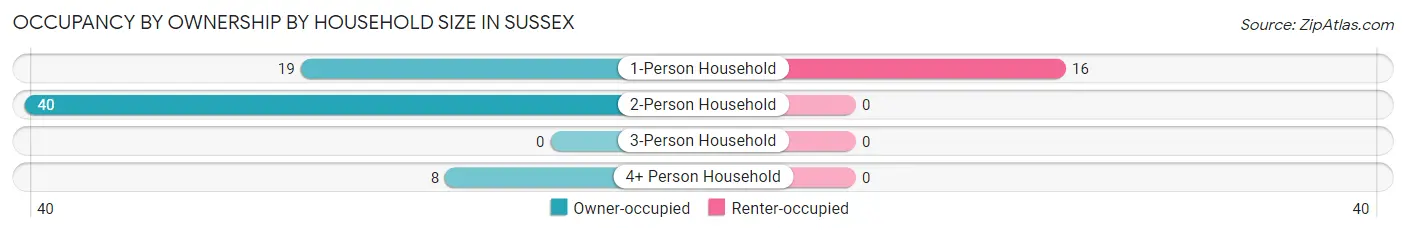
| Household Size | Owner-occupied | Renter-occupied |
| 1-Person Household | 19 (54.3%) | 16 (45.7%) |
| 2-Person Household | 40 (100.0%) | 0 (0.0%) |
| 3-Person Household | 0 (0.0%) | 0 (0.0%) |
| 4+ Person Household | 8 (100.0%) | 0 (0.0%) |
| Total Housing Units | 67 (80.7%) | 16 (19.3%) |
Occupancy by Educational Attainment in Sussex
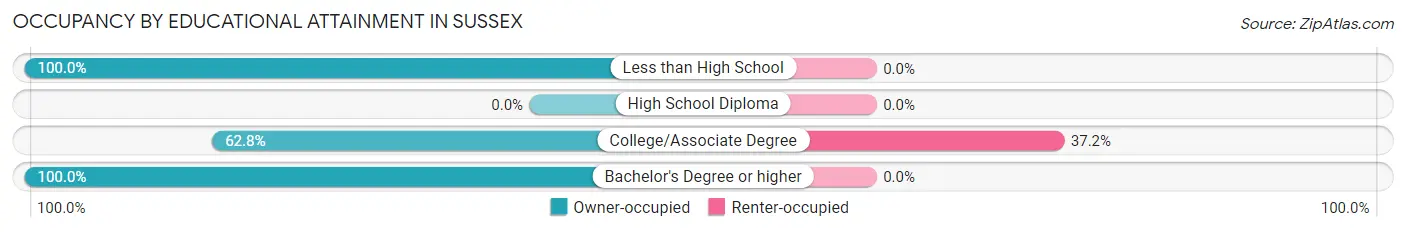
| Household Size | Owner-occupied | Renter-occupied |
| Less than High School | 37 (100.0%) | 0 (0.0%) |
| High School Diploma | 0 (0.0%) | 0 (0.0%) |
| College/Associate Degree | 27 (62.8%) | 16 (37.2%) |
| Bachelor's Degree or higher | 3 (100.0%) | 0 (0.0%) |
Occupancy by Age of Householder in Sussex
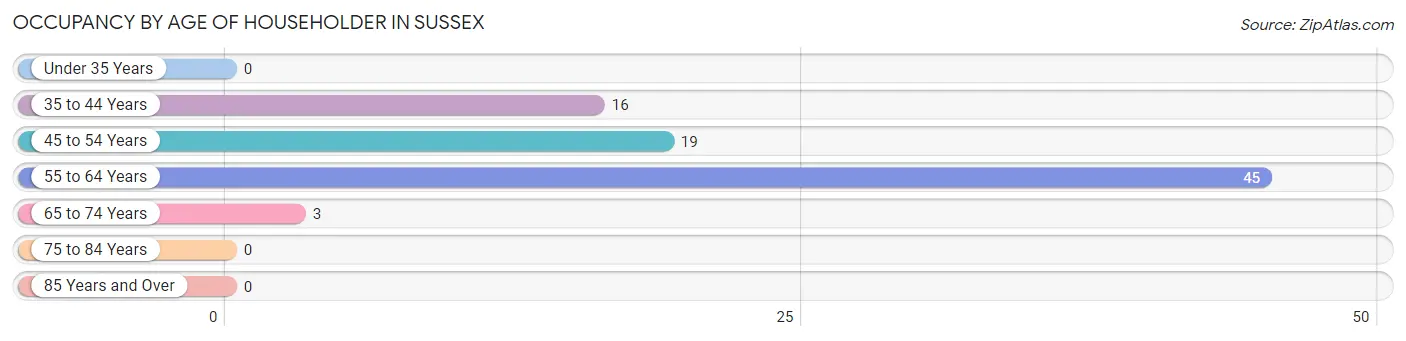
| Age Bracket | # Households | % Households |
| Under 35 Years | 0 | 0.0% |
| 35 to 44 Years | 16 | 19.3% |
| 45 to 54 Years | 19 | 22.9% |
| 55 to 64 Years | 45 | 54.2% |
| 65 to 74 Years | 3 | 3.6% |
| 75 to 84 Years | 0 | 0.0% |
| 85 Years and Over | 0 | 0.0% |
| Total | 83 | 100.0% |
Housing Finances in Sussex
Median Income by Occupancy in Sussex
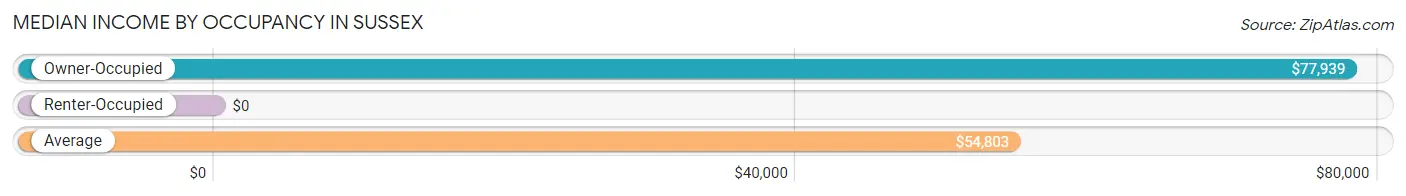
| Occupancy Type | # Households | Median Income |
| Owner-Occupied | 67 (80.7%) | $77,939 |
| Renter-Occupied | 16 (19.3%) | $0 |
| Average | 83 (100.0%) | $54,803 |
Occupancy by Householder Income Bracket in Sussex
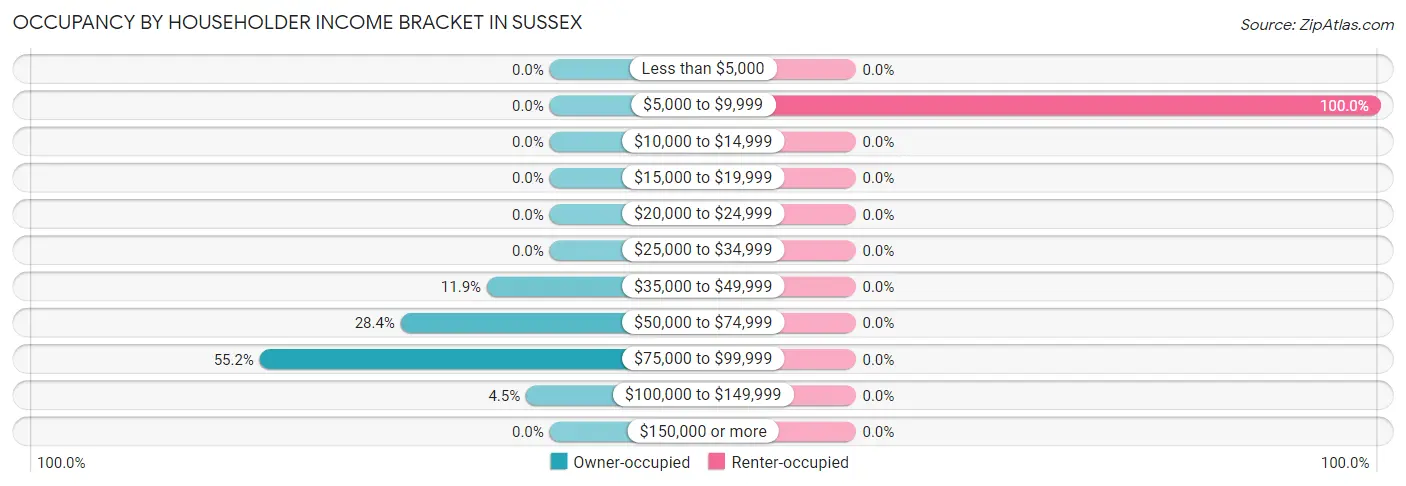
| Income Bracket | Owner-occupied | Renter-occupied |
| Less than $5,000 | 0 (0.0%) | 0 (0.0%) |
| $5,000 to $9,999 | 0 (0.0%) | 16 (100.0%) |
| $10,000 to $14,999 | 0 (0.0%) | 0 (0.0%) |
| $15,000 to $19,999 | 0 (0.0%) | 0 (0.0%) |
| $20,000 to $24,999 | 0 (0.0%) | 0 (0.0%) |
| $25,000 to $34,999 | 0 (0.0%) | 0 (0.0%) |
| $35,000 to $49,999 | 8 (11.9%) | 0 (0.0%) |
| $50,000 to $74,999 | 19 (28.4%) | 0 (0.0%) |
| $75,000 to $99,999 | 37 (55.2%) | 0 (0.0%) |
| $100,000 to $149,999 | 3 (4.5%) | 0 (0.0%) |
| $150,000 or more | 0 (0.0%) | 0 (0.0%) |
| Total | 67 (100.0%) | 16 (100.0%) |
Monthly Housing Cost Tiers in Sussex
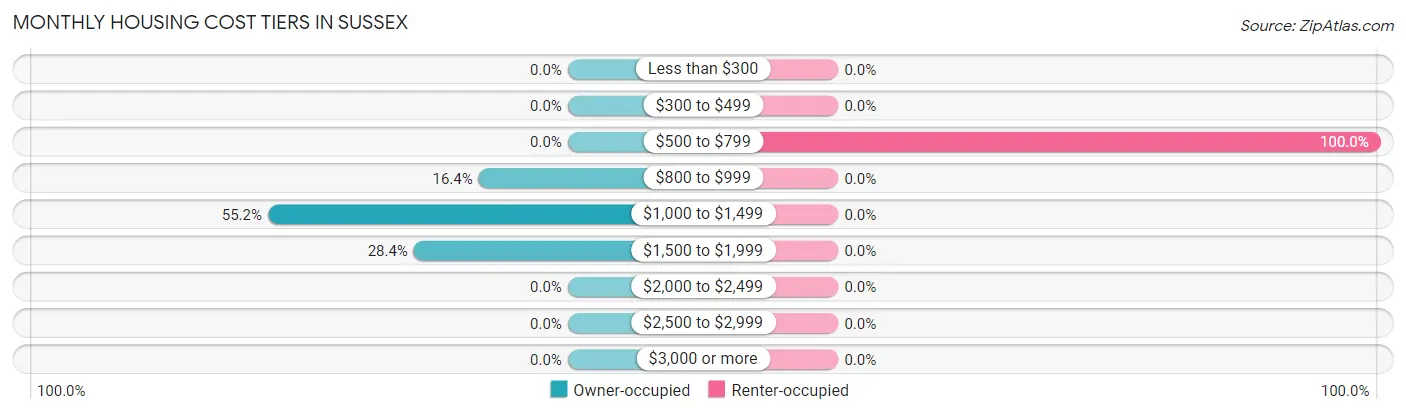
| Monthly Cost | Owner-occupied | Renter-occupied |
| Less than $300 | 0 (0.0%) | 0 (0.0%) |
| $300 to $499 | 0 (0.0%) | 0 (0.0%) |
| $500 to $799 | 0 (0.0%) | 16 (100.0%) |
| $800 to $999 | 11 (16.4%) | 0 (0.0%) |
| $1,000 to $1,499 | 37 (55.2%) | 0 (0.0%) |
| $1,500 to $1,999 | 19 (28.4%) | 0 (0.0%) |
| $2,000 to $2,499 | 0 (0.0%) | 0 (0.0%) |
| $2,500 to $2,999 | 0 (0.0%) | 0 (0.0%) |
| $3,000 or more | 0 (0.0%) | 0 (0.0%) |
| Total | 67 (100.0%) | 16 (100.0%) |
Physical Housing Characteristics in Sussex
Housing Structures in Sussex
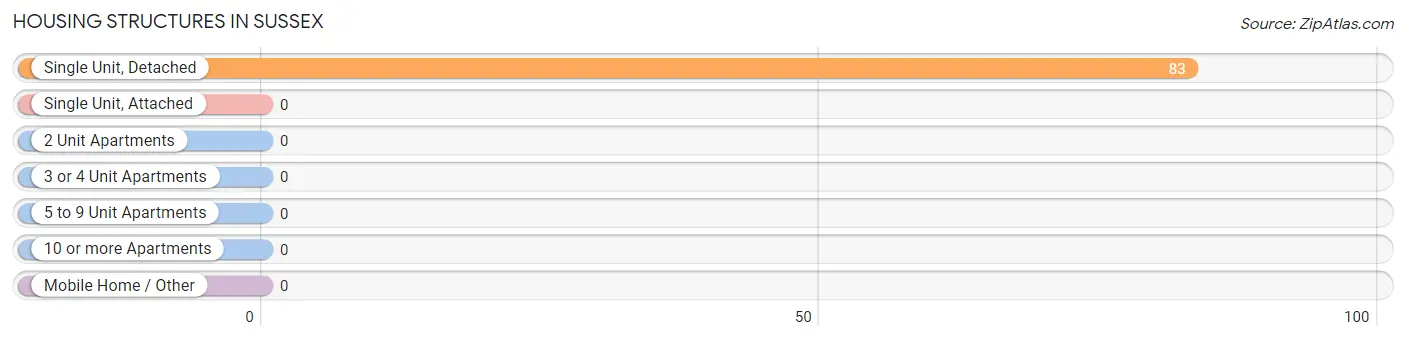
| Structure Type | # Housing Units | % Housing Units |
| Single Unit, Detached | 83 | 100.0% |
| Single Unit, Attached | 0 | 0.0% |
| 2 Unit Apartments | 0 | 0.0% |
| 3 or 4 Unit Apartments | 0 | 0.0% |
| 5 to 9 Unit Apartments | 0 | 0.0% |
| 10 or more Apartments | 0 | 0.0% |
| Mobile Home / Other | 0 | 0.0% |
| Total | 83 | 100.0% |
Housing Structures by Occupancy in Sussex
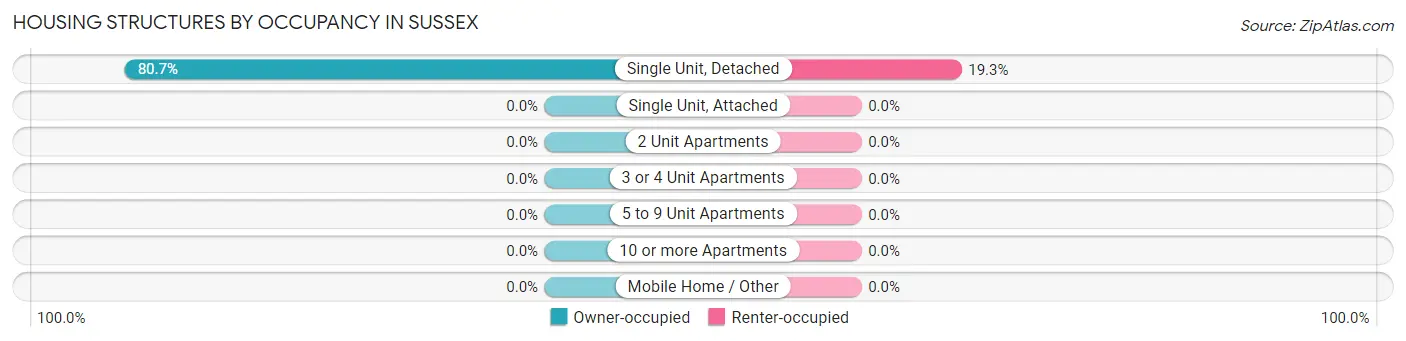
| Structure Type | Owner-occupied | Renter-occupied |
| Single Unit, Detached | 67 (80.7%) | 16 (19.3%) |
| Single Unit, Attached | 0 (0.0%) | 0 (0.0%) |
| 2 Unit Apartments | 0 (0.0%) | 0 (0.0%) |
| 3 or 4 Unit Apartments | 0 (0.0%) | 0 (0.0%) |
| 5 to 9 Unit Apartments | 0 (0.0%) | 0 (0.0%) |
| 10 or more Apartments | 0 (0.0%) | 0 (0.0%) |
| Mobile Home / Other | 0 (0.0%) | 0 (0.0%) |
| Total | 67 (80.7%) | 16 (19.3%) |
Housing Structures by Number of Rooms in Sussex
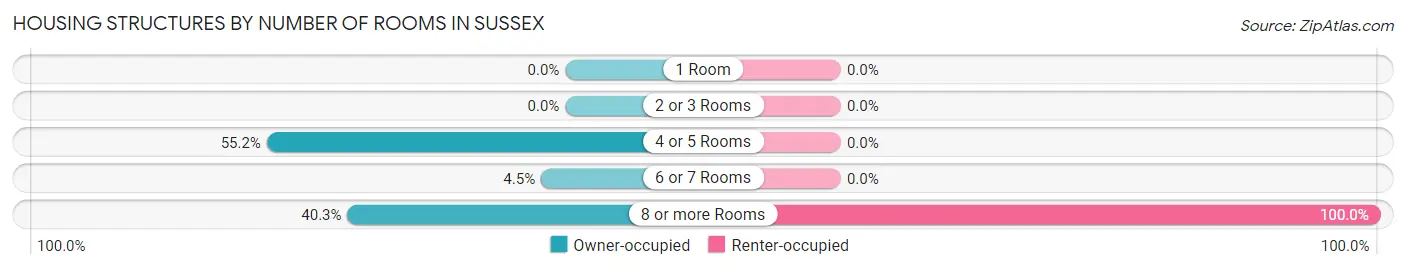
| Number of Rooms | Owner-occupied | Renter-occupied |
| 1 Room | 0 (0.0%) | 0 (0.0%) |
| 2 or 3 Rooms | 0 (0.0%) | 0 (0.0%) |
| 4 or 5 Rooms | 37 (55.2%) | 0 (0.0%) |
| 6 or 7 Rooms | 3 (4.5%) | 0 (0.0%) |
| 8 or more Rooms | 27 (40.3%) | 16 (100.0%) |
| Total | 67 (100.0%) | 16 (100.0%) |
Housing Structure by Heating Type in Sussex
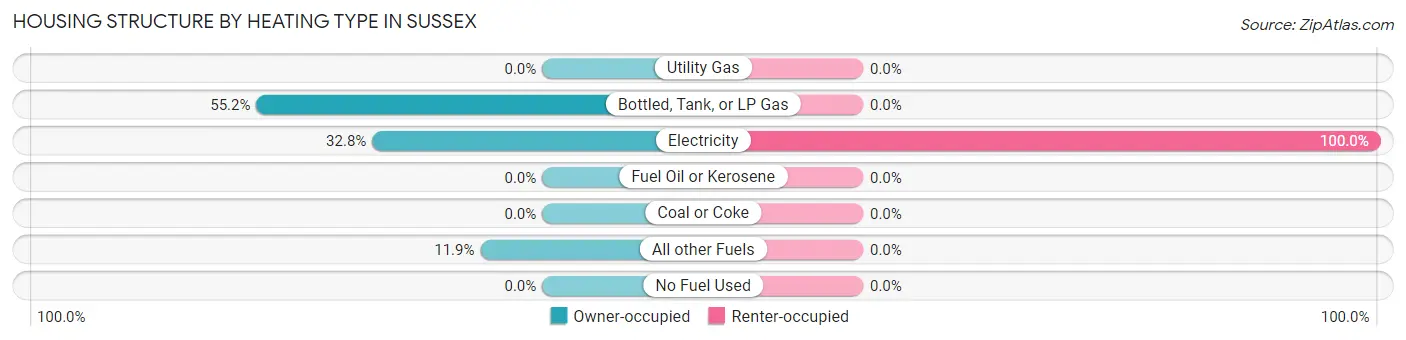
| Heating Type | Owner-occupied | Renter-occupied |
| Utility Gas | 0 (0.0%) | 0 (0.0%) |
| Bottled, Tank, or LP Gas | 37 (55.2%) | 0 (0.0%) |
| Electricity | 22 (32.8%) | 16 (100.0%) |
| Fuel Oil or Kerosene | 0 (0.0%) | 0 (0.0%) |
| Coal or Coke | 0 (0.0%) | 0 (0.0%) |
| All other Fuels | 8 (11.9%) | 0 (0.0%) |
| No Fuel Used | 0 (0.0%) | 0 (0.0%) |
| Total | 67 (100.0%) | 16 (100.0%) |
Household Vehicle Usage in Sussex
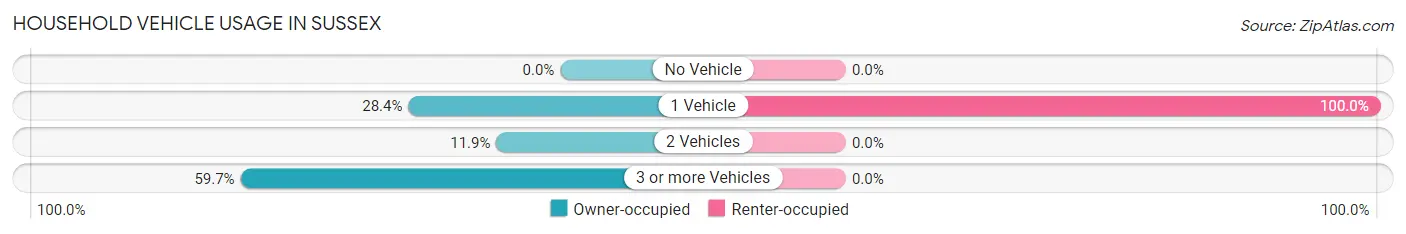
| Vehicles per Household | Owner-occupied | Renter-occupied |
| No Vehicle | 0 (0.0%) | 0 (0.0%) |
| 1 Vehicle | 19 (28.4%) | 16 (100.0%) |
| 2 Vehicles | 8 (11.9%) | 0 (0.0%) |
| 3 or more Vehicles | 40 (59.7%) | 0 (0.0%) |
| Total | 67 (100.0%) | 16 (100.0%) |
Real Estate & Mortgages in Sussex
Real Estate and Mortgage Overview in Sussex
| Characteristic | Without Mortgage | With Mortgage |
| Housing Units | 0 | 67 |
| Median Property Value | - | - |
| Median Household Income | - | - |
| Monthly Housing Costs | - | - |
| Real Estate Taxes | - | - |
Property Value by Mortgage Status in Sussex
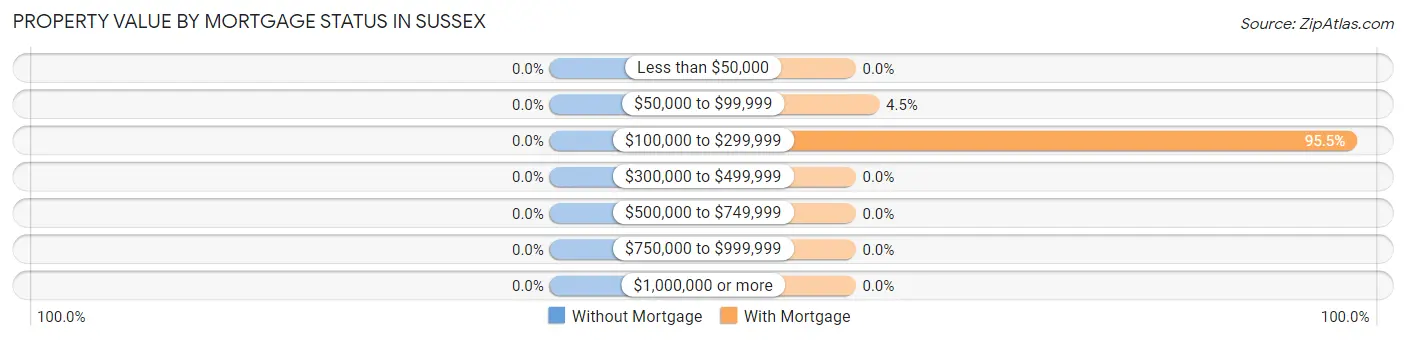
| Property Value | Without Mortgage | With Mortgage |
| Less than $50,000 | 0 (0.0%) | 0 (0.0%) |
| $50,000 to $99,999 | 0 (0.0%) | 3 (4.5%) |
| $100,000 to $299,999 | 0 (0.0%) | 64 (95.5%) |
| $300,000 to $499,999 | 0 (0.0%) | 0 (0.0%) |
| $500,000 to $749,999 | 0 (0.0%) | 0 (0.0%) |
| $750,000 to $999,999 | 0 (0.0%) | 0 (0.0%) |
| $1,000,000 or more | 0 (0.0%) | 0 (0.0%) |
| Total | 0 (0.0%) | 67 (100.0%) |
Household Income by Mortgage Status in Sussex
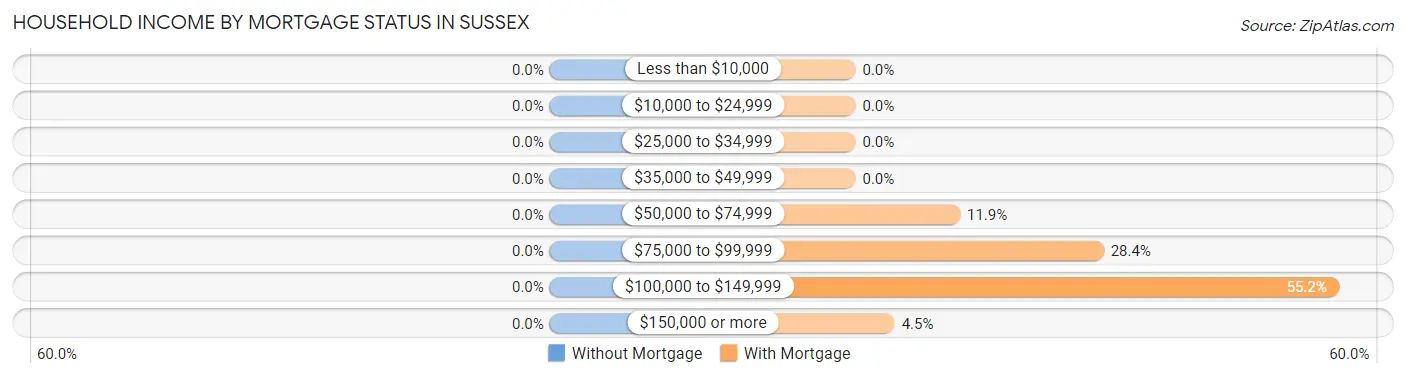
| Household Income | Without Mortgage | With Mortgage |
| Less than $10,000 | 0 (0.0%) | 0 (0.0%) |
| $10,000 to $24,999 | 0 (0.0%) | 0 (0.0%) |
| $25,000 to $34,999 | 0 (0.0%) | 0 (0.0%) |
| $35,000 to $49,999 | 0 (0.0%) | 0 (0.0%) |
| $50,000 to $74,999 | 0 (0.0%) | 8 (11.9%) |
| $75,000 to $99,999 | 0 (0.0%) | 19 (28.4%) |
| $100,000 to $149,999 | 0 (0.0%) | 37 (55.2%) |
| $150,000 or more | 0 (0.0%) | 3 (4.5%) |
| Total | 0 (0.0%) | 67 (100.0%) |
Property Value to Household Income Ratio in Sussex
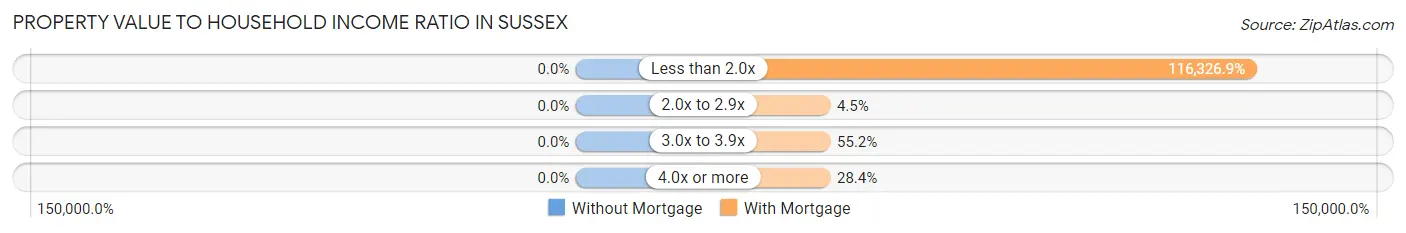
| Value-to-Income Ratio | Without Mortgage | With Mortgage |
| Less than 2.0x | 0 (0.0%) | 77,939 (116,326.9%) |
| 2.0x to 2.9x | 0 (0.0%) | 3 (4.5%) |
| 3.0x to 3.9x | 0 (0.0%) | 37 (55.2%) |
| 4.0x or more | 0 (0.0%) | 19 (28.4%) |
| Total | 0 (0.0%) | 67 (100.0%) |
Real Estate Taxes by Mortgage Status in Sussex
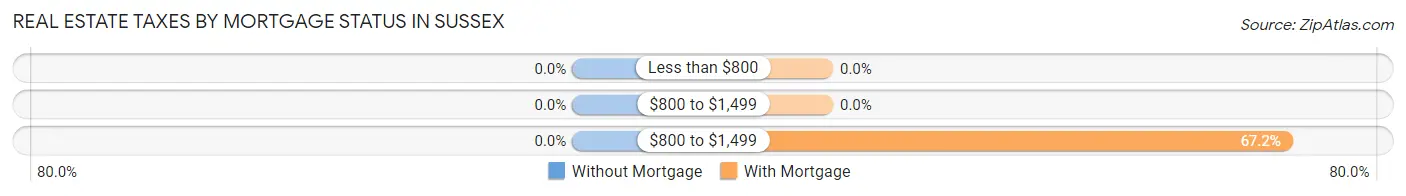
| Property Taxes | Without Mortgage | With Mortgage |
| Less than $800 | 0 (0.0%) | 0 (0.0%) |
| $800 to $1,499 | 0 (0.0%) | 0 (0.0%) |
| $800 to $1,499 | 0 (0.0%) | 45 (67.2%) |
| Total | 0 (0.0%) | 67 (100.0%) |
Health & Disability in Sussex
Health Insurance Coverage by Age in Sussex
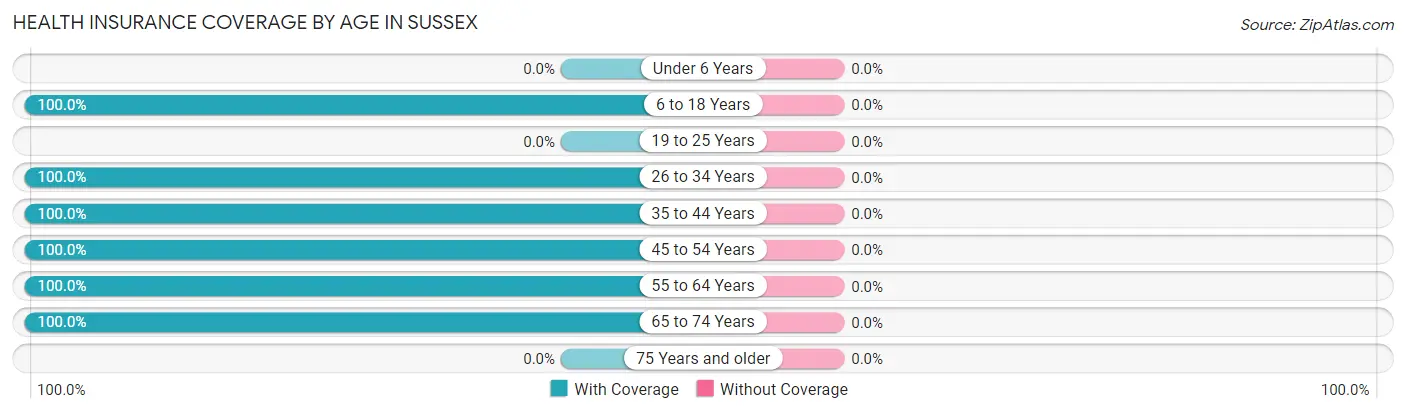
| Age Bracket | With Coverage | Without Coverage |
| Under 6 Years | 0 (0.0%) | 0 (0.0%) |
| 6 to 18 Years | 11 (100.0%) | 0 (0.0%) |
| 19 to 25 Years | 0 (0.0%) | 0 (0.0%) |
| 26 to 34 Years | 9 (100.0%) | 0 (0.0%) |
| 35 to 44 Years | 16 (100.0%) | 0 (0.0%) |
| 45 to 54 Years | 19 (100.0%) | 0 (0.0%) |
| 55 to 64 Years | 48 (100.0%) | 0 (0.0%) |
| 65 to 74 Years | 27 (100.0%) | 0 (0.0%) |
| 75 Years and older | 0 (0.0%) | 0 (0.0%) |
| Total | 130 (100.0%) | 0 (0.0%) |
Health Insurance Coverage by Citizenship Status in Sussex
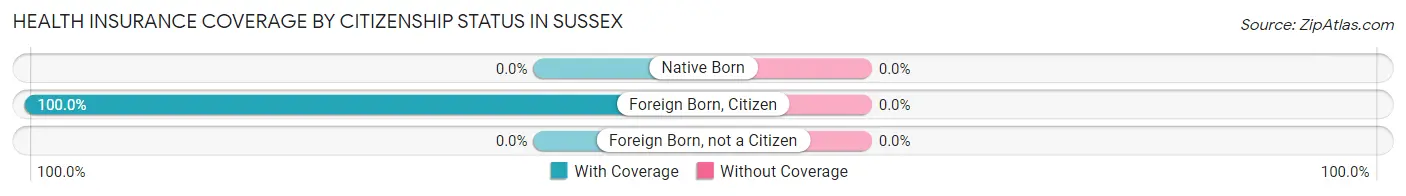
| Citizenship Status | With Coverage | Without Coverage |
| Native Born | 0 (0.0%) | 0 (0.0%) |
| Foreign Born, Citizen | 11 (100.0%) | 0 (0.0%) |
| Foreign Born, not a Citizen | 0 (0.0%) | 0 (0.0%) |
Health Insurance Coverage by Household Income in Sussex
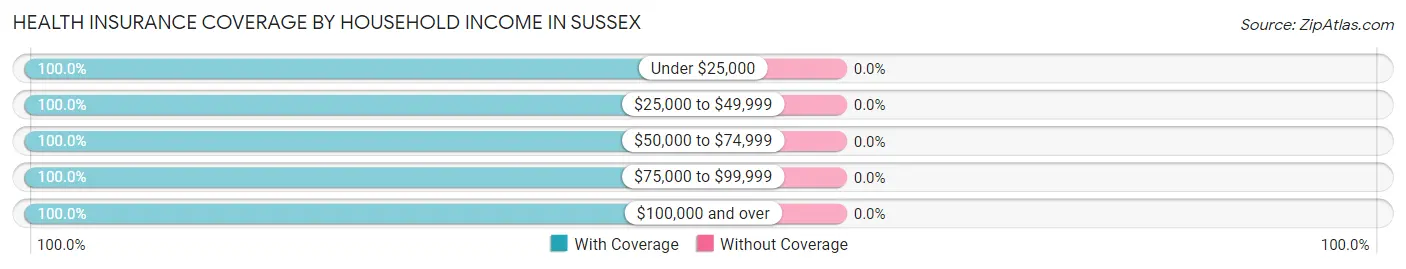
| Household Income | With Coverage | Without Coverage |
| Under $25,000 | 16 (100.0%) | 0 (0.0%) |
| $25,000 to $49,999 | 32 (100.0%) | 0 (0.0%) |
| $50,000 to $74,999 | 19 (100.0%) | 0 (0.0%) |
| $75,000 to $99,999 | 57 (100.0%) | 0 (0.0%) |
| $100,000 and over | 6 (100.0%) | 0 (0.0%) |
Public vs Private Health Insurance Coverage by Age in Sussex
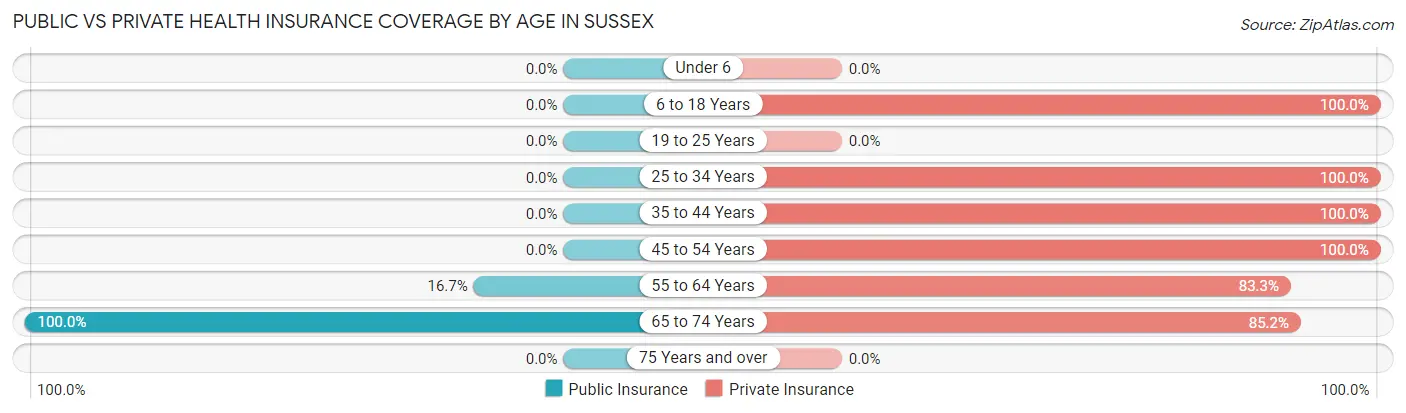
| Age Bracket | Public Insurance | Private Insurance |
| Under 6 | 0 (0.0%) | 0 (0.0%) |
| 6 to 18 Years | 0 (0.0%) | 11 (100.0%) |
| 19 to 25 Years | 0 (0.0%) | 0 (0.0%) |
| 25 to 34 Years | 0 (0.0%) | 9 (100.0%) |
| 35 to 44 Years | 0 (0.0%) | 16 (100.0%) |
| 45 to 54 Years | 0 (0.0%) | 19 (100.0%) |
| 55 to 64 Years | 8 (16.7%) | 40 (83.3%) |
| 65 to 74 Years | 27 (100.0%) | 23 (85.2%) |
| 75 Years and over | 0 (0.0%) | 0 (0.0%) |
| Total | 35 (26.9%) | 118 (90.8%) |
Disability Status by Sex by Age in Sussex
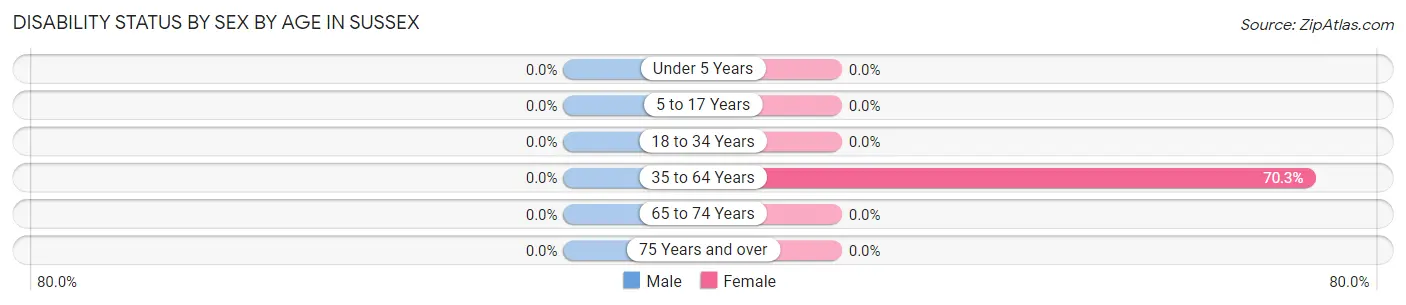
| Age Bracket | Male | Female |
| Under 5 Years | 0 (0.0%) | 0 (0.0%) |
| 5 to 17 Years | 0 (0.0%) | 0 (0.0%) |
| 18 to 34 Years | 0 (0.0%) | 0 (0.0%) |
| 35 to 64 Years | 0 (0.0%) | 45 (70.3%) |
| 65 to 74 Years | 0 (0.0%) | 0 (0.0%) |
| 75 Years and over | 0 (0.0%) | 0 (0.0%) |
Disability Class by Sex by Age in Sussex
Disability Class: Hearing Difficulty
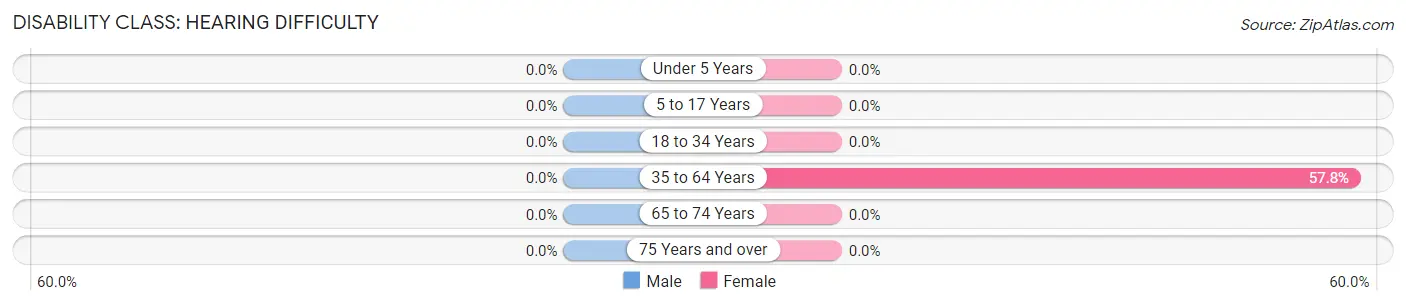
| Age Bracket | Male | Female |
| Under 5 Years | 0 (0.0%) | 0 (0.0%) |
| 5 to 17 Years | 0 (0.0%) | 0 (0.0%) |
| 18 to 34 Years | 0 (0.0%) | 0 (0.0%) |
| 35 to 64 Years | 0 (0.0%) | 37 (57.8%) |
| 65 to 74 Years | 0 (0.0%) | 0 (0.0%) |
| 75 Years and over | 0 (0.0%) | 0 (0.0%) |
Disability Class: Vision Difficulty
| Age Bracket | Male | Female |
| Under 5 Years | 0 (0.0%) | 0 (0.0%) |
| 5 to 17 Years | 0 (0.0%) | 0 (0.0%) |
| 18 to 34 Years | 0 (0.0%) | 0 (0.0%) |
| 35 to 64 Years | 0 (0.0%) | 0 (0.0%) |
| 65 to 74 Years | 0 (0.0%) | 0 (0.0%) |
| 75 Years and over | 0 (0.0%) | 0 (0.0%) |
Disability Class: Cognitive Difficulty
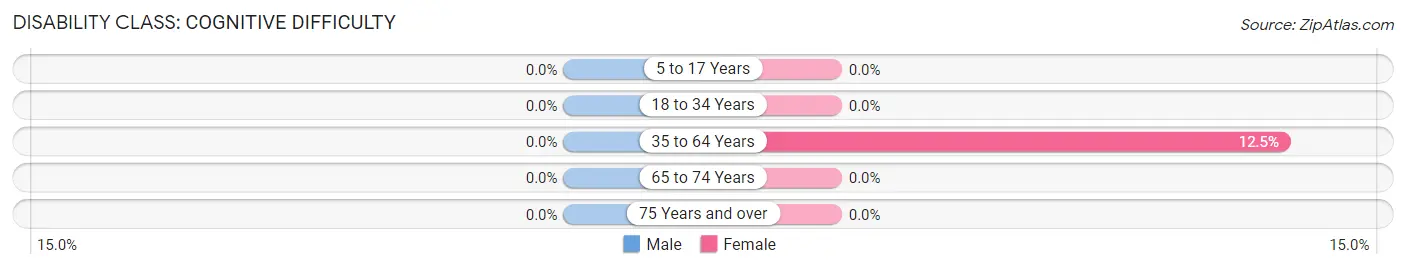
| Age Bracket | Male | Female |
| 5 to 17 Years | 0 (0.0%) | 0 (0.0%) |
| 18 to 34 Years | 0 (0.0%) | 0 (0.0%) |
| 35 to 64 Years | 0 (0.0%) | 8 (12.5%) |
| 65 to 74 Years | 0 (0.0%) | 0 (0.0%) |
| 75 Years and over | 0 (0.0%) | 0 (0.0%) |
Disability Class: Ambulatory Difficulty
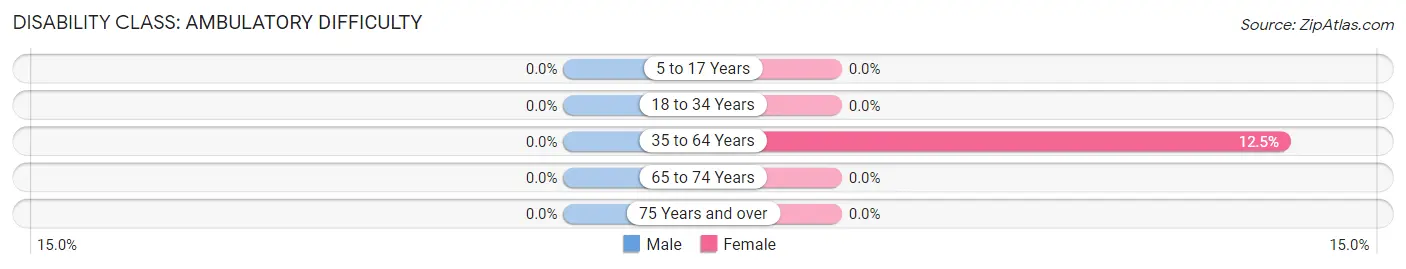
| Age Bracket | Male | Female |
| 5 to 17 Years | 0 (0.0%) | 0 (0.0%) |
| 18 to 34 Years | 0 (0.0%) | 0 (0.0%) |
| 35 to 64 Years | 0 (0.0%) | 8 (12.5%) |
| 65 to 74 Years | 0 (0.0%) | 0 (0.0%) |
| 75 Years and over | 0 (0.0%) | 0 (0.0%) |
Disability Class: Self-Care Difficulty
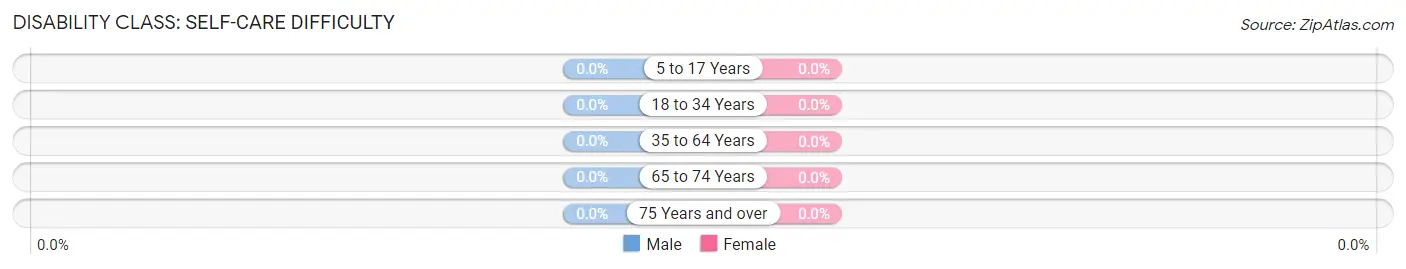
| Age Bracket | Male | Female |
| 5 to 17 Years | 0 (0.0%) | 0 (0.0%) |
| 18 to 34 Years | 0 (0.0%) | 0 (0.0%) |
| 35 to 64 Years | 0 (0.0%) | 0 (0.0%) |
| 65 to 74 Years | 0 (0.0%) | 0 (0.0%) |
| 75 Years and over | 0 (0.0%) | 0 (0.0%) |
Technology Access in Sussex
Computing Device Access in Sussex
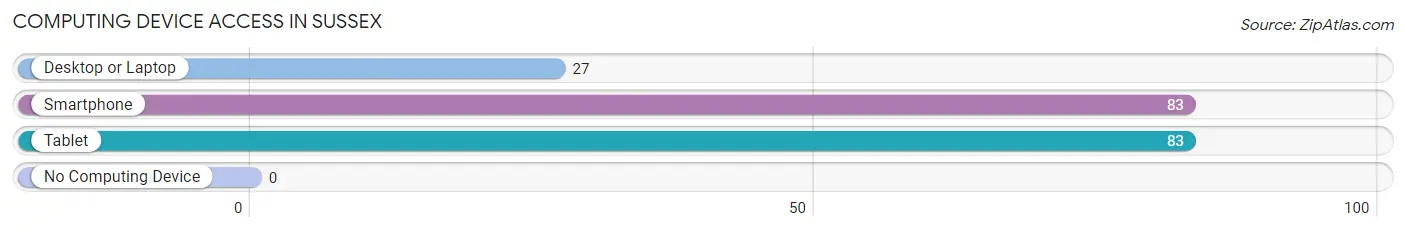
| Device Type | # Households | % Households |
| Desktop or Laptop | 27 | 32.5% |
| Smartphone | 83 | 100.0% |
| Tablet | 83 | 100.0% |
| No Computing Device | 0 | 0.0% |
| Total | 83 | 100.0% |
Internet Access in Sussex
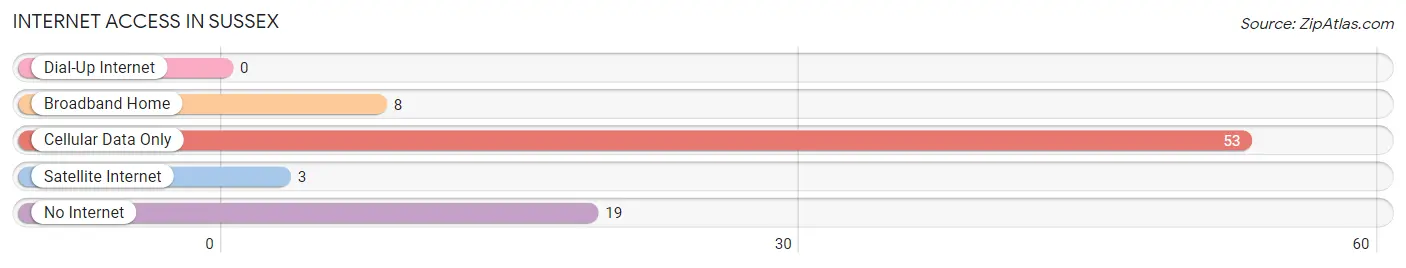
| Internet Type | # Households | % Households |
| Dial-Up Internet | 0 | 0.0% |
| Broadband Home | 8 | 9.6% |
| Cellular Data Only | 53 | 63.9% |
| Satellite Internet | 3 | 3.6% |
| No Internet | 19 | 22.9% |
| Total | 83 | 100.0% |
Sussex Summary
Sussex County, Virginia is located in the southeastern corner of the state, and is part of the Hampton Roads metropolitan area. It is bordered by the cities of Suffolk and Franklin, and the counties of Southampton, Surry, Isle of Wight, and Prince George. The county seat is the town of Sussex, and the county is home to a population of 12,087 people, according to the 2010 census.
Geography
Sussex County is located in the southeastern corner of Virginia, and is part of the Hampton Roads metropolitan area. It is bordered by the cities of Suffolk and Franklin, and the counties of Southampton, Surry, Isle of Wight, and Prince George. The county is located in the Coastal Plain region of Virginia, and is characterized by flat terrain and sandy soils. The county is drained by the Nottoway River, which flows through the county from north to south. The county is also home to several small lakes, including Lake Gaston, Lake Meade, and Lake Drummond.
Economy
The economy of Sussex County is largely based on agriculture and forestry. The county is home to several large farms, and is a major producer of soybeans, corn, and wheat. The county is also home to several large timber companies, which harvest and process timber for use in construction and other industries. In addition, the county is home to several manufacturing companies, including a paper mill and a furniture factory.
Demographics
According to the 2010 census, the population of Sussex County was 12,087 people. The population is largely rural, with the majority of the population living in small towns and rural areas. The racial makeup of the county is 79.3% White, 17.7% African American, 0.5% Native American, 0.3% Asian, 0.1% Pacific Islander, and 2.1% from other races. The median household income in the county is $37,945, and the median age is 41.7 years.
Conclusion
Sussex County, Virginia is a rural county located in the southeastern corner of the state. It is bordered by the cities of Suffolk and Franklin, and the counties of Southampton, Surry, Isle of Wight, and Prince George. The county is home to a population of 12,087 people, and the economy is largely based on agriculture and forestry. The racial makeup of the county is 79.3% White, 17.7% African American, 0.5% Native American, 0.3% Asian, 0.1% Pacific Islander, and 2.1% from other races. The median household income in the county is $37,945, and the median age is 41.7 years.
Common Questions
What is Per Capita Income in Sussex?
Per Capita income in Sussex is $28,027.
What is the Median Family Income in Sussex?
Median Family Income in Sussex is $78,581.
What is the Median Household income in Sussex?
Median Household Income in Sussex is $54,803.
What is Inequality or Gini Index in Sussex?
Inequality or Gini Index in Sussex is 0.28.
What is the Total Population of Sussex?
Total Population of Sussex is 145.
What is the Total Male Population of Sussex?
Total Male Population of Sussex is 76.
What is the Total Female Population of Sussex?
Total Female Population of Sussex is 69.
What is the Ratio of Males per 100 Females in Sussex?
There are 110.14 Males per 100 Females in Sussex.
What is the Ratio of Females per 100 Males in Sussex?
There are 90.79 Females per 100 Males in Sussex.
What is the Median Population Age in Sussex?
Median Population Age in Sussex is 58.3 Years.
What is the Average Family Size in Sussex
Average Family Size in Sussex is 2.0 People.
What is the Average Household Size in Sussex
Average Household Size in Sussex is 1.6 People.
How Large is the Labor Force in Sussex?
There are 111 People in the Labor Forcein in Sussex.
What is the Percentage of People in the Labor Force in Sussex?
82.8% of People are in the Labor Force in Sussex.
What is the Unemployment Rate in Sussex?
Unemployment Rate in Sussex is 2.7%.