Zip Codes with the Highest Percentage of Population Employed in Security & Protection in Radford, VA
RELATED REPORTS & OPTIONS
Security & Protection
Radford
Compare Zip Codes
Map of Zip Codes with the Highest Percentage of Population Employed in Security & Protection in Radford
0.83%
2.5%
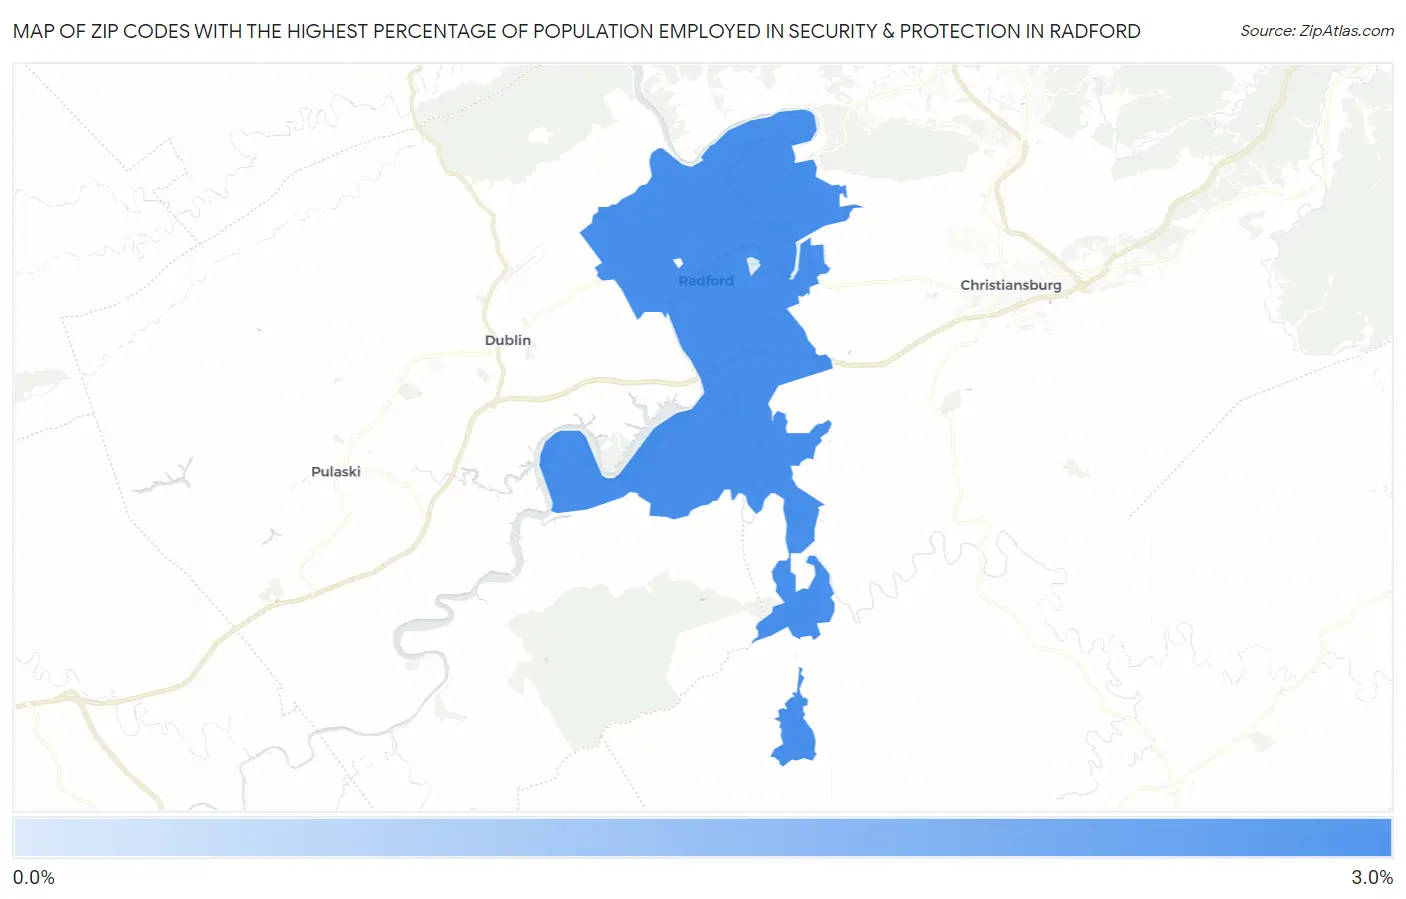
Zip Codes with the Highest Percentage of Population Employed in Security & Protection in Radford, VA
| Zip Code | % Employed | vs State | vs National | |
| 1. | 24141 | 2.5% | 2.7%(-0.180)#369 | 2.1%(+0.353)#9,499 |
| 2. | 24142 | 0.83% | 2.7%(-1.85)#606 | 2.1%(-1.32)#21,250 |
1
Common Questions
What are the Top Zip Codes with the Highest Percentage of Population Employed in Security & Protection in Radford, VA?
Top Zip Codes with the Highest Percentage of Population Employed in Security & Protection in Radford, VA are:
What zip code has the Highest Percentage of Population Employed in Security & Protection in Radford, VA?
24141 has the Highest Percentage of Population Employed in Security & Protection in Radford, VA with 2.5%.
What is the Percentage of Population Employed in Security & Protection in Radford, VA?
Percentage of Population Employed in Security & Protection in Radford is 1.4%.
What is the Percentage of Population Employed in Security & Protection in Virginia?
Percentage of Population Employed in Security & Protection in Virginia is 2.7%.
What is the Percentage of Population Employed in Security & Protection in the United States?
Percentage of Population Employed in Security & Protection in the United States is 2.1%.