Quantico, VA Map & Demographics
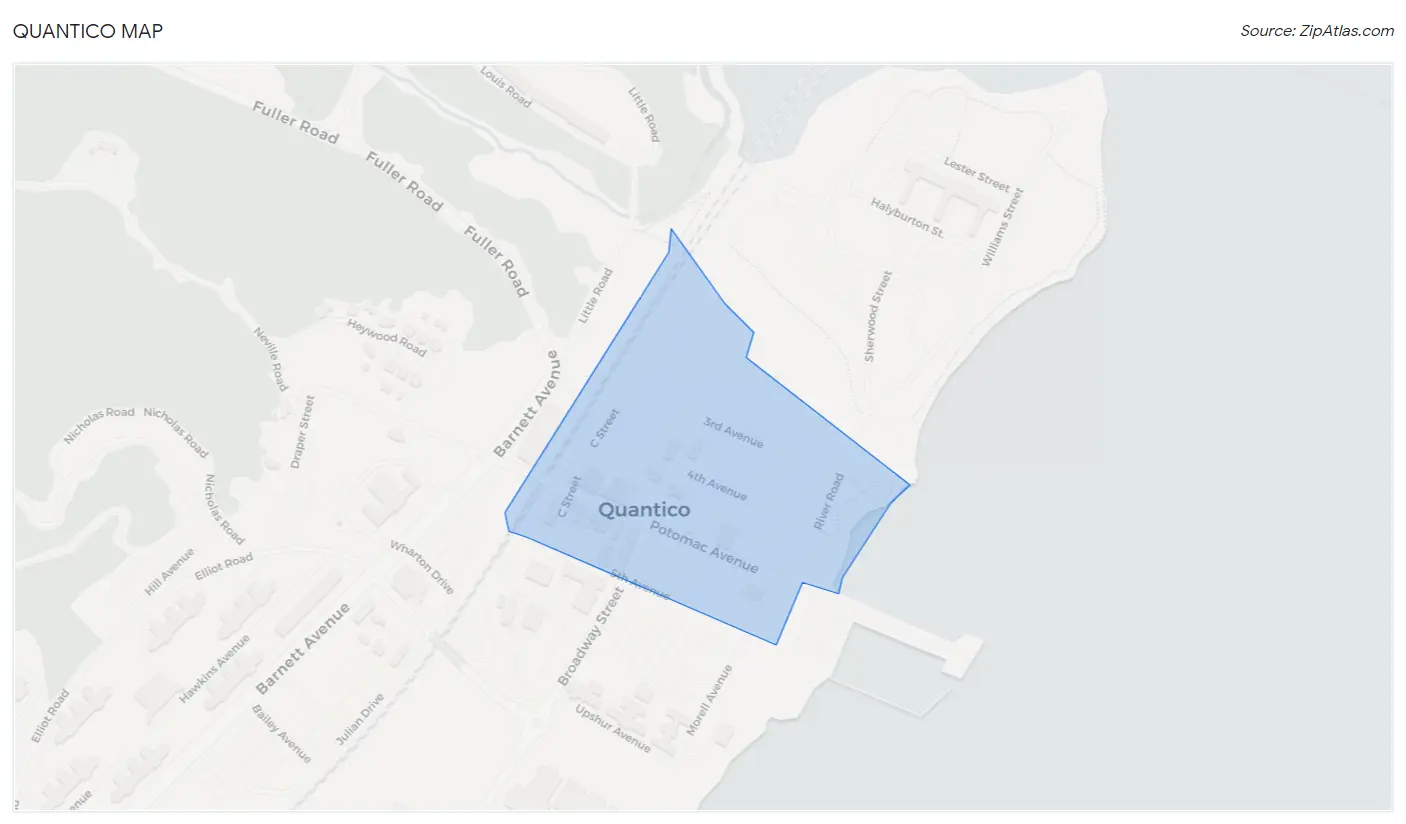
Quantico Map
Quantico Overview
$42,014
PER CAPITA INCOME
$85,278
AVG FAMILY INCOME
$51,611
AVG HOUSEHOLD INCOME
48.3%
WAGE / INCOME GAP [ % ]
51.7¢/ $1
WAGE / INCOME GAP [ $ ]
0.46
INEQUALITY / GINI INDEX
543
TOTAL POPULATION
244
MALE POPULATION
299
FEMALE POPULATION
81.61
MALES / 100 FEMALES
122.54
FEMALES / 100 MALES
41.1
MEDIAN AGE
2.8
AVG FAMILY SIZE
1.8
AVG HOUSEHOLD SIZE
375
LABOR FORCE [ PEOPLE ]
78.8%
PERCENT IN LABOR FORCE
4.5%
UNEMPLOYMENT RATE
Quantico Zip Codes
Quantico Area Codes
Income in Quantico
Income Overview in Quantico
Per Capita Income in Quantico is $42,014, while median incomes of families and households are $85,278 and $51,611 respectively.
| Characteristic | Number | Measure |
| Per Capita Income | 543 | $42,014 |
| Median Family Income | 108 | $85,278 |
| Mean Family Income | 108 | $105,658 |
| Median Household Income | 310 | $51,611 |
| Mean Household Income | 310 | $72,119 |
| Income Deficit | 108 | $0 |
| Wage / Income Gap (%) | 543 | 48.28% |
| Wage / Income Gap ($) | 543 | 51.72¢ per $1 |
| Gini / Inequality Index | 543 | 0.46 |
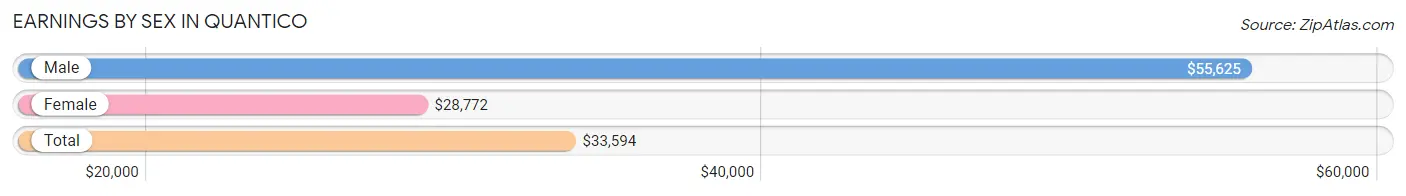
Earnings by Sex in Quantico
Average Earnings in Quantico are $33,594, $55,625 for men and $28,772 for women, a difference of 48.3%.
| Sex | Number | Average Earnings |
| Male | 163 (43.6%) | $55,625 |
| Female | 211 (56.4%) | $28,772 |
| Total | 374 (100.0%) | $33,594 |
Earnings by Sex by Income Bracket in Quantico
The most common earnings brackets in Quantico are $100,000+ for men (46 | 28.2%) and $25,000 to $29,999 for women (56 | 26.5%).
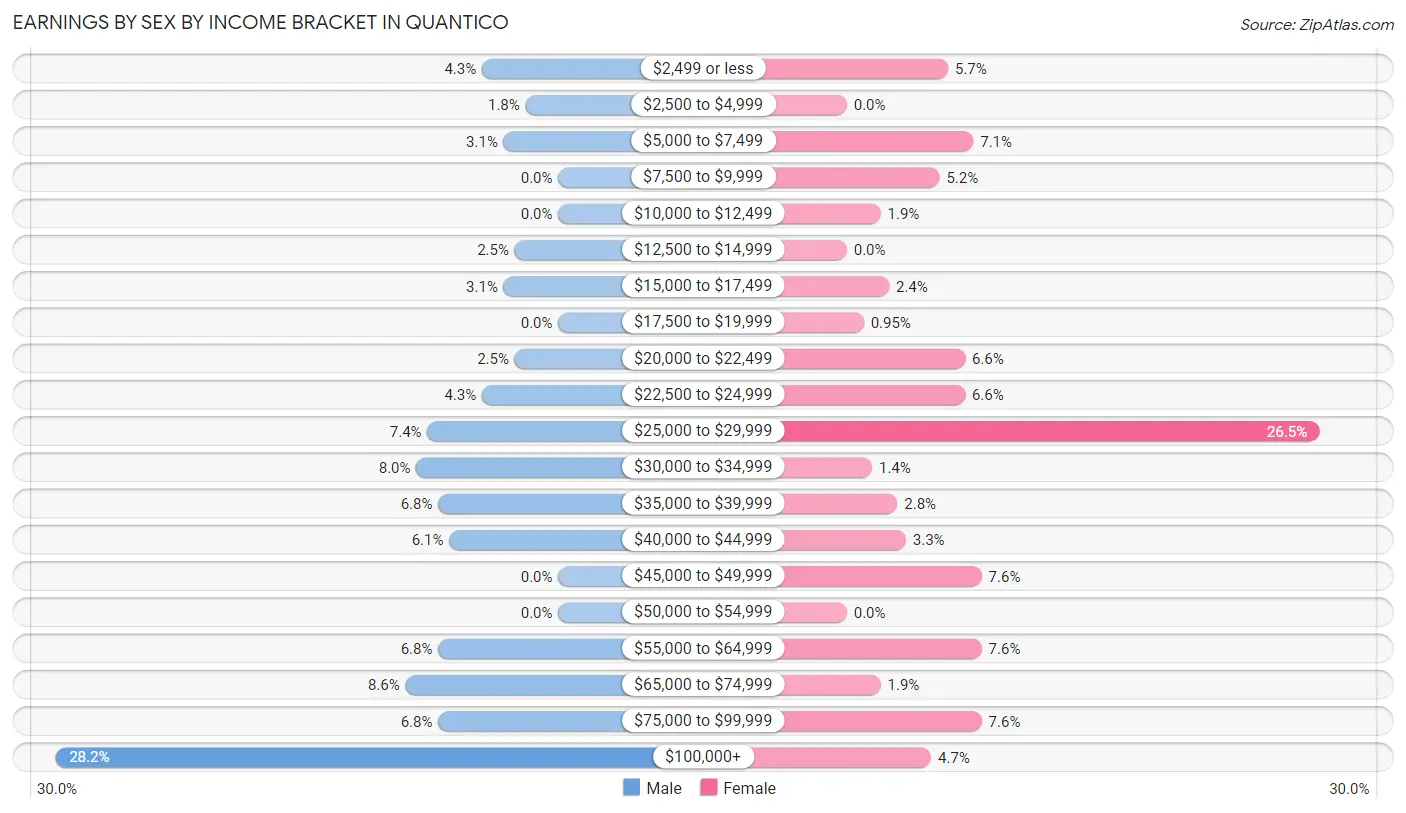
| Income | Male | Female |
| $2,499 or less | 7 (4.3%) | 12 (5.7%) |
| $2,500 to $4,999 | 3 (1.8%) | 0 (0.0%) |
| $5,000 to $7,499 | 5 (3.1%) | 15 (7.1%) |
| $7,500 to $9,999 | 0 (0.0%) | 11 (5.2%) |
| $10,000 to $12,499 | 0 (0.0%) | 4 (1.9%) |
| $12,500 to $14,999 | 4 (2.5%) | 0 (0.0%) |
| $15,000 to $17,499 | 5 (3.1%) | 5 (2.4%) |
| $17,500 to $19,999 | 0 (0.0%) | 2 (0.9%) |
| $20,000 to $22,499 | 4 (2.5%) | 14 (6.6%) |
| $22,500 to $24,999 | 7 (4.3%) | 14 (6.6%) |
| $25,000 to $29,999 | 12 (7.4%) | 56 (26.5%) |
| $30,000 to $34,999 | 13 (8.0%) | 3 (1.4%) |
| $35,000 to $39,999 | 11 (6.8%) | 6 (2.8%) |
| $40,000 to $44,999 | 10 (6.1%) | 7 (3.3%) |
| $45,000 to $49,999 | 0 (0.0%) | 16 (7.6%) |
| $50,000 to $54,999 | 0 (0.0%) | 0 (0.0%) |
| $55,000 to $64,999 | 11 (6.8%) | 16 (7.6%) |
| $65,000 to $74,999 | 14 (8.6%) | 4 (1.9%) |
| $75,000 to $99,999 | 11 (6.8%) | 16 (7.6%) |
| $100,000+ | 46 (28.2%) | 10 (4.7%) |
| Total | 163 (100.0%) | 211 (100.0%) |
Earnings by Sex by Educational Attainment in Quantico
Average earnings in Quantico are $59,028 for men and $29,120 for women, a difference of 50.7%. Men with an educational attainment of graduate degree enjoy the highest average annual earnings of $134,167, while those with high school diploma education earn the least with $39,659. Women with an educational attainment of bachelor's degree earn the most with the average annual earnings of $29,556, while those with bachelor's degree education have the smallest earnings of $29,556.
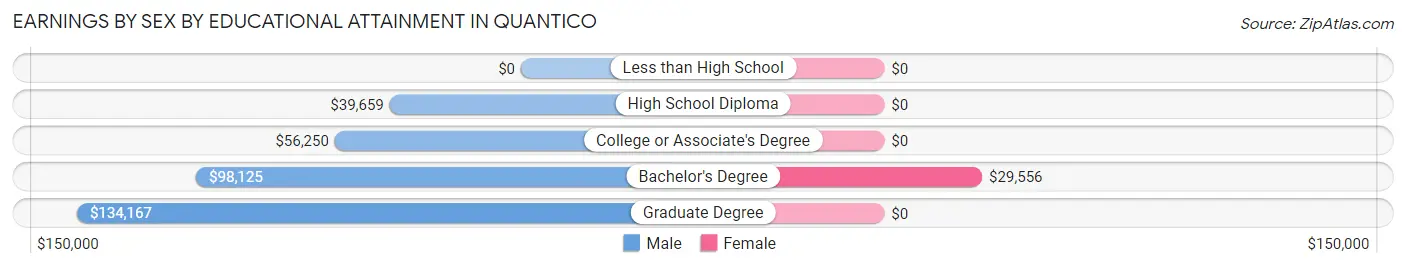
| Educational Attainment | Male Income | Female Income |
| Less than High School | - | - |
| High School Diploma | $39,659 | $0 |
| College or Associate's Degree | $56,250 | $0 |
| Bachelor's Degree | $98,125 | $29,556 |
| Graduate Degree | $134,167 | $0 |
| Total | $59,028 | $29,120 |
Family Income in Quantico
Family Income Brackets in Quantico
According to the Quantico family income data, there are 32 families falling into the $50,000 to $74,999 income range, which is the most common income bracket and makes up 29.6% of all families.
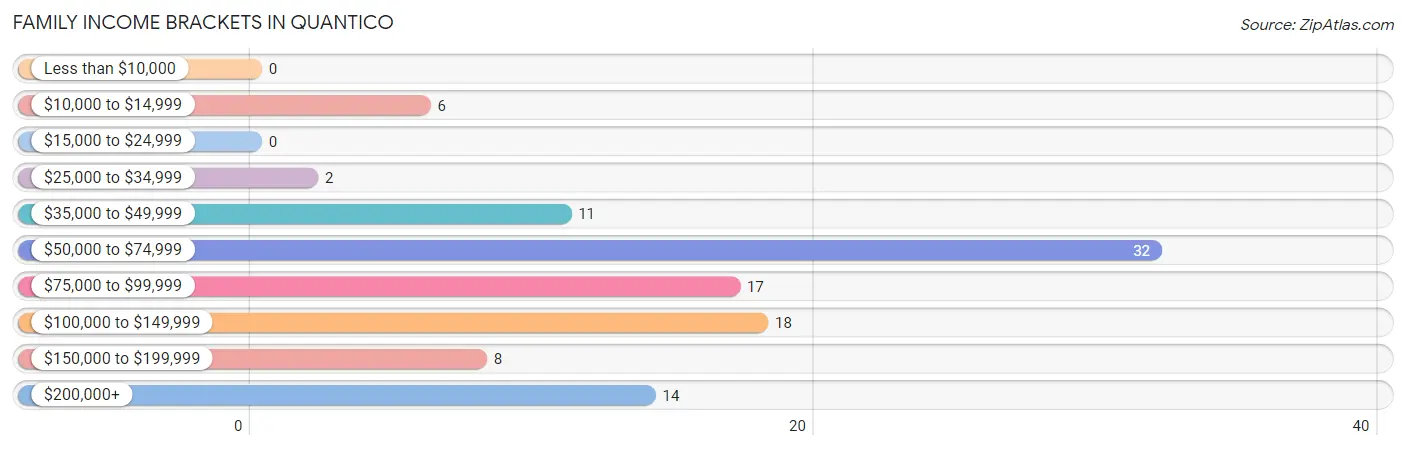
| Income Bracket | # Families | % Families |
| Less than $10,000 | 0 | 0.0% |
| $10,000 to $14,999 | 6 | 5.6% |
| $15,000 to $24,999 | 0 | 0.0% |
| $25,000 to $34,999 | 2 | 1.9% |
| $35,000 to $49,999 | 11 | 10.2% |
| $50,000 to $74,999 | 32 | 29.6% |
| $75,000 to $99,999 | 17 | 15.7% |
| $100,000 to $149,999 | 18 | 16.7% |
| $150,000 to $199,999 | 8 | 7.4% |
| $200,000+ | 14 | 13.0% |
Family Income by Famaliy Size in Quantico
3-person families (32 | 29.6%) account for the highest median family income in Quantico with $98,333 per family, while 3-person families (32 | 29.6%) have the highest median income of $32,778 per family member.
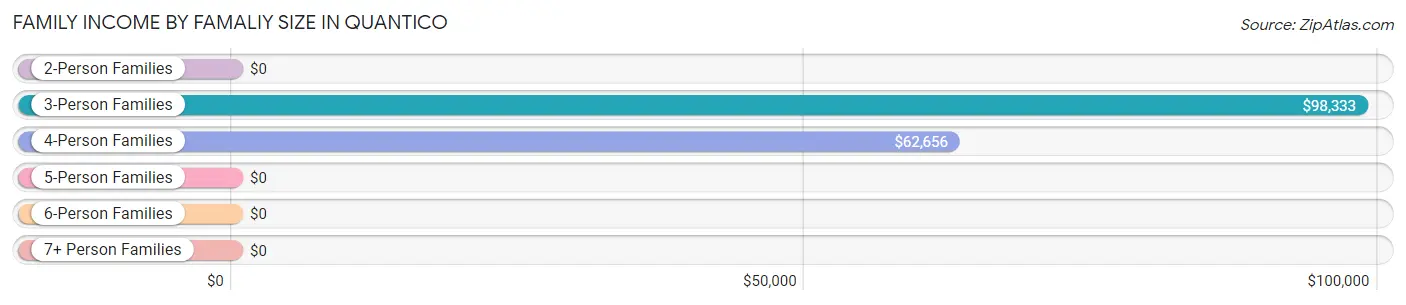
| Income Bracket | # Families | Median Income |
| 2-Person Families | 55 (50.9%) | $0 |
| 3-Person Families | 32 (29.6%) | $98,333 |
| 4-Person Families | 19 (17.6%) | $62,656 |
| 5-Person Families | 2 (1.8%) | $0 |
| 6-Person Families | 0 (0.0%) | $0 |
| 7+ Person Families | 0 (0.0%) | $0 |
| Total | 108 (100.0%) | $85,278 |
Family Income by Number of Earners in Quantico
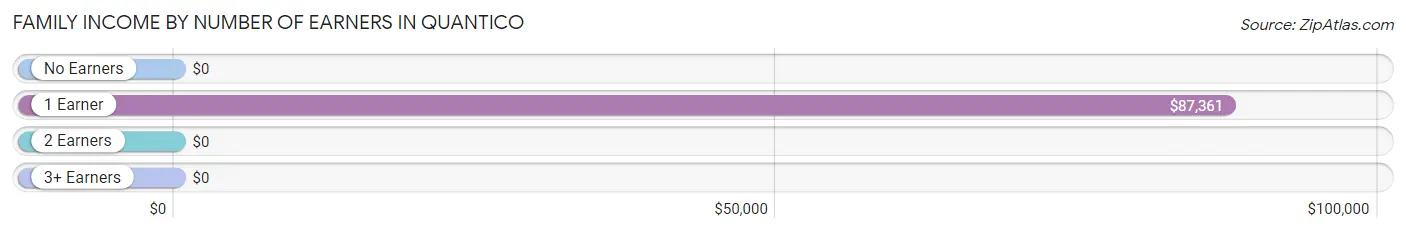
| Number of Earners | # Families | Median Income |
| No Earners | 10 (9.3%) | $0 |
| 1 Earner | 39 (36.1%) | $87,361 |
| 2 Earners | 56 (51.8%) | $0 |
| 3+ Earners | 3 (2.8%) | $0 |
| Total | 108 (100.0%) | $85,278 |
Household Income in Quantico
Household Income Brackets in Quantico
With 74 households falling in the category, the $50,000 to $74,999 income range is the most frequent in Quantico, accounting for 23.9% of all households. In contrast, only 8 households (2.6%) fall into the $150,000 to $199,999 income bracket, making it the least populous group.
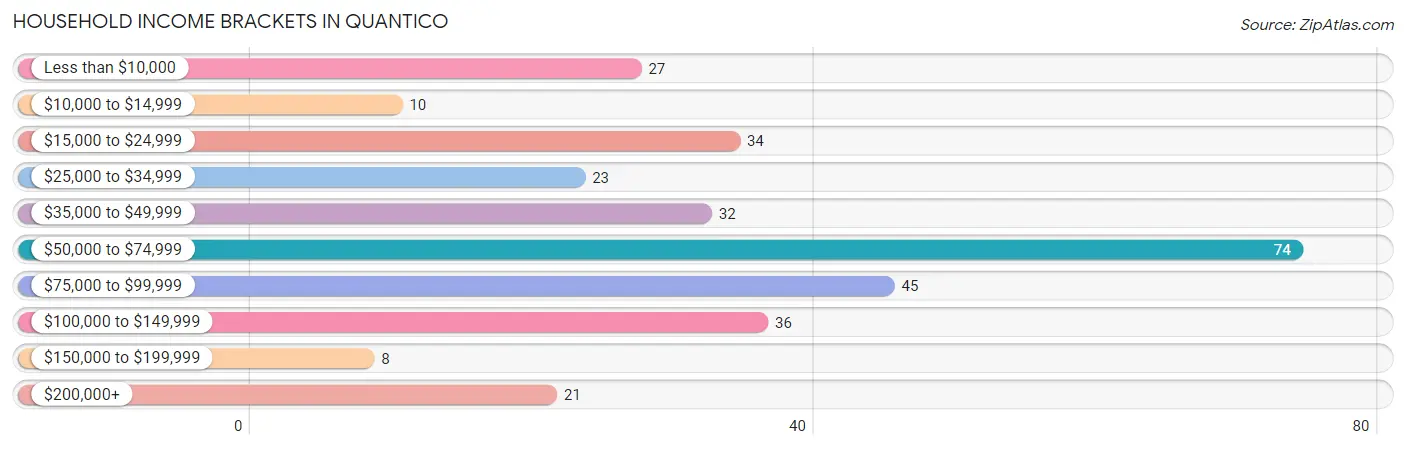
| Income Bracket | # Households | % Households |
| Less than $10,000 | 27 | 8.7% |
| $10,000 to $14,999 | 10 | 3.2% |
| $15,000 to $24,999 | 34 | 11.0% |
| $25,000 to $34,999 | 23 | 7.4% |
| $35,000 to $49,999 | 32 | 10.3% |
| $50,000 to $74,999 | 74 | 23.9% |
| $75,000 to $99,999 | 45 | 14.5% |
| $100,000 to $149,999 | 36 | 11.6% |
| $150,000 to $199,999 | 8 | 2.6% |
| $200,000+ | 21 | 6.8% |
Household Income by Householder Age in Quantico
The median household income in Quantico is $51,611, with the highest median household income of $64,808 found in the 25 to 44 years age bracket for the primary householder. A total of 108 households (34.8%) fall into this category. Meanwhile, the 65+ years age bracket for the primary householder has the lowest median household income of $0, with 41 households (13.2%) in this group.
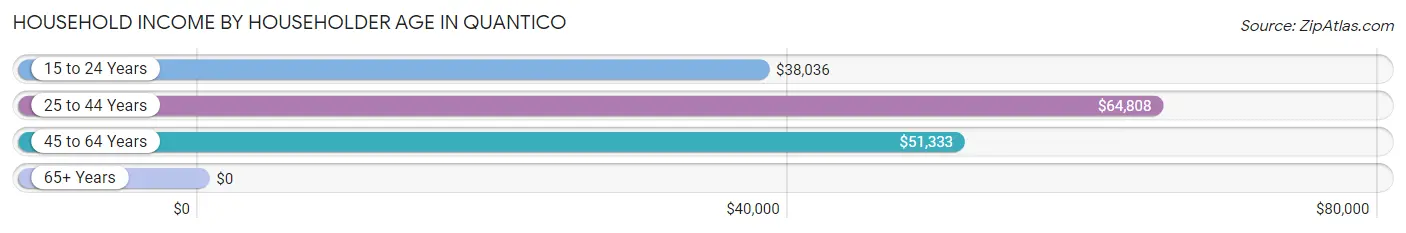
| Income Bracket | # Households | Median Income |
| 15 to 24 Years | 11 (3.5%) | $38,036 |
| 25 to 44 Years | 108 (34.8%) | $64,808 |
| 45 to 64 Years | 150 (48.4%) | $51,333 |
| 65+ Years | 41 (13.2%) | $0 |
| Total | 310 (100.0%) | $51,611 |
Poverty in Quantico
Income Below Poverty by Sex and Age in Quantico
With 13.1% poverty level for males and 11.4% for females among the residents of Quantico, 25 to 34 year old males and 75 year old and over females are the most vulnerable to poverty, with 15 males (31.2%) and 6 females (31.6%) in their respective age groups living below the poverty level.
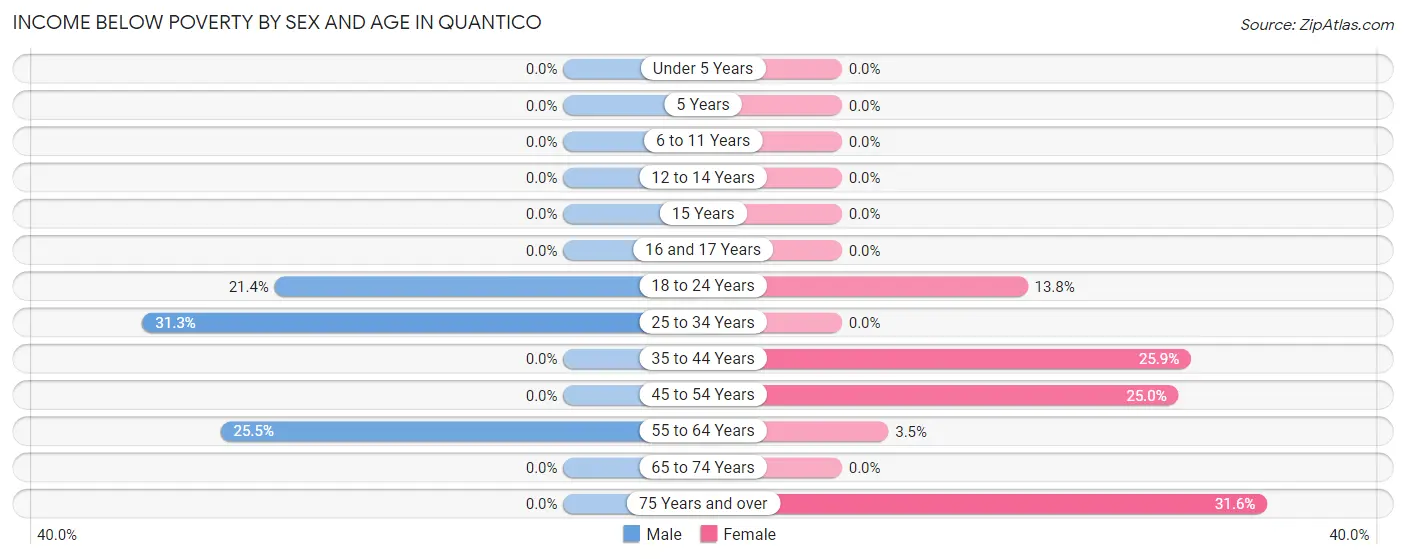
| Age Bracket | Male | Female |
| Under 5 Years | 0 (0.0%) | 0 (0.0%) |
| 5 Years | 0 (0.0%) | 0 (0.0%) |
| 6 to 11 Years | 0 (0.0%) | 0 (0.0%) |
| 12 to 14 Years | 0 (0.0%) | 0 (0.0%) |
| 15 Years | 0 (0.0%) | 0 (0.0%) |
| 16 and 17 Years | 0 (0.0%) | 0 (0.0%) |
| 18 to 24 Years | 3 (21.4%) | 4 (13.8%) |
| 25 to 34 Years | 15 (31.2%) | 0 (0.0%) |
| 35 to 44 Years | 0 (0.0%) | 7 (25.9%) |
| 45 to 54 Years | 0 (0.0%) | 15 (25.0%) |
| 55 to 64 Years | 14 (25.5%) | 2 (3.5%) |
| 65 to 74 Years | 0 (0.0%) | 0 (0.0%) |
| 75 Years and over | 0 (0.0%) | 6 (31.6%) |
| Total | 32 (13.1%) | 34 (11.4%) |
Income Above Poverty by Sex and Age in Quantico
According to the poverty statistics in Quantico, males aged under 5 years and females aged under 5 years are the age groups that are most secure financially, with 100.0% of males and 100.0% of females in these age groups living above the poverty line.
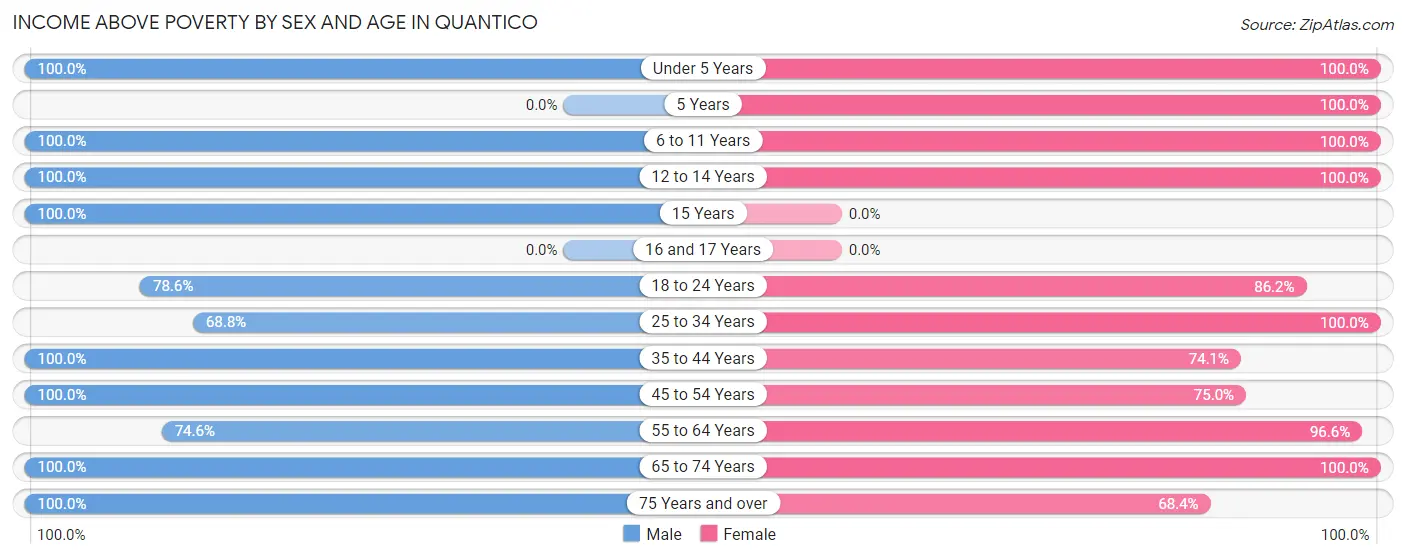
| Age Bracket | Male | Female |
| Under 5 Years | 3 (100.0%) | 7 (100.0%) |
| 5 Years | 0 (0.0%) | 9 (100.0%) |
| 6 to 11 Years | 29 (100.0%) | 1 (100.0%) |
| 12 to 14 Years | 4 (100.0%) | 12 (100.0%) |
| 15 Years | 2 (100.0%) | 0 (0.0%) |
| 16 and 17 Years | 0 (0.0%) | 0 (0.0%) |
| 18 to 24 Years | 11 (78.6%) | 25 (86.2%) |
| 25 to 34 Years | 33 (68.8%) | 71 (100.0%) |
| 35 to 44 Years | 32 (100.0%) | 20 (74.1%) |
| 45 to 54 Years | 31 (100.0%) | 45 (75.0%) |
| 55 to 64 Years | 41 (74.6%) | 56 (96.6%) |
| 65 to 74 Years | 16 (100.0%) | 6 (100.0%) |
| 75 Years and over | 10 (100.0%) | 13 (68.4%) |
| Total | 212 (86.9%) | 265 (88.6%) |
Income Below Poverty Among Married-Couple Families in Quantico
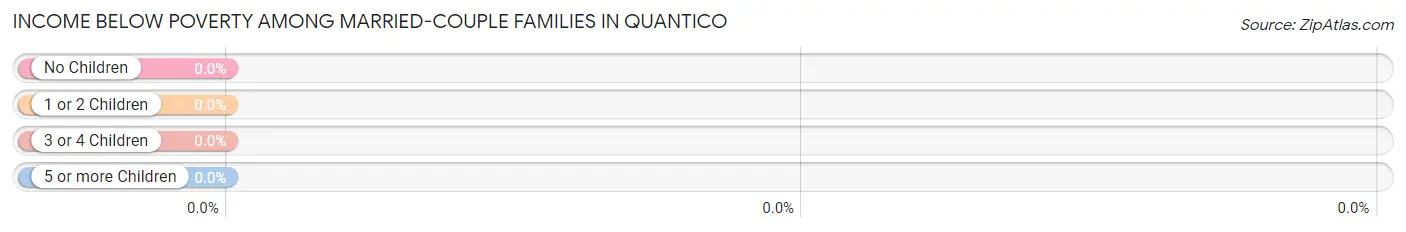
| Children | Above Poverty | Below Poverty |
| No Children | 37 (100.0%) | 0 (0.0%) |
| 1 or 2 Children | 36 (100.0%) | 0 (0.0%) |
| 3 or 4 Children | 0 (0.0%) | 0 (0.0%) |
| 5 or more Children | 0 (0.0%) | 0 (0.0%) |
| Total | 73 (100.0%) | 0 (0.0%) |
Income Below Poverty Among Single-Parent Households in Quantico
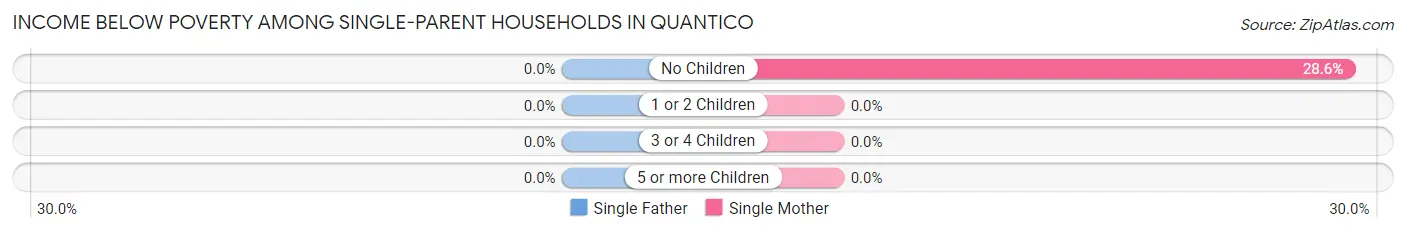
| Children | Single Father | Single Mother |
| No Children | 0 (0.0%) | 6 (28.6%) |
| 1 or 2 Children | 0 (0.0%) | 0 (0.0%) |
| 3 or 4 Children | 0 (0.0%) | 0 (0.0%) |
| 5 or more Children | 0 (0.0%) | 0 (0.0%) |
| Total | 0 (0.0%) | 6 (18.2%) |
Income Below Poverty Among Married-Couple vs Single-Parent Households in Quantico
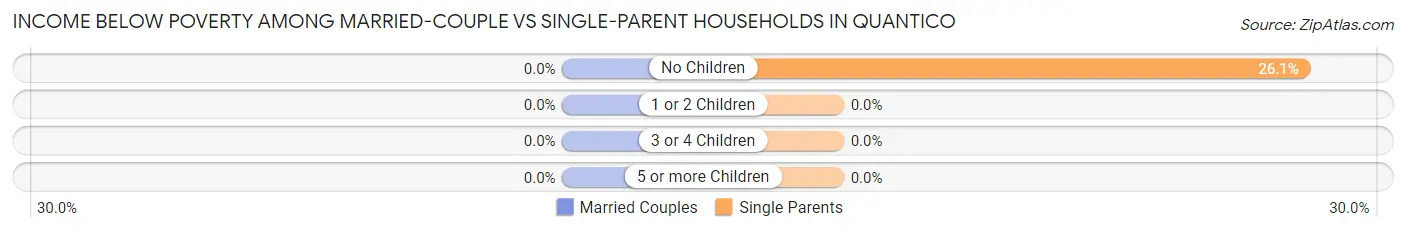
| Children | Married-Couple Families | Single-Parent Households |
| No Children | 0 (0.0%) | 6 (26.1%) |
| 1 or 2 Children | 0 (0.0%) | 0 (0.0%) |
| 3 or 4 Children | 0 (0.0%) | 0 (0.0%) |
| 5 or more Children | 0 (0.0%) | 0 (0.0%) |
| Total | 0 (0.0%) | 6 (17.1%) |
Race in Quantico
The most populous races in Quantico are White / Caucasian (280 | 51.6%), Black / African American (158 | 29.1%), and Hispanic or Latino (87 | 16.0%).
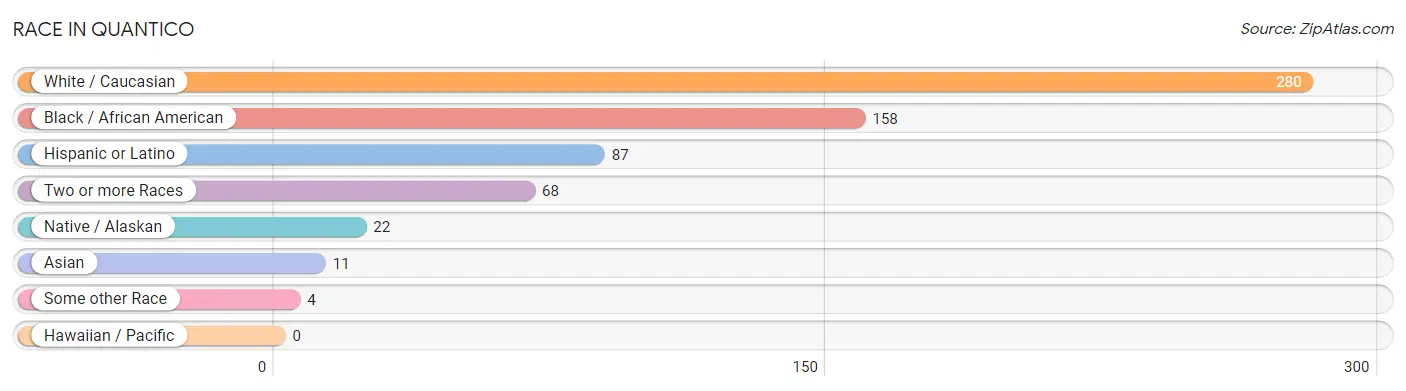
| Race | # Population | % Population |
| Asian | 11 | 2.0% |
| Black / African American | 158 | 29.1% |
| Hawaiian / Pacific | 0 | 0.0% |
| Hispanic or Latino | 87 | 16.0% |
| Native / Alaskan | 22 | 4.1% |
| White / Caucasian | 280 | 51.6% |
| Two or more Races | 68 | 12.5% |
| Some other Race | 4 | 0.7% |
| Total | 543 | 100.0% |
Ancestry in Quantico
The most populous ancestries reported in Quantico are German (63 | 11.6%), English (51 | 9.4%), Greek (33 | 6.1%), Mexican (31 | 5.7%), and American (23 | 4.2%), together accounting for 37.0% of all Quantico residents.
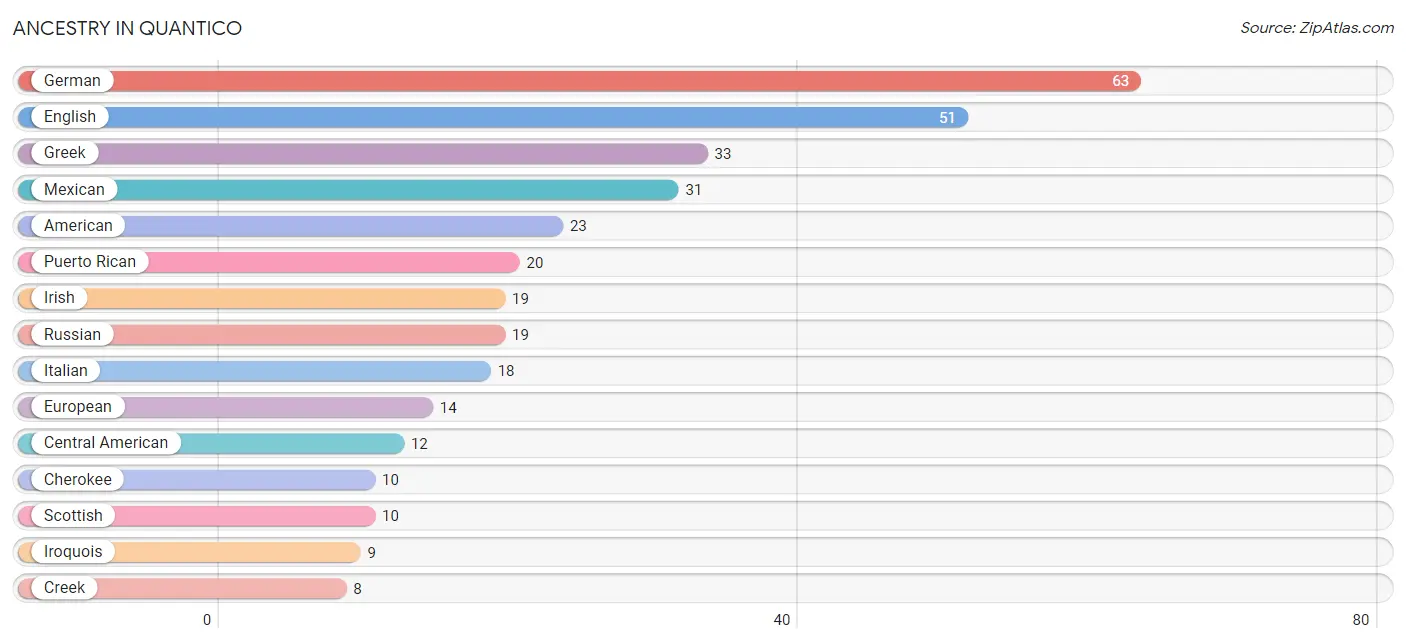
| Ancestry | # Population | % Population |
| African | 4 | 0.7% |
| American | 23 | 4.2% |
| Arab | 7 | 1.3% |
| Belgian | 2 | 0.4% |
| British | 5 | 0.9% |
| Burmese | 6 | 1.1% |
| Central American | 12 | 2.2% |
| Cherokee | 10 | 1.8% |
| Creek | 8 | 1.5% |
| Croatian | 2 | 0.4% |
| Dominican | 3 | 0.5% |
| Dutch | 6 | 1.1% |
| English | 51 | 9.4% |
| European | 14 | 2.6% |
| French | 7 | 1.3% |
| German | 63 | 11.6% |
| Greek | 33 | 6.1% |
| Guatemalan | 4 | 0.7% |
| Haitian | 5 | 0.9% |
| Honduran | 3 | 0.5% |
| Irish | 19 | 3.5% |
| Iroquois | 9 | 1.7% |
| Italian | 18 | 3.3% |
| Korean | 4 | 0.7% |
| Laotian | 2 | 0.4% |
| Lebanese | 7 | 1.3% |
| Mexican | 31 | 5.7% |
| Mongolian | 2 | 0.4% |
| Northern European | 2 | 0.4% |
| Pakistani | 2 | 0.4% |
| Polish | 8 | 1.5% |
| Puerto Rican | 20 | 3.7% |
| Russian | 19 | 3.5% |
| Salvadoran | 5 | 0.9% |
| Scottish | 10 | 1.8% |
| Sri Lankan | 5 | 0.9% |
| Subsaharan African | 4 | 0.7% |
| Swedish | 7 | 1.3% |
| Welsh | 2 | 0.4% | View All 39 Rows |
Immigrants in Quantico
The most numerous immigrant groups reported in Quantico came from Asia (25 | 4.6%), Latin America (13 | 2.4%), South Central Asia (11 | 2.0%), Kazakhstan (10 | 1.8%), and Europe (9 | 1.7%), together accounting for 12.5% of all Quantico residents.
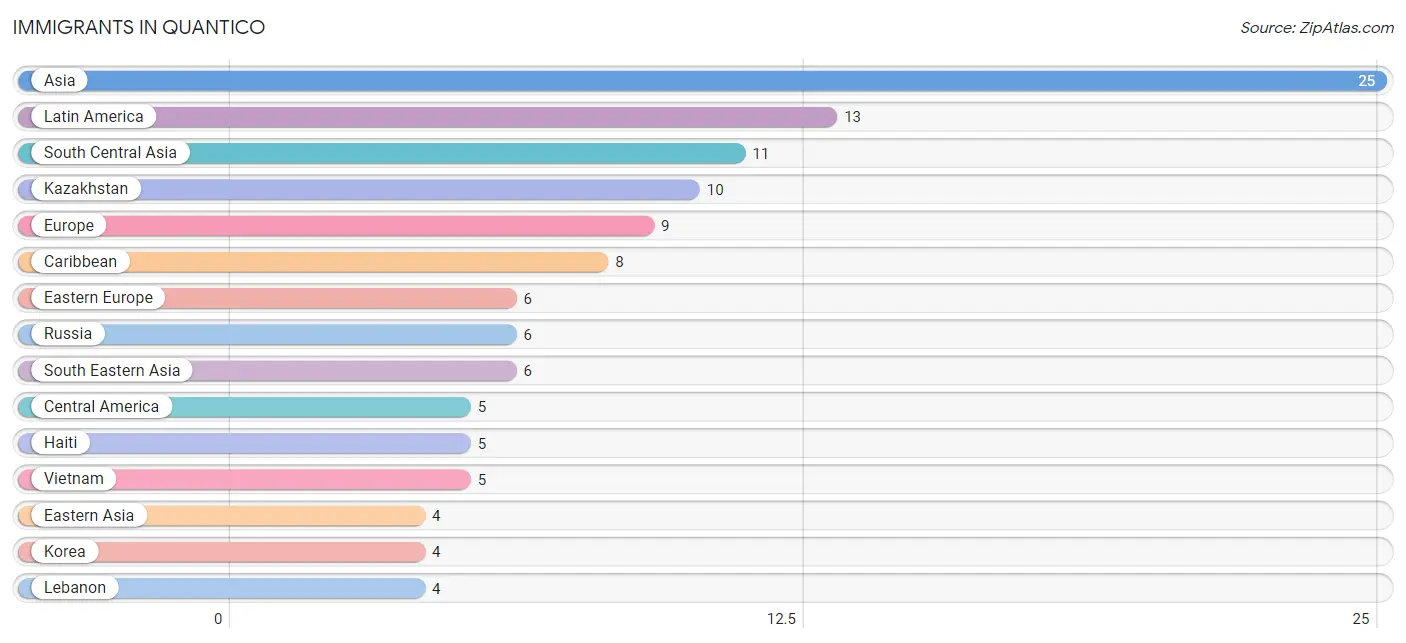
| Immigration Origin | # Population | % Population |
| Asia | 25 | 4.6% |
| Caribbean | 8 | 1.5% |
| Central America | 5 | 0.9% |
| Dominican Republic | 3 | 0.5% |
| Eastern Asia | 4 | 0.7% |
| Eastern Europe | 6 | 1.1% |
| Europe | 9 | 1.7% |
| Germany | 3 | 0.5% |
| Haiti | 5 | 0.9% |
| Honduras | 3 | 0.5% |
| India | 1 | 0.2% |
| Kazakhstan | 10 | 1.8% |
| Korea | 4 | 0.7% |
| Latin America | 13 | 2.4% |
| Lebanon | 4 | 0.7% |
| Mexico | 2 | 0.4% |
| Philippines | 1 | 0.2% |
| Russia | 6 | 1.1% |
| South Central Asia | 11 | 2.0% |
| South Eastern Asia | 6 | 1.1% |
| Vietnam | 5 | 0.9% |
| Western Asia | 4 | 0.7% |
| Western Europe | 3 | 0.5% | View All 23 Rows |
Sex and Age in Quantico
Sex and Age in Quantico
The most populous age groups in Quantico are 55 to 59 Years (36 | 14.7%) for men and 25 to 29 Years (53 | 17.7%) for women.
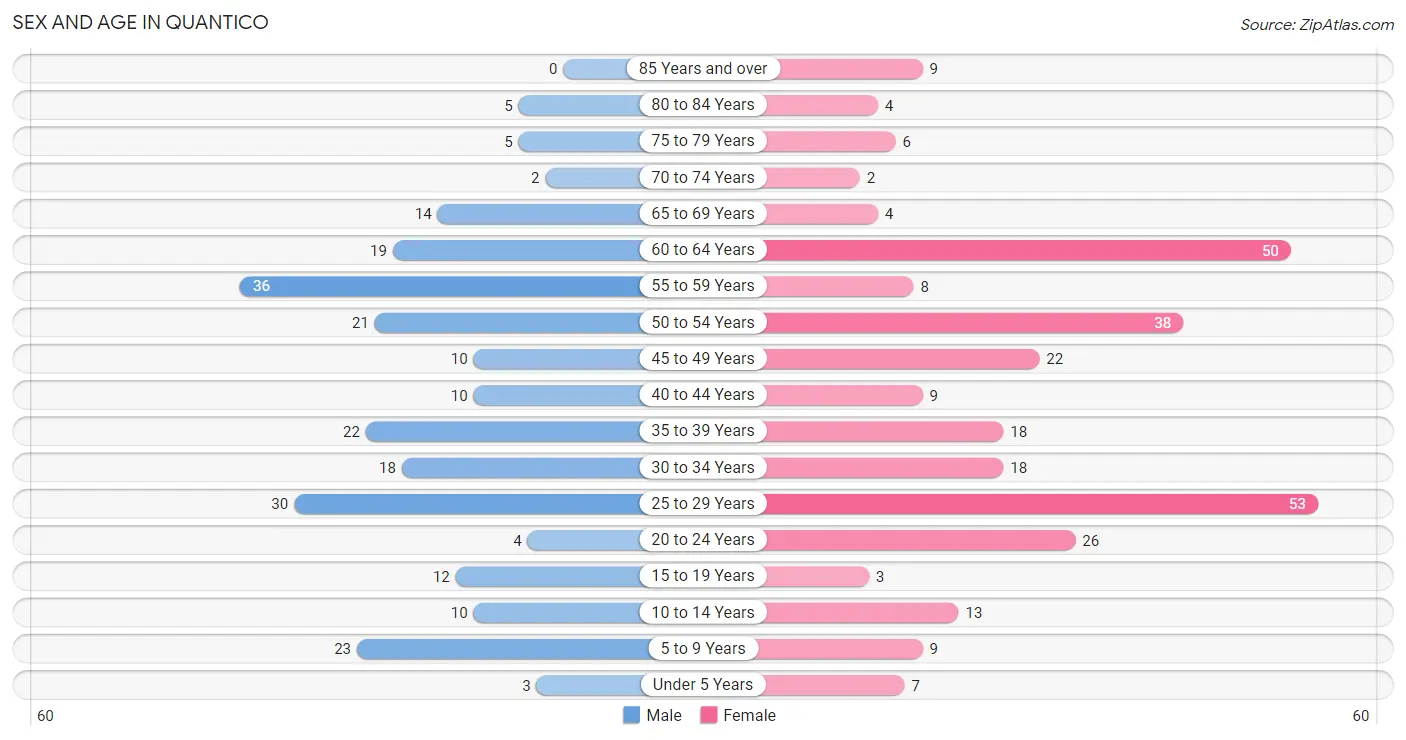
| Age Bracket | Male | Female |
| Under 5 Years | 3 (1.2%) | 7 (2.3%) |
| 5 to 9 Years | 23 (9.4%) | 9 (3.0%) |
| 10 to 14 Years | 10 (4.1%) | 13 (4.3%) |
| 15 to 19 Years | 12 (4.9%) | 3 (1.0%) |
| 20 to 24 Years | 4 (1.6%) | 26 (8.7%) |
| 25 to 29 Years | 30 (12.3%) | 53 (17.7%) |
| 30 to 34 Years | 18 (7.4%) | 18 (6.0%) |
| 35 to 39 Years | 22 (9.0%) | 18 (6.0%) |
| 40 to 44 Years | 10 (4.1%) | 9 (3.0%) |
| 45 to 49 Years | 10 (4.1%) | 22 (7.4%) |
| 50 to 54 Years | 21 (8.6%) | 38 (12.7%) |
| 55 to 59 Years | 36 (14.7%) | 8 (2.7%) |
| 60 to 64 Years | 19 (7.8%) | 50 (16.7%) |
| 65 to 69 Years | 14 (5.7%) | 4 (1.3%) |
| 70 to 74 Years | 2 (0.8%) | 2 (0.7%) |
| 75 to 79 Years | 5 (2.1%) | 6 (2.0%) |
| 80 to 84 Years | 5 (2.1%) | 4 (1.3%) |
| 85 Years and over | 0 (0.0%) | 9 (3.0%) |
| Total | 244 (100.0%) | 299 (100.0%) |
Families and Households in Quantico
Median Family Size in Quantico
The median family size in Quantico is 2.76 persons per family, with married-couple families (73 | 67.6%) accounting for the largest median family size of 2.96 persons per family. On the other hand, single female/mother families (33 | 30.6%) represent the smallest median family size with 2.33 persons per family.
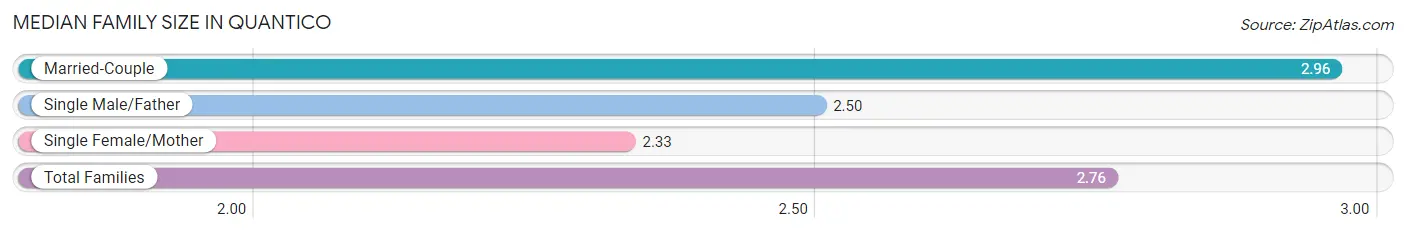
| Family Type | # Families | Family Size |
| Married-Couple | 73 (67.6%) | 2.96 |
| Single Male/Father | 2 (1.8%) | 2.50 |
| Single Female/Mother | 33 (30.6%) | 2.33 |
| Total Families | 108 (100.0%) | 2.76 |
Median Household Size in Quantico
The median household size in Quantico is 1.75 persons per household, with single female/mother households (33 | 10.6%) accounting for the largest median household size of 3 persons per household. non-family households (202 | 65.2%) represent the smallest median household size with 1.10 persons per household.
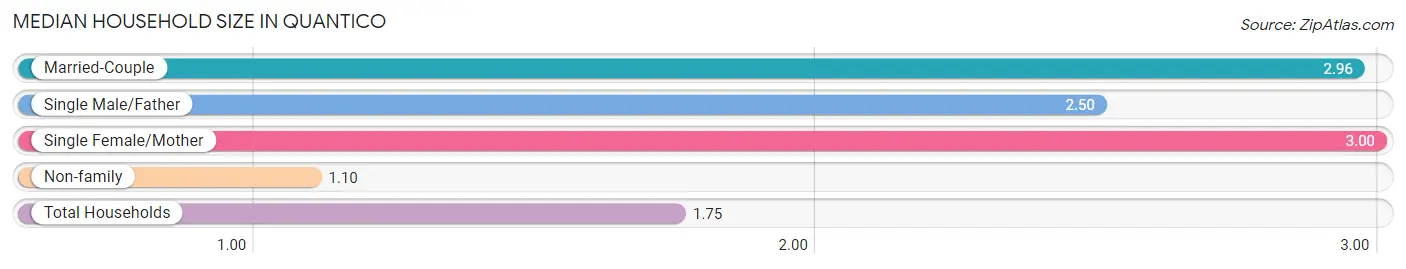
| Household Type | # Households | Household Size |
| Married-Couple | 73 (23.5%) | 2.96 |
| Single Male/Father | 2 (0.6%) | 2.50 |
| Single Female/Mother | 33 (10.6%) | 3.00 |
| Non-family | 202 (65.2%) | 1.10 |
| Total Households | 310 (100.0%) | 1.75 |
Household Size by Marriage Status in Quantico
Out of a total of 310 households in Quantico, 108 (34.8%) are family households, while 202 (65.2%) are nonfamily households. The most numerous type of family households are 2-person households, comprising 45, and the most common type of nonfamily households are 1-person households, comprising 182.
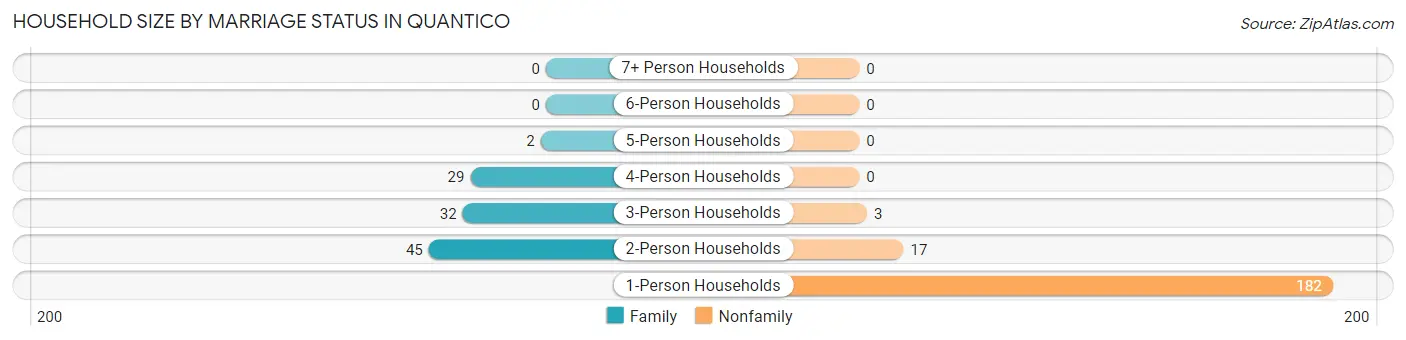
| Household Size | Family Households | Nonfamily Households |
| 1-Person Households | - | 182 (58.7%) |
| 2-Person Households | 45 (14.5%) | 17 (5.5%) |
| 3-Person Households | 32 (10.3%) | 3 (1.0%) |
| 4-Person Households | 29 (9.3%) | 0 (0.0%) |
| 5-Person Households | 2 (0.6%) | 0 (0.0%) |
| 6-Person Households | 0 (0.0%) | 0 (0.0%) |
| 7+ Person Households | 0 (0.0%) | 0 (0.0%) |
| Total | 108 (34.8%) | 202 (65.2%) |
Female Fertility in Quantico
Fertility by Age in Quantico
Average fertility rate in Quantico is 53.0 births per 1,000 women. Women in the age bracket of 20 to 34 years have the highest fertility rate with 82.0 births per 1,000 women. Women in the age bracket of 20 to 34 years acount for 100.0% of all women with births.
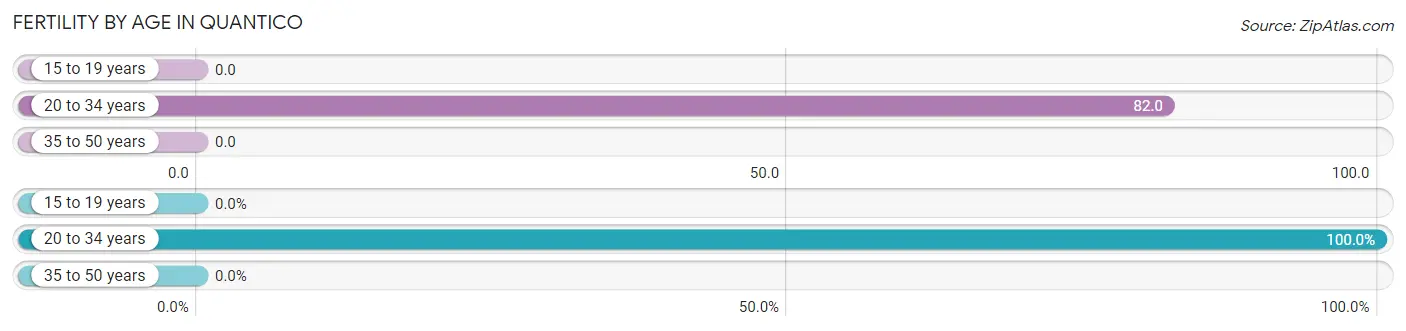
| Age Bracket | Women with Births | Births / 1,000 Women |
| 15 to 19 years | 0 (0.0%) | 0.0 |
| 20 to 34 years | 8 (100.0%) | 82.0 |
| 35 to 50 years | 0 (0.0%) | 0.0 |
| Total | 8 (100.0%) | 53.0 |
Fertility by Age by Marriage Status in Quantico
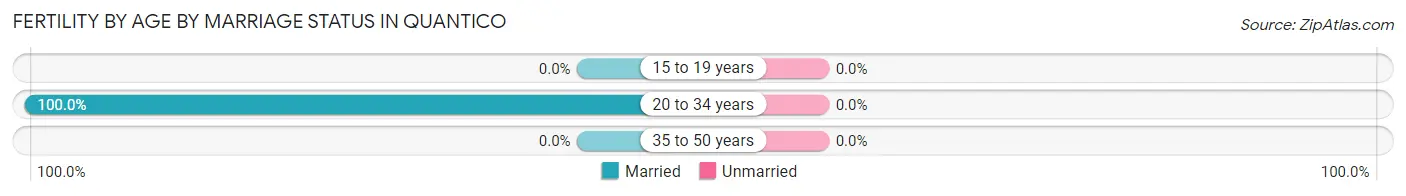
| Age Bracket | Married | Unmarried |
| 15 to 19 years | 0 (0.0%) | 0 (0.0%) |
| 20 to 34 years | 8 (100.0%) | 0 (0.0%) |
| 35 to 50 years | 0 (0.0%) | 0 (0.0%) |
| Total | 8 (100.0%) | 0 (0.0%) |
Fertility by Education in Quantico
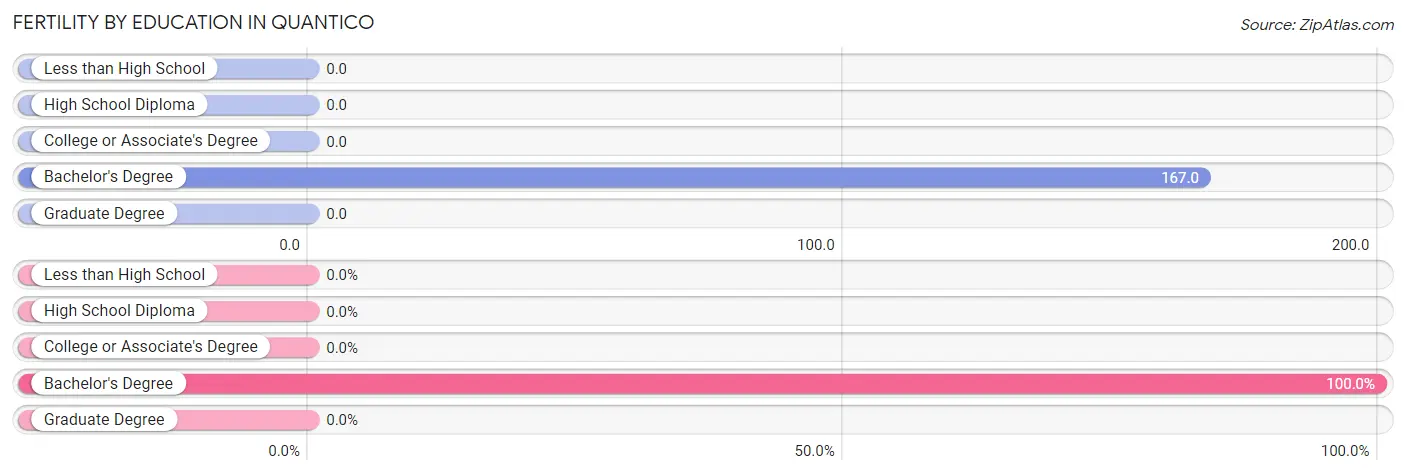
| Educational Attainment | Women with Births | Births / 1,000 Women |
| Less than High School | 0 (0.0%) | 0.0 |
| High School Diploma | 0 (0.0%) | 0.0 |
| College or Associate's Degree | 0 (0.0%) | 0.0 |
| Bachelor's Degree | 8 (100.0%) | 167.0 |
| Graduate Degree | 0 (0.0%) | 0.0 |
| Total | 8 (100.0%) | 53.0 |
Fertility by Education by Marriage Status in Quantico
| Educational Attainment | Married | Unmarried |
| Less than High School | 0 (0.0%) | 0 (0.0%) |
| High School Diploma | 0 (0.0%) | 0 (0.0%) |
| College or Associate's Degree | 0 (0.0%) | 0 (0.0%) |
| Bachelor's Degree | 8 (100.0%) | 0 (0.0%) |
| Graduate Degree | 0 (0.0%) | 0 (0.0%) |
| Total | 8 (100.0%) | 0 (0.0%) |
Employment Characteristics in Quantico
Employment by Class of Employer in Quantico
Among the 359 employed individuals in Quantico, private company employees (154 | 42.9%), federal government employees (87 | 24.2%), and not-for-profit organizations (68 | 18.9%) make up the most common classes of employment.
| Employer Class | # Employees | % Employees |
| Private Company Employees | 154 | 42.9% |
| Self-Employed (Incorporated) | 20 | 5.6% |
| Self-Employed (Not Incorporated) | 22 | 6.1% |
| Not-for-profit Organizations | 68 | 18.9% |
| Local Government Employees | 8 | 2.2% |
| State Government Employees | 0 | 0.0% |
| Federal Government Employees | 87 | 24.2% |
| Unpaid Family Workers | 0 | 0.0% |
| Total | 359 | 100.0% |
Employment Status by Age in Quantico
According to the labor force statistics for Quantico, out of the total population over 16 years of age (476), 78.8% or 375 individuals are in the labor force, with 4.5% or 17 of them unemployed. The age group with the highest labor force participation rate is 16 to 19 years, with 100.0% or 13 individuals in the labor force. Within the labor force, the 20 to 24 years age range has the highest percentage of unemployed individuals, with 60.0% or 14 of them being unemployed.
| Age Bracket | In Labor Force | Unemployed |
| 16 to 19 Years | 13 (100.0%) | 0 (0.0%) |
| 20 to 24 Years | 24 (80.0%) | 14 (60.0%) |
| 25 to 29 Years | 73 (88.0%) | 0 (0.0%) |
| 30 to 34 Years | 32 (88.9%) | 0 (0.0%) |
| 35 to 44 Years | 49 (83.1%) | 0 (0.0%) |
| 45 to 54 Years | 73 (80.2%) | 4 (5.8%) |
| 55 to 59 Years | 25 (56.8%) | 0 (0.0%) |
| 60 to 64 Years | 64 (92.8%) | 0 (0.0%) |
| 65 to 74 Years | 17 (77.3%) | 0 (0.0%) |
| 75 Years and over | 5 (17.2%) | 0 (0.0%) |
| Total | 375 (78.8%) | 17 (4.5%) |
Employment Status by Educational Attainment in Quantico
According to labor force statistics for Quantico, 82.7% of individuals (316) out of the total population between 25 and 64 years of age (382) are in the labor force, with 1.3% or 4 of them being unemployed. The group with the highest labor force participation rate are those with the educational attainment of bachelor's degree or higher, with 93.7% or 134 individuals in the labor force. Within the labor force, individuals with less than high school education have the highest percentage of unemployment, with 25.0% or 4 of them being unemployed.
| Educational Attainment | In Labor Force | Unemployed |
| Less than High School | 16 (48.5%) | 8 (25.0%) |
| High School Diploma | 95 (84.8%) | 0 (0.0%) |
| College / Associate Degree | 71 (75.5%) | 0 (0.0%) |
| Bachelor's Degree or higher | 134 (93.7%) | 0 (0.0%) |
| Total | 316 (82.7%) | 5 (1.3%) |
Employment Occupations by Sex in Quantico
Management, Business, Science and Arts Occupations
The most common Management, Business, Science and Arts occupations in Quantico are Computers, Engineering & Science (29 | 8.6%), Management (23 | 6.8%), Computers & Mathematics (23 | 6.8%), Community & Social Service (21 | 6.2%), and Business & Financial (20 | 5.9%).
Management, Business, Science and Arts Occupations by Sex
Within the Management, Business, Science and Arts occupations in Quantico, the most male-oriented occupations are Life, Physical & Social Science (100.0%), Arts, Media & Entertainment (100.0%), and Management (78.3%), while the most female-oriented occupations are Health Diagnosing & Treating (100.0%), Health Technologists (100.0%), and Business & Financial (75.0%).
| Occupation | Male | Female |
| Management | 18 (78.3%) | 5 (21.7%) |
| Business & Financial | 5 (25.0%) | 15 (75.0%) |
| Computers, Engineering & Science | 14 (48.3%) | 15 (51.7%) |
| Computers & Mathematics | 10 (43.5%) | 13 (56.5%) |
| Architecture & Engineering | 2 (50.0%) | 2 (50.0%) |
| Life, Physical & Social Science | 2 (100.0%) | 0 (0.0%) |
| Community & Social Service | 13 (61.9%) | 8 (38.1%) |
| Education, Arts & Media | 3 (37.5%) | 5 (62.5%) |
| Legal Services & Support | 0 (0.0%) | 0 (0.0%) |
| Education Instruction & Library | 7 (70.0%) | 3 (30.0%) |
| Arts, Media & Entertainment | 3 (100.0%) | 0 (0.0%) |
| Health Diagnosing & Treating | 0 (0.0%) | 8 (100.0%) |
| Health Technologists | 0 (0.0%) | 6 (100.0%) |
| Total (Category) | 50 (49.5%) | 51 (50.5%) |
| Total (Overall) | 140 (41.3%) | 199 (58.7%) |
Services Occupations
The most common Services occupations in Quantico are Personal Care & Service (23 | 6.8%), Security & Protection (18 | 5.3%), Cleaning & Maintenance (18 | 5.3%), Food Preparation & Serving (13 | 3.8%), and Firefighting & Prevention (9 | 2.6%).
Services Occupations by Sex
Within the Services occupations in Quantico, the most male-oriented occupations are Firefighting & Prevention (100.0%), Food Preparation & Serving (76.9%), and Security & Protection (61.1%), while the most female-oriented occupations are Personal Care & Service (100.0%), Law Enforcement (77.8%), and Security & Protection (38.9%).
| Occupation | Male | Female |
| Healthcare Support | 0 (0.0%) | 0 (0.0%) |
| Security & Protection | 11 (61.1%) | 7 (38.9%) |
| Firefighting & Prevention | 9 (100.0%) | 0 (0.0%) |
| Law Enforcement | 2 (22.2%) | 7 (77.8%) |
| Food Preparation & Serving | 10 (76.9%) | 3 (23.1%) |
| Cleaning & Maintenance | 11 (61.1%) | 7 (38.9%) |
| Personal Care & Service | 0 (0.0%) | 23 (100.0%) |
| Total (Category) | 32 (44.4%) | 40 (55.6%) |
| Total (Overall) | 140 (41.3%) | 199 (58.7%) |
Sales and Office Occupations
The most common Sales and Office occupations in Quantico are Sales & Related (57 | 16.8%), and Office & Administration (44 | 13.0%).
Sales and Office Occupations by Sex
| Occupation | Male | Female |
| Sales & Related | 4 (7.0%) | 53 (93.0%) |
| Office & Administration | 9 (20.4%) | 35 (79.5%) |
| Total (Category) | 13 (12.9%) | 88 (87.1%) |
| Total (Overall) | 140 (41.3%) | 199 (58.7%) |
Natural Resources, Construction and Maintenance Occupations
The most common Natural Resources, Construction and Maintenance occupations in Quantico are Construction & Extraction (21 | 6.2%), and Installation, Maintenance & Repair (15 | 4.4%).
Natural Resources, Construction and Maintenance Occupations by Sex
| Occupation | Male | Female |
| Farming, Fishing & Forestry | 0 (0.0%) | 0 (0.0%) |
| Construction & Extraction | 21 (100.0%) | 0 (0.0%) |
| Installation, Maintenance & Repair | 15 (100.0%) | 0 (0.0%) |
| Total (Category) | 36 (100.0%) | 0 (0.0%) |
| Total (Overall) | 140 (41.3%) | 199 (58.7%) |
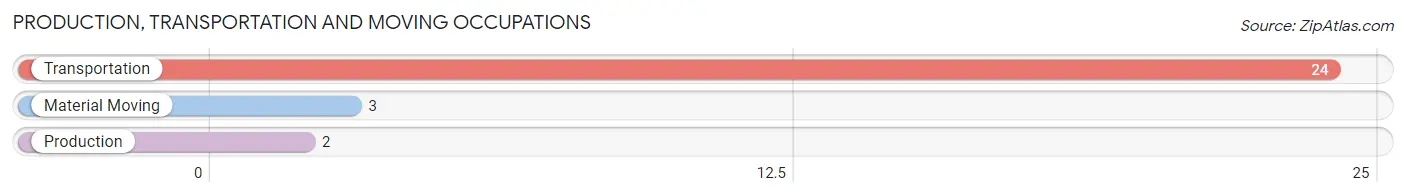
Production, Transportation and Moving Occupations
The most common Production, Transportation and Moving occupations in Quantico are Transportation (24 | 7.1%), Material Moving (3 | 0.9%), and Production (2 | 0.6%).
Production, Transportation and Moving Occupations by Sex
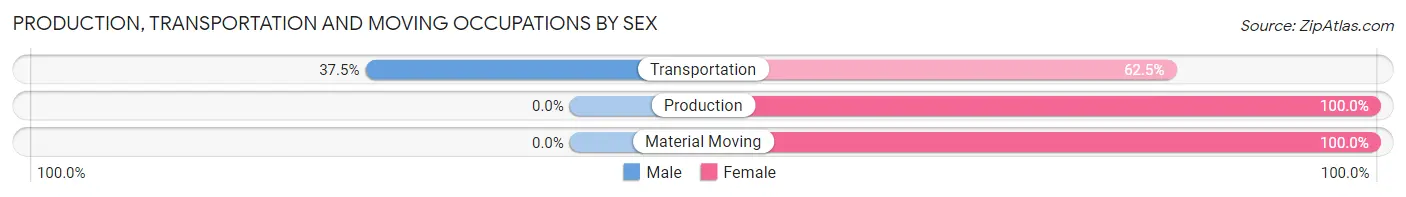
| Occupation | Male | Female |
| Production | 0 (0.0%) | 2 (100.0%) |
| Transportation | 9 (37.5%) | 15 (62.5%) |
| Material Moving | 0 (0.0%) | 3 (100.0%) |
| Total (Category) | 9 (31.0%) | 20 (69.0%) |
| Total (Overall) | 140 (41.3%) | 199 (58.7%) |
Employment Industries by Sex in Quantico
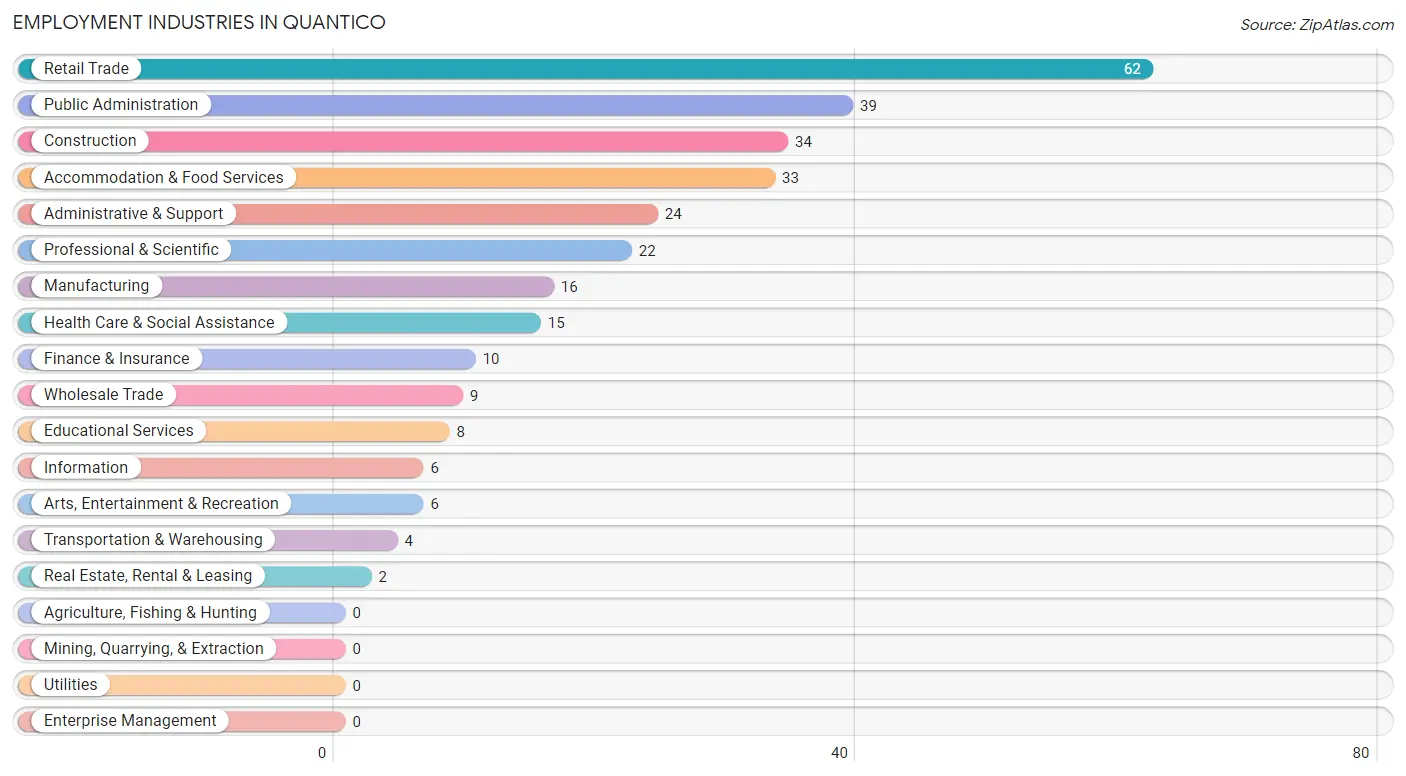
Employment Industries in Quantico
The major employment industries in Quantico include Retail Trade (62 | 18.3%), Public Administration (39 | 11.5%), Construction (34 | 10.0%), Accommodation & Food Services (33 | 9.7%), and Administrative & Support (24 | 7.1%).
Employment Industries by Sex in Quantico
The Quantico industries that see more men than women are Construction (100.0%), Wholesale Trade (100.0%), and Public Administration (84.6%), whereas the industries that tend to have a higher number of women are Transportation & Warehousing (100.0%), Finance & Insurance (100.0%), and Real Estate, Rental & Leasing (100.0%).
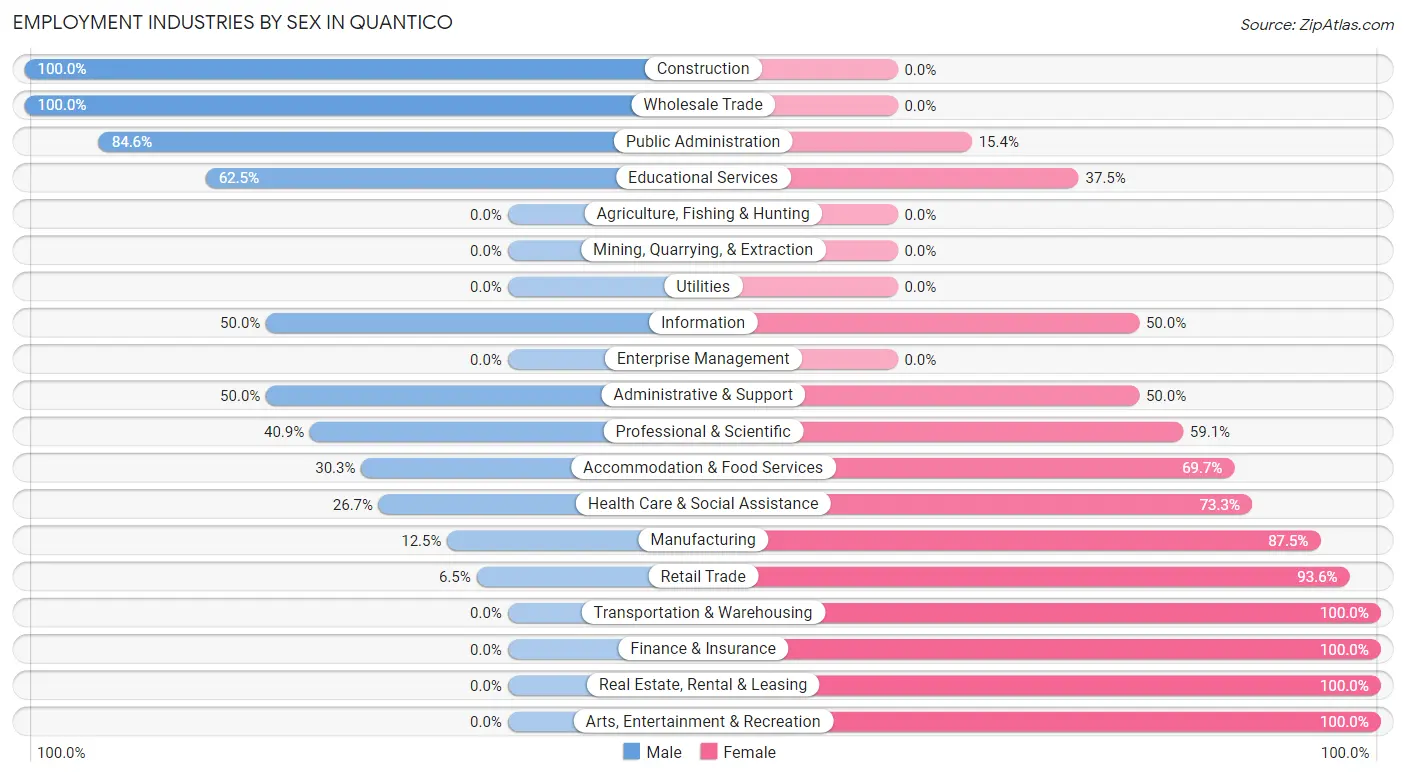
| Industry | Male | Female |
| Agriculture, Fishing & Hunting | 0 (0.0%) | 0 (0.0%) |
| Mining, Quarrying, & Extraction | 0 (0.0%) | 0 (0.0%) |
| Construction | 34 (100.0%) | 0 (0.0%) |
| Manufacturing | 2 (12.5%) | 14 (87.5%) |
| Wholesale Trade | 9 (100.0%) | 0 (0.0%) |
| Retail Trade | 4 (6.5%) | 58 (93.5%) |
| Transportation & Warehousing | 0 (0.0%) | 4 (100.0%) |
| Utilities | 0 (0.0%) | 0 (0.0%) |
| Information | 3 (50.0%) | 3 (50.0%) |
| Finance & Insurance | 0 (0.0%) | 10 (100.0%) |
| Real Estate, Rental & Leasing | 0 (0.0%) | 2 (100.0%) |
| Professional & Scientific | 9 (40.9%) | 13 (59.1%) |
| Enterprise Management | 0 (0.0%) | 0 (0.0%) |
| Administrative & Support | 12 (50.0%) | 12 (50.0%) |
| Educational Services | 5 (62.5%) | 3 (37.5%) |
| Health Care & Social Assistance | 4 (26.7%) | 11 (73.3%) |
| Arts, Entertainment & Recreation | 0 (0.0%) | 6 (100.0%) |
| Accommodation & Food Services | 10 (30.3%) | 23 (69.7%) |
| Public Administration | 33 (84.6%) | 6 (15.4%) |
| Total | 140 (41.3%) | 199 (58.7%) |
Education in Quantico
School Enrollment in Quantico
The most common levels of schooling among the 76 students in Quantico are elementary school (23 | 30.3%), middle school (23 | 30.3%), and nursery / preschool (10 | 13.2%).
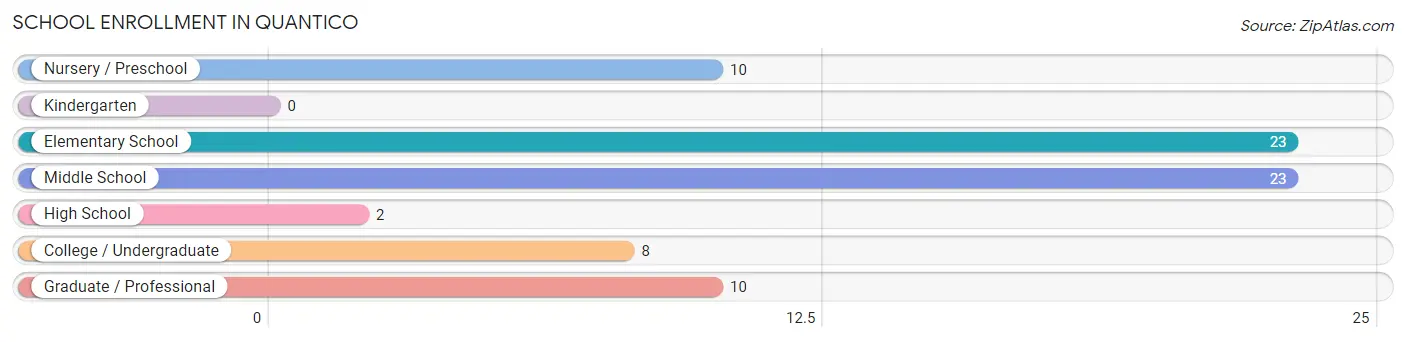
| School Level | # Students | % Students |
| Nursery / Preschool | 10 | 13.2% |
| Kindergarten | 0 | 0.0% |
| Elementary School | 23 | 30.3% |
| Middle School | 23 | 30.3% |
| High School | 2 | 2.6% |
| College / Undergraduate | 8 | 10.5% |
| Graduate / Professional | 10 | 13.2% |
| Total | 76 | 100.0% |
School Enrollment by Age by Funding Source in Quantico
Out of a total of 76 students who are enrolled in schools in Quantico, 13 (17.1%) attend a private institution, while the remaining 63 (82.9%) are enrolled in public schools. The age group of 3 to 4 year olds has the highest likelihood of being enrolled in private schools, with 1 (100.0% in the age bracket) enrolled. Conversely, the age group of 5 to 9 year old has the lowest likelihood of being enrolled in a private school, with 32 (100.0% in the age bracket) attending a public institution.
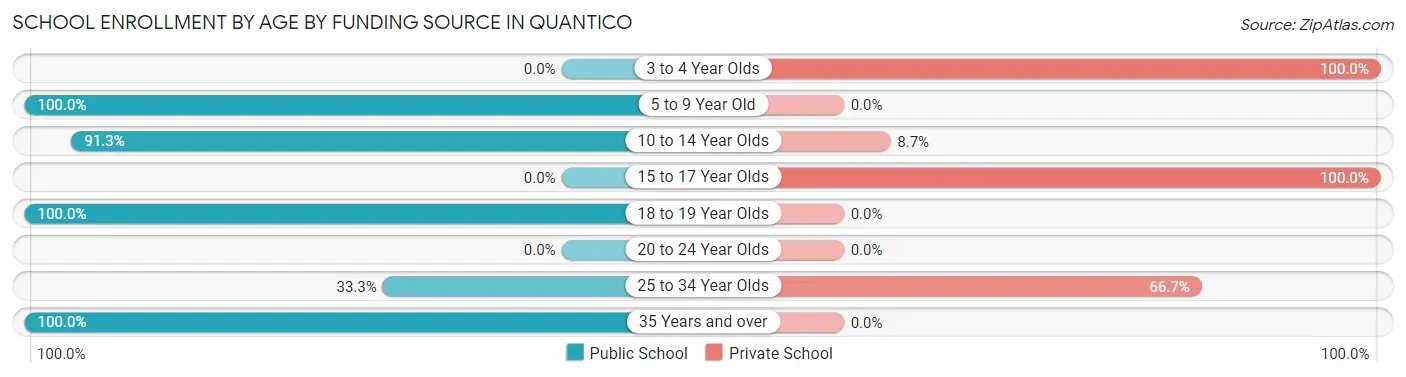
| Age Bracket | Public School | Private School |
| 3 to 4 Year Olds | 0 (0.0%) | 1 (100.0%) |
| 5 to 9 Year Old | 32 (100.0%) | 0 (0.0%) |
| 10 to 14 Year Olds | 21 (91.3%) | 2 (8.7%) |
| 15 to 17 Year Olds | 0 (0.0%) | 2 (100.0%) |
| 18 to 19 Year Olds | 2 (100.0%) | 0 (0.0%) |
| 20 to 24 Year Olds | 0 (0.0%) | 0 (0.0%) |
| 25 to 34 Year Olds | 4 (33.3%) | 8 (66.7%) |
| 35 Years and over | 4 (100.0%) | 0 (0.0%) |
| Total | 63 (82.9%) | 13 (17.1%) |
Educational Attainment by Field of Study in Quantico
Social sciences (74 | 44.9%), business (25 | 15.1%), engineering (11 | 6.7%), science & technology (11 | 6.7%), and arts & humanities (9 | 5.4%) are the most common fields of study among 165 individuals in Quantico who have obtained a bachelor's degree or higher.
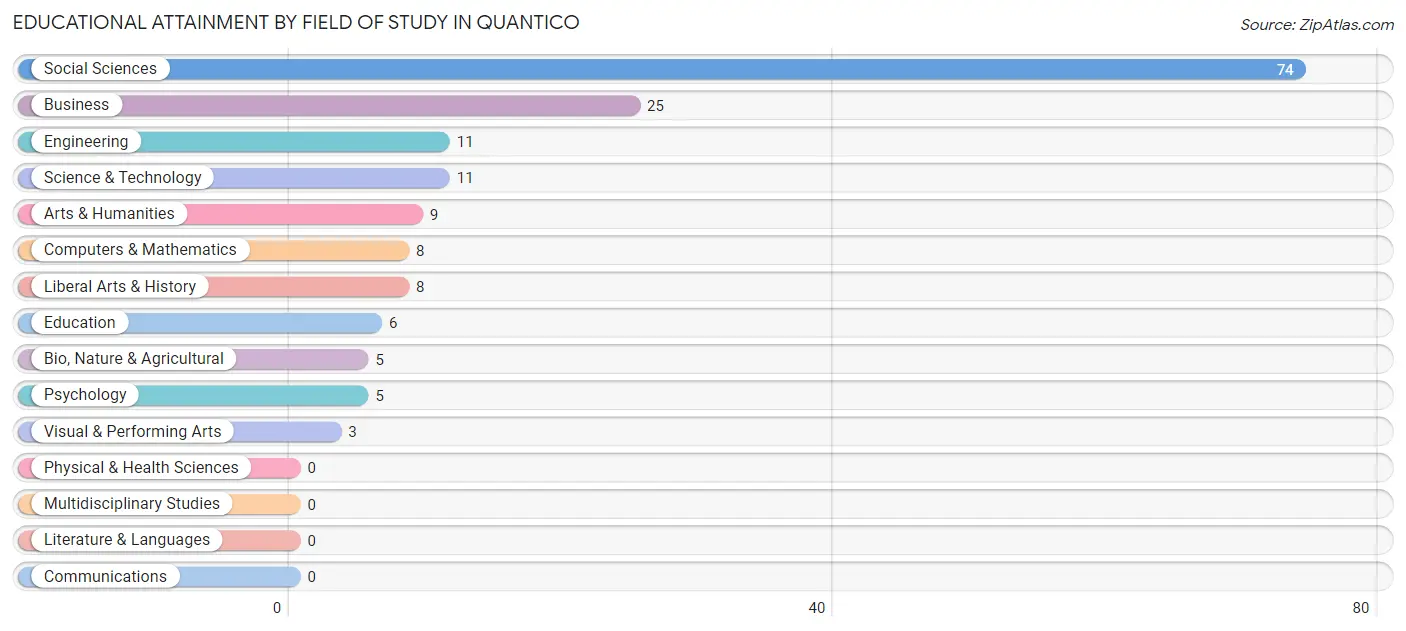
| Field of Study | # Graduates | % Graduates |
| Computers & Mathematics | 8 | 4.9% |
| Bio, Nature & Agricultural | 5 | 3.0% |
| Physical & Health Sciences | 0 | 0.0% |
| Psychology | 5 | 3.0% |
| Social Sciences | 74 | 44.9% |
| Engineering | 11 | 6.7% |
| Multidisciplinary Studies | 0 | 0.0% |
| Science & Technology | 11 | 6.7% |
| Business | 25 | 15.1% |
| Education | 6 | 3.6% |
| Literature & Languages | 0 | 0.0% |
| Liberal Arts & History | 8 | 4.9% |
| Visual & Performing Arts | 3 | 1.8% |
| Communications | 0 | 0.0% |
| Arts & Humanities | 9 | 5.4% |
| Total | 165 | 100.0% |
Transportation & Commute in Quantico
Vehicle Availability by Sex in Quantico
The most prevalent vehicle ownership categories in Quantico are males with 1 vehicle (78, accounting for 48.7%) and females with 1 vehicle (112, making up 39.2%).
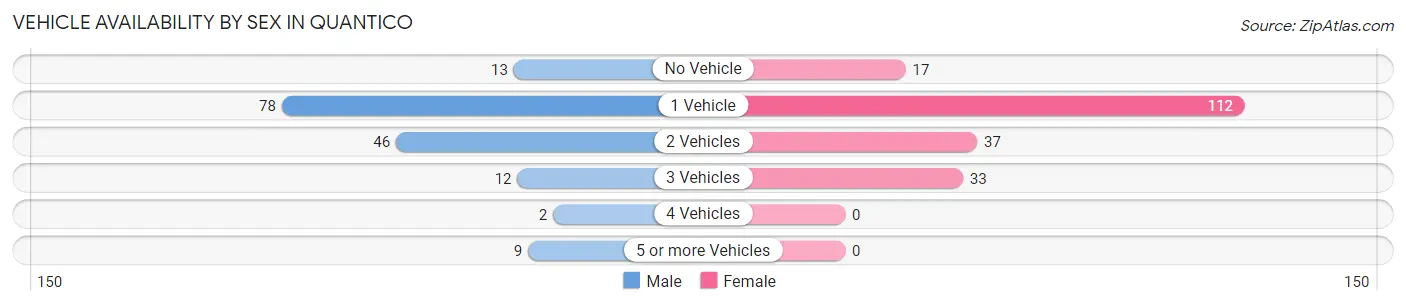
| Vehicles Available | Male | Female |
| No Vehicle | 13 (8.1%) | 17 (8.5%) |
| 1 Vehicle | 78 (48.7%) | 112 (56.3%) |
| 2 Vehicles | 46 (28.7%) | 37 (18.6%) |
| 3 Vehicles | 12 (7.5%) | 33 (16.6%) |
| 4 Vehicles | 2 (1.3%) | 0 (0.0%) |
| 5 or more Vehicles | 9 (5.6%) | 0 (0.0%) |
| Total | 160 (100.0%) | 199 (100.0%) |
Commute Time in Quantico
The most frequently occuring commute durations in Quantico are 10 to 14 minutes (66 commuters, 21.3%), 15 to 19 minutes (46 commuters, 14.8%), and 60 to 89 minutes (46 commuters, 14.8%).
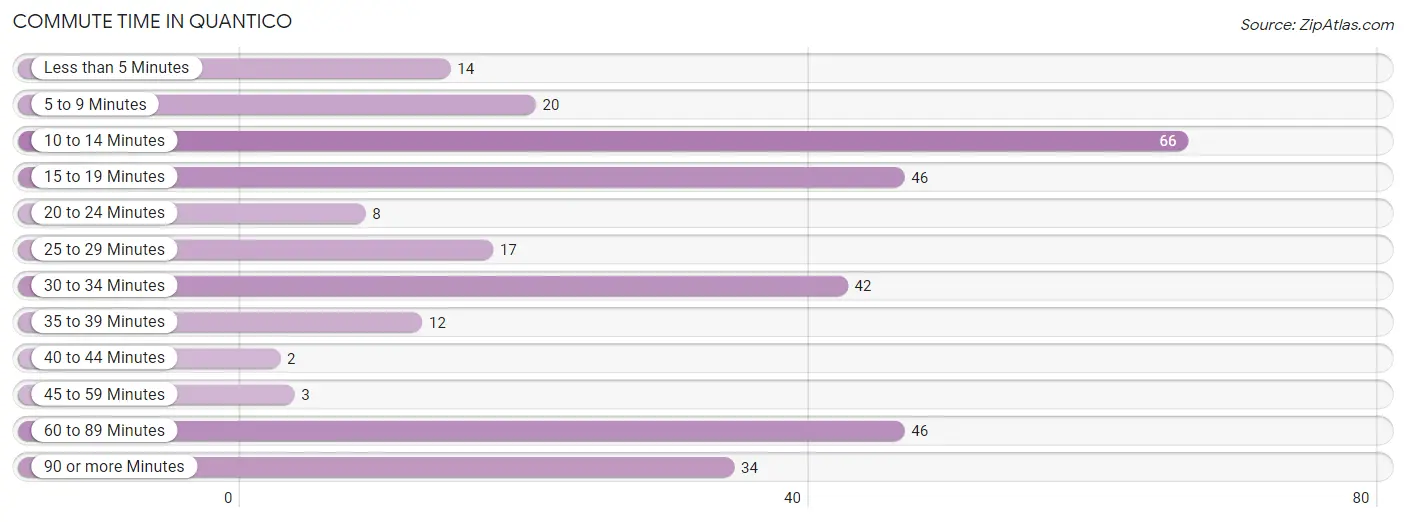
| Commute Time | # Commuters | % Commuters |
| Less than 5 Minutes | 14 | 4.5% |
| 5 to 9 Minutes | 20 | 6.5% |
| 10 to 14 Minutes | 66 | 21.3% |
| 15 to 19 Minutes | 46 | 14.8% |
| 20 to 24 Minutes | 8 | 2.6% |
| 25 to 29 Minutes | 17 | 5.5% |
| 30 to 34 Minutes | 42 | 13.6% |
| 35 to 39 Minutes | 12 | 3.9% |
| 40 to 44 Minutes | 2 | 0.6% |
| 45 to 59 Minutes | 3 | 1.0% |
| 60 to 89 Minutes | 46 | 14.8% |
| 90 or more Minutes | 34 | 11.0% |
Commute Time by Sex in Quantico
The most common commute times in Quantico are 15 to 19 minutes (33 commuters, 24.1%) for males and 10 to 14 minutes (48 commuters, 27.8%) for females.
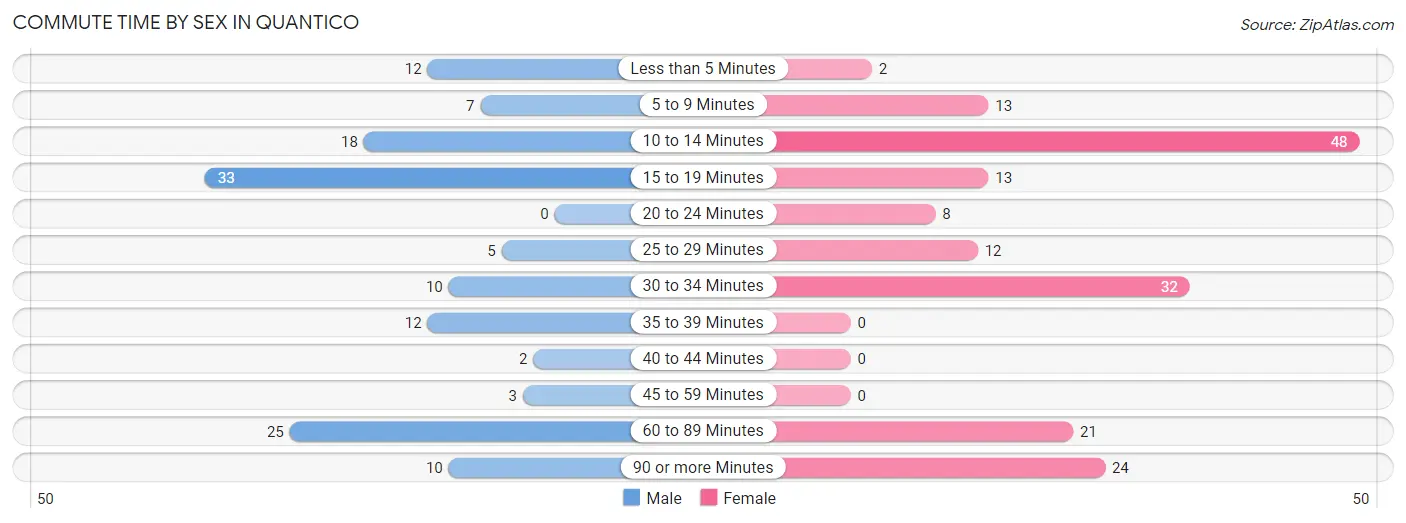
| Commute Time | Male | Female |
| Less than 5 Minutes | 12 (8.8%) | 2 (1.2%) |
| 5 to 9 Minutes | 7 (5.1%) | 13 (7.5%) |
| 10 to 14 Minutes | 18 (13.1%) | 48 (27.8%) |
| 15 to 19 Minutes | 33 (24.1%) | 13 (7.5%) |
| 20 to 24 Minutes | 0 (0.0%) | 8 (4.6%) |
| 25 to 29 Minutes | 5 (3.6%) | 12 (6.9%) |
| 30 to 34 Minutes | 10 (7.3%) | 32 (18.5%) |
| 35 to 39 Minutes | 12 (8.8%) | 0 (0.0%) |
| 40 to 44 Minutes | 2 (1.5%) | 0 (0.0%) |
| 45 to 59 Minutes | 3 (2.2%) | 0 (0.0%) |
| 60 to 89 Minutes | 25 (18.2%) | 21 (12.1%) |
| 90 or more Minutes | 10 (7.3%) | 24 (13.9%) |
Time of Departure to Work by Sex in Quantico
The most frequent times of departure to work in Quantico are 7:00 AM to 7:29 AM (35, 25.6%) for males and 9:00 AM to 9:59 AM (56, 32.4%) for females.
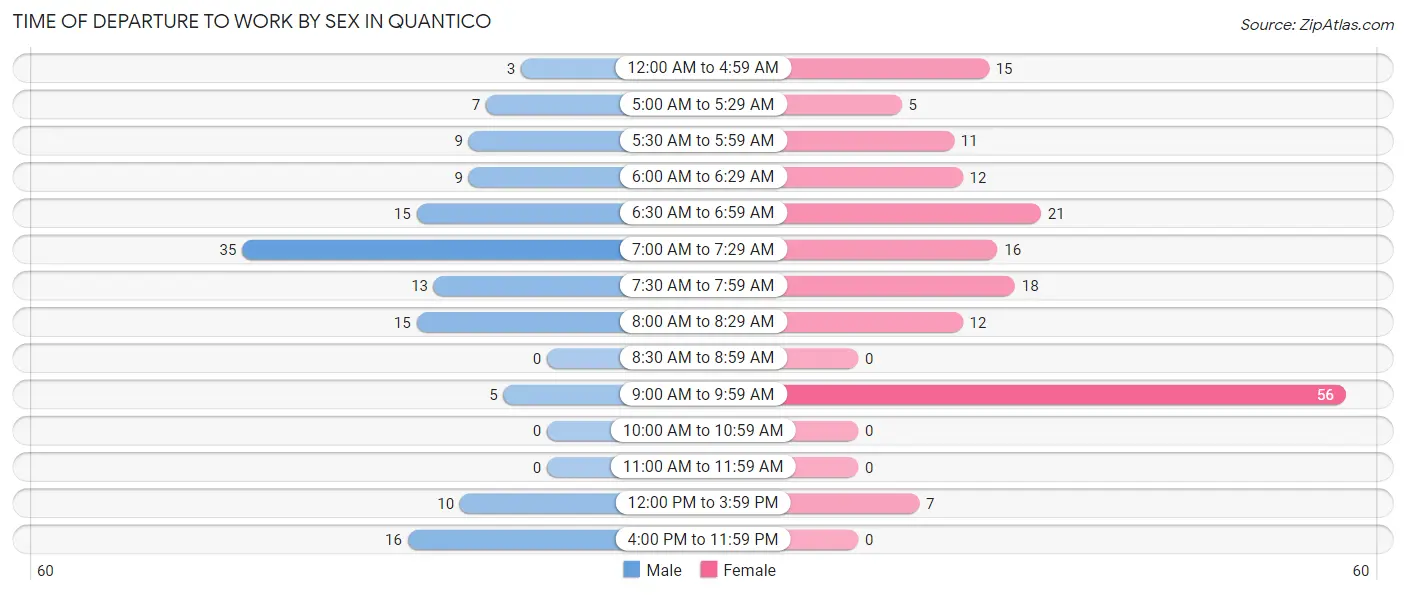
| Time of Departure | Male | Female |
| 12:00 AM to 4:59 AM | 3 (2.2%) | 15 (8.7%) |
| 5:00 AM to 5:29 AM | 7 (5.1%) | 5 (2.9%) |
| 5:30 AM to 5:59 AM | 9 (6.6%) | 11 (6.4%) |
| 6:00 AM to 6:29 AM | 9 (6.6%) | 12 (6.9%) |
| 6:30 AM to 6:59 AM | 15 (11.0%) | 21 (12.1%) |
| 7:00 AM to 7:29 AM | 35 (25.6%) | 16 (9.2%) |
| 7:30 AM to 7:59 AM | 13 (9.5%) | 18 (10.4%) |
| 8:00 AM to 8:29 AM | 15 (11.0%) | 12 (6.9%) |
| 8:30 AM to 8:59 AM | 0 (0.0%) | 0 (0.0%) |
| 9:00 AM to 9:59 AM | 5 (3.6%) | 56 (32.4%) |
| 10:00 AM to 10:59 AM | 0 (0.0%) | 0 (0.0%) |
| 11:00 AM to 11:59 AM | 0 (0.0%) | 0 (0.0%) |
| 12:00 PM to 3:59 PM | 10 (7.3%) | 7 (4.1%) |
| 4:00 PM to 11:59 PM | 16 (11.7%) | 0 (0.0%) |
| Total | 137 (100.0%) | 173 (100.0%) |
Housing Occupancy in Quantico
Occupancy by Ownership in Quantico
Of the total 310 dwellings in Quantico, owner-occupied units account for 64 (20.6%), while renter-occupied units make up 246 (79.3%).
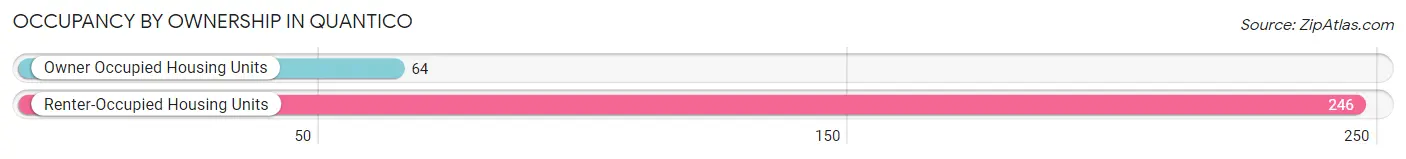
| Occupancy | # Housing Units | % Housing Units |
| Owner Occupied Housing Units | 64 | 20.6% |
| Renter-Occupied Housing Units | 246 | 79.3% |
| Total Occupied Housing Units | 310 | 100.0% |
Occupancy by Household Size in Quantico
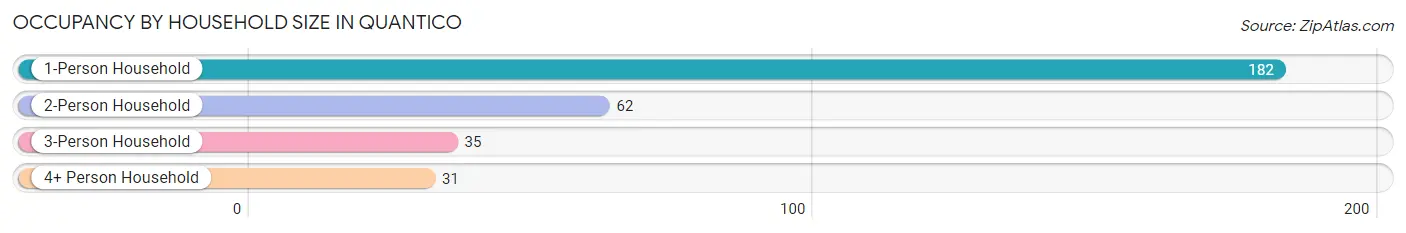
| Household Size | # Housing Units | % Housing Units |
| 1-Person Household | 182 | 58.7% |
| 2-Person Household | 62 | 20.0% |
| 3-Person Household | 35 | 11.3% |
| 4+ Person Household | 31 | 10.0% |
| Total Housing Units | 310 | 100.0% |
Occupancy by Ownership by Household Size in Quantico
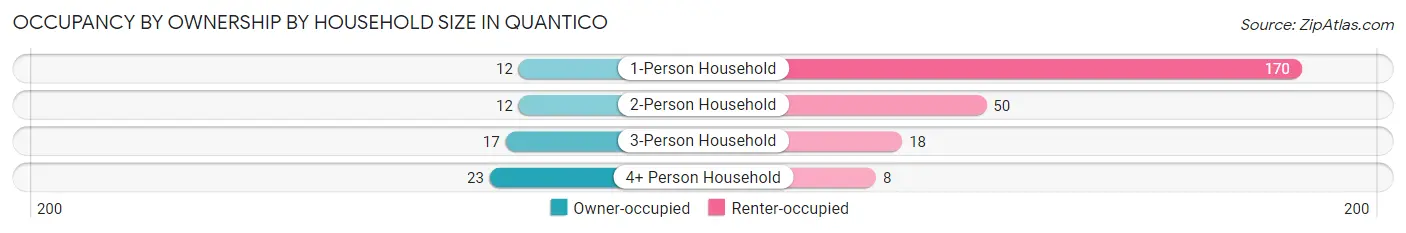
| Household Size | Owner-occupied | Renter-occupied |
| 1-Person Household | 12 (6.6%) | 170 (93.4%) |
| 2-Person Household | 12 (19.4%) | 50 (80.6%) |
| 3-Person Household | 17 (48.6%) | 18 (51.4%) |
| 4+ Person Household | 23 (74.2%) | 8 (25.8%) |
| Total Housing Units | 64 (20.6%) | 246 (79.3%) |
Occupancy by Educational Attainment in Quantico
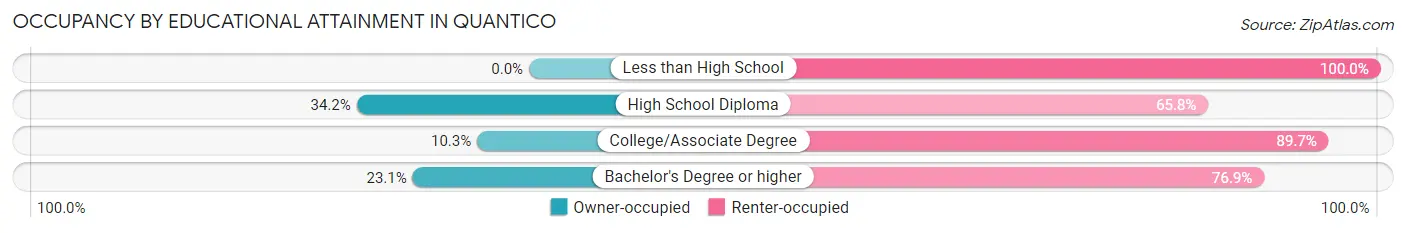
| Household Size | Owner-occupied | Renter-occupied |
| Less than High School | 0 (0.0%) | 33 (100.0%) |
| High School Diploma | 27 (34.2%) | 52 (65.8%) |
| College/Associate Degree | 7 (10.3%) | 61 (89.7%) |
| Bachelor's Degree or higher | 30 (23.1%) | 100 (76.9%) |
Occupancy by Age of Householder in Quantico
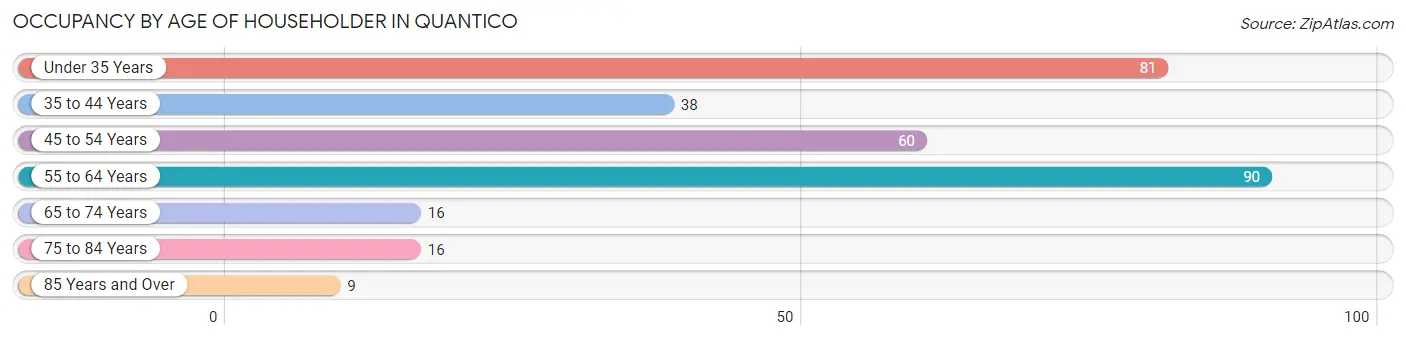
| Age Bracket | # Households | % Households |
| Under 35 Years | 81 | 26.1% |
| 35 to 44 Years | 38 | 12.3% |
| 45 to 54 Years | 60 | 19.4% |
| 55 to 64 Years | 90 | 29.0% |
| 65 to 74 Years | 16 | 5.2% |
| 75 to 84 Years | 16 | 5.2% |
| 85 Years and Over | 9 | 2.9% |
| Total | 310 | 100.0% |
Housing Finances in Quantico
Median Income by Occupancy in Quantico
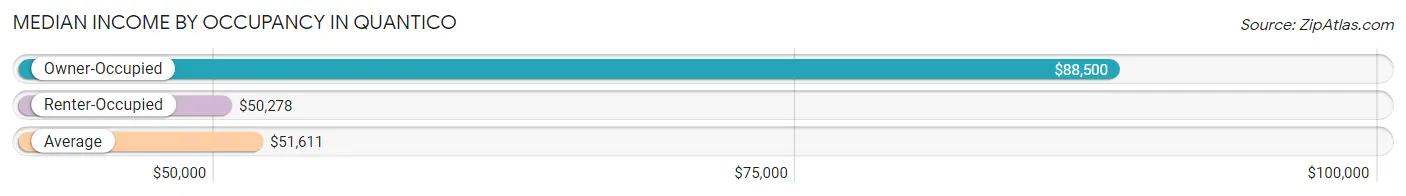
| Occupancy Type | # Households | Median Income |
| Owner-Occupied | 64 (20.6%) | $88,500 |
| Renter-Occupied | 246 (79.3%) | $50,278 |
| Average | 310 (100.0%) | $51,611 |
Occupancy by Householder Income Bracket in Quantico
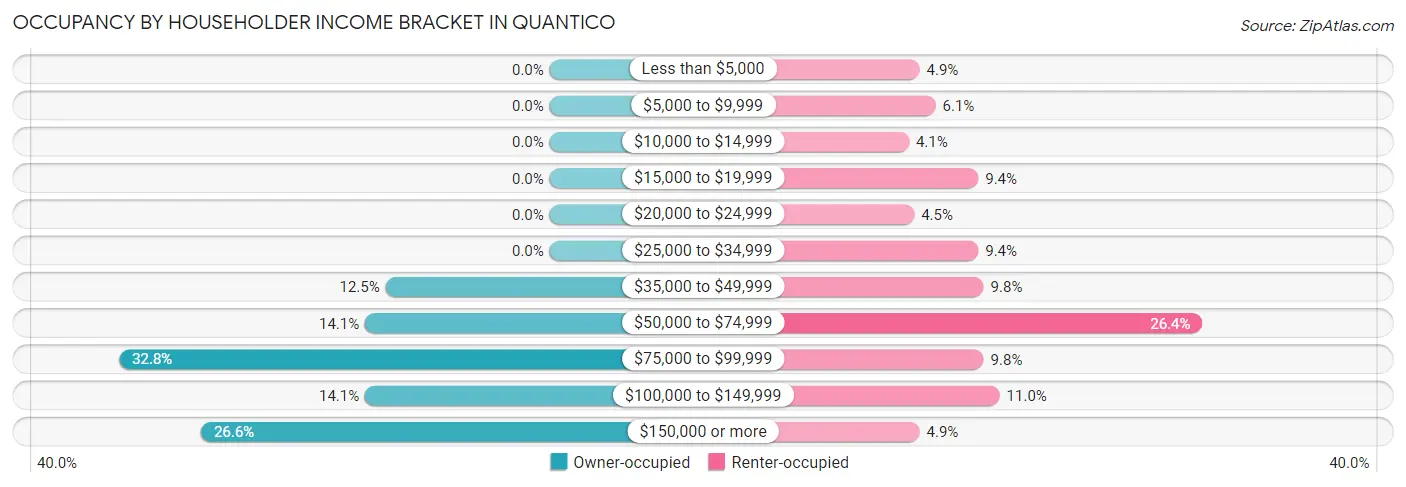
| Income Bracket | Owner-occupied | Renter-occupied |
| Less than $5,000 | 0 (0.0%) | 12 (4.9%) |
| $5,000 to $9,999 | 0 (0.0%) | 15 (6.1%) |
| $10,000 to $14,999 | 0 (0.0%) | 10 (4.1%) |
| $15,000 to $19,999 | 0 (0.0%) | 23 (9.3%) |
| $20,000 to $24,999 | 0 (0.0%) | 11 (4.5%) |
| $25,000 to $34,999 | 0 (0.0%) | 23 (9.3%) |
| $35,000 to $49,999 | 8 (12.5%) | 24 (9.8%) |
| $50,000 to $74,999 | 9 (14.1%) | 65 (26.4%) |
| $75,000 to $99,999 | 21 (32.8%) | 24 (9.8%) |
| $100,000 to $149,999 | 9 (14.1%) | 27 (11.0%) |
| $150,000 or more | 17 (26.6%) | 12 (4.9%) |
| Total | 64 (100.0%) | 246 (100.0%) |
Monthly Housing Cost Tiers in Quantico
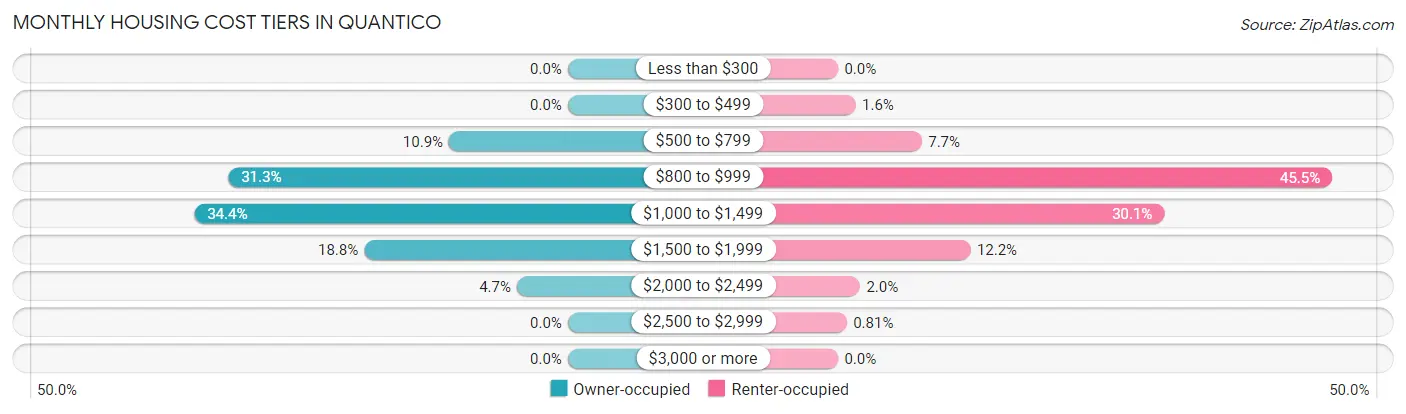
| Monthly Cost | Owner-occupied | Renter-occupied |
| Less than $300 | 0 (0.0%) | 0 (0.0%) |
| $300 to $499 | 0 (0.0%) | 4 (1.6%) |
| $500 to $799 | 7 (10.9%) | 19 (7.7%) |
| $800 to $999 | 20 (31.2%) | 112 (45.5%) |
| $1,000 to $1,499 | 22 (34.4%) | 74 (30.1%) |
| $1,500 to $1,999 | 12 (18.8%) | 30 (12.2%) |
| $2,000 to $2,499 | 3 (4.7%) | 5 (2.0%) |
| $2,500 to $2,999 | 0 (0.0%) | 2 (0.8%) |
| $3,000 or more | 0 (0.0%) | 0 (0.0%) |
| Total | 64 (100.0%) | 246 (100.0%) |
Physical Housing Characteristics in Quantico
Housing Structures in Quantico
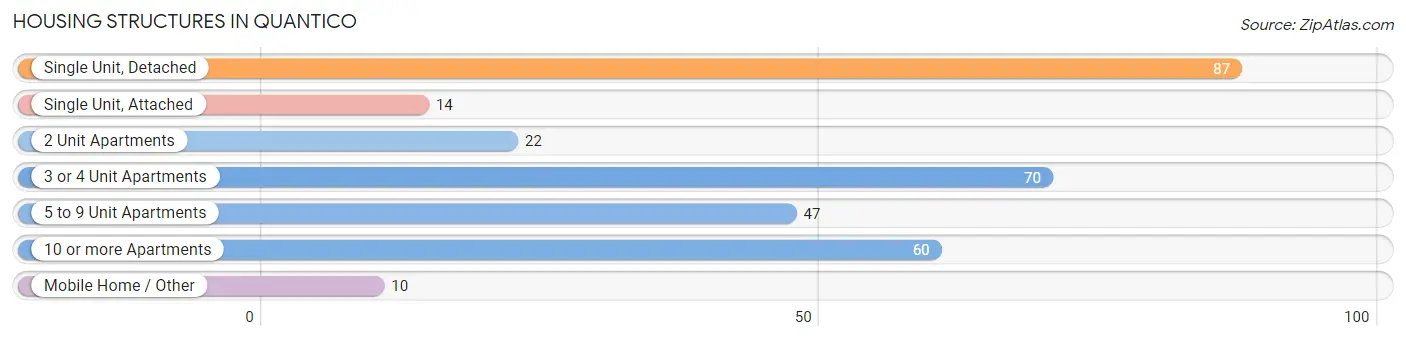
| Structure Type | # Housing Units | % Housing Units |
| Single Unit, Detached | 87 | 28.1% |
| Single Unit, Attached | 14 | 4.5% |
| 2 Unit Apartments | 22 | 7.1% |
| 3 or 4 Unit Apartments | 70 | 22.6% |
| 5 to 9 Unit Apartments | 47 | 15.2% |
| 10 or more Apartments | 60 | 19.4% |
| Mobile Home / Other | 10 | 3.2% |
| Total | 310 | 100.0% |
Housing Structures by Occupancy in Quantico
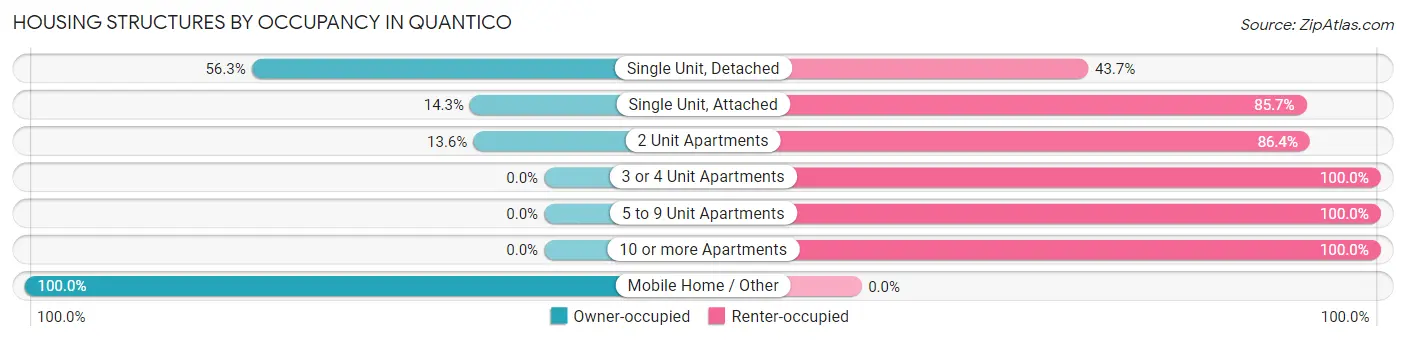
| Structure Type | Owner-occupied | Renter-occupied |
| Single Unit, Detached | 49 (56.3%) | 38 (43.7%) |
| Single Unit, Attached | 2 (14.3%) | 12 (85.7%) |
| 2 Unit Apartments | 3 (13.6%) | 19 (86.4%) |
| 3 or 4 Unit Apartments | 0 (0.0%) | 70 (100.0%) |
| 5 to 9 Unit Apartments | 0 (0.0%) | 47 (100.0%) |
| 10 or more Apartments | 0 (0.0%) | 60 (100.0%) |
| Mobile Home / Other | 10 (100.0%) | 0 (0.0%) |
| Total | 64 (20.6%) | 246 (79.3%) |
Housing Structures by Number of Rooms in Quantico
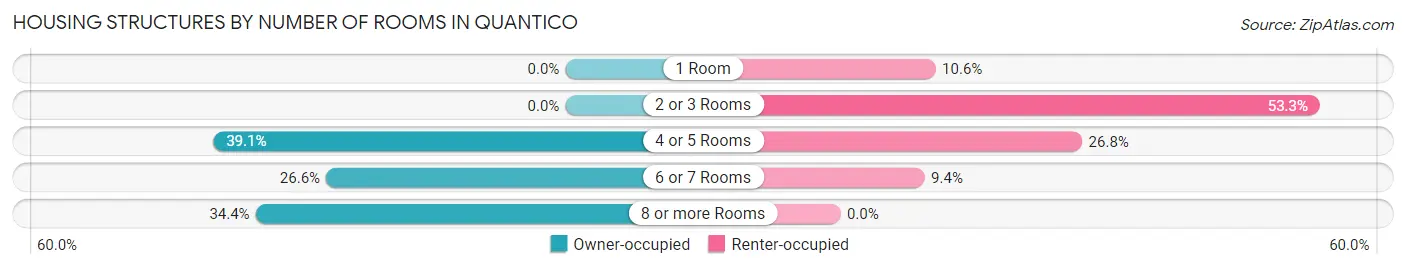
| Number of Rooms | Owner-occupied | Renter-occupied |
| 1 Room | 0 (0.0%) | 26 (10.6%) |
| 2 or 3 Rooms | 0 (0.0%) | 131 (53.2%) |
| 4 or 5 Rooms | 25 (39.1%) | 66 (26.8%) |
| 6 or 7 Rooms | 17 (26.6%) | 23 (9.3%) |
| 8 or more Rooms | 22 (34.4%) | 0 (0.0%) |
| Total | 64 (100.0%) | 246 (100.0%) |
Housing Structure by Heating Type in Quantico
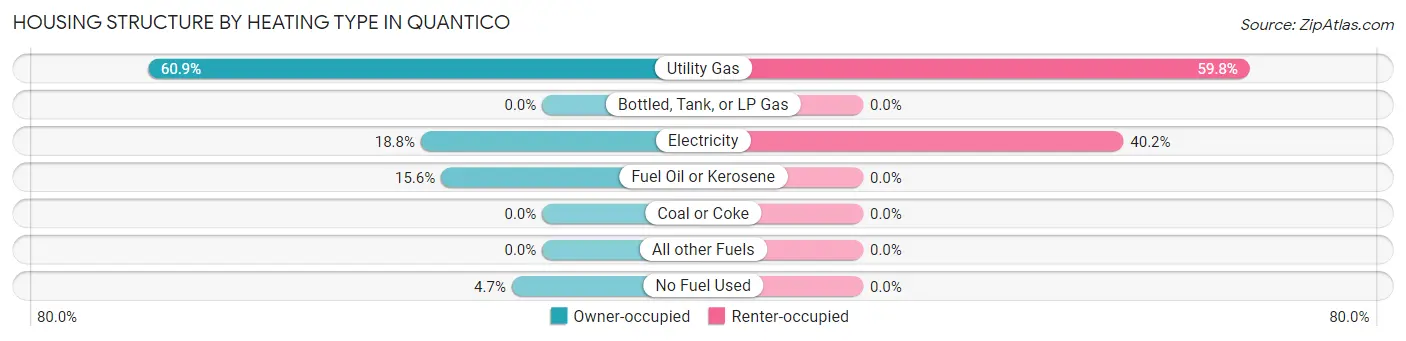
| Heating Type | Owner-occupied | Renter-occupied |
| Utility Gas | 39 (60.9%) | 147 (59.8%) |
| Bottled, Tank, or LP Gas | 0 (0.0%) | 0 (0.0%) |
| Electricity | 12 (18.8%) | 99 (40.2%) |
| Fuel Oil or Kerosene | 10 (15.6%) | 0 (0.0%) |
| Coal or Coke | 0 (0.0%) | 0 (0.0%) |
| All other Fuels | 0 (0.0%) | 0 (0.0%) |
| No Fuel Used | 3 (4.7%) | 0 (0.0%) |
| Total | 64 (100.0%) | 246 (100.0%) |
Household Vehicle Usage in Quantico
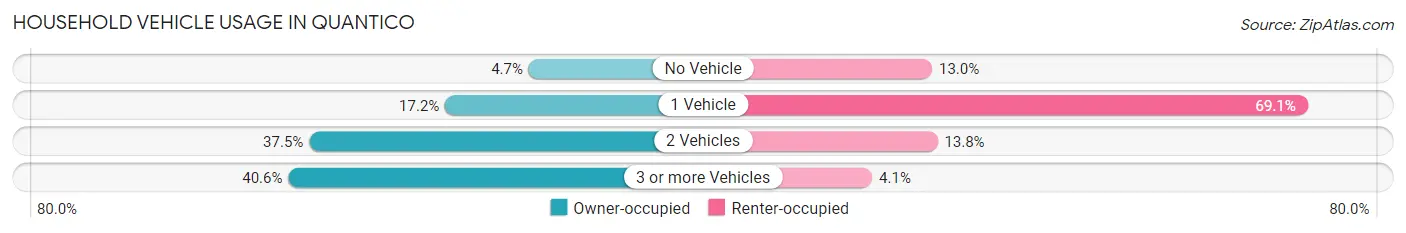
| Vehicles per Household | Owner-occupied | Renter-occupied |
| No Vehicle | 3 (4.7%) | 32 (13.0%) |
| 1 Vehicle | 11 (17.2%) | 170 (69.1%) |
| 2 Vehicles | 24 (37.5%) | 34 (13.8%) |
| 3 or more Vehicles | 26 (40.6%) | 10 (4.1%) |
| Total | 64 (100.0%) | 246 (100.0%) |
Real Estate & Mortgages in Quantico
Real Estate and Mortgage Overview in Quantico
| Characteristic | Without Mortgage | With Mortgage |
| Housing Units | 23 | 41 |
| Median Property Value | - | - |
| Median Household Income | $85,625 | $17 |
| Monthly Housing Costs | $986 | $0 |
| Real Estate Taxes | $3,409 | $5 |
Property Value by Mortgage Status in Quantico
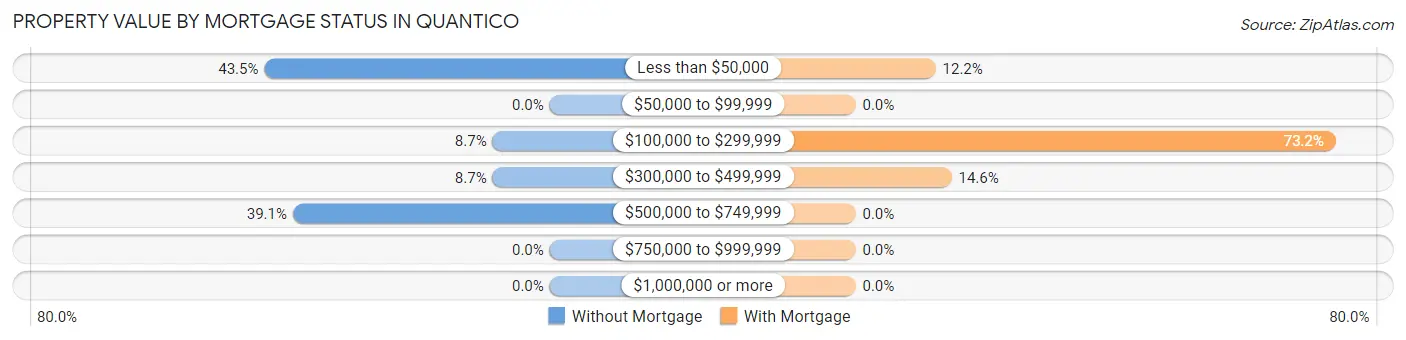
| Property Value | Without Mortgage | With Mortgage |
| Less than $50,000 | 10 (43.5%) | 5 (12.2%) |
| $50,000 to $99,999 | 0 (0.0%) | 0 (0.0%) |
| $100,000 to $299,999 | 2 (8.7%) | 30 (73.2%) |
| $300,000 to $499,999 | 2 (8.7%) | 6 (14.6%) |
| $500,000 to $749,999 | 9 (39.1%) | 0 (0.0%) |
| $750,000 to $999,999 | 0 (0.0%) | 0 (0.0%) |
| $1,000,000 or more | 0 (0.0%) | 0 (0.0%) |
| Total | 23 (100.0%) | 41 (100.0%) |
Household Income by Mortgage Status in Quantico
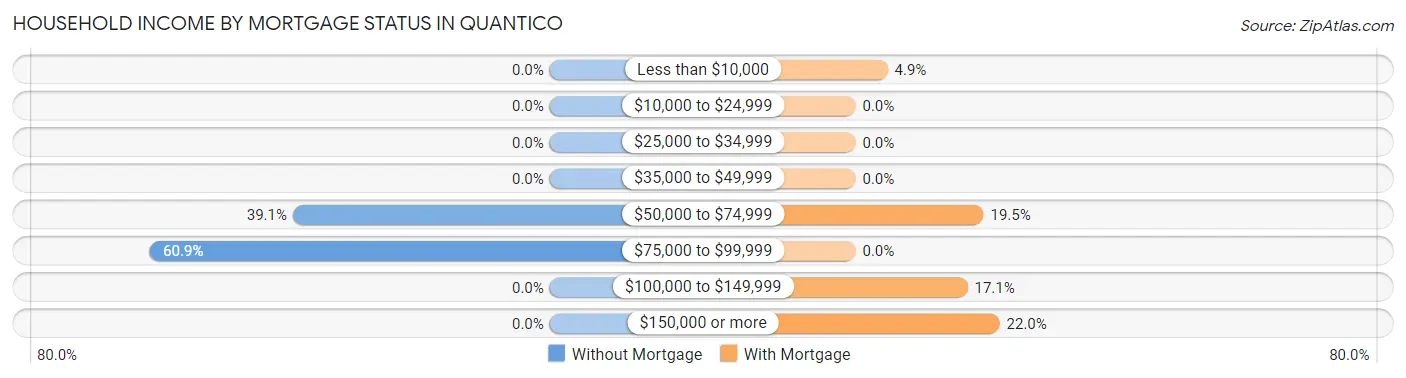
| Household Income | Without Mortgage | With Mortgage |
| Less than $10,000 | 0 (0.0%) | 2 (4.9%) |
| $10,000 to $24,999 | 0 (0.0%) | 0 (0.0%) |
| $25,000 to $34,999 | 0 (0.0%) | 0 (0.0%) |
| $35,000 to $49,999 | 0 (0.0%) | 0 (0.0%) |
| $50,000 to $74,999 | 9 (39.1%) | 8 (19.5%) |
| $75,000 to $99,999 | 14 (60.9%) | 0 (0.0%) |
| $100,000 to $149,999 | 0 (0.0%) | 7 (17.1%) |
| $150,000 or more | 0 (0.0%) | 9 (22.0%) |
| Total | 23 (100.0%) | 41 (100.0%) |
Property Value to Household Income Ratio in Quantico
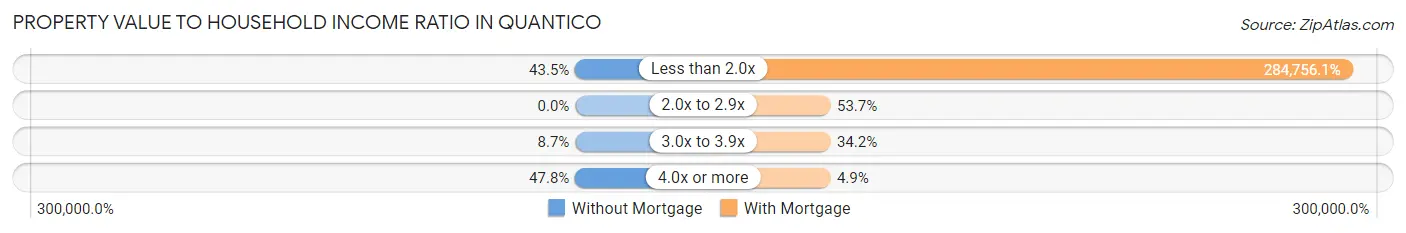
| Value-to-Income Ratio | Without Mortgage | With Mortgage |
| Less than 2.0x | 10 (43.5%) | 116,750 (284,756.1%) |
| 2.0x to 2.9x | 0 (0.0%) | 22 (53.7%) |
| 3.0x to 3.9x | 2 (8.7%) | 14 (34.2%) |
| 4.0x or more | 11 (47.8%) | 2 (4.9%) |
| Total | 23 (100.0%) | 41 (100.0%) |
Real Estate Taxes by Mortgage Status in Quantico
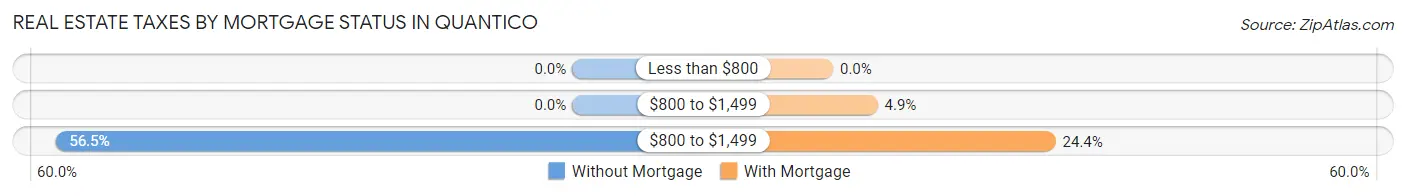
| Property Taxes | Without Mortgage | With Mortgage |
| Less than $800 | 0 (0.0%) | 0 (0.0%) |
| $800 to $1,499 | 0 (0.0%) | 2 (4.9%) |
| $800 to $1,499 | 13 (56.5%) | 10 (24.4%) |
| Total | 23 (100.0%) | 41 (100.0%) |
Health & Disability in Quantico
Health Insurance Coverage by Age in Quantico
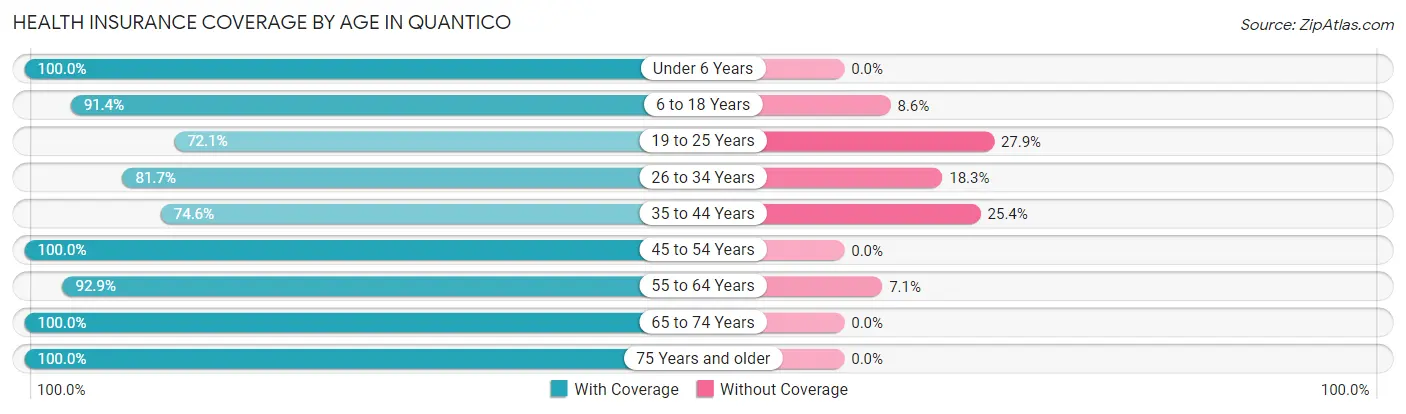
| Age Bracket | With Coverage | Without Coverage |
| Under 6 Years | 19 (100.0%) | 0 (0.0%) |
| 6 to 18 Years | 53 (91.4%) | 5 (8.6%) |
| 19 to 25 Years | 31 (72.1%) | 12 (27.9%) |
| 26 to 34 Years | 76 (81.7%) | 17 (18.3%) |
| 35 to 44 Years | 44 (74.6%) | 15 (25.4%) |
| 45 to 54 Years | 87 (100.0%) | 0 (0.0%) |
| 55 to 64 Years | 105 (92.9%) | 8 (7.1%) |
| 65 to 74 Years | 22 (100.0%) | 0 (0.0%) |
| 75 Years and older | 29 (100.0%) | 0 (0.0%) |
| Total | 466 (89.1%) | 57 (10.9%) |
Health Insurance Coverage by Citizenship Status in Quantico
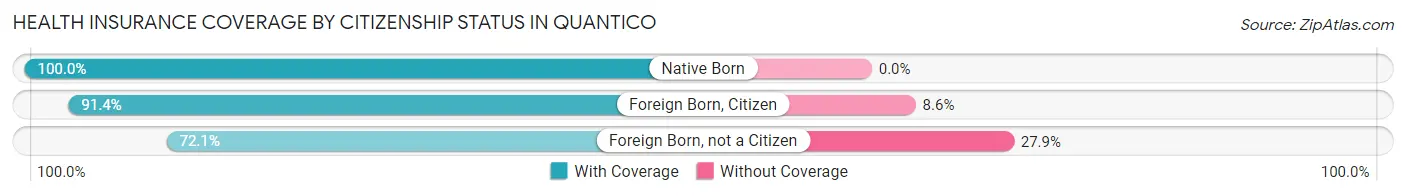
| Citizenship Status | With Coverage | Without Coverage |
| Native Born | 19 (100.0%) | 0 (0.0%) |
| Foreign Born, Citizen | 53 (91.4%) | 5 (8.6%) |
| Foreign Born, not a Citizen | 31 (72.1%) | 12 (27.9%) |
Health Insurance Coverage by Household Income in Quantico
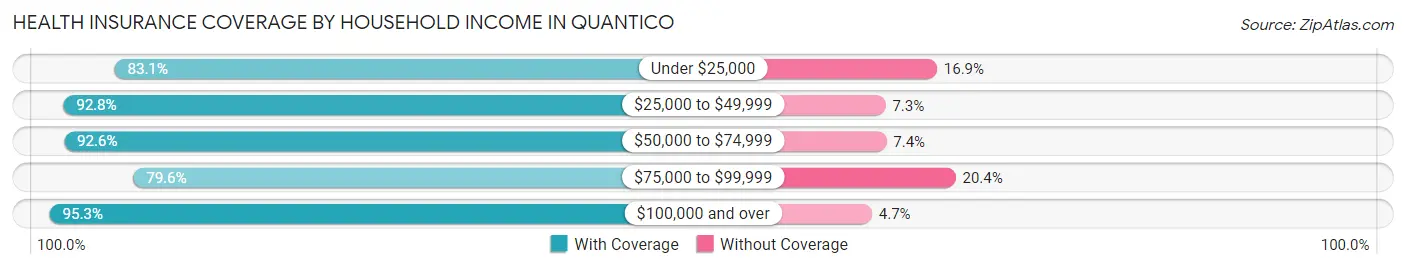
| Household Income | With Coverage | Without Coverage |
| Under $25,000 | 69 (83.1%) | 14 (16.9%) |
| $25,000 to $49,999 | 64 (92.7%) | 5 (7.2%) |
| $50,000 to $74,999 | 125 (92.6%) | 10 (7.4%) |
| $75,000 to $99,999 | 86 (79.6%) | 22 (20.4%) |
| $100,000 and over | 122 (95.3%) | 6 (4.7%) |
Public vs Private Health Insurance Coverage by Age in Quantico
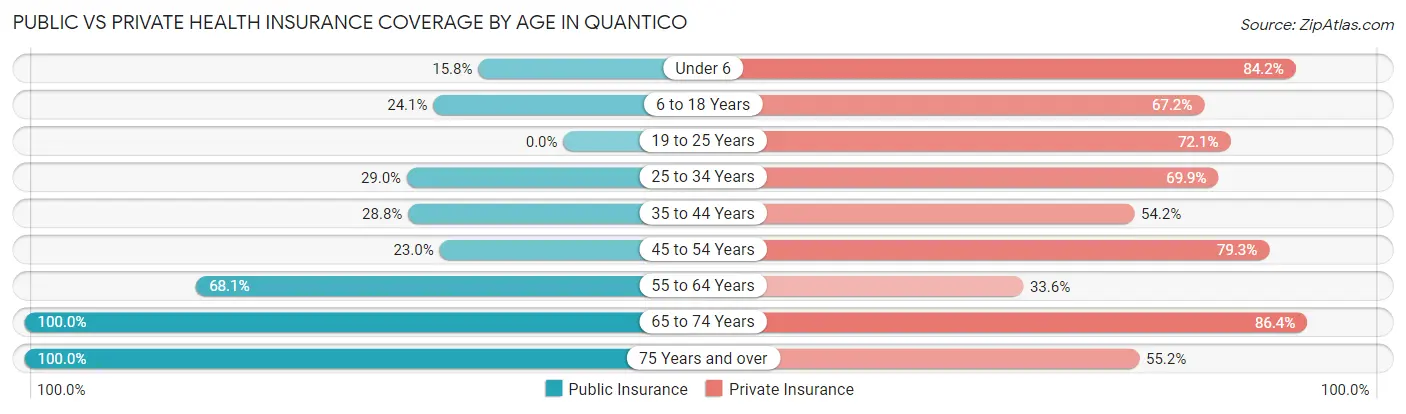
| Age Bracket | Public Insurance | Private Insurance |
| Under 6 | 3 (15.8%) | 16 (84.2%) |
| 6 to 18 Years | 14 (24.1%) | 39 (67.2%) |
| 19 to 25 Years | 0 (0.0%) | 31 (72.1%) |
| 25 to 34 Years | 27 (29.0%) | 65 (69.9%) |
| 35 to 44 Years | 17 (28.8%) | 32 (54.2%) |
| 45 to 54 Years | 20 (23.0%) | 69 (79.3%) |
| 55 to 64 Years | 77 (68.1%) | 38 (33.6%) |
| 65 to 74 Years | 22 (100.0%) | 19 (86.4%) |
| 75 Years and over | 29 (100.0%) | 16 (55.2%) |
| Total | 209 (40.0%) | 325 (62.1%) |
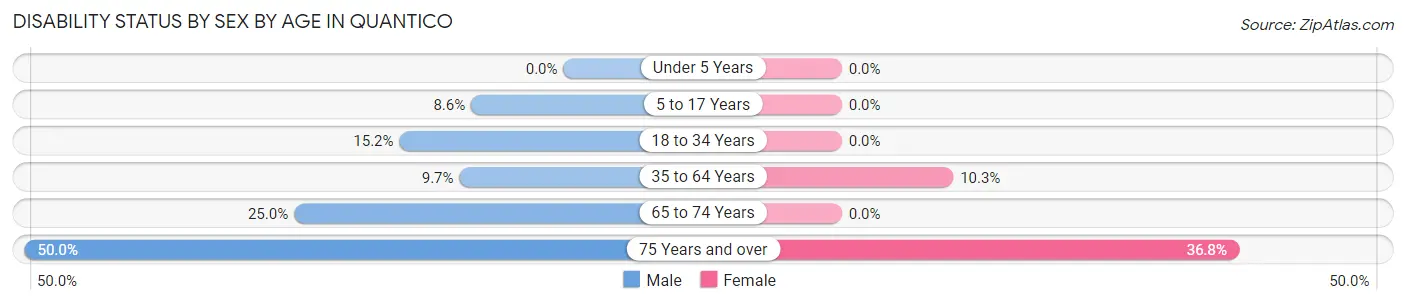
Disability Status by Sex by Age in Quantico
| Age Bracket | Male | Female |
| Under 5 Years | 0 (0.0%) | 0 (0.0%) |
| 5 to 17 Years | 3 (8.6%) | 0 (0.0%) |
| 18 to 34 Years | 7 (15.2%) | 0 (0.0%) |
| 35 to 64 Years | 11 (9.7%) | 15 (10.3%) |
| 65 to 74 Years | 4 (25.0%) | 0 (0.0%) |
| 75 Years and over | 5 (50.0%) | 7 (36.8%) |
Disability Class by Sex by Age in Quantico
Disability Class: Hearing Difficulty
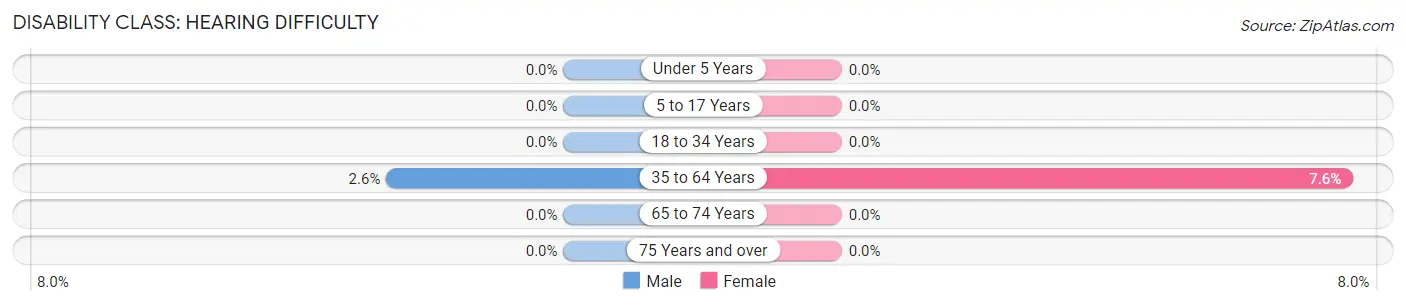
| Age Bracket | Male | Female |
| Under 5 Years | 0 (0.0%) | 0 (0.0%) |
| 5 to 17 Years | 0 (0.0%) | 0 (0.0%) |
| 18 to 34 Years | 0 (0.0%) | 0 (0.0%) |
| 35 to 64 Years | 3 (2.6%) | 11 (7.6%) |
| 65 to 74 Years | 0 (0.0%) | 0 (0.0%) |
| 75 Years and over | 0 (0.0%) | 0 (0.0%) |
Disability Class: Vision Difficulty
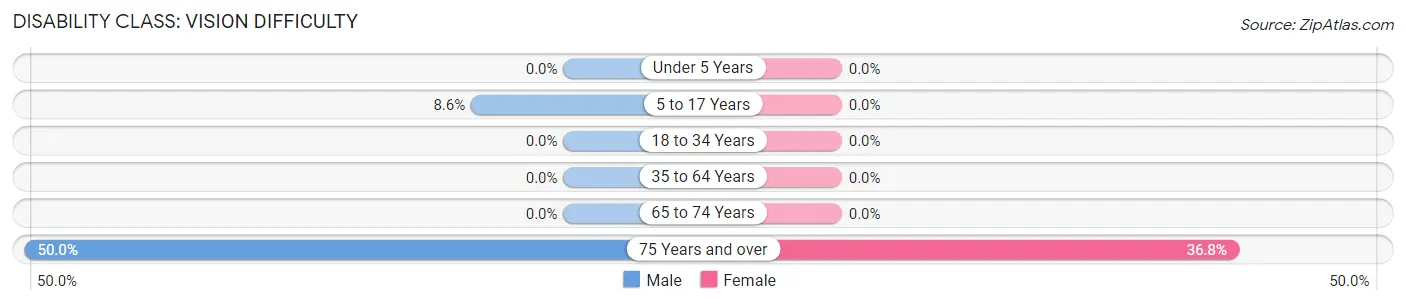
| Age Bracket | Male | Female |
| Under 5 Years | 0 (0.0%) | 0 (0.0%) |
| 5 to 17 Years | 3 (8.6%) | 0 (0.0%) |
| 18 to 34 Years | 0 (0.0%) | 0 (0.0%) |
| 35 to 64 Years | 0 (0.0%) | 0 (0.0%) |
| 65 to 74 Years | 0 (0.0%) | 0 (0.0%) |
| 75 Years and over | 5 (50.0%) | 7 (36.8%) |
Disability Class: Cognitive Difficulty
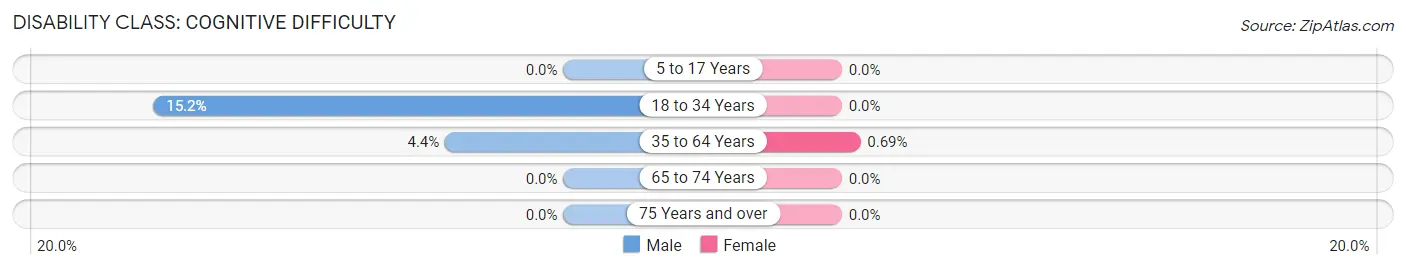
| Age Bracket | Male | Female |
| 5 to 17 Years | 0 (0.0%) | 0 (0.0%) |
| 18 to 34 Years | 7 (15.2%) | 0 (0.0%) |
| 35 to 64 Years | 5 (4.4%) | 1 (0.7%) |
| 65 to 74 Years | 0 (0.0%) | 0 (0.0%) |
| 75 Years and over | 0 (0.0%) | 0 (0.0%) |
Disability Class: Ambulatory Difficulty
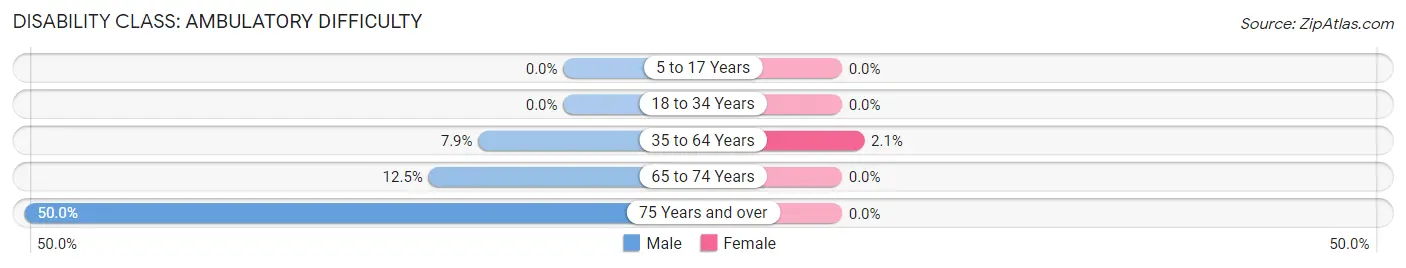
| Age Bracket | Male | Female |
| 5 to 17 Years | 0 (0.0%) | 0 (0.0%) |
| 18 to 34 Years | 0 (0.0%) | 0 (0.0%) |
| 35 to 64 Years | 9 (7.9%) | 3 (2.1%) |
| 65 to 74 Years | 2 (12.5%) | 0 (0.0%) |
| 75 Years and over | 5 (50.0%) | 0 (0.0%) |
Disability Class: Self-Care Difficulty
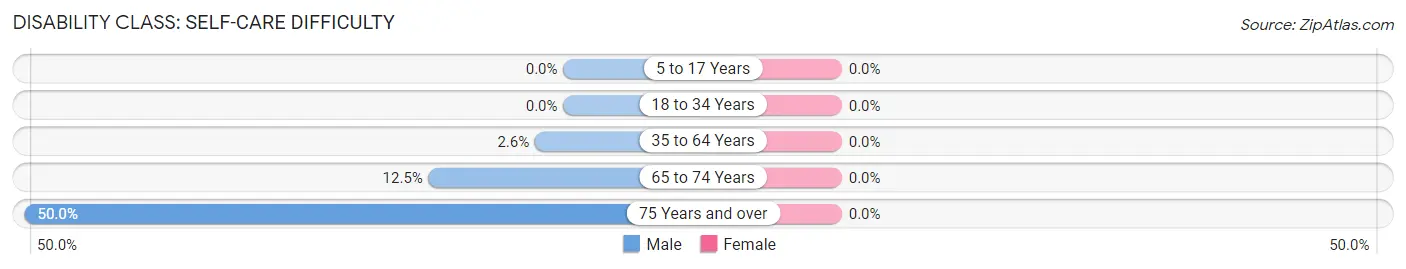
| Age Bracket | Male | Female |
| 5 to 17 Years | 0 (0.0%) | 0 (0.0%) |
| 18 to 34 Years | 0 (0.0%) | 0 (0.0%) |
| 35 to 64 Years | 3 (2.6%) | 0 (0.0%) |
| 65 to 74 Years | 2 (12.5%) | 0 (0.0%) |
| 75 Years and over | 5 (50.0%) | 0 (0.0%) |
Technology Access in Quantico
Computing Device Access in Quantico
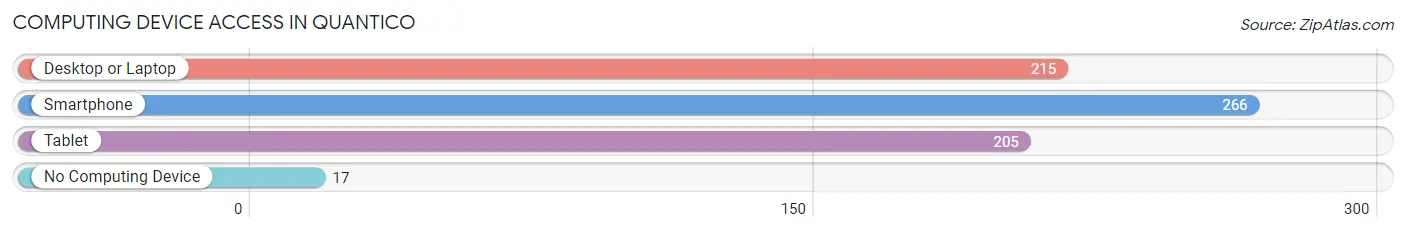
| Device Type | # Households | % Households |
| Desktop or Laptop | 215 | 69.4% |
| Smartphone | 266 | 85.8% |
| Tablet | 205 | 66.1% |
| No Computing Device | 17 | 5.5% |
| Total | 310 | 100.0% |
Internet Access in Quantico
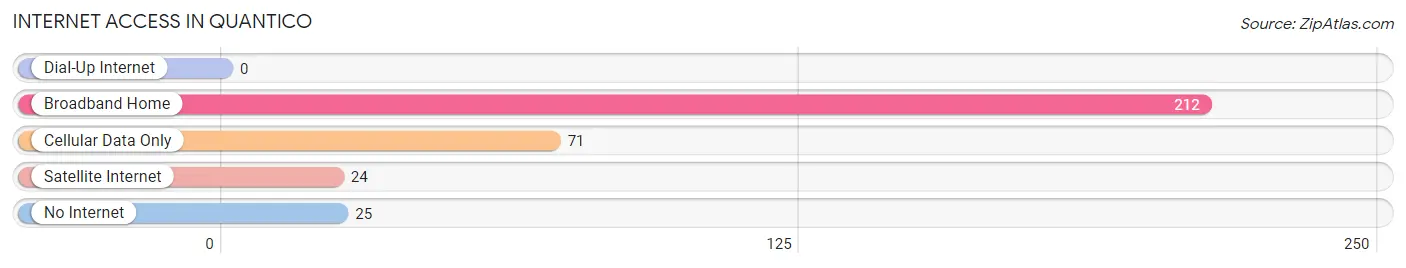
| Internet Type | # Households | % Households |
| Dial-Up Internet | 0 | 0.0% |
| Broadband Home | 212 | 68.4% |
| Cellular Data Only | 71 | 22.9% |
| Satellite Internet | 24 | 7.7% |
| No Internet | 25 | 8.1% |
| Total | 310 | 100.0% |
Quantico Summary
History
The area now known as Quantico, Virginia has a long and varied history. The area was first inhabited by Native Americans, including the Doeg, Piscataway, and Iroquois tribes. The first European settlers arrived in the area in the late 1600s, and the area was officially established as Quantico in 1795.
The town of Quantico was originally a small fishing village, but it quickly grew in importance as a port and trading center. During the Civil War, Quantico served as a major supply depot for the Confederate Army. After the war, the town continued to grow and prosper, becoming a popular tourist destination.
In 1917, the United States Marine Corps established a base in Quantico, which has since become one of the largest and most important military installations in the country. The base has played a major role in the history of the town, and it continues to be a major employer in the area.
Geography
Quantico is located in Prince William County, Virginia, about 30 miles south of Washington, D.C. The town is situated on the Potomac River, and it is bordered by the Quantico National Wildlife Refuge to the north and the Marine Corps Base Quantico to the south.
The town is located in a humid subtropical climate zone, and it experiences hot, humid summers and mild winters. The average annual temperature is around 60 degrees Fahrenheit, and the average annual precipitation is around 40 inches.
Economy
The economy of Quantico is largely driven by the Marine Corps Base, which is the largest employer in the area. The base provides jobs for thousands of people, and it also serves as a major source of economic activity for the town.
In addition to the base, Quantico is home to a number of other businesses, including retail stores, restaurants, and hotels. The town also has a thriving tourism industry, as it is a popular destination for visitors from all over the world.
Demographics
As of the 2010 census, the population of Quantico was 4,452. The racial makeup of the town was 79.3% White, 11.2% African American, 0.7% Native American, 2.2% Asian, 0.1% Pacific Islander, and 6.5% from other races. The median household income was $60,945, and the median family income was $71,945.
The town is home to a large number of military personnel, and the population is highly educated. Over 90% of the population has at least a high school diploma, and nearly 40% have a bachelor’s degree or higher.
Conclusion
Quantico, Virginia is a small town with a long and varied history. The town is home to a large military base, which is the largest employer in the area. The town also has a thriving tourism industry, and it is a popular destination for visitors from all over the world. The population of Quantico is highly educated, and the median household income is above the national average.
Common Questions
What is Per Capita Income in Quantico?
Per Capita income in Quantico is $42,014.
What is the Median Family Income in Quantico?
Median Family Income in Quantico is $85,278.
What is the Median Household income in Quantico?
Median Household Income in Quantico is $51,611.
What is Income or Wage Gap in Quantico?
Income or Wage Gap in Quantico is 48.3%.
Women in Quantico earn 51.7 cents for every dollar earned by a man.
What is Inequality or Gini Index in Quantico?
Inequality or Gini Index in Quantico is 0.46.
What is the Total Population of Quantico?
Total Population of Quantico is 543.
What is the Total Male Population of Quantico?
Total Male Population of Quantico is 244.
What is the Total Female Population of Quantico?
Total Female Population of Quantico is 299.
What is the Ratio of Males per 100 Females in Quantico?
There are 81.61 Males per 100 Females in Quantico.
What is the Ratio of Females per 100 Males in Quantico?
There are 122.54 Females per 100 Males in Quantico.
What is the Median Population Age in Quantico?
Median Population Age in Quantico is 41.1 Years.
What is the Average Family Size in Quantico
Average Family Size in Quantico is 2.8 People.
What is the Average Household Size in Quantico
Average Household Size in Quantico is 1.8 People.
How Large is the Labor Force in Quantico?
There are 375 People in the Labor Forcein in Quantico.
What is the Percentage of People in the Labor Force in Quantico?
78.8% of People are in the Labor Force in Quantico.
What is the Unemployment Rate in Quantico?
Unemployment Rate in Quantico is 4.5%.