Gratton, VA Map & Demographics
Gratton Map
Gratton Overview
$31,985
PER CAPITA INCOME
$72,422
AVG FAMILY INCOME
$72,466
AVG HOUSEHOLD INCOME
8.4%
WAGE / INCOME GAP [ % ]
91.6¢/ $1
WAGE / INCOME GAP [ $ ]
0.34
INEQUALITY / GINI INDEX
1,176
TOTAL POPULATION
686
MALE POPULATION
490
FEMALE POPULATION
140.00
MALES / 100 FEMALES
71.43
FEMALES / 100 MALES
40.2
MEDIAN AGE
2.9
AVG FAMILY SIZE
3.0
AVG HOUSEHOLD SIZE
512
LABOR FORCE [ PEOPLE ]
52.6%
PERCENT IN LABOR FORCE
Income in Gratton
Income Overview in Gratton
Per Capita Income in Gratton is $31,985, while median incomes of families and households are $72,422 and $72,466 respectively.
| Characteristic | Number | Measure |
| Per Capita Income | 1,176 | $31,985 |
| Median Family Income | 399 | $72,422 |
| Mean Family Income | 399 | $89,098 |
| Median Household Income | 399 | $72,466 |
| Mean Household Income | 399 | $89,650 |
| Income Deficit | 399 | $0 |
| Wage / Income Gap (%) | 1,176 | 8.40% |
| Wage / Income Gap ($) | 1,176 | 91.60¢ per $1 |
| Gini / Inequality Index | 1,176 | 0.34 |
Earnings by Sex in Gratton
Average Earnings in Gratton are $39,982, $39,732 for men and $43,375 for women, a difference of 8.4%.
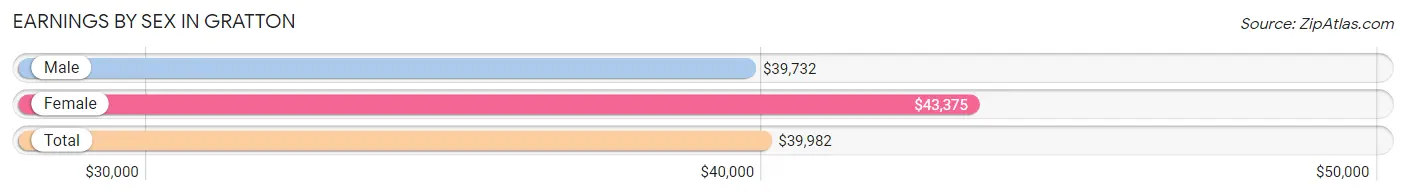
| Sex | Number | Average Earnings |
| Male | 377 (71.5%) | $39,732 |
| Female | 150 (28.5%) | $43,375 |
| Total | 527 (100.0%) | $39,982 |
Earnings by Sex by Income Bracket in Gratton
The most common earnings brackets in Gratton are $75,000 to $99,999 for men (78 | 20.7%) and $75,000 to $99,999 for women (35 | 23.3%).
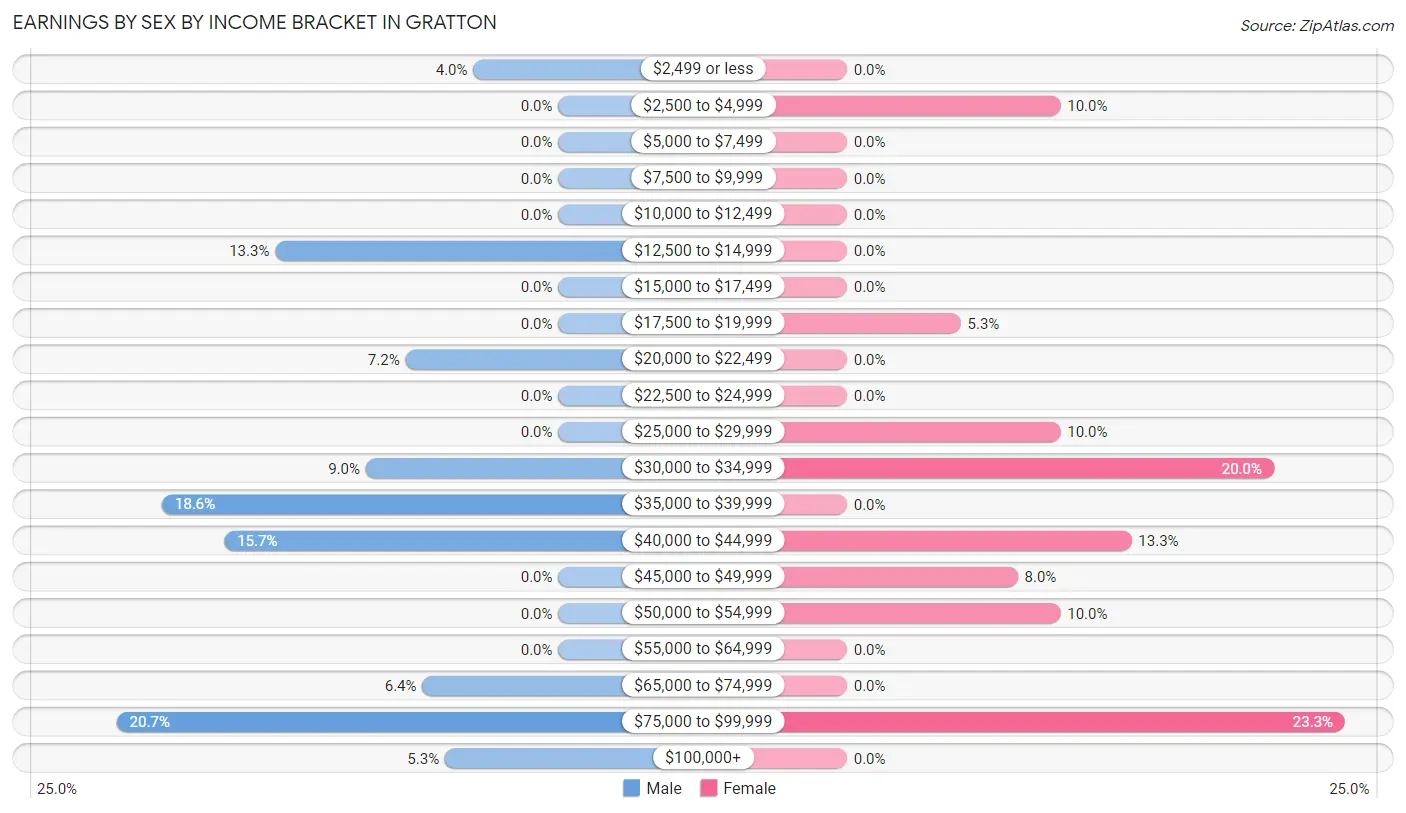
| Income | Male | Female |
| $2,499 or less | 15 (4.0%) | 0 (0.0%) |
| $2,500 to $4,999 | 0 (0.0%) | 15 (10.0%) |
| $5,000 to $7,499 | 0 (0.0%) | 0 (0.0%) |
| $7,500 to $9,999 | 0 (0.0%) | 0 (0.0%) |
| $10,000 to $12,499 | 0 (0.0%) | 0 (0.0%) |
| $12,500 to $14,999 | 50 (13.3%) | 0 (0.0%) |
| $15,000 to $17,499 | 0 (0.0%) | 0 (0.0%) |
| $17,500 to $19,999 | 0 (0.0%) | 8 (5.3%) |
| $20,000 to $22,499 | 27 (7.2%) | 0 (0.0%) |
| $22,500 to $24,999 | 0 (0.0%) | 0 (0.0%) |
| $25,000 to $29,999 | 0 (0.0%) | 15 (10.0%) |
| $30,000 to $34,999 | 34 (9.0%) | 30 (20.0%) |
| $35,000 to $39,999 | 70 (18.6%) | 0 (0.0%) |
| $40,000 to $44,999 | 59 (15.7%) | 20 (13.3%) |
| $45,000 to $49,999 | 0 (0.0%) | 12 (8.0%) |
| $50,000 to $54,999 | 0 (0.0%) | 15 (10.0%) |
| $55,000 to $64,999 | 0 (0.0%) | 0 (0.0%) |
| $65,000 to $74,999 | 24 (6.4%) | 0 (0.0%) |
| $75,000 to $99,999 | 78 (20.7%) | 35 (23.3%) |
| $100,000+ | 20 (5.3%) | 0 (0.0%) |
| Total | 377 (100.0%) | 150 (100.0%) |
Earnings by Sex by Educational Attainment in Gratton
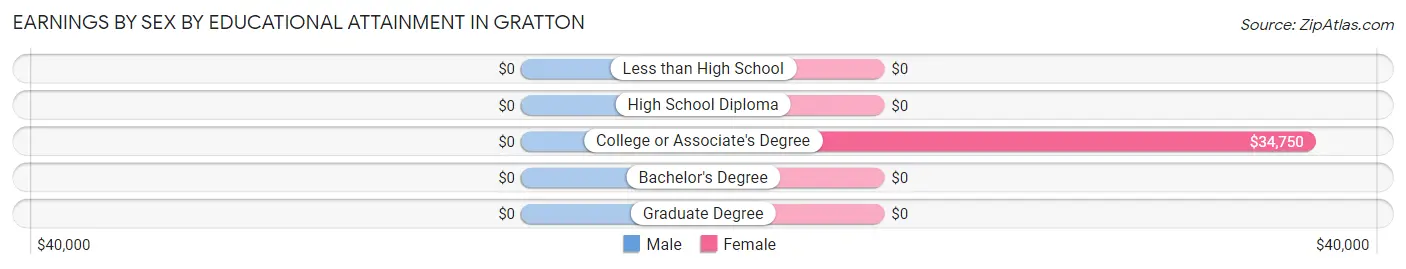
| Educational Attainment | Male Income | Female Income |
| Less than High School | - | - |
| High School Diploma | - | - |
| College or Associate's Degree | - | - |
| Bachelor's Degree | - | - |
| Graduate Degree | - | - |
| Total | - | - |
Family Income in Gratton
Family Income Brackets in Gratton
According to the Gratton family income data, there are 131 families falling into the $100,000 to $149,999 income range, which is the most common income bracket and makes up 32.8% of all families.
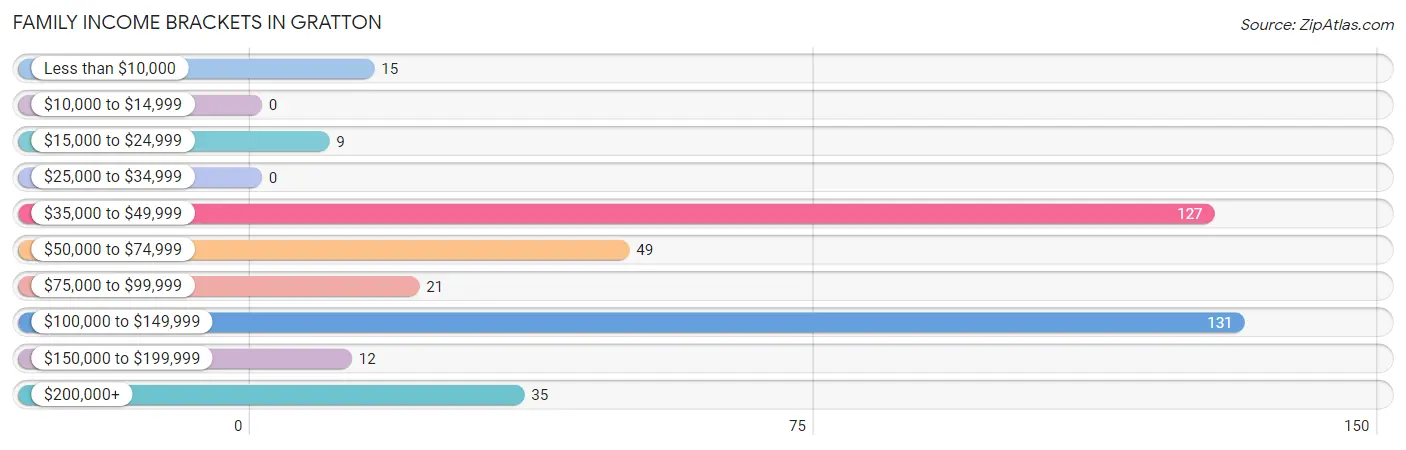
| Income Bracket | # Families | % Families |
| Less than $10,000 | 15 | 3.8% |
| $10,000 to $14,999 | 0 | 0.0% |
| $15,000 to $24,999 | 9 | 2.3% |
| $25,000 to $34,999 | 0 | 0.0% |
| $35,000 to $49,999 | 127 | 31.8% |
| $50,000 to $74,999 | 49 | 12.3% |
| $75,000 to $99,999 | 21 | 5.3% |
| $100,000 to $149,999 | 131 | 32.8% |
| $150,000 to $199,999 | 12 | 3.0% |
| $200,000+ | 35 | 8.8% |
Family Income by Famaliy Size in Gratton
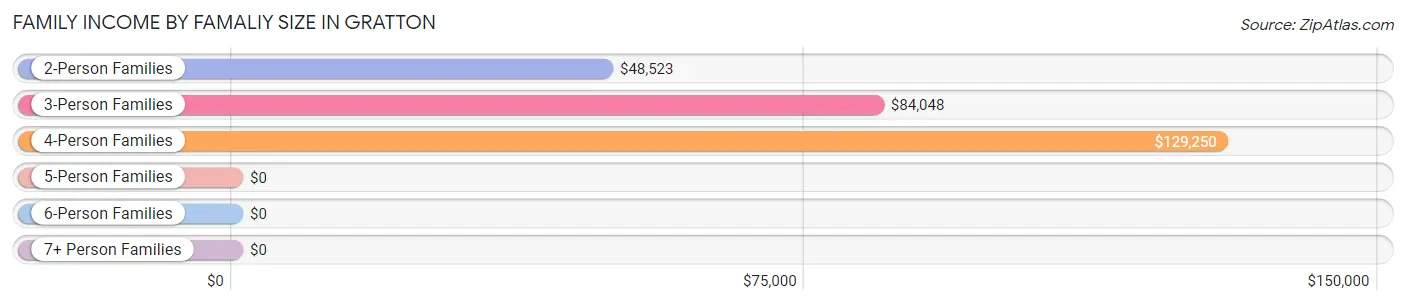
4-person families (97 | 24.3%) account for the highest median family income in Gratton with $129,250 per family, while 4-person families (97 | 24.3%) have the highest median income of $32,312 per family member.
| Income Bracket | # Families | Median Income |
| 2-Person Families | 246 (61.7%) | $48,523 |
| 3-Person Families | 56 (14.0%) | $84,048 |
| 4-Person Families | 97 (24.3%) | $129,250 |
| 5-Person Families | 0 (0.0%) | $0 |
| 6-Person Families | 0 (0.0%) | $0 |
| 7+ Person Families | 0 (0.0%) | $0 |
| Total | 399 (100.0%) | $72,422 |
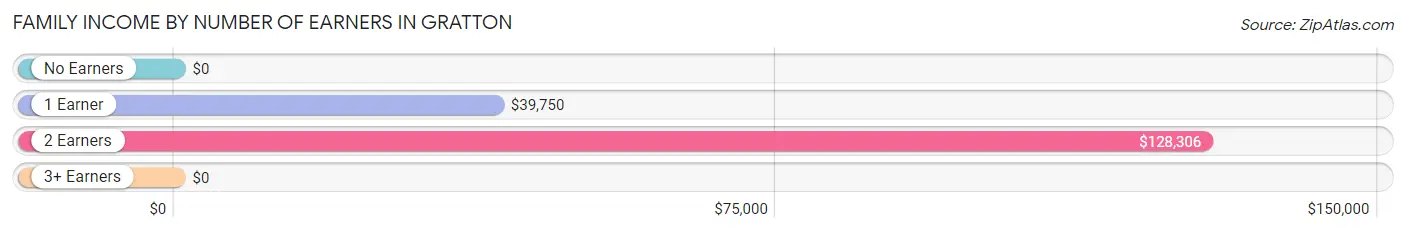
Family Income by Number of Earners in Gratton
| Number of Earners | # Families | Median Income |
| No Earners | 114 (28.6%) | $0 |
| 1 Earner | 156 (39.1%) | $39,750 |
| 2 Earners | 85 (21.3%) | $128,306 |
| 3+ Earners | 44 (11.0%) | $0 |
| Total | 399 (100.0%) | $72,422 |
Household Income in Gratton
Household Income Brackets in Gratton
With 131 households falling in the category, the $100,000 to $149,999 income range is the most frequent in Gratton, accounting for 32.8% of all households.
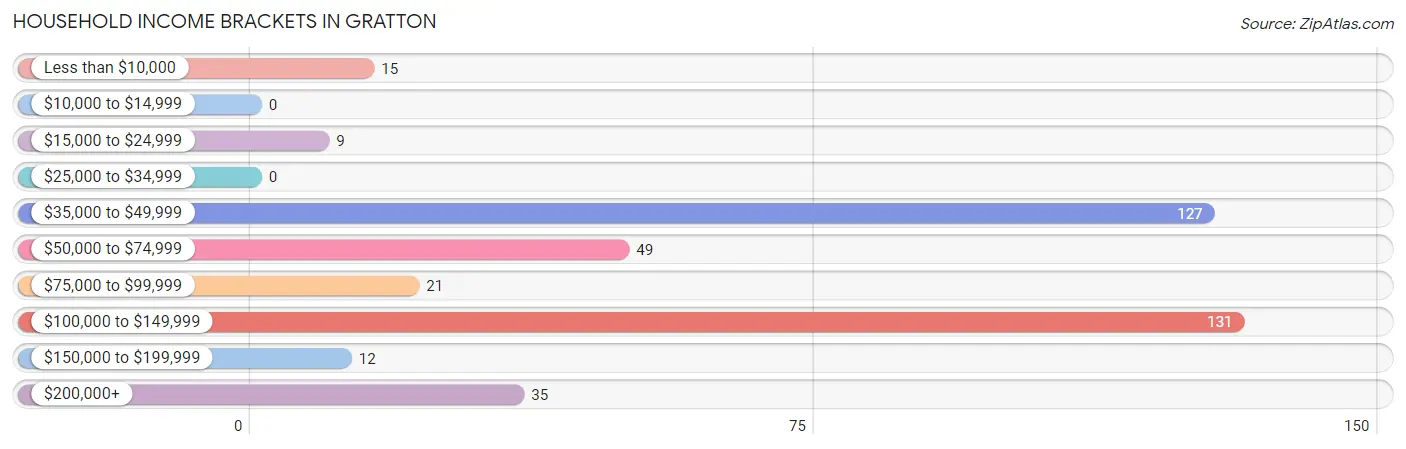
| Income Bracket | # Households | % Households |
| Less than $10,000 | 15 | 3.8% |
| $10,000 to $14,999 | 0 | 0.0% |
| $15,000 to $24,999 | 9 | 2.3% |
| $25,000 to $34,999 | 0 | 0.0% |
| $35,000 to $49,999 | 127 | 31.8% |
| $50,000 to $74,999 | 49 | 12.3% |
| $75,000 to $99,999 | 21 | 5.3% |
| $100,000 to $149,999 | 131 | 32.8% |
| $150,000 to $199,999 | 12 | 3.0% |
| $200,000+ | 35 | 8.8% |
Household Income by Householder Age in Gratton
The median household income in Gratton is $72,466, with the highest median household income of $129,056 found in the 25 to 44 years age bracket for the primary householder. A total of 72 households (18.0%) fall into this category. Meanwhile, the 15 to 24 years age bracket for the primary householder has the lowest median household income of $0, with 70 households (17.5%) in this group.
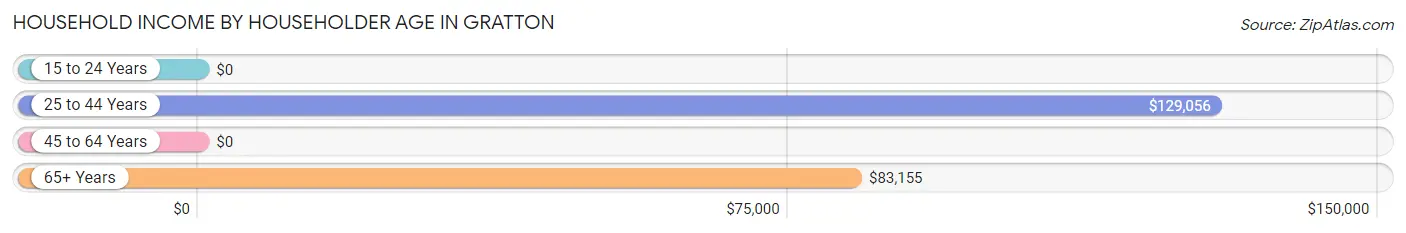
| Income Bracket | # Households | Median Income |
| 15 to 24 Years | 70 (17.5%) | $0 |
| 25 to 44 Years | 72 (18.0%) | $129,056 |
| 45 to 64 Years | 86 (21.5%) | $0 |
| 65+ Years | 171 (42.9%) | $83,155 |
| Total | 399 (100.0%) | $72,466 |
Poverty in Gratton
Income Below Poverty by Sex and Age in Gratton
With 2.2% poverty level for males and 15.7% for females among the residents of Gratton, 55 to 64 year old males and 18 to 24 year old females are the most vulnerable to poverty, with 15 males (29.4%) and 19 females (100.0%) in their respective age groups living below the poverty level.
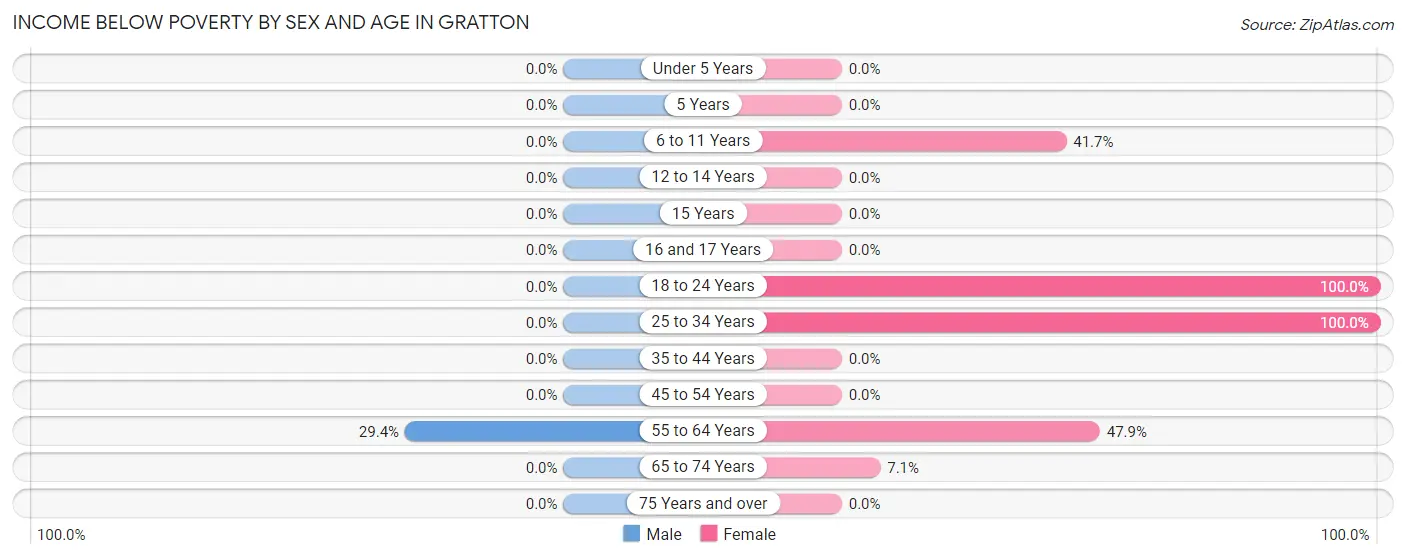
| Age Bracket | Male | Female |
| Under 5 Years | 0 (0.0%) | 0 (0.0%) |
| 5 Years | 0 (0.0%) | 0 (0.0%) |
| 6 to 11 Years | 0 (0.0%) | 10 (41.7%) |
| 12 to 14 Years | 0 (0.0%) | 0 (0.0%) |
| 15 Years | 0 (0.0%) | 0 (0.0%) |
| 16 and 17 Years | 0 (0.0%) | 0 (0.0%) |
| 18 to 24 Years | 0 (0.0%) | 19 (100.0%) |
| 25 to 34 Years | 0 (0.0%) | 5 (100.0%) |
| 35 to 44 Years | 0 (0.0%) | 0 (0.0%) |
| 45 to 54 Years | 0 (0.0%) | 0 (0.0%) |
| 55 to 64 Years | 15 (29.4%) | 34 (47.9%) |
| 65 to 74 Years | 0 (0.0%) | 9 (7.1%) |
| 75 Years and over | 0 (0.0%) | 0 (0.0%) |
| Total | 15 (2.2%) | 77 (15.7%) |
Income Above Poverty by Sex and Age in Gratton
According to the poverty statistics in Gratton, males aged 6 to 11 years and females aged under 5 years are the age groups that are most secure financially, with 100.0% of males and 100.0% of females in these age groups living above the poverty line.
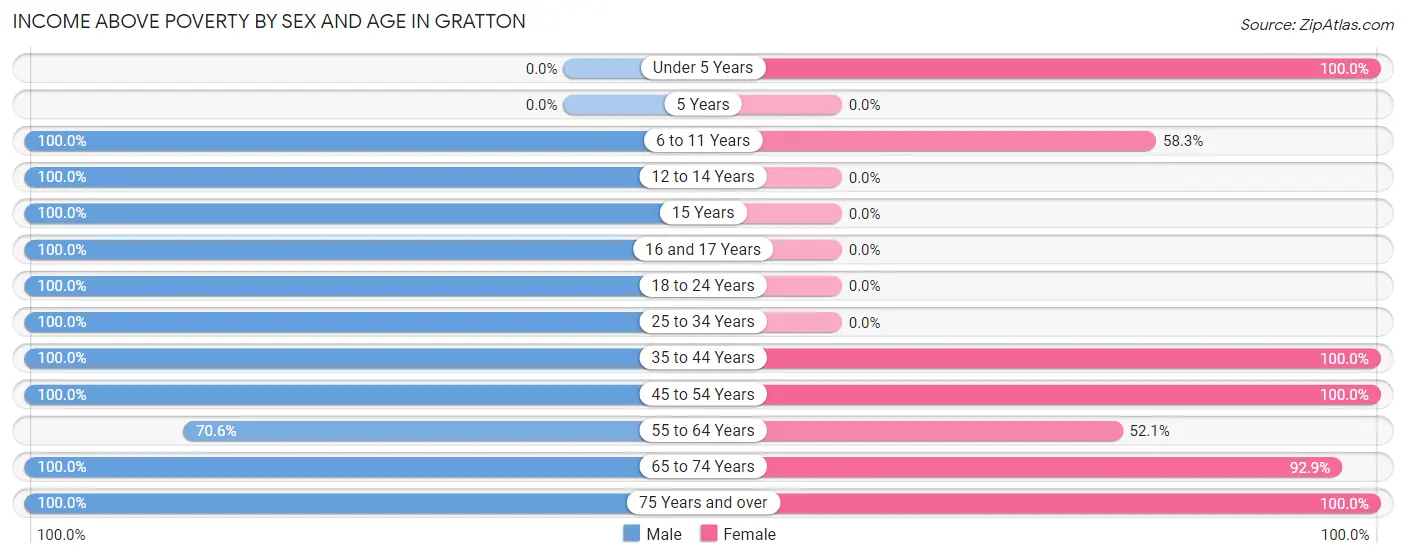
| Age Bracket | Male | Female |
| Under 5 Years | 0 (0.0%) | 108 (100.0%) |
| 5 Years | 0 (0.0%) | 0 (0.0%) |
| 6 to 11 Years | 30 (100.0%) | 14 (58.3%) |
| 12 to 14 Years | 22 (100.0%) | 0 (0.0%) |
| 15 Years | 18 (100.0%) | 0 (0.0%) |
| 16 and 17 Years | 73 (100.0%) | 0 (0.0%) |
| 18 to 24 Years | 114 (100.0%) | 0 (0.0%) |
| 25 to 34 Years | 46 (100.0%) | 0 (0.0%) |
| 35 to 44 Years | 118 (100.0%) | 87 (100.0%) |
| 45 to 54 Years | 53 (100.0%) | 35 (100.0%) |
| 55 to 64 Years | 36 (70.6%) | 37 (52.1%) |
| 65 to 74 Years | 145 (100.0%) | 117 (92.9%) |
| 75 Years and over | 16 (100.0%) | 15 (100.0%) |
| Total | 671 (97.8%) | 413 (84.3%) |
Income Below Poverty Among Married-Couple Families in Gratton
The poverty statistics for married-couple families in Gratton show that 5.2% or 15 of the total 288 families live below the poverty line. Families with no children have the highest poverty rate of 7.5%, comprising of 15 families. On the other hand, families with 1 or 2 children have the lowest poverty rate of 0.0%, which includes 0 families.
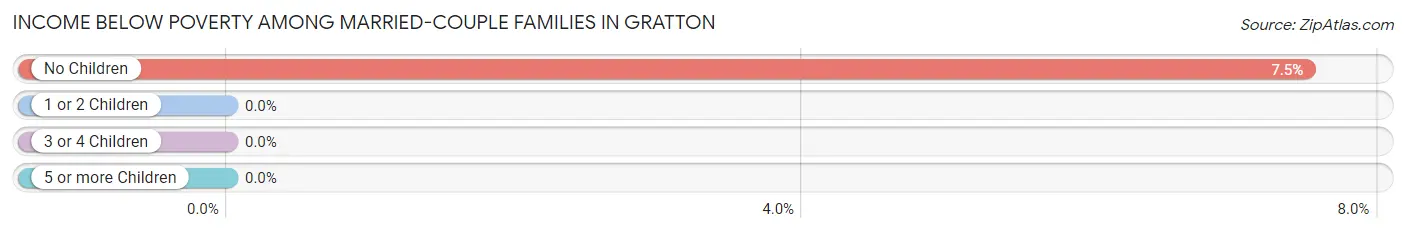
| Children | Above Poverty | Below Poverty |
| No Children | 185 (92.5%) | 15 (7.5%) |
| 1 or 2 Children | 88 (100.0%) | 0 (0.0%) |
| 3 or 4 Children | 0 (0.0%) | 0 (0.0%) |
| 5 or more Children | 0 (0.0%) | 0 (0.0%) |
| Total | 273 (94.8%) | 15 (5.2%) |
Income Below Poverty Among Single-Parent Households in Gratton
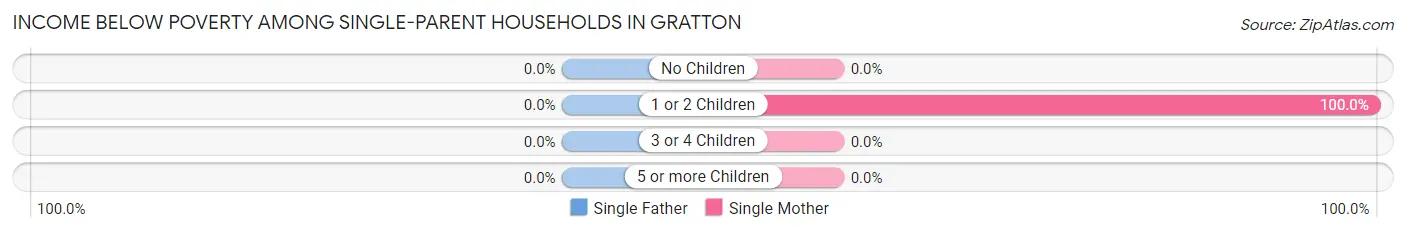
| Children | Single Father | Single Mother |
| No Children | 0 (0.0%) | 0 (0.0%) |
| 1 or 2 Children | 0 (0.0%) | 9 (100.0%) |
| 3 or 4 Children | 0 (0.0%) | 0 (0.0%) |
| 5 or more Children | 0 (0.0%) | 0 (0.0%) |
| Total | 0 (0.0%) | 9 (69.2%) |
Income Below Poverty Among Married-Couple vs Single-Parent Households in Gratton
The poverty data for Gratton shows that 15 of the married-couple family households (5.2%) and 9 of the single-parent households (8.1%) are living below the poverty level. Within the married-couple family households, those with no children have the highest poverty rate, with 15 households (7.5%) falling below the poverty line. Among the single-parent households, those with 1 or 2 children have the highest poverty rate, with 9 household (10.5%) living below poverty.
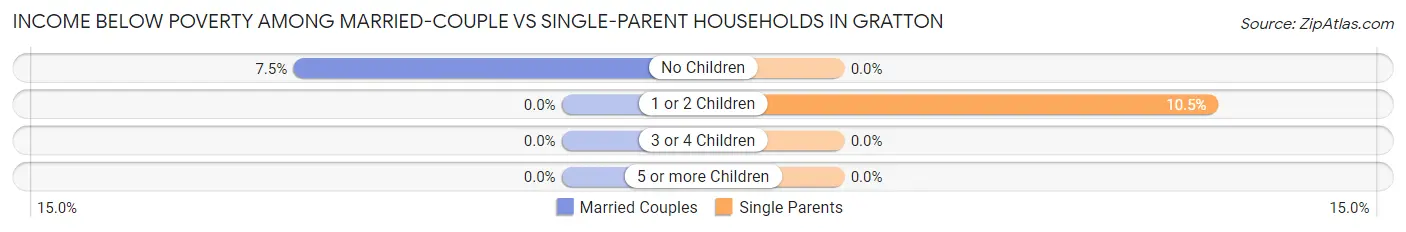
| Children | Married-Couple Families | Single-Parent Households |
| No Children | 15 (7.5%) | 0 (0.0%) |
| 1 or 2 Children | 0 (0.0%) | 9 (10.5%) |
| 3 or 4 Children | 0 (0.0%) | 0 (0.0%) |
| 5 or more Children | 0 (0.0%) | 0 (0.0%) |
| Total | 15 (5.2%) | 9 (8.1%) |
Race in Gratton
The most populous races in Gratton are White / Caucasian (1,060 | 90.1%), Hispanic or Latino (59 | 5.0%), and Some other Race (59 | 5.0%).
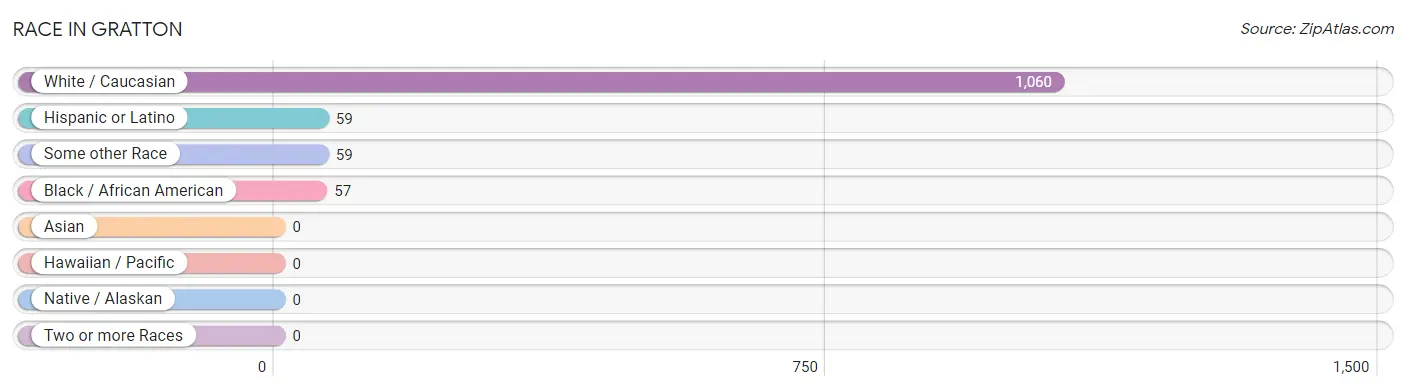
| Race | # Population | % Population |
| Asian | 0 | 0.0% |
| Black / African American | 57 | 4.9% |
| Hawaiian / Pacific | 0 | 0.0% |
| Hispanic or Latino | 59 | 5.0% |
| Native / Alaskan | 0 | 0.0% |
| White / Caucasian | 1,060 | 90.1% |
| Two or more Races | 0 | 0.0% |
| Some other Race | 59 | 5.0% |
| Total | 1,176 | 100.0% |
Ancestry in Gratton
The most populous ancestries reported in Gratton are American (250 | 21.3%), English (87 | 7.4%), German (72 | 6.1%), Scandinavian (70 | 5.9%), and Scottish (70 | 5.9%), together accounting for 46.7% of all Gratton residents.
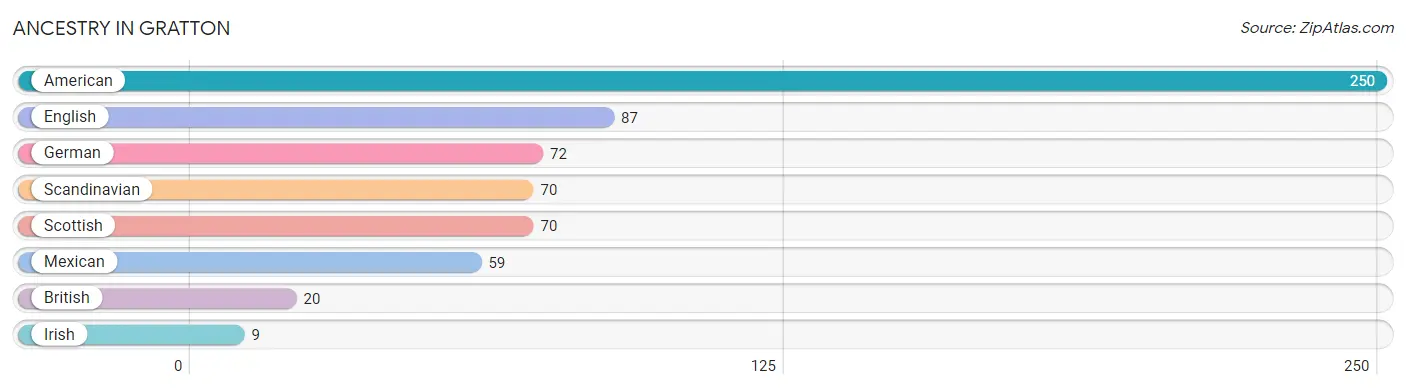
| Ancestry | # Population | % Population |
| American | 250 | 21.3% |
| British | 20 | 1.7% |
| English | 87 | 7.4% |
| German | 72 | 6.1% |
| Irish | 9 | 0.8% |
| Mexican | 59 | 5.0% |
| Scandinavian | 70 | 5.9% |
| Scottish | 70 | 5.9% | View All 8 Rows |
Immigrants in Gratton

| Immigration Origin | # Population | % Population | View All 0 Rows |
Sex and Age in Gratton
Sex and Age in Gratton
The most populous age groups in Gratton are 20 to 24 Years (114 | 16.6%) for men and Under 5 Years (108 | 22.0%) for women.
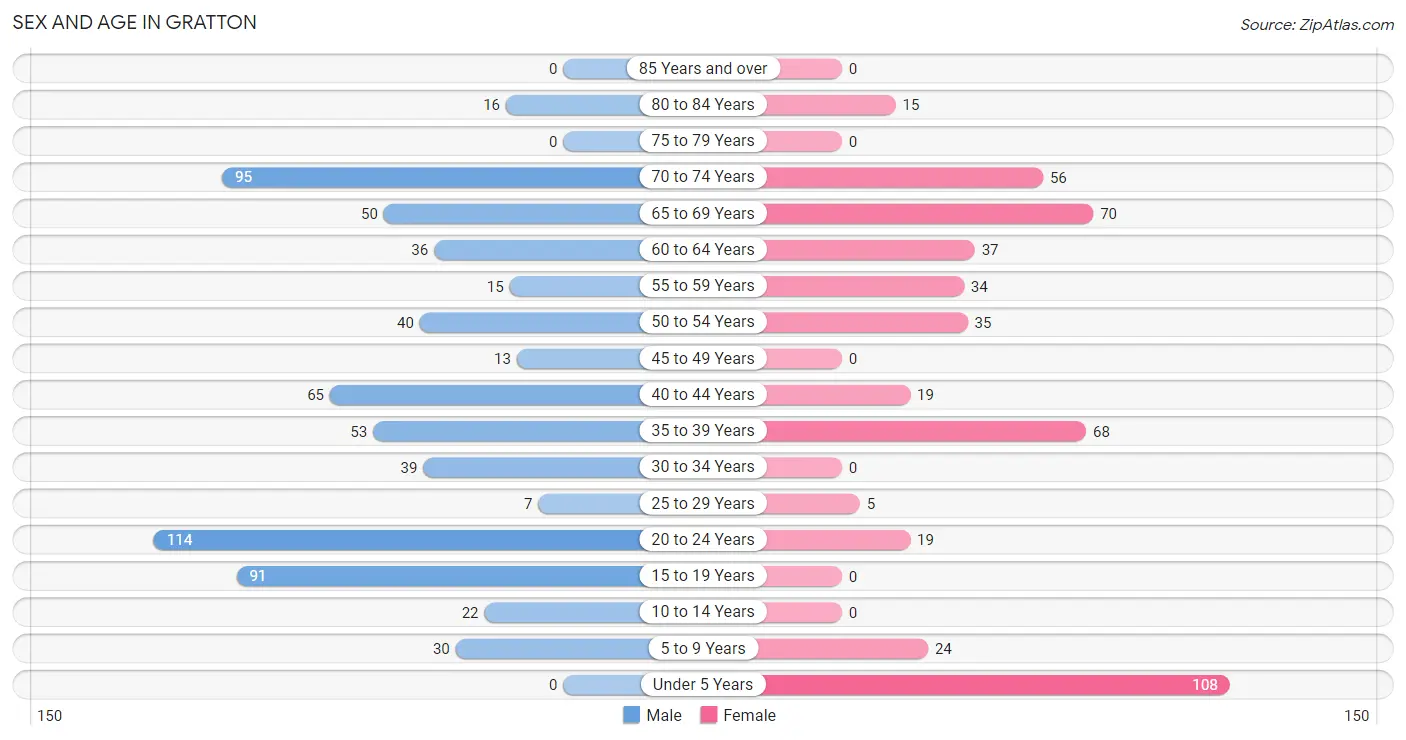
| Age Bracket | Male | Female |
| Under 5 Years | 0 (0.0%) | 108 (22.0%) |
| 5 to 9 Years | 30 (4.4%) | 24 (4.9%) |
| 10 to 14 Years | 22 (3.2%) | 0 (0.0%) |
| 15 to 19 Years | 91 (13.3%) | 0 (0.0%) |
| 20 to 24 Years | 114 (16.6%) | 19 (3.9%) |
| 25 to 29 Years | 7 (1.0%) | 5 (1.0%) |
| 30 to 34 Years | 39 (5.7%) | 0 (0.0%) |
| 35 to 39 Years | 53 (7.7%) | 68 (13.9%) |
| 40 to 44 Years | 65 (9.5%) | 19 (3.9%) |
| 45 to 49 Years | 13 (1.9%) | 0 (0.0%) |
| 50 to 54 Years | 40 (5.8%) | 35 (7.1%) |
| 55 to 59 Years | 15 (2.2%) | 34 (6.9%) |
| 60 to 64 Years | 36 (5.2%) | 37 (7.5%) |
| 65 to 69 Years | 50 (7.3%) | 70 (14.3%) |
| 70 to 74 Years | 95 (13.9%) | 56 (11.4%) |
| 75 to 79 Years | 0 (0.0%) | 0 (0.0%) |
| 80 to 84 Years | 16 (2.3%) | 15 (3.1%) |
| 85 Years and over | 0 (0.0%) | 0 (0.0%) |
| Total | 686 (100.0%) | 490 (100.0%) |
Families and Households in Gratton
Median Family Size in Gratton
The median family size in Gratton is 2.89 persons per family, with married-couple families (288 | 72.2%) accounting for the largest median family size of 3.16 persons per family. On the other hand, single male/father families (98 | 24.6%) represent the smallest median family size with 2.16 persons per family.
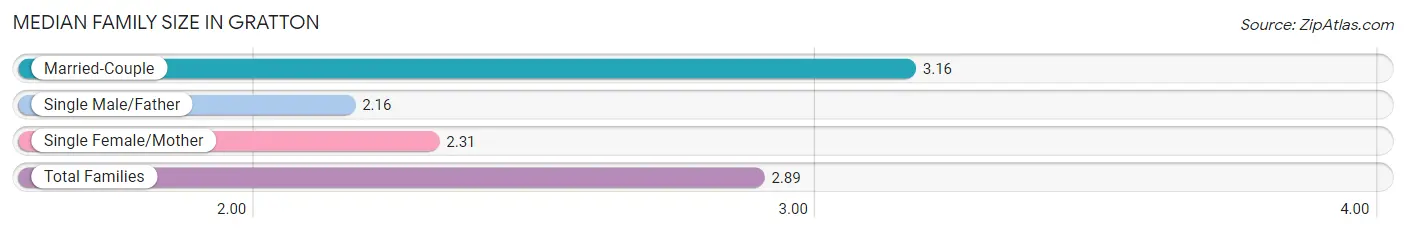
| Family Type | # Families | Family Size |
| Married-Couple | 288 (72.2%) | 3.16 |
| Single Male/Father | 98 (24.6%) | 2.16 |
| Single Female/Mother | 13 (3.3%) | 2.31 |
| Total Families | 399 (100.0%) | 2.89 |
Median Household Size in Gratton
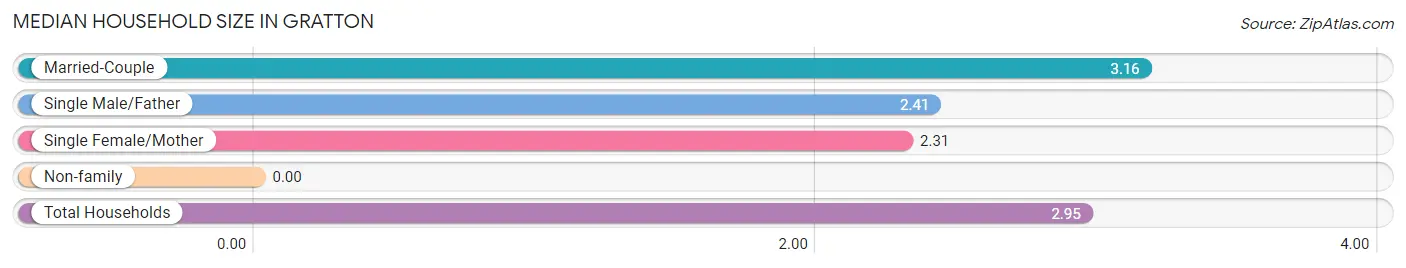
| Household Type | # Households | Household Size |
| Married-Couple | 288 (72.2%) | 3.16 |
| Single Male/Father | 98 (24.6%) | 2.41 |
| Single Female/Mother | 13 (3.3%) | 2.31 |
| Non-family | 0 (0.0%) | - |
| Total Households | 399 (100.0%) | 2.95 |
Household Size by Marriage Status in Gratton
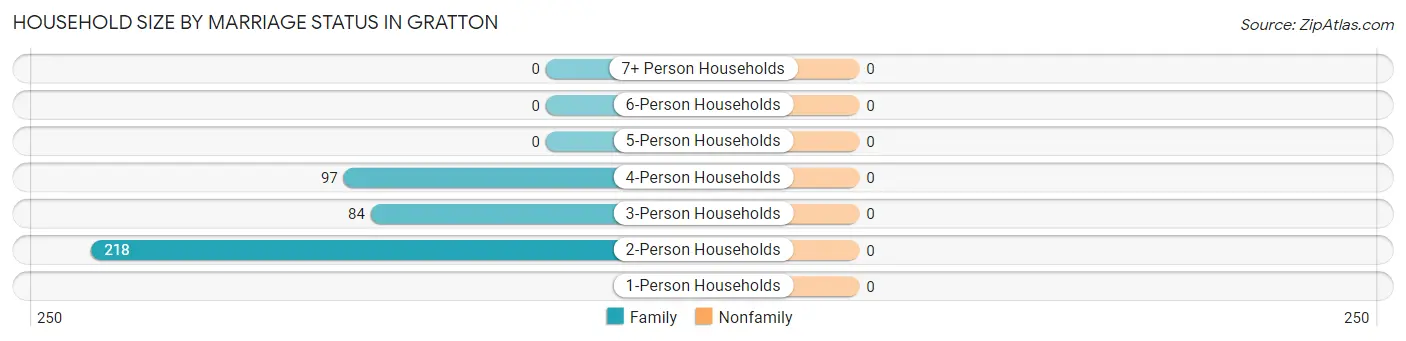
| Household Size | Family Households | Nonfamily Households |
| 1-Person Households | - | 0 (0.0%) |
| 2-Person Households | 218 (54.6%) | 0 (0.0%) |
| 3-Person Households | 84 (21.0%) | 0 (0.0%) |
| 4-Person Households | 97 (24.3%) | 0 (0.0%) |
| 5-Person Households | 0 (0.0%) | 0 (0.0%) |
| 6-Person Households | 0 (0.0%) | 0 (0.0%) |
| 7+ Person Households | 0 (0.0%) | 0 (0.0%) |
| Total | 399 (100.0%) | 0 (0.0%) |
Female Fertility in Gratton
Fertility by Age in Gratton
| Age Bracket | Women with Births | Births / 1,000 Women |
| 15 to 19 years | 0 (0.0%) | 0.0 |
| 20 to 34 years | 0 (0.0%) | 0.0 |
| 35 to 50 years | 0 (0.0%) | 0.0 |
| Total | 0 (0.0%) | 0.0 |
Fertility by Age by Marriage Status in Gratton
| Age Bracket | Married | Unmarried |
| 15 to 19 years | 0 (0.0%) | 0 (0.0%) |
| 20 to 34 years | 0 (0.0%) | 0 (0.0%) |
| 35 to 50 years | 0 (0.0%) | 0 (0.0%) |
| Total | 0 (0.0%) | 0 (0.0%) |
Fertility by Education in Gratton
| Educational Attainment | Women with Births | Births / 1,000 Women |
| Less than High School | 0 (0.0%) | 0.0 |
| High School Diploma | 0 (0.0%) | 0.0 |
| College or Associate's Degree | 0 (0.0%) | 0.0 |
| Bachelor's Degree | 0 (0.0%) | 0.0 |
| Graduate Degree | 0 (0.0%) | 0.0 |
| Total | 0 (0.0%) | 0.0 |
Fertility by Education by Marriage Status in Gratton
| Educational Attainment | Married | Unmarried |
| Less than High School | 0 (0.0%) | 0 (0.0%) |
| High School Diploma | 0 (0.0%) | 0 (0.0%) |
| College or Associate's Degree | 0 (0.0%) | 0 (0.0%) |
| Bachelor's Degree | 0 (0.0%) | 0 (0.0%) |
| Graduate Degree | 0 (0.0%) | 0 (0.0%) |
| Total | 0 (0.0%) | 0 (0.0%) |
Employment Characteristics in Gratton
Employment by Class of Employer in Gratton
Among the 512 employed individuals in Gratton, private company employees (226 | 44.1%), state government employees (105 | 20.5%), and self-employed (incorporated) (66 | 12.9%) make up the most common classes of employment.
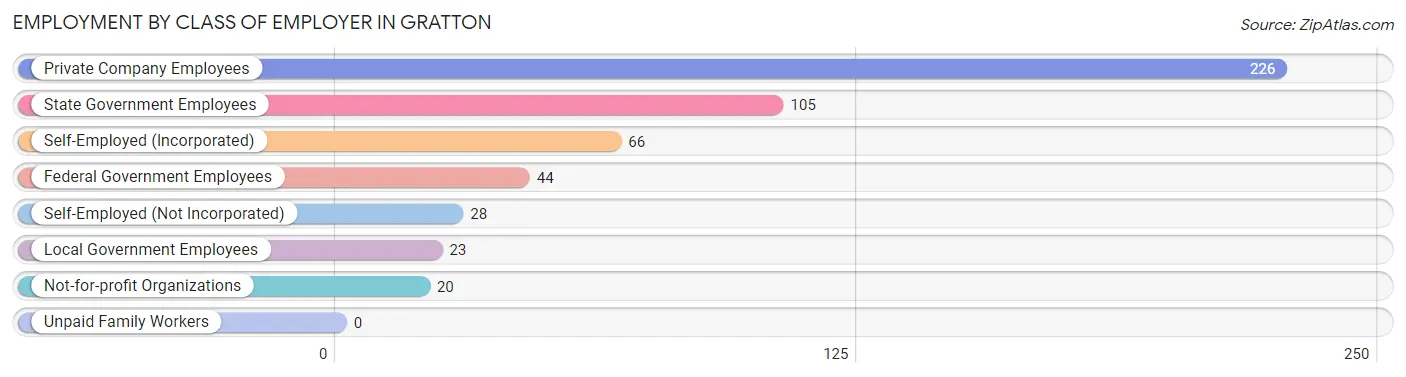
| Employer Class | # Employees | % Employees |
| Private Company Employees | 226 | 44.1% |
| Self-Employed (Incorporated) | 66 | 12.9% |
| Self-Employed (Not Incorporated) | 28 | 5.5% |
| Not-for-profit Organizations | 20 | 3.9% |
| Local Government Employees | 23 | 4.5% |
| State Government Employees | 105 | 20.5% |
| Federal Government Employees | 44 | 8.6% |
| Unpaid Family Workers | 0 | 0.0% |
| Total | 512 | 100.0% |
Employment Status by Age in Gratton
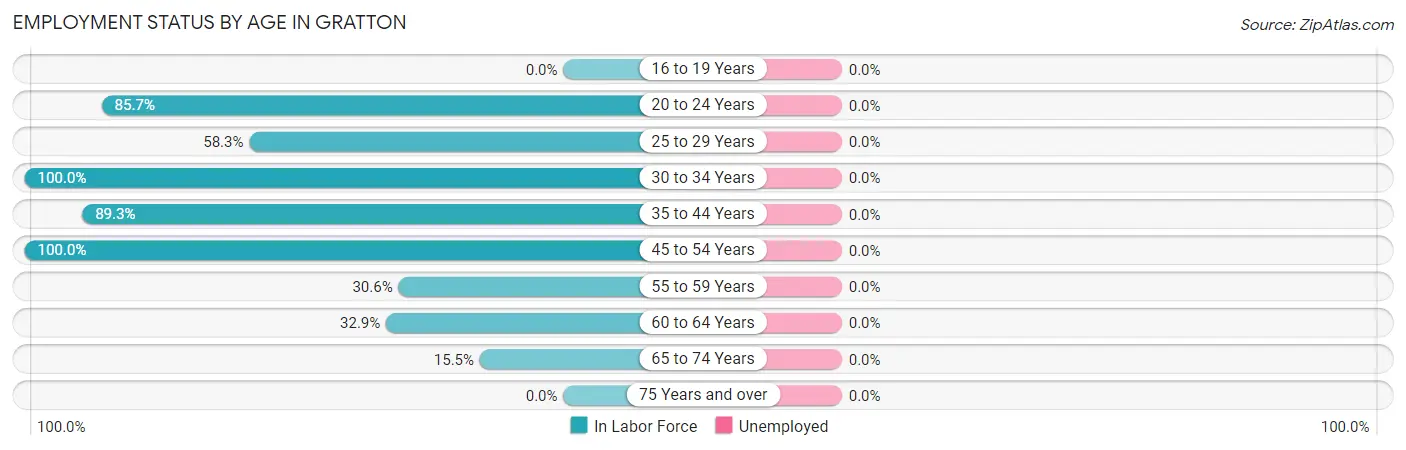
| Age Bracket | In Labor Force | Unemployed |
| 16 to 19 Years | 0 (0.0%) | 0 (0.0%) |
| 20 to 24 Years | 114 (85.7%) | 0 (0.0%) |
| 25 to 29 Years | 7 (58.3%) | 0 (0.0%) |
| 30 to 34 Years | 39 (100.0%) | 0 (0.0%) |
| 35 to 44 Years | 183 (89.3%) | 0 (0.0%) |
| 45 to 54 Years | 88 (100.0%) | 0 (0.0%) |
| 55 to 59 Years | 15 (30.6%) | 0 (0.0%) |
| 60 to 64 Years | 24 (32.9%) | 0 (0.0%) |
| 65 to 74 Years | 42 (15.5%) | 0 (0.0%) |
| 75 Years and over | 0 (0.0%) | 0 (0.0%) |
| Total | 512 (52.6%) | 0 (0.0%) |
Employment Status by Educational Attainment in Gratton
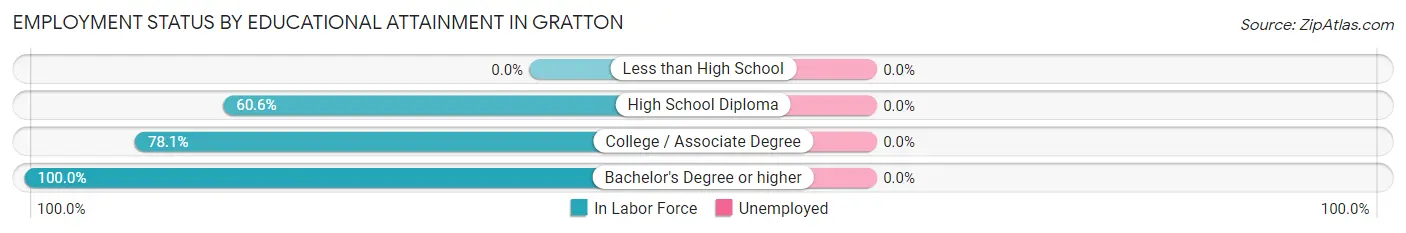
| Educational Attainment | In Labor Force | Unemployed |
| Less than High School | 0 (0.0%) | 0 (0.0%) |
| High School Diploma | 86 (60.6%) | 0 (0.0%) |
| College / Associate Degree | 168 (78.1%) | 0 (0.0%) |
| Bachelor's Degree or higher | 102 (100.0%) | 0 (0.0%) |
| Total | 356 (76.4%) | 0 (0.0%) |
Employment Occupations by Sex in Gratton
Management, Business, Science and Arts Occupations
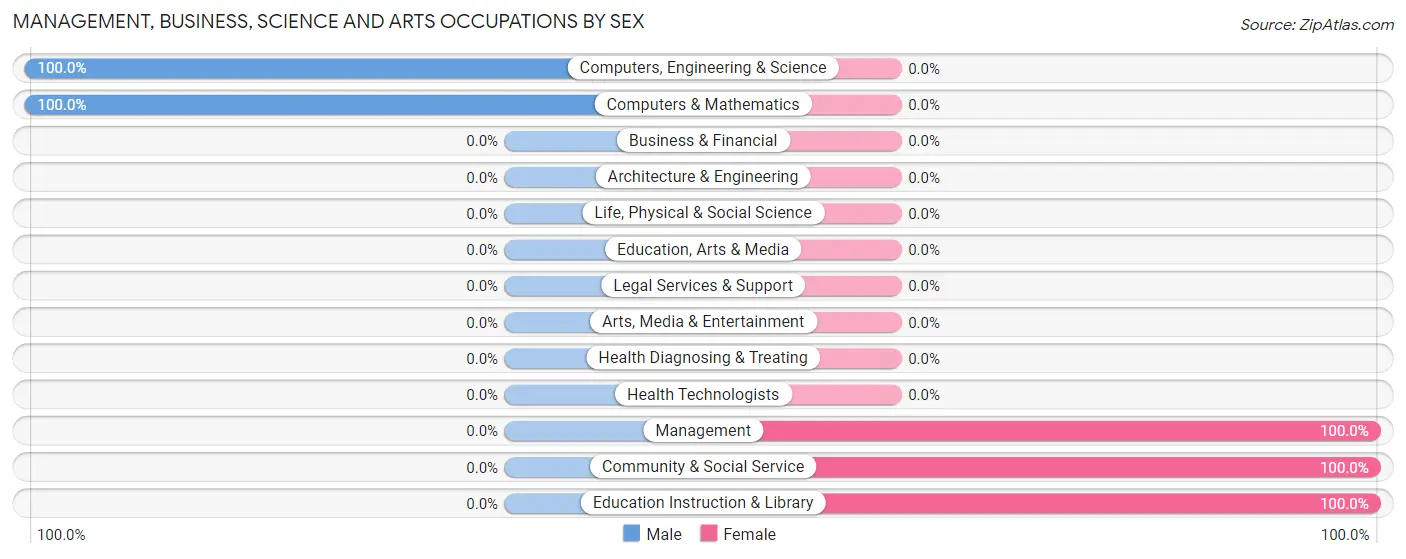
The most common Management, Business, Science and Arts occupations in Gratton are Computers, Engineering & Science (44 | 8.6%), Computers & Mathematics (44 | 8.6%), Management (35 | 6.8%), Community & Social Service (23 | 4.5%), and Education Instruction & Library (23 | 4.5%).
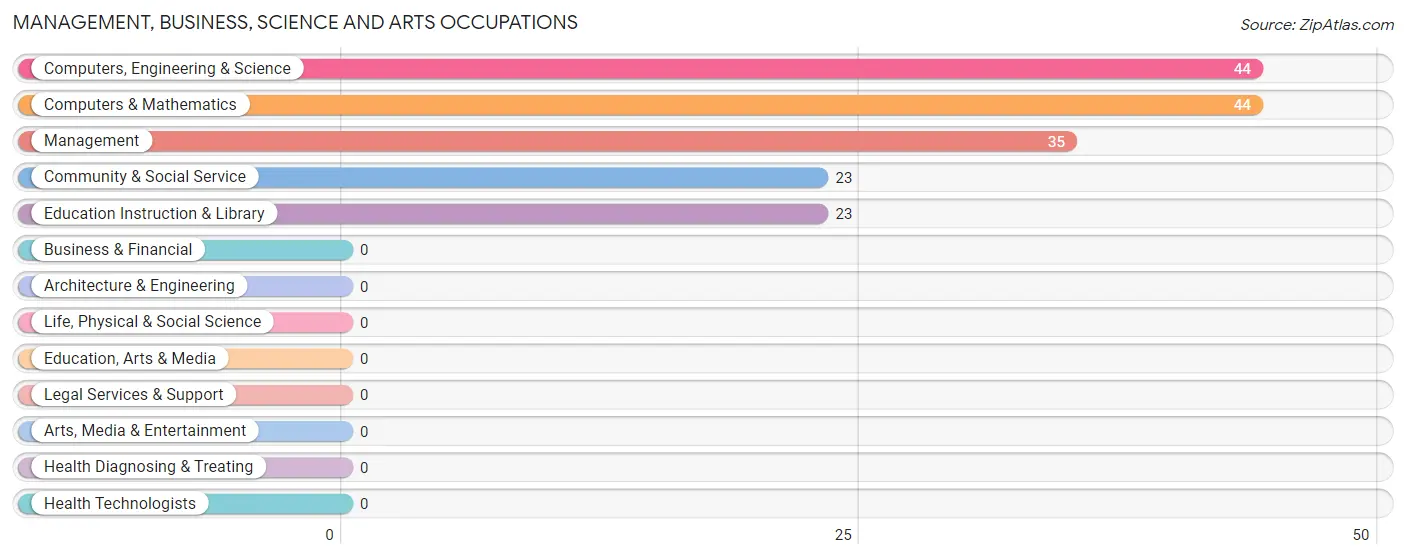
Management, Business, Science and Arts Occupations by Sex
Within the Management, Business, Science and Arts occupations in Gratton, the most male-oriented occupations are Computers, Engineering & Science (100.0%), and Computers & Mathematics (100.0%), while the most female-oriented occupations are Management (100.0%), Community & Social Service (100.0%), and Education Instruction & Library (100.0%).
| Occupation | Male | Female |
| Management | 0 (0.0%) | 35 (100.0%) |
| Business & Financial | 0 (0.0%) | 0 (0.0%) |
| Computers, Engineering & Science | 44 (100.0%) | 0 (0.0%) |
| Computers & Mathematics | 44 (100.0%) | 0 (0.0%) |
| Architecture & Engineering | 0 (0.0%) | 0 (0.0%) |
| Life, Physical & Social Science | 0 (0.0%) | 0 (0.0%) |
| Community & Social Service | 0 (0.0%) | 23 (100.0%) |
| Education, Arts & Media | 0 (0.0%) | 0 (0.0%) |
| Legal Services & Support | 0 (0.0%) | 0 (0.0%) |
| Education Instruction & Library | 0 (0.0%) | 23 (100.0%) |
| Arts, Media & Entertainment | 0 (0.0%) | 0 (0.0%) |
| Health Diagnosing & Treating | 0 (0.0%) | 0 (0.0%) |
| Health Technologists | 0 (0.0%) | 0 (0.0%) |
| Total (Category) | 44 (43.1%) | 58 (56.9%) |
| Total (Overall) | 377 (73.6%) | 135 (26.4%) |
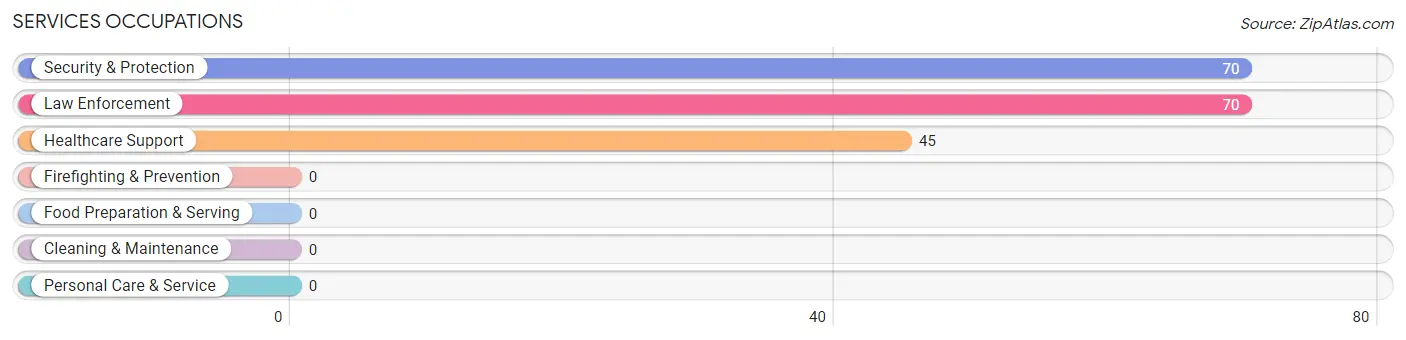
Services Occupations
The most common Services occupations in Gratton are Security & Protection (70 | 13.7%), Law Enforcement (70 | 13.7%), and Healthcare Support (45 | 8.8%).
Services Occupations by Sex
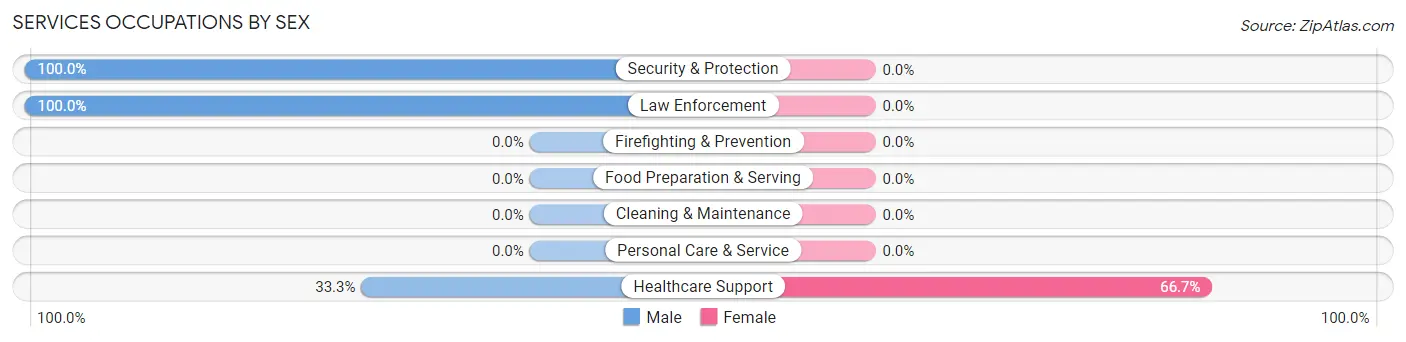
| Occupation | Male | Female |
| Healthcare Support | 15 (33.3%) | 30 (66.7%) |
| Security & Protection | 70 (100.0%) | 0 (0.0%) |
| Firefighting & Prevention | 0 (0.0%) | 0 (0.0%) |
| Law Enforcement | 70 (100.0%) | 0 (0.0%) |
| Food Preparation & Serving | 0 (0.0%) | 0 (0.0%) |
| Cleaning & Maintenance | 0 (0.0%) | 0 (0.0%) |
| Personal Care & Service | 0 (0.0%) | 0 (0.0%) |
| Total (Category) | 85 (73.9%) | 30 (26.1%) |
| Total (Overall) | 377 (73.6%) | 135 (26.4%) |
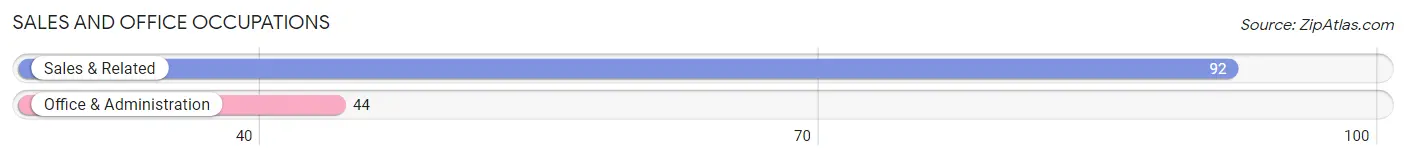
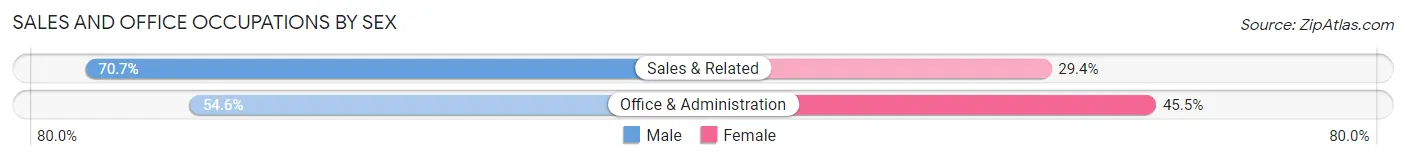
Sales and Office Occupations
The most common Sales and Office occupations in Gratton are Sales & Related (92 | 18.0%), and Office & Administration (44 | 8.6%).
Sales and Office Occupations by Sex
| Occupation | Male | Female |
| Sales & Related | 65 (70.7%) | 27 (29.3%) |
| Office & Administration | 24 (54.5%) | 20 (45.5%) |
| Total (Category) | 89 (65.4%) | 47 (34.6%) |
| Total (Overall) | 377 (73.6%) | 135 (26.4%) |
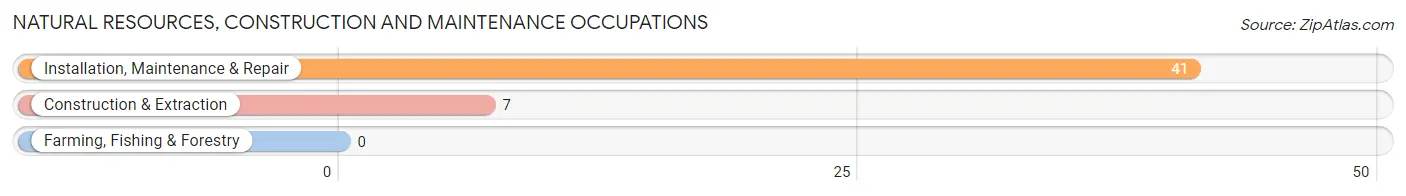
Natural Resources, Construction and Maintenance Occupations
The most common Natural Resources, Construction and Maintenance occupations in Gratton are Installation, Maintenance & Repair (41 | 8.0%), and Construction & Extraction (7 | 1.4%).
Natural Resources, Construction and Maintenance Occupations by Sex
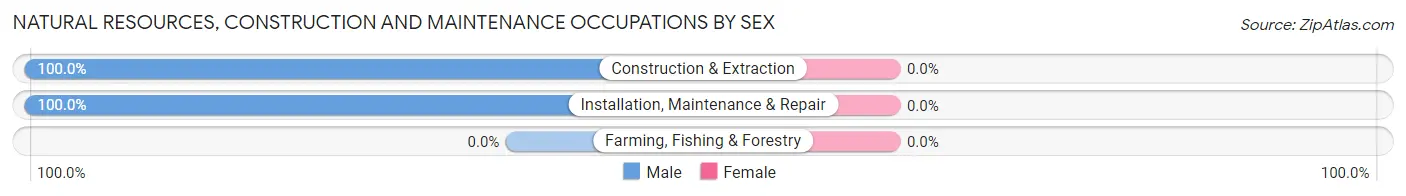
| Occupation | Male | Female |
| Farming, Fishing & Forestry | 0 (0.0%) | 0 (0.0%) |
| Construction & Extraction | 7 (100.0%) | 0 (0.0%) |
| Installation, Maintenance & Repair | 41 (100.0%) | 0 (0.0%) |
| Total (Category) | 48 (100.0%) | 0 (0.0%) |
| Total (Overall) | 377 (73.6%) | 135 (26.4%) |
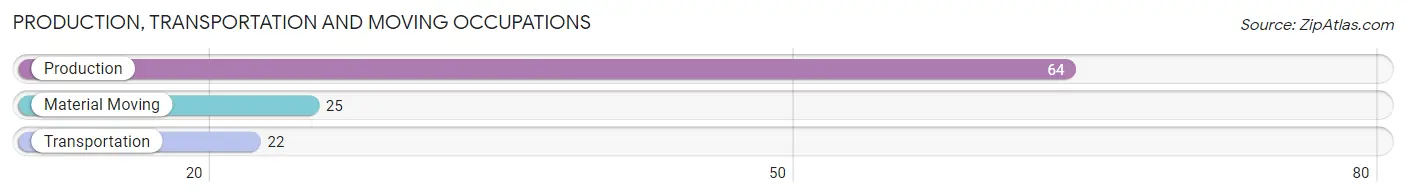
Production, Transportation and Moving Occupations
The most common Production, Transportation and Moving occupations in Gratton are Production (64 | 12.5%), Material Moving (25 | 4.9%), and Transportation (22 | 4.3%).
Production, Transportation and Moving Occupations by Sex
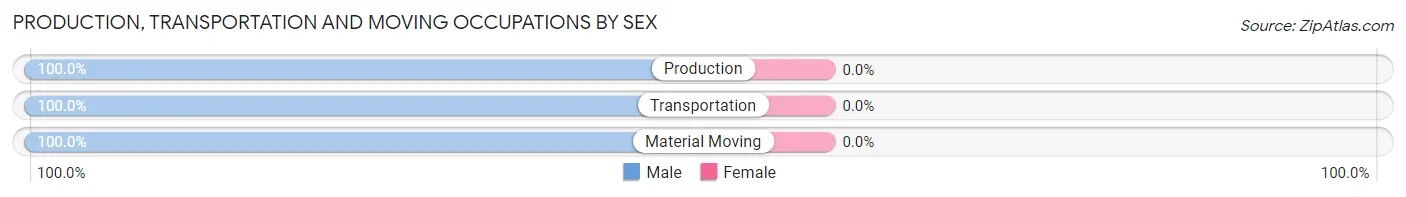
| Occupation | Male | Female |
| Production | 64 (100.0%) | 0 (0.0%) |
| Transportation | 22 (100.0%) | 0 (0.0%) |
| Material Moving | 25 (100.0%) | 0 (0.0%) |
| Total (Category) | 111 (100.0%) | 0 (0.0%) |
| Total (Overall) | 377 (73.6%) | 135 (26.4%) |
Employment Industries by Sex in Gratton
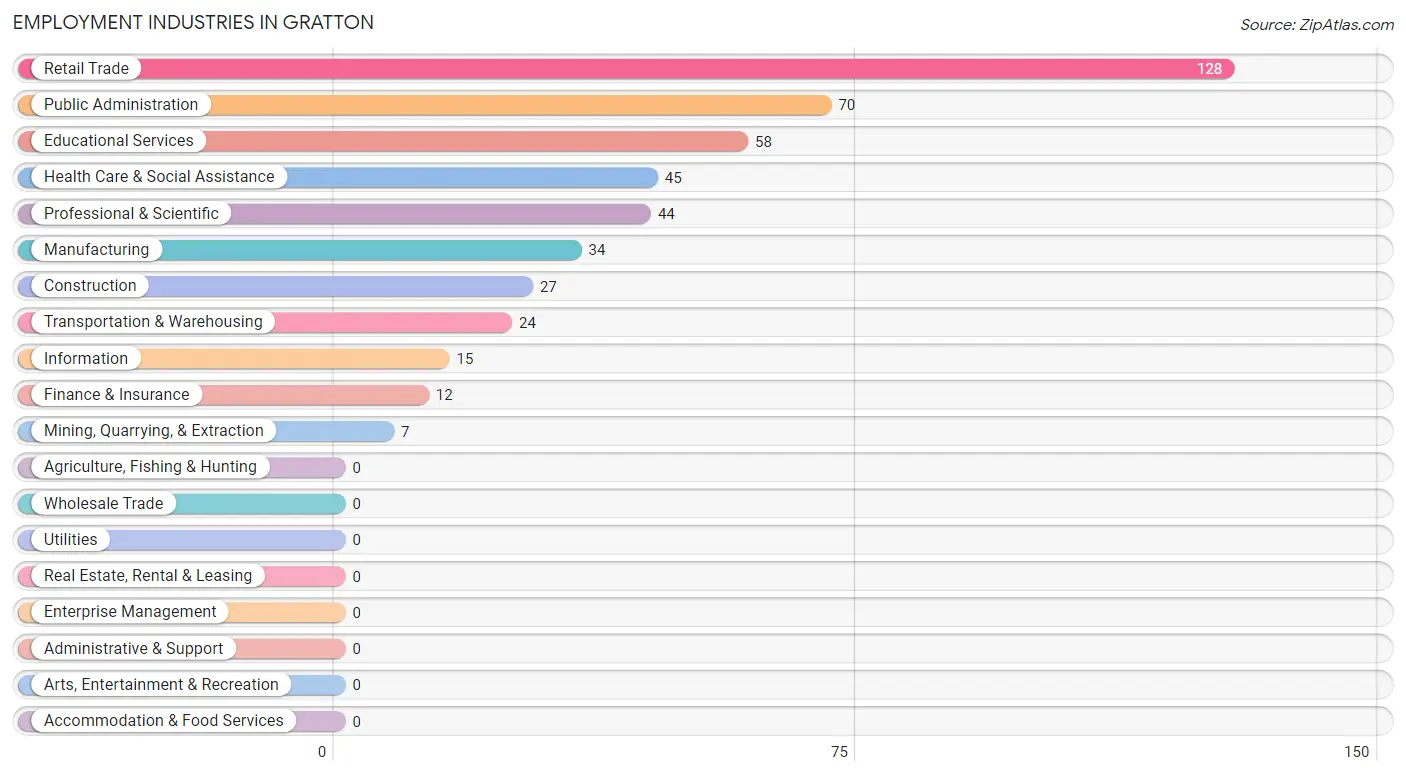
Employment Industries in Gratton
The major employment industries in Gratton include Retail Trade (128 | 25.0%), Public Administration (70 | 13.7%), Educational Services (58 | 11.3%), Health Care & Social Assistance (45 | 8.8%), and Professional & Scientific (44 | 8.6%).
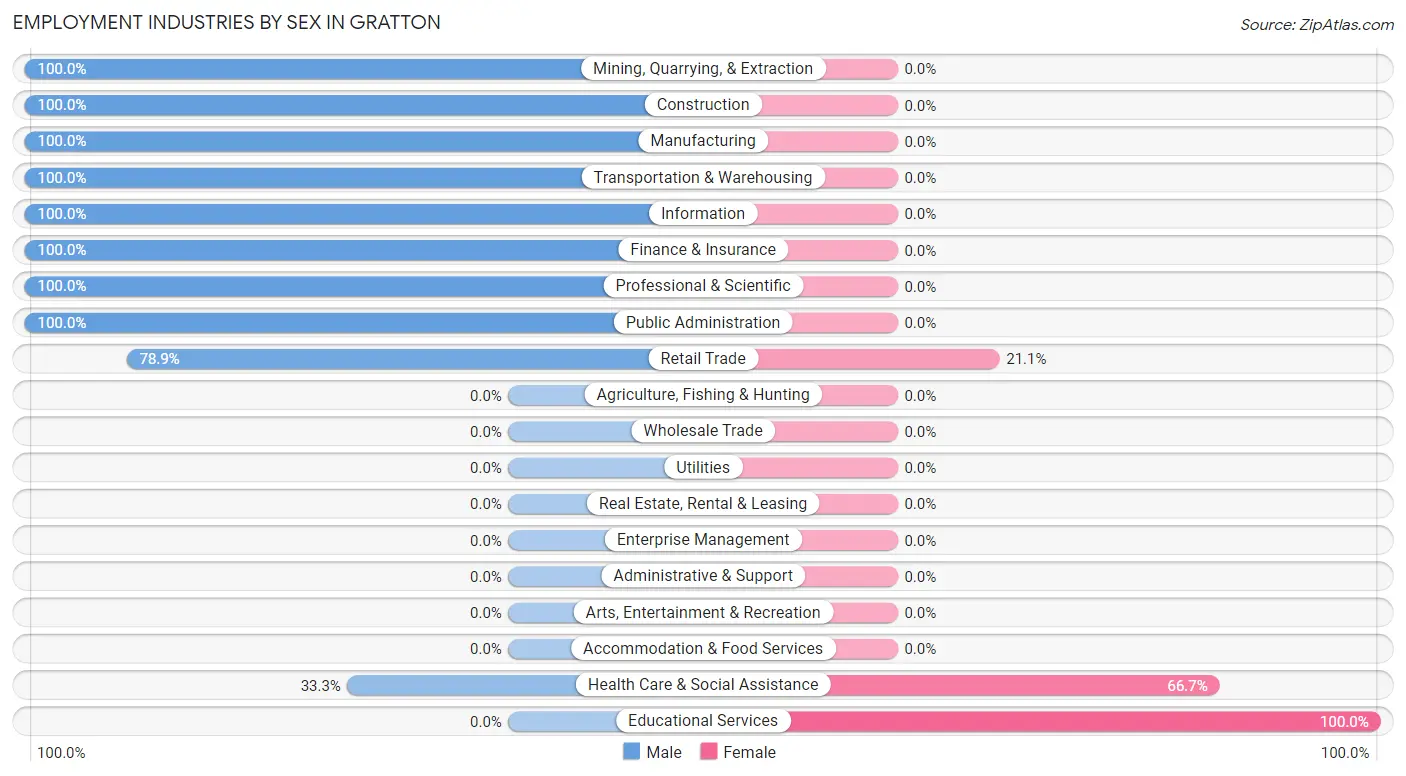
Employment Industries by Sex in Gratton
The Gratton industries that see more men than women are Mining, Quarrying, & Extraction (100.0%), Construction (100.0%), and Manufacturing (100.0%), whereas the industries that tend to have a higher number of women are Educational Services (100.0%), Health Care & Social Assistance (66.7%), and Retail Trade (21.1%).
| Industry | Male | Female |
| Agriculture, Fishing & Hunting | 0 (0.0%) | 0 (0.0%) |
| Mining, Quarrying, & Extraction | 7 (100.0%) | 0 (0.0%) |
| Construction | 27 (100.0%) | 0 (0.0%) |
| Manufacturing | 34 (100.0%) | 0 (0.0%) |
| Wholesale Trade | 0 (0.0%) | 0 (0.0%) |
| Retail Trade | 101 (78.9%) | 27 (21.1%) |
| Transportation & Warehousing | 24 (100.0%) | 0 (0.0%) |
| Utilities | 0 (0.0%) | 0 (0.0%) |
| Information | 15 (100.0%) | 0 (0.0%) |
| Finance & Insurance | 12 (100.0%) | 0 (0.0%) |
| Real Estate, Rental & Leasing | 0 (0.0%) | 0 (0.0%) |
| Professional & Scientific | 44 (100.0%) | 0 (0.0%) |
| Enterprise Management | 0 (0.0%) | 0 (0.0%) |
| Administrative & Support | 0 (0.0%) | 0 (0.0%) |
| Educational Services | 0 (0.0%) | 58 (100.0%) |
| Health Care & Social Assistance | 15 (33.3%) | 30 (66.7%) |
| Arts, Entertainment & Recreation | 0 (0.0%) | 0 (0.0%) |
| Accommodation & Food Services | 0 (0.0%) | 0 (0.0%) |
| Public Administration | 70 (100.0%) | 0 (0.0%) |
| Total | 377 (73.6%) | 135 (26.4%) |
Education in Gratton
School Enrollment in Gratton
The most common levels of schooling among the 235 students in Gratton are high school (91 | 38.7%), college / undergraduate (68 | 28.9%), and elementary school (36 | 15.3%).
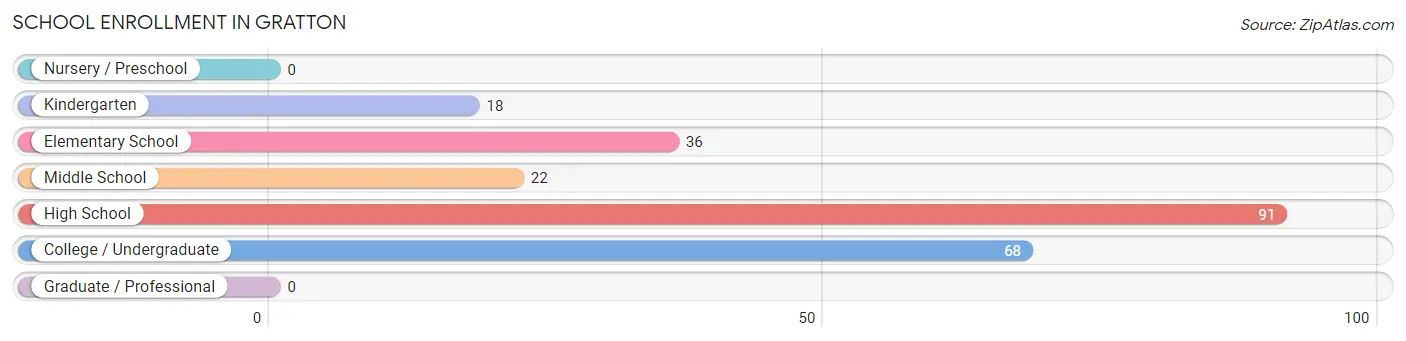
| School Level | # Students | % Students |
| Nursery / Preschool | 0 | 0.0% |
| Kindergarten | 18 | 7.7% |
| Elementary School | 36 | 15.3% |
| Middle School | 22 | 9.4% |
| High School | 91 | 38.7% |
| College / Undergraduate | 68 | 28.9% |
| Graduate / Professional | 0 | 0.0% |
| Total | 235 | 100.0% |
School Enrollment by Age by Funding Source in Gratton
Out of a total of 235 students who are enrolled in schools in Gratton, 44 (18.7%) attend a private institution, while the remaining 191 (81.3%) are enrolled in public schools. The age group of 20 to 24 year olds has the highest likelihood of being enrolled in private schools, with 44 (69.8% in the age bracket) enrolled. Conversely, the age group of 5 to 9 year old has the lowest likelihood of being enrolled in a private school, with 54 (100.0% in the age bracket) attending a public institution.
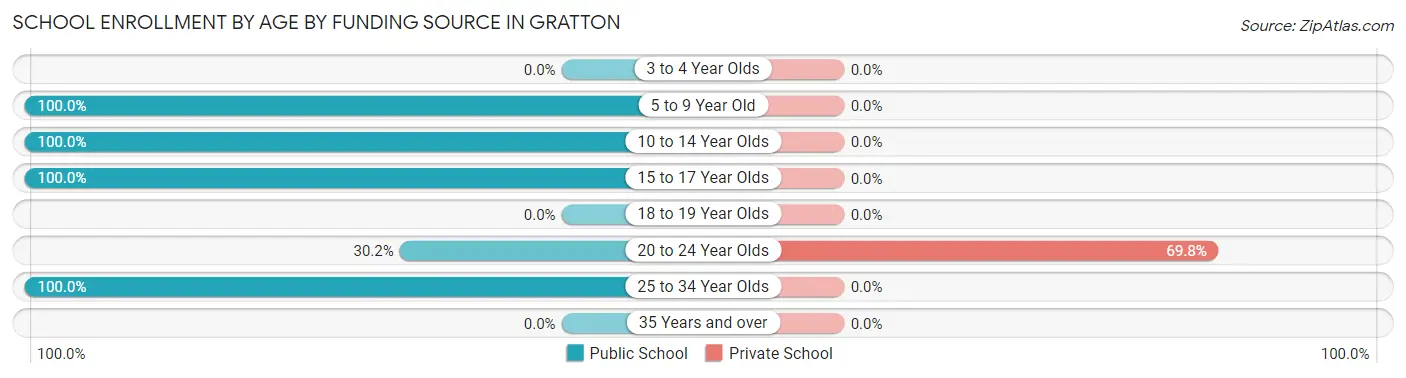
| Age Bracket | Public School | Private School |
| 3 to 4 Year Olds | 0 (0.0%) | 0 (0.0%) |
| 5 to 9 Year Old | 54 (100.0%) | 0 (0.0%) |
| 10 to 14 Year Olds | 22 (100.0%) | 0 (0.0%) |
| 15 to 17 Year Olds | 91 (100.0%) | 0 (0.0%) |
| 18 to 19 Year Olds | 0 (0.0%) | 0 (0.0%) |
| 20 to 24 Year Olds | 19 (30.2%) | 44 (69.8%) |
| 25 to 34 Year Olds | 5 (100.0%) | 0 (0.0%) |
| 35 Years and over | 0 (0.0%) | 0 (0.0%) |
| Total | 191 (81.3%) | 44 (18.7%) |
Educational Attainment by Field of Study in Gratton
Business (47 | 46.1%), psychology (40 | 39.2%), and education (15 | 14.7%) are the most common fields of study among 102 individuals in Gratton who have obtained a bachelor's degree or higher.
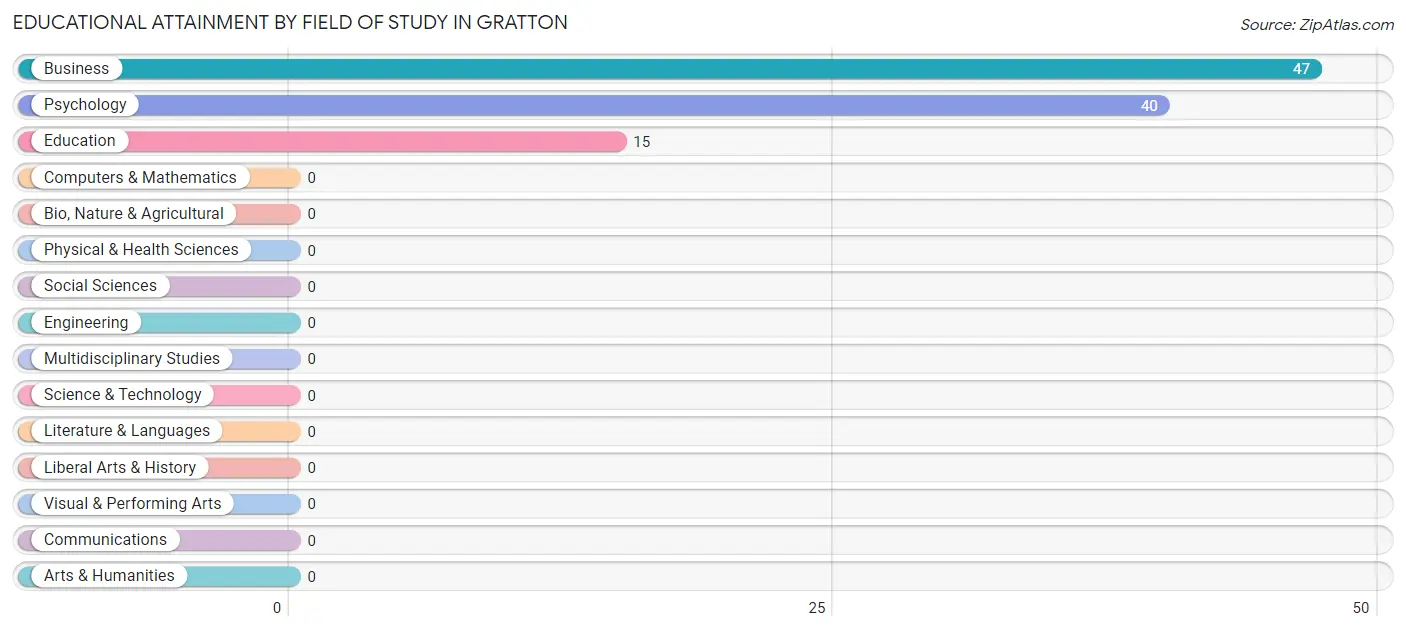
| Field of Study | # Graduates | % Graduates |
| Computers & Mathematics | 0 | 0.0% |
| Bio, Nature & Agricultural | 0 | 0.0% |
| Physical & Health Sciences | 0 | 0.0% |
| Psychology | 40 | 39.2% |
| Social Sciences | 0 | 0.0% |
| Engineering | 0 | 0.0% |
| Multidisciplinary Studies | 0 | 0.0% |
| Science & Technology | 0 | 0.0% |
| Business | 47 | 46.1% |
| Education | 15 | 14.7% |
| Literature & Languages | 0 | 0.0% |
| Liberal Arts & History | 0 | 0.0% |
| Visual & Performing Arts | 0 | 0.0% |
| Communications | 0 | 0.0% |
| Arts & Humanities | 0 | 0.0% |
| Total | 102 | 100.0% |
Transportation & Commute in Gratton
Vehicle Availability by Sex in Gratton
The most prevalent vehicle ownership categories in Gratton are males with 3 vehicles (218, accounting for 57.8%) and females with 3 vehicles (93, making up 161.5%).
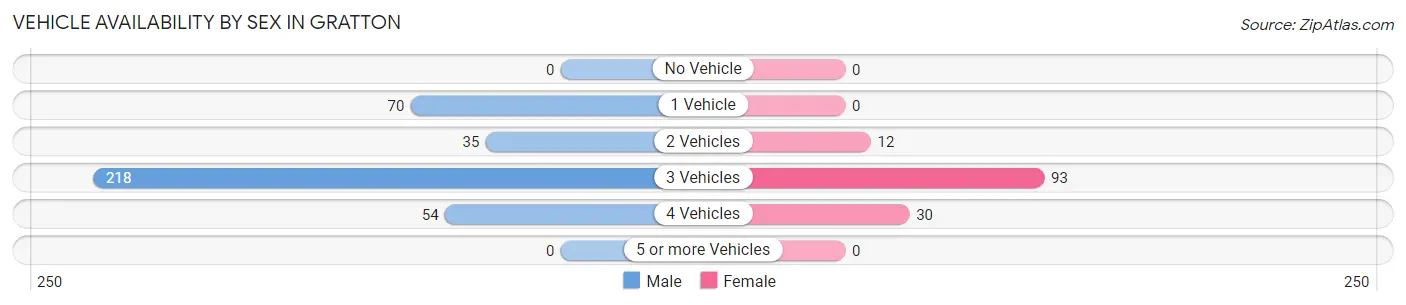
| Vehicles Available | Male | Female |
| No Vehicle | 0 (0.0%) | 0 (0.0%) |
| 1 Vehicle | 70 (18.6%) | 0 (0.0%) |
| 2 Vehicles | 35 (9.3%) | 12 (8.9%) |
| 3 Vehicles | 218 (57.8%) | 93 (68.9%) |
| 4 Vehicles | 54 (14.3%) | 30 (22.2%) |
| 5 or more Vehicles | 0 (0.0%) | 0 (0.0%) |
| Total | 377 (100.0%) | 135 (100.0%) |
Commute Time in Gratton
The most frequently occuring commute durations in Gratton are 30 to 34 minutes (137 commuters, 26.8%), 5 to 9 minutes (112 commuters, 21.9%), and 60 to 89 minutes (77 commuters, 15.0%).
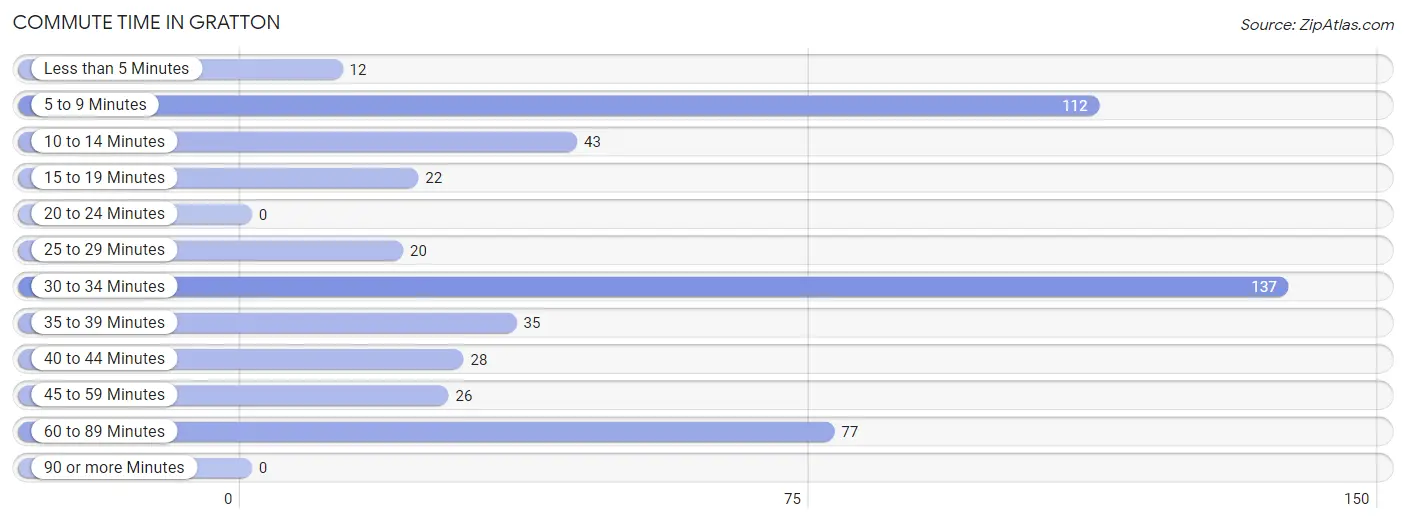
| Commute Time | # Commuters | % Commuters |
| Less than 5 Minutes | 12 | 2.3% |
| 5 to 9 Minutes | 112 | 21.9% |
| 10 to 14 Minutes | 43 | 8.4% |
| 15 to 19 Minutes | 22 | 4.3% |
| 20 to 24 Minutes | 0 | 0.0% |
| 25 to 29 Minutes | 20 | 3.9% |
| 30 to 34 Minutes | 137 | 26.8% |
| 35 to 39 Minutes | 35 | 6.8% |
| 40 to 44 Minutes | 28 | 5.5% |
| 45 to 59 Minutes | 26 | 5.1% |
| 60 to 89 Minutes | 77 | 15.0% |
| 90 or more Minutes | 0 | 0.0% |
Commute Time by Sex in Gratton
The most common commute times in Gratton are 30 to 34 minutes (110 commuters, 29.2%) for males and 5 to 9 minutes (38 commuters, 28.1%) for females.
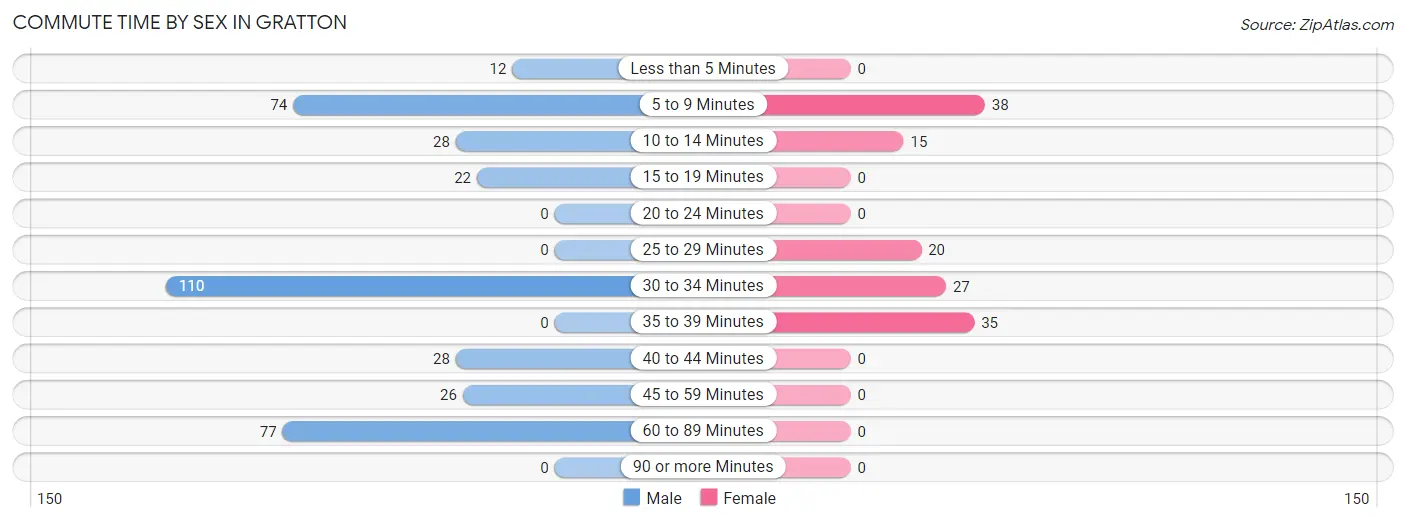
| Commute Time | Male | Female |
| Less than 5 Minutes | 12 (3.2%) | 0 (0.0%) |
| 5 to 9 Minutes | 74 (19.6%) | 38 (28.1%) |
| 10 to 14 Minutes | 28 (7.4%) | 15 (11.1%) |
| 15 to 19 Minutes | 22 (5.8%) | 0 (0.0%) |
| 20 to 24 Minutes | 0 (0.0%) | 0 (0.0%) |
| 25 to 29 Minutes | 0 (0.0%) | 20 (14.8%) |
| 30 to 34 Minutes | 110 (29.2%) | 27 (20.0%) |
| 35 to 39 Minutes | 0 (0.0%) | 35 (25.9%) |
| 40 to 44 Minutes | 28 (7.4%) | 0 (0.0%) |
| 45 to 59 Minutes | 26 (6.9%) | 0 (0.0%) |
| 60 to 89 Minutes | 77 (20.4%) | 0 (0.0%) |
| 90 or more Minutes | 0 (0.0%) | 0 (0.0%) |
Time of Departure to Work by Sex in Gratton
The most frequent times of departure to work in Gratton are 8:00 AM to 8:29 AM (130, 34.5%) for males and 6:30 AM to 6:59 AM (42, 31.1%) for females.
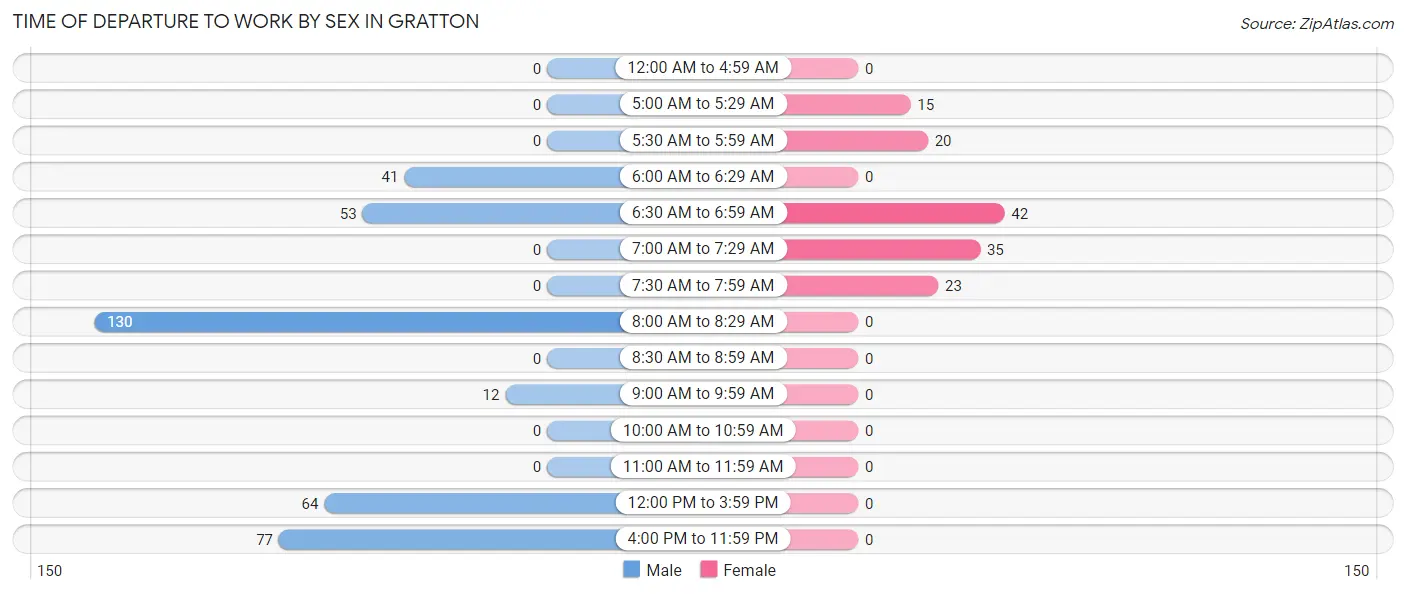
| Time of Departure | Male | Female |
| 12:00 AM to 4:59 AM | 0 (0.0%) | 0 (0.0%) |
| 5:00 AM to 5:29 AM | 0 (0.0%) | 15 (11.1%) |
| 5:30 AM to 5:59 AM | 0 (0.0%) | 20 (14.8%) |
| 6:00 AM to 6:29 AM | 41 (10.9%) | 0 (0.0%) |
| 6:30 AM to 6:59 AM | 53 (14.1%) | 42 (31.1%) |
| 7:00 AM to 7:29 AM | 0 (0.0%) | 35 (25.9%) |
| 7:30 AM to 7:59 AM | 0 (0.0%) | 23 (17.0%) |
| 8:00 AM to 8:29 AM | 130 (34.5%) | 0 (0.0%) |
| 8:30 AM to 8:59 AM | 0 (0.0%) | 0 (0.0%) |
| 9:00 AM to 9:59 AM | 12 (3.2%) | 0 (0.0%) |
| 10:00 AM to 10:59 AM | 0 (0.0%) | 0 (0.0%) |
| 11:00 AM to 11:59 AM | 0 (0.0%) | 0 (0.0%) |
| 12:00 PM to 3:59 PM | 64 (17.0%) | 0 (0.0%) |
| 4:00 PM to 11:59 PM | 77 (20.4%) | 0 (0.0%) |
| Total | 377 (100.0%) | 135 (100.0%) |
Housing Occupancy in Gratton
Occupancy by Ownership in Gratton
Of the total 399 dwellings in Gratton, owner-occupied units account for 329 (82.5%), while renter-occupied units make up 70 (17.5%).
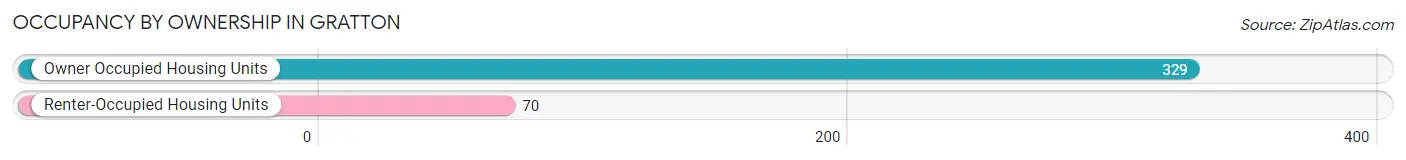
| Occupancy | # Housing Units | % Housing Units |
| Owner Occupied Housing Units | 329 | 82.5% |
| Renter-Occupied Housing Units | 70 | 17.5% |
| Total Occupied Housing Units | 399 | 100.0% |
Occupancy by Household Size in Gratton
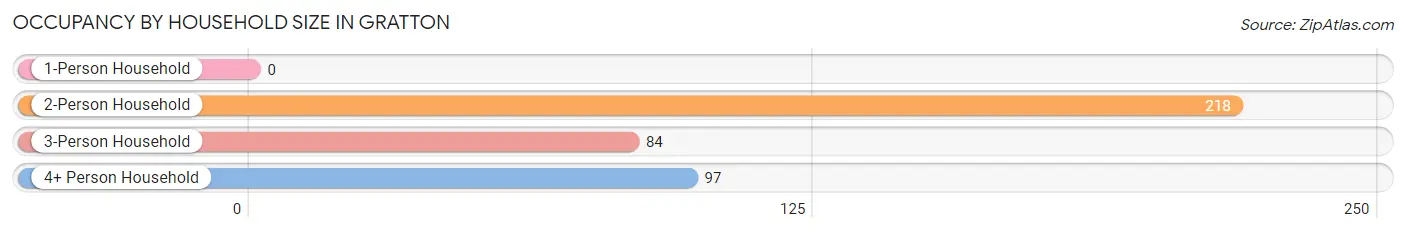
| Household Size | # Housing Units | % Housing Units |
| 1-Person Household | 0 | 0.0% |
| 2-Person Household | 218 | 54.6% |
| 3-Person Household | 84 | 21.0% |
| 4+ Person Household | 97 | 24.3% |
| Total Housing Units | 399 | 100.0% |
Occupancy by Ownership by Household Size in Gratton
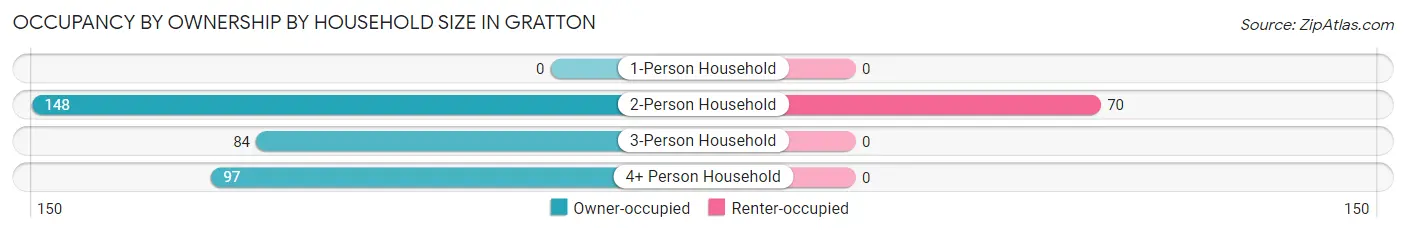
| Household Size | Owner-occupied | Renter-occupied |
| 1-Person Household | 0 (0.0%) | 0 (0.0%) |
| 2-Person Household | 148 (67.9%) | 70 (32.1%) |
| 3-Person Household | 84 (100.0%) | 0 (0.0%) |
| 4+ Person Household | 97 (100.0%) | 0 (0.0%) |
| Total Housing Units | 329 (82.5%) | 70 (17.5%) |
Occupancy by Educational Attainment in Gratton
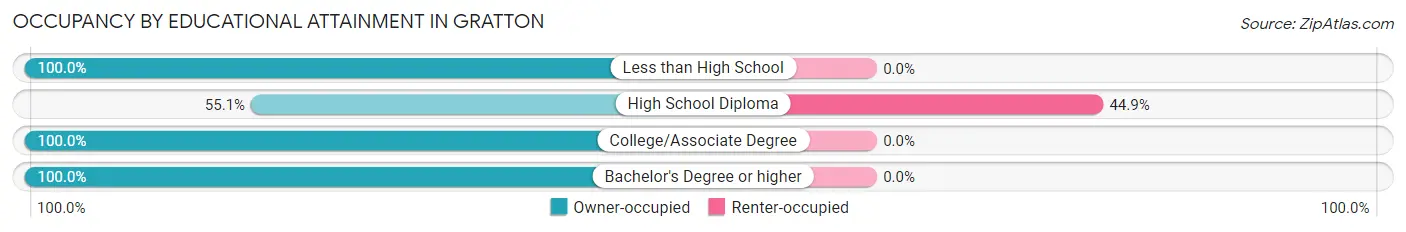
| Household Size | Owner-occupied | Renter-occupied |
| Less than High School | 21 (100.0%) | 0 (0.0%) |
| High School Diploma | 86 (55.1%) | 70 (44.9%) |
| College/Associate Degree | 172 (100.0%) | 0 (0.0%) |
| Bachelor's Degree or higher | 50 (100.0%) | 0 (0.0%) |
Occupancy by Age of Householder in Gratton
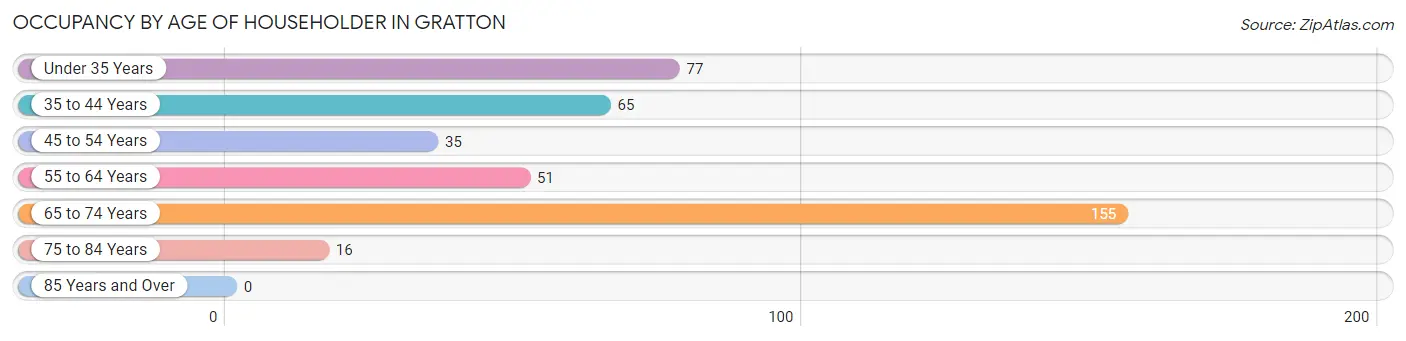
| Age Bracket | # Households | % Households |
| Under 35 Years | 77 | 19.3% |
| 35 to 44 Years | 65 | 16.3% |
| 45 to 54 Years | 35 | 8.8% |
| 55 to 64 Years | 51 | 12.8% |
| 65 to 74 Years | 155 | 38.9% |
| 75 to 84 Years | 16 | 4.0% |
| 85 Years and Over | 0 | 0.0% |
| Total | 399 | 100.0% |
Housing Finances in Gratton
Median Income by Occupancy in Gratton
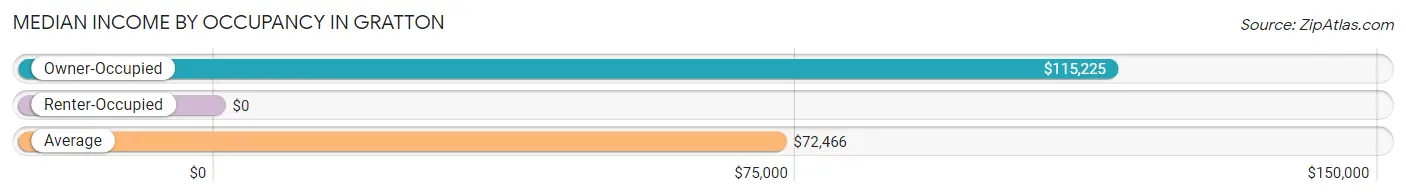
| Occupancy Type | # Households | Median Income |
| Owner-Occupied | 329 (82.5%) | $115,225 |
| Renter-Occupied | 70 (17.5%) | $0 |
| Average | 399 (100.0%) | $72,466 |
Occupancy by Householder Income Bracket in Gratton
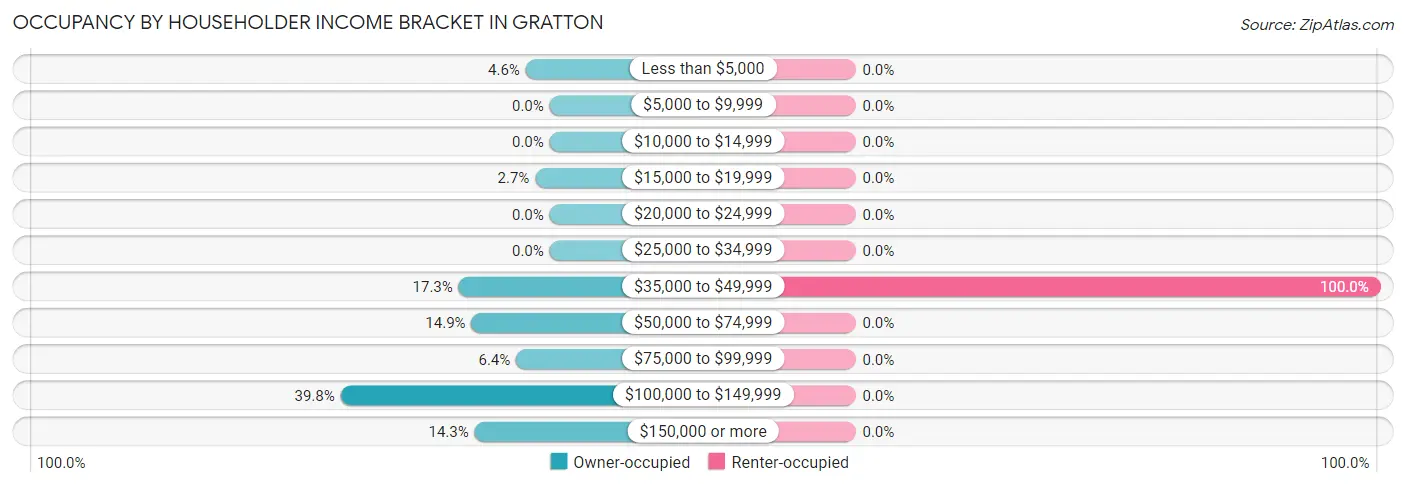
| Income Bracket | Owner-occupied | Renter-occupied |
| Less than $5,000 | 15 (4.6%) | 0 (0.0%) |
| $5,000 to $9,999 | 0 (0.0%) | 0 (0.0%) |
| $10,000 to $14,999 | 0 (0.0%) | 0 (0.0%) |
| $15,000 to $19,999 | 9 (2.7%) | 0 (0.0%) |
| $20,000 to $24,999 | 0 (0.0%) | 0 (0.0%) |
| $25,000 to $34,999 | 0 (0.0%) | 0 (0.0%) |
| $35,000 to $49,999 | 57 (17.3%) | 70 (100.0%) |
| $50,000 to $74,999 | 49 (14.9%) | 0 (0.0%) |
| $75,000 to $99,999 | 21 (6.4%) | 0 (0.0%) |
| $100,000 to $149,999 | 131 (39.8%) | 0 (0.0%) |
| $150,000 or more | 47 (14.3%) | 0 (0.0%) |
| Total | 329 (100.0%) | 70 (100.0%) |
Monthly Housing Cost Tiers in Gratton
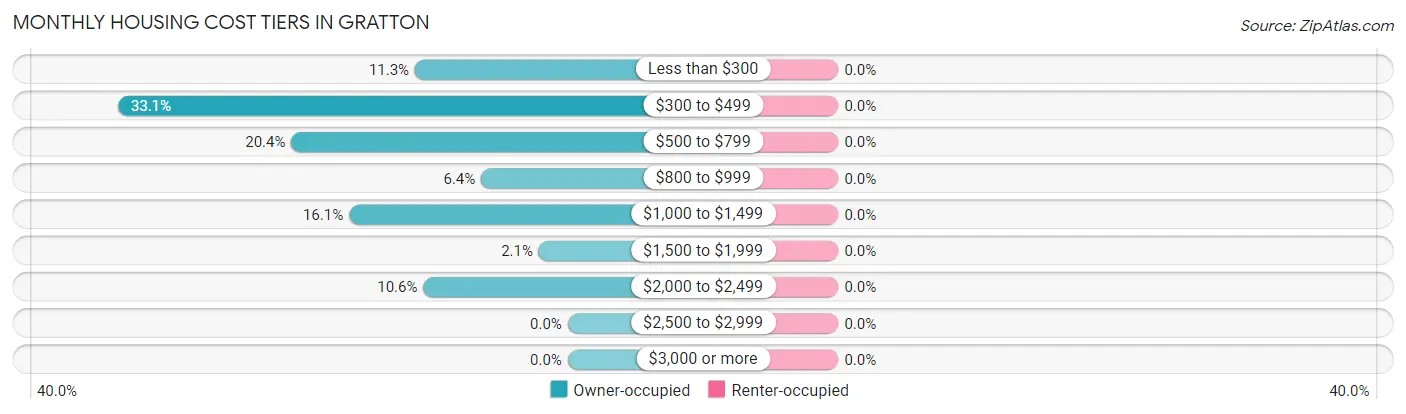
| Monthly Cost | Owner-occupied | Renter-occupied |
| Less than $300 | 37 (11.3%) | 0 (0.0%) |
| $300 to $499 | 109 (33.1%) | 0 (0.0%) |
| $500 to $799 | 67 (20.4%) | 0 (0.0%) |
| $800 to $999 | 21 (6.4%) | 0 (0.0%) |
| $1,000 to $1,499 | 53 (16.1%) | 0 (0.0%) |
| $1,500 to $1,999 | 7 (2.1%) | 0 (0.0%) |
| $2,000 to $2,499 | 35 (10.6%) | 0 (0.0%) |
| $2,500 to $2,999 | 0 (0.0%) | 0 (0.0%) |
| $3,000 or more | 0 (0.0%) | 0 (0.0%) |
| Total | 329 (100.0%) | 70 (100.0%) |
Physical Housing Characteristics in Gratton
Housing Structures in Gratton
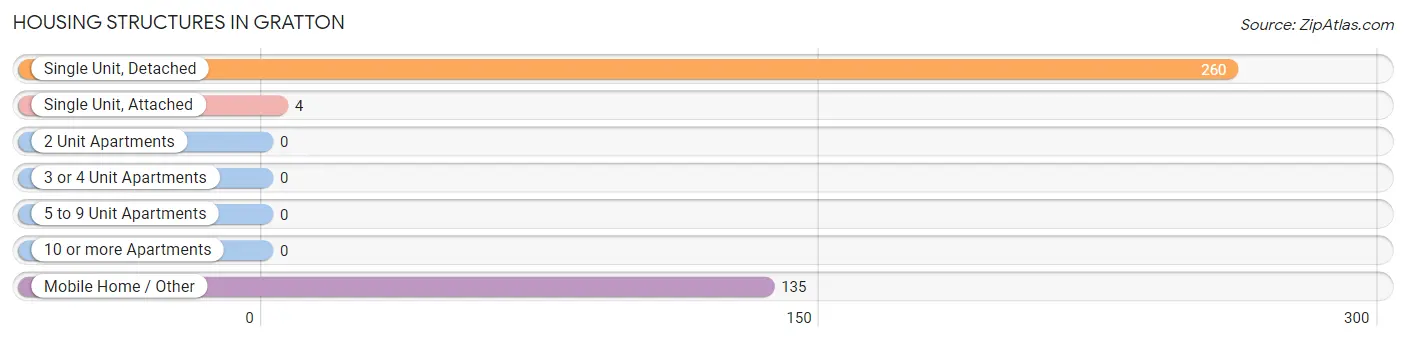
| Structure Type | # Housing Units | % Housing Units |
| Single Unit, Detached | 260 | 65.2% |
| Single Unit, Attached | 4 | 1.0% |
| 2 Unit Apartments | 0 | 0.0% |
| 3 or 4 Unit Apartments | 0 | 0.0% |
| 5 to 9 Unit Apartments | 0 | 0.0% |
| 10 or more Apartments | 0 | 0.0% |
| Mobile Home / Other | 135 | 33.8% |
| Total | 399 | 100.0% |
Housing Structures by Occupancy in Gratton
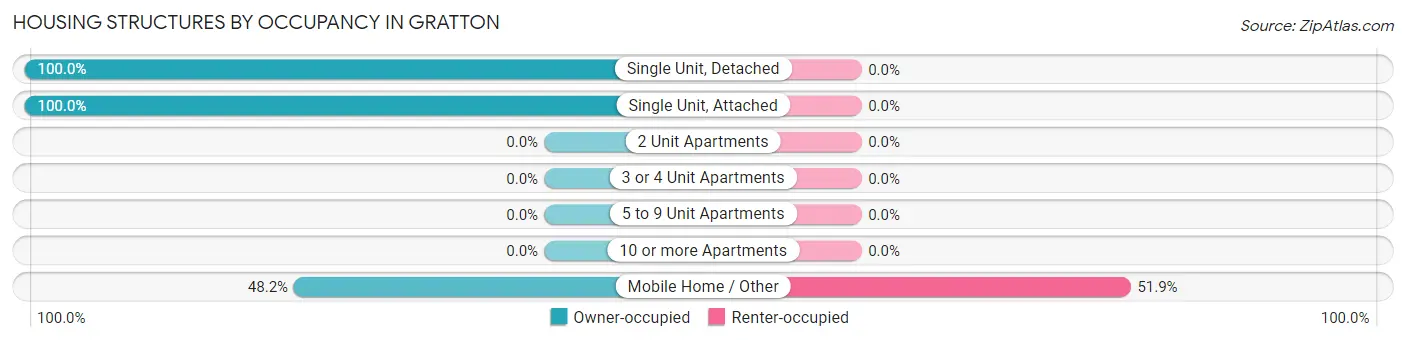
| Structure Type | Owner-occupied | Renter-occupied |
| Single Unit, Detached | 260 (100.0%) | 0 (0.0%) |
| Single Unit, Attached | 4 (100.0%) | 0 (0.0%) |
| 2 Unit Apartments | 0 (0.0%) | 0 (0.0%) |
| 3 or 4 Unit Apartments | 0 (0.0%) | 0 (0.0%) |
| 5 to 9 Unit Apartments | 0 (0.0%) | 0 (0.0%) |
| 10 or more Apartments | 0 (0.0%) | 0 (0.0%) |
| Mobile Home / Other | 65 (48.1%) | 70 (51.8%) |
| Total | 329 (82.5%) | 70 (17.5%) |
Housing Structures by Number of Rooms in Gratton
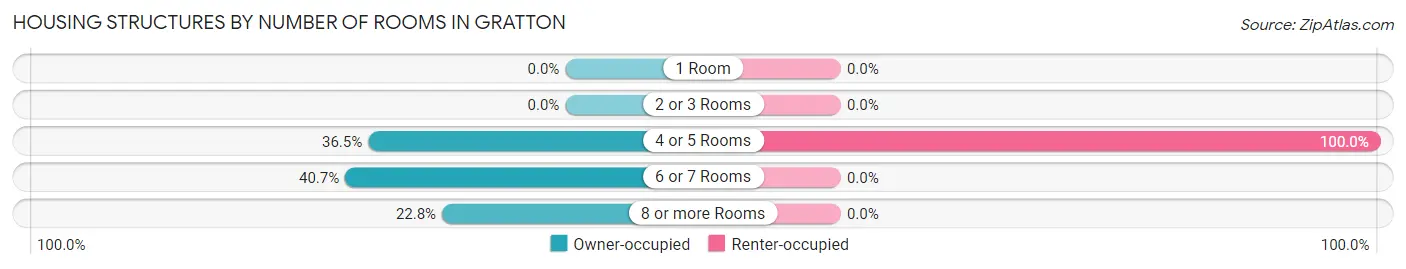
| Number of Rooms | Owner-occupied | Renter-occupied |
| 1 Room | 0 (0.0%) | 0 (0.0%) |
| 2 or 3 Rooms | 0 (0.0%) | 0 (0.0%) |
| 4 or 5 Rooms | 120 (36.5%) | 70 (100.0%) |
| 6 or 7 Rooms | 134 (40.7%) | 0 (0.0%) |
| 8 or more Rooms | 75 (22.8%) | 0 (0.0%) |
| Total | 329 (100.0%) | 70 (100.0%) |
Housing Structure by Heating Type in Gratton
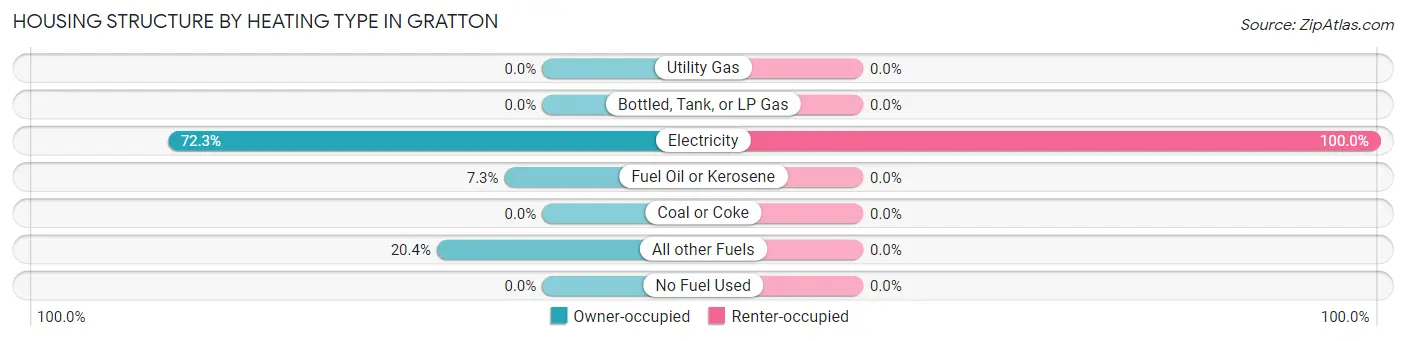
| Heating Type | Owner-occupied | Renter-occupied |
| Utility Gas | 0 (0.0%) | 0 (0.0%) |
| Bottled, Tank, or LP Gas | 0 (0.0%) | 0 (0.0%) |
| Electricity | 238 (72.3%) | 70 (100.0%) |
| Fuel Oil or Kerosene | 24 (7.3%) | 0 (0.0%) |
| Coal or Coke | 0 (0.0%) | 0 (0.0%) |
| All other Fuels | 67 (20.4%) | 0 (0.0%) |
| No Fuel Used | 0 (0.0%) | 0 (0.0%) |
| Total | 329 (100.0%) | 70 (100.0%) |
Household Vehicle Usage in Gratton
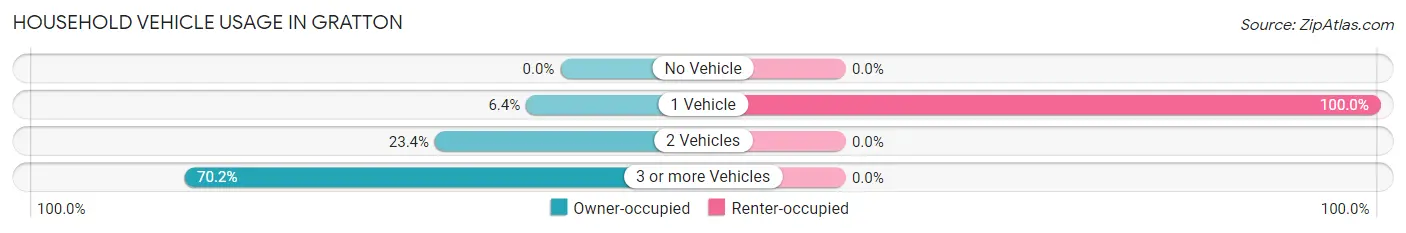
| Vehicles per Household | Owner-occupied | Renter-occupied |
| No Vehicle | 0 (0.0%) | 0 (0.0%) |
| 1 Vehicle | 21 (6.4%) | 70 (100.0%) |
| 2 Vehicles | 77 (23.4%) | 0 (0.0%) |
| 3 or more Vehicles | 231 (70.2%) | 0 (0.0%) |
| Total | 329 (100.0%) | 70 (100.0%) |
Real Estate & Mortgages in Gratton
Real Estate and Mortgage Overview in Gratton
| Characteristic | Without Mortgage | With Mortgage |
| Housing Units | 176 | 153 |
| Median Property Value | $121,100 | $116,300 |
| Median Household Income | $115,600 | $47 |
| Monthly Housing Costs | $348 | $0 |
| Real Estate Taxes | $646 | $0 |
Property Value by Mortgage Status in Gratton
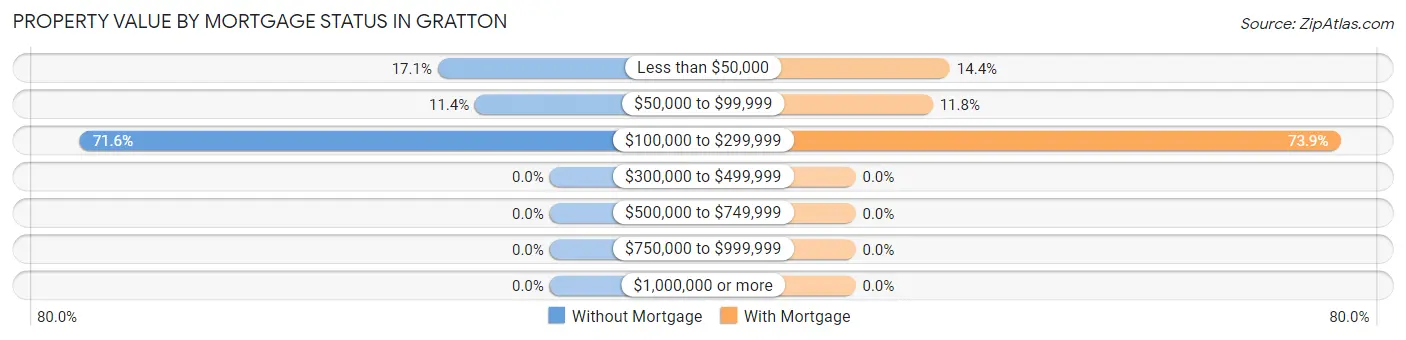
| Property Value | Without Mortgage | With Mortgage |
| Less than $50,000 | 30 (17.1%) | 22 (14.4%) |
| $50,000 to $99,999 | 20 (11.4%) | 18 (11.8%) |
| $100,000 to $299,999 | 126 (71.6%) | 113 (73.9%) |
| $300,000 to $499,999 | 0 (0.0%) | 0 (0.0%) |
| $500,000 to $749,999 | 0 (0.0%) | 0 (0.0%) |
| $750,000 to $999,999 | 0 (0.0%) | 0 (0.0%) |
| $1,000,000 or more | 0 (0.0%) | 0 (0.0%) |
| Total | 176 (100.0%) | 153 (100.0%) |
Household Income by Mortgage Status in Gratton
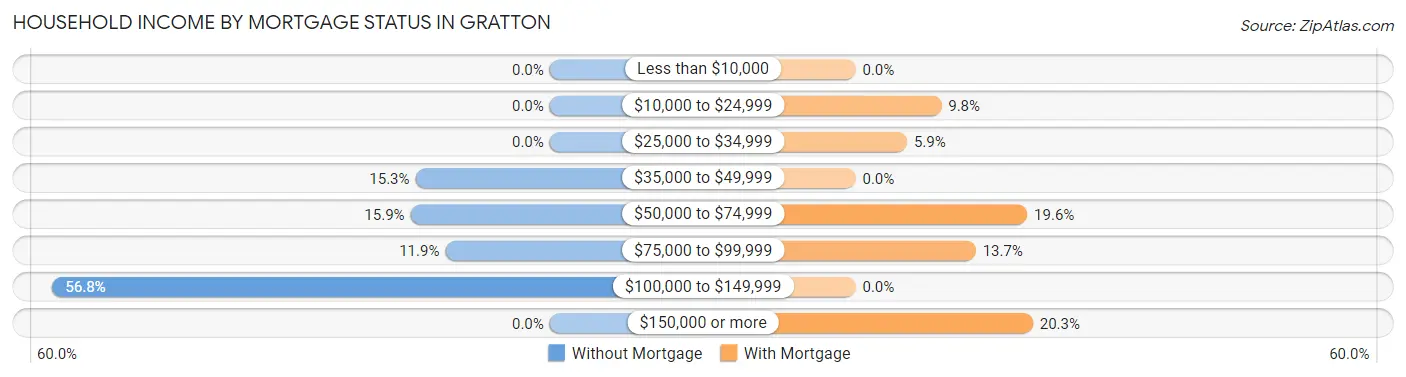
| Household Income | Without Mortgage | With Mortgage |
| Less than $10,000 | 0 (0.0%) | 0 (0.0%) |
| $10,000 to $24,999 | 0 (0.0%) | 15 (9.8%) |
| $25,000 to $34,999 | 0 (0.0%) | 9 (5.9%) |
| $35,000 to $49,999 | 27 (15.3%) | 0 (0.0%) |
| $50,000 to $74,999 | 28 (15.9%) | 30 (19.6%) |
| $75,000 to $99,999 | 21 (11.9%) | 21 (13.7%) |
| $100,000 to $149,999 | 100 (56.8%) | 0 (0.0%) |
| $150,000 or more | 0 (0.0%) | 31 (20.3%) |
| Total | 176 (100.0%) | 153 (100.0%) |
Property Value to Household Income Ratio in Gratton
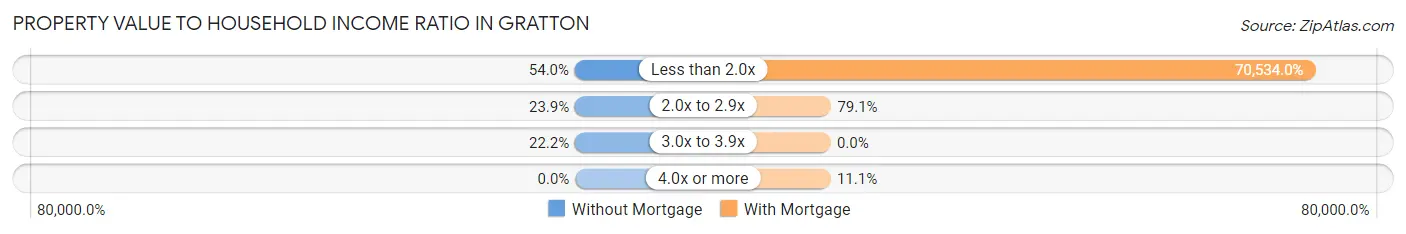
| Value-to-Income Ratio | Without Mortgage | With Mortgage |
| Less than 2.0x | 95 (54.0%) | 107,917 (70,534.0%) |
| 2.0x to 2.9x | 42 (23.9%) | 121 (79.1%) |
| 3.0x to 3.9x | 39 (22.2%) | 0 (0.0%) |
| 4.0x or more | 0 (0.0%) | 17 (11.1%) |
| Total | 176 (100.0%) | 153 (100.0%) |
Real Estate Taxes by Mortgage Status in Gratton
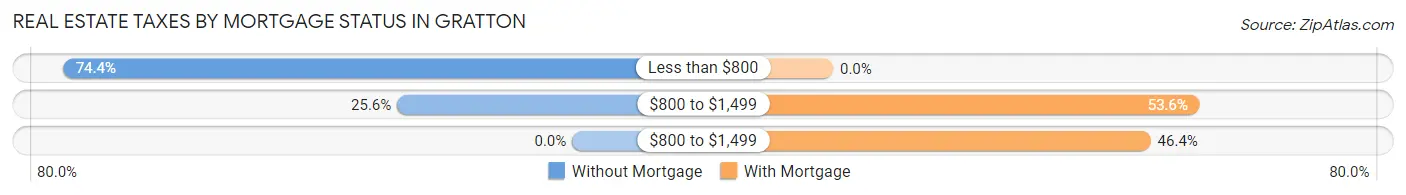
| Property Taxes | Without Mortgage | With Mortgage |
| Less than $800 | 131 (74.4%) | 0 (0.0%) |
| $800 to $1,499 | 45 (25.6%) | 82 (53.6%) |
| $800 to $1,499 | 0 (0.0%) | 71 (46.4%) |
| Total | 176 (100.0%) | 153 (100.0%) |
Health & Disability in Gratton
Health Insurance Coverage by Age in Gratton
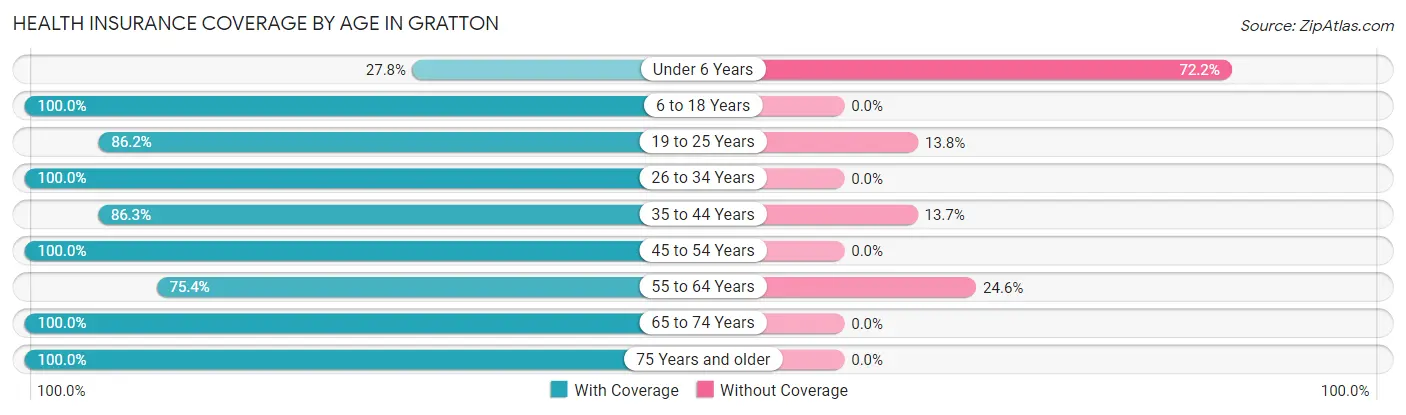
| Age Bracket | With Coverage | Without Coverage |
| Under 6 Years | 30 (27.8%) | 78 (72.2%) |
| 6 to 18 Years | 167 (100.0%) | 0 (0.0%) |
| 19 to 25 Years | 119 (86.2%) | 19 (13.8%) |
| 26 to 34 Years | 46 (100.0%) | 0 (0.0%) |
| 35 to 44 Years | 177 (86.3%) | 28 (13.7%) |
| 45 to 54 Years | 88 (100.0%) | 0 (0.0%) |
| 55 to 64 Years | 92 (75.4%) | 30 (24.6%) |
| 65 to 74 Years | 271 (100.0%) | 0 (0.0%) |
| 75 Years and older | 31 (100.0%) | 0 (0.0%) |
| Total | 1,021 (86.8%) | 155 (13.2%) |
Health Insurance Coverage by Citizenship Status in Gratton
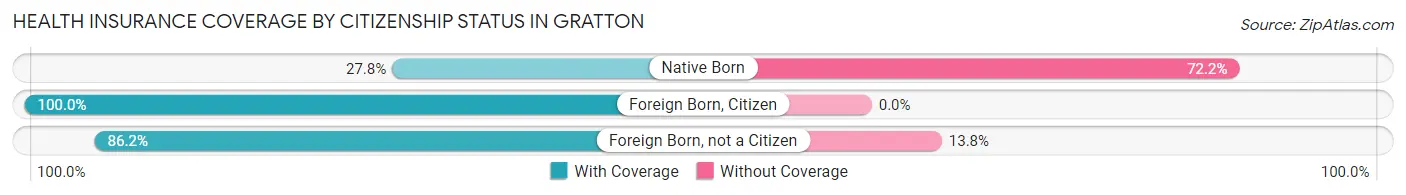
| Citizenship Status | With Coverage | Without Coverage |
| Native Born | 30 (27.8%) | 78 (72.2%) |
| Foreign Born, Citizen | 167 (100.0%) | 0 (0.0%) |
| Foreign Born, not a Citizen | 119 (86.2%) | 19 (13.8%) |
Health Insurance Coverage by Household Income in Gratton
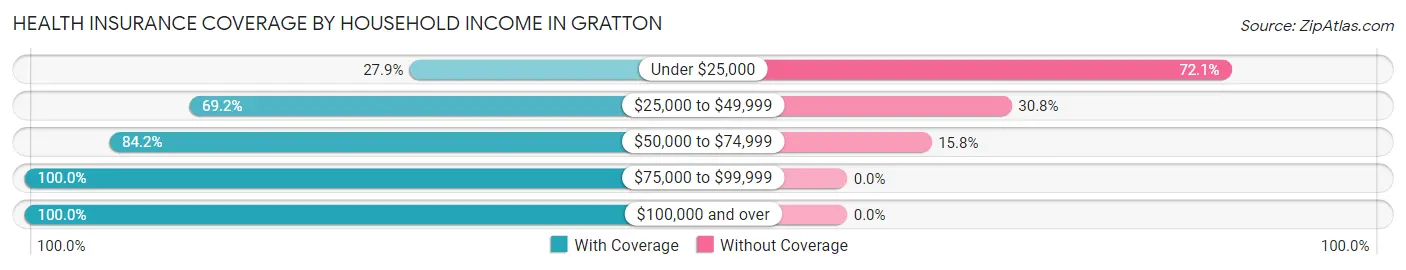
| Household Income | With Coverage | Without Coverage |
| Under $25,000 | 19 (27.9%) | 49 (72.1%) |
| $25,000 to $49,999 | 175 (69.2%) | 78 (30.8%) |
| $50,000 to $74,999 | 149 (84.2%) | 28 (15.8%) |
| $75,000 to $99,999 | 66 (100.0%) | 0 (0.0%) |
| $100,000 and over | 612 (100.0%) | 0 (0.0%) |
Public vs Private Health Insurance Coverage by Age in Gratton
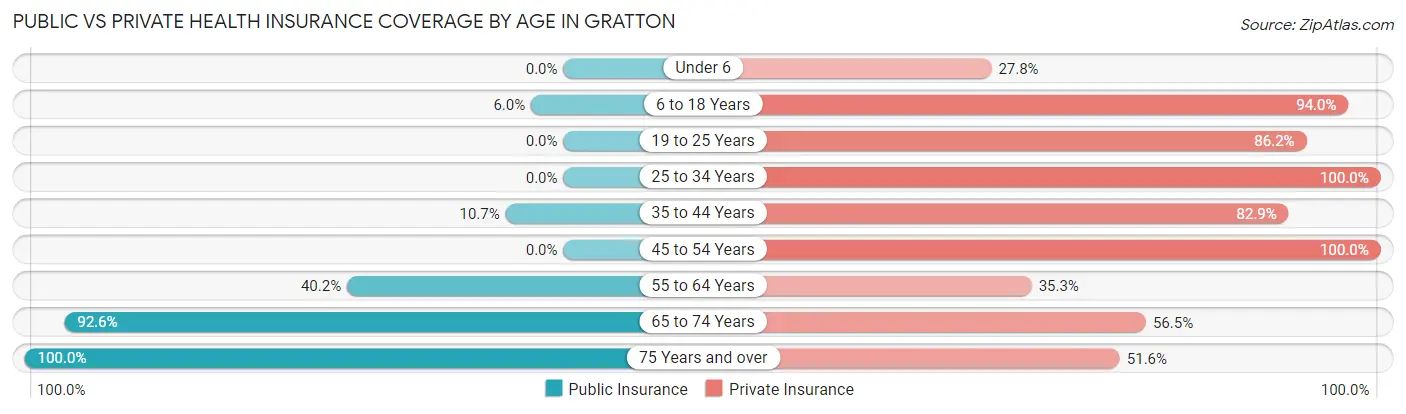
| Age Bracket | Public Insurance | Private Insurance |
| Under 6 | 0 (0.0%) | 30 (27.8%) |
| 6 to 18 Years | 10 (6.0%) | 157 (94.0%) |
| 19 to 25 Years | 0 (0.0%) | 119 (86.2%) |
| 25 to 34 Years | 0 (0.0%) | 46 (100.0%) |
| 35 to 44 Years | 22 (10.7%) | 170 (82.9%) |
| 45 to 54 Years | 0 (0.0%) | 88 (100.0%) |
| 55 to 64 Years | 49 (40.2%) | 43 (35.2%) |
| 65 to 74 Years | 251 (92.6%) | 153 (56.5%) |
| 75 Years and over | 31 (100.0%) | 16 (51.6%) |
| Total | 363 (30.9%) | 822 (69.9%) |
Disability Status by Sex by Age in Gratton
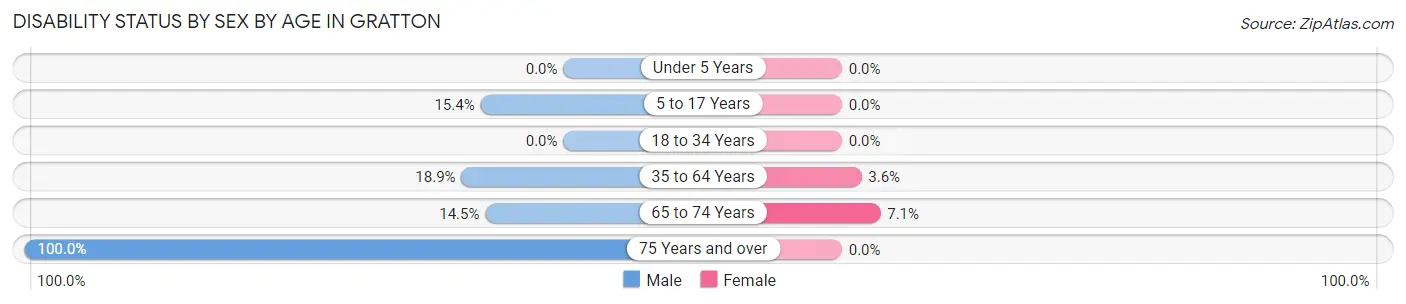
| Age Bracket | Male | Female |
| Under 5 Years | 0 (0.0%) | 0 (0.0%) |
| 5 to 17 Years | 22 (15.4%) | 0 (0.0%) |
| 18 to 34 Years | 0 (0.0%) | 0 (0.0%) |
| 35 to 64 Years | 42 (18.9%) | 7 (3.6%) |
| 65 to 74 Years | 21 (14.5%) | 9 (7.1%) |
| 75 Years and over | 16 (100.0%) | 0 (0.0%) |
Disability Class by Sex by Age in Gratton
Disability Class: Hearing Difficulty
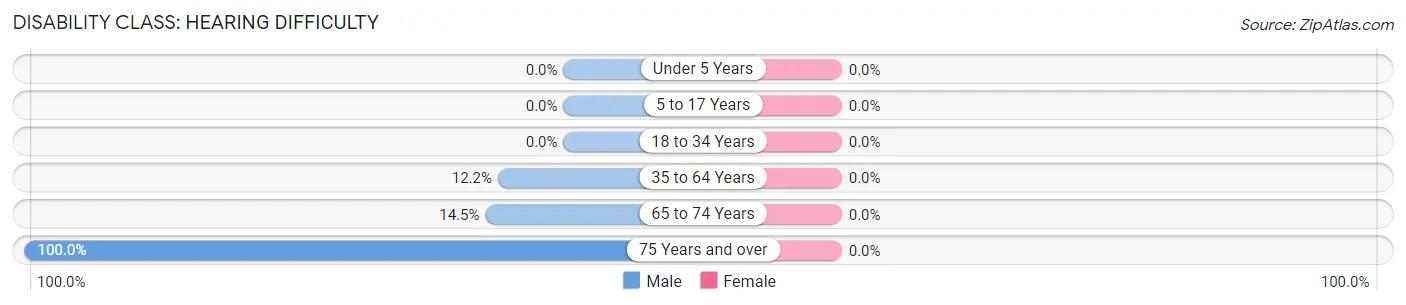
| Age Bracket | Male | Female |
| Under 5 Years | 0 (0.0%) | 0 (0.0%) |
| 5 to 17 Years | 0 (0.0%) | 0 (0.0%) |
| 18 to 34 Years | 0 (0.0%) | 0 (0.0%) |
| 35 to 64 Years | 27 (12.2%) | 0 (0.0%) |
| 65 to 74 Years | 21 (14.5%) | 0 (0.0%) |
| 75 Years and over | 16 (100.0%) | 0 (0.0%) |
Disability Class: Vision Difficulty
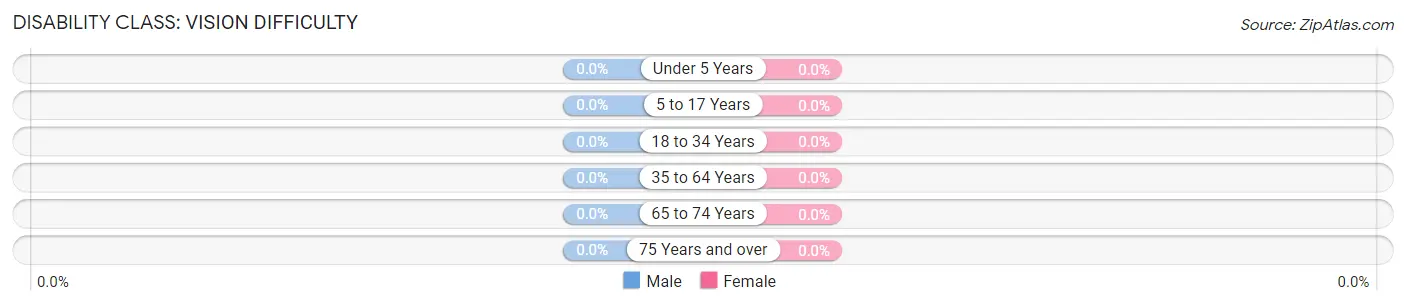
| Age Bracket | Male | Female |
| Under 5 Years | 0 (0.0%) | 0 (0.0%) |
| 5 to 17 Years | 0 (0.0%) | 0 (0.0%) |
| 18 to 34 Years | 0 (0.0%) | 0 (0.0%) |
| 35 to 64 Years | 0 (0.0%) | 0 (0.0%) |
| 65 to 74 Years | 0 (0.0%) | 0 (0.0%) |
| 75 Years and over | 0 (0.0%) | 0 (0.0%) |
Disability Class: Cognitive Difficulty
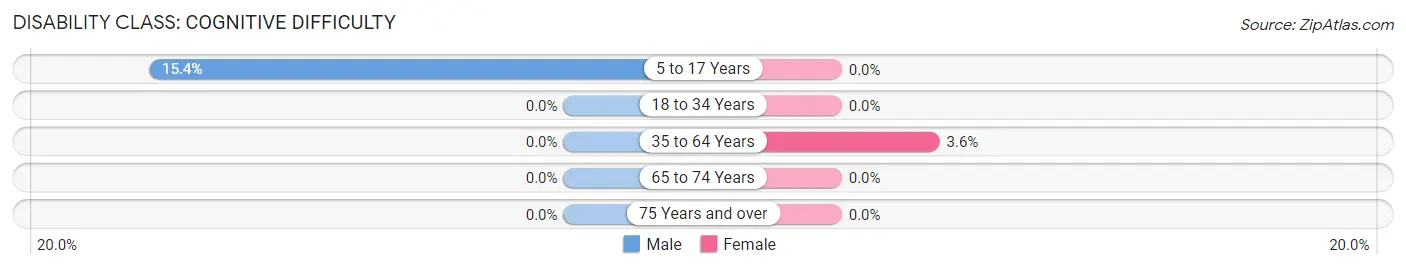
| Age Bracket | Male | Female |
| 5 to 17 Years | 22 (15.4%) | 0 (0.0%) |
| 18 to 34 Years | 0 (0.0%) | 0 (0.0%) |
| 35 to 64 Years | 0 (0.0%) | 7 (3.6%) |
| 65 to 74 Years | 0 (0.0%) | 0 (0.0%) |
| 75 Years and over | 0 (0.0%) | 0 (0.0%) |
Disability Class: Ambulatory Difficulty
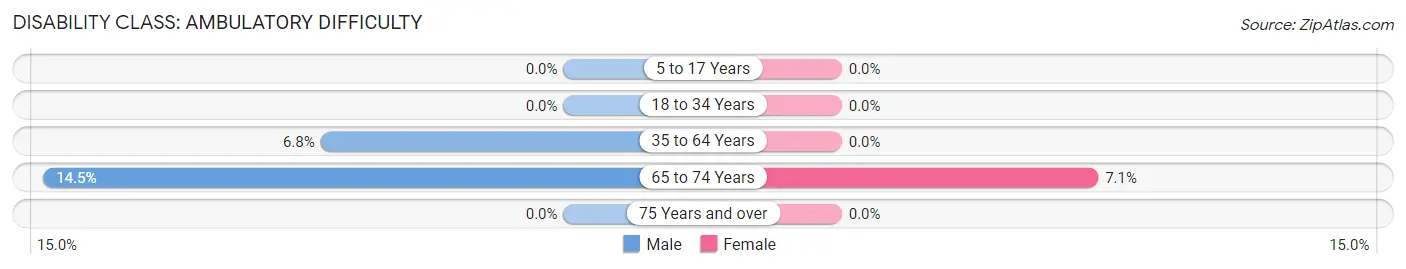
| Age Bracket | Male | Female |
| 5 to 17 Years | 0 (0.0%) | 0 (0.0%) |
| 18 to 34 Years | 0 (0.0%) | 0 (0.0%) |
| 35 to 64 Years | 15 (6.8%) | 0 (0.0%) |
| 65 to 74 Years | 21 (14.5%) | 9 (7.1%) |
| 75 Years and over | 0 (0.0%) | 0 (0.0%) |
Disability Class: Self-Care Difficulty
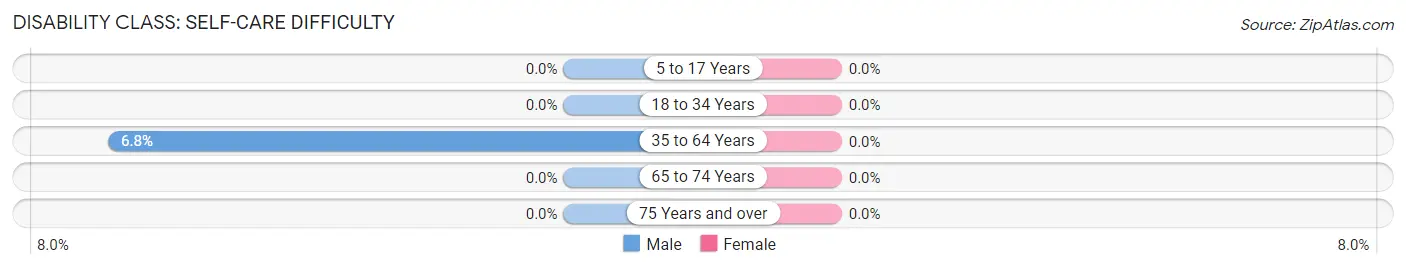
| Age Bracket | Male | Female |
| 5 to 17 Years | 0 (0.0%) | 0 (0.0%) |
| 18 to 34 Years | 0 (0.0%) | 0 (0.0%) |
| 35 to 64 Years | 15 (6.8%) | 0 (0.0%) |
| 65 to 74 Years | 0 (0.0%) | 0 (0.0%) |
| 75 Years and over | 0 (0.0%) | 0 (0.0%) |
Technology Access in Gratton
Computing Device Access in Gratton
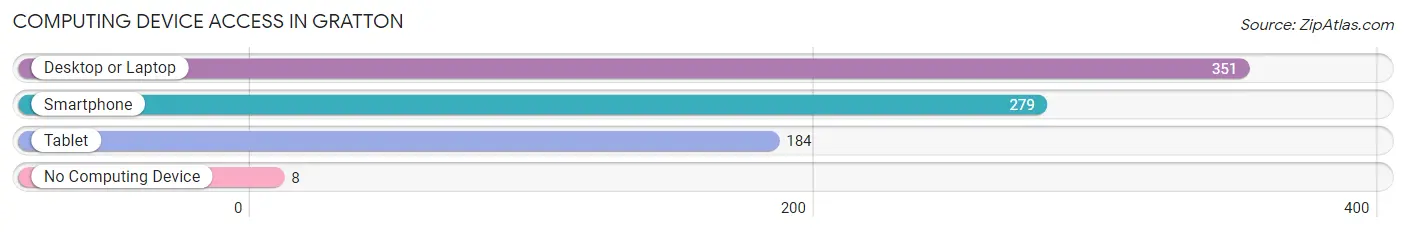
| Device Type | # Households | % Households |
| Desktop or Laptop | 351 | 88.0% |
| Smartphone | 279 | 69.9% |
| Tablet | 184 | 46.1% |
| No Computing Device | 8 | 2.0% |
| Total | 399 | 100.0% |
Internet Access in Gratton
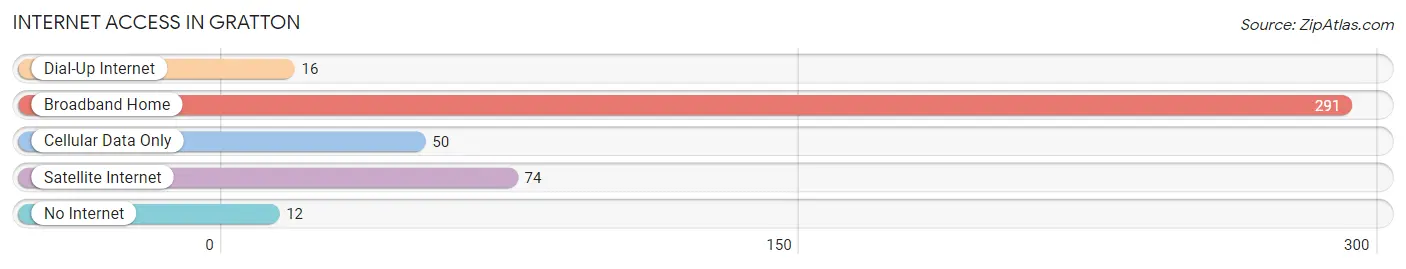
| Internet Type | # Households | % Households |
| Dial-Up Internet | 16 | 4.0% |
| Broadband Home | 291 | 72.9% |
| Cellular Data Only | 50 | 12.5% |
| Satellite Internet | 74 | 18.5% |
| No Internet | 12 | 3.0% |
| Total | 399 | 100.0% |
Gratton Summary
Gratton is a small unincorporated community located in the Blue Ridge Mountains of Virginia. It is situated in the northern part of the state, in the county of Grayson. The town is located on the banks of the New River, and is surrounded by the Jefferson National Forest. Gratton is a rural community with a population of just over 500 people.
History
Gratton was first settled in the late 1700s by a group of settlers from North Carolina. The town was originally known as “Gratton’s Crossroads”, and was named after the Gratton family who owned the land. The town was officially incorporated in 1883.
In the early 1900s, Gratton was a thriving community with a variety of businesses, including a general store, a blacksmith shop, a sawmill, and a gristmill. The town also had a post office, a school, and a church.
In the mid-1900s, the town began to decline as the population moved away in search of better economic opportunities. By the late 20th century, Gratton had become a small, rural community with a population of just over 500 people.
Geography
Gratton is located in the Blue Ridge Mountains of Virginia. It is situated in the northern part of the state, in the county of Grayson. The town is located on the banks of the New River, and is surrounded by the Jefferson National Forest.
The town is located at an elevation of 1,890 feet above sea level. The climate in Gratton is temperate, with hot summers and cold winters. The average annual temperature is around 50 degrees Fahrenheit.
Economy
Gratton’s economy is largely based on agriculture and tourism. The town is home to several farms, which produce a variety of crops, including corn, soybeans, hay, and tobacco. The town also has a few small businesses, including a general store, a restaurant, and a gas station.
Tourism is an important part of the local economy. The town is located near several popular attractions, including the New River, the Jefferson National Forest, and the Blue Ridge Parkway. The town also hosts several annual festivals, including the Gratton Apple Festival and the Gratton Music Festival.
Demographics
As of the 2010 census, Gratton had a population of 517 people. The racial makeup of the town was 97.3% White, 0.6% African American, 0.2% Native American, 0.2% Asian, 0.2% from other races, and 1.6% from two or more races.
The median household income in Gratton was $35,625, and the median family income was $41,250. The per capita income was $17,945. About 11.3% of the population was below the poverty line.
Gratton is a small, rural community with a population of just over 500 people. The town has a rich history and a strong agricultural and tourism-based economy. The town is located in the beautiful Blue Ridge Mountains of Virginia, and is surrounded by the Jefferson National Forest. Gratton is a great place to live, work, and raise a family.
Common Questions
What is Per Capita Income in Gratton?
Per Capita income in Gratton is $31,985.
What is the Median Family Income in Gratton?
Median Family Income in Gratton is $72,422.
What is the Median Household income in Gratton?
Median Household Income in Gratton is $72,466.
What is Income or Wage Gap in Gratton?
Income or Wage Gap in Gratton is 8.4%.
Women in Gratton earn 91.6 cents for every dollar earned by a man.
What is Inequality or Gini Index in Gratton?
Inequality or Gini Index in Gratton is 0.34.
What is the Total Population of Gratton?
Total Population of Gratton is 1,176.
What is the Total Male Population of Gratton?
Total Male Population of Gratton is 686.
What is the Total Female Population of Gratton?
Total Female Population of Gratton is 490.
What is the Ratio of Males per 100 Females in Gratton?
There are 140.00 Males per 100 Females in Gratton.
What is the Ratio of Females per 100 Males in Gratton?
There are 71.43 Females per 100 Males in Gratton.
What is the Median Population Age in Gratton?
Median Population Age in Gratton is 40.2 Years.
What is the Average Family Size in Gratton
Average Family Size in Gratton is 2.9 People.
What is the Average Household Size in Gratton
Average Household Size in Gratton is 3.0 People.
How Large is the Labor Force in Gratton?
There are 512 People in the Labor Forcein in Gratton.
What is the Percentage of People in the Labor Force in Gratton?
52.6% of People are in the Labor Force in Gratton.