Chase City, VA Map & Demographics
Chase City Map
Chase City Overview
$26,837
PER CAPITA INCOME
$58,661
AVG FAMILY INCOME
$46,596
AVG HOUSEHOLD INCOME
26.4%
WAGE / INCOME GAP [ % ]
73.6¢/ $1
WAGE / INCOME GAP [ $ ]
0.43
INEQUALITY / GINI INDEX
2,339
TOTAL POPULATION
1,139
MALE POPULATION
1,200
FEMALE POPULATION
94.92
MALES / 100 FEMALES
105.36
FEMALES / 100 MALES
43.9
MEDIAN AGE
2.9
AVG FAMILY SIZE
2.3
AVG HOUSEHOLD SIZE
961
LABOR FORCE [ PEOPLE ]
52.3%
PERCENT IN LABOR FORCE
2.2%
UNEMPLOYMENT RATE
Chase City Zip Codes
Chase City Area Codes
Income in Chase City
Income Overview in Chase City
Per Capita Income in Chase City is $26,837, while median incomes of families and households are $58,661 and $46,596 respectively.
| Characteristic | Number | Measure |
| Per Capita Income | 2,339 | $26,837 |
| Median Family Income | 688 | $58,661 |
| Mean Family Income | 688 | $73,489 |
| Median Household Income | 1,036 | $46,596 |
| Mean Household Income | 1,036 | $57,985 |
| Income Deficit | 688 | $0 |
| Wage / Income Gap (%) | 2,339 | 26.37% |
| Wage / Income Gap ($) | 2,339 | 73.63¢ per $1 |
| Gini / Inequality Index | 2,339 | 0.43 |
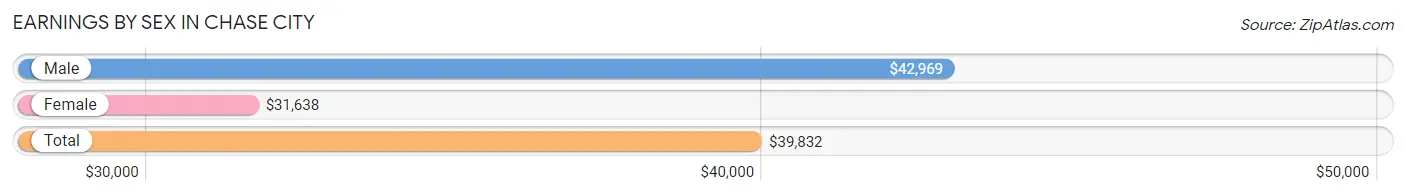
Earnings by Sex in Chase City
Average Earnings in Chase City are $39,832, $42,969 for men and $31,638 for women, a difference of 26.4%.
| Sex | Number | Average Earnings |
| Male | 519 (52.4%) | $42,969 |
| Female | 472 (47.6%) | $31,638 |
| Total | 991 (100.0%) | $39,832 |
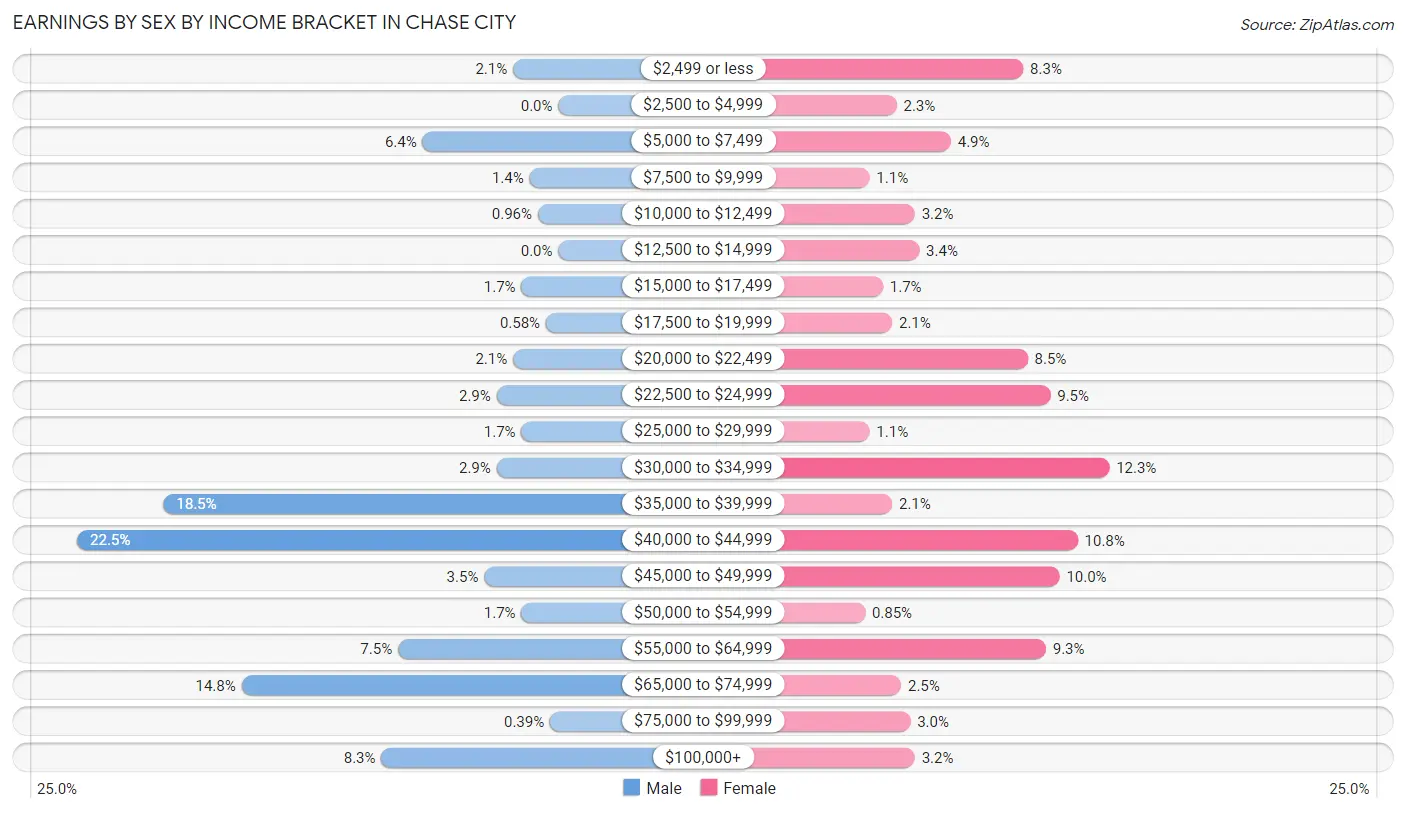
Earnings by Sex by Income Bracket in Chase City
The most common earnings brackets in Chase City are $40,000 to $44,999 for men (117 | 22.5%) and $30,000 to $34,999 for women (58 | 12.3%).
| Income | Male | Female |
| $2,499 or less | 11 (2.1%) | 39 (8.3%) |
| $2,500 to $4,999 | 0 (0.0%) | 11 (2.3%) |
| $5,000 to $7,499 | 33 (6.4%) | 23 (4.9%) |
| $7,500 to $9,999 | 7 (1.3%) | 5 (1.1%) |
| $10,000 to $12,499 | 5 (1.0%) | 15 (3.2%) |
| $12,500 to $14,999 | 0 (0.0%) | 16 (3.4%) |
| $15,000 to $17,499 | 9 (1.7%) | 8 (1.7%) |
| $17,500 to $19,999 | 3 (0.6%) | 10 (2.1%) |
| $20,000 to $22,499 | 11 (2.1%) | 40 (8.5%) |
| $22,500 to $24,999 | 15 (2.9%) | 45 (9.5%) |
| $25,000 to $29,999 | 9 (1.7%) | 5 (1.1%) |
| $30,000 to $34,999 | 15 (2.9%) | 58 (12.3%) |
| $35,000 to $39,999 | 96 (18.5%) | 10 (2.1%) |
| $40,000 to $44,999 | 117 (22.5%) | 51 (10.8%) |
| $45,000 to $49,999 | 18 (3.5%) | 47 (10.0%) |
| $50,000 to $54,999 | 9 (1.7%) | 4 (0.9%) |
| $55,000 to $64,999 | 39 (7.5%) | 44 (9.3%) |
| $65,000 to $74,999 | 77 (14.8%) | 12 (2.5%) |
| $75,000 to $99,999 | 2 (0.4%) | 14 (3.0%) |
| $100,000+ | 43 (8.3%) | 15 (3.2%) |
| Total | 519 (100.0%) | 472 (100.0%) |
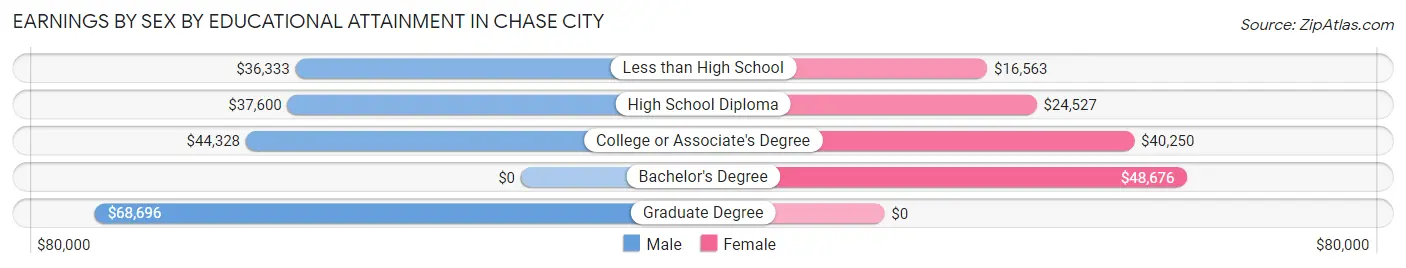
Earnings by Sex by Educational Attainment in Chase City
Average earnings in Chase City are $43,310 for men and $34,353 for women, a difference of 20.7%. Men with an educational attainment of graduate degree enjoy the highest average annual earnings of $68,696, while those with less than high school education earn the least with $36,333. Women with an educational attainment of bachelor's degree earn the most with the average annual earnings of $48,676, while those with less than high school education have the smallest earnings of $16,563.
| Educational Attainment | Male Income | Female Income |
| Less than High School | $36,333 | $16,563 |
| High School Diploma | $37,600 | $24,527 |
| College or Associate's Degree | $44,328 | $40,250 |
| Bachelor's Degree | - | - |
| Graduate Degree | $68,696 | $0 |
| Total | $43,310 | $34,353 |
Family Income in Chase City
Family Income Brackets in Chase City
According to the Chase City family income data, there are 261 families falling into the $50,000 to $74,999 income range, which is the most common income bracket and makes up 37.9% of all families. Conversely, the $10,000 to $14,999 income bracket is the least frequent group with only 7 families (1.0%) belonging to this category.
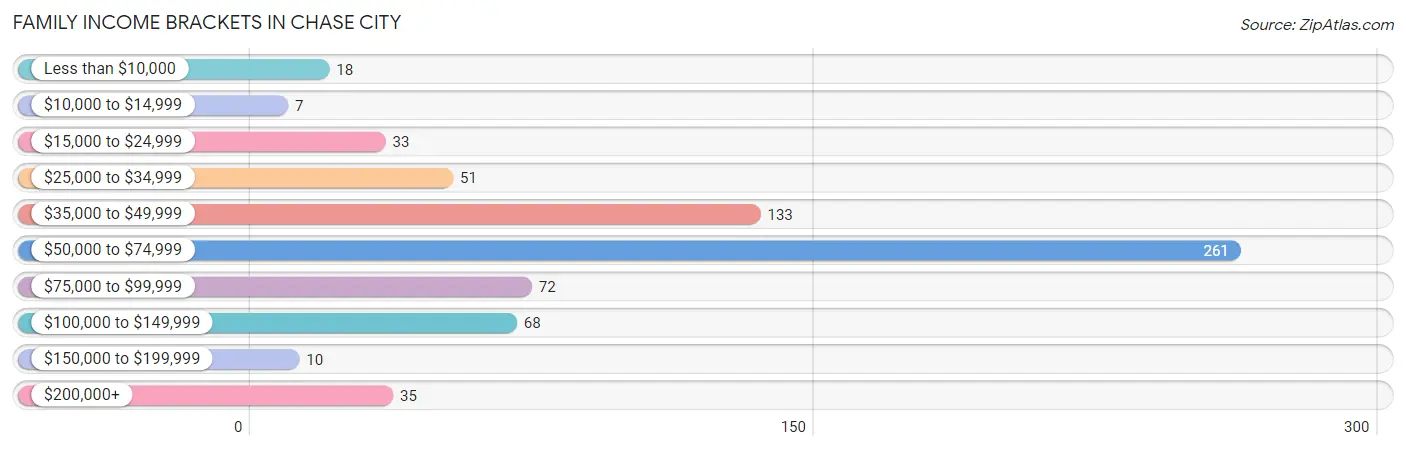
| Income Bracket | # Families | % Families |
| Less than $10,000 | 18 | 2.6% |
| $10,000 to $14,999 | 7 | 1.0% |
| $15,000 to $24,999 | 33 | 4.8% |
| $25,000 to $34,999 | 51 | 7.4% |
| $35,000 to $49,999 | 133 | 19.3% |
| $50,000 to $74,999 | 261 | 37.9% |
| $75,000 to $99,999 | 72 | 10.5% |
| $100,000 to $149,999 | 68 | 9.9% |
| $150,000 to $199,999 | 10 | 1.5% |
| $200,000+ | 35 | 5.1% |
Family Income by Famaliy Size in Chase City
4-person families (69 | 10.0%) account for the highest median family income in Chase City with $101,250 per family, while 2-person families (450 | 65.4%) have the highest median income of $26,026 per family member.
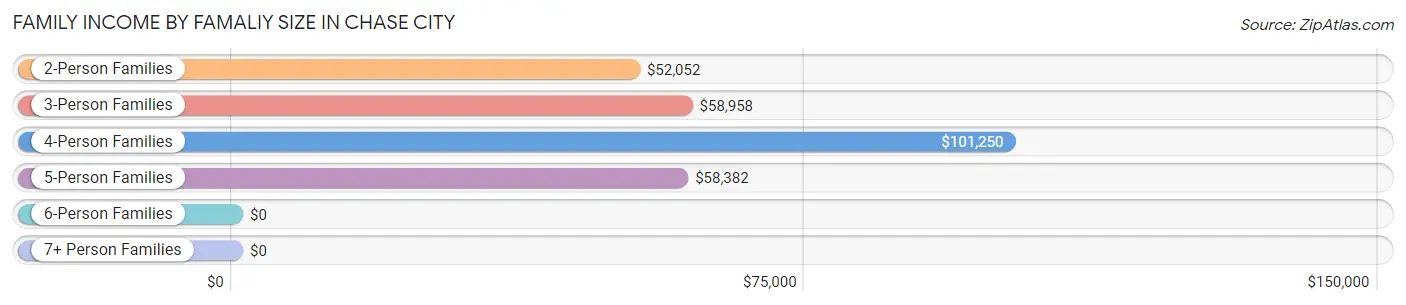
| Income Bracket | # Families | Median Income |
| 2-Person Families | 450 (65.4%) | $52,052 |
| 3-Person Families | 111 (16.1%) | $58,958 |
| 4-Person Families | 69 (10.0%) | $101,250 |
| 5-Person Families | 52 (7.6%) | $58,382 |
| 6-Person Families | 6 (0.9%) | $0 |
| 7+ Person Families | 0 (0.0%) | $0 |
| Total | 688 (100.0%) | $58,661 |
Family Income by Number of Earners in Chase City
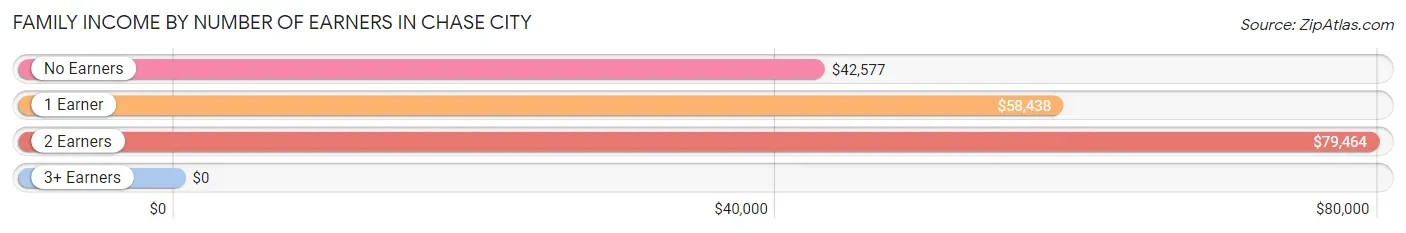
| Number of Earners | # Families | Median Income |
| No Earners | 157 (22.8%) | $42,577 |
| 1 Earner | 293 (42.6%) | $58,438 |
| 2 Earners | 201 (29.2%) | $79,464 |
| 3+ Earners | 37 (5.4%) | $0 |
| Total | 688 (100.0%) | $58,661 |
Household Income in Chase City
Household Income Brackets in Chase City
With 296 households falling in the category, the $50,000 to $74,999 income range is the most frequent in Chase City, accounting for 28.6% of all households. In contrast, only 10 households (1.0%) fall into the $150,000 to $199,999 income bracket, making it the least populous group.
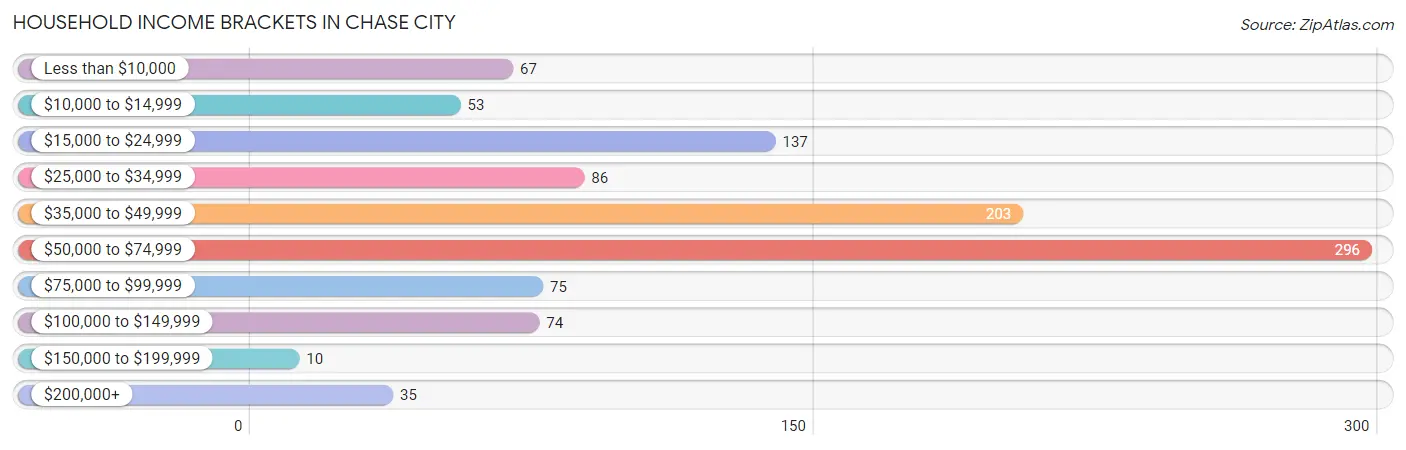
| Income Bracket | # Households | % Households |
| Less than $10,000 | 67 | 6.5% |
| $10,000 to $14,999 | 53 | 5.1% |
| $15,000 to $24,999 | 137 | 13.2% |
| $25,000 to $34,999 | 86 | 8.3% |
| $35,000 to $49,999 | 203 | 19.6% |
| $50,000 to $74,999 | 296 | 28.6% |
| $75,000 to $99,999 | 75 | 7.2% |
| $100,000 to $149,999 | 74 | 7.1% |
| $150,000 to $199,999 | 10 | 1.0% |
| $200,000+ | 35 | 3.4% |
Household Income by Householder Age in Chase City
The median household income in Chase City is $46,596, with the highest median household income of $61,964 found in the 25 to 44 years age bracket for the primary householder. A total of 225 households (21.7%) fall into this category.
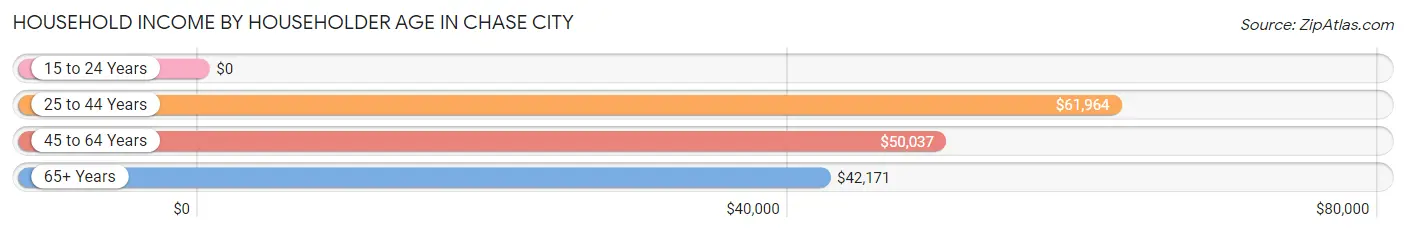
| Income Bracket | # Households | Median Income |
| 15 to 24 Years | 0 (0.0%) | $0 |
| 25 to 44 Years | 225 (21.7%) | $61,964 |
| 45 to 64 Years | 412 (39.8%) | $50,037 |
| 65+ Years | 399 (38.5%) | $42,171 |
| Total | 1,036 (100.0%) | $46,596 |
Poverty in Chase City
Income Below Poverty by Sex and Age in Chase City
With 15.2% poverty level for males and 13.9% for females among the residents of Chase City, 6 to 11 year old males and 5 year old females are the most vulnerable to poverty, with 51 males (59.3%) and 21 females (100.0%) in their respective age groups living below the poverty level.
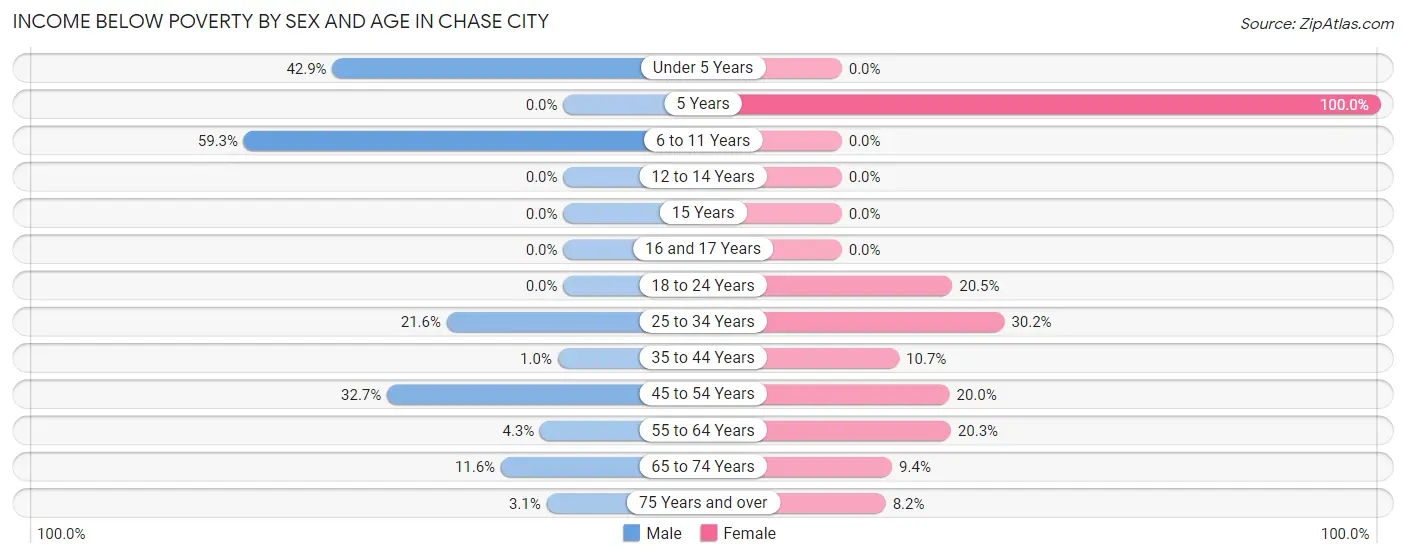
| Age Bracket | Male | Female |
| Under 5 Years | 33 (42.9%) | 0 (0.0%) |
| 5 Years | 0 (0.0%) | 21 (100.0%) |
| 6 to 11 Years | 51 (59.3%) | 0 (0.0%) |
| 12 to 14 Years | 0 (0.0%) | 0 (0.0%) |
| 15 Years | 0 (0.0%) | 0 (0.0%) |
| 16 and 17 Years | 0 (0.0%) | 0 (0.0%) |
| 18 to 24 Years | 0 (0.0%) | 8 (20.5%) |
| 25 to 34 Years | 29 (21.6%) | 32 (30.2%) |
| 35 to 44 Years | 1 (1.0%) | 18 (10.6%) |
| 45 to 54 Years | 35 (32.7%) | 28 (20.0%) |
| 55 to 64 Years | 9 (4.3%) | 32 (20.3%) |
| 65 to 74 Years | 11 (11.6%) | 13 (9.3%) |
| 75 Years and over | 4 (3.1%) | 15 (8.2%) |
| Total | 173 (15.2%) | 167 (13.9%) |
Income Above Poverty by Sex and Age in Chase City
According to the poverty statistics in Chase City, males aged 5 years and females aged under 5 years are the age groups that are most secure financially, with 100.0% of males and 100.0% of females in these age groups living above the poverty line.
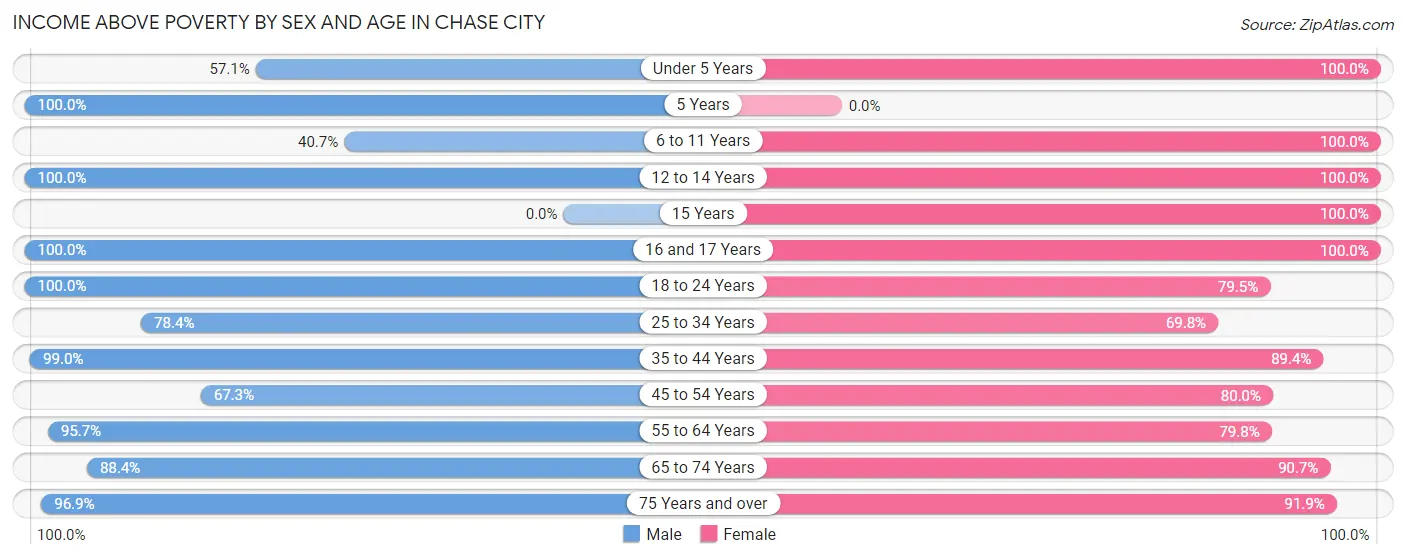
| Age Bracket | Male | Female |
| Under 5 Years | 44 (57.1%) | 55 (100.0%) |
| 5 Years | 15 (100.0%) | 0 (0.0%) |
| 6 to 11 Years | 35 (40.7%) | 81 (100.0%) |
| 12 to 14 Years | 110 (100.0%) | 43 (100.0%) |
| 15 Years | 0 (0.0%) | 14 (100.0%) |
| 16 and 17 Years | 13 (100.0%) | 51 (100.0%) |
| 18 to 24 Years | 68 (100.0%) | 31 (79.5%) |
| 25 to 34 Years | 105 (78.4%) | 74 (69.8%) |
| 35 to 44 Years | 95 (99.0%) | 151 (89.3%) |
| 45 to 54 Years | 72 (67.3%) | 112 (80.0%) |
| 55 to 64 Years | 200 (95.7%) | 126 (79.7%) |
| 65 to 74 Years | 84 (88.4%) | 126 (90.6%) |
| 75 Years and over | 125 (96.9%) | 169 (91.8%) |
| Total | 966 (84.8%) | 1,033 (86.1%) |
Income Below Poverty Among Married-Couple Families in Chase City
The poverty statistics for married-couple families in Chase City show that 2.6% or 9 of the total 340 families live below the poverty line. Families with no children have the highest poverty rate of 3.6%, comprising of 9 families. On the other hand, families with 1 or 2 children have the lowest poverty rate of 0.0%, which includes 0 families.
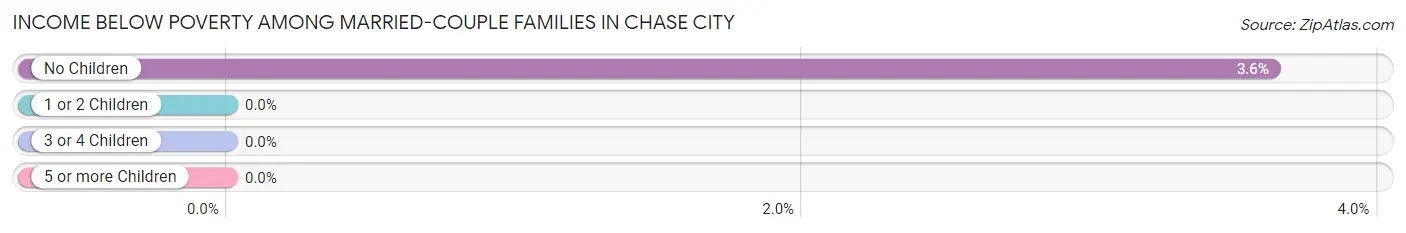
| Children | Above Poverty | Below Poverty |
| No Children | 239 (96.4%) | 9 (3.6%) |
| 1 or 2 Children | 60 (100.0%) | 0 (0.0%) |
| 3 or 4 Children | 32 (100.0%) | 0 (0.0%) |
| 5 or more Children | 0 (0.0%) | 0 (0.0%) |
| Total | 331 (97.4%) | 9 (2.6%) |
Income Below Poverty Among Single-Parent Households in Chase City
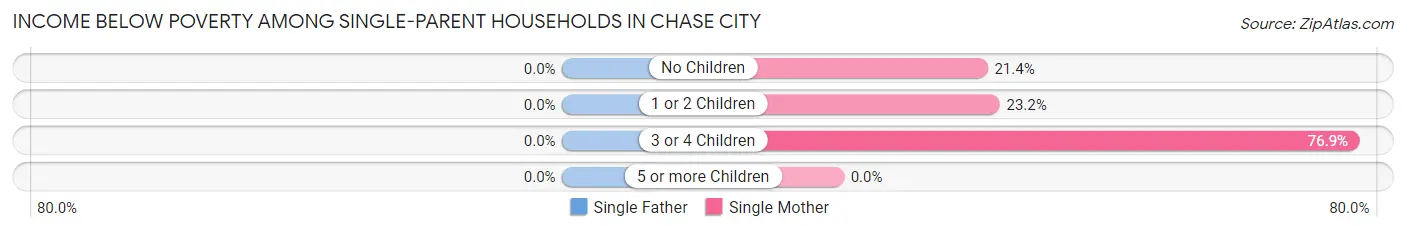
| Children | Single Father | Single Mother |
| No Children | 0 (0.0%) | 18 (21.4%) |
| 1 or 2 Children | 0 (0.0%) | 23 (23.2%) |
| 3 or 4 Children | 0 (0.0%) | 20 (76.9%) |
| 5 or more Children | 0 (0.0%) | 0 (0.0%) |
| Total | 0 (0.0%) | 61 (29.2%) |
Income Below Poverty Among Married-Couple vs Single-Parent Households in Chase City
The poverty data for Chase City shows that 9 of the married-couple family households (2.6%) and 61 of the single-parent households (17.5%) are living below the poverty level. Within the married-couple family households, those with no children have the highest poverty rate, with 9 households (3.6%) falling below the poverty line. Among the single-parent households, those with 3 or 4 children have the highest poverty rate, with 20 household (76.9%) living below poverty.
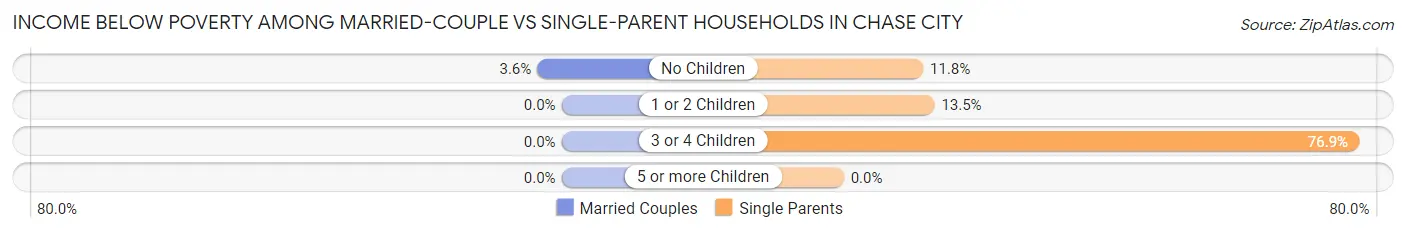
| Children | Married-Couple Families | Single-Parent Households |
| No Children | 9 (3.6%) | 18 (11.8%) |
| 1 or 2 Children | 0 (0.0%) | 23 (13.5%) |
| 3 or 4 Children | 0 (0.0%) | 20 (76.9%) |
| 5 or more Children | 0 (0.0%) | 0 (0.0%) |
| Total | 9 (2.6%) | 61 (17.5%) |
Race in Chase City
The most populous races in Chase City are White / Caucasian (1,284 | 54.9%), Black / African American (943 | 40.3%), and Two or more Races (73 | 3.1%).
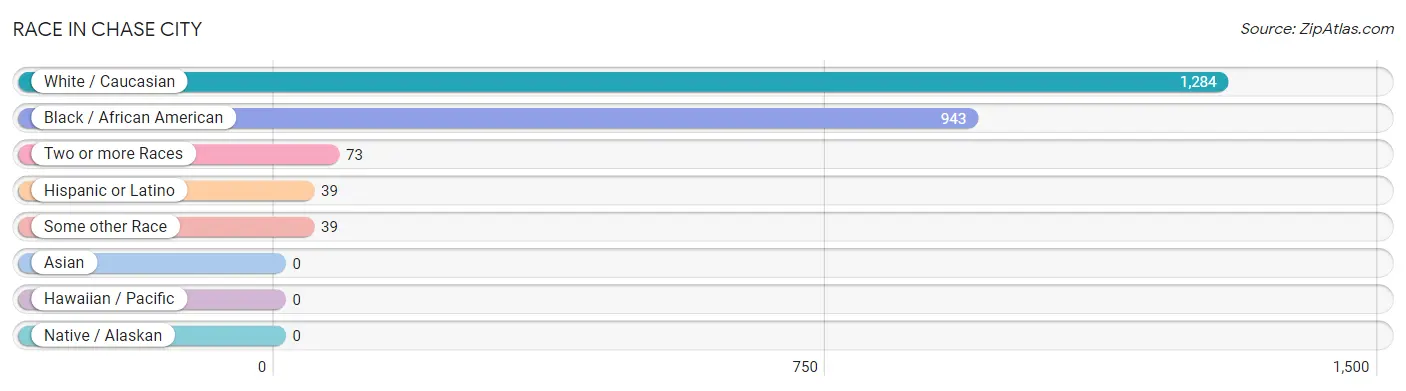
| Race | # Population | % Population |
| Asian | 0 | 0.0% |
| Black / African American | 943 | 40.3% |
| Hawaiian / Pacific | 0 | 0.0% |
| Hispanic or Latino | 39 | 1.7% |
| Native / Alaskan | 0 | 0.0% |
| White / Caucasian | 1,284 | 54.9% |
| Two or more Races | 73 | 3.1% |
| Some other Race | 39 | 1.7% |
| Total | 2,339 | 100.0% |
Ancestry in Chase City
The most populous ancestries reported in Chase City are American (670 | 28.6%), English (198 | 8.5%), Irish (49 | 2.1%), African (34 | 1.5%), and Subsaharan African (34 | 1.5%), together accounting for 42.1% of all Chase City residents.
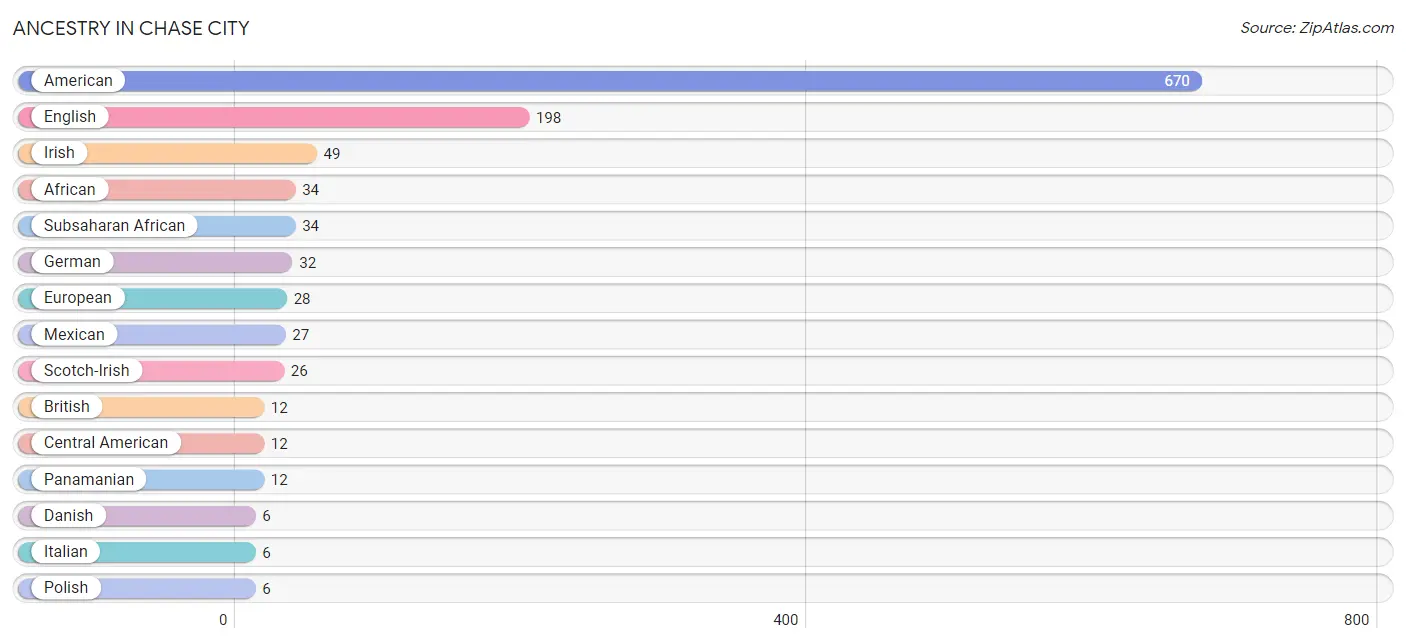
| Ancestry | # Population | % Population |
| African | 34 | 1.5% |
| American | 670 | 28.6% |
| British | 12 | 0.5% |
| Central American | 12 | 0.5% |
| Danish | 6 | 0.3% |
| English | 198 | 8.5% |
| European | 28 | 1.2% |
| French | 5 | 0.2% |
| German | 32 | 1.4% |
| Irish | 49 | 2.1% |
| Italian | 6 | 0.3% |
| Mexican | 27 | 1.1% |
| Panamanian | 12 | 0.5% |
| Polish | 6 | 0.3% |
| Scotch-Irish | 26 | 1.1% |
| Subsaharan African | 34 | 1.5% |
| Swedish | 5 | 0.2% | View All 17 Rows |
Immigrants in Chase City
The most numerous immigrant groups reported in Chase City came from Central America (26 | 1.1%), Latin America (26 | 1.1%), Panama (12 | 0.5%), Mexico (8 | 0.3%), and Honduras (6 | 0.3%), together accounting for 3.3% of all Chase City residents.
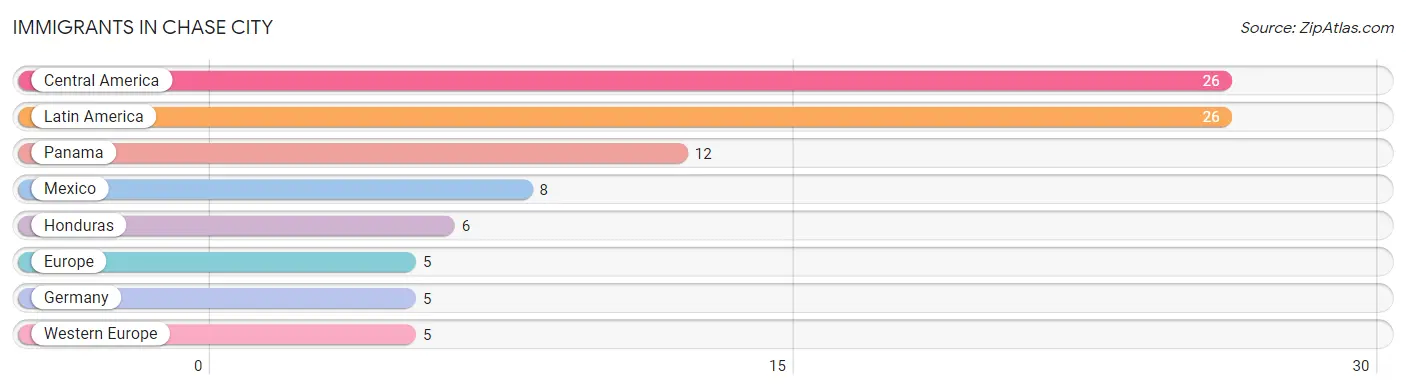
| Immigration Origin | # Population | % Population |
| Central America | 26 | 1.1% |
| Europe | 5 | 0.2% |
| Germany | 5 | 0.2% |
| Honduras | 6 | 0.3% |
| Latin America | 26 | 1.1% |
| Mexico | 8 | 0.3% |
| Panama | 12 | 0.5% |
| Western Europe | 5 | 0.2% | View All 8 Rows |
Sex and Age in Chase City
Sex and Age in Chase City
The most populous age groups in Chase City are 10 to 14 Years (126 | 11.1%) for men and 55 to 59 Years (131 | 10.9%) for women.
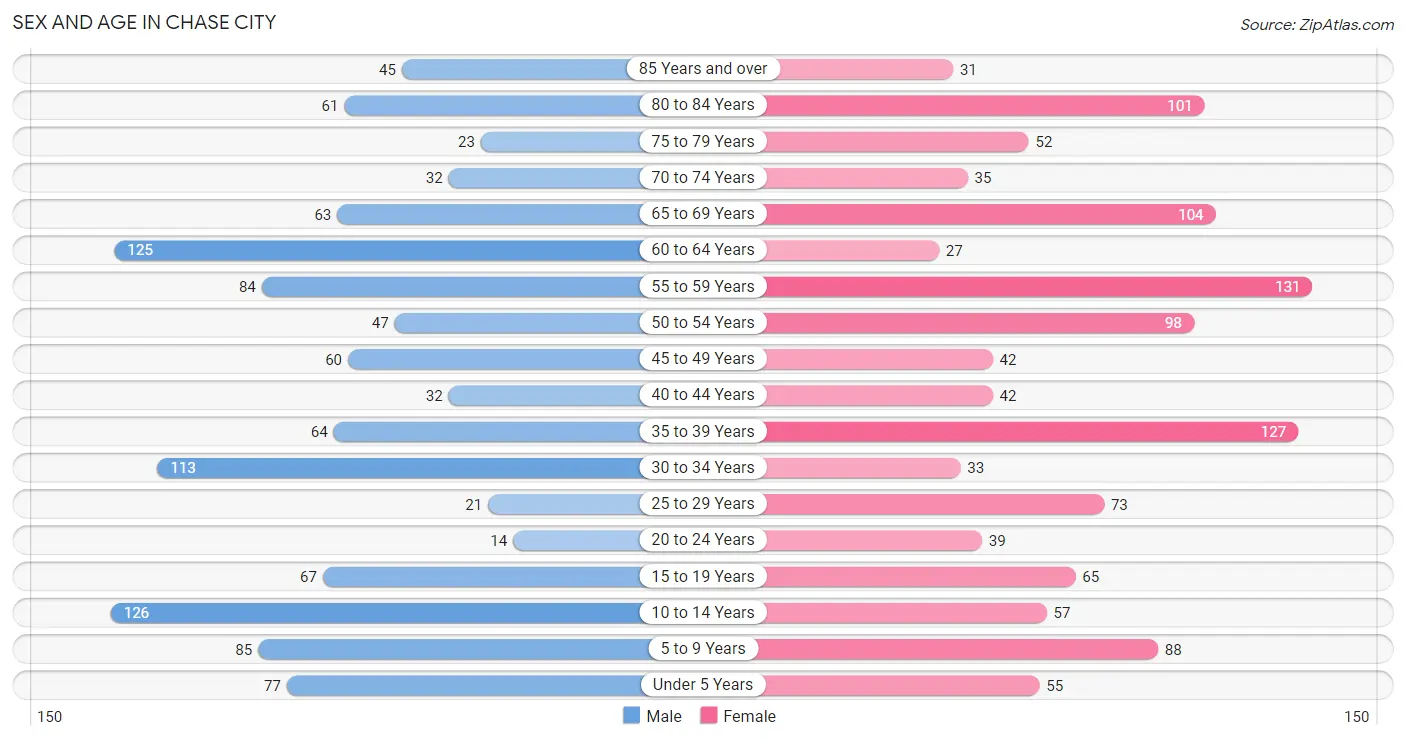
| Age Bracket | Male | Female |
| Under 5 Years | 77 (6.8%) | 55 (4.6%) |
| 5 to 9 Years | 85 (7.5%) | 88 (7.3%) |
| 10 to 14 Years | 126 (11.1%) | 57 (4.8%) |
| 15 to 19 Years | 67 (5.9%) | 65 (5.4%) |
| 20 to 24 Years | 14 (1.2%) | 39 (3.3%) |
| 25 to 29 Years | 21 (1.8%) | 73 (6.1%) |
| 30 to 34 Years | 113 (9.9%) | 33 (2.8%) |
| 35 to 39 Years | 64 (5.6%) | 127 (10.6%) |
| 40 to 44 Years | 32 (2.8%) | 42 (3.5%) |
| 45 to 49 Years | 60 (5.3%) | 42 (3.5%) |
| 50 to 54 Years | 47 (4.1%) | 98 (8.2%) |
| 55 to 59 Years | 84 (7.4%) | 131 (10.9%) |
| 60 to 64 Years | 125 (11.0%) | 27 (2.2%) |
| 65 to 69 Years | 63 (5.5%) | 104 (8.7%) |
| 70 to 74 Years | 32 (2.8%) | 35 (2.9%) |
| 75 to 79 Years | 23 (2.0%) | 52 (4.3%) |
| 80 to 84 Years | 61 (5.4%) | 101 (8.4%) |
| 85 Years and over | 45 (4.0%) | 31 (2.6%) |
| Total | 1,139 (100.0%) | 1,200 (100.0%) |
Families and Households in Chase City
Median Family Size in Chase City
The median family size in Chase City is 2.85 persons per family, with single female/mother families (209 | 30.4%) accounting for the largest median family size of 3.6 persons per family. On the other hand, single male/father families (139 | 20.2%) represent the smallest median family size with 1.78 persons per family.
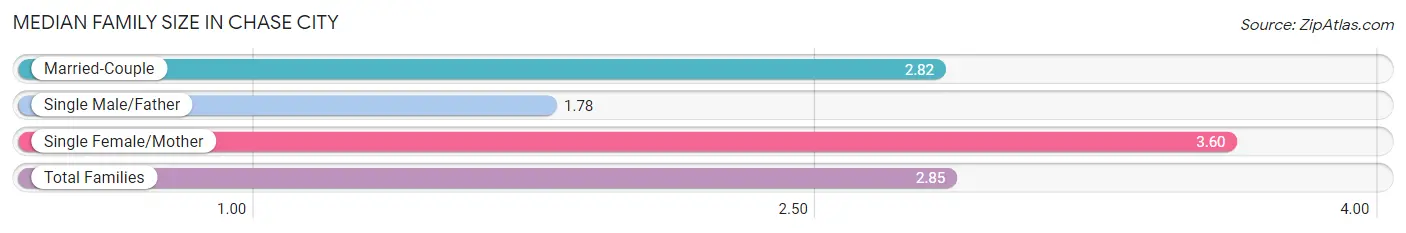
| Family Type | # Families | Family Size |
| Married-Couple | 340 (49.4%) | 2.82 |
| Single Male/Father | 139 (20.2%) | 1.78 |
| Single Female/Mother | 209 (30.4%) | 3.60 |
| Total Families | 688 (100.0%) | 2.85 |
Median Household Size in Chase City
The median household size in Chase City is 2.26 persons per household, with single female/mother households (209 | 20.2%) accounting for the largest median household size of 3.63 persons per household. non-family households (348 | 33.6%) represent the smallest median household size with 1.07 persons per household.
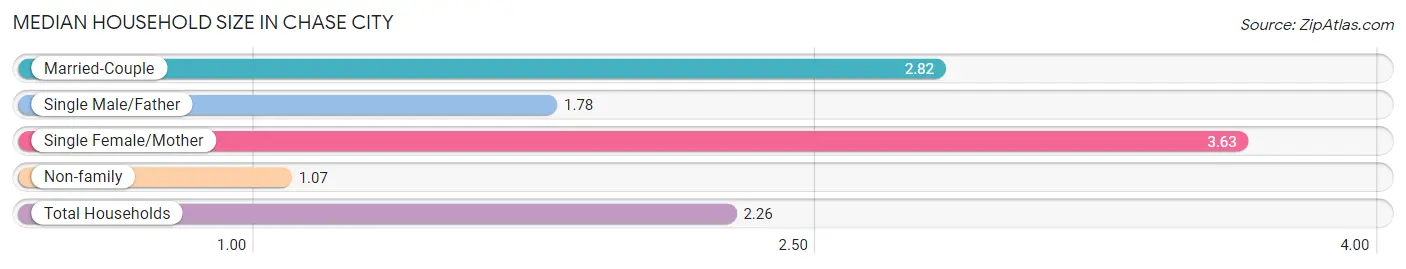
| Household Type | # Households | Household Size |
| Married-Couple | 340 (32.8%) | 2.82 |
| Single Male/Father | 139 (13.4%) | 1.78 |
| Single Female/Mother | 209 (20.2%) | 3.63 |
| Non-family | 348 (33.6%) | 1.07 |
| Total Households | 1,036 (100.0%) | 2.26 |
Household Size by Marriage Status in Chase City
Out of a total of 1,036 households in Chase City, 688 (66.4%) are family households, while 348 (33.6%) are nonfamily households. The most numerous type of family households are 2-person households, comprising 446, and the most common type of nonfamily households are 1-person households, comprising 328.
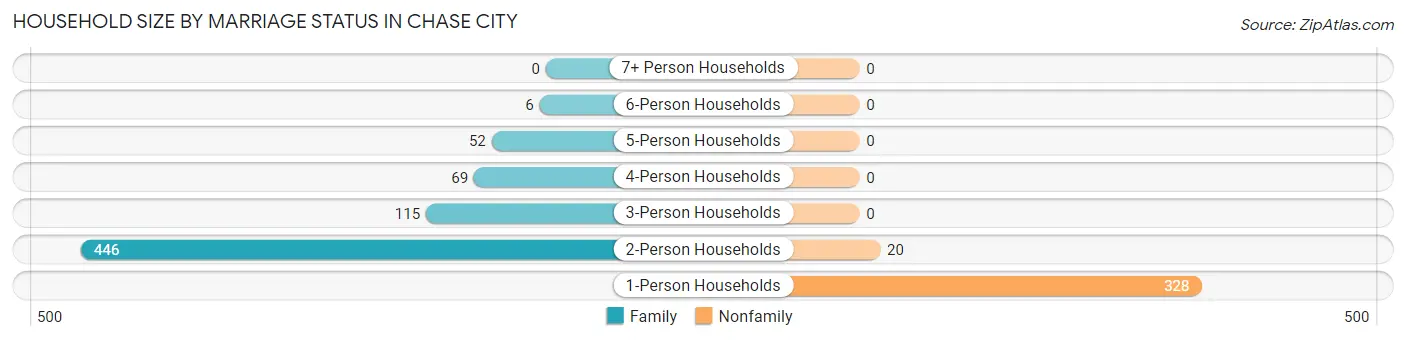
| Household Size | Family Households | Nonfamily Households |
| 1-Person Households | - | 328 (31.7%) |
| 2-Person Households | 446 (43.0%) | 20 (1.9%) |
| 3-Person Households | 115 (11.1%) | 0 (0.0%) |
| 4-Person Households | 69 (6.7%) | 0 (0.0%) |
| 5-Person Households | 52 (5.0%) | 0 (0.0%) |
| 6-Person Households | 6 (0.6%) | 0 (0.0%) |
| 7+ Person Households | 0 (0.0%) | 0 (0.0%) |
| Total | 688 (66.4%) | 348 (33.6%) |
Female Fertility in Chase City
Fertility by Age in Chase City
Average fertility rate in Chase City is 47.0 births per 1,000 women. Women in the age bracket of 20 to 34 years have the highest fertility rate with 103.0 births per 1,000 women. Women in the age bracket of 20 to 34 years acount for 71.4% of all women with births.
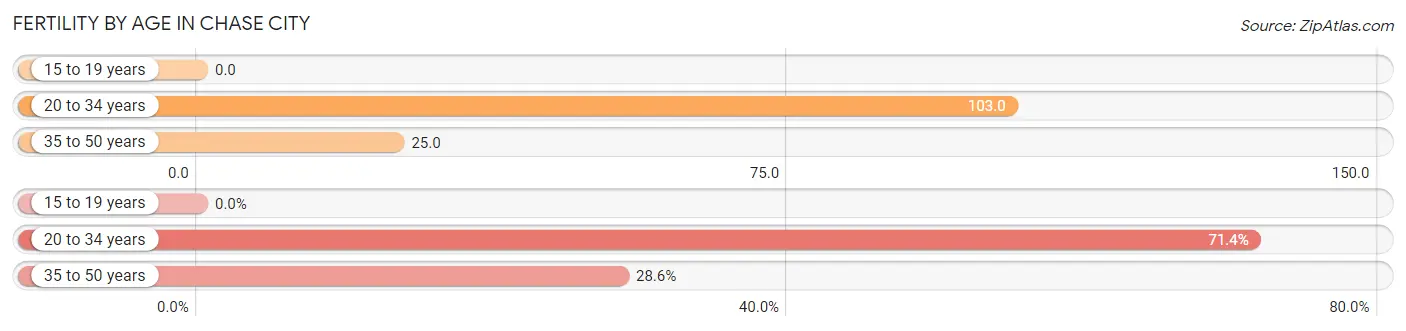
| Age Bracket | Women with Births | Births / 1,000 Women |
| 15 to 19 years | 0 (0.0%) | 0.0 |
| 20 to 34 years | 15 (71.4%) | 103.0 |
| 35 to 50 years | 6 (28.6%) | 25.0 |
| Total | 21 (100.0%) | 47.0 |
Fertility by Age by Marriage Status in Chase City
28.6% of women with births (21) in Chase City are married. The highest percentage of unmarried women with births falls into 20 to 34 years age bracket with 100.0% of them unmarried at the time of birth, while the lowest percentage of unmarried women with births belong to 35 to 50 years age bracket with 0.0% of them unmarried.
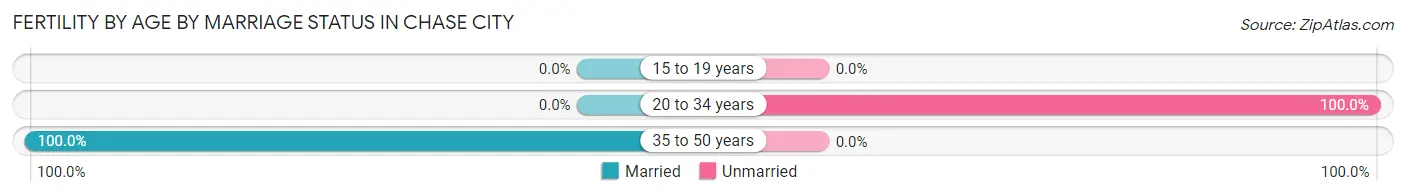
| Age Bracket | Married | Unmarried |
| 15 to 19 years | 0 (0.0%) | 0 (0.0%) |
| 20 to 34 years | 0 (0.0%) | 15 (100.0%) |
| 35 to 50 years | 6 (100.0%) | 0 (0.0%) |
| Total | 6 (28.6%) | 15 (71.4%) |
Fertility by Education in Chase City
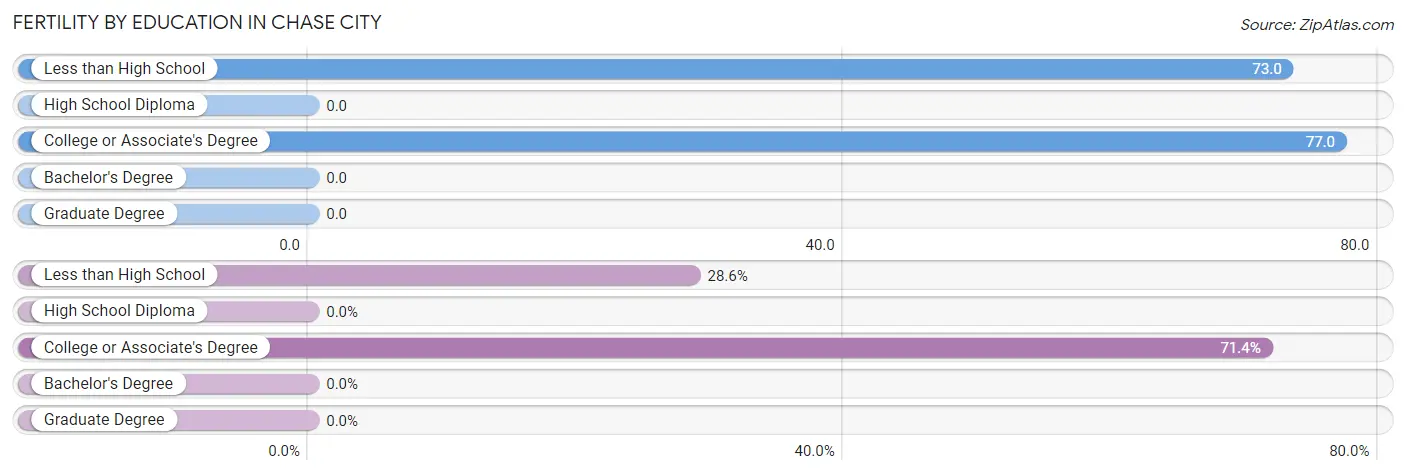
| Educational Attainment | Women with Births | Births / 1,000 Women |
| Less than High School | 6 (28.6%) | 73.0 |
| High School Diploma | 0 (0.0%) | 0.0 |
| College or Associate's Degree | 15 (71.4%) | 77.0 |
| Bachelor's Degree | 0 (0.0%) | 0.0 |
| Graduate Degree | 0 (0.0%) | 0.0 |
| Total | 21 (100.0%) | 47.0 |
Fertility by Education by Marriage Status in Chase City
71.4% of women with births in Chase City are unmarried. Women with the educational attainment of less than high school are most likely to be married with 100.0% of them married at childbirth, while women with the educational attainment of college or associate's degree are least likely to be married with 100.0% of them unmarried at childbirth.
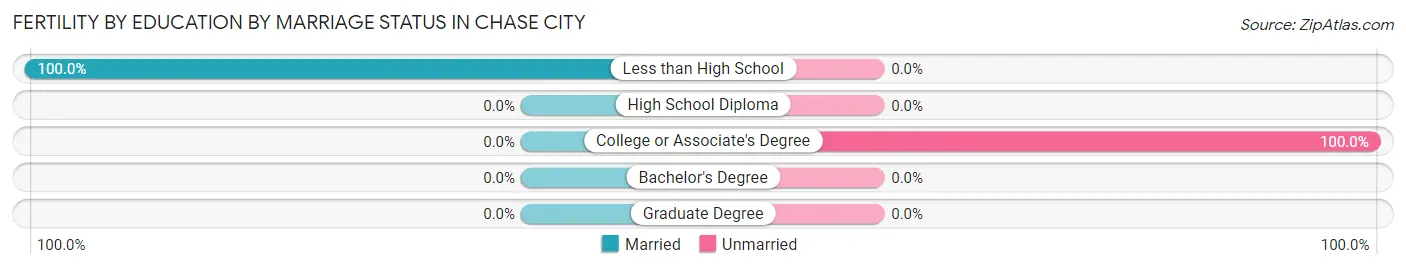
| Educational Attainment | Married | Unmarried |
| Less than High School | 6 (100.0%) | 0 (0.0%) |
| High School Diploma | 0 (0.0%) | 0 (0.0%) |
| College or Associate's Degree | 0 (0.0%) | 15 (100.0%) |
| Bachelor's Degree | 0 (0.0%) | 0 (0.0%) |
| Graduate Degree | 0 (0.0%) | 0 (0.0%) |
| Total | 6 (28.6%) | 15 (71.4%) |
Employment Characteristics in Chase City
Employment by Class of Employer in Chase City
Among the 939 employed individuals in Chase City, private company employees (549 | 58.5%), state government employees (150 | 16.0%), and local government employees (127 | 13.5%) make up the most common classes of employment.
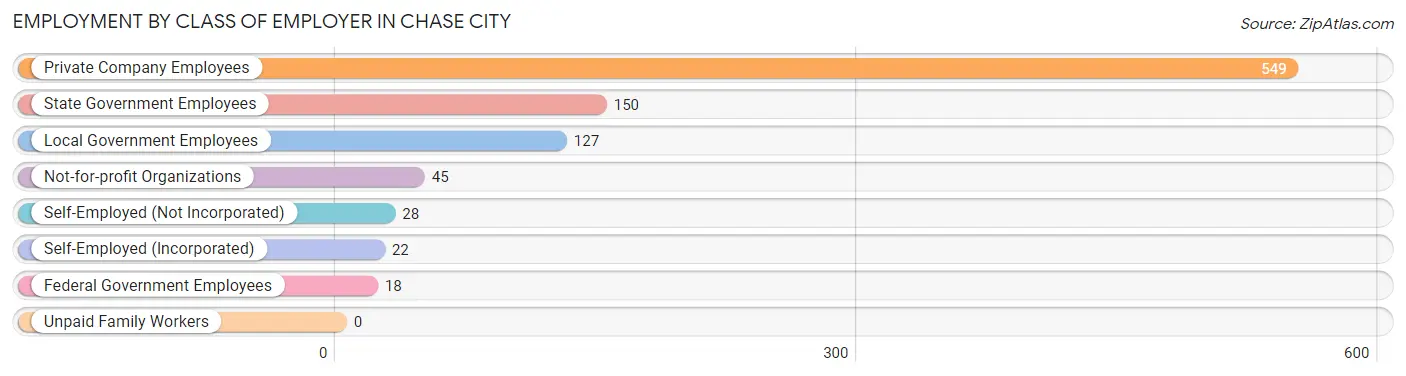
| Employer Class | # Employees | % Employees |
| Private Company Employees | 549 | 58.5% |
| Self-Employed (Incorporated) | 22 | 2.3% |
| Self-Employed (Not Incorporated) | 28 | 3.0% |
| Not-for-profit Organizations | 45 | 4.8% |
| Local Government Employees | 127 | 13.5% |
| State Government Employees | 150 | 16.0% |
| Federal Government Employees | 18 | 1.9% |
| Unpaid Family Workers | 0 | 0.0% |
| Total | 939 | 100.0% |
Employment Status by Age in Chase City
According to the labor force statistics for Chase City, out of the total population over 16 years of age (1,837), 52.3% or 961 individuals are in the labor force, with 2.2% or 21 of them unemployed. The age group with the highest labor force participation rate is 30 to 34 years, with 87.0% or 127 individuals in the labor force. Within the labor force, the 35 to 44 years age range has the highest percentage of unemployed individuals, with 9.3% or 21 of them being unemployed.
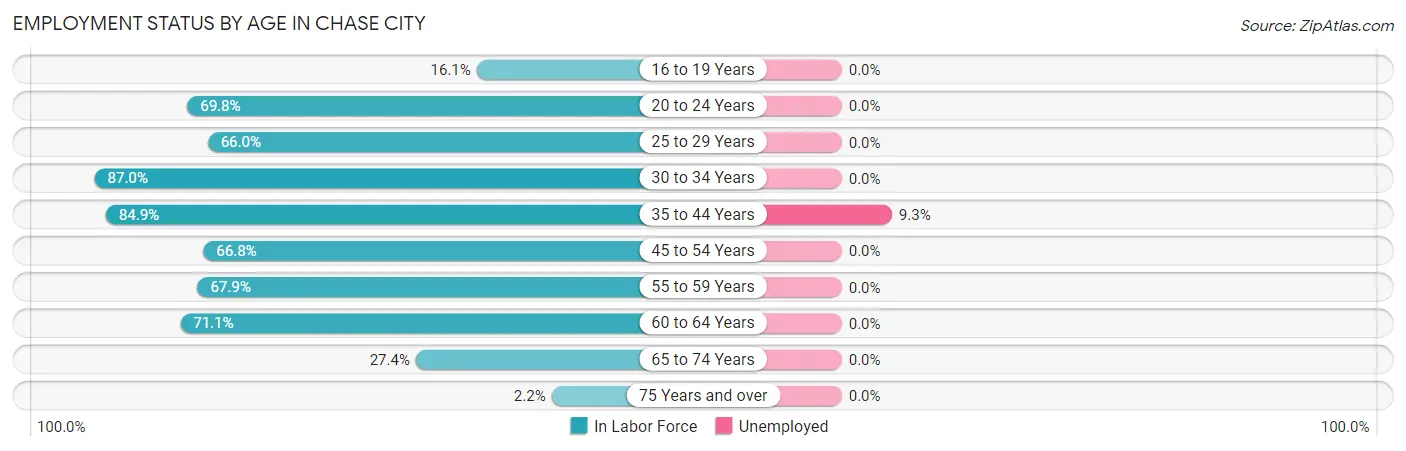
| Age Bracket | In Labor Force | Unemployed |
| 16 to 19 Years | 19 (16.1%) | 0 (0.0%) |
| 20 to 24 Years | 37 (69.8%) | 0 (0.0%) |
| 25 to 29 Years | 62 (66.0%) | 0 (0.0%) |
| 30 to 34 Years | 127 (87.0%) | 0 (0.0%) |
| 35 to 44 Years | 225 (84.9%) | 21 (9.3%) |
| 45 to 54 Years | 165 (66.8%) | 0 (0.0%) |
| 55 to 59 Years | 146 (67.9%) | 0 (0.0%) |
| 60 to 64 Years | 108 (71.1%) | 0 (0.0%) |
| 65 to 74 Years | 64 (27.4%) | 0 (0.0%) |
| 75 Years and over | 7 (2.2%) | 0 (0.0%) |
| Total | 961 (52.3%) | 21 (2.2%) |
Employment Status by Educational Attainment in Chase City
According to labor force statistics for Chase City, 74.4% of individuals (833) out of the total population between 25 and 64 years of age (1,119) are in the labor force, with 2.5% or 21 of them being unemployed. The group with the highest labor force participation rate are those with the educational attainment of bachelor's degree or higher, with 97.6% or 162 individuals in the labor force. Within the labor force, individuals with college / associate degree education have the highest percentage of unemployment, with 5.6% or 18 of them being unemployed.
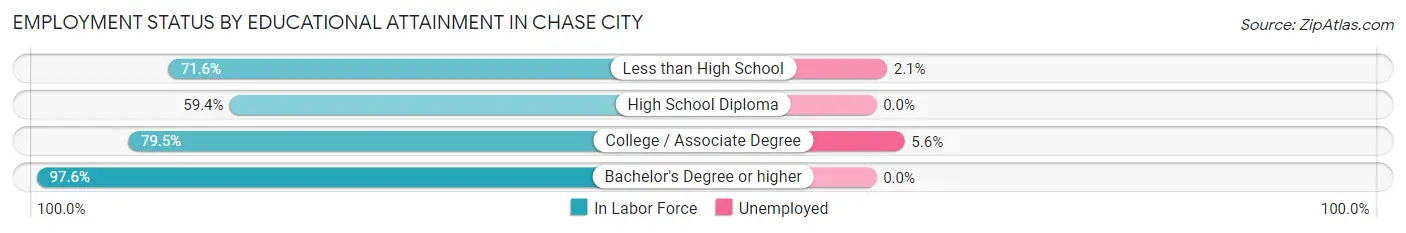
| Educational Attainment | In Labor Force | Unemployed |
| Less than High School | 141 (71.6%) | 4 (2.1%) |
| High School Diploma | 209 (59.4%) | 0 (0.0%) |
| College / Associate Degree | 321 (79.5%) | 23 (5.6%) |
| Bachelor's Degree or higher | 162 (97.6%) | 0 (0.0%) |
| Total | 833 (74.4%) | 28 (2.5%) |
Employment Occupations by Sex in Chase City
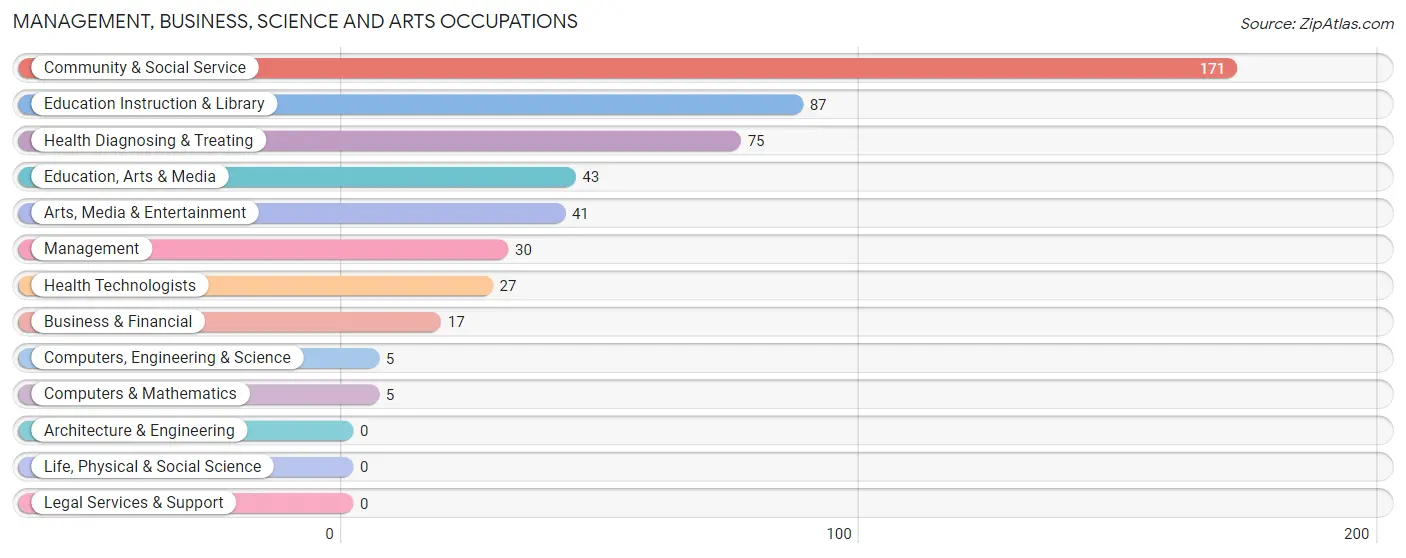
Management, Business, Science and Arts Occupations
The most common Management, Business, Science and Arts occupations in Chase City are Community & Social Service (171 | 18.2%), Education Instruction & Library (87 | 9.3%), Health Diagnosing & Treating (75 | 8.0%), Education, Arts & Media (43 | 4.6%), and Arts, Media & Entertainment (41 | 4.4%).
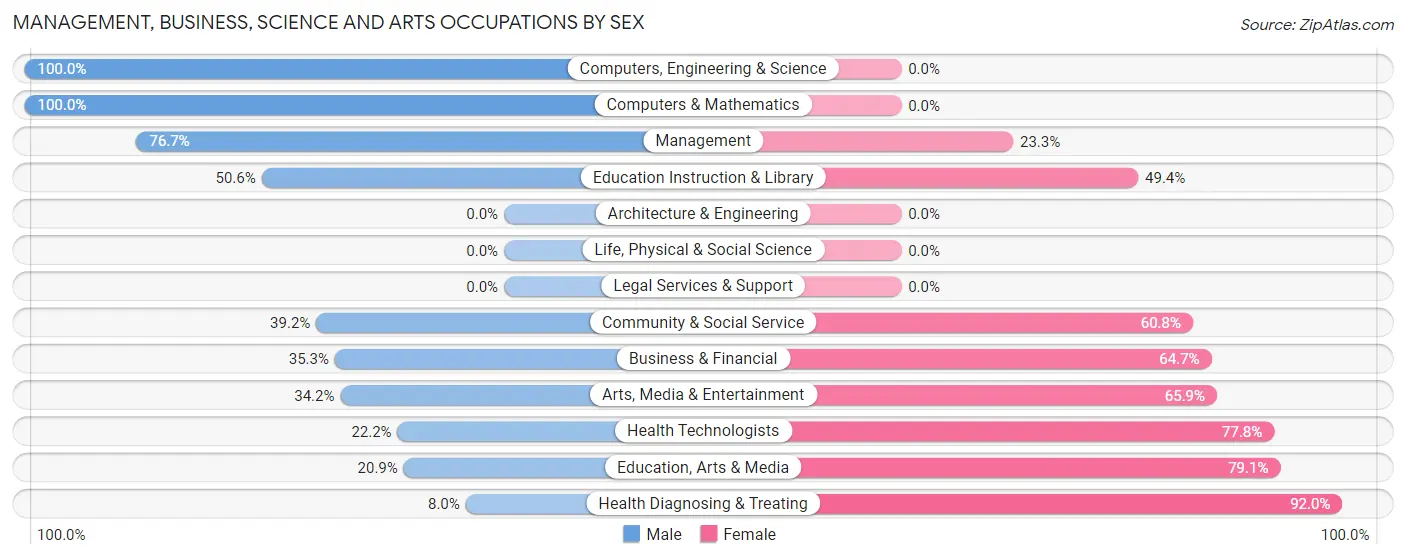
Management, Business, Science and Arts Occupations by Sex
Within the Management, Business, Science and Arts occupations in Chase City, the most male-oriented occupations are Computers, Engineering & Science (100.0%), Computers & Mathematics (100.0%), and Management (76.7%), while the most female-oriented occupations are Health Diagnosing & Treating (92.0%), Education, Arts & Media (79.1%), and Health Technologists (77.8%).
| Occupation | Male | Female |
| Management | 23 (76.7%) | 7 (23.3%) |
| Business & Financial | 6 (35.3%) | 11 (64.7%) |
| Computers, Engineering & Science | 5 (100.0%) | 0 (0.0%) |
| Computers & Mathematics | 5 (100.0%) | 0 (0.0%) |
| Architecture & Engineering | 0 (0.0%) | 0 (0.0%) |
| Life, Physical & Social Science | 0 (0.0%) | 0 (0.0%) |
| Community & Social Service | 67 (39.2%) | 104 (60.8%) |
| Education, Arts & Media | 9 (20.9%) | 34 (79.1%) |
| Legal Services & Support | 0 (0.0%) | 0 (0.0%) |
| Education Instruction & Library | 44 (50.6%) | 43 (49.4%) |
| Arts, Media & Entertainment | 14 (34.2%) | 27 (65.8%) |
| Health Diagnosing & Treating | 6 (8.0%) | 69 (92.0%) |
| Health Technologists | 6 (22.2%) | 21 (77.8%) |
| Total (Category) | 107 (35.9%) | 191 (64.1%) |
| Total (Overall) | 508 (54.1%) | 431 (45.9%) |
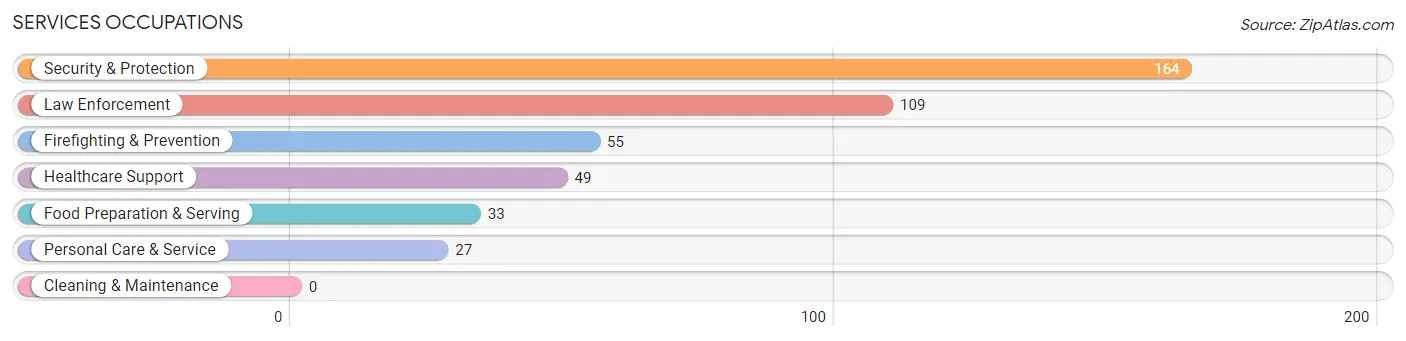
Services Occupations
The most common Services occupations in Chase City are Security & Protection (164 | 17.5%), Law Enforcement (109 | 11.6%), Firefighting & Prevention (55 | 5.9%), Healthcare Support (49 | 5.2%), and Food Preparation & Serving (33 | 3.5%).
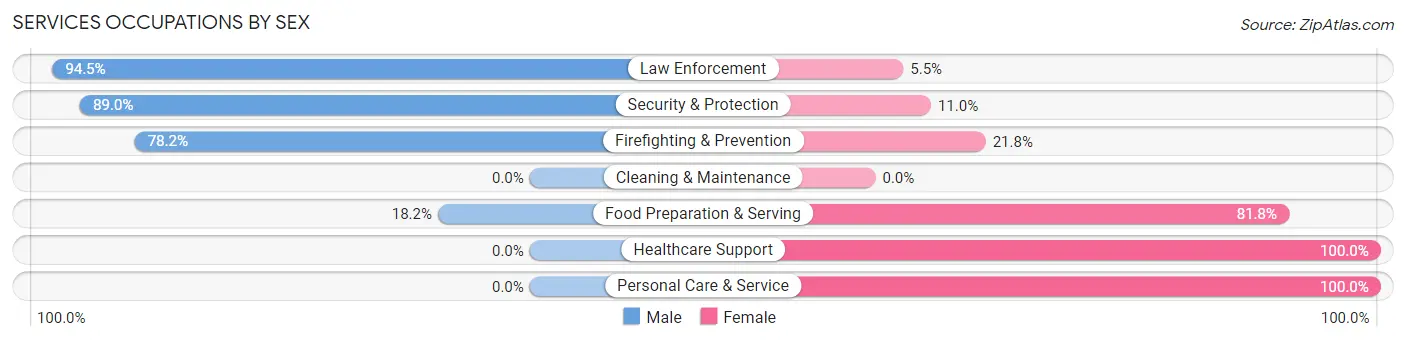
Services Occupations by Sex
Within the Services occupations in Chase City, the most male-oriented occupations are Law Enforcement (94.5%), Security & Protection (89.0%), and Firefighting & Prevention (78.2%), while the most female-oriented occupations are Healthcare Support (100.0%), Personal Care & Service (100.0%), and Food Preparation & Serving (81.8%).
| Occupation | Male | Female |
| Healthcare Support | 0 (0.0%) | 49 (100.0%) |
| Security & Protection | 146 (89.0%) | 18 (11.0%) |
| Firefighting & Prevention | 43 (78.2%) | 12 (21.8%) |
| Law Enforcement | 103 (94.5%) | 6 (5.5%) |
| Food Preparation & Serving | 6 (18.2%) | 27 (81.8%) |
| Cleaning & Maintenance | 0 (0.0%) | 0 (0.0%) |
| Personal Care & Service | 0 (0.0%) | 27 (100.0%) |
| Total (Category) | 152 (55.7%) | 121 (44.3%) |
| Total (Overall) | 508 (54.1%) | 431 (45.9%) |
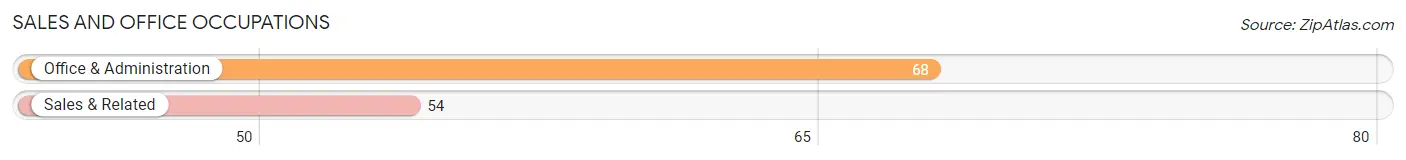
Sales and Office Occupations
The most common Sales and Office occupations in Chase City are Office & Administration (68 | 7.2%), and Sales & Related (54 | 5.8%).
Sales and Office Occupations by Sex
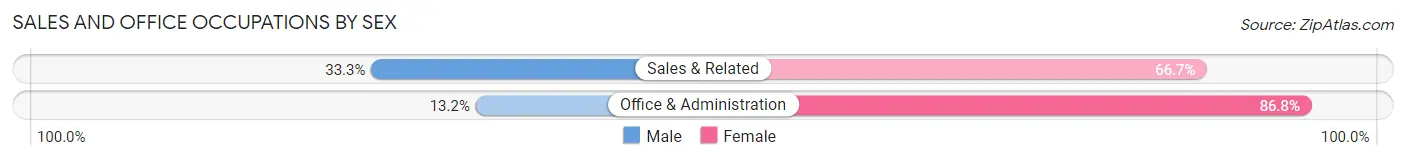
| Occupation | Male | Female |
| Sales & Related | 18 (33.3%) | 36 (66.7%) |
| Office & Administration | 9 (13.2%) | 59 (86.8%) |
| Total (Category) | 27 (22.1%) | 95 (77.9%) |
| Total (Overall) | 508 (54.1%) | 431 (45.9%) |
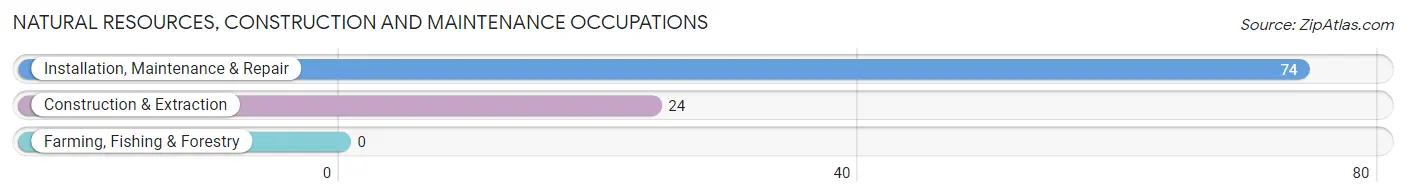
Natural Resources, Construction and Maintenance Occupations
The most common Natural Resources, Construction and Maintenance occupations in Chase City are Installation, Maintenance & Repair (74 | 7.9%), and Construction & Extraction (24 | 2.6%).
Natural Resources, Construction and Maintenance Occupations by Sex
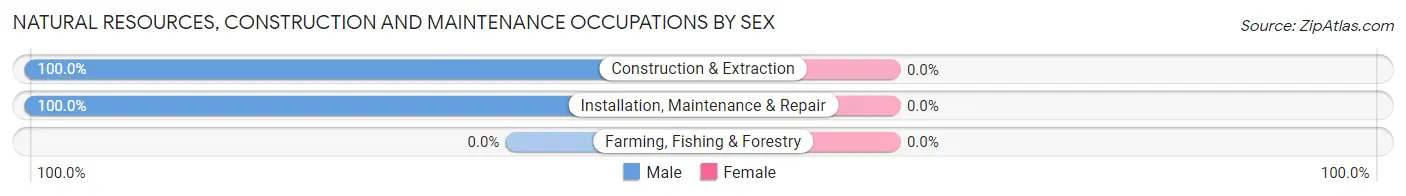
| Occupation | Male | Female |
| Farming, Fishing & Forestry | 0 (0.0%) | 0 (0.0%) |
| Construction & Extraction | 24 (100.0%) | 0 (0.0%) |
| Installation, Maintenance & Repair | 74 (100.0%) | 0 (0.0%) |
| Total (Category) | 98 (100.0%) | 0 (0.0%) |
| Total (Overall) | 508 (54.1%) | 431 (45.9%) |
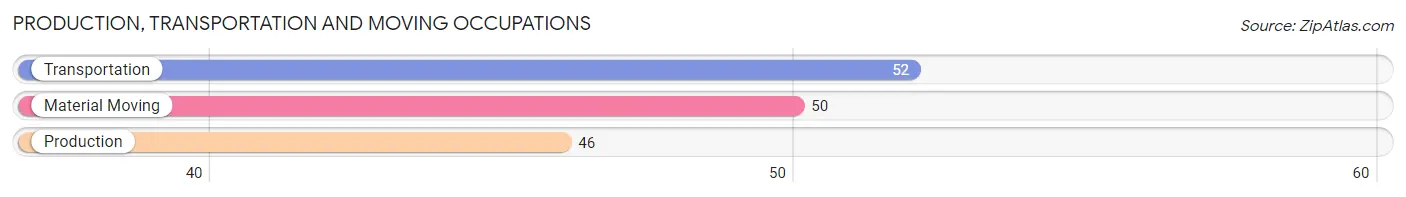
Production, Transportation and Moving Occupations
The most common Production, Transportation and Moving occupations in Chase City are Transportation (52 | 5.5%), Material Moving (50 | 5.3%), and Production (46 | 4.9%).
Production, Transportation and Moving Occupations by Sex
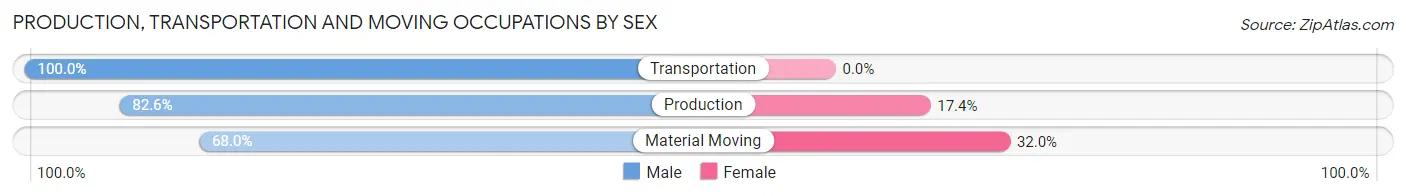
| Occupation | Male | Female |
| Production | 38 (82.6%) | 8 (17.4%) |
| Transportation | 52 (100.0%) | 0 (0.0%) |
| Material Moving | 34 (68.0%) | 16 (32.0%) |
| Total (Category) | 124 (83.8%) | 24 (16.2%) |
| Total (Overall) | 508 (54.1%) | 431 (45.9%) |
Employment Industries by Sex in Chase City
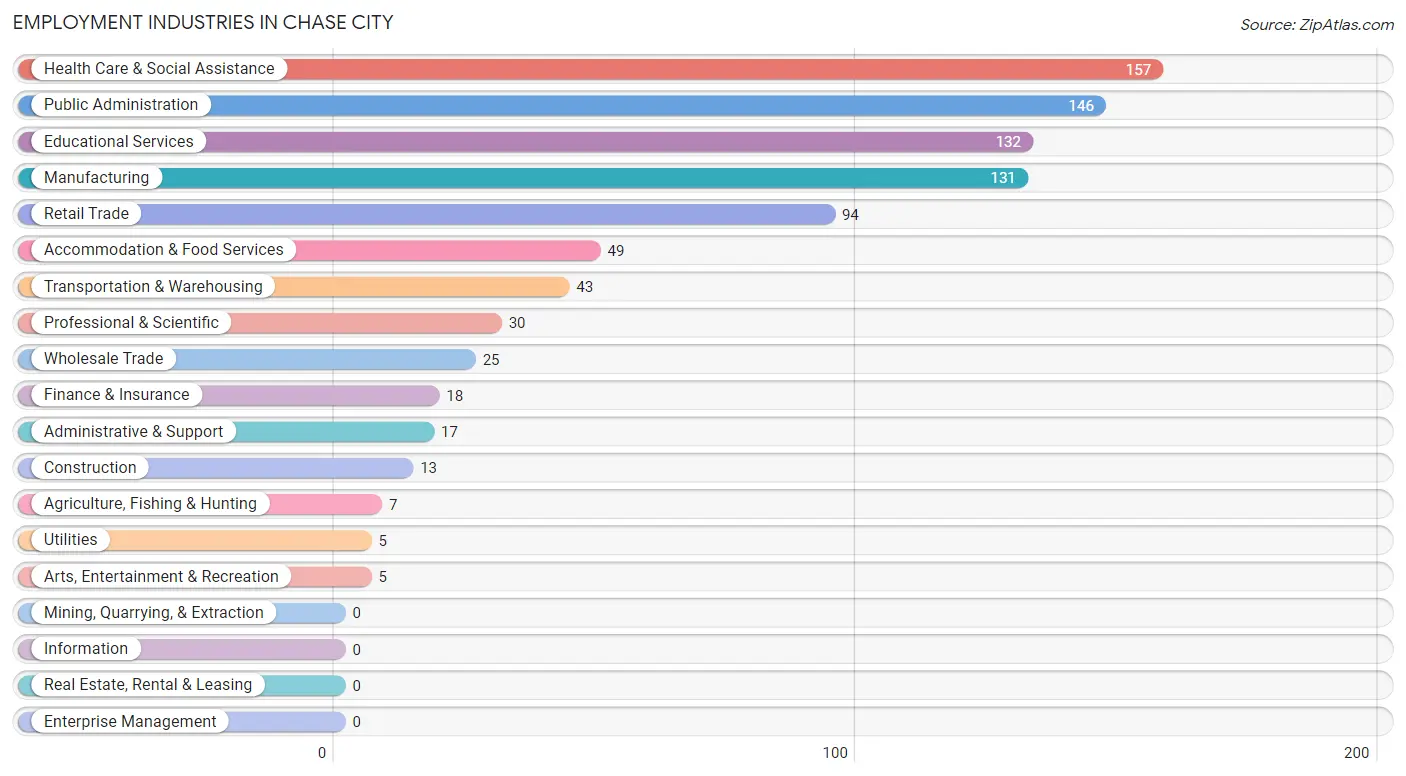
Employment Industries in Chase City
The major employment industries in Chase City include Health Care & Social Assistance (157 | 16.7%), Public Administration (146 | 15.5%), Educational Services (132 | 14.1%), Manufacturing (131 | 14.0%), and Retail Trade (94 | 10.0%).
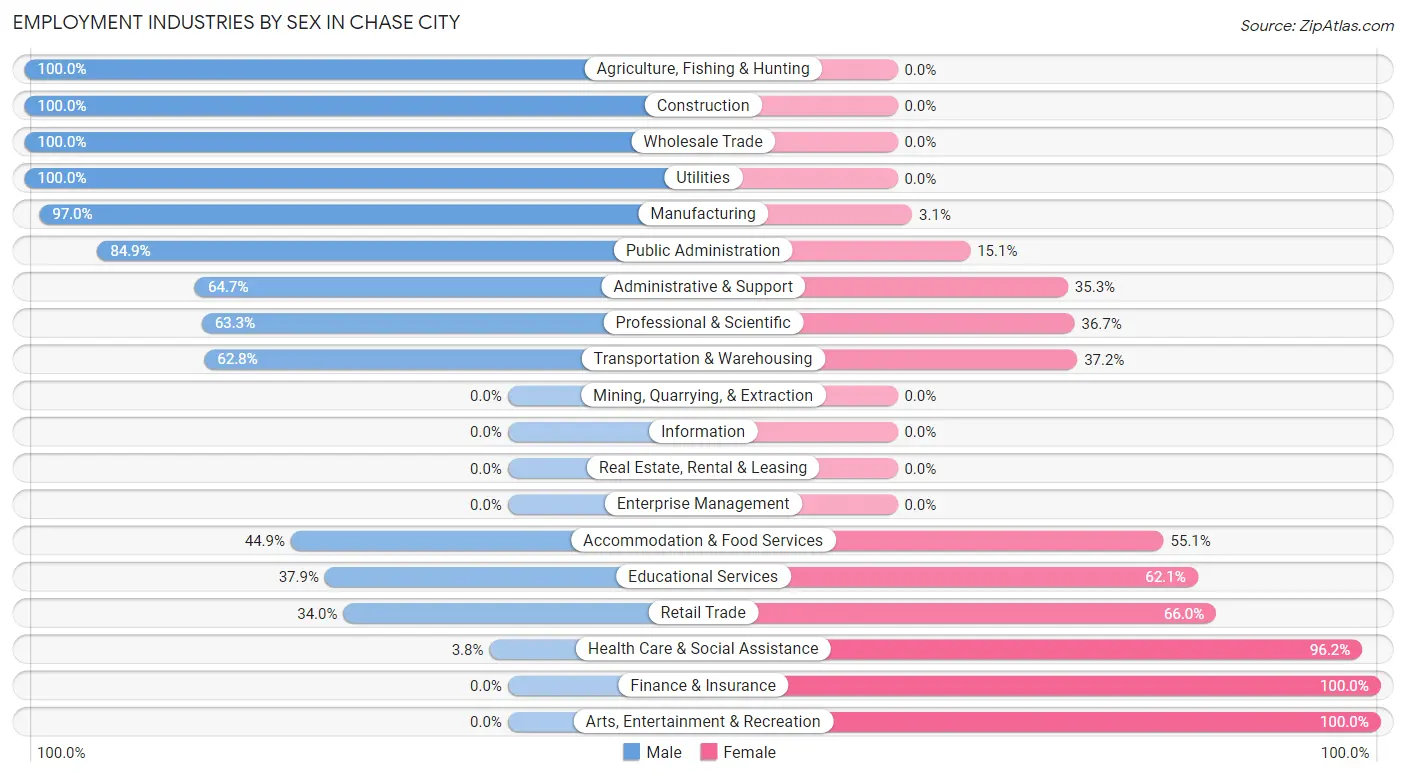
Employment Industries by Sex in Chase City
The Chase City industries that see more men than women are Agriculture, Fishing & Hunting (100.0%), Construction (100.0%), and Wholesale Trade (100.0%), whereas the industries that tend to have a higher number of women are Finance & Insurance (100.0%), Arts, Entertainment & Recreation (100.0%), and Health Care & Social Assistance (96.2%).
| Industry | Male | Female |
| Agriculture, Fishing & Hunting | 7 (100.0%) | 0 (0.0%) |
| Mining, Quarrying, & Extraction | 0 (0.0%) | 0 (0.0%) |
| Construction | 13 (100.0%) | 0 (0.0%) |
| Manufacturing | 127 (97.0%) | 4 (3.0%) |
| Wholesale Trade | 25 (100.0%) | 0 (0.0%) |
| Retail Trade | 32 (34.0%) | 62 (66.0%) |
| Transportation & Warehousing | 27 (62.8%) | 16 (37.2%) |
| Utilities | 5 (100.0%) | 0 (0.0%) |
| Information | 0 (0.0%) | 0 (0.0%) |
| Finance & Insurance | 0 (0.0%) | 18 (100.0%) |
| Real Estate, Rental & Leasing | 0 (0.0%) | 0 (0.0%) |
| Professional & Scientific | 19 (63.3%) | 11 (36.7%) |
| Enterprise Management | 0 (0.0%) | 0 (0.0%) |
| Administrative & Support | 11 (64.7%) | 6 (35.3%) |
| Educational Services | 50 (37.9%) | 82 (62.1%) |
| Health Care & Social Assistance | 6 (3.8%) | 151 (96.2%) |
| Arts, Entertainment & Recreation | 0 (0.0%) | 5 (100.0%) |
| Accommodation & Food Services | 22 (44.9%) | 27 (55.1%) |
| Public Administration | 124 (84.9%) | 22 (15.1%) |
| Total | 508 (54.1%) | 431 (45.9%) |
Education in Chase City
School Enrollment in Chase City
The most common levels of schooling among the 510 students in Chase City are high school (151 | 29.6%), elementary school (138 | 27.1%), and middle school (124 | 24.3%).
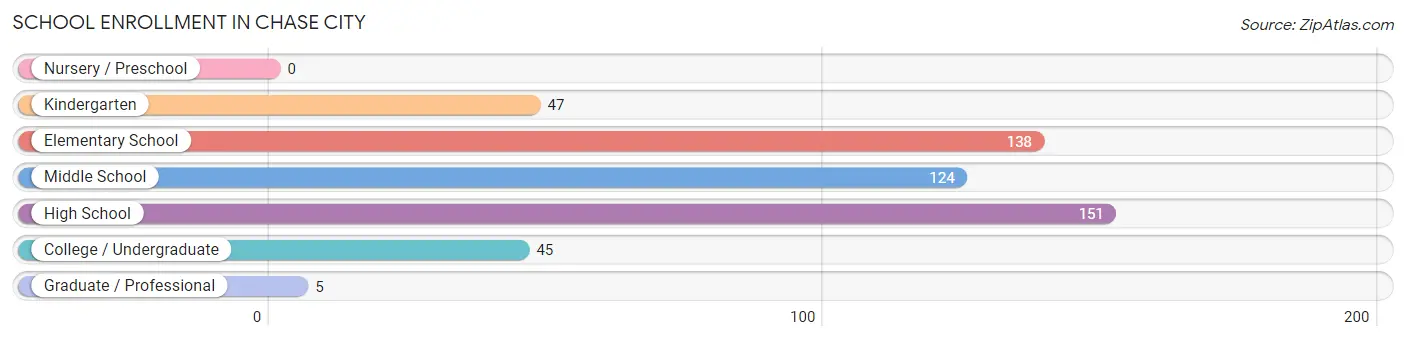
| School Level | # Students | % Students |
| Nursery / Preschool | 0 | 0.0% |
| Kindergarten | 47 | 9.2% |
| Elementary School | 138 | 27.1% |
| Middle School | 124 | 24.3% |
| High School | 151 | 29.6% |
| College / Undergraduate | 45 | 8.8% |
| Graduate / Professional | 5 | 1.0% |
| Total | 510 | 100.0% |
School Enrollment by Age by Funding Source in Chase City
Out of a total of 510 students who are enrolled in schools in Chase City, 10 (2.0%) attend a private institution, while the remaining 500 (98.0%) are enrolled in public schools. The age group of 25 to 34 year olds has the highest likelihood of being enrolled in private schools, with 6 (40.0% in the age bracket) enrolled. Conversely, the age group of 10 to 14 year olds has the lowest likelihood of being enrolled in a private school, with 159 (100.0% in the age bracket) attending a public institution.
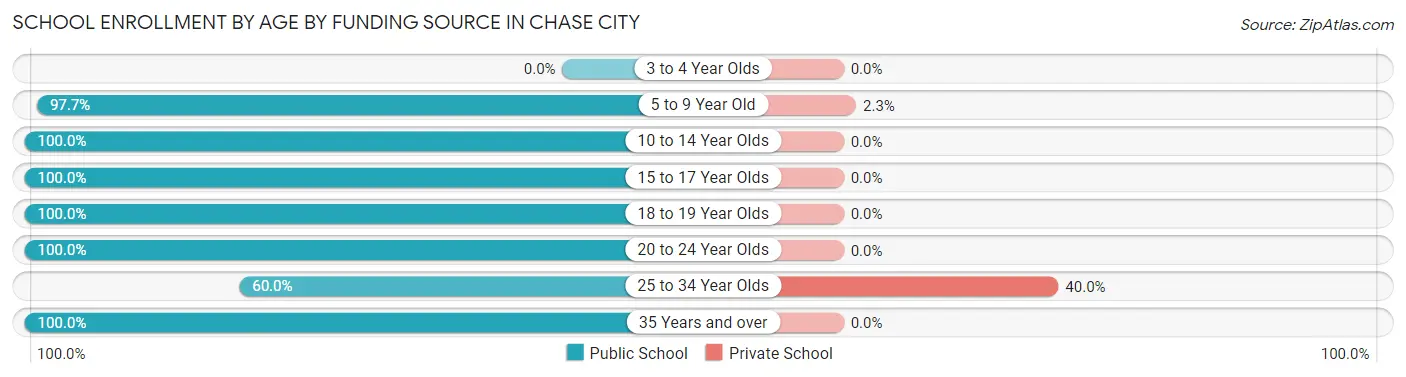
| Age Bracket | Public School | Private School |
| 3 to 4 Year Olds | 0 (0.0%) | 0 (0.0%) |
| 5 to 9 Year Old | 169 (97.7%) | 4 (2.3%) |
| 10 to 14 Year Olds | 159 (100.0%) | 0 (0.0%) |
| 15 to 17 Year Olds | 78 (100.0%) | 0 (0.0%) |
| 18 to 19 Year Olds | 54 (100.0%) | 0 (0.0%) |
| 20 to 24 Year Olds | 7 (100.0%) | 0 (0.0%) |
| 25 to 34 Year Olds | 9 (60.0%) | 6 (40.0%) |
| 35 Years and over | 24 (100.0%) | 0 (0.0%) |
| Total | 500 (98.0%) | 10 (2.0%) |
Educational Attainment by Field of Study in Chase City
Business (41 | 16.9%), bio, nature & agricultural (36 | 14.9%), liberal arts & history (33 | 13.6%), science & technology (29 | 12.0%), and education (23 | 9.5%) are the most common fields of study among 242 individuals in Chase City who have obtained a bachelor's degree or higher.
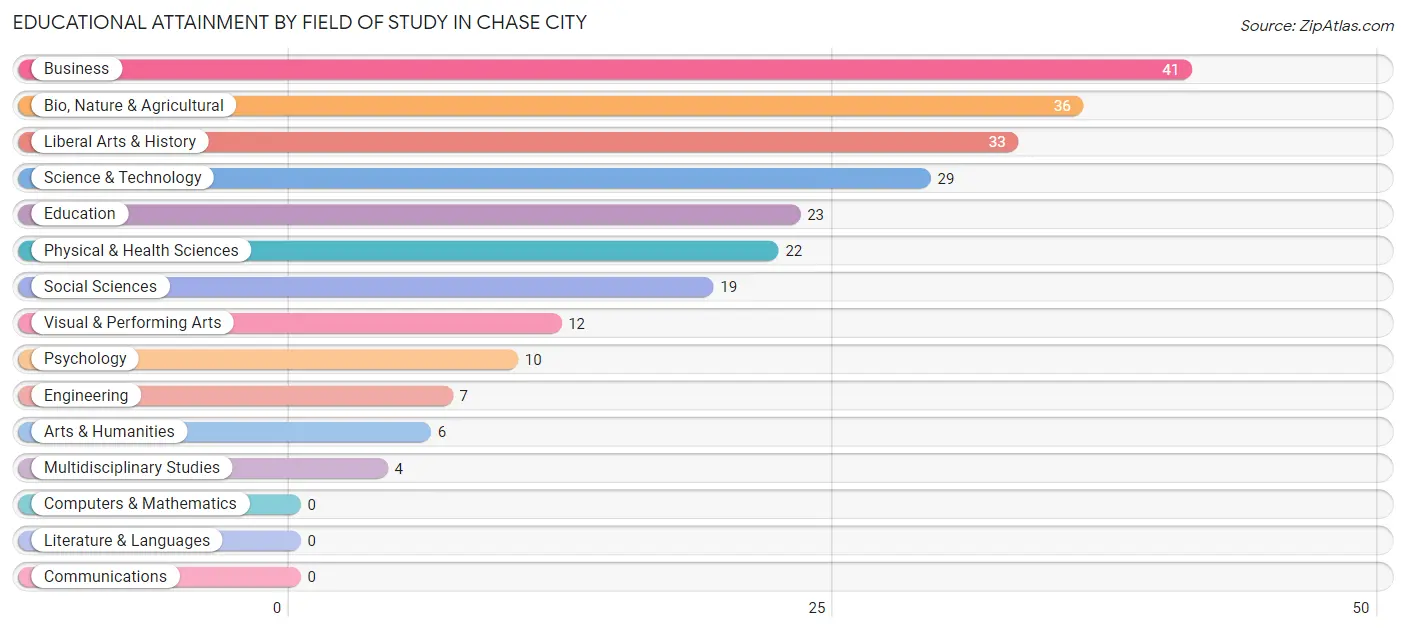
| Field of Study | # Graduates | % Graduates |
| Computers & Mathematics | 0 | 0.0% |
| Bio, Nature & Agricultural | 36 | 14.9% |
| Physical & Health Sciences | 22 | 9.1% |
| Psychology | 10 | 4.1% |
| Social Sciences | 19 | 7.9% |
| Engineering | 7 | 2.9% |
| Multidisciplinary Studies | 4 | 1.7% |
| Science & Technology | 29 | 12.0% |
| Business | 41 | 16.9% |
| Education | 23 | 9.5% |
| Literature & Languages | 0 | 0.0% |
| Liberal Arts & History | 33 | 13.6% |
| Visual & Performing Arts | 12 | 5.0% |
| Communications | 0 | 0.0% |
| Arts & Humanities | 6 | 2.5% |
| Total | 242 | 100.0% |
Transportation & Commute in Chase City
Vehicle Availability by Sex in Chase City
The most prevalent vehicle ownership categories in Chase City are males with 2 vehicles (179, accounting for 35.2%) and females with 2 vehicles (146, making up 41.5%).
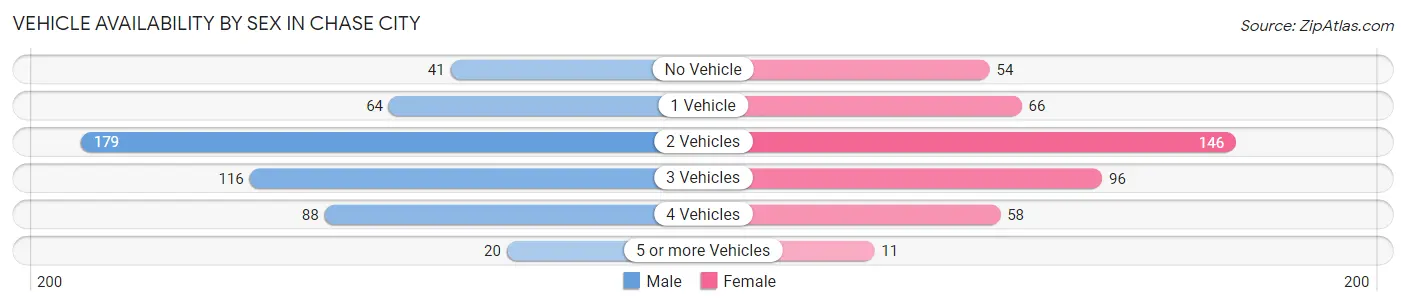
| Vehicles Available | Male | Female |
| No Vehicle | 41 (8.1%) | 54 (12.5%) |
| 1 Vehicle | 64 (12.6%) | 66 (15.3%) |
| 2 Vehicles | 179 (35.2%) | 146 (33.9%) |
| 3 Vehicles | 116 (22.8%) | 96 (22.3%) |
| 4 Vehicles | 88 (17.3%) | 58 (13.5%) |
| 5 or more Vehicles | 20 (3.9%) | 11 (2.5%) |
| Total | 508 (100.0%) | 431 (100.0%) |
Commute Time in Chase City
The most frequently occuring commute durations in Chase City are 30 to 34 minutes (182 commuters, 19.8%), 45 to 59 minutes (123 commuters, 13.4%), and 10 to 14 minutes (116 commuters, 12.6%).
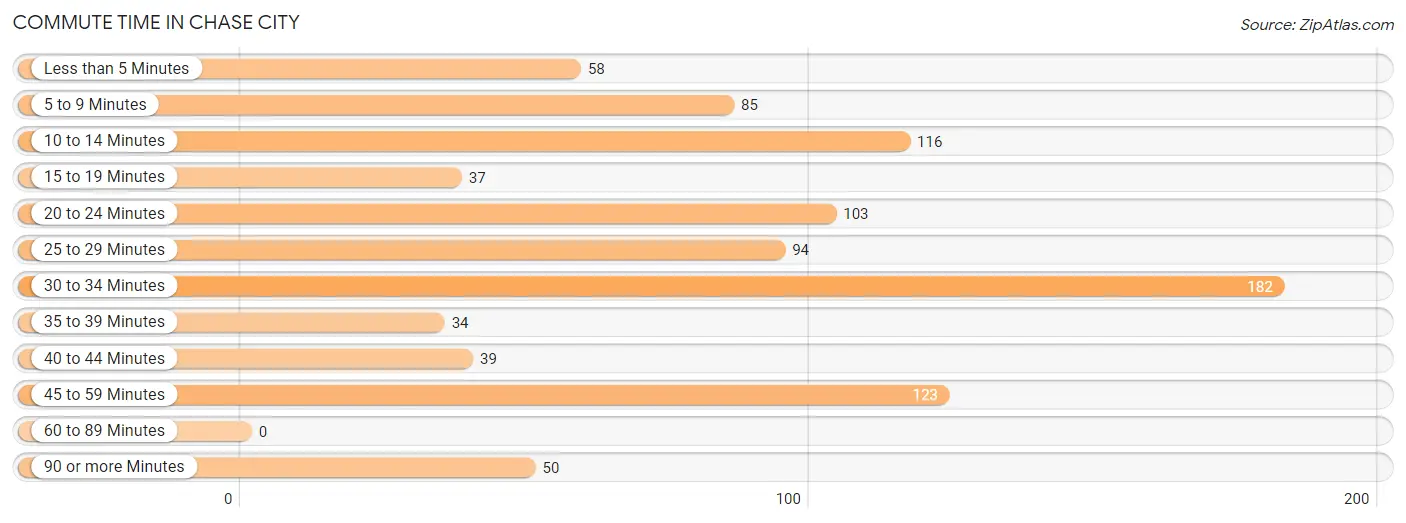
| Commute Time | # Commuters | % Commuters |
| Less than 5 Minutes | 58 | 6.3% |
| 5 to 9 Minutes | 85 | 9.2% |
| 10 to 14 Minutes | 116 | 12.6% |
| 15 to 19 Minutes | 37 | 4.0% |
| 20 to 24 Minutes | 103 | 11.2% |
| 25 to 29 Minutes | 94 | 10.2% |
| 30 to 34 Minutes | 182 | 19.8% |
| 35 to 39 Minutes | 34 | 3.7% |
| 40 to 44 Minutes | 39 | 4.2% |
| 45 to 59 Minutes | 123 | 13.4% |
| 60 to 89 Minutes | 0 | 0.0% |
| 90 or more Minutes | 50 | 5.4% |
Commute Time by Sex in Chase City
The most common commute times in Chase City are 30 to 34 minutes (113 commuters, 23.1%) for males and 30 to 34 minutes (69 commuters, 16.0%) for females.
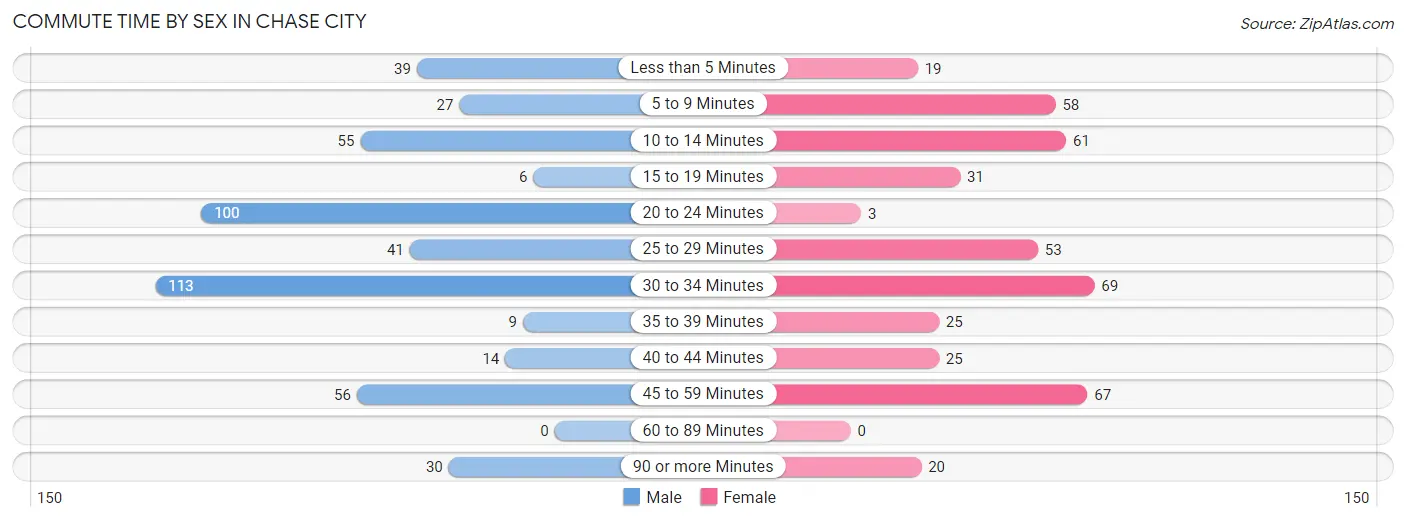
| Commute Time | Male | Female |
| Less than 5 Minutes | 39 (8.0%) | 19 (4.4%) |
| 5 to 9 Minutes | 27 (5.5%) | 58 (13.5%) |
| 10 to 14 Minutes | 55 (11.2%) | 61 (14.1%) |
| 15 to 19 Minutes | 6 (1.2%) | 31 (7.2%) |
| 20 to 24 Minutes | 100 (20.4%) | 3 (0.7%) |
| 25 to 29 Minutes | 41 (8.4%) | 53 (12.3%) |
| 30 to 34 Minutes | 113 (23.1%) | 69 (16.0%) |
| 35 to 39 Minutes | 9 (1.8%) | 25 (5.8%) |
| 40 to 44 Minutes | 14 (2.9%) | 25 (5.8%) |
| 45 to 59 Minutes | 56 (11.4%) | 67 (15.5%) |
| 60 to 89 Minutes | 0 (0.0%) | 0 (0.0%) |
| 90 or more Minutes | 30 (6.1%) | 20 (4.6%) |
Time of Departure to Work by Sex in Chase City
The most frequent times of departure to work in Chase City are 4:00 PM to 11:59 PM (113, 23.1%) for males and 7:30 AM to 7:59 AM (101, 23.4%) for females.
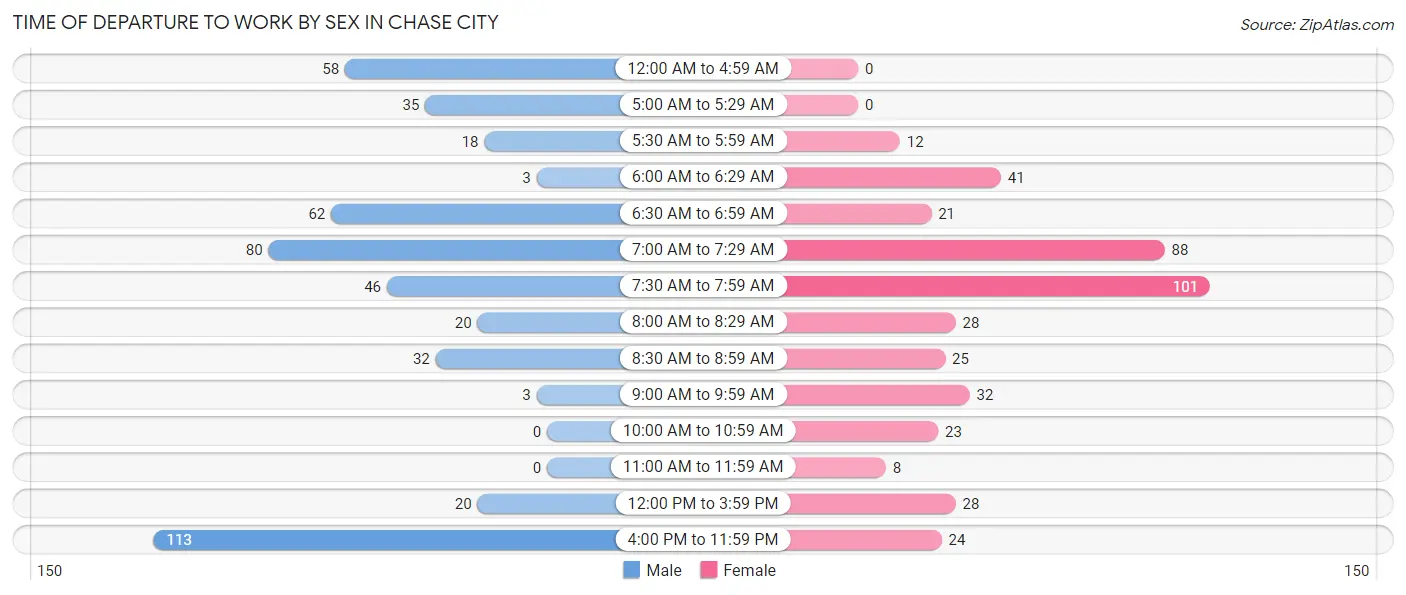
| Time of Departure | Male | Female |
| 12:00 AM to 4:59 AM | 58 (11.8%) | 0 (0.0%) |
| 5:00 AM to 5:29 AM | 35 (7.1%) | 0 (0.0%) |
| 5:30 AM to 5:59 AM | 18 (3.7%) | 12 (2.8%) |
| 6:00 AM to 6:29 AM | 3 (0.6%) | 41 (9.5%) |
| 6:30 AM to 6:59 AM | 62 (12.7%) | 21 (4.9%) |
| 7:00 AM to 7:29 AM | 80 (16.3%) | 88 (20.4%) |
| 7:30 AM to 7:59 AM | 46 (9.4%) | 101 (23.4%) |
| 8:00 AM to 8:29 AM | 20 (4.1%) | 28 (6.5%) |
| 8:30 AM to 8:59 AM | 32 (6.5%) | 25 (5.8%) |
| 9:00 AM to 9:59 AM | 3 (0.6%) | 32 (7.4%) |
| 10:00 AM to 10:59 AM | 0 (0.0%) | 23 (5.3%) |
| 11:00 AM to 11:59 AM | 0 (0.0%) | 8 (1.9%) |
| 12:00 PM to 3:59 PM | 20 (4.1%) | 28 (6.5%) |
| 4:00 PM to 11:59 PM | 113 (23.1%) | 24 (5.6%) |
| Total | 490 (100.0%) | 431 (100.0%) |
Housing Occupancy in Chase City
Occupancy by Ownership in Chase City
Of the total 1,036 dwellings in Chase City, owner-occupied units account for 757 (73.1%), while renter-occupied units make up 279 (26.9%).
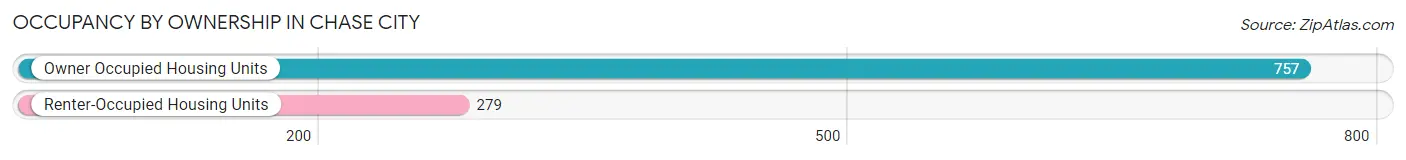
| Occupancy | # Housing Units | % Housing Units |
| Owner Occupied Housing Units | 757 | 73.1% |
| Renter-Occupied Housing Units | 279 | 26.9% |
| Total Occupied Housing Units | 1,036 | 100.0% |
Occupancy by Household Size in Chase City
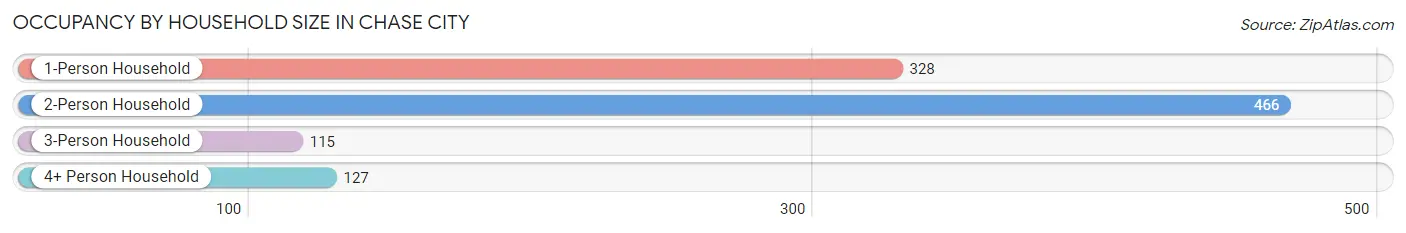
| Household Size | # Housing Units | % Housing Units |
| 1-Person Household | 328 | 31.7% |
| 2-Person Household | 466 | 45.0% |
| 3-Person Household | 115 | 11.1% |
| 4+ Person Household | 127 | 12.3% |
| Total Housing Units | 1,036 | 100.0% |
Occupancy by Ownership by Household Size in Chase City
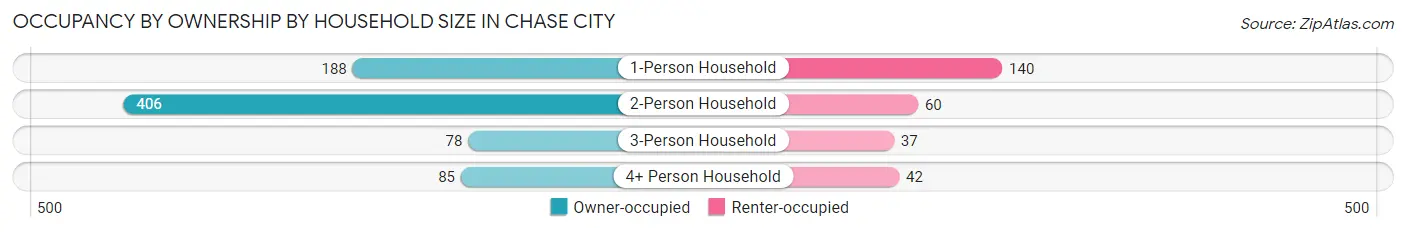
| Household Size | Owner-occupied | Renter-occupied |
| 1-Person Household | 188 (57.3%) | 140 (42.7%) |
| 2-Person Household | 406 (87.1%) | 60 (12.9%) |
| 3-Person Household | 78 (67.8%) | 37 (32.2%) |
| 4+ Person Household | 85 (66.9%) | 42 (33.1%) |
| Total Housing Units | 757 (73.1%) | 279 (26.9%) |
Occupancy by Educational Attainment in Chase City
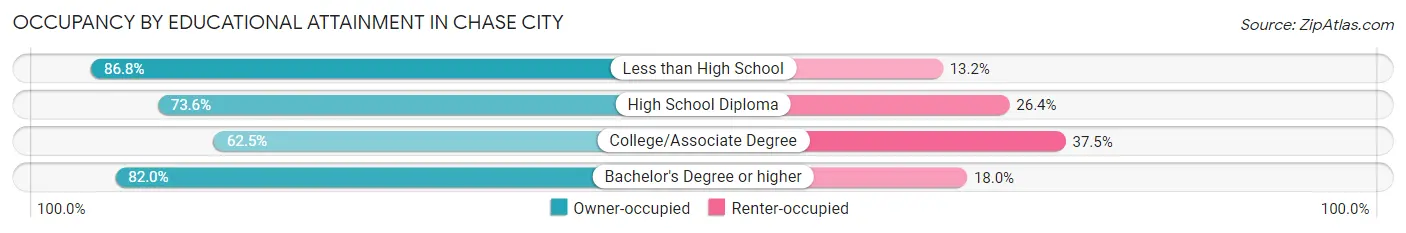
| Household Size | Owner-occupied | Renter-occupied |
| Less than High School | 125 (86.8%) | 19 (13.2%) |
| High School Diploma | 301 (73.6%) | 108 (26.4%) |
| College/Associate Degree | 208 (62.5%) | 125 (37.5%) |
| Bachelor's Degree or higher | 123 (82.0%) | 27 (18.0%) |
Occupancy by Age of Householder in Chase City
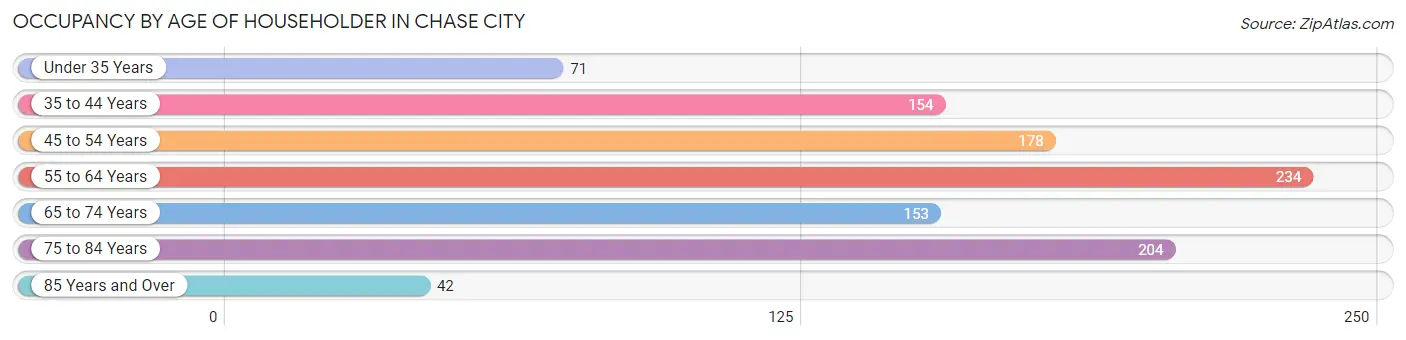
| Age Bracket | # Households | % Households |
| Under 35 Years | 71 | 6.9% |
| 35 to 44 Years | 154 | 14.9% |
| 45 to 54 Years | 178 | 17.2% |
| 55 to 64 Years | 234 | 22.6% |
| 65 to 74 Years | 153 | 14.8% |
| 75 to 84 Years | 204 | 19.7% |
| 85 Years and Over | 42 | 4.1% |
| Total | 1,036 | 100.0% |
Housing Finances in Chase City
Median Income by Occupancy in Chase City
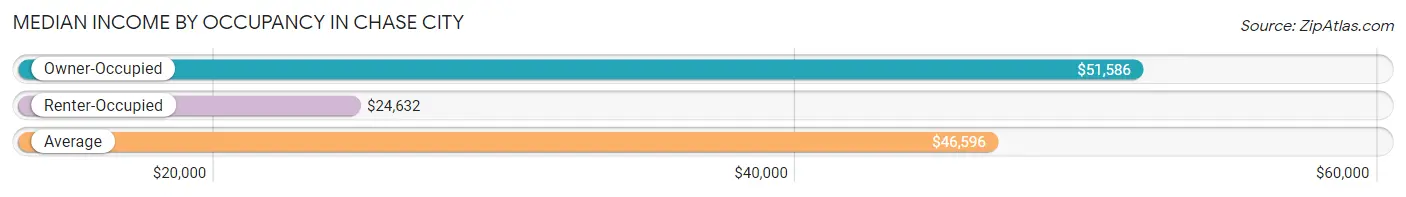
| Occupancy Type | # Households | Median Income |
| Owner-Occupied | 757 (73.1%) | $51,586 |
| Renter-Occupied | 279 (26.9%) | $24,632 |
| Average | 1,036 (100.0%) | $46,596 |
Occupancy by Householder Income Bracket in Chase City
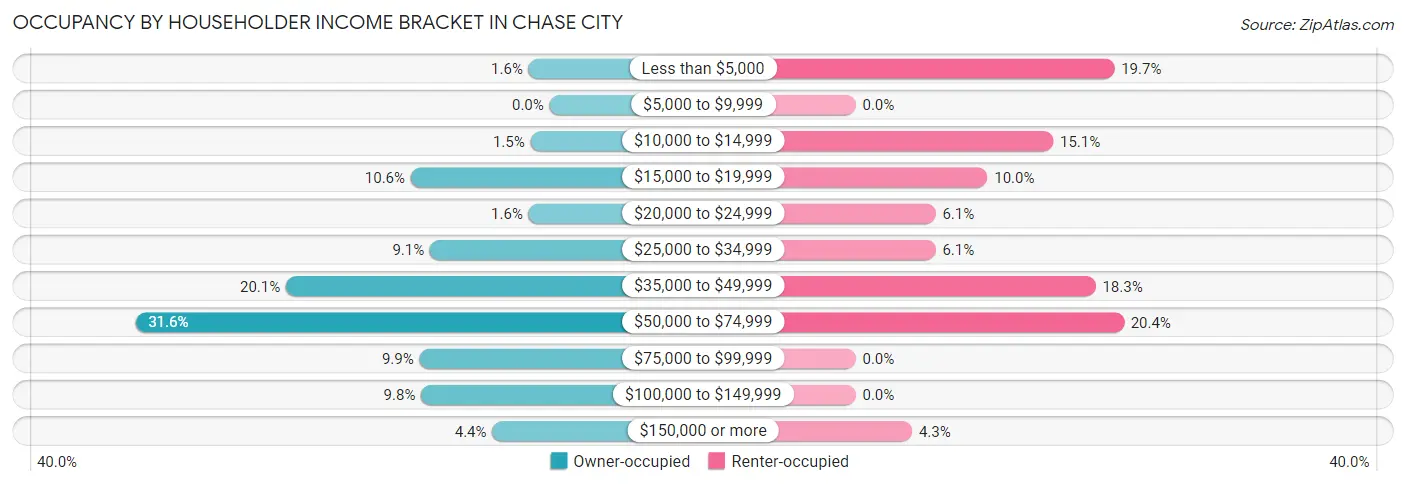
| Income Bracket | Owner-occupied | Renter-occupied |
| Less than $5,000 | 12 (1.6%) | 55 (19.7%) |
| $5,000 to $9,999 | 0 (0.0%) | 0 (0.0%) |
| $10,000 to $14,999 | 11 (1.5%) | 42 (15.0%) |
| $15,000 to $19,999 | 80 (10.6%) | 28 (10.0%) |
| $20,000 to $24,999 | 12 (1.6%) | 17 (6.1%) |
| $25,000 to $34,999 | 69 (9.1%) | 17 (6.1%) |
| $35,000 to $49,999 | 152 (20.1%) | 51 (18.3%) |
| $50,000 to $74,999 | 239 (31.6%) | 57 (20.4%) |
| $75,000 to $99,999 | 75 (9.9%) | 0 (0.0%) |
| $100,000 to $149,999 | 74 (9.8%) | 0 (0.0%) |
| $150,000 or more | 33 (4.4%) | 12 (4.3%) |
| Total | 757 (100.0%) | 279 (100.0%) |
Monthly Housing Cost Tiers in Chase City
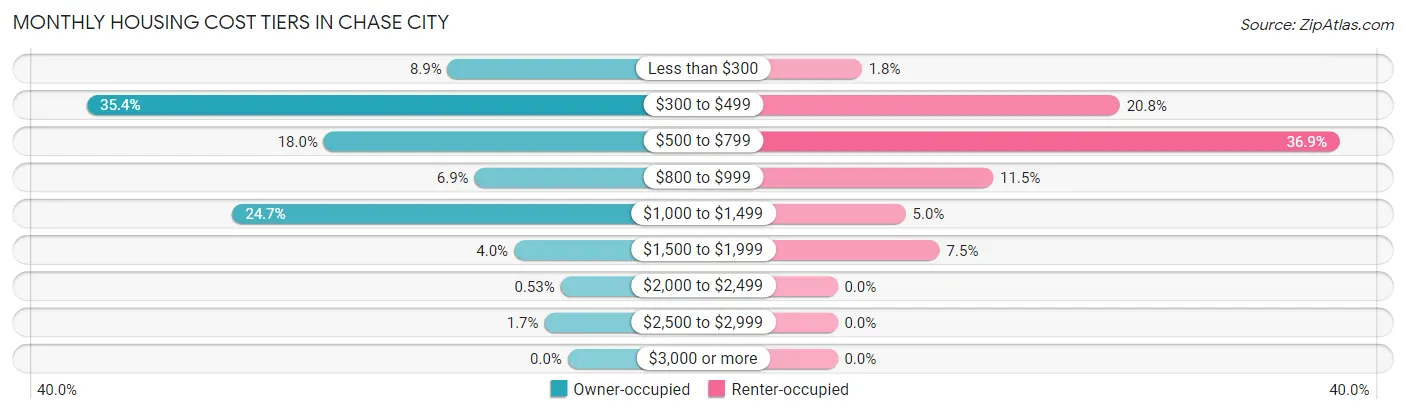
| Monthly Cost | Owner-occupied | Renter-occupied |
| Less than $300 | 67 (8.8%) | 5 (1.8%) |
| $300 to $499 | 268 (35.4%) | 58 (20.8%) |
| $500 to $799 | 136 (18.0%) | 103 (36.9%) |
| $800 to $999 | 52 (6.9%) | 32 (11.5%) |
| $1,000 to $1,499 | 187 (24.7%) | 14 (5.0%) |
| $1,500 to $1,999 | 30 (4.0%) | 21 (7.5%) |
| $2,000 to $2,499 | 4 (0.5%) | 0 (0.0%) |
| $2,500 to $2,999 | 13 (1.7%) | 0 (0.0%) |
| $3,000 or more | 0 (0.0%) | 0 (0.0%) |
| Total | 757 (100.0%) | 279 (100.0%) |
Physical Housing Characteristics in Chase City
Housing Structures in Chase City
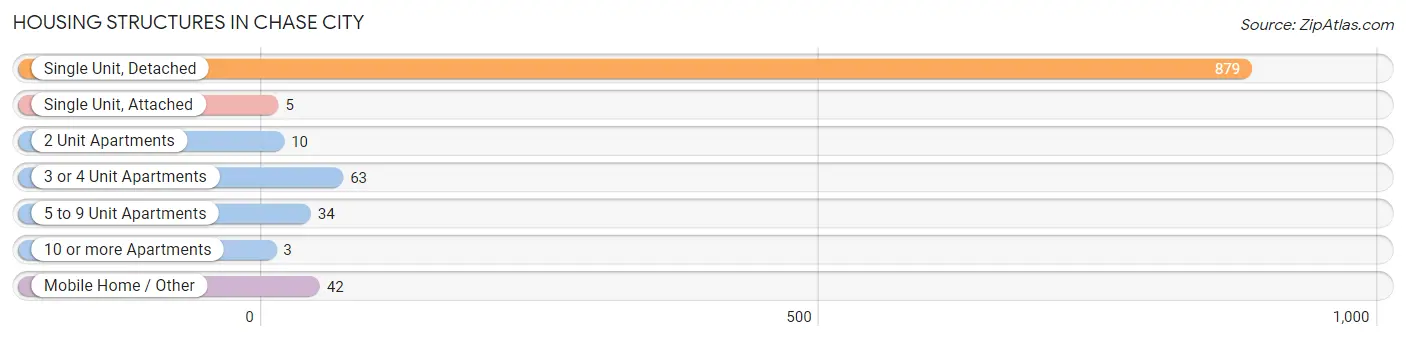
| Structure Type | # Housing Units | % Housing Units |
| Single Unit, Detached | 879 | 84.9% |
| Single Unit, Attached | 5 | 0.5% |
| 2 Unit Apartments | 10 | 1.0% |
| 3 or 4 Unit Apartments | 63 | 6.1% |
| 5 to 9 Unit Apartments | 34 | 3.3% |
| 10 or more Apartments | 3 | 0.3% |
| Mobile Home / Other | 42 | 4.1% |
| Total | 1,036 | 100.0% |
Housing Structures by Occupancy in Chase City
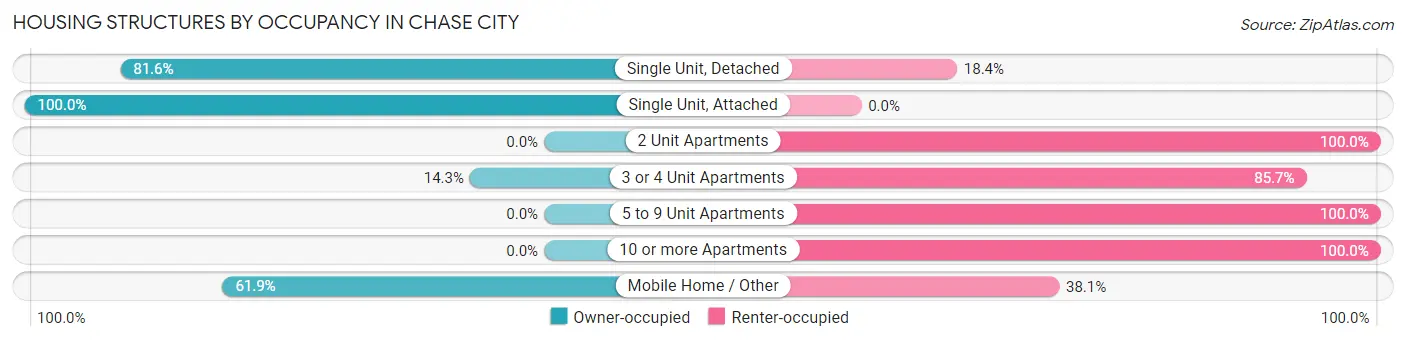
| Structure Type | Owner-occupied | Renter-occupied |
| Single Unit, Detached | 717 (81.6%) | 162 (18.4%) |
| Single Unit, Attached | 5 (100.0%) | 0 (0.0%) |
| 2 Unit Apartments | 0 (0.0%) | 10 (100.0%) |
| 3 or 4 Unit Apartments | 9 (14.3%) | 54 (85.7%) |
| 5 to 9 Unit Apartments | 0 (0.0%) | 34 (100.0%) |
| 10 or more Apartments | 0 (0.0%) | 3 (100.0%) |
| Mobile Home / Other | 26 (61.9%) | 16 (38.1%) |
| Total | 757 (73.1%) | 279 (26.9%) |
Housing Structures by Number of Rooms in Chase City
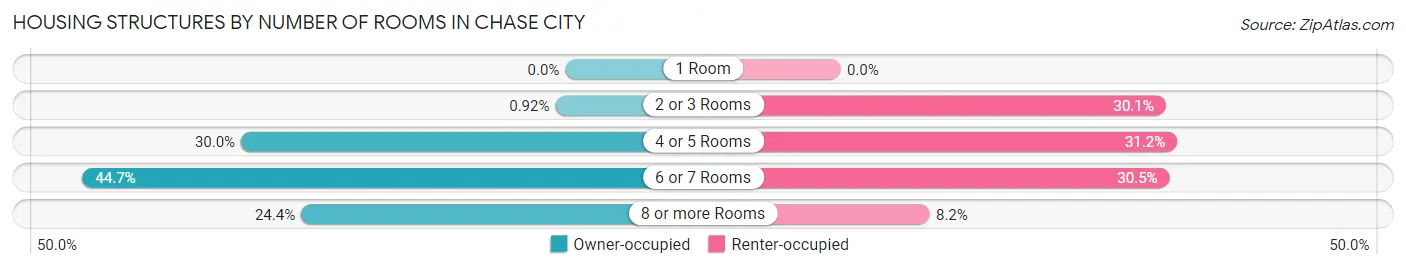
| Number of Rooms | Owner-occupied | Renter-occupied |
| 1 Room | 0 (0.0%) | 0 (0.0%) |
| 2 or 3 Rooms | 7 (0.9%) | 84 (30.1%) |
| 4 or 5 Rooms | 227 (30.0%) | 87 (31.2%) |
| 6 or 7 Rooms | 338 (44.7%) | 85 (30.5%) |
| 8 or more Rooms | 185 (24.4%) | 23 (8.2%) |
| Total | 757 (100.0%) | 279 (100.0%) |
Housing Structure by Heating Type in Chase City
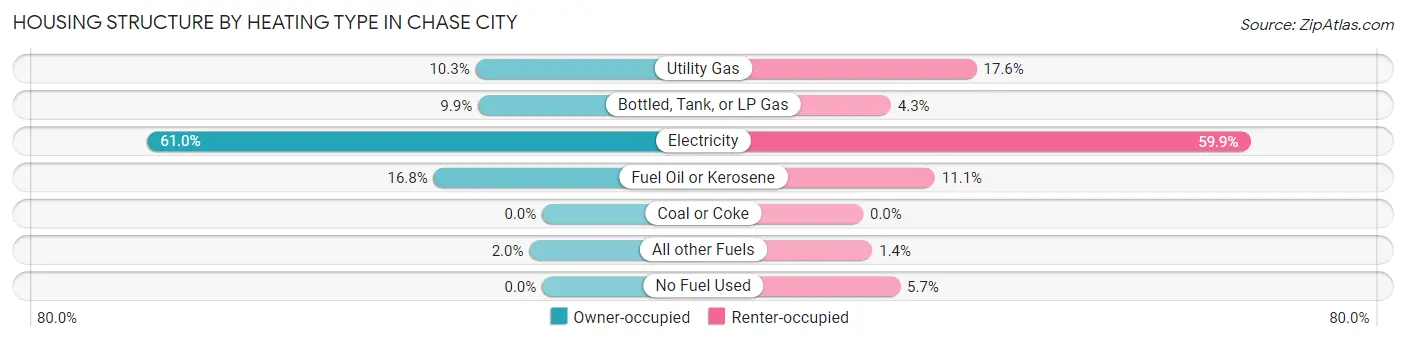
| Heating Type | Owner-occupied | Renter-occupied |
| Utility Gas | 78 (10.3%) | 49 (17.6%) |
| Bottled, Tank, or LP Gas | 75 (9.9%) | 12 (4.3%) |
| Electricity | 462 (61.0%) | 167 (59.9%) |
| Fuel Oil or Kerosene | 127 (16.8%) | 31 (11.1%) |
| Coal or Coke | 0 (0.0%) | 0 (0.0%) |
| All other Fuels | 15 (2.0%) | 4 (1.4%) |
| No Fuel Used | 0 (0.0%) | 16 (5.7%) |
| Total | 757 (100.0%) | 279 (100.0%) |
Household Vehicle Usage in Chase City
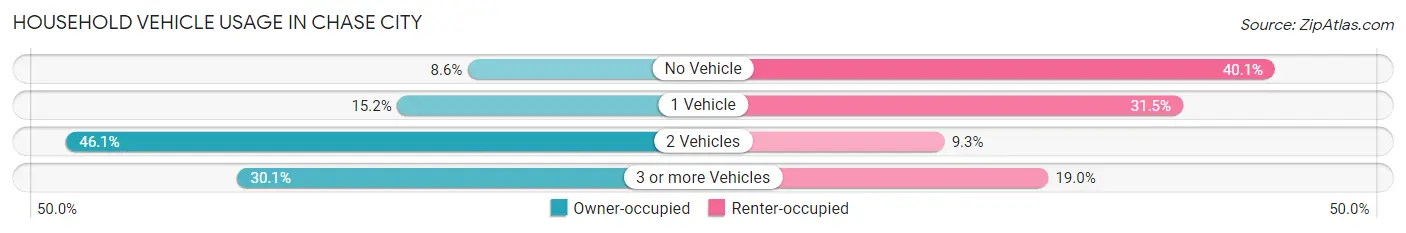
| Vehicles per Household | Owner-occupied | Renter-occupied |
| No Vehicle | 65 (8.6%) | 112 (40.1%) |
| 1 Vehicle | 115 (15.2%) | 88 (31.5%) |
| 2 Vehicles | 349 (46.1%) | 26 (9.3%) |
| 3 or more Vehicles | 228 (30.1%) | 53 (19.0%) |
| Total | 757 (100.0%) | 279 (100.0%) |
Real Estate & Mortgages in Chase City
Real Estate and Mortgage Overview in Chase City
| Characteristic | Without Mortgage | With Mortgage |
| Housing Units | 382 | 375 |
| Median Property Value | $91,000 | $137,100 |
| Median Household Income | $44,464 | $21 |
| Monthly Housing Costs | $408 | $0 |
| Real Estate Taxes | $615 | $0 |
Property Value by Mortgage Status in Chase City
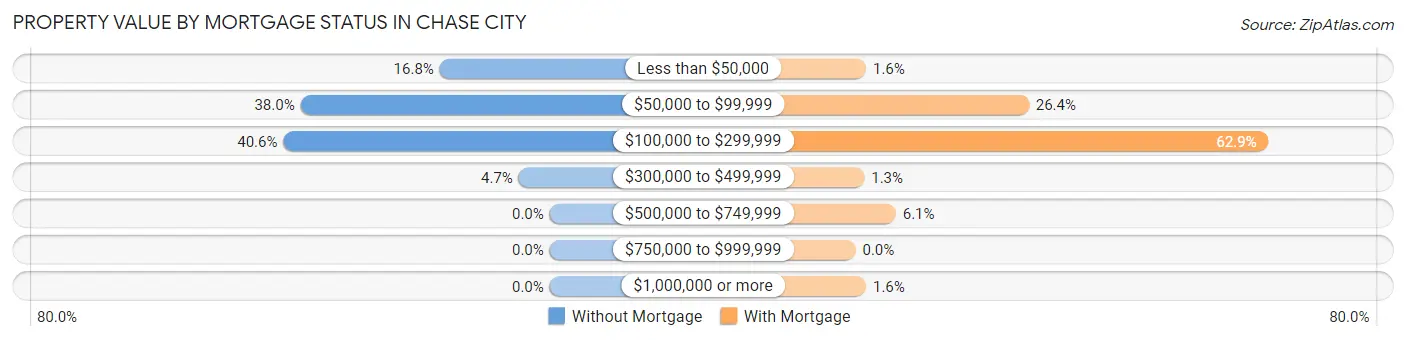
| Property Value | Without Mortgage | With Mortgage |
| Less than $50,000 | 64 (16.8%) | 6 (1.6%) |
| $50,000 to $99,999 | 145 (38.0%) | 99 (26.4%) |
| $100,000 to $299,999 | 155 (40.6%) | 236 (62.9%) |
| $300,000 to $499,999 | 18 (4.7%) | 5 (1.3%) |
| $500,000 to $749,999 | 0 (0.0%) | 23 (6.1%) |
| $750,000 to $999,999 | 0 (0.0%) | 0 (0.0%) |
| $1,000,000 or more | 0 (0.0%) | 6 (1.6%) |
| Total | 382 (100.0%) | 375 (100.0%) |
Household Income by Mortgage Status in Chase City
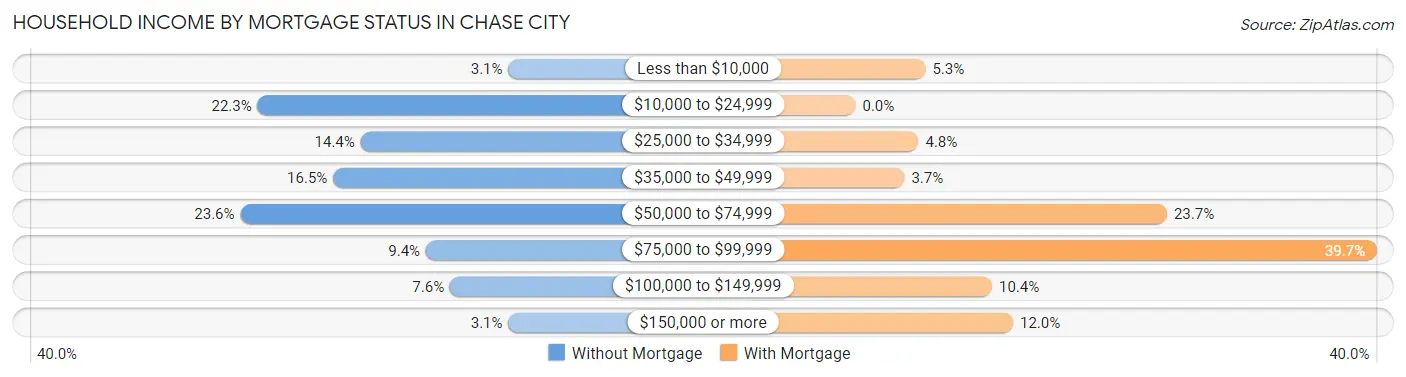
| Household Income | Without Mortgage | With Mortgage |
| Less than $10,000 | 12 (3.1%) | 20 (5.3%) |
| $10,000 to $24,999 | 85 (22.3%) | 0 (0.0%) |
| $25,000 to $34,999 | 55 (14.4%) | 18 (4.8%) |
| $35,000 to $49,999 | 63 (16.5%) | 14 (3.7%) |
| $50,000 to $74,999 | 90 (23.6%) | 89 (23.7%) |
| $75,000 to $99,999 | 36 (9.4%) | 149 (39.7%) |
| $100,000 to $149,999 | 29 (7.6%) | 39 (10.4%) |
| $150,000 or more | 12 (3.1%) | 45 (12.0%) |
| Total | 382 (100.0%) | 375 (100.0%) |
Property Value to Household Income Ratio in Chase City
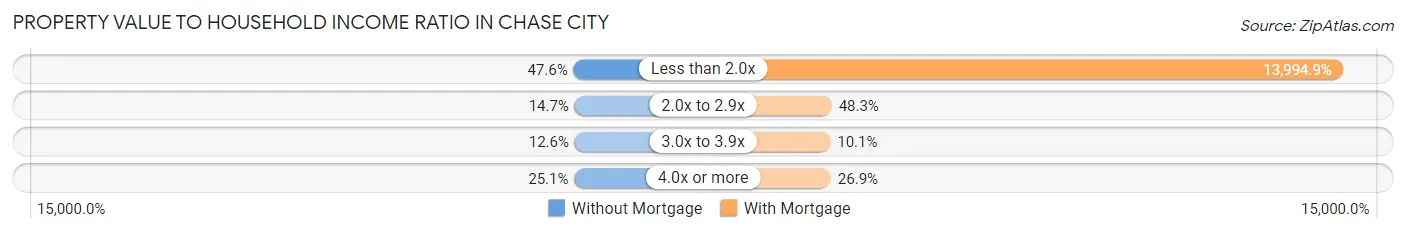
| Value-to-Income Ratio | Without Mortgage | With Mortgage |
| Less than 2.0x | 182 (47.6%) | 52,481 (13,994.9%) |
| 2.0x to 2.9x | 56 (14.7%) | 181 (48.3%) |
| 3.0x to 3.9x | 48 (12.6%) | 38 (10.1%) |
| 4.0x or more | 96 (25.1%) | 101 (26.9%) |
| Total | 382 (100.0%) | 375 (100.0%) |
Real Estate Taxes by Mortgage Status in Chase City
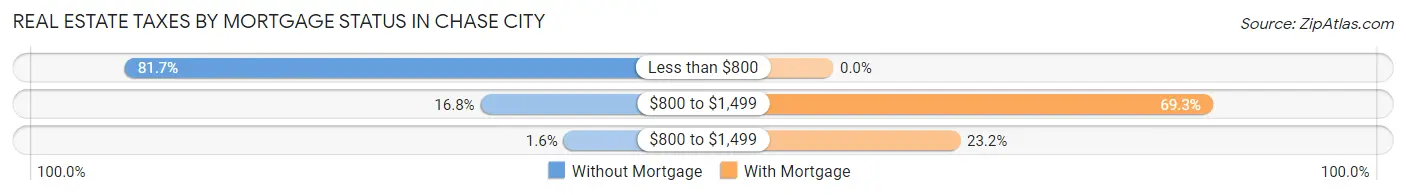
| Property Taxes | Without Mortgage | With Mortgage |
| Less than $800 | 312 (81.7%) | 0 (0.0%) |
| $800 to $1,499 | 64 (16.8%) | 260 (69.3%) |
| $800 to $1,499 | 6 (1.6%) | 87 (23.2%) |
| Total | 382 (100.0%) | 375 (100.0%) |
Health & Disability in Chase City
Health Insurance Coverage by Age in Chase City
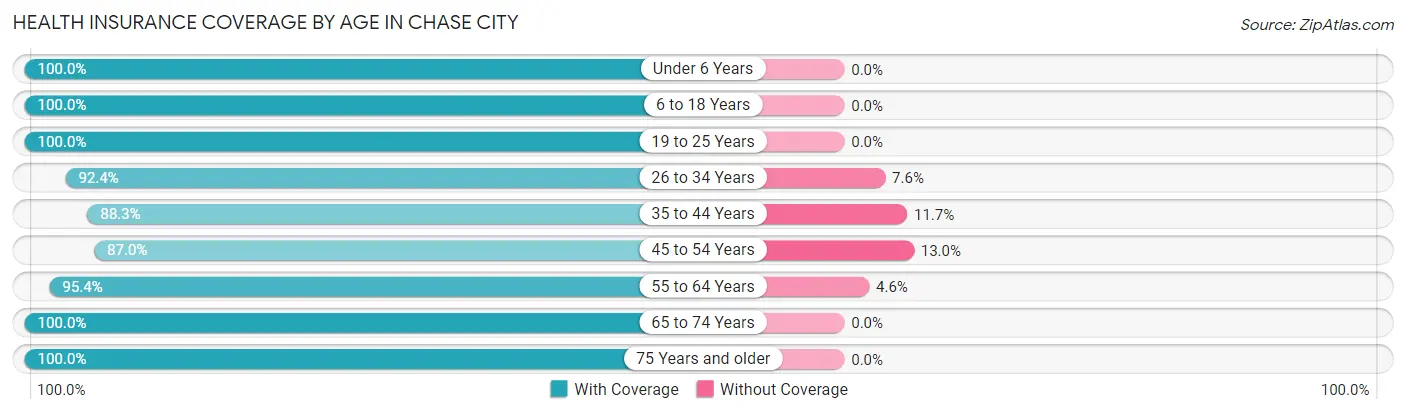
| Age Bracket | With Coverage | Without Coverage |
| Under 6 Years | 168 (100.0%) | 0 (0.0%) |
| 6 to 18 Years | 425 (100.0%) | 0 (0.0%) |
| 19 to 25 Years | 97 (100.0%) | 0 (0.0%) |
| 26 to 34 Years | 206 (92.4%) | 17 (7.6%) |
| 35 to 44 Years | 234 (88.3%) | 31 (11.7%) |
| 45 to 54 Years | 215 (87.0%) | 32 (13.0%) |
| 55 to 64 Years | 350 (95.4%) | 17 (4.6%) |
| 65 to 74 Years | 234 (100.0%) | 0 (0.0%) |
| 75 Years and older | 313 (100.0%) | 0 (0.0%) |
| Total | 2,242 (95.9%) | 97 (4.2%) |
Health Insurance Coverage by Citizenship Status in Chase City
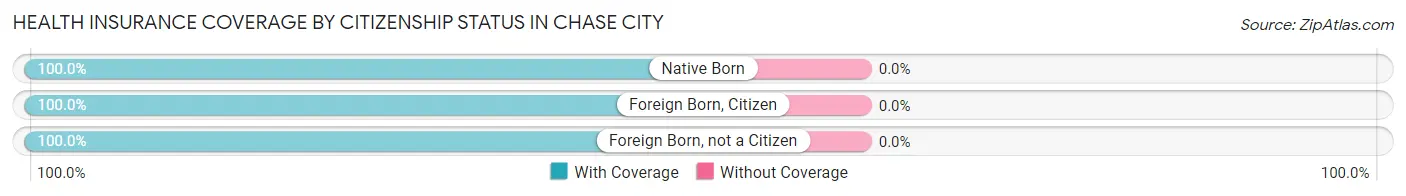
| Citizenship Status | With Coverage | Without Coverage |
| Native Born | 168 (100.0%) | 0 (0.0%) |
| Foreign Born, Citizen | 425 (100.0%) | 0 (0.0%) |
| Foreign Born, not a Citizen | 97 (100.0%) | 0 (0.0%) |
Health Insurance Coverage by Household Income in Chase City
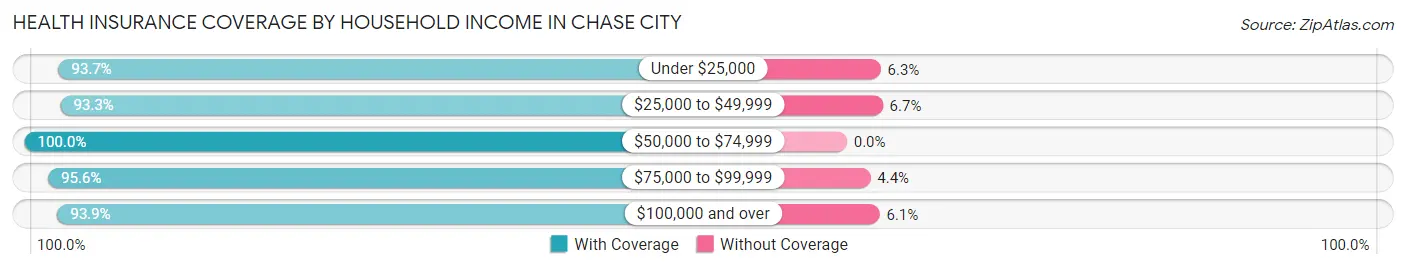
| Household Income | With Coverage | Without Coverage |
| Under $25,000 | 325 (93.7%) | 22 (6.3%) |
| $25,000 to $49,999 | 541 (93.3%) | 39 (6.7%) |
| $50,000 to $74,999 | 768 (100.0%) | 0 (0.0%) |
| $75,000 to $99,999 | 195 (95.6%) | 9 (4.4%) |
| $100,000 and over | 413 (93.9%) | 27 (6.1%) |
Public vs Private Health Insurance Coverage by Age in Chase City
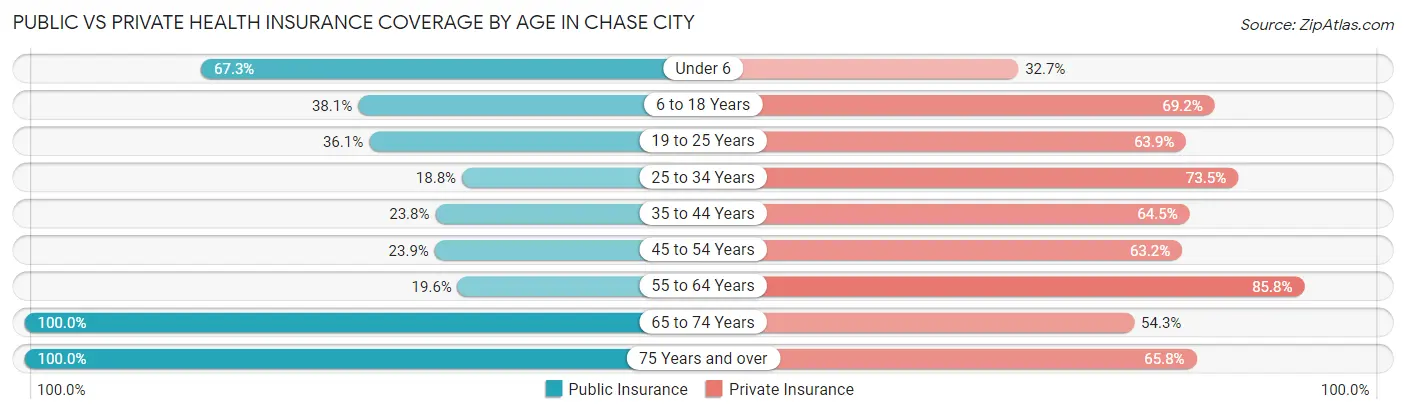
| Age Bracket | Public Insurance | Private Insurance |
| Under 6 | 113 (67.3%) | 55 (32.7%) |
| 6 to 18 Years | 162 (38.1%) | 294 (69.2%) |
| 19 to 25 Years | 35 (36.1%) | 62 (63.9%) |
| 25 to 34 Years | 42 (18.8%) | 164 (73.5%) |
| 35 to 44 Years | 63 (23.8%) | 171 (64.5%) |
| 45 to 54 Years | 59 (23.9%) | 156 (63.2%) |
| 55 to 64 Years | 72 (19.6%) | 315 (85.8%) |
| 65 to 74 Years | 234 (100.0%) | 127 (54.3%) |
| 75 Years and over | 313 (100.0%) | 206 (65.8%) |
| Total | 1,093 (46.7%) | 1,550 (66.3%) |
Disability Status by Sex by Age in Chase City
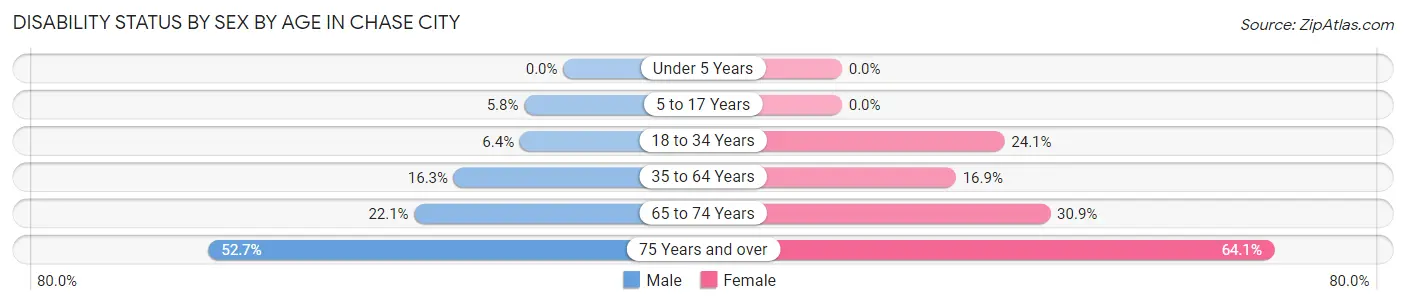
| Age Bracket | Male | Female |
| Under 5 Years | 0 (0.0%) | 0 (0.0%) |
| 5 to 17 Years | 13 (5.8%) | 0 (0.0%) |
| 18 to 34 Years | 13 (6.4%) | 35 (24.1%) |
| 35 to 64 Years | 67 (16.3%) | 79 (16.9%) |
| 65 to 74 Years | 21 (22.1%) | 43 (30.9%) |
| 75 Years and over | 68 (52.7%) | 118 (64.1%) |
Disability Class by Sex by Age in Chase City
Disability Class: Hearing Difficulty
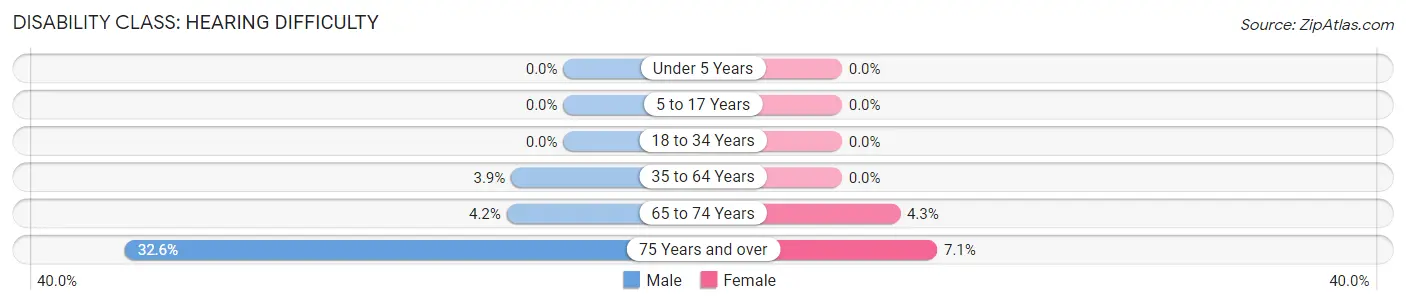
| Age Bracket | Male | Female |
| Under 5 Years | 0 (0.0%) | 0 (0.0%) |
| 5 to 17 Years | 0 (0.0%) | 0 (0.0%) |
| 18 to 34 Years | 0 (0.0%) | 0 (0.0%) |
| 35 to 64 Years | 16 (3.9%) | 0 (0.0%) |
| 65 to 74 Years | 4 (4.2%) | 6 (4.3%) |
| 75 Years and over | 42 (32.6%) | 13 (7.1%) |
Disability Class: Vision Difficulty
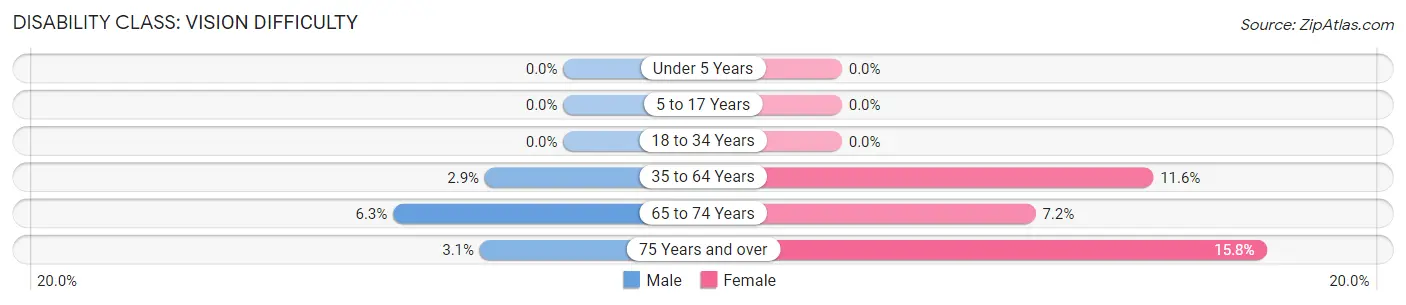
| Age Bracket | Male | Female |
| Under 5 Years | 0 (0.0%) | 0 (0.0%) |
| 5 to 17 Years | 0 (0.0%) | 0 (0.0%) |
| 18 to 34 Years | 0 (0.0%) | 0 (0.0%) |
| 35 to 64 Years | 12 (2.9%) | 54 (11.6%) |
| 65 to 74 Years | 6 (6.3%) | 10 (7.2%) |
| 75 Years and over | 4 (3.1%) | 29 (15.8%) |
Disability Class: Cognitive Difficulty
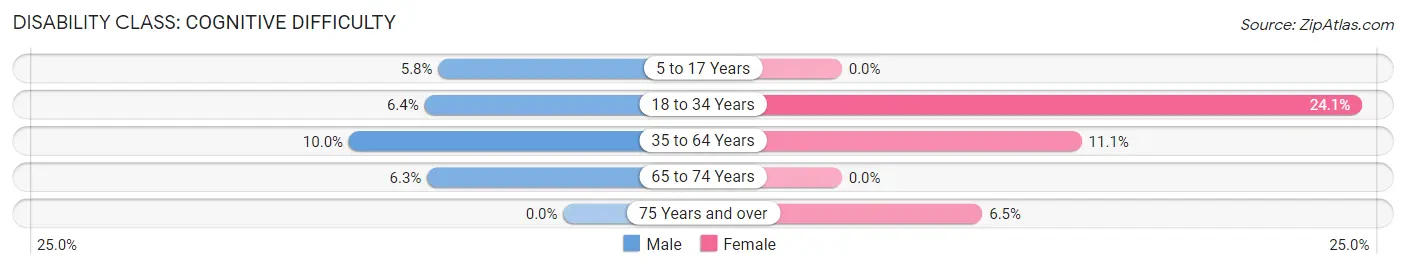
| Age Bracket | Male | Female |
| 5 to 17 Years | 13 (5.8%) | 0 (0.0%) |
| 18 to 34 Years | 13 (6.4%) | 35 (24.1%) |
| 35 to 64 Years | 41 (10.0%) | 52 (11.1%) |
| 65 to 74 Years | 6 (6.3%) | 0 (0.0%) |
| 75 Years and over | 0 (0.0%) | 12 (6.5%) |
Disability Class: Ambulatory Difficulty
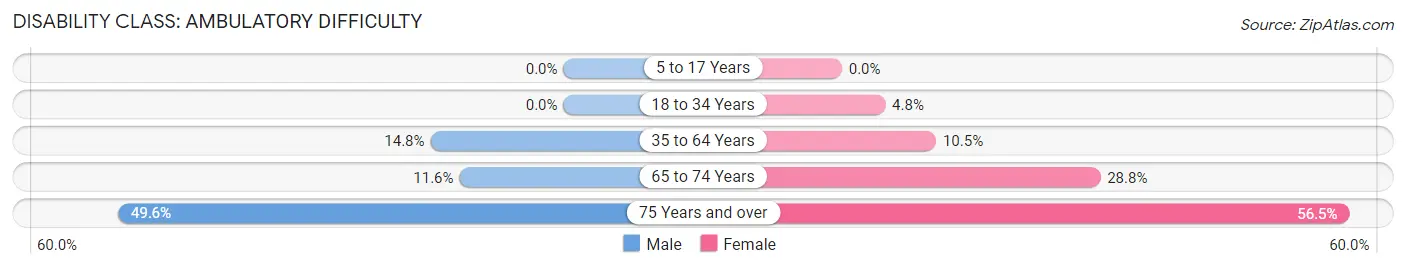
| Age Bracket | Male | Female |
| 5 to 17 Years | 0 (0.0%) | 0 (0.0%) |
| 18 to 34 Years | 0 (0.0%) | 7 (4.8%) |
| 35 to 64 Years | 61 (14.8%) | 49 (10.5%) |
| 65 to 74 Years | 11 (11.6%) | 40 (28.8%) |
| 75 Years and over | 64 (49.6%) | 104 (56.5%) |
Disability Class: Self-Care Difficulty
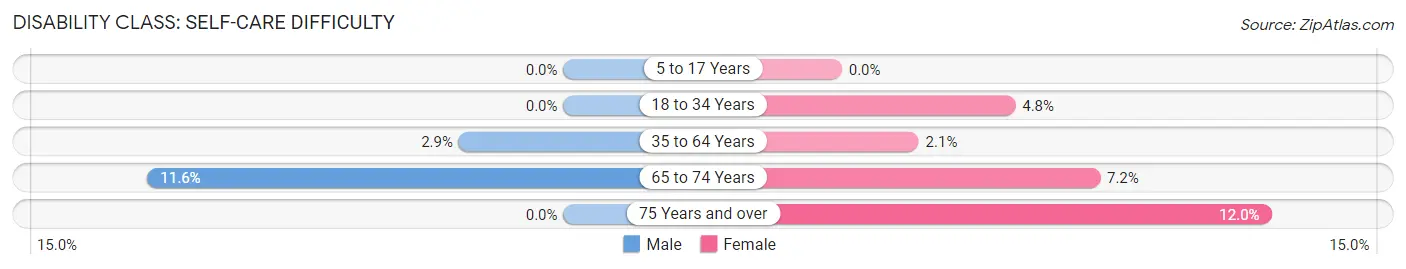
| Age Bracket | Male | Female |
| 5 to 17 Years | 0 (0.0%) | 0 (0.0%) |
| 18 to 34 Years | 0 (0.0%) | 7 (4.8%) |
| 35 to 64 Years | 12 (2.9%) | 10 (2.1%) |
| 65 to 74 Years | 11 (11.6%) | 10 (7.2%) |
| 75 Years and over | 0 (0.0%) | 22 (12.0%) |
Technology Access in Chase City
Computing Device Access in Chase City
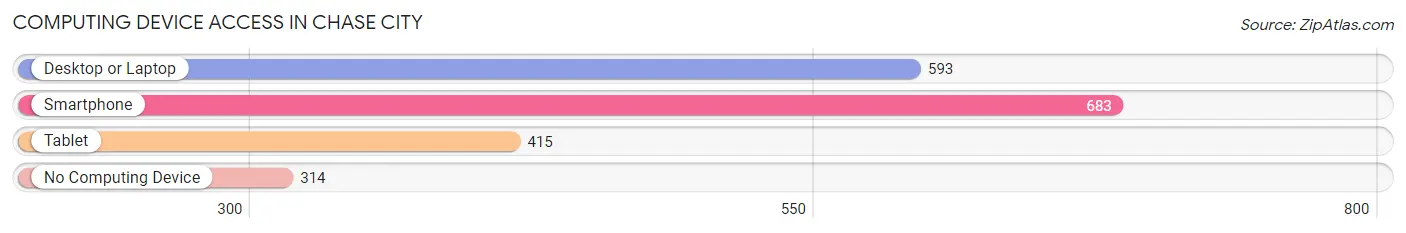
| Device Type | # Households | % Households |
| Desktop or Laptop | 593 | 57.2% |
| Smartphone | 683 | 65.9% |
| Tablet | 415 | 40.1% |
| No Computing Device | 314 | 30.3% |
| Total | 1,036 | 100.0% |
Internet Access in Chase City
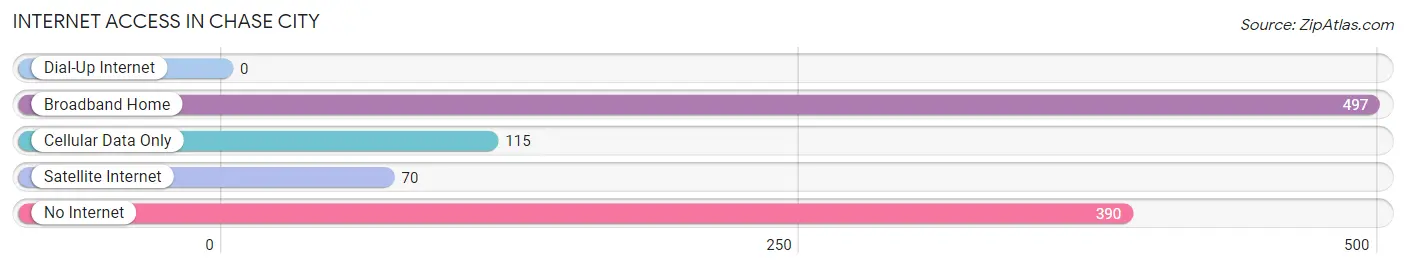
| Internet Type | # Households | % Households |
| Dial-Up Internet | 0 | 0.0% |
| Broadband Home | 497 | 48.0% |
| Cellular Data Only | 115 | 11.1% |
| Satellite Internet | 70 | 6.8% |
| No Internet | 390 | 37.6% |
| Total | 1,036 | 100.0% |
Chase City Summary
Chase City, Virginia is a small town located in Mecklenburg County, Virginia. It is situated on the banks of the Roanoke River and is part of the Southside Virginia region. The town was founded in 1873 and is named after Salmon P. Chase, the former Secretary of the Treasury and Chief Justice of the United States Supreme Court.
Geography
Chase City is located in the Southside Virginia region of the state, which is characterized by rolling hills and flatlands. The town is situated on the banks of the Roanoke River, which is a major tributary of the Chesapeake Bay. The town is located approximately 50 miles south of Richmond and is part of the Richmond-Petersburg metropolitan area. The town has a total area of 2.2 square miles, all of which is land.
Climate
Chase City has a humid subtropical climate, with hot, humid summers and mild winters. The average annual temperature is around 60 degrees Fahrenheit, with an average high of around 80 degrees in the summer and an average low of around 40 degrees in the winter. The town receives an average of 45 inches of precipitation per year, with most of it falling in the summer months.
Demographics
As of the 2010 census, the population of Chase City was 2,252. The racial makeup of the town was 79.3% White, 17.3% African American, 0.3% Native American, 0.4% Asian, 0.1% Pacific Islander, 1.2% from other races, and 1.4% from two or more races. Hispanic or Latino of any race were 2.7% of the population.
Economy
Chase City is a small, rural town with a largely agricultural economy. The town is home to several farms, as well as a few small businesses. The town is also home to a number of manufacturing companies, including a furniture factory and a paper mill. The town is also home to a number of retail stores, restaurants, and other services.
History
Chase City was founded in 1873 and was named after Salmon P. Chase, the former Secretary of the Treasury and Chief Justice of the United States Supreme Court. The town was originally a small farming community, but it grew rapidly in the late 19th and early 20th centuries. The town was home to a number of manufacturing companies, including a furniture factory and a paper mill. The town was also home to a number of retail stores, restaurants, and other services.
In the late 20th century, the town began to decline as many of the manufacturing companies moved away. The town has since become a small, rural community with a largely agricultural economy. The town is home to several farms, as well as a few small businesses. The town is also home to a number of retail stores, restaurants, and other services.
Common Questions
What is Per Capita Income in Chase City?
Per Capita income in Chase City is $26,837.
What is the Median Family Income in Chase City?
Median Family Income in Chase City is $58,661.
What is the Median Household income in Chase City?
Median Household Income in Chase City is $46,596.
What is Income or Wage Gap in Chase City?
Income or Wage Gap in Chase City is 26.4%.
Women in Chase City earn 73.6 cents for every dollar earned by a man.
What is Inequality or Gini Index in Chase City?
Inequality or Gini Index in Chase City is 0.43.
What is the Total Population of Chase City?
Total Population of Chase City is 2,339.
What is the Total Male Population of Chase City?
Total Male Population of Chase City is 1,139.
What is the Total Female Population of Chase City?
Total Female Population of Chase City is 1,200.
What is the Ratio of Males per 100 Females in Chase City?
There are 94.92 Males per 100 Females in Chase City.
What is the Ratio of Females per 100 Males in Chase City?
There are 105.36 Females per 100 Males in Chase City.
What is the Median Population Age in Chase City?
Median Population Age in Chase City is 43.9 Years.
What is the Average Family Size in Chase City
Average Family Size in Chase City is 2.9 People.
What is the Average Household Size in Chase City
Average Household Size in Chase City is 2.3 People.
How Large is the Labor Force in Chase City?
There are 961 People in the Labor Forcein in Chase City.
What is the Percentage of People in the Labor Force in Chase City?
52.3% of People are in the Labor Force in Chase City.
What is the Unemployment Rate in Chase City?
Unemployment Rate in Chase City is 2.2%.