Zip Codes with the Highest Percentage of Population Employed in Security & Protection in Virginia
RELATED REPORTS & OPTIONS
Security & Protection
Virginia
Compare Zip Codes
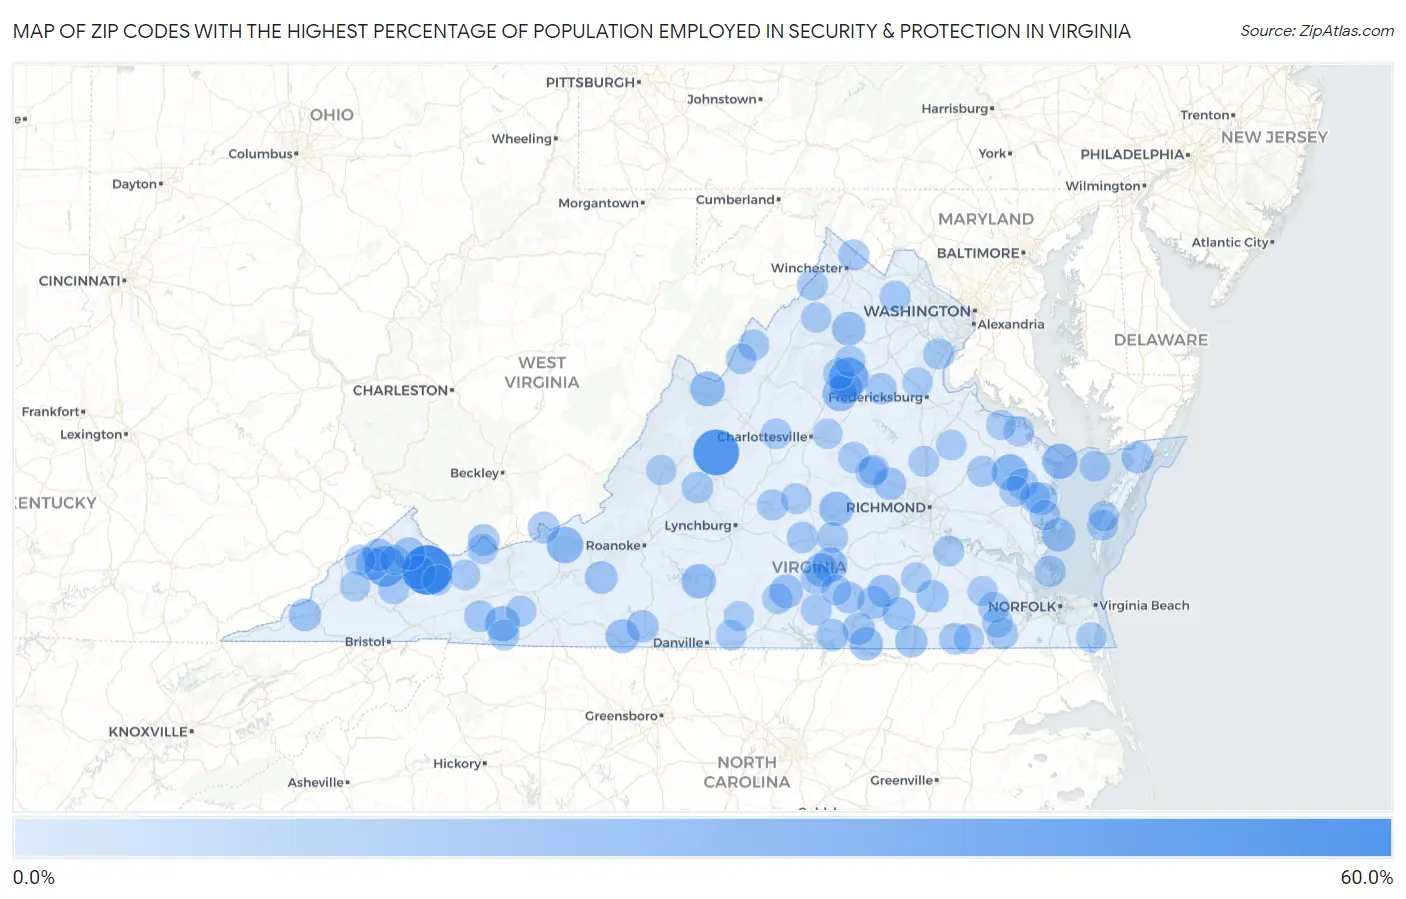
Map of Zip Codes with the Highest Percentage of Population Employed in Security & Protection in Virginia
0.0%
60.0%
Zip Codes with the Highest Percentage of Population Employed in Security & Protection in Virginia
| Zip Code | % Employed | vs State | vs National | |
| 1. | 24612 | 59.3% | 2.7%(+56.6)#1 | 2.1%(+57.1)#28 |
| 2. | 24415 | 48.6% | 2.7%(+45.9)#2 | 2.1%(+46.4)#42 |
| 3. | 24220 | 34.5% | 2.7%(+31.8)#3 | 2.1%(+32.3)#72 |
| 4. | 22725 | 31.6% | 2.7%(+28.9)#4 | 2.1%(+29.4)#87 |
| 5. | 22504 | 22.5% | 2.7%(+19.9)#5 | 2.1%(+20.4)#156 |
| 6. | 24086 | 22.5% | 2.7%(+19.8)#6 | 2.1%(+20.3)#157 |
| 7. | 22539 | 19.5% | 2.7%(+16.8)#7 | 2.1%(+17.3)#209 |
| 8. | 22709 | 19.2% | 2.7%(+16.5)#8 | 2.1%(+17.1)#216 |
| 9. | 24326 | 18.8% | 2.7%(+16.2)#9 | 2.1%(+16.7)#229 |
| 10. | 24442 | 18.2% | 2.7%(+15.5)#10 | 2.1%(+16.0)#246 |
| 11. | 23942 | 17.9% | 2.7%(+15.3)#11 | 2.1%(+15.8)#257 |
| 12. | 24139 | 17.2% | 2.7%(+14.5)#12 | 2.1%(+15.0)#280 |
| 13. | 23040 | 16.4% | 2.7%(+13.7)#13 | 2.1%(+14.3)#300 |
| 14. | 24649 | 16.1% | 2.7%(+13.5)#14 | 2.1%(+14.0)#310 |
| 15. | 24082 | 15.6% | 2.7%(+12.9)#15 | 2.1%(+13.5)#336 |
| 16. | 22627 | 15.4% | 2.7%(+12.7)#16 | 2.1%(+13.2)#344 |
| 17. | 23954 | 15.1% | 2.7%(+12.4)#17 | 2.1%(+13.0)#357 |
| 18. | 23962 | 14.9% | 2.7%(+12.2)#18 | 2.1%(+12.8)#366 |
| 19. | 23138 | 14.3% | 2.7%(+11.6)#19 | 2.1%(+12.1)#399 |
| 20. | 23845 | 14.0% | 2.7%(+11.3)#20 | 2.1%(+11.9)#422 |
| 21. | 24226 | 13.8% | 2.7%(+11.1)#21 | 2.1%(+11.6)#429 |
| 22. | 22730 | 13.6% | 2.7%(+11.0)#22 | 2.1%(+11.5)#437 |
| 23. | 23821 | 13.2% | 2.7%(+10.5)#23 | 2.1%(+11.0)#467 |
| 24. | 23856 | 13.1% | 2.7%(+10.4)#24 | 2.1%(+10.9)#472 |
| 25. | 24631 | 12.8% | 2.7%(+10.1)#25 | 2.1%(+10.7)#487 |
| 26. | 24256 | 12.7% | 2.7%(+10.0)#26 | 2.1%(+10.6)#491 |
| 27. | 23169 | 12.5% | 2.7%(+9.86)#27 | 2.1%(+10.4)#503 |
| 28. | 23876 | 12.5% | 2.7%(+9.82)#28 | 2.1%(+10.4)#506 |
| 29. | 24138 | 12.4% | 2.7%(+9.75)#29 | 2.1%(+10.3)#512 |
| 30. | 24243 | 12.2% | 2.7%(+9.50)#30 | 2.1%(+10.0)#536 |
| 31. | 23879 | 11.9% | 2.7%(+9.22)#31 | 2.1%(+9.76)#557 |
| 32. | 23129 | 11.8% | 2.7%(+9.15)#32 | 2.1%(+9.68)#566 |
| 33. | 24089 | 11.7% | 2.7%(+8.99)#33 | 2.1%(+9.53)#580 |
| 34. | 23950 | 11.6% | 2.7%(+8.95)#34 | 2.1%(+9.48)#585 |
| 35. | 23882 | 11.5% | 2.7%(+8.85)#35 | 2.1%(+9.38)#595 |
| 36. | 23917 | 10.8% | 2.7%(+8.14)#36 | 2.1%(+8.68)#664 |
| 37. | 23359 | 10.1% | 2.7%(+7.41)#37 | 2.1%(+7.94)#755 |
| 38. | 24635 | 10.0% | 2.7%(+7.32)#38 | 2.1%(+7.85)#764 |
| 39. | 24147 | 9.8% | 2.7%(+7.14)#39 | 2.1%(+7.68)#789 |
| 40. | 23944 | 9.8% | 2.7%(+7.13)#40 | 2.1%(+7.66)#791 |
| 41. | 23827 | 9.6% | 2.7%(+6.92)#41 | 2.1%(+7.46)#822 |
| 42. | 24555 | 9.6% | 2.7%(+6.88)#42 | 2.1%(+7.42)#829 |
| 43. | 24375 | 9.5% | 2.7%(+6.82)#43 | 2.1%(+7.36)#839 |
| 44. | 23153 | 9.3% | 2.7%(+6.57)#44 | 2.1%(+7.10)#871 |
| 45. | 23665 | 9.2% | 2.7%(+6.54)#45 | 2.1%(+7.07)#874 |
| 46. | 22433 | 9.0% | 2.7%(+6.27)#46 | 2.1%(+6.81)#924 |
| 47. | 23960 | 8.9% | 2.7%(+6.19)#47 | 2.1%(+6.72)#938 |
| 48. | 23180 | 8.6% | 2.7%(+5.96)#48 | 2.1%(+6.50)#975 |
| 49. | 23084 | 8.5% | 2.7%(+5.86)#49 | 2.1%(+6.39)#1,000 |
| 50. | 24553 | 8.5% | 2.7%(+5.79)#50 | 2.1%(+6.33)#1,013 |
| 51. | 23947 | 8.4% | 2.7%(+5.71)#51 | 2.1%(+6.25)#1,039 |
| 52. | 22722 | 8.3% | 2.7%(+5.65)#52 | 2.1%(+6.18)#1,064 |
| 53. | 24225 | 8.3% | 2.7%(+5.64)#53 | 2.1%(+6.17)#1,070 |
| 54. | 23437 | 8.3% | 2.7%(+5.63)#54 | 2.1%(+6.16)#1,072 |
| 55. | 20117 | 8.3% | 2.7%(+5.59)#55 | 2.1%(+6.13)#1,079 |
| 56. | 23898 | 8.2% | 2.7%(+5.50)#56 | 2.1%(+6.04)#1,101 |
| 57. | 23924 | 8.2% | 2.7%(+5.50)#57 | 2.1%(+6.03)#1,103 |
| 58. | 23092 | 8.0% | 2.7%(+5.34)#58 | 2.1%(+5.87)#1,162 |
| 59. | 22830 | 8.0% | 2.7%(+5.32)#59 | 2.1%(+5.86)#1,168 |
| 60. | 22713 | 7.9% | 2.7%(+5.22)#60 | 2.1%(+5.76)#1,200 |
| 61. | 22654 | 7.9% | 2.7%(+5.19)#61 | 2.1%(+5.72)#1,211 |
| 62. | 22025 | 7.9% | 2.7%(+5.19)#62 | 2.1%(+5.72)#1,214 |
| 63. | 22624 | 7.8% | 2.7%(+5.15)#63 | 2.1%(+5.68)#1,228 |
| 64. | 23405 | 7.8% | 2.7%(+5.12)#64 | 2.1%(+5.66)#1,239 |
| 65. | 23023 | 7.7% | 2.7%(+5.05)#65 | 2.1%(+5.58)#1,258 |
| 66. | 23966 | 7.6% | 2.7%(+4.89)#66 | 2.1%(+5.43)#1,303 |
| 67. | 23921 | 7.5% | 2.7%(+4.77)#67 | 2.1%(+5.30)#1,352 |
| 68. | 23875 | 7.4% | 2.7%(+4.74)#68 | 2.1%(+5.27)#1,359 |
| 69. | 24350 | 7.4% | 2.7%(+4.67)#69 | 2.1%(+5.21)#1,379 |
| 70. | 23315 | 7.3% | 2.7%(+4.61)#70 | 2.1%(+5.14)#1,401 |
| 71. | 24348 | 7.3% | 2.7%(+4.60)#71 | 2.1%(+5.14)#1,406 |
| 72. | 22831 | 7.3% | 2.7%(+4.58)#72 | 2.1%(+5.12)#1,414 |
| 73. | 22943 | 7.2% | 2.7%(+4.51)#73 | 2.1%(+5.04)#1,446 |
| 74. | 24534 | 7.2% | 2.7%(+4.51)#74 | 2.1%(+5.04)#1,448 |
| 75. | 24651 | 7.2% | 2.7%(+4.50)#75 | 2.1%(+5.04)#1,451 |
| 76. | 23047 | 7.1% | 2.7%(+4.45)#76 | 2.1%(+4.99)#1,478 |
| 77. | 23440 | 7.0% | 2.7%(+4.31)#77 | 2.1%(+4.84)#1,537 |
| 78. | 23032 | 7.0% | 2.7%(+4.29)#78 | 2.1%(+4.83)#1,544 |
| 79. | 22469 | 6.9% | 2.7%(+4.26)#79 | 2.1%(+4.79)#1,560 |
| 80. | 22514 | 6.9% | 2.7%(+4.18)#80 | 2.1%(+4.71)#1,603 |
| 81. | 24228 | 6.8% | 2.7%(+4.14)#81 | 2.1%(+4.67)#1,621 |
| 82. | 23974 | 6.8% | 2.7%(+4.07)#82 | 2.1%(+4.61)#1,655 |
| 83. | 23065 | 6.8% | 2.7%(+4.07)#83 | 2.1%(+4.60)#1,657 |
| 84. | 22406 | 6.7% | 2.7%(+4.05)#84 | 2.1%(+4.58)#1,666 |
| 85. | 24594 | 6.6% | 2.7%(+3.97)#85 | 2.1%(+4.50)#1,716 |
| 86. | 24605 | 6.6% | 2.7%(+3.95)#86 | 2.1%(+4.49)#1,719 |
| 87. | 24609 | 6.6% | 2.7%(+3.91)#87 | 2.1%(+4.45)#1,737 |
| 88. | 23874 | 6.6% | 2.7%(+3.89)#88 | 2.1%(+4.43)#1,749 |
| 89. | 23354 | 6.5% | 2.7%(+3.85)#89 | 2.1%(+4.38)#1,775 |
| 90. | 23841 | 6.4% | 2.7%(+3.73)#90 | 2.1%(+4.27)#1,822 |
| 91. | 24230 | 6.4% | 2.7%(+3.72)#91 | 2.1%(+4.25)#1,829 |
| 92. | 24656 | 6.4% | 2.7%(+3.67)#92 | 2.1%(+4.21)#1,859 |
| 93. | 22652 | 6.4% | 2.7%(+3.67)#93 | 2.1%(+4.20)#1,861 |
| 94. | 23050 | 6.2% | 2.7%(+3.54)#94 | 2.1%(+4.07)#1,941 |
| 95. | 23888 | 6.1% | 2.7%(+3.44)#95 | 2.1%(+3.98)#1,997 |
| 96. | 24597 | 6.1% | 2.7%(+3.43)#96 | 2.1%(+3.97)#2,001 |
| 97. | 24448 | 6.1% | 2.7%(+3.38)#97 | 2.1%(+3.91)#2,036 |
| 98. | 23457 | 6.0% | 2.7%(+3.34)#98 | 2.1%(+3.88)#2,060 |
| 99. | 22520 | 5.9% | 2.7%(+3.27)#99 | 2.1%(+3.80)#2,114 |
| 100. | 22947 | 5.9% | 2.7%(+3.25)#100 | 2.1%(+3.78)#2,129 |
Common Questions
What are the Top 10 Zip Codes with the Highest Percentage of Population Employed in Security & Protection in Virginia?
Top 10 Zip Codes with the Highest Percentage of Population Employed in Security & Protection in Virginia are:
What zip code has the Highest Percentage of Population Employed in Security & Protection in Virginia?
24612 has the Highest Percentage of Population Employed in Security & Protection in Virginia with 59.3%.
What is the Percentage of Population Employed in Security & Protection in the State of Virginia?
Percentage of Population Employed in Security & Protection in Virginia is 2.7%.
What is the Percentage of Population Employed in Security & Protection in the United States?
Percentage of Population Employed in Security & Protection in the United States is 2.1%.