Wakefield, VA Map & Demographics
Wakefield Map
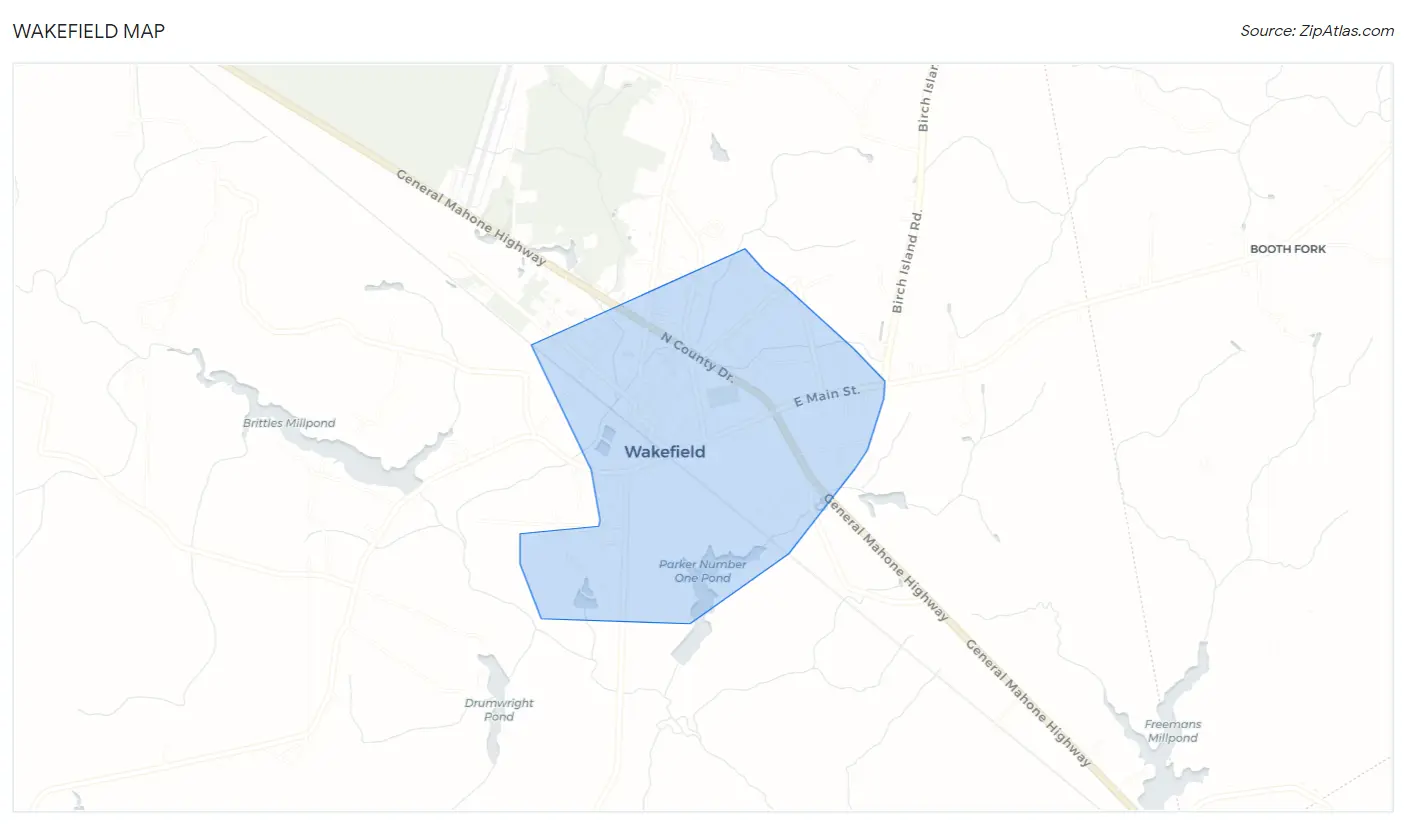
Wakefield Overview
$32,517
PER CAPITA INCOME
$57,670
AVG FAMILY INCOME
$52,679
AVG HOUSEHOLD INCOME
28.5%
WAGE / INCOME GAP [ % ]
71.5¢/ $1
WAGE / INCOME GAP [ $ ]
0.43
INEQUALITY / GINI INDEX
1,286
TOTAL POPULATION
810
MALE POPULATION
476
FEMALE POPULATION
170.17
MALES / 100 FEMALES
58.77
FEMALES / 100 MALES
29.3
MEDIAN AGE
4.4
AVG FAMILY SIZE
3.3
AVG HOUSEHOLD SIZE
779
LABOR FORCE [ PEOPLE ]
67.3%
PERCENT IN LABOR FORCE
4.3%
UNEMPLOYMENT RATE
Wakefield Zip Codes
Wakefield Area Codes
Income in Wakefield
Income Overview in Wakefield
Per Capita Income in Wakefield is $32,517, while median incomes of families and households are $57,670 and $52,679 respectively.
| Characteristic | Number | Measure |
| Per Capita Income | 1,286 | $32,517 |
| Median Family Income | 217 | $57,670 |
| Mean Family Income | 217 | $80,753 |
| Median Household Income | 389 | $52,679 |
| Mean Household Income | 389 | $67,431 |
| Income Deficit | 217 | $0 |
| Wage / Income Gap (%) | 1,286 | 28.47% |
| Wage / Income Gap ($) | 1,286 | 71.53¢ per $1 |
| Gini / Inequality Index | 1,286 | 0.43 |
Earnings by Sex in Wakefield
Average Earnings in Wakefield are $29,158, $29,375 for men and $21,012 for women, a difference of 28.5%.
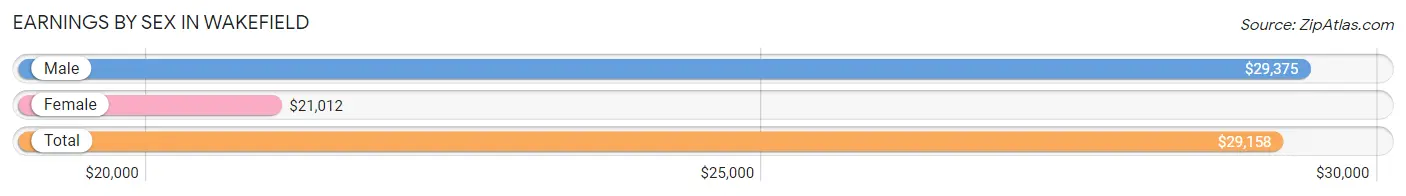
| Sex | Number | Average Earnings |
| Male | 598 (72.0%) | $29,375 |
| Female | 233 (28.0%) | $21,012 |
| Total | 831 (100.0%) | $29,158 |
Earnings by Sex by Income Bracket in Wakefield
The most common earnings brackets in Wakefield are $25,000 to $29,999 for men (264 | 44.2%) and $5,000 to $7,499 for women (47 | 20.2%).
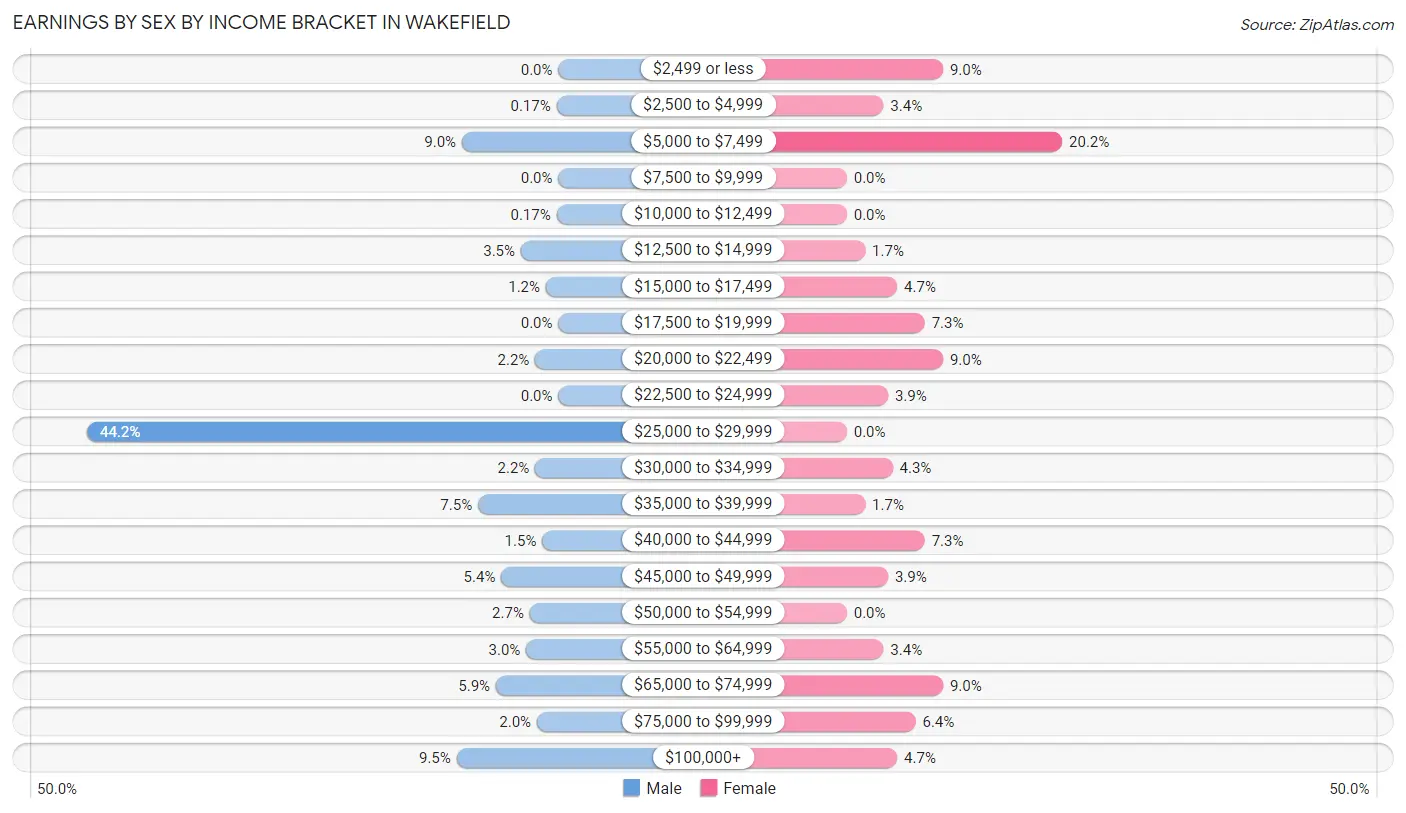
| Income | Male | Female |
| $2,499 or less | 0 (0.0%) | 21 (9.0%) |
| $2,500 to $4,999 | 1 (0.2%) | 8 (3.4%) |
| $5,000 to $7,499 | 54 (9.0%) | 47 (20.2%) |
| $7,500 to $9,999 | 0 (0.0%) | 0 (0.0%) |
| $10,000 to $12,499 | 1 (0.2%) | 0 (0.0%) |
| $12,500 to $14,999 | 21 (3.5%) | 4 (1.7%) |
| $15,000 to $17,499 | 7 (1.2%) | 11 (4.7%) |
| $17,500 to $19,999 | 0 (0.0%) | 17 (7.3%) |
| $20,000 to $22,499 | 13 (2.2%) | 21 (9.0%) |
| $22,500 to $24,999 | 0 (0.0%) | 9 (3.9%) |
| $25,000 to $29,999 | 264 (44.2%) | 0 (0.0%) |
| $30,000 to $34,999 | 13 (2.2%) | 10 (4.3%) |
| $35,000 to $39,999 | 45 (7.5%) | 4 (1.7%) |
| $40,000 to $44,999 | 9 (1.5%) | 17 (7.3%) |
| $45,000 to $49,999 | 32 (5.3%) | 9 (3.9%) |
| $50,000 to $54,999 | 16 (2.7%) | 0 (0.0%) |
| $55,000 to $64,999 | 18 (3.0%) | 8 (3.4%) |
| $65,000 to $74,999 | 35 (5.9%) | 21 (9.0%) |
| $75,000 to $99,999 | 12 (2.0%) | 15 (6.4%) |
| $100,000+ | 57 (9.5%) | 11 (4.7%) |
| Total | 598 (100.0%) | 233 (100.0%) |
Earnings by Sex by Educational Attainment in Wakefield
Average earnings in Wakefield are $48,320 for men and $35,938 for women, a difference of 25.6%. Men with an educational attainment of bachelor's degree enjoy the highest average annual earnings of $128,205, while those with high school diploma education earn the least with $35,664. Women with an educational attainment of graduate degree earn the most with the average annual earnings of $75,000, while those with college or associate's degree education have the smallest earnings of $23,194.
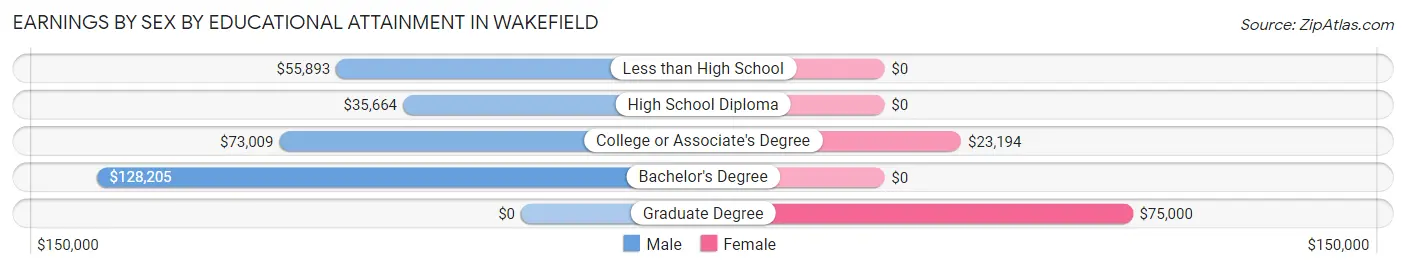
| Educational Attainment | Male Income | Female Income |
| Less than High School | $55,893 | $0 |
| High School Diploma | $35,664 | $0 |
| College or Associate's Degree | $73,009 | $23,194 |
| Bachelor's Degree | $128,205 | $0 |
| Graduate Degree | - | - |
| Total | $48,320 | $35,938 |
Family Income in Wakefield
Family Income Brackets in Wakefield
According to the Wakefield family income data, there are 60 families falling into the $35,000 to $49,999 income range, which is the most common income bracket and makes up 27.7% of all families.
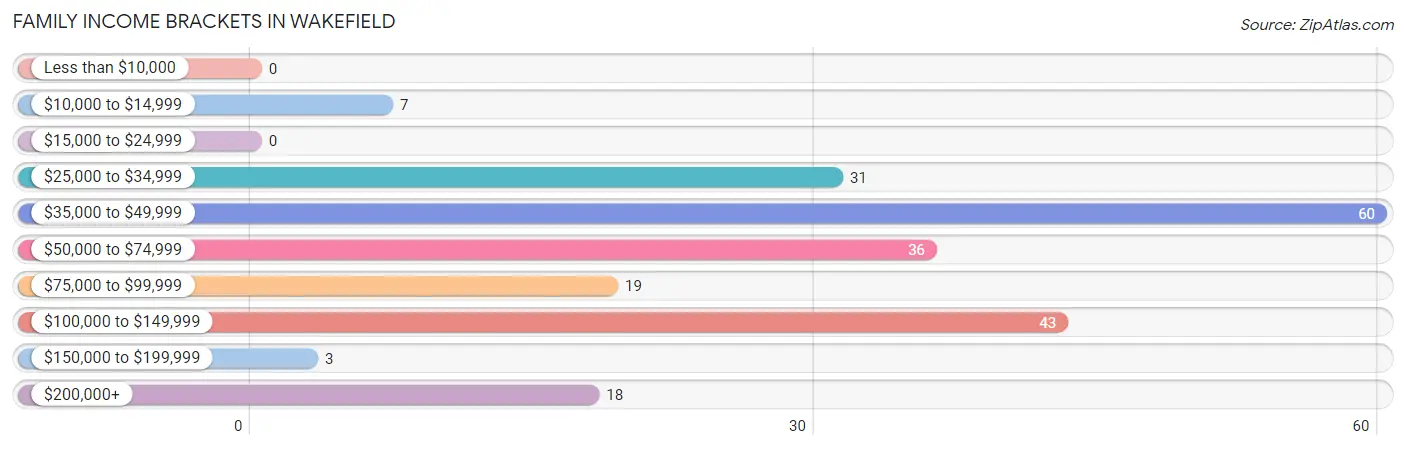
| Income Bracket | # Families | % Families |
| Less than $10,000 | 0 | 0.0% |
| $10,000 to $14,999 | 7 | 3.2% |
| $15,000 to $24,999 | 0 | 0.0% |
| $25,000 to $34,999 | 31 | 14.3% |
| $35,000 to $49,999 | 60 | 27.6% |
| $50,000 to $74,999 | 36 | 16.6% |
| $75,000 to $99,999 | 19 | 8.8% |
| $100,000 to $149,999 | 43 | 19.8% |
| $150,000 to $199,999 | 3 | 1.4% |
| $200,000+ | 18 | 8.3% |
Family Income by Famaliy Size in Wakefield
3-person families (72 | 33.2%) account for the highest median family income in Wakefield with $95,938 per family, while 3-person families (72 | 33.2%) have the highest median income of $31,979 per family member.
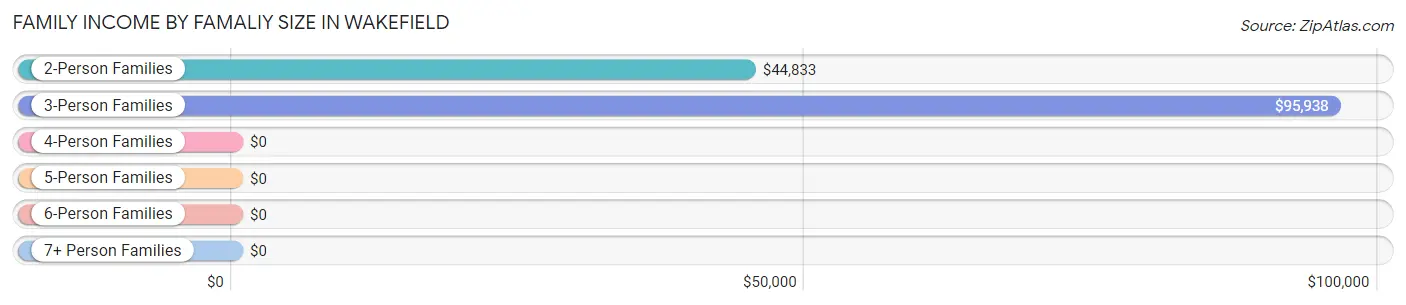
| Income Bracket | # Families | Median Income |
| 2-Person Families | 126 (58.1%) | $44,833 |
| 3-Person Families | 72 (33.2%) | $95,938 |
| 4-Person Families | 0 (0.0%) | $0 |
| 5-Person Families | 13 (6.0%) | $0 |
| 6-Person Families | 0 (0.0%) | $0 |
| 7+ Person Families | 6 (2.8%) | $0 |
| Total | 217 (100.0%) | $57,670 |
Family Income by Number of Earners in Wakefield
The median family income in Wakefield is $57,670, with families comprising 3+ earners (15) having the highest median family income of $250,001, while families with no earners (44) have the lowest median family income of $41,667, accounting for 6.9% and 20.3% of families, respectively.
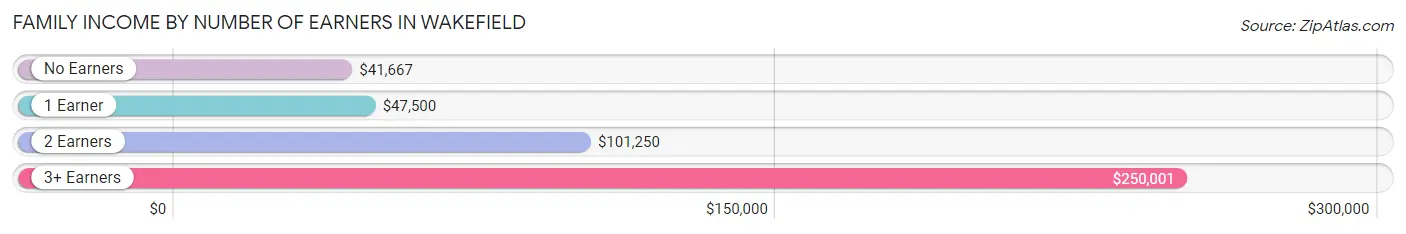
| Number of Earners | # Families | Median Income |
| No Earners | 44 (20.3%) | $41,667 |
| 1 Earner | 94 (43.3%) | $47,500 |
| 2 Earners | 64 (29.5%) | $101,250 |
| 3+ Earners | 15 (6.9%) | $250,001 |
| Total | 217 (100.0%) | $57,670 |
Household Income in Wakefield
Household Income Brackets in Wakefield
With 79 households falling in the category, the $35,000 to $49,999 income range is the most frequent in Wakefield, accounting for 20.3% of all households. In contrast, only 3 households (0.8%) fall into the $150,000 to $199,999 income bracket, making it the least populous group.
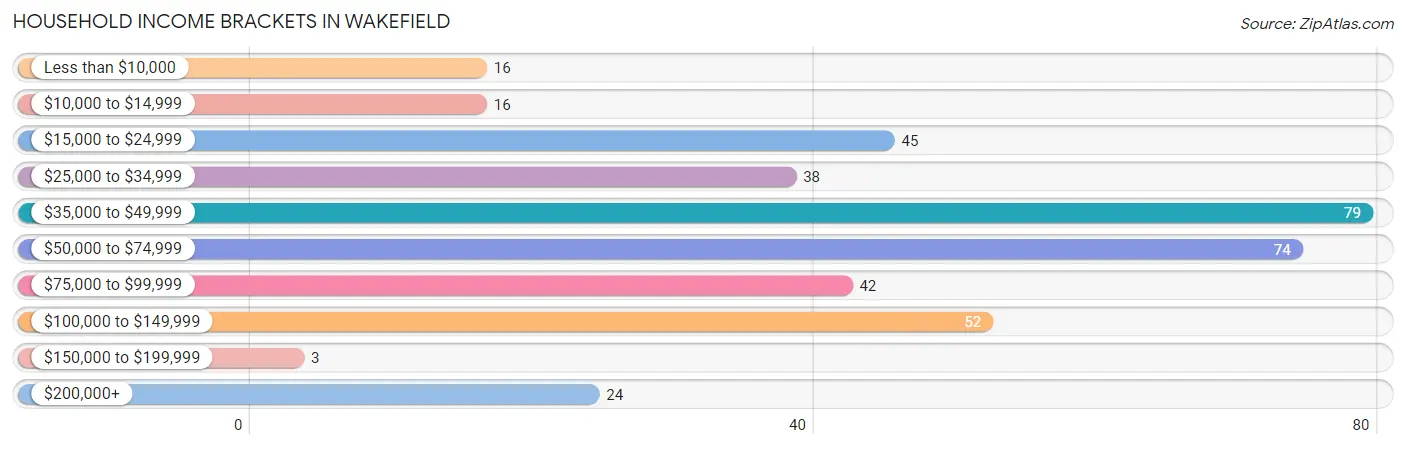
| Income Bracket | # Households | % Households |
| Less than $10,000 | 16 | 4.1% |
| $10,000 to $14,999 | 16 | 4.1% |
| $15,000 to $24,999 | 45 | 11.6% |
| $25,000 to $34,999 | 38 | 9.8% |
| $35,000 to $49,999 | 79 | 20.3% |
| $50,000 to $74,999 | 74 | 19.0% |
| $75,000 to $99,999 | 42 | 10.8% |
| $100,000 to $149,999 | 52 | 13.4% |
| $150,000 to $199,999 | 3 | 0.8% |
| $200,000+ | 24 | 6.2% |
Household Income by Householder Age in Wakefield
The median household income in Wakefield is $52,679, with the highest median household income of $62,232 found in the 25 to 44 years age bracket for the primary householder. A total of 117 households (30.1%) fall into this category. Meanwhile, the 15 to 24 years age bracket for the primary householder has the lowest median household income of $0, with 4 households (1.0%) in this group.
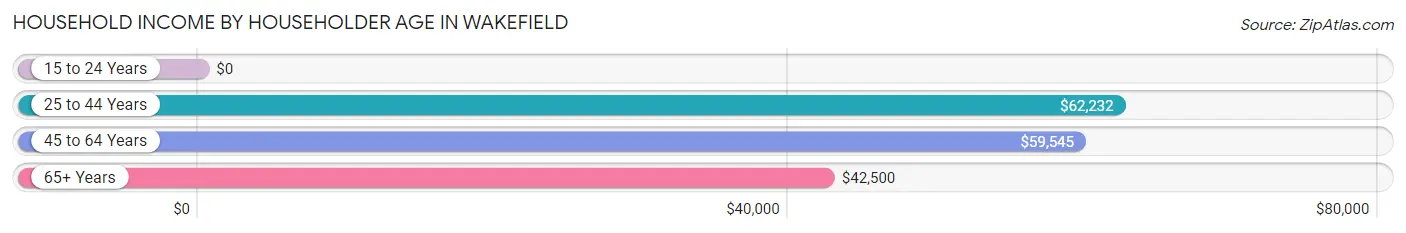
| Income Bracket | # Households | Median Income |
| 15 to 24 Years | 4 (1.0%) | $0 |
| 25 to 44 Years | 117 (30.1%) | $62,232 |
| 45 to 64 Years | 134 (34.4%) | $59,545 |
| 65+ Years | 134 (34.4%) | $42,500 |
| Total | 389 (100.0%) | $52,679 |
Poverty in Wakefield
Income Below Poverty by Sex and Age in Wakefield
With 11.1% poverty level for males and 11.7% for females among the residents of Wakefield, under 5 year old males and 6 to 11 year old females are the most vulnerable to poverty, with 4 males (44.4%) and 5 females (41.7%) in their respective age groups living below the poverty level.
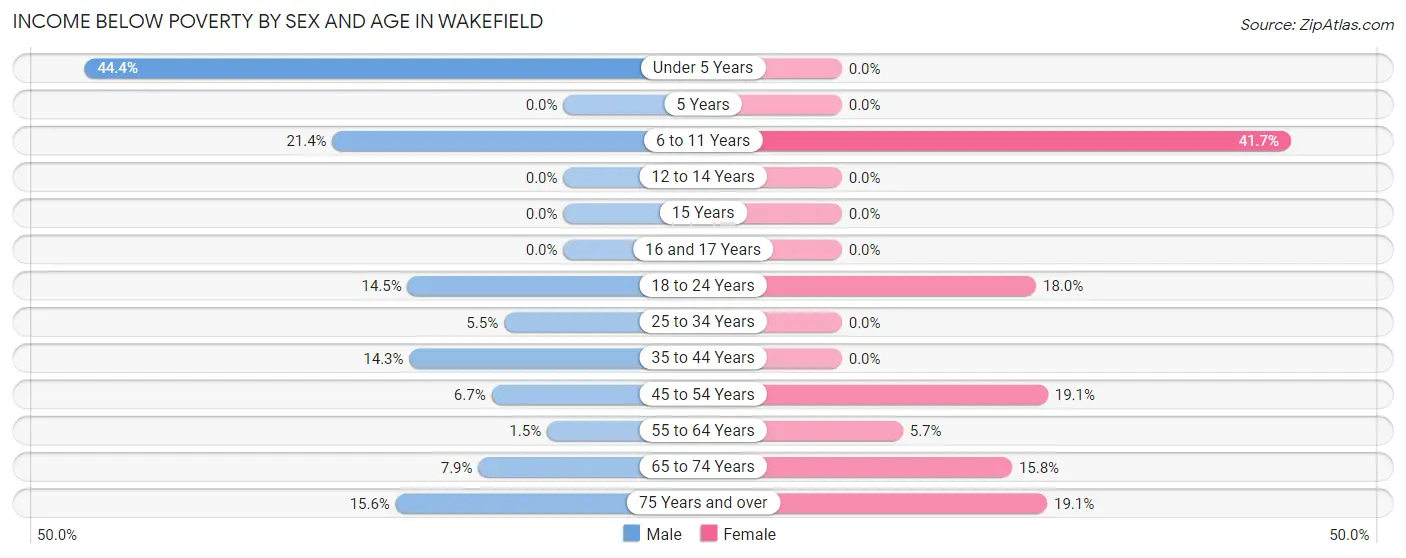
| Age Bracket | Male | Female |
| Under 5 Years | 4 (44.4%) | 0 (0.0%) |
| 5 Years | 0 (0.0%) | 0 (0.0%) |
| 6 to 11 Years | 6 (21.4%) | 5 (41.7%) |
| 12 to 14 Years | 0 (0.0%) | 0 (0.0%) |
| 15 Years | 0 (0.0%) | 0 (0.0%) |
| 16 and 17 Years | 0 (0.0%) | 0 (0.0%) |
| 18 to 24 Years | 47 (14.5%) | 11 (18.0%) |
| 25 to 34 Years | 7 (5.5%) | 0 (0.0%) |
| 35 to 44 Years | 8 (14.3%) | 0 (0.0%) |
| 45 to 54 Years | 7 (6.7%) | 13 (19.1%) |
| 55 to 64 Years | 1 (1.5%) | 3 (5.7%) |
| 65 to 74 Years | 3 (7.9%) | 9 (15.8%) |
| 75 Years and over | 7 (15.6%) | 12 (19.1%) |
| Total | 90 (11.1%) | 53 (11.7%) |
Income Above Poverty by Sex and Age in Wakefield
According to the poverty statistics in Wakefield, males aged 12 to 14 years and females aged under 5 years are the age groups that are most secure financially, with 100.0% of males and 100.0% of females in these age groups living above the poverty line.
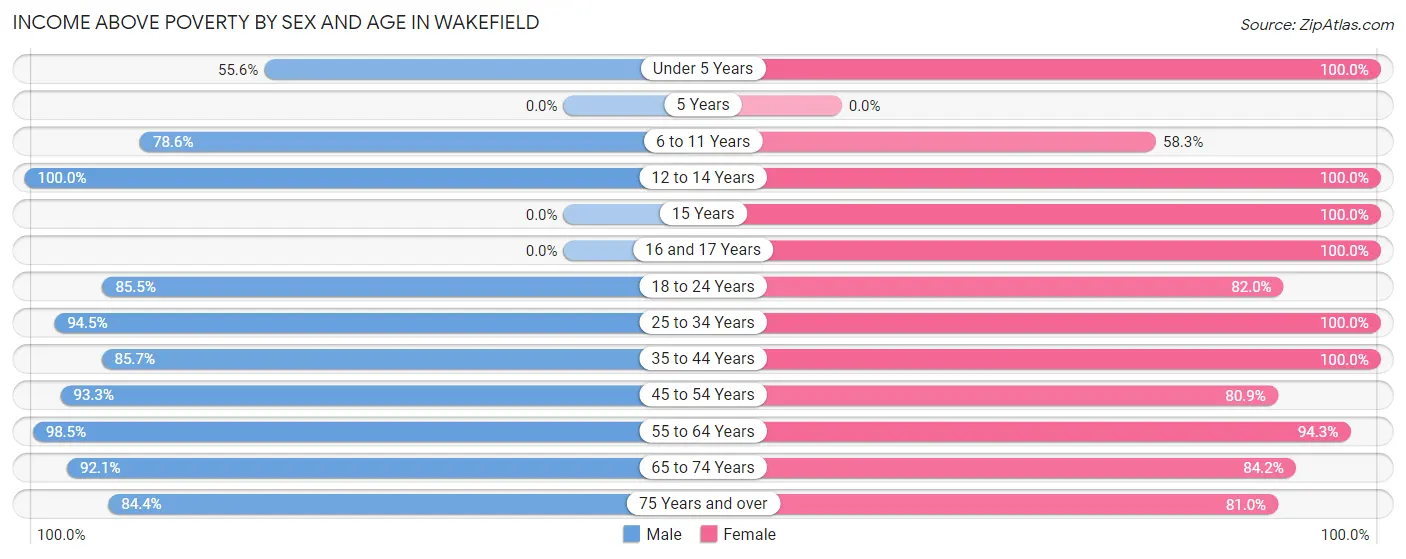
| Age Bracket | Male | Female |
| Under 5 Years | 5 (55.6%) | 6 (100.0%) |
| 5 Years | 0 (0.0%) | 0 (0.0%) |
| 6 to 11 Years | 22 (78.6%) | 7 (58.3%) |
| 12 to 14 Years | 11 (100.0%) | 36 (100.0%) |
| 15 Years | 0 (0.0%) | 5 (100.0%) |
| 16 and 17 Years | 0 (0.0%) | 11 (100.0%) |
| 18 to 24 Years | 278 (85.5%) | 50 (82.0%) |
| 25 to 34 Years | 120 (94.5%) | 45 (100.0%) |
| 35 to 44 Years | 48 (85.7%) | 38 (100.0%) |
| 45 to 54 Years | 98 (93.3%) | 55 (80.9%) |
| 55 to 64 Years | 65 (98.5%) | 50 (94.3%) |
| 65 to 74 Years | 35 (92.1%) | 48 (84.2%) |
| 75 Years and over | 38 (84.4%) | 51 (80.9%) |
| Total | 720 (88.9%) | 402 (88.3%) |
Income Below Poverty Among Married-Couple Families in Wakefield
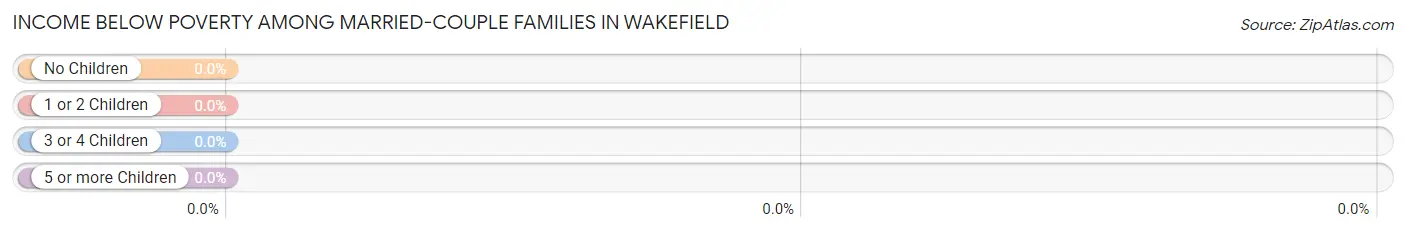
| Children | Above Poverty | Below Poverty |
| No Children | 61 (100.0%) | 0 (0.0%) |
| 1 or 2 Children | 43 (100.0%) | 0 (0.0%) |
| 3 or 4 Children | 0 (0.0%) | 0 (0.0%) |
| 5 or more Children | 0 (0.0%) | 0 (0.0%) |
| Total | 104 (100.0%) | 0 (0.0%) |
Income Below Poverty Among Single-Parent Households in Wakefield
According to the poverty data in Wakefield, 14.0% or 7 single-father households and 6.4% or 4 single-mother households are living below the poverty line. Among single-father households, those with 1 or 2 children have the highest poverty rate, with 7 households (25.9%) experiencing poverty. Likewise, among single-mother households, those with 3 or 4 children have the highest poverty rate, with 4 households (50.0%) falling below the poverty line.
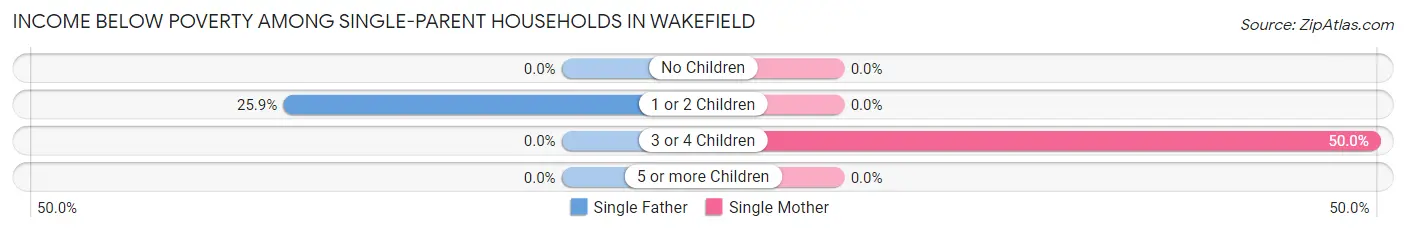
| Children | Single Father | Single Mother |
| No Children | 0 (0.0%) | 0 (0.0%) |
| 1 or 2 Children | 7 (25.9%) | 0 (0.0%) |
| 3 or 4 Children | 0 (0.0%) | 4 (50.0%) |
| 5 or more Children | 0 (0.0%) | 0 (0.0%) |
| Total | 7 (14.0%) | 4 (6.4%) |
Income Below Poverty Among Married-Couple vs Single-Parent Households in Wakefield
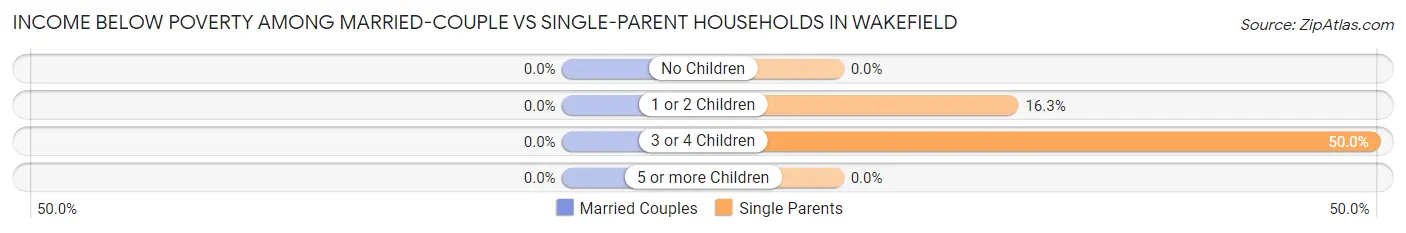
| Children | Married-Couple Families | Single-Parent Households |
| No Children | 0 (0.0%) | 0 (0.0%) |
| 1 or 2 Children | 0 (0.0%) | 7 (16.3%) |
| 3 or 4 Children | 0 (0.0%) | 4 (50.0%) |
| 5 or more Children | 0 (0.0%) | 0 (0.0%) |
| Total | 0 (0.0%) | 11 (9.7%) |
Race in Wakefield
The most populous races in Wakefield are Black / African American (781 | 60.7%), White / Caucasian (476 | 37.0%), and Two or more Races (27 | 2.1%).
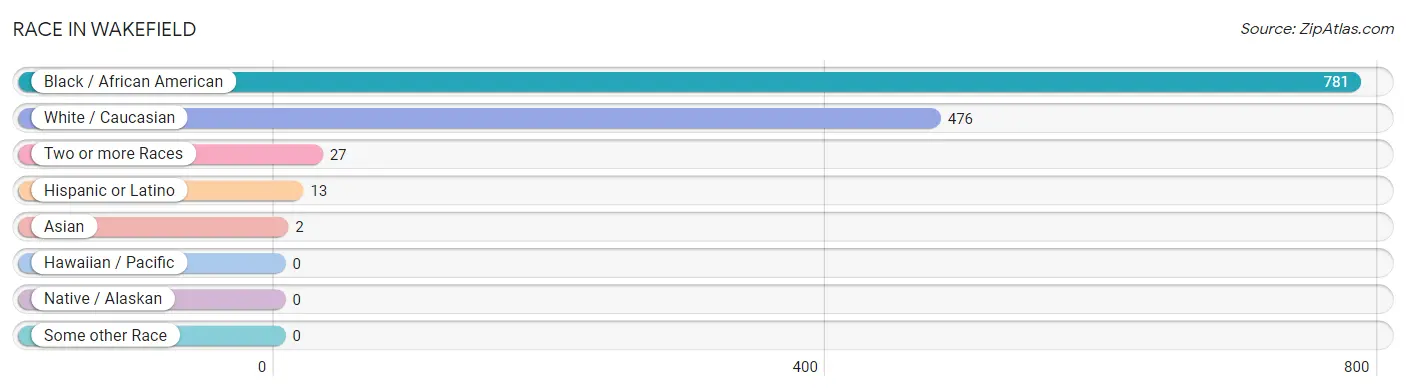
| Race | # Population | % Population |
| Asian | 2 | 0.2% |
| Black / African American | 781 | 60.7% |
| Hawaiian / Pacific | 0 | 0.0% |
| Hispanic or Latino | 13 | 1.0% |
| Native / Alaskan | 0 | 0.0% |
| White / Caucasian | 476 | 37.0% |
| Two or more Races | 27 | 2.1% |
| Some other Race | 0 | 0.0% |
| Total | 1,286 | 100.0% |
Ancestry in Wakefield
The most populous ancestries reported in Wakefield are African (453 | 35.2%), Subsaharan African (453 | 35.2%), German (79 | 6.1%), English (74 | 5.8%), and Irish (36 | 2.8%), together accounting for 85.2% of all Wakefield residents.
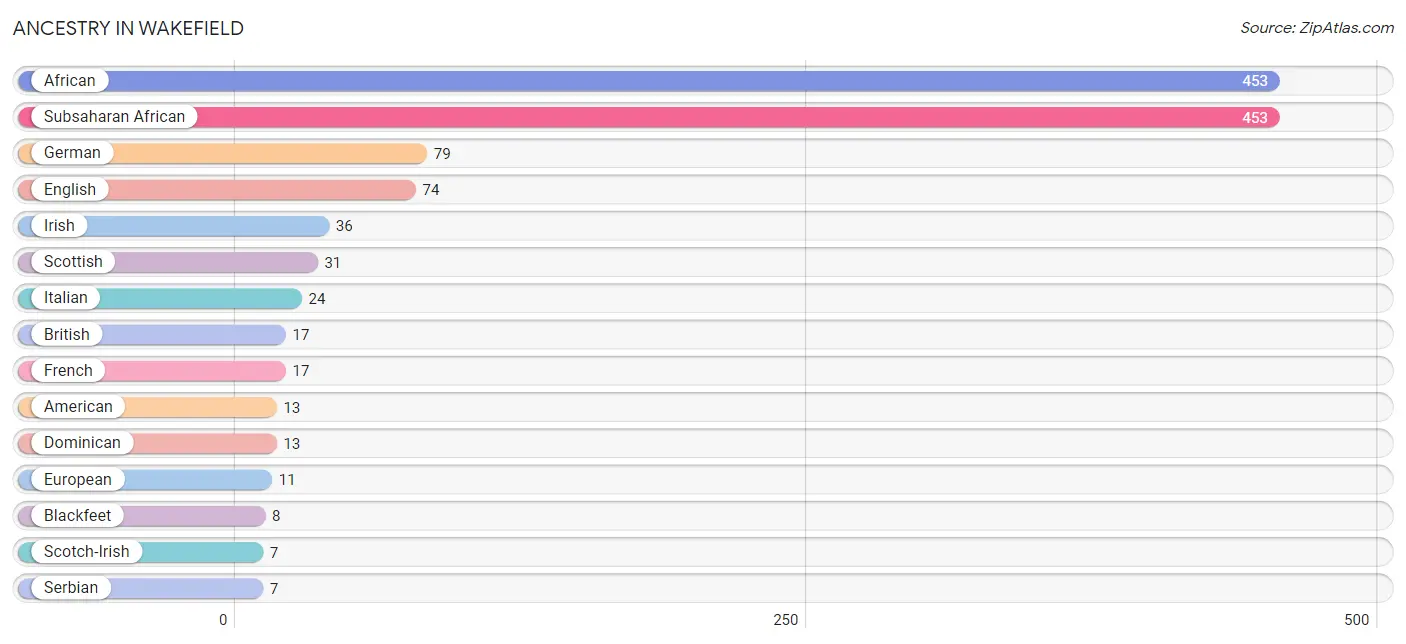
| Ancestry | # Population | % Population |
| African | 453 | 35.2% |
| American | 13 | 1.0% |
| Austrian | 4 | 0.3% |
| Blackfeet | 8 | 0.6% |
| British | 17 | 1.3% |
| Dominican | 13 | 1.0% |
| English | 74 | 5.8% |
| European | 11 | 0.9% |
| French | 17 | 1.3% |
| German | 79 | 6.1% |
| Greek | 1 | 0.1% |
| Irish | 36 | 2.8% |
| Italian | 24 | 1.9% |
| Korean | 2 | 0.2% |
| Lumbee | 1 | 0.1% |
| Portuguese | 2 | 0.2% |
| Scandinavian | 6 | 0.5% |
| Scotch-Irish | 7 | 0.5% |
| Scottish | 31 | 2.4% |
| Serbian | 7 | 0.5% |
| Subsaharan African | 453 | 35.2% | View All 21 Rows |
Immigrants in Wakefield
The most numerous immigrant groups reported in Wakefield came from Europe (9 | 0.7%), Eastern Europe (7 | 0.5%), Serbia (7 | 0.5%), Germany (2 | 0.2%), and Western Europe (2 | 0.2%), together accounting for 2.1% of all Wakefield residents.
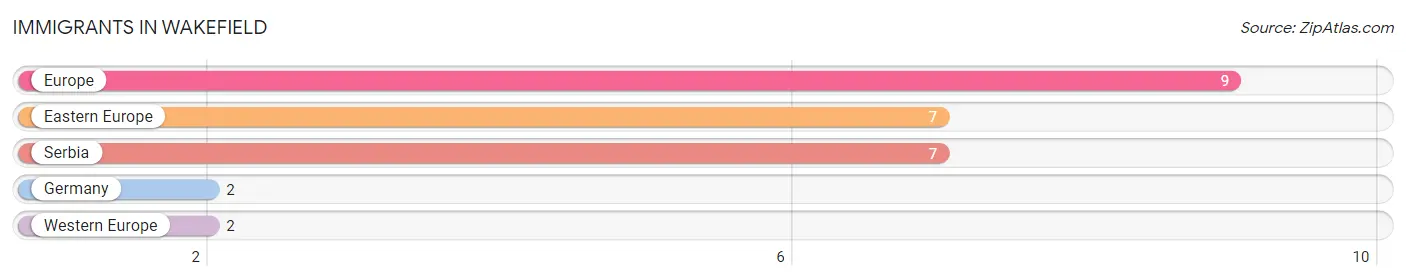
| Immigration Origin | # Population | % Population |
| Eastern Europe | 7 | 0.5% |
| Europe | 9 | 0.7% |
| Germany | 2 | 0.2% |
| Serbia | 7 | 0.5% |
| Western Europe | 2 | 0.2% | View All 5 Rows |
Sex and Age in Wakefield
Sex and Age in Wakefield
The most populous age groups in Wakefield are 20 to 24 Years (249 | 30.7%) for men and 20 to 24 Years (57 | 12.0%) for women.
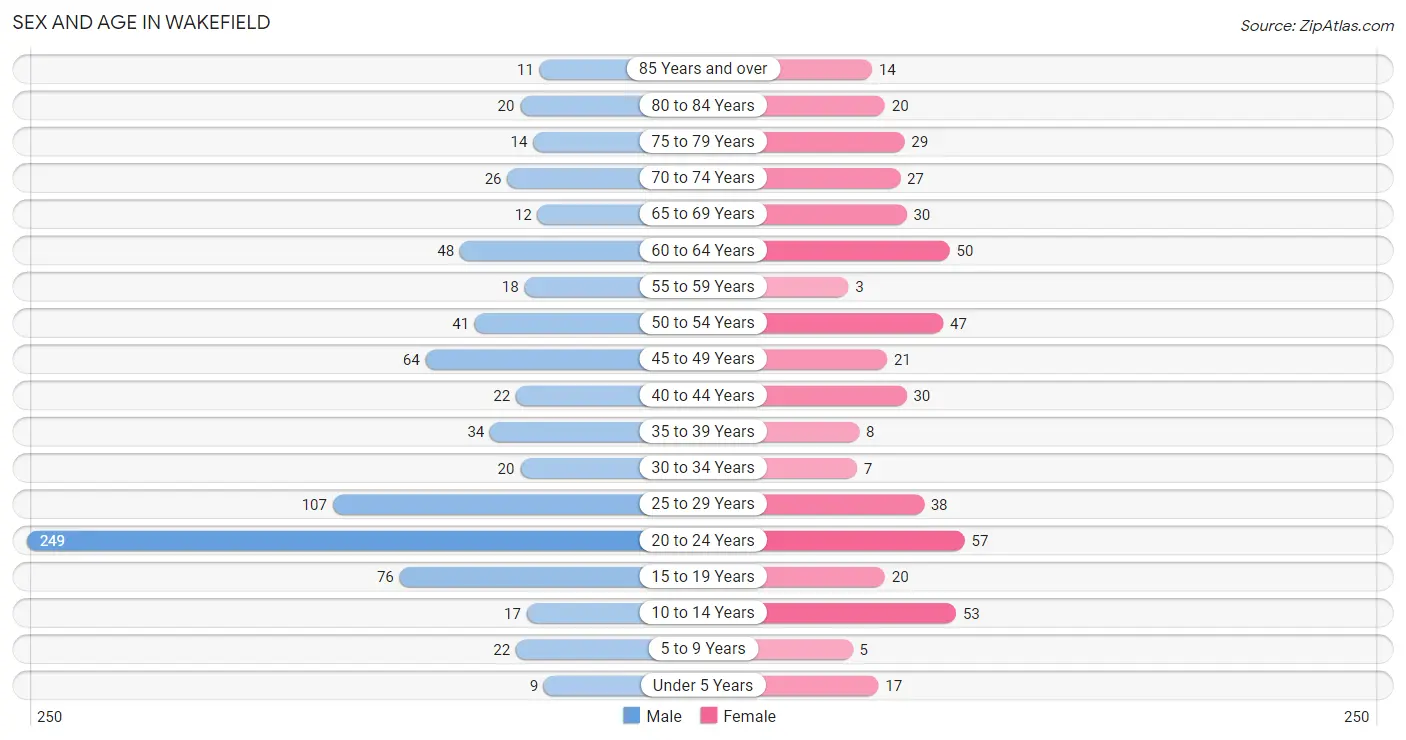
| Age Bracket | Male | Female |
| Under 5 Years | 9 (1.1%) | 17 (3.6%) |
| 5 to 9 Years | 22 (2.7%) | 5 (1.1%) |
| 10 to 14 Years | 17 (2.1%) | 53 (11.1%) |
| 15 to 19 Years | 76 (9.4%) | 20 (4.2%) |
| 20 to 24 Years | 249 (30.7%) | 57 (12.0%) |
| 25 to 29 Years | 107 (13.2%) | 38 (8.0%) |
| 30 to 34 Years | 20 (2.5%) | 7 (1.5%) |
| 35 to 39 Years | 34 (4.2%) | 8 (1.7%) |
| 40 to 44 Years | 22 (2.7%) | 30 (6.3%) |
| 45 to 49 Years | 64 (7.9%) | 21 (4.4%) |
| 50 to 54 Years | 41 (5.1%) | 47 (9.9%) |
| 55 to 59 Years | 18 (2.2%) | 3 (0.6%) |
| 60 to 64 Years | 48 (5.9%) | 50 (10.5%) |
| 65 to 69 Years | 12 (1.5%) | 30 (6.3%) |
| 70 to 74 Years | 26 (3.2%) | 27 (5.7%) |
| 75 to 79 Years | 14 (1.7%) | 29 (6.1%) |
| 80 to 84 Years | 20 (2.5%) | 20 (4.2%) |
| 85 Years and over | 11 (1.4%) | 14 (2.9%) |
| Total | 810 (100.0%) | 476 (100.0%) |
Families and Households in Wakefield
Median Family Size in Wakefield
The median family size in Wakefield is 4.41 persons per family, with married-couple families (104 | 47.9%) accounting for the largest median family size of 5.29 persons per family. On the other hand, single male/father families (50 | 23.0%) represent the smallest median family size with 2.98 persons per family.
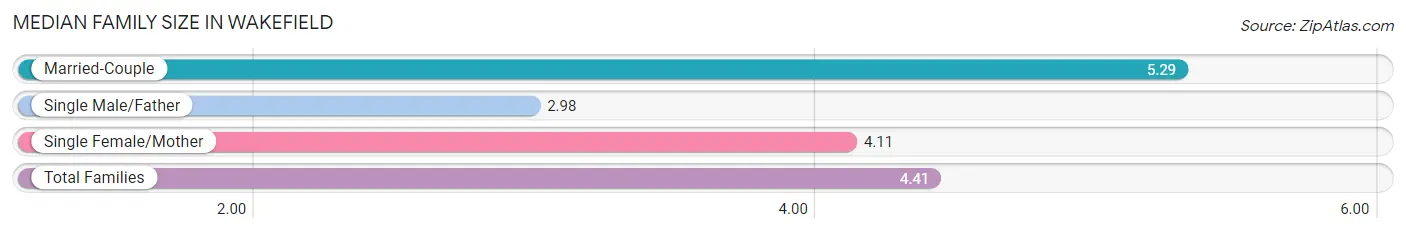
| Family Type | # Families | Family Size |
| Married-Couple | 104 (47.9%) | 5.29 |
| Single Male/Father | 50 (23.0%) | 2.98 |
| Single Female/Mother | 63 (29.0%) | 4.11 |
| Total Families | 217 (100.0%) | 4.41 |
Median Household Size in Wakefield
The median household size in Wakefield is 3.28 persons per household, with married-couple households (104 | 26.7%) accounting for the largest median household size of 5.38 persons per household. non-family households (172 | 44.2%) represent the smallest median household size with 1.62 persons per household.
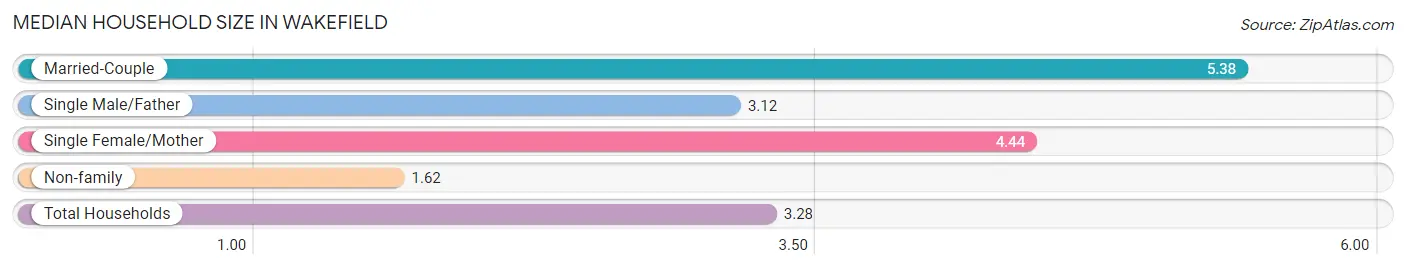
| Household Type | # Households | Household Size |
| Married-Couple | 104 (26.7%) | 5.38 |
| Single Male/Father | 50 (12.9%) | 3.12 |
| Single Female/Mother | 63 (16.2%) | 4.44 |
| Non-family | 172 (44.2%) | 1.62 |
| Total Households | 389 (100.0%) | 3.28 |
Household Size by Marriage Status in Wakefield
Out of a total of 389 households in Wakefield, 217 (55.8%) are family households, while 172 (44.2%) are nonfamily households. The most numerous type of family households are 2-person households, comprising 126, and the most common type of nonfamily households are 1-person households, comprising 143.
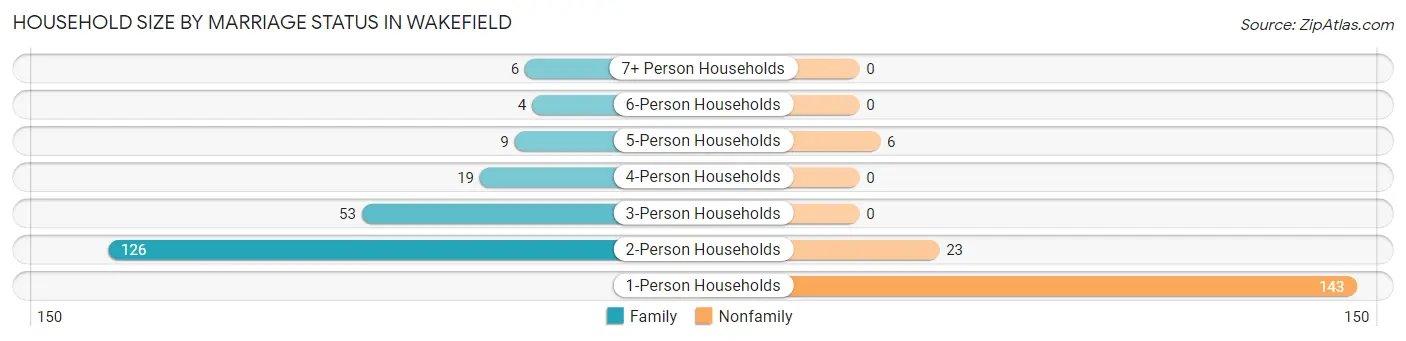
| Household Size | Family Households | Nonfamily Households |
| 1-Person Households | - | 143 (36.8%) |
| 2-Person Households | 126 (32.4%) | 23 (5.9%) |
| 3-Person Households | 53 (13.6%) | 0 (0.0%) |
| 4-Person Households | 19 (4.9%) | 0 (0.0%) |
| 5-Person Households | 9 (2.3%) | 6 (1.5%) |
| 6-Person Households | 4 (1.0%) | 0 (0.0%) |
| 7+ Person Households | 6 (1.5%) | 0 (0.0%) |
| Total | 217 (55.8%) | 172 (44.2%) |
Female Fertility in Wakefield
Fertility by Age in Wakefield
Average fertility rate in Wakefield is 43.0 births per 1,000 women. Women in the age bracket of 35 to 50 years have the highest fertility rate with 63.0 births per 1,000 women. Women in the age bracket of 20 to 34 years acount for 50.0% of all women with births.
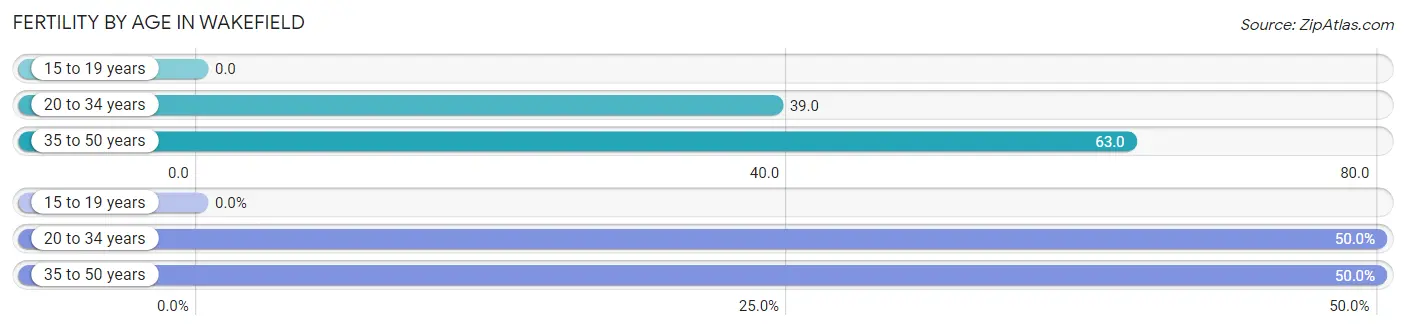
| Age Bracket | Women with Births | Births / 1,000 Women |
| 15 to 19 years | 0 (0.0%) | 0.0 |
| 20 to 34 years | 4 (50.0%) | 39.0 |
| 35 to 50 years | 4 (50.0%) | 63.0 |
| Total | 8 (100.0%) | 43.0 |
Fertility by Age by Marriage Status in Wakefield
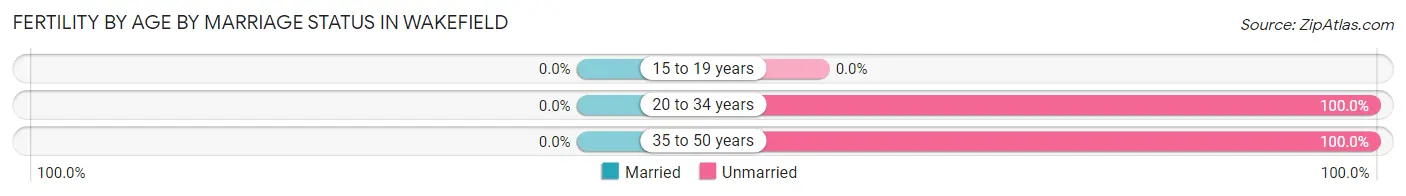
| Age Bracket | Married | Unmarried |
| 15 to 19 years | 0 (0.0%) | 0 (0.0%) |
| 20 to 34 years | 0 (0.0%) | 4 (100.0%) |
| 35 to 50 years | 0 (0.0%) | 4 (100.0%) |
| Total | 0 (0.0%) | 8 (100.0%) |
Fertility by Education in Wakefield
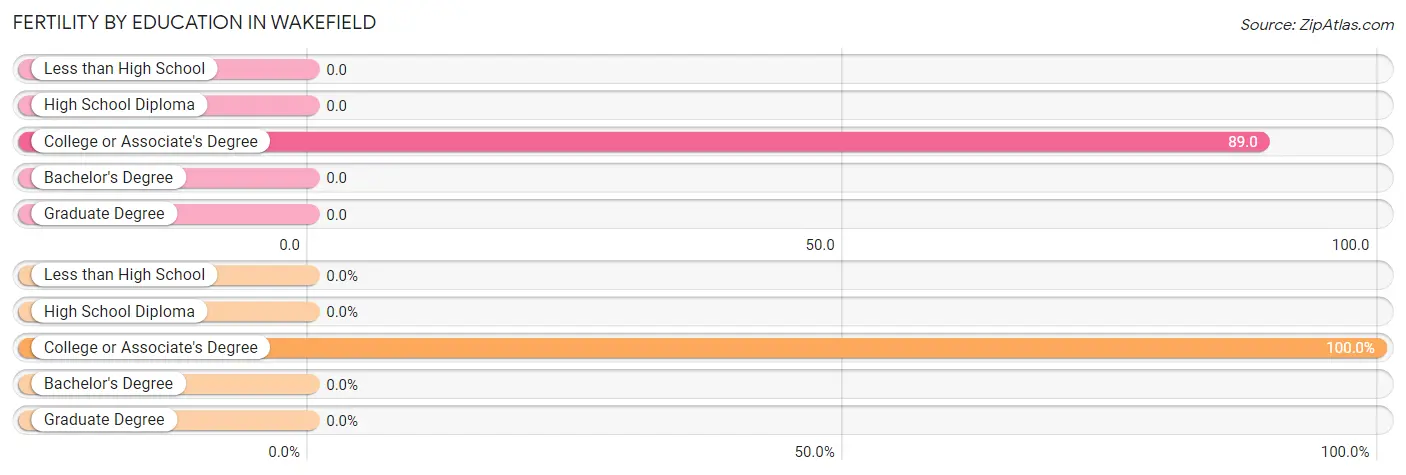
| Educational Attainment | Women with Births | Births / 1,000 Women |
| Less than High School | 0 (0.0%) | 0.0 |
| High School Diploma | 0 (0.0%) | 0.0 |
| College or Associate's Degree | 8 (100.0%) | 89.0 |
| Bachelor's Degree | 0 (0.0%) | 0.0 |
| Graduate Degree | 0 (0.0%) | 0.0 |
| Total | 8 (100.0%) | 43.0 |
Fertility by Education by Marriage Status in Wakefield
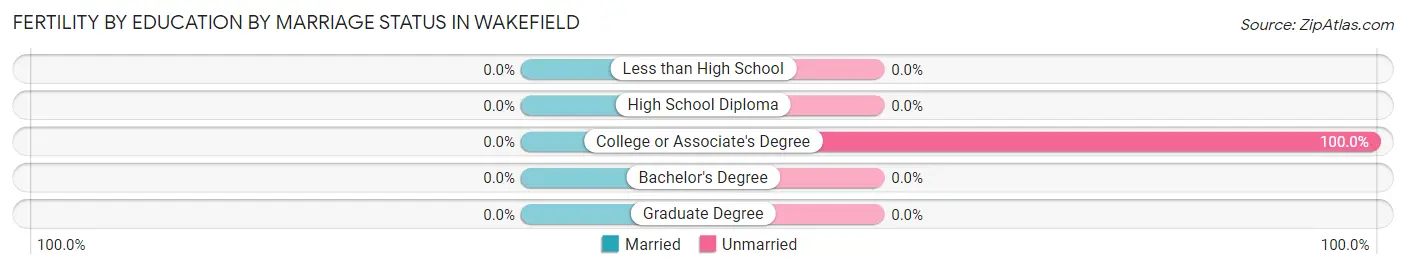
| Educational Attainment | Married | Unmarried |
| Less than High School | 0 (0.0%) | 0 (0.0%) |
| High School Diploma | 0 (0.0%) | 0 (0.0%) |
| College or Associate's Degree | 0 (0.0%) | 8 (100.0%) |
| Bachelor's Degree | 0 (0.0%) | 0 (0.0%) |
| Graduate Degree | 0 (0.0%) | 0 (0.0%) |
| Total | 0 (0.0%) | 8 (100.0%) |
Employment Characteristics in Wakefield
Employment by Class of Employer in Wakefield
Among the 719 employed individuals in Wakefield, private company employees (574 | 79.8%), federal government employees (45 | 6.3%), and local government employees (43 | 6.0%) make up the most common classes of employment.
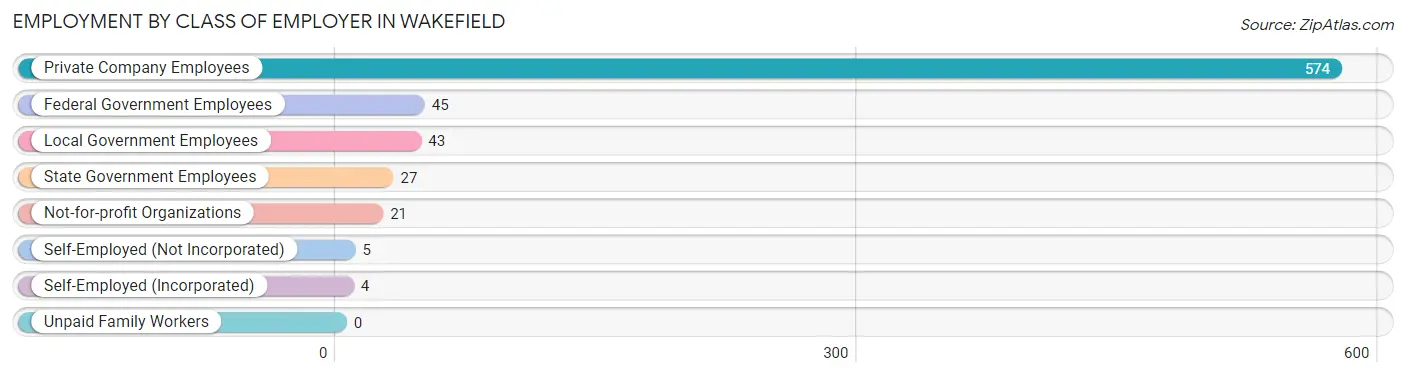
| Employer Class | # Employees | % Employees |
| Private Company Employees | 574 | 79.8% |
| Self-Employed (Incorporated) | 4 | 0.6% |
| Self-Employed (Not Incorporated) | 5 | 0.7% |
| Not-for-profit Organizations | 21 | 2.9% |
| Local Government Employees | 43 | 6.0% |
| State Government Employees | 27 | 3.8% |
| Federal Government Employees | 45 | 6.3% |
| Unpaid Family Workers | 0 | 0.0% |
| Total | 719 | 100.0% |
Employment Status by Age in Wakefield
According to the labor force statistics for Wakefield, out of the total population over 16 years of age (1,158), 67.3% or 779 individuals are in the labor force, with 4.3% or 33 of them unemployed. The age group with the highest labor force participation rate is 25 to 29 years, with 100.0% or 145 individuals in the labor force. Within the labor force, the 35 to 44 years age range has the highest percentage of unemployed individuals, with 11.9% or 9 of them being unemployed.
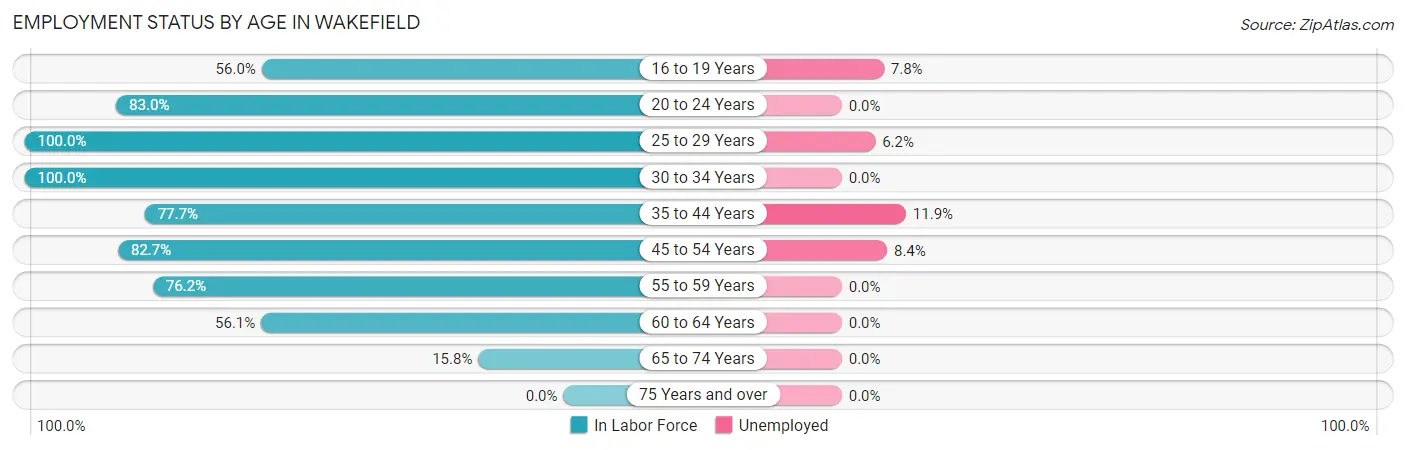
| Age Bracket | In Labor Force | Unemployed |
| 16 to 19 Years | 51 (56.0%) | 4 (7.8%) |
| 20 to 24 Years | 254 (83.0%) | 0 (0.0%) |
| 25 to 29 Years | 145 (100.0%) | 9 (6.2%) |
| 30 to 34 Years | 27 (100.0%) | 0 (0.0%) |
| 35 to 44 Years | 73 (77.7%) | 9 (11.9%) |
| 45 to 54 Years | 143 (82.7%) | 12 (8.4%) |
| 55 to 59 Years | 16 (76.2%) | 0 (0.0%) |
| 60 to 64 Years | 55 (56.1%) | 0 (0.0%) |
| 65 to 74 Years | 15 (15.8%) | 0 (0.0%) |
| 75 Years and over | 0 (0.0%) | 0 (0.0%) |
| Total | 779 (67.3%) | 33 (4.3%) |
Employment Status by Educational Attainment in Wakefield
According to labor force statistics for Wakefield, 82.3% of individuals (459) out of the total population between 25 and 64 years of age (558) are in the labor force, with 6.4% or 29 of them being unemployed. The group with the highest labor force participation rate are those with the educational attainment of bachelor's degree or higher, with 88.5% or 123 individuals in the labor force. Within the labor force, individuals with bachelor's degree or higher education have the highest percentage of unemployment, with 6.8% or 8 of them being unemployed.
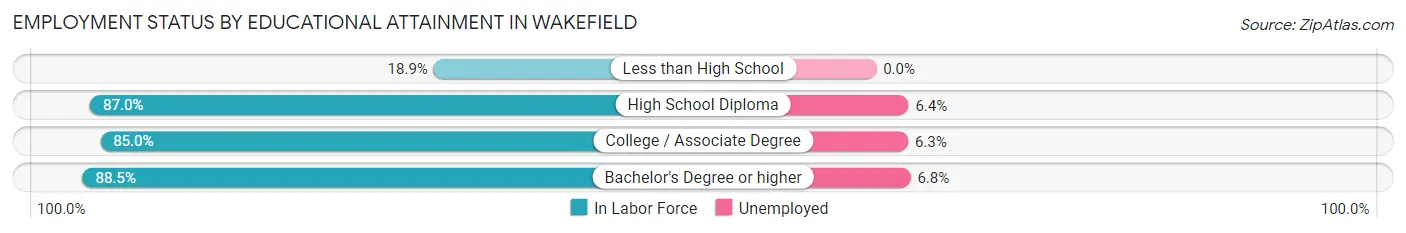
| Educational Attainment | In Labor Force | Unemployed |
| Less than High School | 7 (18.9%) | 0 (0.0%) |
| High School Diploma | 187 (87.0%) | 14 (6.4%) |
| College / Associate Degree | 142 (85.0%) | 11 (6.3%) |
| Bachelor's Degree or higher | 123 (88.5%) | 9 (6.8%) |
| Total | 459 (82.3%) | 36 (6.4%) |
Employment Occupations by Sex in Wakefield
Management, Business, Science and Arts Occupations
The most common Management, Business, Science and Arts occupations in Wakefield are Community & Social Service (55 | 7.4%), Education Instruction & Library (37 | 5.0%), Management (27 | 3.6%), Computers, Engineering & Science (17 | 2.3%), and Arts, Media & Entertainment (15 | 2.0%).
Management, Business, Science and Arts Occupations by Sex
Within the Management, Business, Science and Arts occupations in Wakefield, the most male-oriented occupations are Architecture & Engineering (100.0%), Arts, Media & Entertainment (100.0%), and Computers, Engineering & Science (70.6%), while the most female-oriented occupations are Computers & Mathematics (100.0%), Legal Services & Support (100.0%), and Health Diagnosing & Treating (100.0%).
| Occupation | Male | Female |
| Management | 16 (59.3%) | 11 (40.7%) |
| Business & Financial | 0 (0.0%) | 0 (0.0%) |
| Computers, Engineering & Science | 12 (70.6%) | 5 (29.4%) |
| Computers & Mathematics | 0 (0.0%) | 5 (100.0%) |
| Architecture & Engineering | 12 (100.0%) | 0 (0.0%) |
| Life, Physical & Social Science | 0 (0.0%) | 0 (0.0%) |
| Community & Social Service | 28 (50.9%) | 27 (49.1%) |
| Education, Arts & Media | 0 (0.0%) | 0 (0.0%) |
| Legal Services & Support | 0 (0.0%) | 3 (100.0%) |
| Education Instruction & Library | 13 (35.1%) | 24 (64.9%) |
| Arts, Media & Entertainment | 15 (100.0%) | 0 (0.0%) |
| Health Diagnosing & Treating | 0 (0.0%) | 3 (100.0%) |
| Health Technologists | 0 (0.0%) | 0 (0.0%) |
| Total (Category) | 56 (54.9%) | 46 (45.1%) |
| Total (Overall) | 570 (77.0%) | 170 (23.0%) |
Services Occupations
The most common Services occupations in Wakefield are Healthcare Support (214 | 28.9%), Security & Protection (81 | 11.0%), Firefighting & Prevention (69 | 9.3%), Cleaning & Maintenance (22 | 3.0%), and Law Enforcement (12 | 1.6%).
Services Occupations by Sex
Within the Services occupations in Wakefield, the most male-oriented occupations are Firefighting & Prevention (100.0%), Security & Protection (97.5%), and Healthcare Support (94.4%), while the most female-oriented occupations are Food Preparation & Serving (100.0%), Cleaning & Maintenance (72.7%), and Law Enforcement (16.7%).
| Occupation | Male | Female |
| Healthcare Support | 202 (94.4%) | 12 (5.6%) |
| Security & Protection | 79 (97.5%) | 2 (2.5%) |
| Firefighting & Prevention | 69 (100.0%) | 0 (0.0%) |
| Law Enforcement | 10 (83.3%) | 2 (16.7%) |
| Food Preparation & Serving | 0 (0.0%) | 11 (100.0%) |
| Cleaning & Maintenance | 6 (27.3%) | 16 (72.7%) |
| Personal Care & Service | 0 (0.0%) | 0 (0.0%) |
| Total (Category) | 287 (87.5%) | 41 (12.5%) |
| Total (Overall) | 570 (77.0%) | 170 (23.0%) |
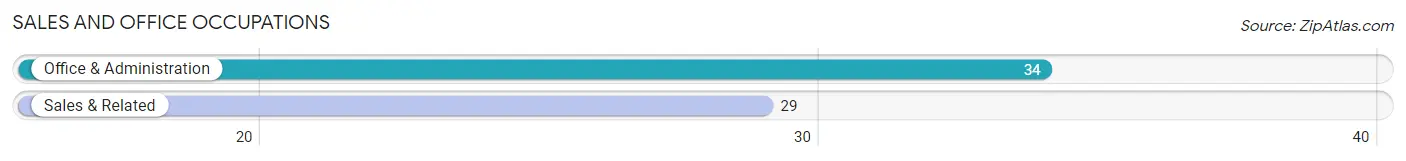
Sales and Office Occupations
The most common Sales and Office occupations in Wakefield are Office & Administration (34 | 4.6%), and Sales & Related (29 | 3.9%).
Sales and Office Occupations by Sex
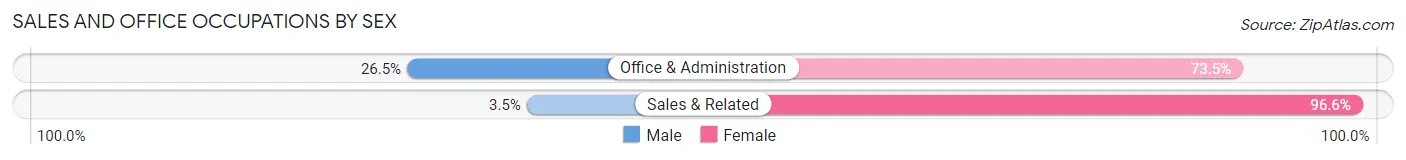
| Occupation | Male | Female |
| Sales & Related | 1 (3.5%) | 28 (96.6%) |
| Office & Administration | 9 (26.5%) | 25 (73.5%) |
| Total (Category) | 10 (15.9%) | 53 (84.1%) |
| Total (Overall) | 570 (77.0%) | 170 (23.0%) |
Natural Resources, Construction and Maintenance Occupations
The most common Natural Resources, Construction and Maintenance occupations in Wakefield are Construction & Extraction (33 | 4.5%), and Installation, Maintenance & Repair (5 | 0.7%).
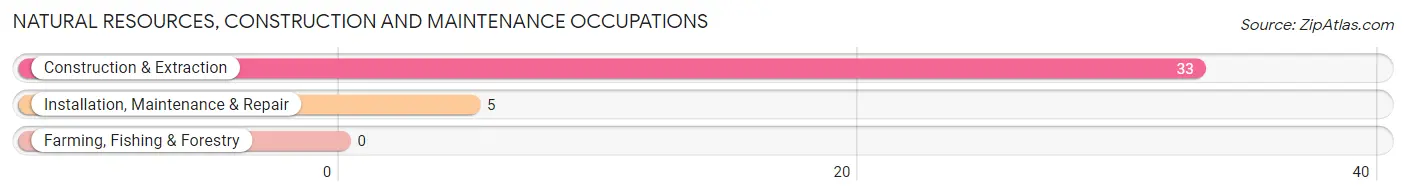
Natural Resources, Construction and Maintenance Occupations by Sex
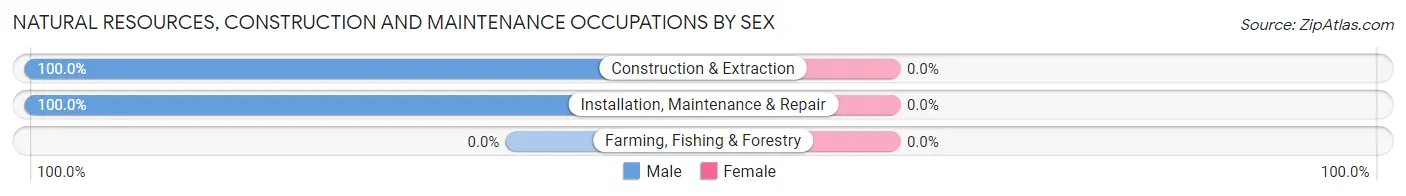
| Occupation | Male | Female |
| Farming, Fishing & Forestry | 0 (0.0%) | 0 (0.0%) |
| Construction & Extraction | 33 (100.0%) | 0 (0.0%) |
| Installation, Maintenance & Repair | 5 (100.0%) | 0 (0.0%) |
| Total (Category) | 38 (100.0%) | 0 (0.0%) |
| Total (Overall) | 570 (77.0%) | 170 (23.0%) |
Production, Transportation and Moving Occupations
The most common Production, Transportation and Moving occupations in Wakefield are Material Moving (125 | 16.9%), Production (76 | 10.3%), and Transportation (8 | 1.1%).
Production, Transportation and Moving Occupations by Sex
| Occupation | Male | Female |
| Production | 50 (65.8%) | 26 (34.2%) |
| Transportation | 8 (100.0%) | 0 (0.0%) |
| Material Moving | 121 (96.8%) | 4 (3.2%) |
| Total (Category) | 179 (85.7%) | 30 (14.3%) |
| Total (Overall) | 570 (77.0%) | 170 (23.0%) |
Employment Industries by Sex in Wakefield
Employment Industries in Wakefield
The major employment industries in Wakefield include Health Care & Social Assistance (219 | 29.6%), Retail Trade (179 | 24.2%), Manufacturing (83 | 11.2%), Public Administration (69 | 9.3%), and Educational Services (44 | 5.9%).
Employment Industries by Sex in Wakefield
The Wakefield industries that see more men than women are Agriculture, Fishing & Hunting (100.0%), Construction (100.0%), and Wholesale Trade (100.0%), whereas the industries that tend to have a higher number of women are Educational Services (70.5%), Accommodation & Food Services (51.5%), and Professional & Scientific (43.8%).
| Industry | Male | Female |
| Agriculture, Fishing & Hunting | 4 (100.0%) | 0 (0.0%) |
| Mining, Quarrying, & Extraction | 0 (0.0%) | 0 (0.0%) |
| Construction | 33 (100.0%) | 0 (0.0%) |
| Manufacturing | 62 (74.7%) | 21 (25.3%) |
| Wholesale Trade | 13 (100.0%) | 0 (0.0%) |
| Retail Trade | 142 (79.3%) | 37 (20.7%) |
| Transportation & Warehousing | 7 (58.3%) | 5 (41.7%) |
| Utilities | 6 (100.0%) | 0 (0.0%) |
| Information | 6 (100.0%) | 0 (0.0%) |
| Finance & Insurance | 0 (0.0%) | 0 (0.0%) |
| Real Estate, Rental & Leasing | 1 (100.0%) | 0 (0.0%) |
| Professional & Scientific | 9 (56.2%) | 7 (43.8%) |
| Enterprise Management | 0 (0.0%) | 0 (0.0%) |
| Administrative & Support | 6 (100.0%) | 0 (0.0%) |
| Educational Services | 13 (29.5%) | 31 (70.5%) |
| Health Care & Social Assistance | 202 (92.2%) | 17 (7.8%) |
| Arts, Entertainment & Recreation | 0 (0.0%) | 0 (0.0%) |
| Accommodation & Food Services | 16 (48.5%) | 17 (51.5%) |
| Public Administration | 50 (72.5%) | 19 (27.5%) |
| Total | 570 (77.0%) | 170 (23.0%) |
Education in Wakefield
School Enrollment in Wakefield
The most common levels of schooling among the 276 students in Wakefield are college / undergraduate (117 | 42.4%), middle school (68 | 24.6%), and high school (44 | 15.9%).
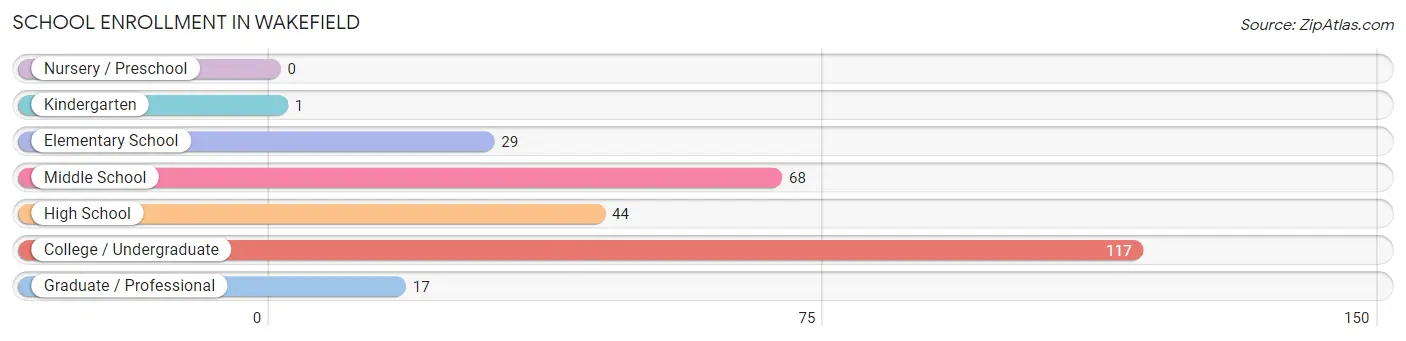
| School Level | # Students | % Students |
| Nursery / Preschool | 0 | 0.0% |
| Kindergarten | 1 | 0.4% |
| Elementary School | 29 | 10.5% |
| Middle School | 68 | 24.6% |
| High School | 44 | 15.9% |
| College / Undergraduate | 117 | 42.4% |
| Graduate / Professional | 17 | 6.2% |
| Total | 276 | 100.0% |
School Enrollment by Age by Funding Source in Wakefield
Out of a total of 276 students who are enrolled in schools in Wakefield, 75 (27.2%) attend a private institution, while the remaining 201 (72.8%) are enrolled in public schools. The age group of 35 years and over has the highest likelihood of being enrolled in private schools, with 13 (50.0% in the age bracket) enrolled. Conversely, the age group of 15 to 17 year olds has the lowest likelihood of being enrolled in a private school, with 13 (100.0% in the age bracket) attending a public institution.
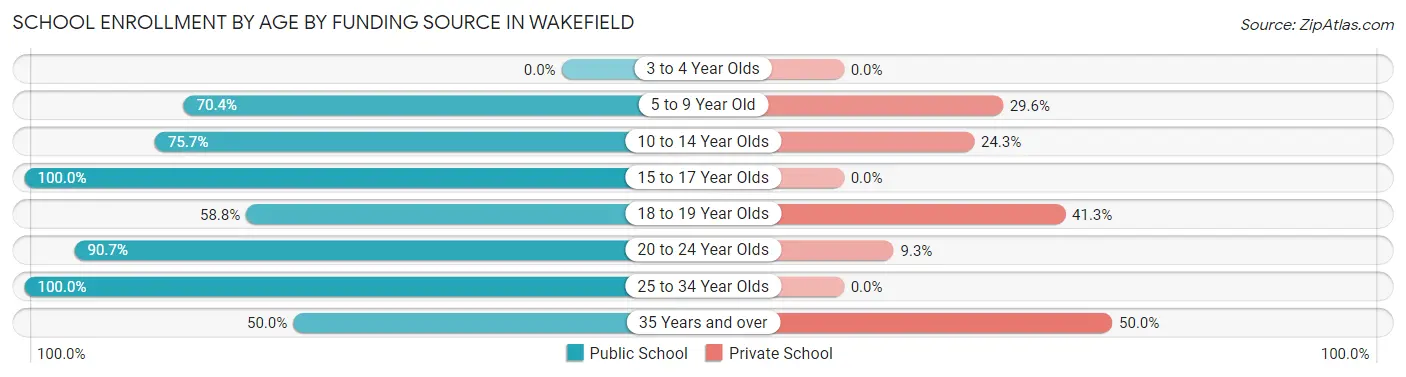
| Age Bracket | Public School | Private School |
| 3 to 4 Year Olds | 0 (0.0%) | 0 (0.0%) |
| 5 to 9 Year Old | 19 (70.4%) | 8 (29.6%) |
| 10 to 14 Year Olds | 53 (75.7%) | 17 (24.3%) |
| 15 to 17 Year Olds | 13 (100.0%) | 0 (0.0%) |
| 18 to 19 Year Olds | 47 (58.8%) | 33 (41.2%) |
| 20 to 24 Year Olds | 39 (90.7%) | 4 (9.3%) |
| 25 to 34 Year Olds | 17 (100.0%) | 0 (0.0%) |
| 35 Years and over | 13 (50.0%) | 13 (50.0%) |
| Total | 201 (72.8%) | 75 (27.2%) |
Educational Attainment by Field of Study in Wakefield
Arts & humanities (39 | 25.0%), communications (25 | 16.0%), education (17 | 10.9%), business (15 | 9.6%), and social sciences (14 | 9.0%) are the most common fields of study among 156 individuals in Wakefield who have obtained a bachelor's degree or higher.
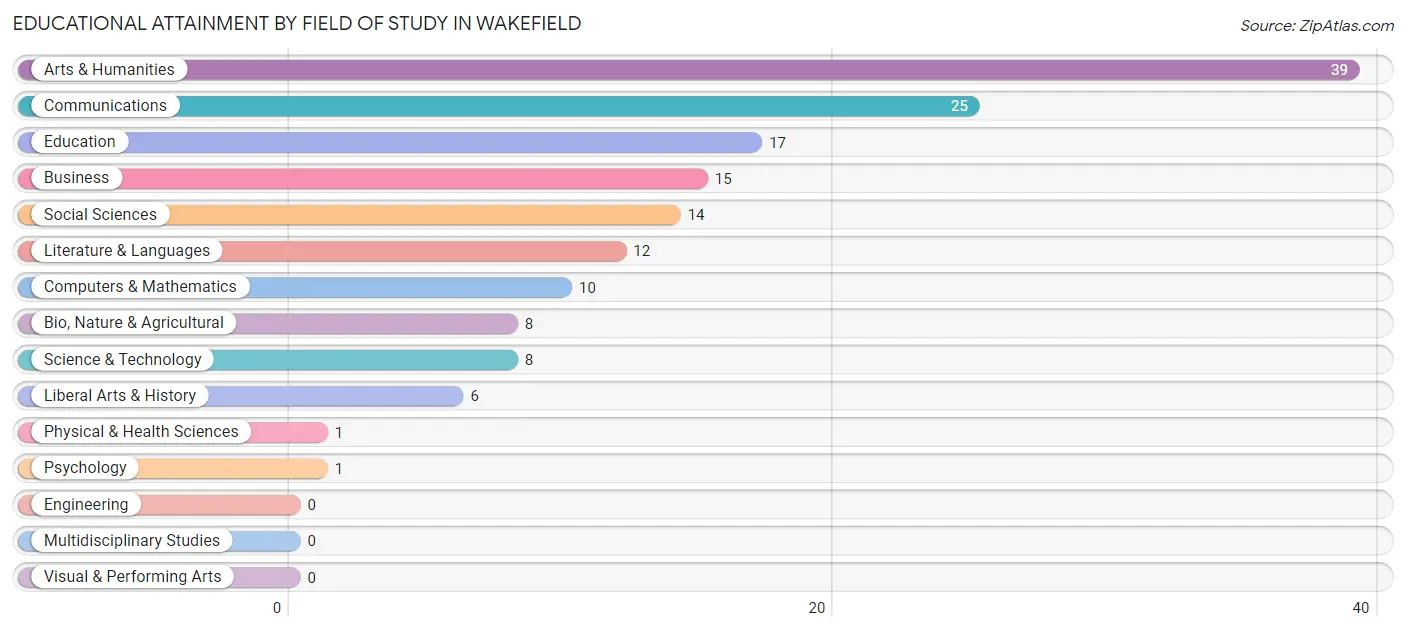
| Field of Study | # Graduates | % Graduates |
| Computers & Mathematics | 10 | 6.4% |
| Bio, Nature & Agricultural | 8 | 5.1% |
| Physical & Health Sciences | 1 | 0.6% |
| Psychology | 1 | 0.6% |
| Social Sciences | 14 | 9.0% |
| Engineering | 0 | 0.0% |
| Multidisciplinary Studies | 0 | 0.0% |
| Science & Technology | 8 | 5.1% |
| Business | 15 | 9.6% |
| Education | 17 | 10.9% |
| Literature & Languages | 12 | 7.7% |
| Liberal Arts & History | 6 | 3.8% |
| Visual & Performing Arts | 0 | 0.0% |
| Communications | 25 | 16.0% |
| Arts & Humanities | 39 | 25.0% |
| Total | 156 | 100.0% |
Transportation & Commute in Wakefield
Vehicle Availability by Sex in Wakefield
The most prevalent vehicle ownership categories in Wakefield are males with 4 vehicles (255, accounting for 45.4%) and females with 4 vehicles (24, making up 162.4%).
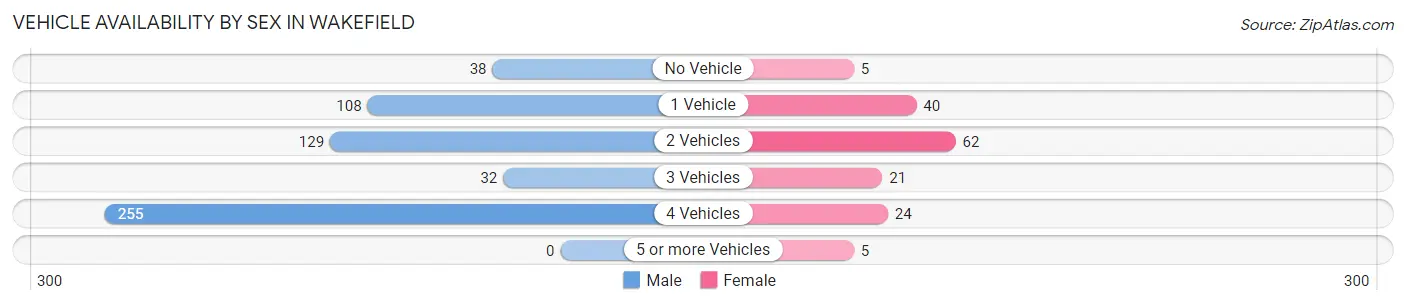
| Vehicles Available | Male | Female |
| No Vehicle | 38 (6.8%) | 5 (3.2%) |
| 1 Vehicle | 108 (19.2%) | 40 (25.5%) |
| 2 Vehicles | 129 (23.0%) | 62 (39.5%) |
| 3 Vehicles | 32 (5.7%) | 21 (13.4%) |
| 4 Vehicles | 255 (45.4%) | 24 (15.3%) |
| 5 or more Vehicles | 0 (0.0%) | 5 (3.2%) |
| Total | 562 (100.0%) | 157 (100.0%) |
Commute Time in Wakefield
The most frequently occuring commute durations in Wakefield are 45 to 59 minutes (320 commuters, 44.8%), 30 to 34 minutes (102 commuters, 14.3%), and 60 to 89 minutes (70 commuters, 9.8%).
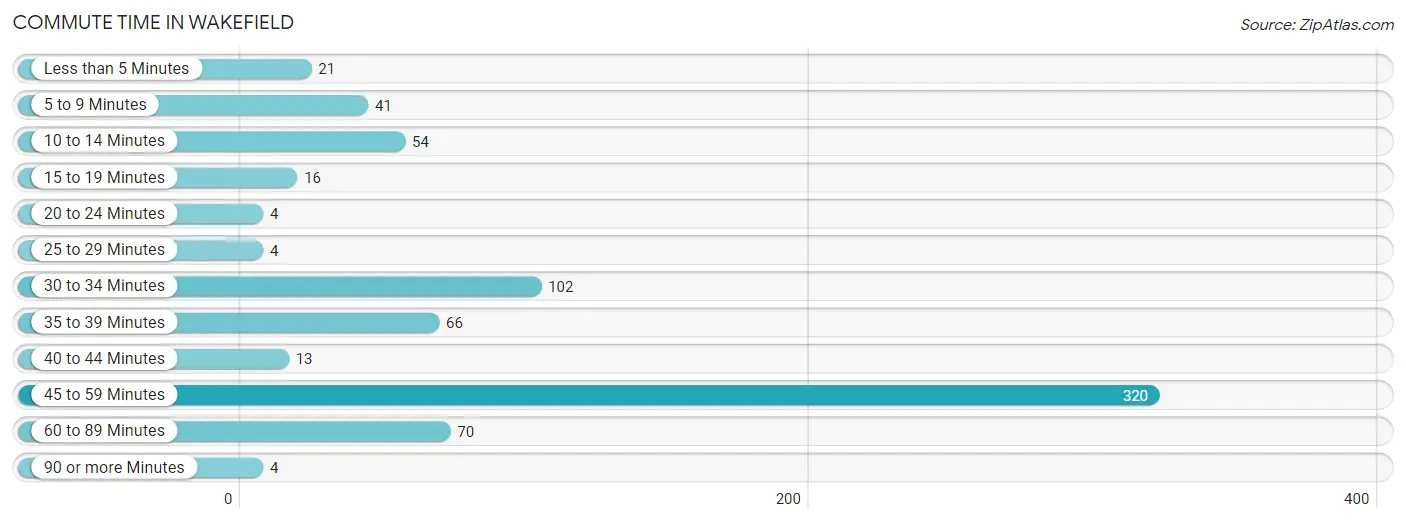
| Commute Time | # Commuters | % Commuters |
| Less than 5 Minutes | 21 | 2.9% |
| 5 to 9 Minutes | 41 | 5.7% |
| 10 to 14 Minutes | 54 | 7.5% |
| 15 to 19 Minutes | 16 | 2.2% |
| 20 to 24 Minutes | 4 | 0.6% |
| 25 to 29 Minutes | 4 | 0.6% |
| 30 to 34 Minutes | 102 | 14.3% |
| 35 to 39 Minutes | 66 | 9.2% |
| 40 to 44 Minutes | 13 | 1.8% |
| 45 to 59 Minutes | 320 | 44.8% |
| 60 to 89 Minutes | 70 | 9.8% |
| 90 or more Minutes | 4 | 0.6% |
Commute Time by Sex in Wakefield
The most common commute times in Wakefield are 45 to 59 minutes (308 commuters, 54.8%) for males and 10 to 14 minutes (34 commuters, 22.2%) for females.
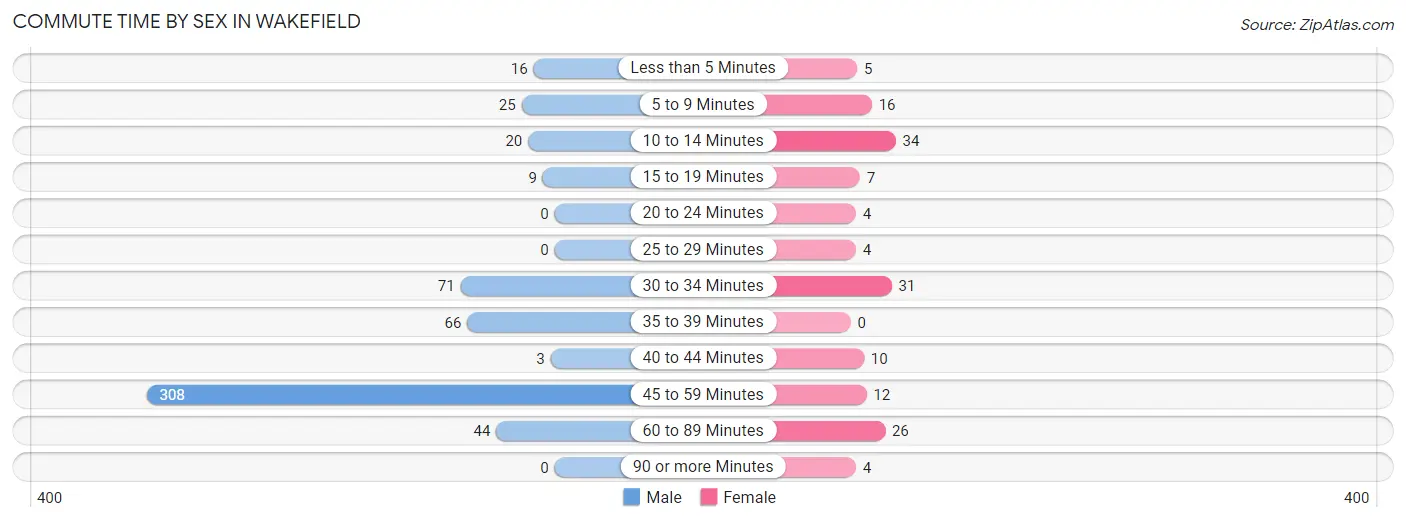
| Commute Time | Male | Female |
| Less than 5 Minutes | 16 (2.9%) | 5 (3.3%) |
| 5 to 9 Minutes | 25 (4.4%) | 16 (10.5%) |
| 10 to 14 Minutes | 20 (3.6%) | 34 (22.2%) |
| 15 to 19 Minutes | 9 (1.6%) | 7 (4.6%) |
| 20 to 24 Minutes | 0 (0.0%) | 4 (2.6%) |
| 25 to 29 Minutes | 0 (0.0%) | 4 (2.6%) |
| 30 to 34 Minutes | 71 (12.6%) | 31 (20.3%) |
| 35 to 39 Minutes | 66 (11.7%) | 0 (0.0%) |
| 40 to 44 Minutes | 3 (0.5%) | 10 (6.5%) |
| 45 to 59 Minutes | 308 (54.8%) | 12 (7.8%) |
| 60 to 89 Minutes | 44 (7.8%) | 26 (17.0%) |
| 90 or more Minutes | 0 (0.0%) | 4 (2.6%) |
Time of Departure to Work by Sex in Wakefield
The most frequent times of departure to work in Wakefield are 8:30 AM to 8:59 AM (209, 37.2%) for males and 6:00 AM to 6:29 AM (32, 20.9%) for females.
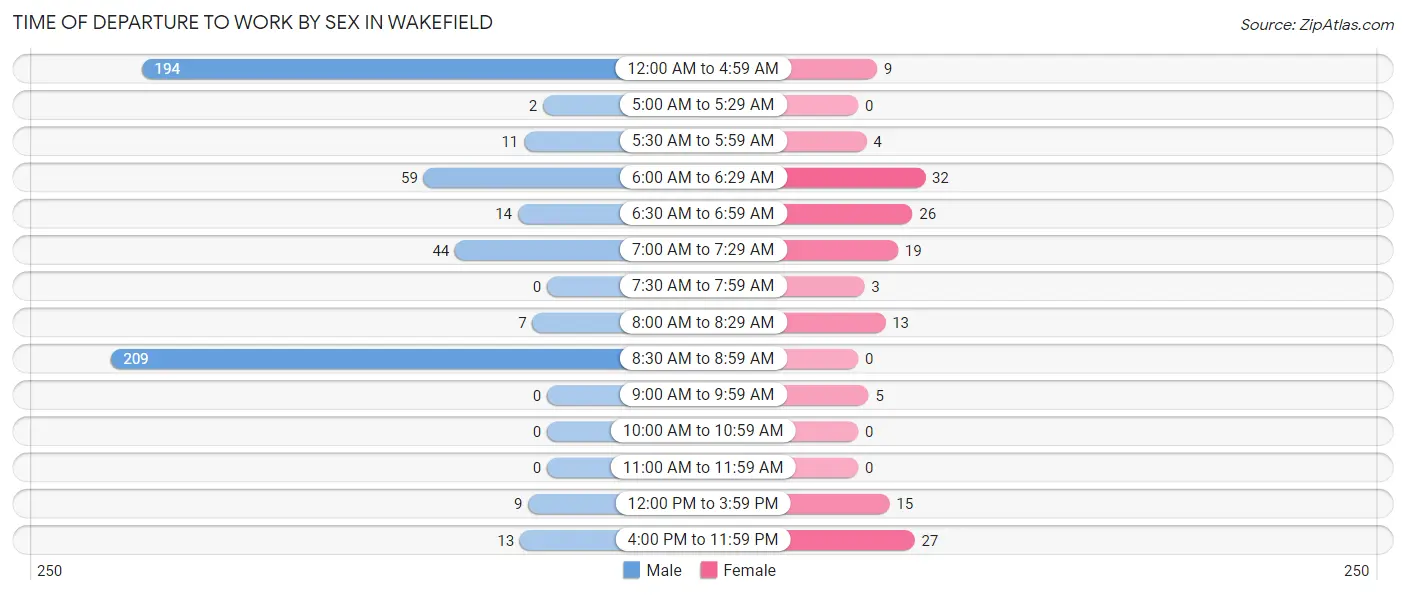
| Time of Departure | Male | Female |
| 12:00 AM to 4:59 AM | 194 (34.5%) | 9 (5.9%) |
| 5:00 AM to 5:29 AM | 2 (0.4%) | 0 (0.0%) |
| 5:30 AM to 5:59 AM | 11 (2.0%) | 4 (2.6%) |
| 6:00 AM to 6:29 AM | 59 (10.5%) | 32 (20.9%) |
| 6:30 AM to 6:59 AM | 14 (2.5%) | 26 (17.0%) |
| 7:00 AM to 7:29 AM | 44 (7.8%) | 19 (12.4%) |
| 7:30 AM to 7:59 AM | 0 (0.0%) | 3 (2.0%) |
| 8:00 AM to 8:29 AM | 7 (1.3%) | 13 (8.5%) |
| 8:30 AM to 8:59 AM | 209 (37.2%) | 0 (0.0%) |
| 9:00 AM to 9:59 AM | 0 (0.0%) | 5 (3.3%) |
| 10:00 AM to 10:59 AM | 0 (0.0%) | 0 (0.0%) |
| 11:00 AM to 11:59 AM | 0 (0.0%) | 0 (0.0%) |
| 12:00 PM to 3:59 PM | 9 (1.6%) | 15 (9.8%) |
| 4:00 PM to 11:59 PM | 13 (2.3%) | 27 (17.6%) |
| Total | 562 (100.0%) | 153 (100.0%) |
Housing Occupancy in Wakefield
Occupancy by Ownership in Wakefield
Of the total 389 dwellings in Wakefield, owner-occupied units account for 256 (65.8%), while renter-occupied units make up 133 (34.2%).
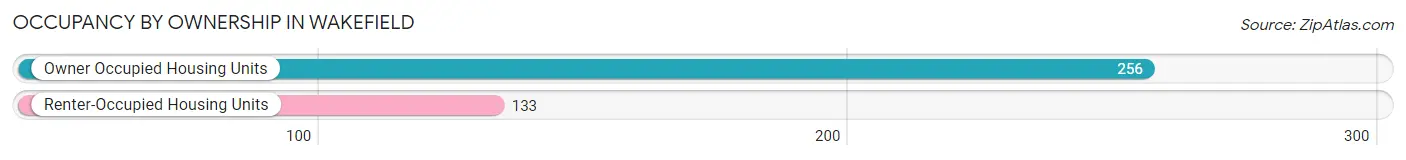
| Occupancy | # Housing Units | % Housing Units |
| Owner Occupied Housing Units | 256 | 65.8% |
| Renter-Occupied Housing Units | 133 | 34.2% |
| Total Occupied Housing Units | 389 | 100.0% |
Occupancy by Household Size in Wakefield
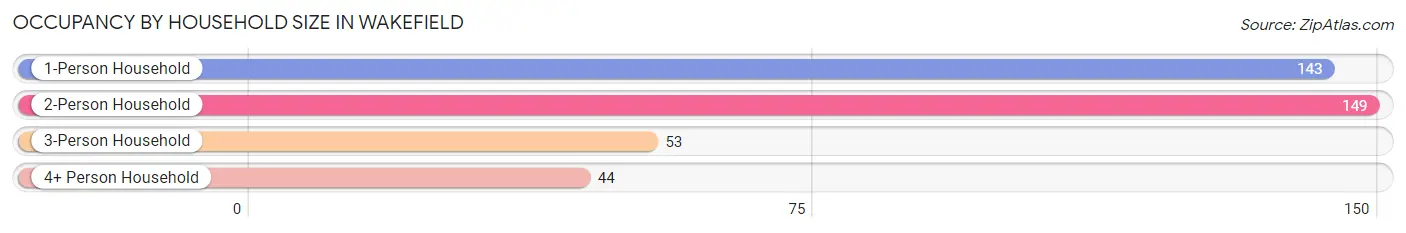
| Household Size | # Housing Units | % Housing Units |
| 1-Person Household | 143 | 36.8% |
| 2-Person Household | 149 | 38.3% |
| 3-Person Household | 53 | 13.6% |
| 4+ Person Household | 44 | 11.3% |
| Total Housing Units | 389 | 100.0% |
Occupancy by Ownership by Household Size in Wakefield
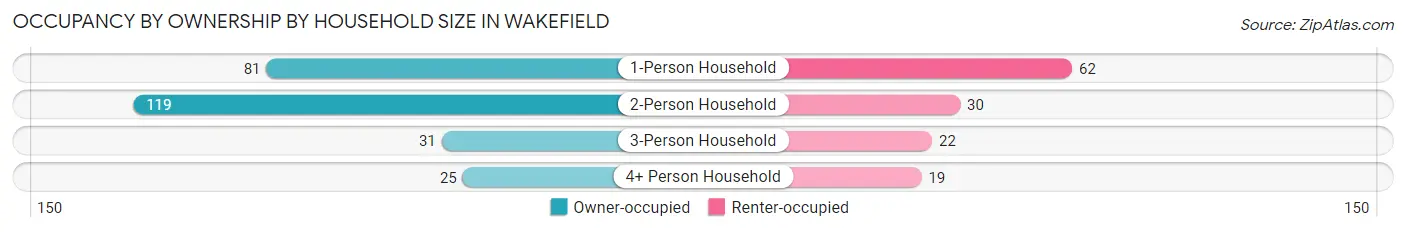
| Household Size | Owner-occupied | Renter-occupied |
| 1-Person Household | 81 (56.6%) | 62 (43.4%) |
| 2-Person Household | 119 (79.9%) | 30 (20.1%) |
| 3-Person Household | 31 (58.5%) | 22 (41.5%) |
| 4+ Person Household | 25 (56.8%) | 19 (43.2%) |
| Total Housing Units | 256 (65.8%) | 133 (34.2%) |
Occupancy by Educational Attainment in Wakefield
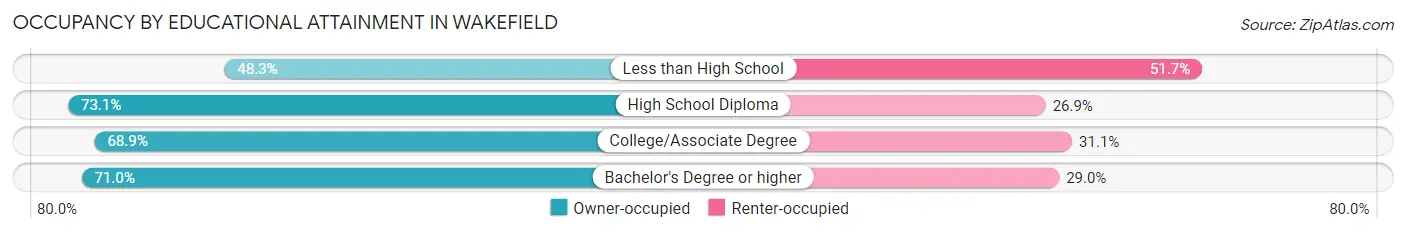
| Household Size | Owner-occupied | Renter-occupied |
| Less than High School | 43 (48.3%) | 46 (51.7%) |
| High School Diploma | 87 (73.1%) | 32 (26.9%) |
| College/Associate Degree | 82 (68.9%) | 37 (31.1%) |
| Bachelor's Degree or higher | 44 (71.0%) | 18 (29.0%) |
Occupancy by Age of Householder in Wakefield
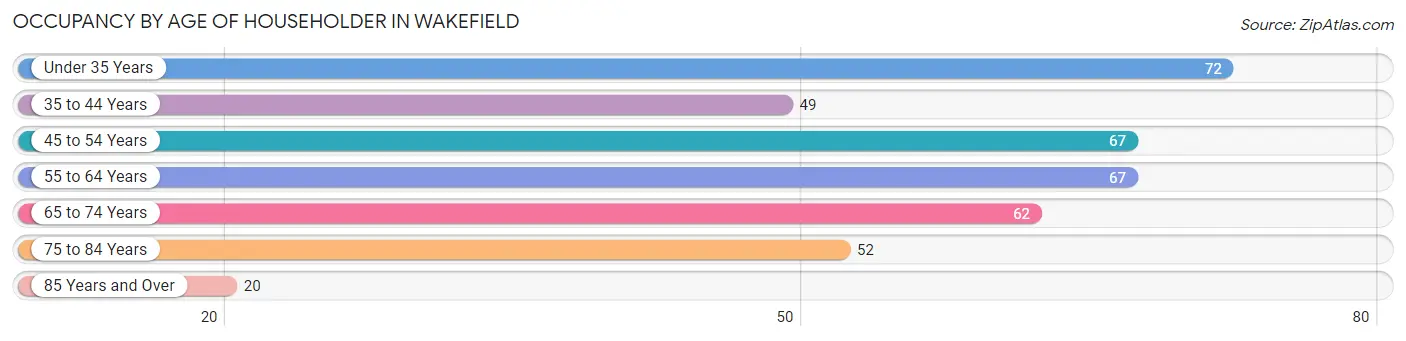
| Age Bracket | # Households | % Households |
| Under 35 Years | 72 | 18.5% |
| 35 to 44 Years | 49 | 12.6% |
| 45 to 54 Years | 67 | 17.2% |
| 55 to 64 Years | 67 | 17.2% |
| 65 to 74 Years | 62 | 15.9% |
| 75 to 84 Years | 52 | 13.4% |
| 85 Years and Over | 20 | 5.1% |
| Total | 389 | 100.0% |
Housing Finances in Wakefield
Median Income by Occupancy in Wakefield
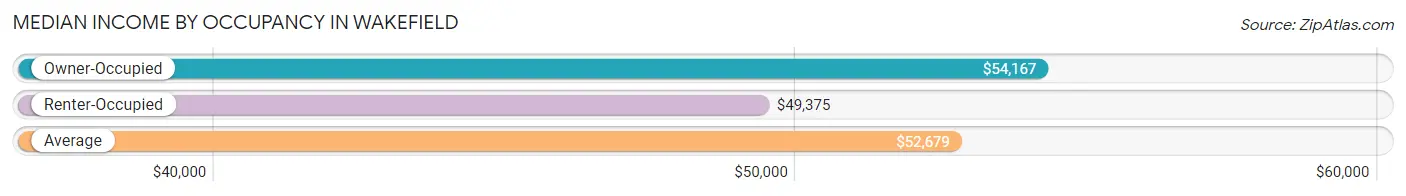
| Occupancy Type | # Households | Median Income |
| Owner-Occupied | 256 (65.8%) | $54,167 |
| Renter-Occupied | 133 (34.2%) | $49,375 |
| Average | 389 (100.0%) | $52,679 |
Occupancy by Householder Income Bracket in Wakefield
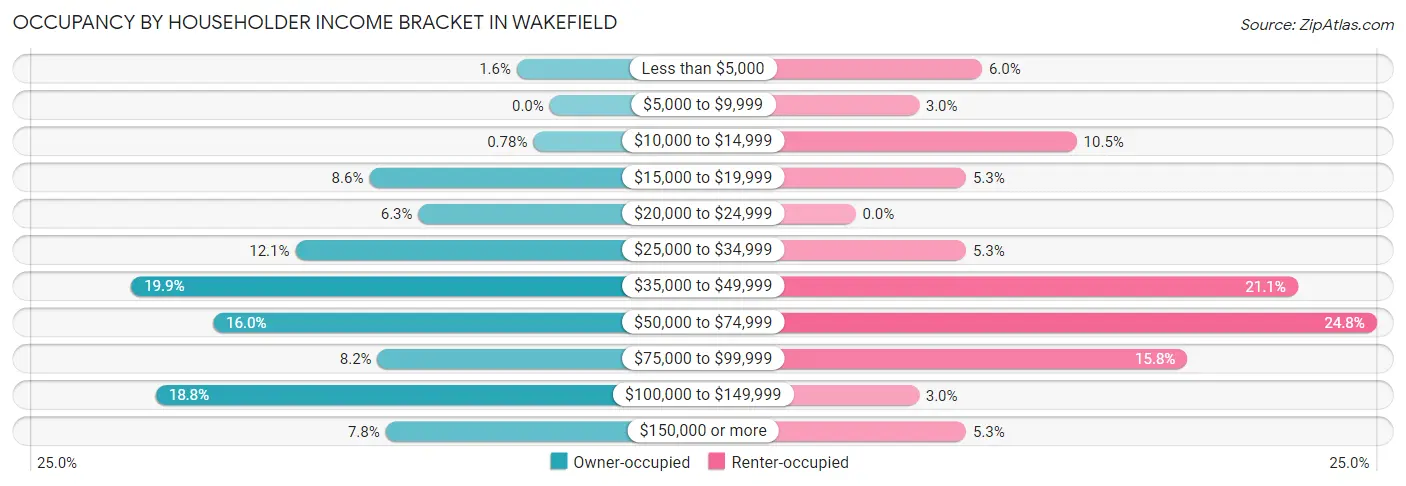
| Income Bracket | Owner-occupied | Renter-occupied |
| Less than $5,000 | 4 (1.6%) | 8 (6.0%) |
| $5,000 to $9,999 | 0 (0.0%) | 4 (3.0%) |
| $10,000 to $14,999 | 2 (0.8%) | 14 (10.5%) |
| $15,000 to $19,999 | 22 (8.6%) | 7 (5.3%) |
| $20,000 to $24,999 | 16 (6.2%) | 0 (0.0%) |
| $25,000 to $34,999 | 31 (12.1%) | 7 (5.3%) |
| $35,000 to $49,999 | 51 (19.9%) | 28 (21.0%) |
| $50,000 to $74,999 | 41 (16.0%) | 33 (24.8%) |
| $75,000 to $99,999 | 21 (8.2%) | 21 (15.8%) |
| $100,000 to $149,999 | 48 (18.8%) | 4 (3.0%) |
| $150,000 or more | 20 (7.8%) | 7 (5.3%) |
| Total | 256 (100.0%) | 133 (100.0%) |
Monthly Housing Cost Tiers in Wakefield
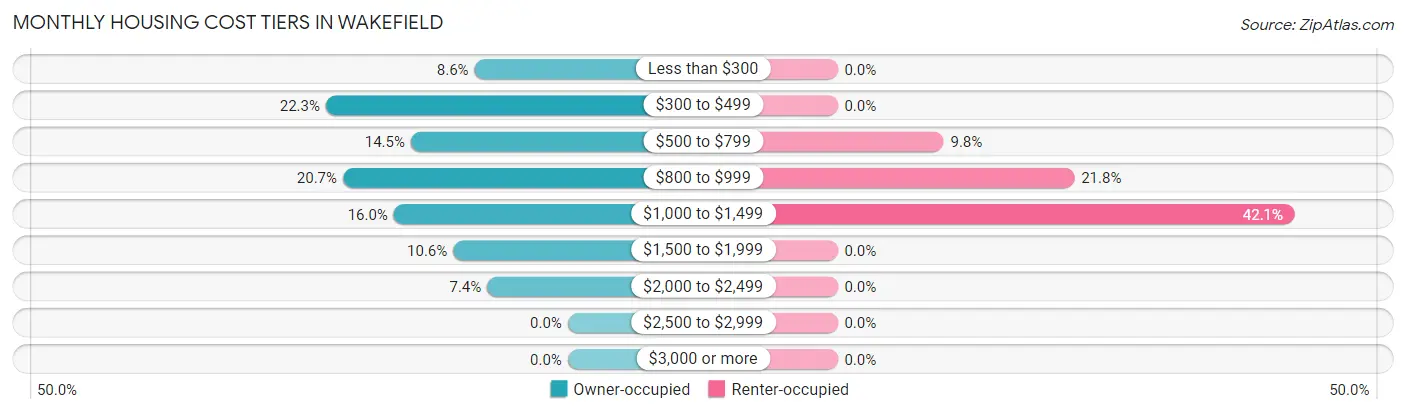
| Monthly Cost | Owner-occupied | Renter-occupied |
| Less than $300 | 22 (8.6%) | 0 (0.0%) |
| $300 to $499 | 57 (22.3%) | 0 (0.0%) |
| $500 to $799 | 37 (14.4%) | 13 (9.8%) |
| $800 to $999 | 53 (20.7%) | 29 (21.8%) |
| $1,000 to $1,499 | 41 (16.0%) | 56 (42.1%) |
| $1,500 to $1,999 | 27 (10.5%) | 0 (0.0%) |
| $2,000 to $2,499 | 19 (7.4%) | 0 (0.0%) |
| $2,500 to $2,999 | 0 (0.0%) | 0 (0.0%) |
| $3,000 or more | 0 (0.0%) | 0 (0.0%) |
| Total | 256 (100.0%) | 133 (100.0%) |
Physical Housing Characteristics in Wakefield
Housing Structures in Wakefield
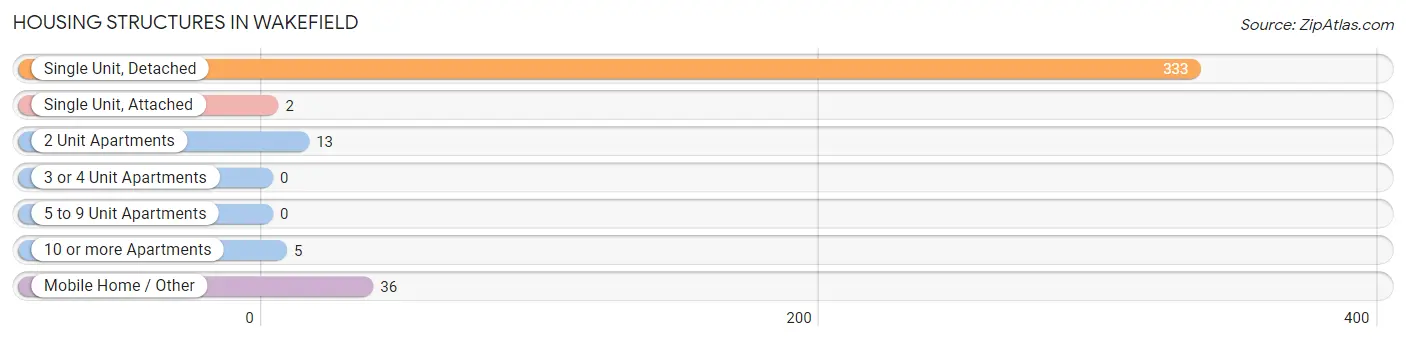
| Structure Type | # Housing Units | % Housing Units |
| Single Unit, Detached | 333 | 85.6% |
| Single Unit, Attached | 2 | 0.5% |
| 2 Unit Apartments | 13 | 3.3% |
| 3 or 4 Unit Apartments | 0 | 0.0% |
| 5 to 9 Unit Apartments | 0 | 0.0% |
| 10 or more Apartments | 5 | 1.3% |
| Mobile Home / Other | 36 | 9.2% |
| Total | 389 | 100.0% |
Housing Structures by Occupancy in Wakefield
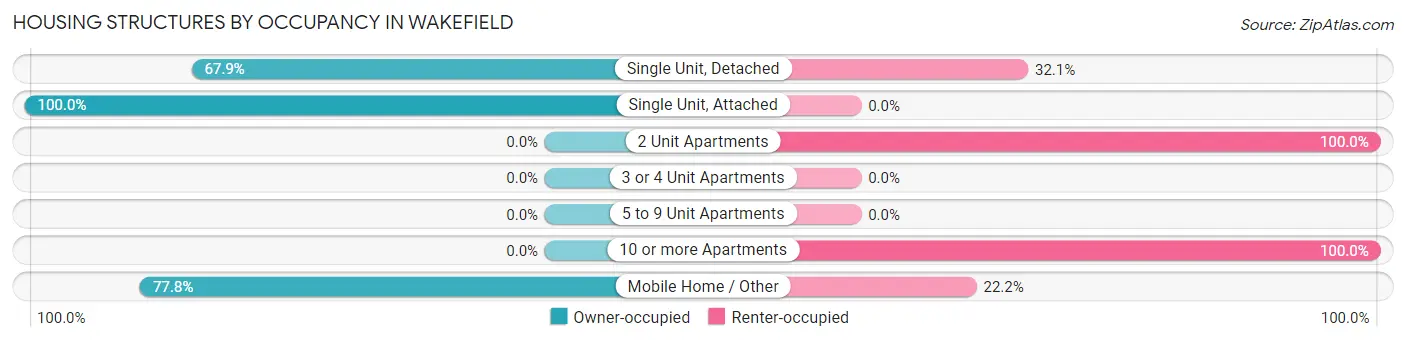
| Structure Type | Owner-occupied | Renter-occupied |
| Single Unit, Detached | 226 (67.9%) | 107 (32.1%) |
| Single Unit, Attached | 2 (100.0%) | 0 (0.0%) |
| 2 Unit Apartments | 0 (0.0%) | 13 (100.0%) |
| 3 or 4 Unit Apartments | 0 (0.0%) | 0 (0.0%) |
| 5 to 9 Unit Apartments | 0 (0.0%) | 0 (0.0%) |
| 10 or more Apartments | 0 (0.0%) | 5 (100.0%) |
| Mobile Home / Other | 28 (77.8%) | 8 (22.2%) |
| Total | 256 (65.8%) | 133 (34.2%) |
Housing Structures by Number of Rooms in Wakefield
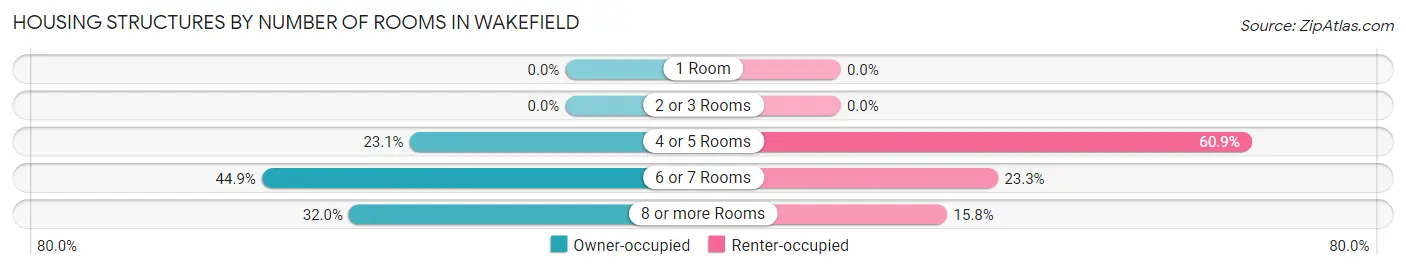
| Number of Rooms | Owner-occupied | Renter-occupied |
| 1 Room | 0 (0.0%) | 0 (0.0%) |
| 2 or 3 Rooms | 0 (0.0%) | 0 (0.0%) |
| 4 or 5 Rooms | 59 (23.1%) | 81 (60.9%) |
| 6 or 7 Rooms | 115 (44.9%) | 31 (23.3%) |
| 8 or more Rooms | 82 (32.0%) | 21 (15.8%) |
| Total | 256 (100.0%) | 133 (100.0%) |
Housing Structure by Heating Type in Wakefield
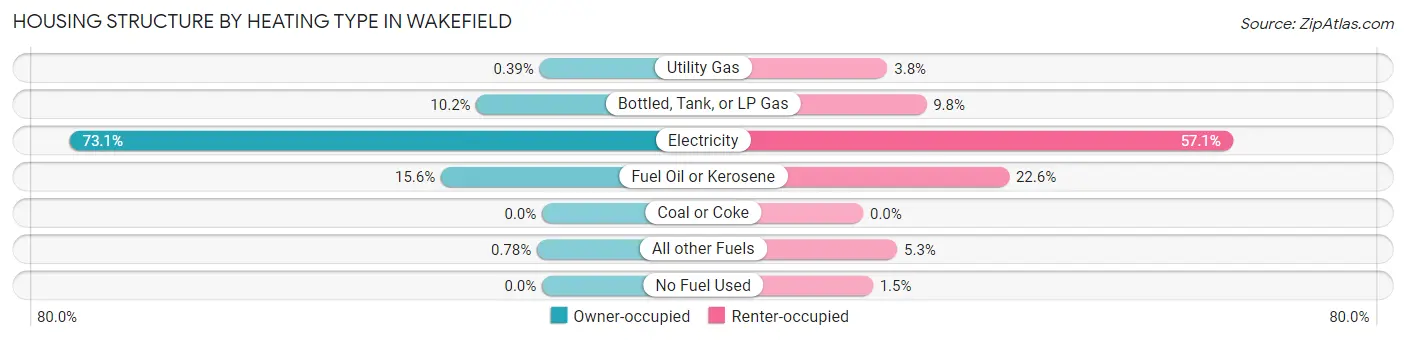
| Heating Type | Owner-occupied | Renter-occupied |
| Utility Gas | 1 (0.4%) | 5 (3.8%) |
| Bottled, Tank, or LP Gas | 26 (10.2%) | 13 (9.8%) |
| Electricity | 187 (73.1%) | 76 (57.1%) |
| Fuel Oil or Kerosene | 40 (15.6%) | 30 (22.6%) |
| Coal or Coke | 0 (0.0%) | 0 (0.0%) |
| All other Fuels | 2 (0.8%) | 7 (5.3%) |
| No Fuel Used | 0 (0.0%) | 2 (1.5%) |
| Total | 256 (100.0%) | 133 (100.0%) |
Household Vehicle Usage in Wakefield
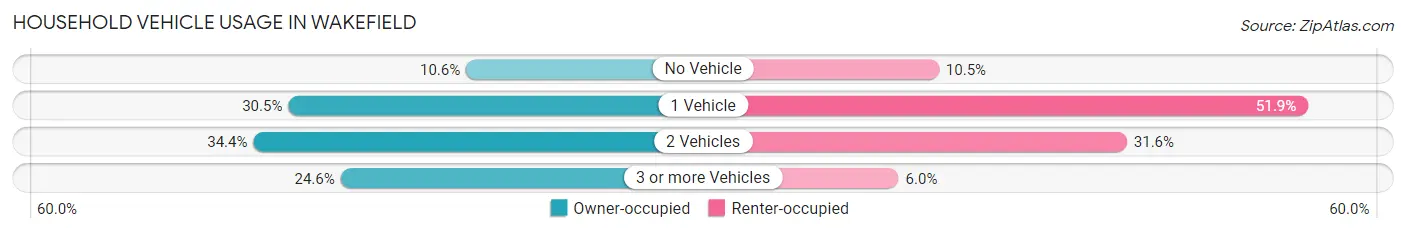
| Vehicles per Household | Owner-occupied | Renter-occupied |
| No Vehicle | 27 (10.5%) | 14 (10.5%) |
| 1 Vehicle | 78 (30.5%) | 69 (51.9%) |
| 2 Vehicles | 88 (34.4%) | 42 (31.6%) |
| 3 or more Vehicles | 63 (24.6%) | 8 (6.0%) |
| Total | 256 (100.0%) | 133 (100.0%) |
Real Estate & Mortgages in Wakefield
Real Estate and Mortgage Overview in Wakefield
| Characteristic | Without Mortgage | With Mortgage |
| Housing Units | 110 | 146 |
| Median Property Value | $111,100 | $146,900 |
| Median Household Income | $41,786 | $20 |
| Monthly Housing Costs | $423 | $0 |
| Real Estate Taxes | $635 | $11 |
Property Value by Mortgage Status in Wakefield
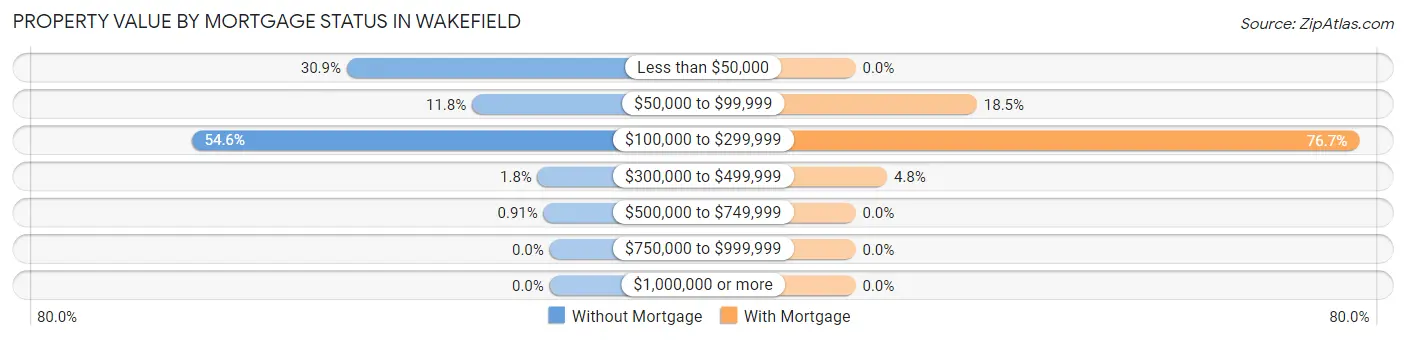
| Property Value | Without Mortgage | With Mortgage |
| Less than $50,000 | 34 (30.9%) | 0 (0.0%) |
| $50,000 to $99,999 | 13 (11.8%) | 27 (18.5%) |
| $100,000 to $299,999 | 60 (54.5%) | 112 (76.7%) |
| $300,000 to $499,999 | 2 (1.8%) | 7 (4.8%) |
| $500,000 to $749,999 | 1 (0.9%) | 0 (0.0%) |
| $750,000 to $999,999 | 0 (0.0%) | 0 (0.0%) |
| $1,000,000 or more | 0 (0.0%) | 0 (0.0%) |
| Total | 110 (100.0%) | 146 (100.0%) |
Household Income by Mortgage Status in Wakefield
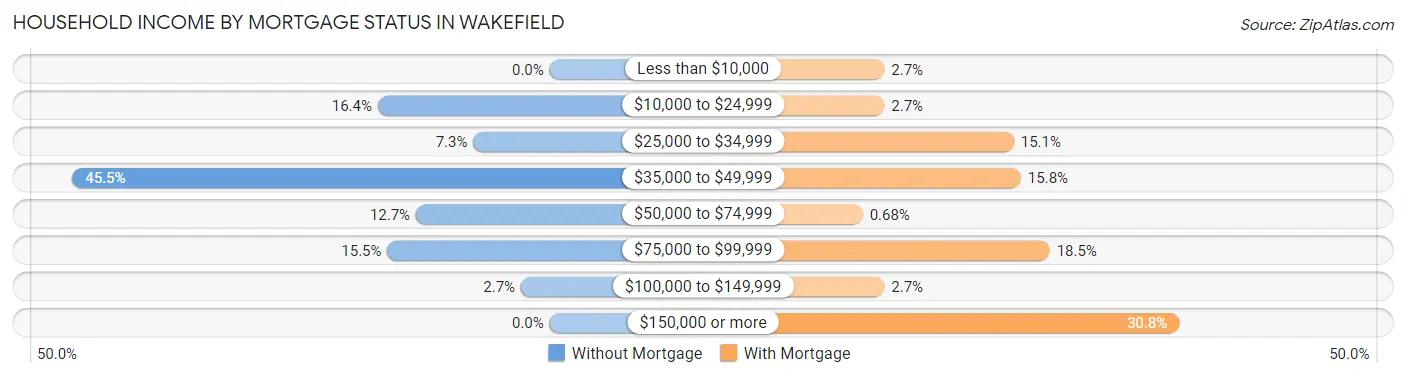
| Household Income | Without Mortgage | With Mortgage |
| Less than $10,000 | 0 (0.0%) | 4 (2.7%) |
| $10,000 to $24,999 | 18 (16.4%) | 4 (2.7%) |
| $25,000 to $34,999 | 8 (7.3%) | 22 (15.1%) |
| $35,000 to $49,999 | 50 (45.5%) | 23 (15.8%) |
| $50,000 to $74,999 | 14 (12.7%) | 1 (0.7%) |
| $75,000 to $99,999 | 17 (15.4%) | 27 (18.5%) |
| $100,000 to $149,999 | 3 (2.7%) | 4 (2.7%) |
| $150,000 or more | 0 (0.0%) | 45 (30.8%) |
| Total | 110 (100.0%) | 146 (100.0%) |
Property Value to Household Income Ratio in Wakefield
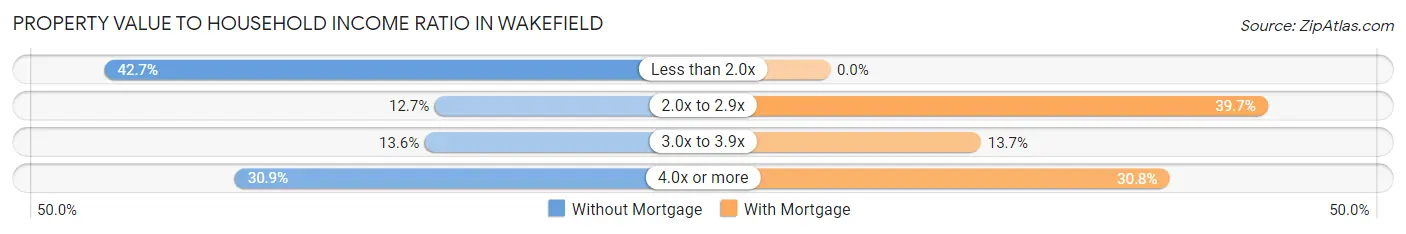
| Value-to-Income Ratio | Without Mortgage | With Mortgage |
| Less than 2.0x | 47 (42.7%) | 0 (0.0%) |
| 2.0x to 2.9x | 14 (12.7%) | 58 (39.7%) |
| 3.0x to 3.9x | 15 (13.6%) | 20 (13.7%) |
| 4.0x or more | 34 (30.9%) | 45 (30.8%) |
| Total | 110 (100.0%) | 146 (100.0%) |
Real Estate Taxes by Mortgage Status in Wakefield
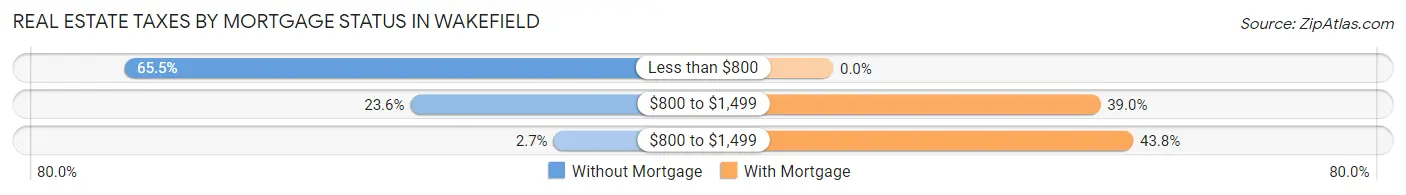
| Property Taxes | Without Mortgage | With Mortgage |
| Less than $800 | 72 (65.4%) | 0 (0.0%) |
| $800 to $1,499 | 26 (23.6%) | 57 (39.0%) |
| $800 to $1,499 | 3 (2.7%) | 64 (43.8%) |
| Total | 110 (100.0%) | 146 (100.0%) |
Health & Disability in Wakefield
Health Insurance Coverage by Age in Wakefield
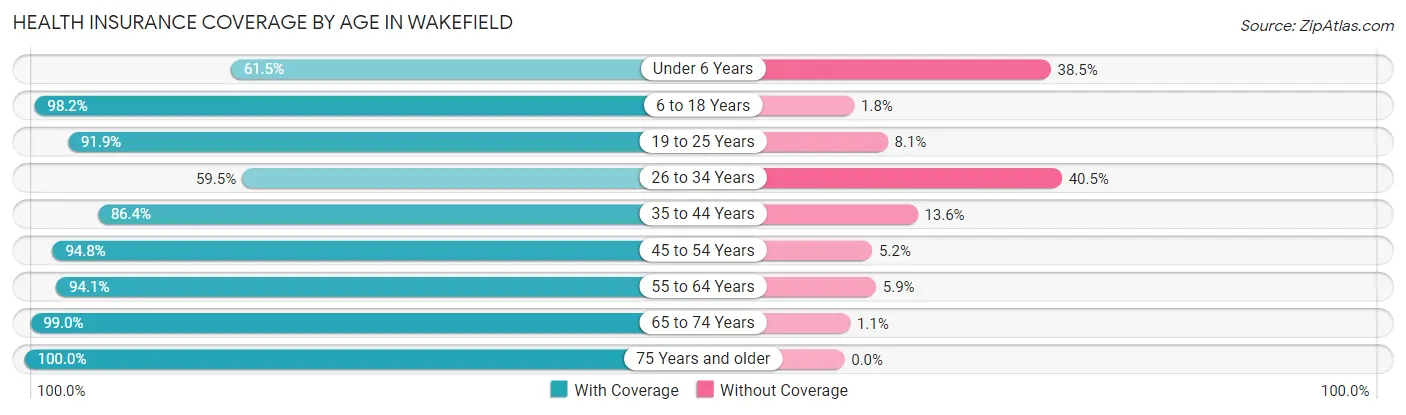
| Age Bracket | With Coverage | Without Coverage |
| Under 6 Years | 16 (61.5%) | 10 (38.5%) |
| 6 to 18 Years | 161 (98.2%) | 3 (1.8%) |
| 19 to 25 Years | 330 (91.9%) | 29 (8.1%) |
| 26 to 34 Years | 88 (59.5%) | 60 (40.5%) |
| 35 to 44 Years | 76 (86.4%) | 12 (13.6%) |
| 45 to 54 Years | 164 (94.8%) | 9 (5.2%) |
| 55 to 64 Years | 112 (94.1%) | 7 (5.9%) |
| 65 to 74 Years | 94 (99.0%) | 1 (1.1%) |
| 75 Years and older | 108 (100.0%) | 0 (0.0%) |
| Total | 1,149 (89.8%) | 131 (10.2%) |
Health Insurance Coverage by Citizenship Status in Wakefield
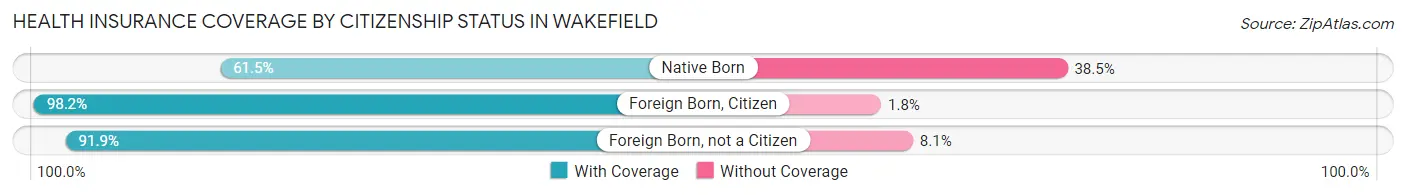
| Citizenship Status | With Coverage | Without Coverage |
| Native Born | 16 (61.5%) | 10 (38.5%) |
| Foreign Born, Citizen | 161 (98.2%) | 3 (1.8%) |
| Foreign Born, not a Citizen | 330 (91.9%) | 29 (8.1%) |
Health Insurance Coverage by Household Income in Wakefield
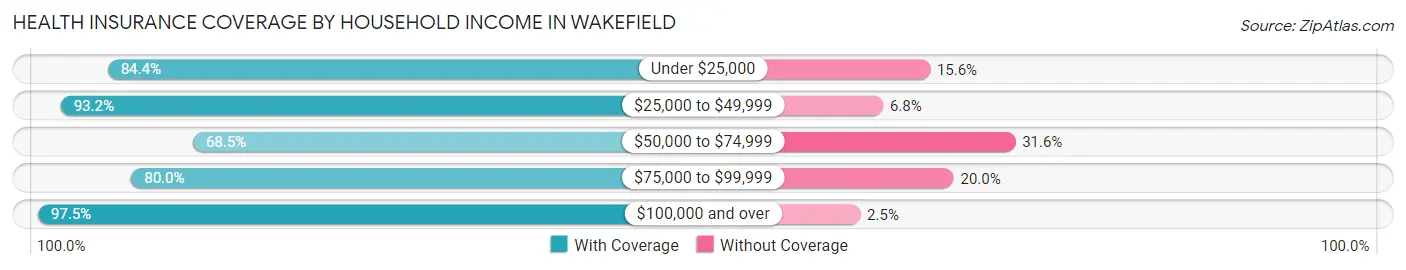
| Household Income | With Coverage | Without Coverage |
| Under $25,000 | 65 (84.4%) | 12 (15.6%) |
| $25,000 to $49,999 | 220 (93.2%) | 16 (6.8%) |
| $50,000 to $74,999 | 141 (68.4%) | 65 (31.6%) |
| $75,000 to $99,999 | 88 (80.0%) | 22 (20.0%) |
| $100,000 and over | 623 (97.5%) | 16 (2.5%) |
Public vs Private Health Insurance Coverage by Age in Wakefield
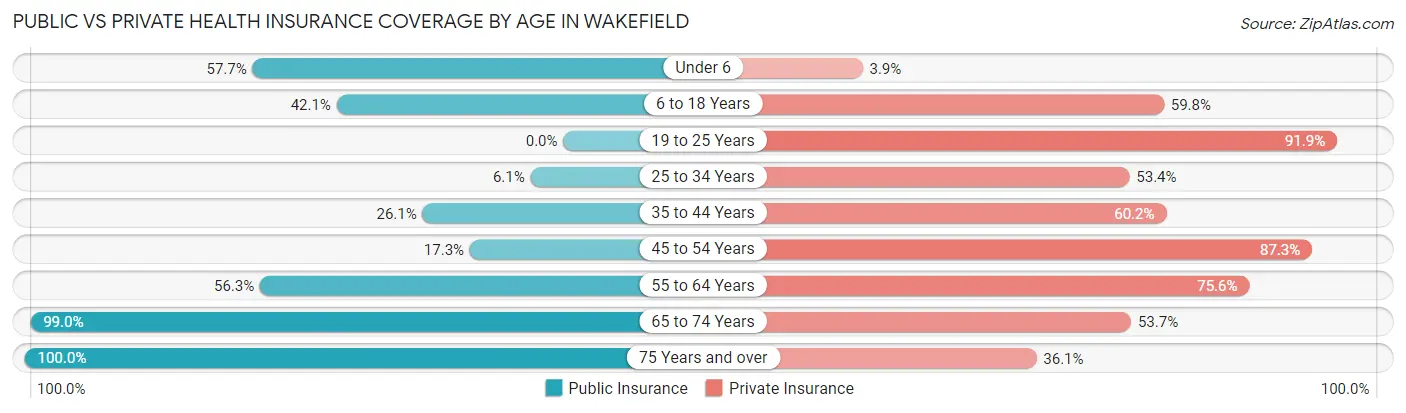
| Age Bracket | Public Insurance | Private Insurance |
| Under 6 | 15 (57.7%) | 1 (3.8%) |
| 6 to 18 Years | 69 (42.1%) | 98 (59.8%) |
| 19 to 25 Years | 0 (0.0%) | 330 (91.9%) |
| 25 to 34 Years | 9 (6.1%) | 79 (53.4%) |
| 35 to 44 Years | 23 (26.1%) | 53 (60.2%) |
| 45 to 54 Years | 30 (17.3%) | 151 (87.3%) |
| 55 to 64 Years | 67 (56.3%) | 90 (75.6%) |
| 65 to 74 Years | 94 (99.0%) | 51 (53.7%) |
| 75 Years and over | 108 (100.0%) | 39 (36.1%) |
| Total | 415 (32.4%) | 892 (69.7%) |
Disability Status by Sex by Age in Wakefield
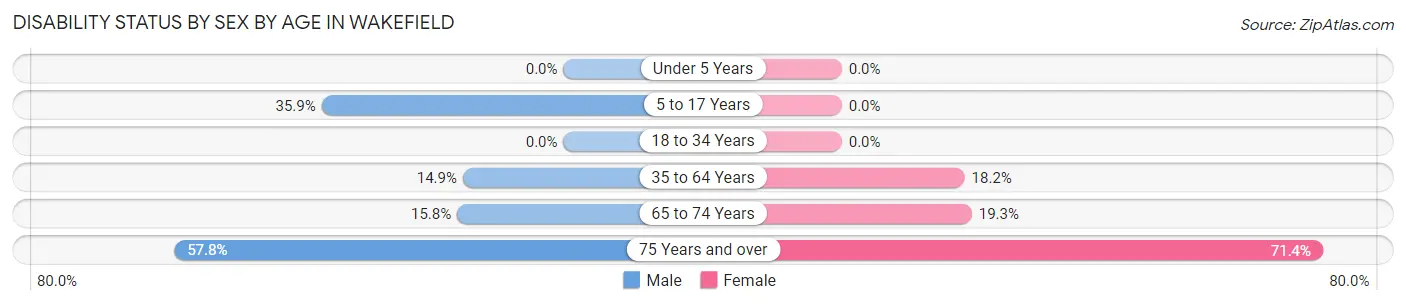
| Age Bracket | Male | Female |
| Under 5 Years | 0 (0.0%) | 0 (0.0%) |
| 5 to 17 Years | 14 (35.9%) | 0 (0.0%) |
| 18 to 34 Years | 0 (0.0%) | 0 (0.0%) |
| 35 to 64 Years | 33 (14.9%) | 29 (18.2%) |
| 65 to 74 Years | 6 (15.8%) | 11 (19.3%) |
| 75 Years and over | 26 (57.8%) | 45 (71.4%) |
Disability Class by Sex by Age in Wakefield
Disability Class: Hearing Difficulty
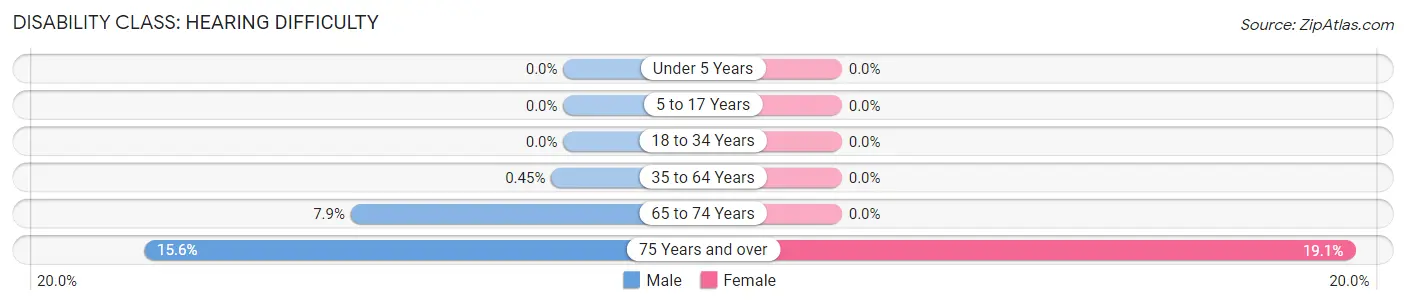
| Age Bracket | Male | Female |
| Under 5 Years | 0 (0.0%) | 0 (0.0%) |
| 5 to 17 Years | 0 (0.0%) | 0 (0.0%) |
| 18 to 34 Years | 0 (0.0%) | 0 (0.0%) |
| 35 to 64 Years | 1 (0.4%) | 0 (0.0%) |
| 65 to 74 Years | 3 (7.9%) | 0 (0.0%) |
| 75 Years and over | 7 (15.6%) | 12 (19.1%) |
Disability Class: Vision Difficulty
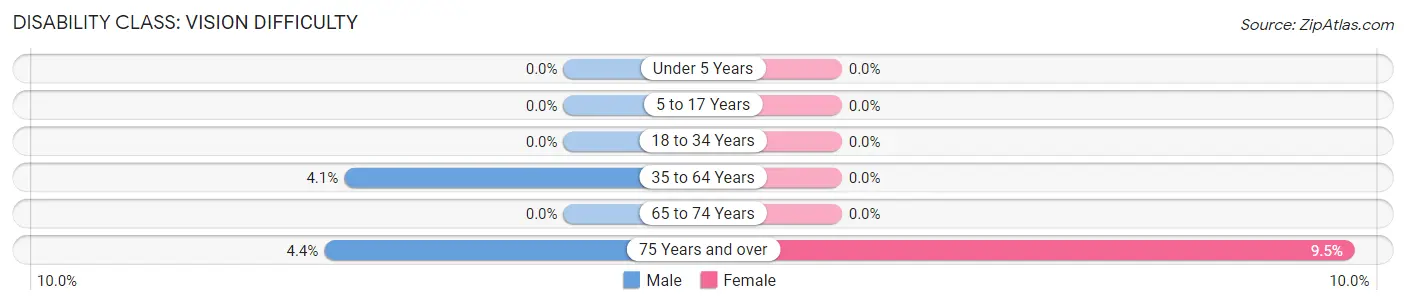
| Age Bracket | Male | Female |
| Under 5 Years | 0 (0.0%) | 0 (0.0%) |
| 5 to 17 Years | 0 (0.0%) | 0 (0.0%) |
| 18 to 34 Years | 0 (0.0%) | 0 (0.0%) |
| 35 to 64 Years | 9 (4.1%) | 0 (0.0%) |
| 65 to 74 Years | 0 (0.0%) | 0 (0.0%) |
| 75 Years and over | 2 (4.4%) | 6 (9.5%) |
Disability Class: Cognitive Difficulty
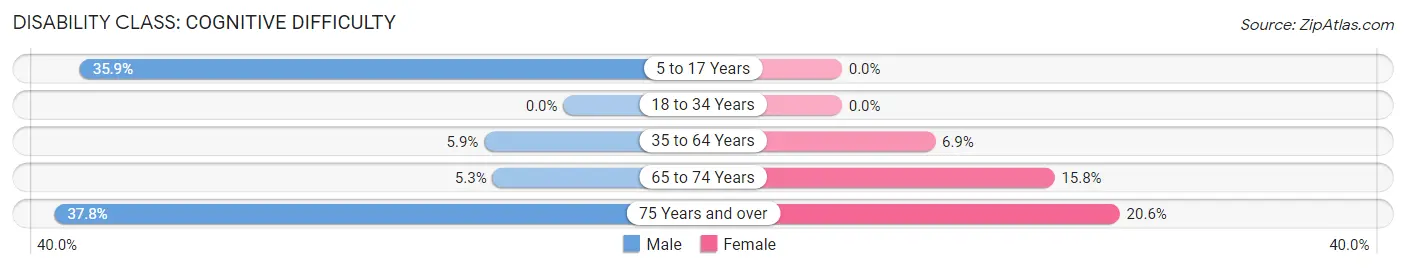
| Age Bracket | Male | Female |
| 5 to 17 Years | 14 (35.9%) | 0 (0.0%) |
| 18 to 34 Years | 0 (0.0%) | 0 (0.0%) |
| 35 to 64 Years | 13 (5.9%) | 11 (6.9%) |
| 65 to 74 Years | 2 (5.3%) | 9 (15.8%) |
| 75 Years and over | 17 (37.8%) | 13 (20.6%) |
Disability Class: Ambulatory Difficulty
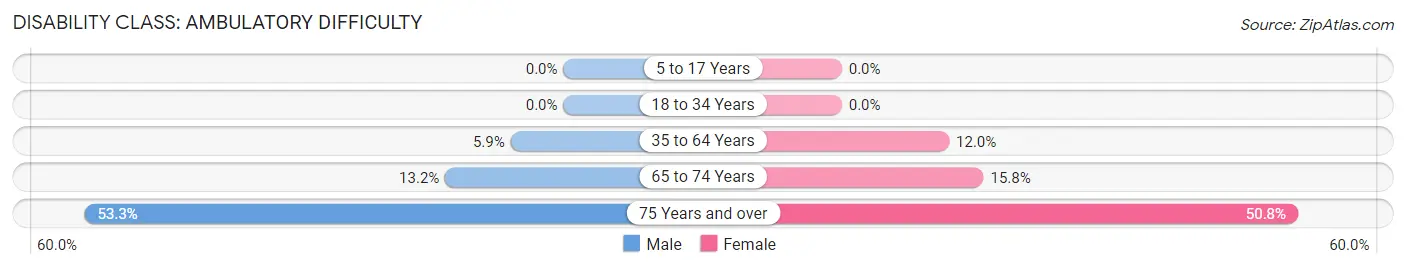
| Age Bracket | Male | Female |
| 5 to 17 Years | 0 (0.0%) | 0 (0.0%) |
| 18 to 34 Years | 0 (0.0%) | 0 (0.0%) |
| 35 to 64 Years | 13 (5.9%) | 19 (11.9%) |
| 65 to 74 Years | 5 (13.2%) | 9 (15.8%) |
| 75 Years and over | 24 (53.3%) | 32 (50.8%) |
Disability Class: Self-Care Difficulty
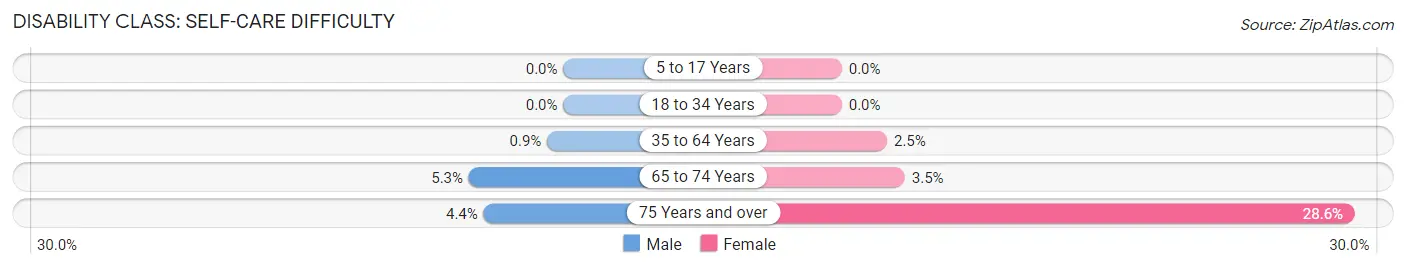
| Age Bracket | Male | Female |
| 5 to 17 Years | 0 (0.0%) | 0 (0.0%) |
| 18 to 34 Years | 0 (0.0%) | 0 (0.0%) |
| 35 to 64 Years | 2 (0.9%) | 4 (2.5%) |
| 65 to 74 Years | 2 (5.3%) | 2 (3.5%) |
| 75 Years and over | 2 (4.4%) | 18 (28.6%) |
Technology Access in Wakefield
Computing Device Access in Wakefield
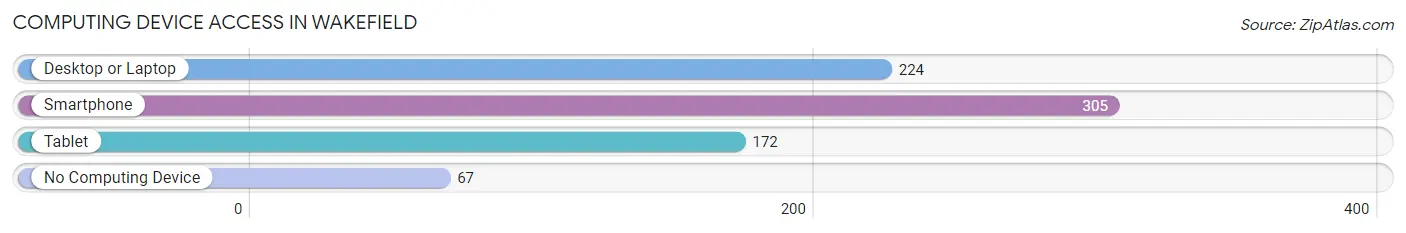
| Device Type | # Households | % Households |
| Desktop or Laptop | 224 | 57.6% |
| Smartphone | 305 | 78.4% |
| Tablet | 172 | 44.2% |
| No Computing Device | 67 | 17.2% |
| Total | 389 | 100.0% |
Internet Access in Wakefield
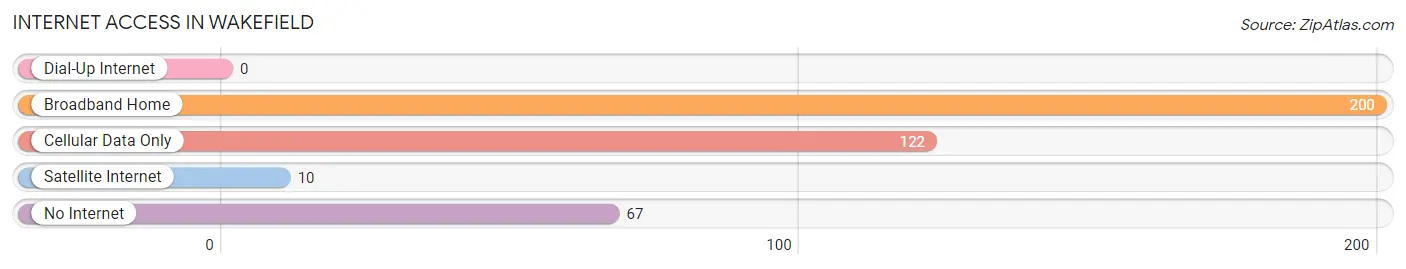
| Internet Type | # Households | % Households |
| Dial-Up Internet | 0 | 0.0% |
| Broadband Home | 200 | 51.4% |
| Cellular Data Only | 122 | 31.4% |
| Satellite Internet | 10 | 2.6% |
| No Internet | 67 | 17.2% |
| Total | 389 | 100.0% |
Wakefield Summary
Wakefield is a town located in the Commonwealth of Virginia in the United States. It is situated in the northern part of the state, in the county of Sussex, and is part of the Hampton Roads metropolitan area. The town has a population of approximately 1,500 people, and is located on the banks of the Blackwater River.
History
The area that is now Wakefield was first settled in the early 1700s by English colonists. The town was originally known as Wakefield Court House, and was established in 1752. The town was named after the Wakefield family, who were prominent landowners in the area. The town was the county seat of Sussex County until 1871, when the county seat was moved to Waverly.
In the late 1800s, Wakefield began to grow and develop as a commercial center. The town was home to several stores, a bank, a post office, and a railroad station. The town also had a thriving lumber industry, and was home to several sawmills.
In the early 1900s, Wakefield experienced a period of decline. The lumber industry had declined, and the railroad station had closed. The town was also hit hard by the Great Depression. However, in the 1950s, the town began to experience a resurgence. The town was revitalized by the construction of a new highway, and the opening of a new shopping center.
Geography
Wakefield is located in the northern part of Virginia, in the county of Sussex. The town is situated on the banks of the Blackwater River, and is surrounded by rolling hills and forests. The town is located approximately 30 miles south of Richmond, and is part of the Hampton Roads metropolitan area.
The climate in Wakefield is humid subtropical, with hot, humid summers and mild winters. The average annual temperature is around 60 degrees Fahrenheit. The town receives an average of 45 inches of precipitation per year.
Economy
The economy of Wakefield is largely based on agriculture and tourism. The town is home to several farms, and is a popular destination for tourists. The town is also home to several small businesses, including restaurants, shops, and a movie theater.
Demographics
As of the 2010 census, the population of Wakefield was 1,500 people. The racial makeup of the town was 79.3% White, 17.3% African American, 0.7% Native American, 0.7% Asian, and 1.7% from other races. The median household income was $37,500, and the median family income was $45,000. The town has a poverty rate of 16.7%.
Conclusion
Wakefield is a small town located in the northern part of Virginia. The town has a rich history, and is home to a diverse population. The economy of the town is largely based on agriculture and tourism, and the town is a popular destination for visitors. Wakefield is a great place to live, work, and visit.
Common Questions
What is Per Capita Income in Wakefield?
Per Capita income in Wakefield is $32,517.
What is the Median Family Income in Wakefield?
Median Family Income in Wakefield is $57,670.
What is the Median Household income in Wakefield?
Median Household Income in Wakefield is $52,679.
What is Income or Wage Gap in Wakefield?
Income or Wage Gap in Wakefield is 28.5%.
Women in Wakefield earn 71.5 cents for every dollar earned by a man.
What is Inequality or Gini Index in Wakefield?
Inequality or Gini Index in Wakefield is 0.43.
What is the Total Population of Wakefield?
Total Population of Wakefield is 1,286.
What is the Total Male Population of Wakefield?
Total Male Population of Wakefield is 810.
What is the Total Female Population of Wakefield?
Total Female Population of Wakefield is 476.
What is the Ratio of Males per 100 Females in Wakefield?
There are 170.17 Males per 100 Females in Wakefield.
What is the Ratio of Females per 100 Males in Wakefield?
There are 58.77 Females per 100 Males in Wakefield.
What is the Median Population Age in Wakefield?
Median Population Age in Wakefield is 29.3 Years.
What is the Average Family Size in Wakefield
Average Family Size in Wakefield is 4.4 People.
What is the Average Household Size in Wakefield
Average Household Size in Wakefield is 3.3 People.
How Large is the Labor Force in Wakefield?
There are 779 People in the Labor Forcein in Wakefield.
What is the Percentage of People in the Labor Force in Wakefield?
67.3% of People are in the Labor Force in Wakefield.
What is the Unemployment Rate in Wakefield?
Unemployment Rate in Wakefield is 4.3%.