Greenbush, VA Map & Demographics
Greenbush Map
Greenbush Overview
$21,558
PER CAPITA INCOME
$81,696
AVG FAMILY INCOME
$81,696
AVG HOUSEHOLD INCOME
23.6%
WAGE / INCOME GAP [ % ]
76.4¢/ $1
WAGE / INCOME GAP [ $ ]
0.10
INEQUALITY / GINI INDEX
149
TOTAL POPULATION
65
MALE POPULATION
84
FEMALE POPULATION
77.38
MALES / 100 FEMALES
129.23
FEMALES / 100 MALES
25.9
MEDIAN AGE
4.0
AVG FAMILY SIZE
4.3
AVG HOUSEHOLD SIZE
49
LABOR FORCE [ PEOPLE ]
49.0%
PERCENT IN LABOR FORCE
Greenbush Zip Codes
Greenbush Area Codes
Income in Greenbush
Income Overview in Greenbush
Per Capita Income in Greenbush is $21,558, while median incomes of families and households are $81,696 and $81,696 respectively.
| Characteristic | Number | Measure |
| Per Capita Income | 149 | $21,558 |
| Median Family Income | 35 | $81,696 |
| Mean Family Income | 35 | $82,780 |
| Median Household Income | 35 | $81,696 |
| Mean Household Income | 35 | $88,129 |
| Income Deficit | 35 | $0 |
| Wage / Income Gap (%) | 149 | 23.64% |
| Wage / Income Gap ($) | 149 | 76.36¢ per $1 |
| Gini / Inequality Index | 149 | 0.10 |
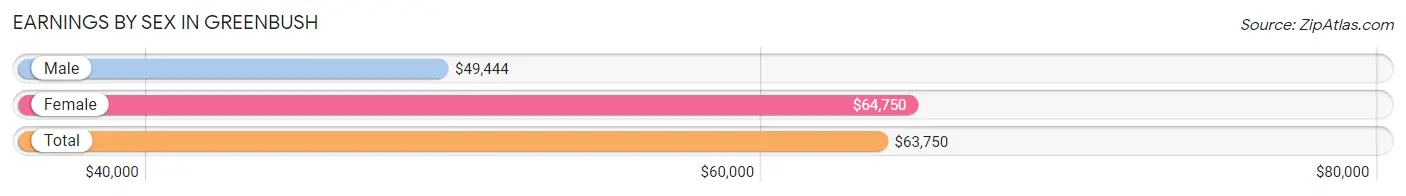
Earnings by Sex in Greenbush
Average Earnings in Greenbush are $63,750, $49,444 for men and $64,750 for women, a difference of 23.6%.
| Sex | Number | Average Earnings |
| Male | 20 (40.8%) | $49,444 |
| Female | 29 (59.2%) | $64,750 |
| Total | 49 (100.0%) | $63,750 |
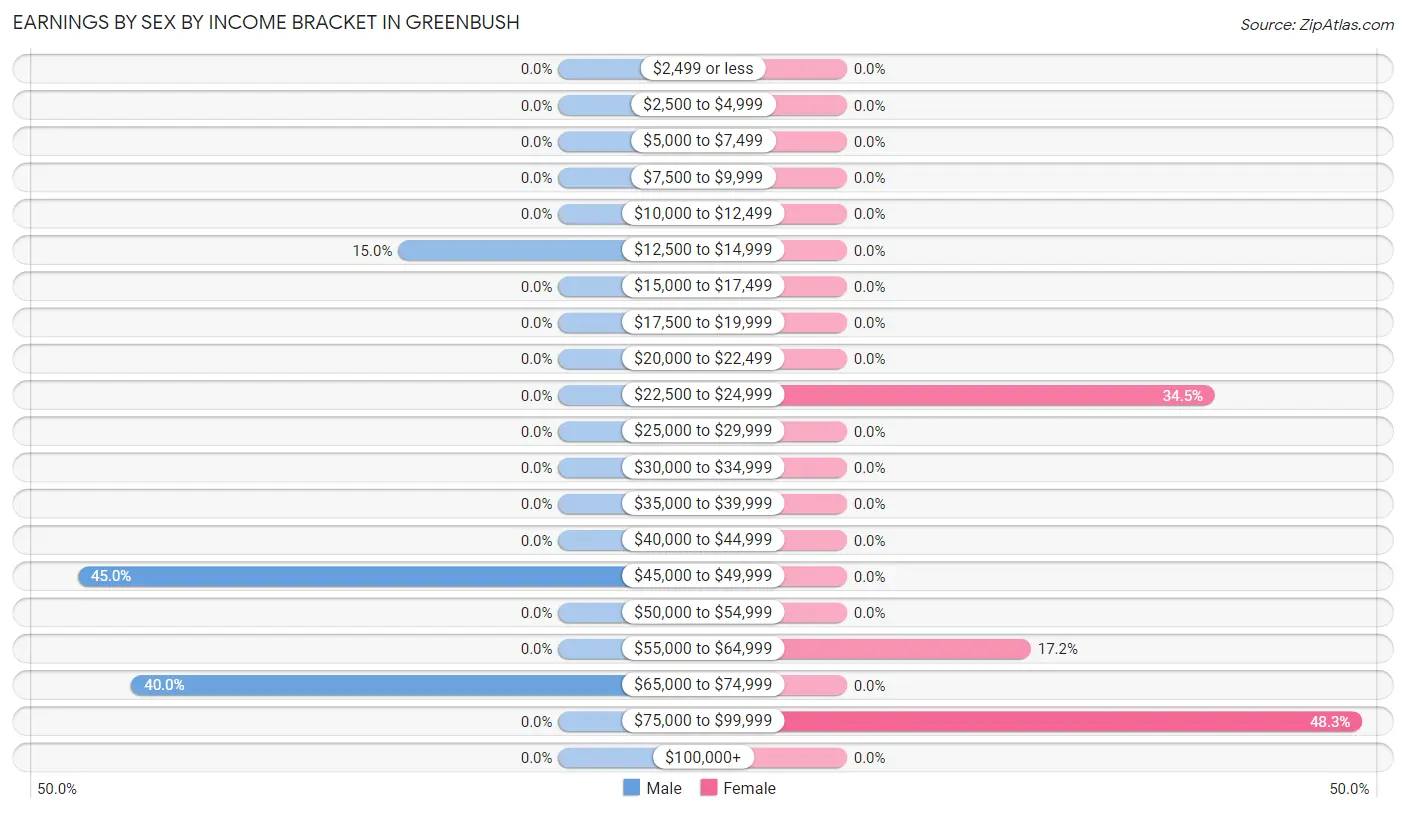
Earnings by Sex by Income Bracket in Greenbush
The most common earnings brackets in Greenbush are $45,000 to $49,999 for men (9 | 45.0%) and $75,000 to $99,999 for women (14 | 48.3%).
| Income | Male | Female |
| $2,499 or less | 0 (0.0%) | 0 (0.0%) |
| $2,500 to $4,999 | 0 (0.0%) | 0 (0.0%) |
| $5,000 to $7,499 | 0 (0.0%) | 0 (0.0%) |
| $7,500 to $9,999 | 0 (0.0%) | 0 (0.0%) |
| $10,000 to $12,499 | 0 (0.0%) | 0 (0.0%) |
| $12,500 to $14,999 | 3 (15.0%) | 0 (0.0%) |
| $15,000 to $17,499 | 0 (0.0%) | 0 (0.0%) |
| $17,500 to $19,999 | 0 (0.0%) | 0 (0.0%) |
| $20,000 to $22,499 | 0 (0.0%) | 0 (0.0%) |
| $22,500 to $24,999 | 0 (0.0%) | 10 (34.5%) |
| $25,000 to $29,999 | 0 (0.0%) | 0 (0.0%) |
| $30,000 to $34,999 | 0 (0.0%) | 0 (0.0%) |
| $35,000 to $39,999 | 0 (0.0%) | 0 (0.0%) |
| $40,000 to $44,999 | 0 (0.0%) | 0 (0.0%) |
| $45,000 to $49,999 | 9 (45.0%) | 0 (0.0%) |
| $50,000 to $54,999 | 0 (0.0%) | 0 (0.0%) |
| $55,000 to $64,999 | 0 (0.0%) | 5 (17.2%) |
| $65,000 to $74,999 | 8 (40.0%) | 0 (0.0%) |
| $75,000 to $99,999 | 0 (0.0%) | 14 (48.3%) |
| $100,000+ | 0 (0.0%) | 0 (0.0%) |
| Total | 20 (100.0%) | 29 (100.0%) |
Earnings by Sex by Educational Attainment in Greenbush
| Educational Attainment | Male Income | Female Income |
| Less than High School | - | - |
| High School Diploma | - | - |
| College or Associate's Degree | - | - |
| Bachelor's Degree | - | - |
| Graduate Degree | - | - |
| Total | $49,444 | $0 |
Family Income in Greenbush
Family Income Brackets in Greenbush
According to the Greenbush family income data, there are 19 families falling into the $75,000 to $99,999 income range, which is the most common income bracket and makes up 54.3% of all families.
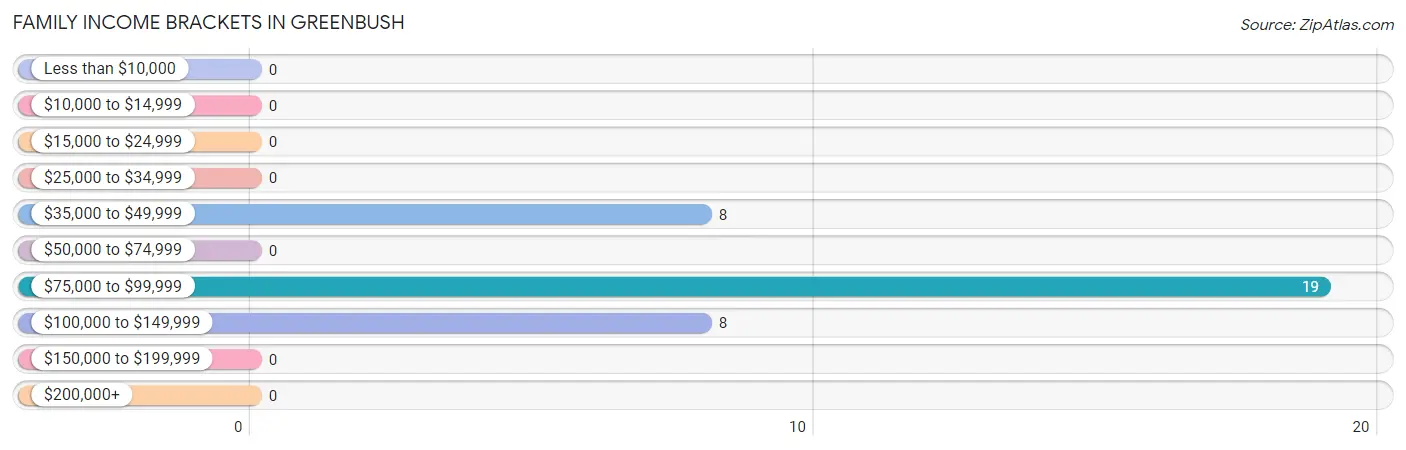
| Income Bracket | # Families | % Families |
| Less than $10,000 | 0 | 0.0% |
| $10,000 to $14,999 | 0 | 0.0% |
| $15,000 to $24,999 | 0 | 0.0% |
| $25,000 to $34,999 | 0 | 0.0% |
| $35,000 to $49,999 | 8 | 22.9% |
| $50,000 to $74,999 | 0 | 0.0% |
| $75,000 to $99,999 | 19 | 54.3% |
| $100,000 to $149,999 | 8 | 22.9% |
| $150,000 to $199,999 | 0 | 0.0% |
| $200,000+ | 0 | 0.0% |
Family Income by Famaliy Size in Greenbush
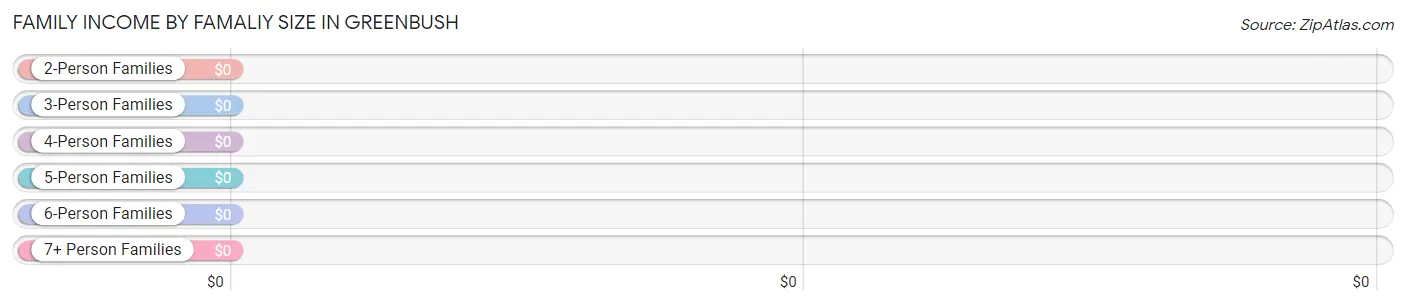
| Income Bracket | # Families | Median Income |
| 2-Person Families | 13 (37.1%) | $0 |
| 3-Person Families | 0 (0.0%) | $0 |
| 4-Person Families | 0 (0.0%) | $0 |
| 5-Person Families | 22 (62.9%) | $0 |
| 6-Person Families | 0 (0.0%) | $0 |
| 7+ Person Families | 0 (0.0%) | $0 |
| Total | 35 (100.0%) | $81,696 |
Family Income by Number of Earners in Greenbush
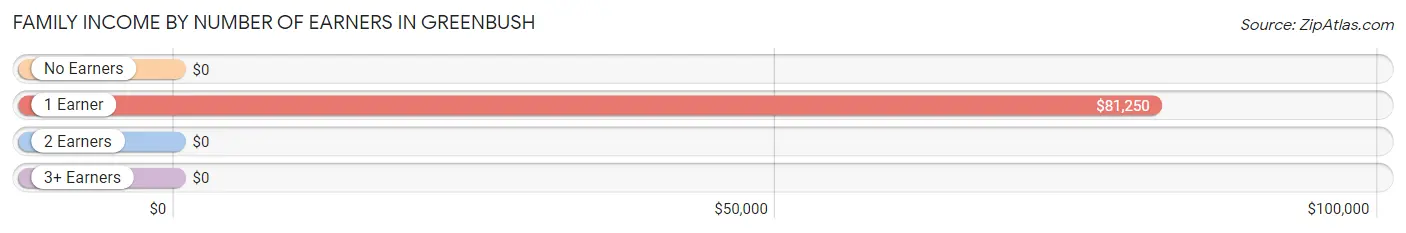
| Number of Earners | # Families | Median Income |
| No Earners | 0 (0.0%) | $0 |
| 1 Earner | 30 (85.7%) | $81,250 |
| 2 Earners | 5 (14.3%) | $0 |
| 3+ Earners | 0 (0.0%) | $0 |
| Total | 35 (100.0%) | $81,696 |
Household Income in Greenbush
Household Income Brackets in Greenbush
With 19 households falling in the category, the $75,000 to $99,999 income range is the most frequent in Greenbush, accounting for 54.3% of all households.
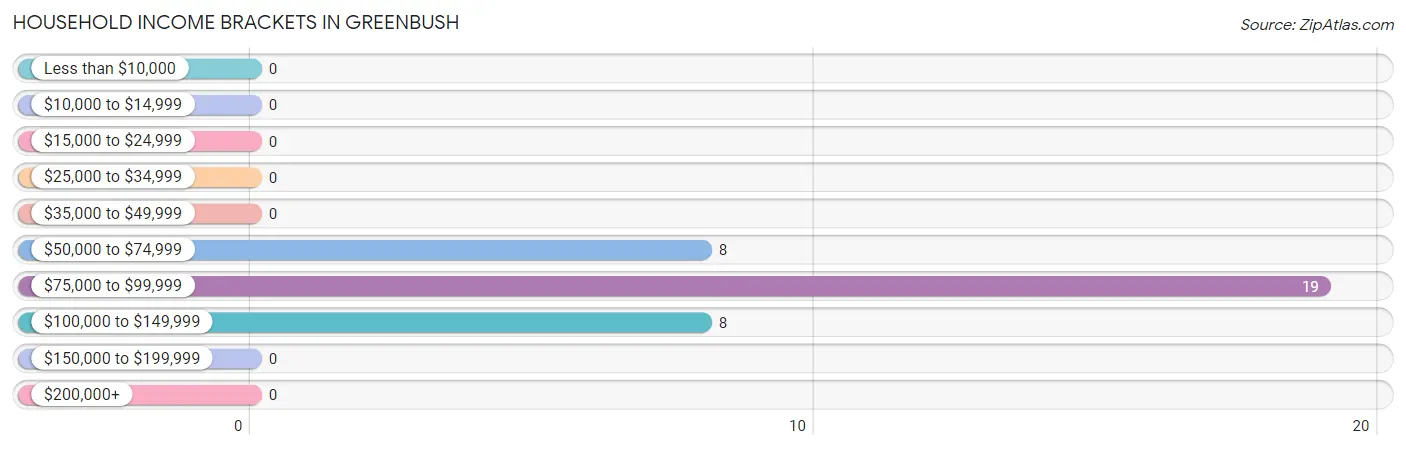
| Income Bracket | # Households | % Households |
| Less than $10,000 | 0 | 0.0% |
| $10,000 to $14,999 | 0 | 0.0% |
| $15,000 to $24,999 | 0 | 0.0% |
| $25,000 to $34,999 | 0 | 0.0% |
| $35,000 to $49,999 | 0 | 0.0% |
| $50,000 to $74,999 | 8 | 22.9% |
| $75,000 to $99,999 | 19 | 54.3% |
| $100,000 to $149,999 | 8 | 22.9% |
| $150,000 to $199,999 | 0 | 0.0% |
| $200,000+ | 0 | 0.0% |
Household Income by Householder Age in Greenbush
| Income Bracket | # Households | Median Income |
| 15 to 24 Years | 0 (0.0%) | $0 |
| 25 to 44 Years | 22 (62.9%) | $0 |
| 45 to 64 Years | 5 (14.3%) | $0 |
| 65+ Years | 8 (22.9%) | $0 |
| Total | 35 (100.0%) | $81,696 |
Poverty in Greenbush
Income Below Poverty by Sex and Age in Greenbush
| Age Bracket | Male | Female |
| Under 5 Years | 0 (0.0%) | 0 (0.0%) |
| 5 Years | 0 (0.0%) | 0 (0.0%) |
| 6 to 11 Years | 0 (0.0%) | 0 (0.0%) |
| 12 to 14 Years | 0 (0.0%) | 0 (0.0%) |
| 15 Years | 0 (0.0%) | 0 (0.0%) |
| 16 and 17 Years | 0 (0.0%) | 0 (0.0%) |
| 18 to 24 Years | 0 (0.0%) | 0 (0.0%) |
| 25 to 34 Years | 0 (0.0%) | 0 (0.0%) |
| 35 to 44 Years | 0 (0.0%) | 0 (0.0%) |
| 45 to 54 Years | 0 (0.0%) | 0 (0.0%) |
| 55 to 64 Years | 0 (0.0%) | 0 (0.0%) |
| 65 to 74 Years | 0 (0.0%) | 0 (0.0%) |
| 75 Years and over | 0 (0.0%) | 0 (0.0%) |
| Total | 0 (0.0%) | 0 (0.0%) |
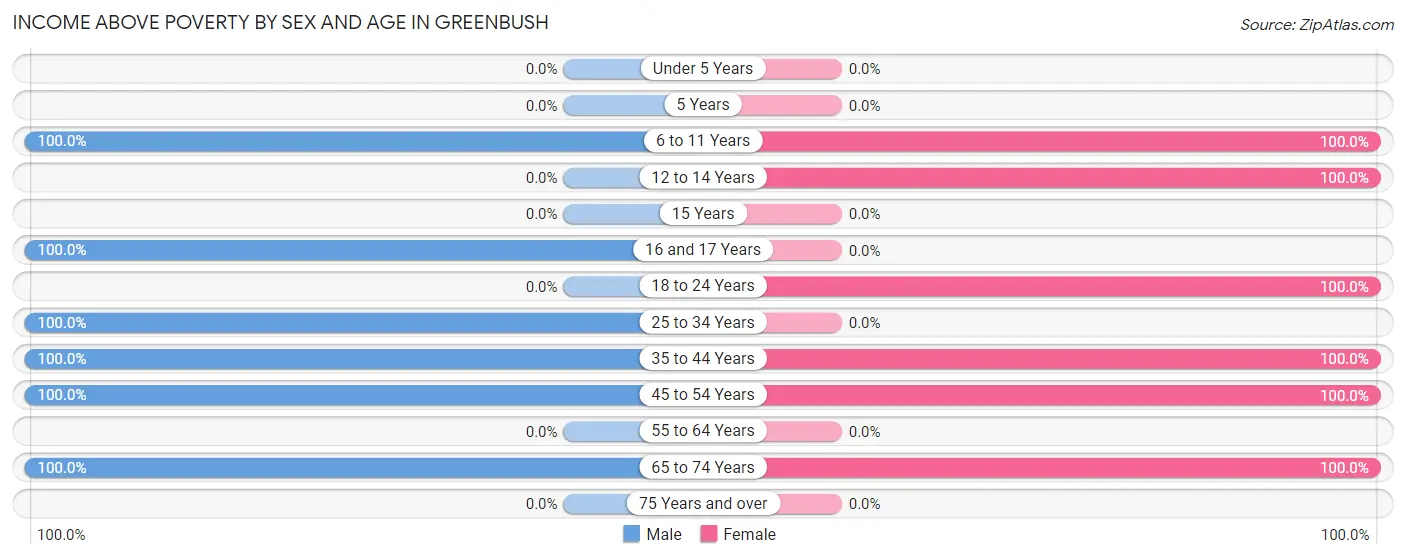
Income Above Poverty by Sex and Age in Greenbush
According to the poverty statistics in Greenbush, males aged 6 to 11 years and females aged 6 to 11 years are the age groups that are most secure financially, with 100.0% of males and 100.0% of females in these age groups living above the poverty line.
| Age Bracket | Male | Female |
| Under 5 Years | 0 (0.0%) | 0 (0.0%) |
| 5 Years | 0 (0.0%) | 0 (0.0%) |
| 6 to 11 Years | 13 (100.0%) | 29 (100.0%) |
| 12 to 14 Years | 0 (0.0%) | 7 (100.0%) |
| 15 Years | 0 (0.0%) | 0 (0.0%) |
| 16 and 17 Years | 6 (100.0%) | 0 (0.0%) |
| 18 to 24 Years | 0 (0.0%) | 10 (100.0%) |
| 25 to 34 Years | 11 (100.0%) | 0 (0.0%) |
| 35 to 44 Years | 9 (100.0%) | 22 (100.0%) |
| 45 to 54 Years | 18 (100.0%) | 5 (100.0%) |
| 55 to 64 Years | 0 (0.0%) | 0 (0.0%) |
| 65 to 74 Years | 8 (100.0%) | 11 (100.0%) |
| 75 Years and over | 0 (0.0%) | 0 (0.0%) |
| Total | 65 (100.0%) | 84 (100.0%) |
Income Below Poverty Among Married-Couple Families in Greenbush
| Children | Above Poverty | Below Poverty |
| No Children | 13 (100.0%) | 0 (0.0%) |
| 1 or 2 Children | 8 (100.0%) | 0 (0.0%) |
| 3 or 4 Children | 14 (100.0%) | 0 (0.0%) |
| 5 or more Children | 0 (0.0%) | 0 (0.0%) |
| Total | 35 (100.0%) | 0 (0.0%) |
Income Below Poverty Among Single-Parent Households in Greenbush
| Children | Single Father | Single Mother |
| No Children | 0 (0.0%) | 0 (0.0%) |
| 1 or 2 Children | 0 (0.0%) | 0 (0.0%) |
| 3 or 4 Children | 0 (0.0%) | 0 (0.0%) |
| 5 or more Children | 0 (0.0%) | 0 (0.0%) |
| Total | 0 (0.0%) | 0 (0.0%) |
Income Below Poverty Among Married-Couple vs Single-Parent Households in Greenbush
| Children | Married-Couple Families | Single-Parent Households |
| No Children | 0 (0.0%) | 0 (0.0%) |
| 1 or 2 Children | 0 (0.0%) | 0 (0.0%) |
| 3 or 4 Children | 0 (0.0%) | 0 (0.0%) |
| 5 or more Children | 0 (0.0%) | 0 (0.0%) |
| Total | 0 (0.0%) | 0 (0.0%) |
Race in Greenbush
The most populous races in Greenbush are Black / African American (71 | 47.6%), White / Caucasian (67 | 45.0%), and Asian (11 | 7.4%).
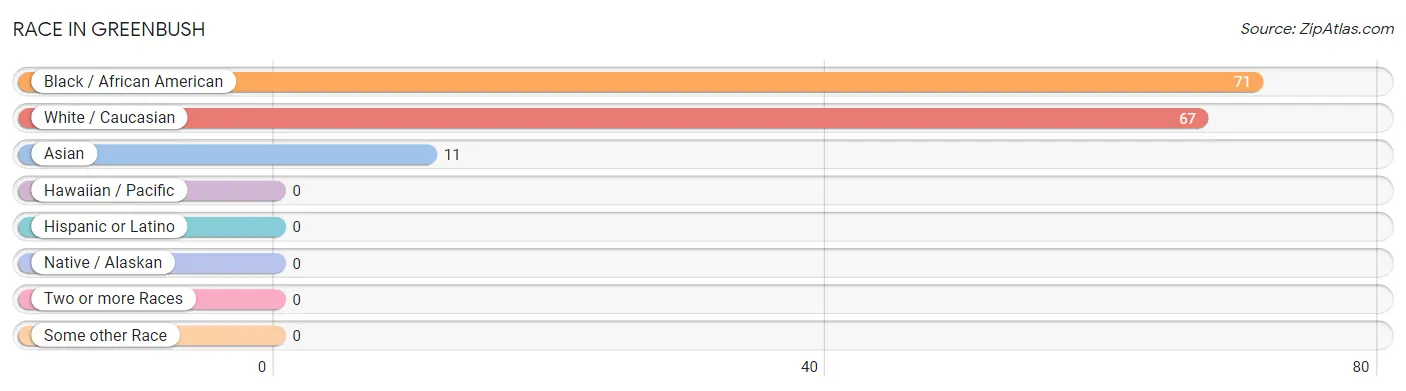
| Race | # Population | % Population |
| Asian | 11 | 7.4% |
| Black / African American | 71 | 47.6% |
| Hawaiian / Pacific | 0 | 0.0% |
| Hispanic or Latino | 0 | 0.0% |
| Native / Alaskan | 0 | 0.0% |
| White / Caucasian | 67 | 45.0% |
| Two or more Races | 0 | 0.0% |
| Some other Race | 0 | 0.0% |
| Total | 149 | 100.0% |
Ancestry in Greenbush
The most populous ancestries reported in Greenbush are American (71 | 47.6%), Korean (11 | 7.4%), Irish (8 | 5.4%), and French Canadian (5 | 3.4%), together accounting for 63.8% of all Greenbush residents.
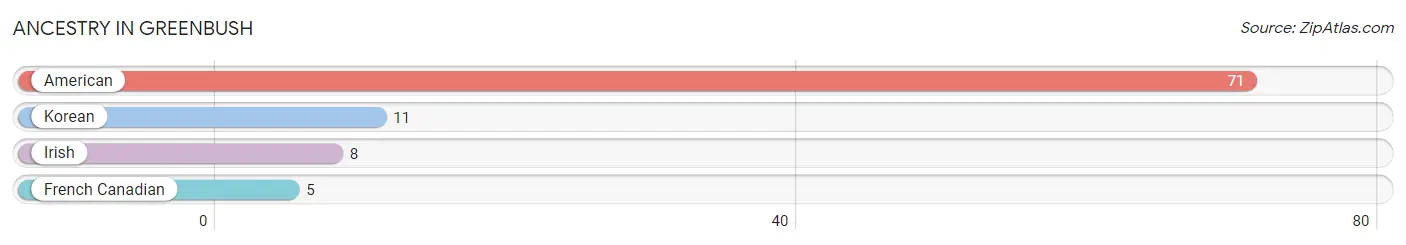
| Ancestry | # Population | % Population |
| American | 71 | 47.6% |
| French Canadian | 5 | 3.4% |
| Irish | 8 | 5.4% |
| Korean | 11 | 7.4% | View All 4 Rows |
Immigrants in Greenbush
The most numerous immigrant groups reported in Greenbush came from Asia (11 | 7.4%), Philippines (11 | 7.4%), and South Eastern Asia (11 | 7.4%), together accounting for 22.1% of all Greenbush residents.
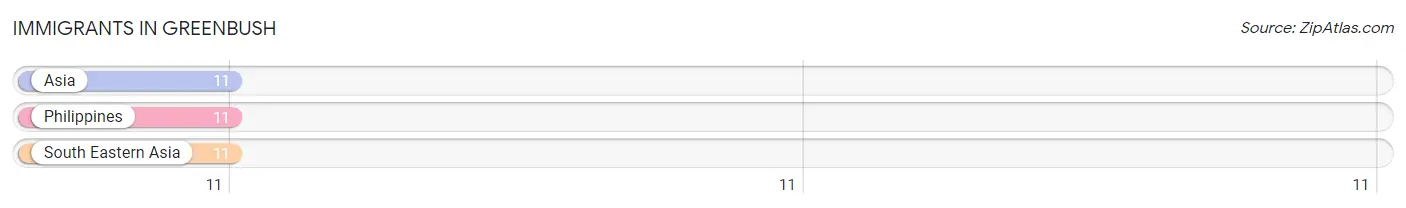
| Immigration Origin | # Population | % Population |
| Asia | 11 | 7.4% |
| Philippines | 11 | 7.4% |
| South Eastern Asia | 11 | 7.4% | View All 3 Rows |
Sex and Age in Greenbush
Sex and Age in Greenbush
The most populous age groups in Greenbush are 45 to 49 Years (15 | 23.1%) for men and 10 to 14 Years (22 | 26.2%) for women.
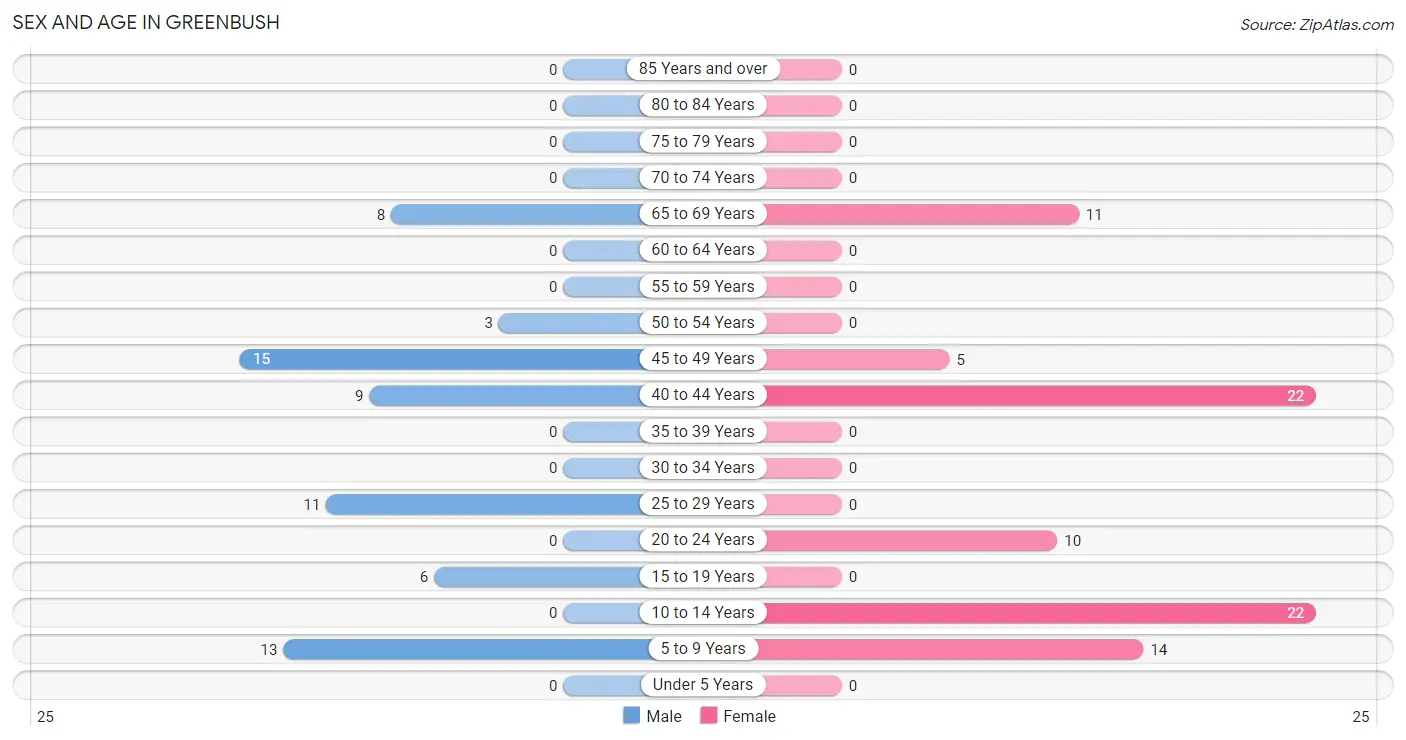
| Age Bracket | Male | Female |
| Under 5 Years | 0 (0.0%) | 0 (0.0%) |
| 5 to 9 Years | 13 (20.0%) | 14 (16.7%) |
| 10 to 14 Years | 0 (0.0%) | 22 (26.2%) |
| 15 to 19 Years | 6 (9.2%) | 0 (0.0%) |
| 20 to 24 Years | 0 (0.0%) | 10 (11.9%) |
| 25 to 29 Years | 11 (16.9%) | 0 (0.0%) |
| 30 to 34 Years | 0 (0.0%) | 0 (0.0%) |
| 35 to 39 Years | 0 (0.0%) | 0 (0.0%) |
| 40 to 44 Years | 9 (13.9%) | 22 (26.2%) |
| 45 to 49 Years | 15 (23.1%) | 5 (5.9%) |
| 50 to 54 Years | 3 (4.6%) | 0 (0.0%) |
| 55 to 59 Years | 0 (0.0%) | 0 (0.0%) |
| 60 to 64 Years | 0 (0.0%) | 0 (0.0%) |
| 65 to 69 Years | 8 (12.3%) | 11 (13.1%) |
| 70 to 74 Years | 0 (0.0%) | 0 (0.0%) |
| 75 to 79 Years | 0 (0.0%) | 0 (0.0%) |
| 80 to 84 Years | 0 (0.0%) | 0 (0.0%) |
| 85 Years and over | 0 (0.0%) | 0 (0.0%) |
| Total | 65 (100.0%) | 84 (100.0%) |
Families and Households in Greenbush
Median Family Size in Greenbush
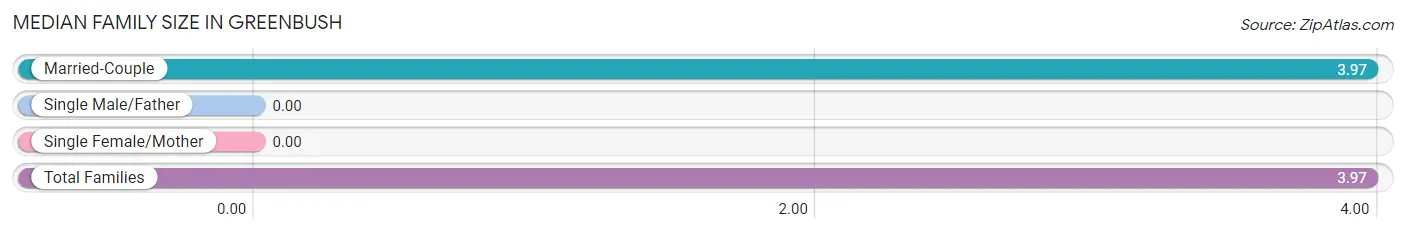
| Family Type | # Families | Family Size |
| Married-Couple | 35 (100.0%) | 3.97 |
| Single Male/Father | 0 (0.0%) | - |
| Single Female/Mother | 0 (0.0%) | - |
| Total Families | 35 (100.0%) | 3.97 |
Median Household Size in Greenbush
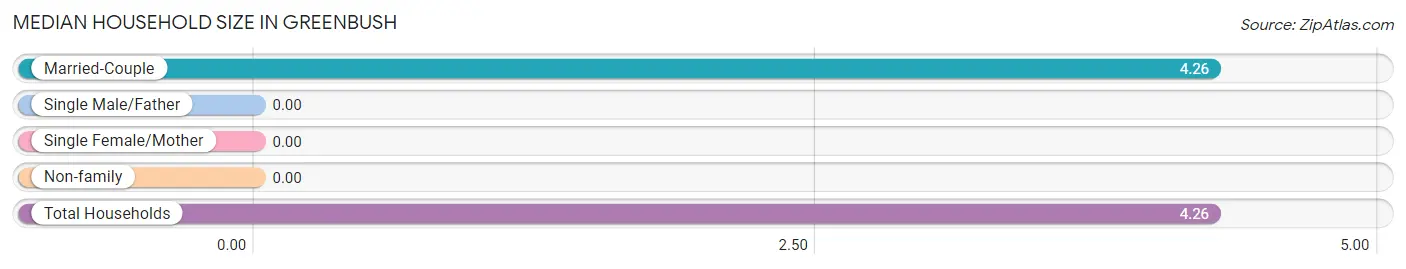
| Household Type | # Households | Household Size |
| Married-Couple | 35 (100.0%) | 4.26 |
| Single Male/Father | 0 (0.0%) | - |
| Single Female/Mother | 0 (0.0%) | - |
| Non-family | 0 (0.0%) | - |
| Total Households | 35 (100.0%) | 4.26 |
Household Size by Marriage Status in Greenbush
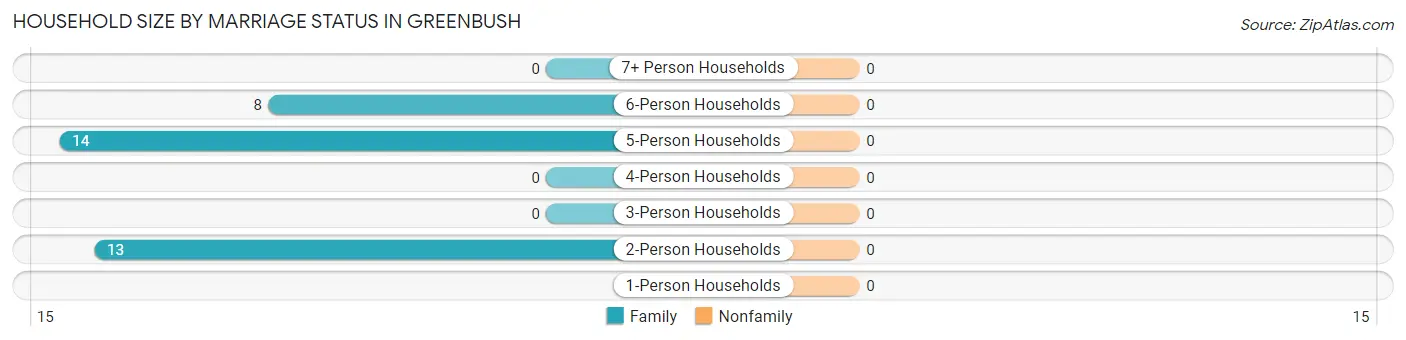
| Household Size | Family Households | Nonfamily Households |
| 1-Person Households | - | 0 (0.0%) |
| 2-Person Households | 13 (37.1%) | 0 (0.0%) |
| 3-Person Households | 0 (0.0%) | 0 (0.0%) |
| 4-Person Households | 0 (0.0%) | 0 (0.0%) |
| 5-Person Households | 14 (40.0%) | 0 (0.0%) |
| 6-Person Households | 8 (22.9%) | 0 (0.0%) |
| 7+ Person Households | 0 (0.0%) | 0 (0.0%) |
| Total | 35 (100.0%) | 0 (0.0%) |
Female Fertility in Greenbush
Fertility by Age in Greenbush
| Age Bracket | Women with Births | Births / 1,000 Women |
| 15 to 19 years | 0 (0.0%) | 0.0 |
| 20 to 34 years | 0 (0.0%) | 0.0 |
| 35 to 50 years | 0 (0.0%) | 0.0 |
| Total | 0 (0.0%) | 0.0 |
Fertility by Age by Marriage Status in Greenbush
| Age Bracket | Married | Unmarried |
| 15 to 19 years | 0 (0.0%) | 0 (0.0%) |
| 20 to 34 years | 0 (0.0%) | 0 (0.0%) |
| 35 to 50 years | 0 (0.0%) | 0 (0.0%) |
| Total | 0 (0.0%) | 0 (0.0%) |
Fertility by Education in Greenbush
| Educational Attainment | Women with Births | Births / 1,000 Women |
| Less than High School | 0 (0.0%) | 0.0 |
| High School Diploma | 0 (0.0%) | 0.0 |
| College or Associate's Degree | 0 (0.0%) | 0.0 |
| Bachelor's Degree | 0 (0.0%) | 0.0 |
| Graduate Degree | 0 (0.0%) | 0.0 |
| Total | 0 (0.0%) | 0.0 |
Fertility by Education by Marriage Status in Greenbush
| Educational Attainment | Married | Unmarried |
| Less than High School | 0 (0.0%) | 0 (0.0%) |
| High School Diploma | 0 (0.0%) | 0 (0.0%) |
| College or Associate's Degree | 0 (0.0%) | 0 (0.0%) |
| Bachelor's Degree | 0 (0.0%) | 0 (0.0%) |
| Graduate Degree | 0 (0.0%) | 0 (0.0%) |
| Total | 0 (0.0%) | 0 (0.0%) |
Employment Characteristics in Greenbush
Employment by Class of Employer in Greenbush
Among the 49 employed individuals in Greenbush, private company employees (24 | 49.0%), federal government employees (13 | 26.5%), and local government employees (9 | 18.4%) make up the most common classes of employment.
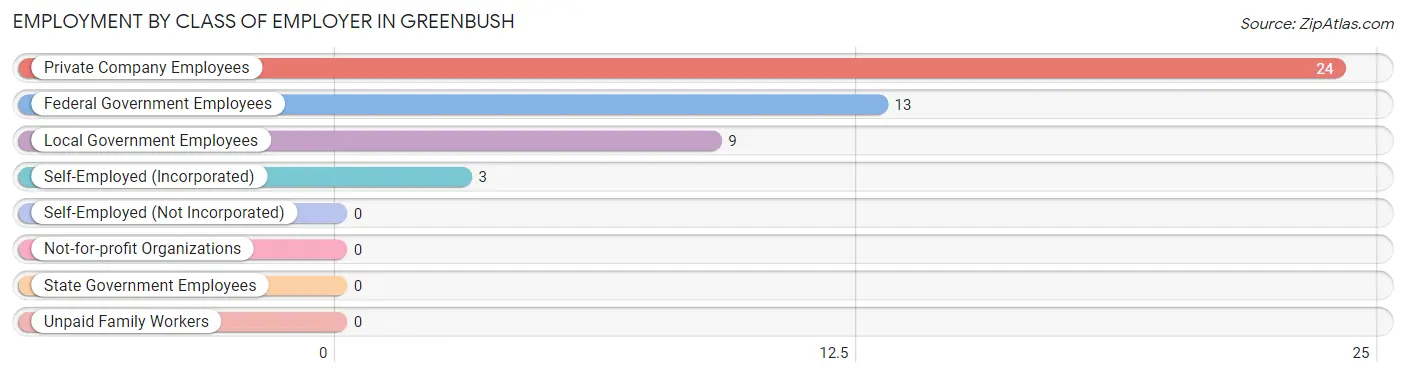
| Employer Class | # Employees | % Employees |
| Private Company Employees | 24 | 49.0% |
| Self-Employed (Incorporated) | 3 | 6.1% |
| Self-Employed (Not Incorporated) | 0 | 0.0% |
| Not-for-profit Organizations | 0 | 0.0% |
| Local Government Employees | 9 | 18.4% |
| State Government Employees | 0 | 0.0% |
| Federal Government Employees | 13 | 26.5% |
| Unpaid Family Workers | 0 | 0.0% |
| Total | 49 | 100.0% |
Employment Status by Age in Greenbush
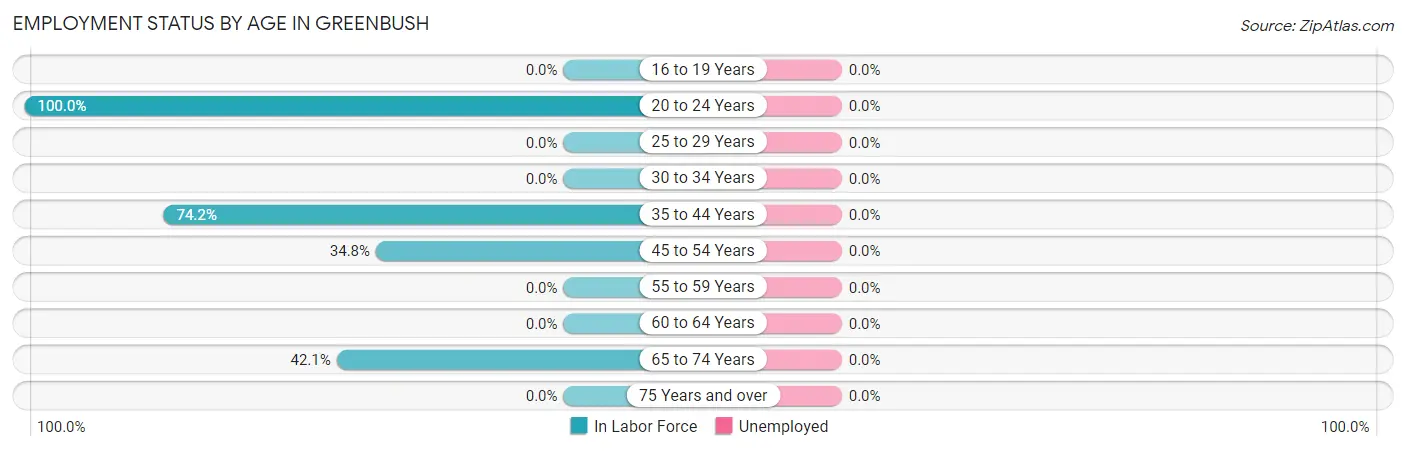
| Age Bracket | In Labor Force | Unemployed |
| 16 to 19 Years | 0 (0.0%) | 0 (0.0%) |
| 20 to 24 Years | 10 (100.0%) | 0 (0.0%) |
| 25 to 29 Years | 0 (0.0%) | 0 (0.0%) |
| 30 to 34 Years | 0 (0.0%) | 0 (0.0%) |
| 35 to 44 Years | 23 (74.2%) | 0 (0.0%) |
| 45 to 54 Years | 8 (34.8%) | 0 (0.0%) |
| 55 to 59 Years | 0 (0.0%) | 0 (0.0%) |
| 60 to 64 Years | 0 (0.0%) | 0 (0.0%) |
| 65 to 74 Years | 8 (42.1%) | 0 (0.0%) |
| 75 Years and over | 0 (0.0%) | 0 (0.0%) |
| Total | 49 (49.0%) | 0 (0.0%) |
Employment Status by Educational Attainment in Greenbush
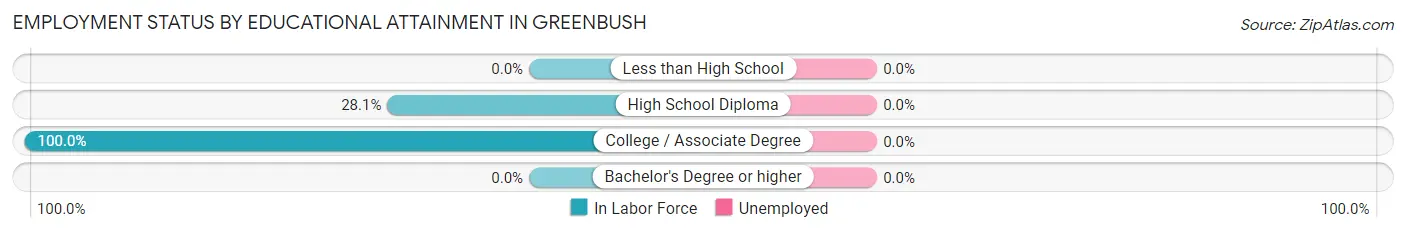
| Educational Attainment | In Labor Force | Unemployed |
| Less than High School | 0 (0.0%) | 0 (0.0%) |
| High School Diploma | 9 (28.1%) | 0 (0.0%) |
| College / Associate Degree | 22 (100.0%) | 0 (0.0%) |
| Bachelor's Degree or higher | 0 (0.0%) | 0 (0.0%) |
| Total | 31 (47.7%) | 0 (0.0%) |
Employment Occupations by Sex in Greenbush
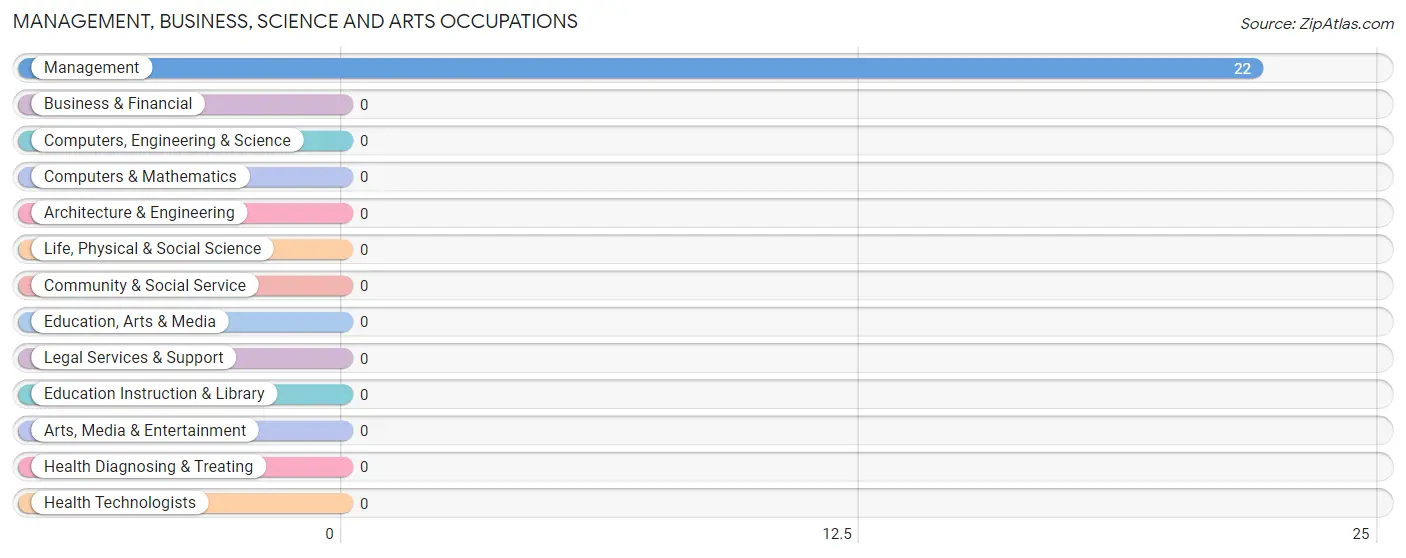
Management, Business, Science and Arts Occupations
The most common Management, Business, Science and Arts occupations in Greenbush are , and Management (22 | 50.0%).
Management, Business, Science and Arts Occupations by Sex
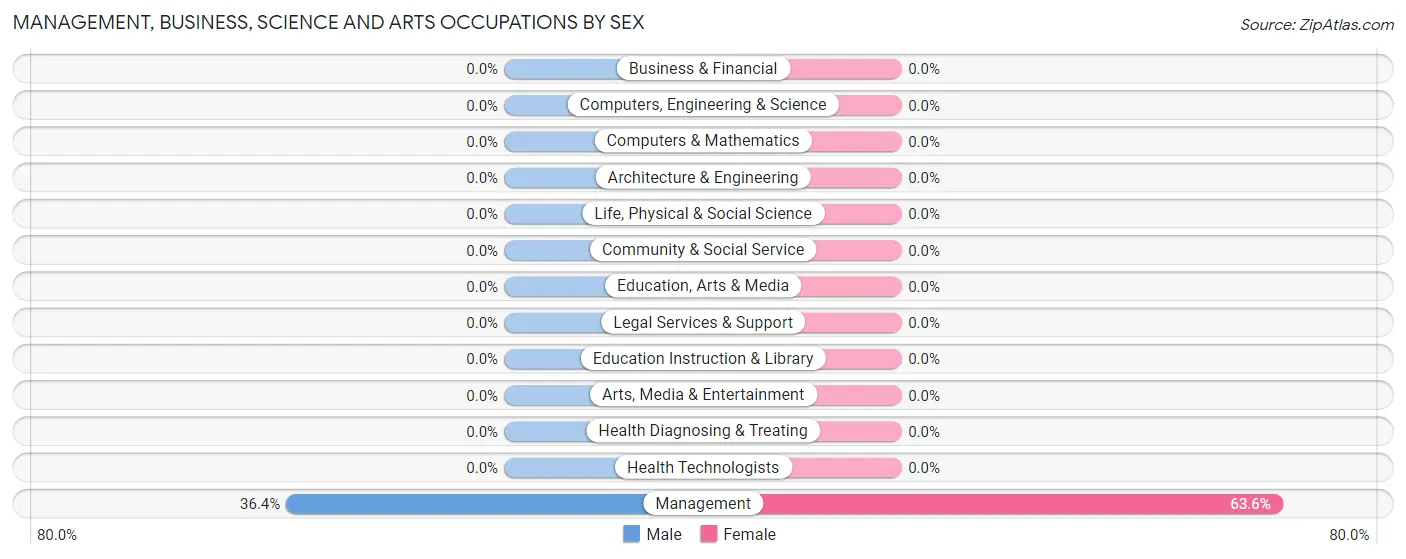
| Occupation | Male | Female |
| Management | 8 (36.4%) | 14 (63.6%) |
| Business & Financial | 0 (0.0%) | 0 (0.0%) |
| Computers, Engineering & Science | 0 (0.0%) | 0 (0.0%) |
| Computers & Mathematics | 0 (0.0%) | 0 (0.0%) |
| Architecture & Engineering | 0 (0.0%) | 0 (0.0%) |
| Life, Physical & Social Science | 0 (0.0%) | 0 (0.0%) |
| Community & Social Service | 0 (0.0%) | 0 (0.0%) |
| Education, Arts & Media | 0 (0.0%) | 0 (0.0%) |
| Legal Services & Support | 0 (0.0%) | 0 (0.0%) |
| Education Instruction & Library | 0 (0.0%) | 0 (0.0%) |
| Arts, Media & Entertainment | 0 (0.0%) | 0 (0.0%) |
| Health Diagnosing & Treating | 0 (0.0%) | 0 (0.0%) |
| Health Technologists | 0 (0.0%) | 0 (0.0%) |
| Total (Category) | 8 (36.4%) | 14 (63.6%) |
| Total (Overall) | 20 (45.5%) | 24 (54.5%) |
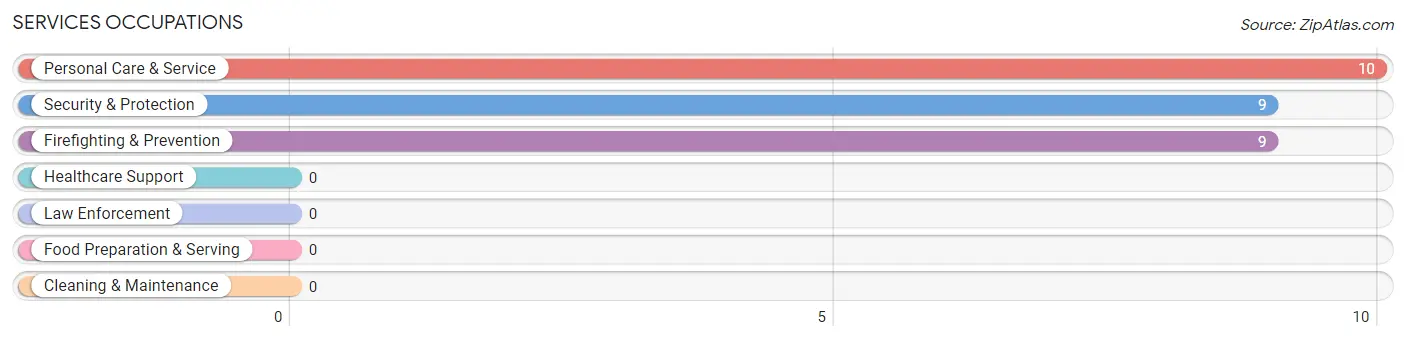
Services Occupations
The most common Services occupations in Greenbush are Personal Care & Service (10 | 22.7%), Security & Protection (9 | 20.4%), and Firefighting & Prevention (9 | 20.4%).
Services Occupations by Sex
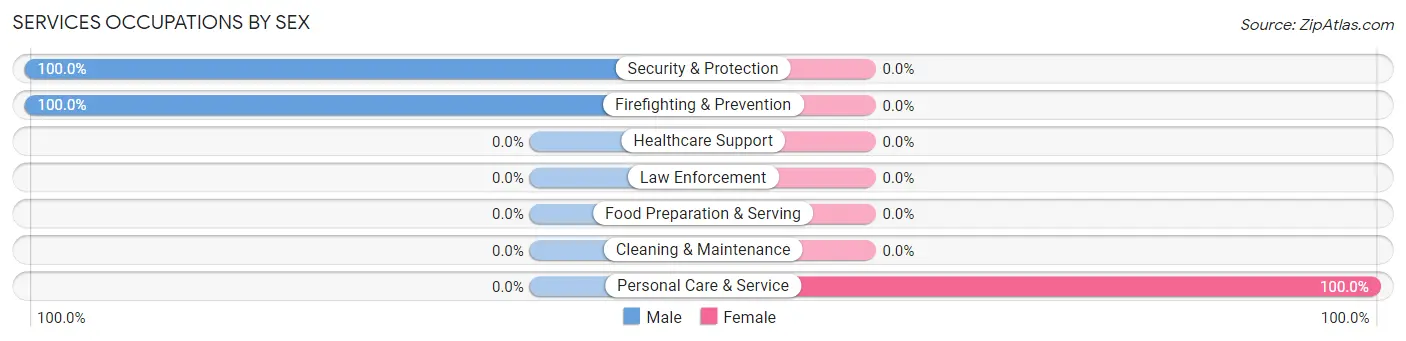
| Occupation | Male | Female |
| Healthcare Support | 0 (0.0%) | 0 (0.0%) |
| Security & Protection | 9 (100.0%) | 0 (0.0%) |
| Firefighting & Prevention | 9 (100.0%) | 0 (0.0%) |
| Law Enforcement | 0 (0.0%) | 0 (0.0%) |
| Food Preparation & Serving | 0 (0.0%) | 0 (0.0%) |
| Cleaning & Maintenance | 0 (0.0%) | 0 (0.0%) |
| Personal Care & Service | 0 (0.0%) | 10 (100.0%) |
| Total (Category) | 9 (47.4%) | 10 (52.6%) |
| Total (Overall) | 20 (45.5%) | 24 (54.5%) |
Sales and Office Occupations
Sales and Office Occupations by Sex
| Occupation | Male | Female |
| Sales & Related | 0 (0.0%) | 0 (0.0%) |
| Office & Administration | 0 (0.0%) | 0 (0.0%) |
| Total (Category) | 0 (0.0%) | 0 (0.0%) |
| Total (Overall) | 20 (45.5%) | 24 (54.5%) |
Natural Resources, Construction and Maintenance Occupations
The most common Natural Resources, Construction and Maintenance occupations in Greenbush are , and Installation, Maintenance & Repair (3 | 6.8%).
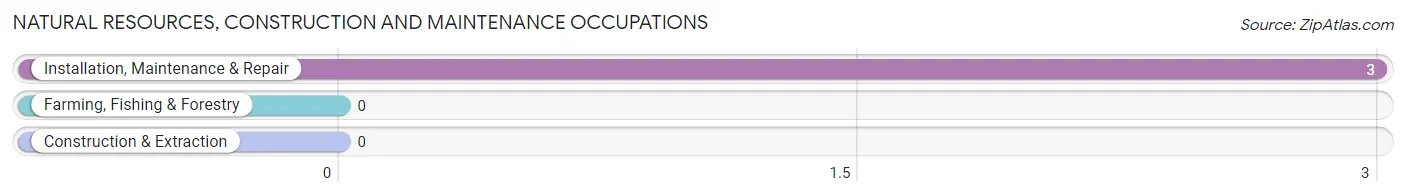
Natural Resources, Construction and Maintenance Occupations by Sex
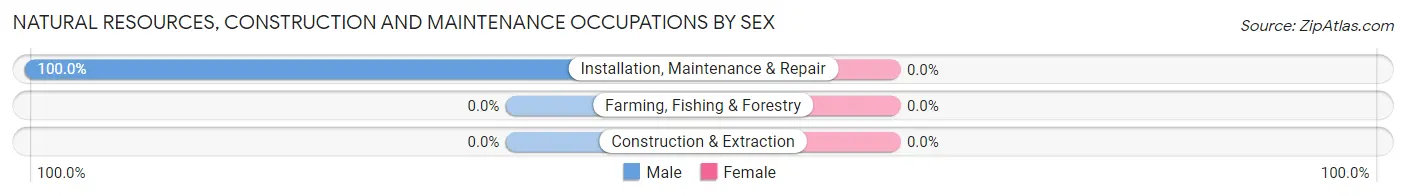
| Occupation | Male | Female |
| Farming, Fishing & Forestry | 0 (0.0%) | 0 (0.0%) |
| Construction & Extraction | 0 (0.0%) | 0 (0.0%) |
| Installation, Maintenance & Repair | 3 (100.0%) | 0 (0.0%) |
| Total (Category) | 3 (100.0%) | 0 (0.0%) |
| Total (Overall) | 20 (45.5%) | 24 (54.5%) |
Production, Transportation and Moving Occupations
Production, Transportation and Moving Occupations by Sex
| Occupation | Male | Female |
| Production | 0 (0.0%) | 0 (0.0%) |
| Transportation | 0 (0.0%) | 0 (0.0%) |
| Material Moving | 0 (0.0%) | 0 (0.0%) |
| Total (Category) | 0 (0.0%) | 0 (0.0%) |
| Total (Overall) | 20 (45.5%) | 24 (54.5%) |
Employment Industries by Sex in Greenbush
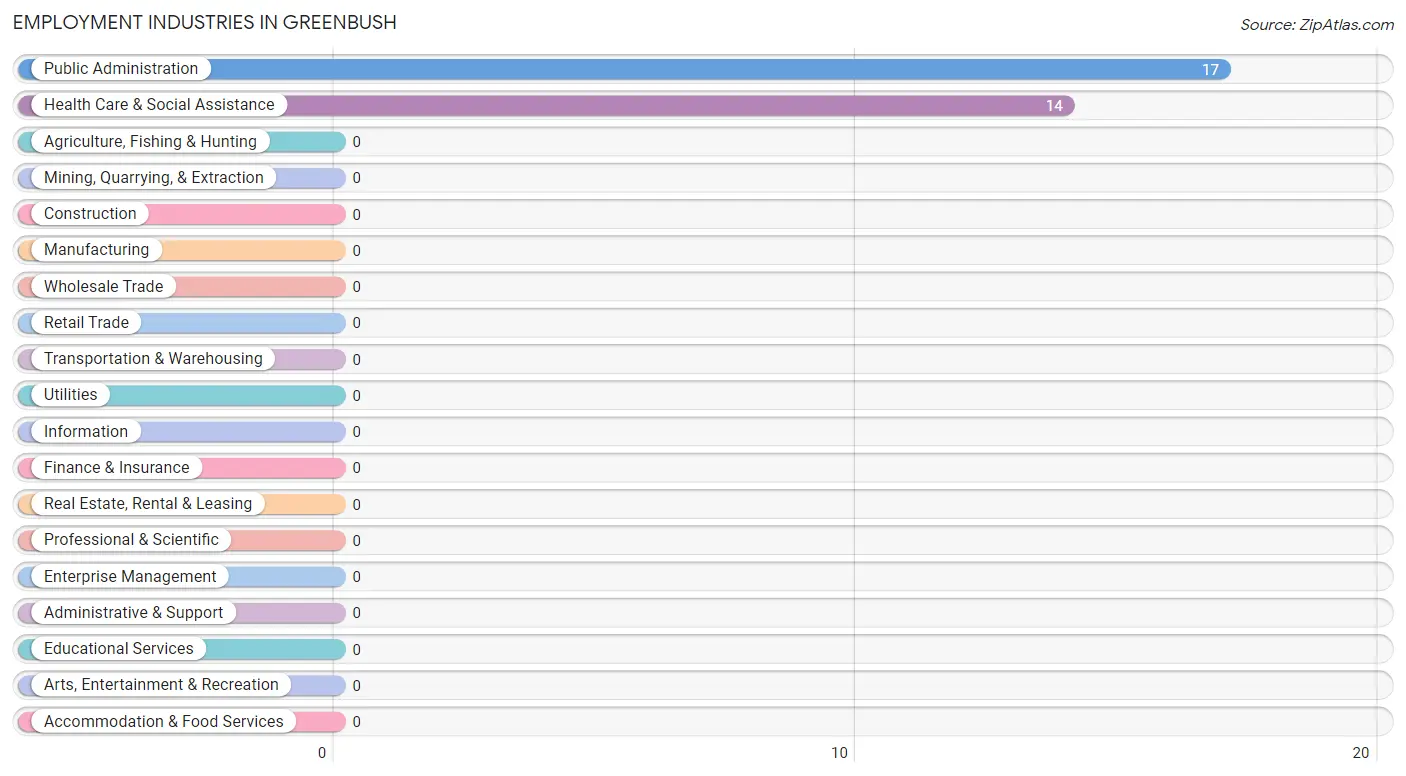
Employment Industries in Greenbush
The major employment industries in Greenbush include Public Administration (17 | 38.6%), and Health Care & Social Assistance (14 | 31.8%).
Employment Industries by Sex in Greenbush
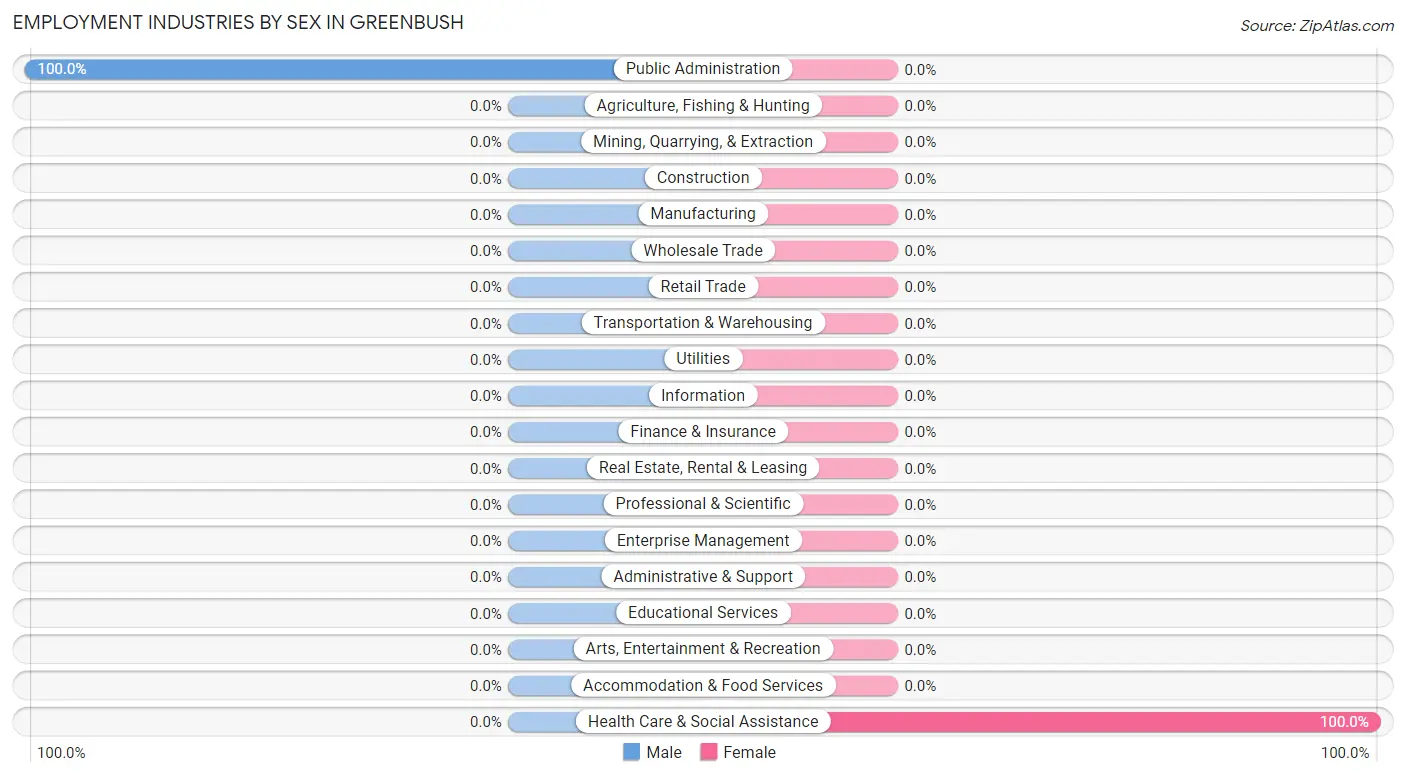
| Industry | Male | Female |
| Agriculture, Fishing & Hunting | 0 (0.0%) | 0 (0.0%) |
| Mining, Quarrying, & Extraction | 0 (0.0%) | 0 (0.0%) |
| Construction | 0 (0.0%) | 0 (0.0%) |
| Manufacturing | 0 (0.0%) | 0 (0.0%) |
| Wholesale Trade | 0 (0.0%) | 0 (0.0%) |
| Retail Trade | 0 (0.0%) | 0 (0.0%) |
| Transportation & Warehousing | 0 (0.0%) | 0 (0.0%) |
| Utilities | 0 (0.0%) | 0 (0.0%) |
| Information | 0 (0.0%) | 0 (0.0%) |
| Finance & Insurance | 0 (0.0%) | 0 (0.0%) |
| Real Estate, Rental & Leasing | 0 (0.0%) | 0 (0.0%) |
| Professional & Scientific | 0 (0.0%) | 0 (0.0%) |
| Enterprise Management | 0 (0.0%) | 0 (0.0%) |
| Administrative & Support | 0 (0.0%) | 0 (0.0%) |
| Educational Services | 0 (0.0%) | 0 (0.0%) |
| Health Care & Social Assistance | 0 (0.0%) | 14 (100.0%) |
| Arts, Entertainment & Recreation | 0 (0.0%) | 0 (0.0%) |
| Accommodation & Food Services | 0 (0.0%) | 0 (0.0%) |
| Public Administration | 17 (100.0%) | 0 (0.0%) |
| Total | 20 (45.5%) | 24 (54.5%) |
Education in Greenbush
School Enrollment in Greenbush
The most common levels of schooling among the 69 students in Greenbush are middle school (15 | 21.7%), kindergarten (14 | 20.3%), and college / undergraduate (14 | 20.3%).
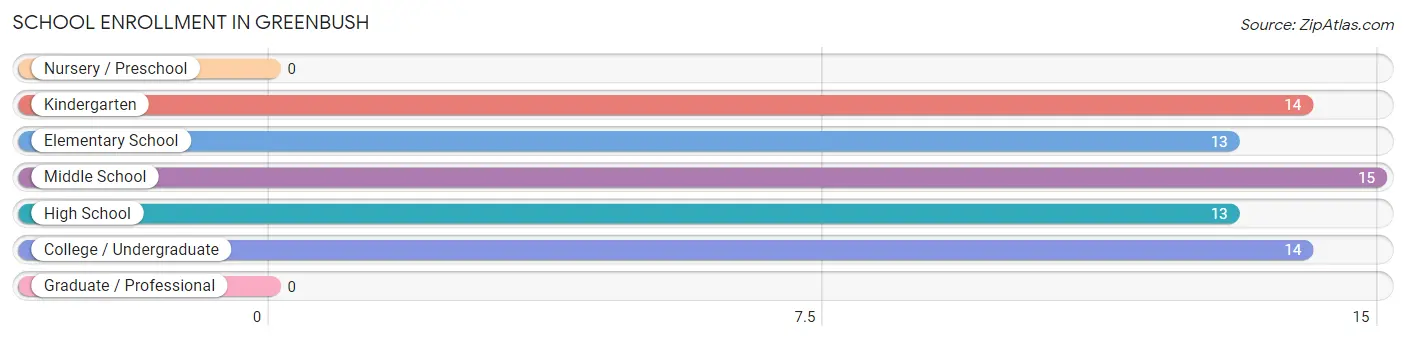
| School Level | # Students | % Students |
| Nursery / Preschool | 0 | 0.0% |
| Kindergarten | 14 | 20.3% |
| Elementary School | 13 | 18.8% |
| Middle School | 15 | 21.7% |
| High School | 13 | 18.8% |
| College / Undergraduate | 14 | 20.3% |
| Graduate / Professional | 0 | 0.0% |
| Total | 69 | 100.0% |
School Enrollment by Age by Funding Source in Greenbush
Out of a total of 69 students who are enrolled in schools in Greenbush, 14 (20.3%) attend a private institution, while the remaining 55 (79.7%) are enrolled in public schools. The age group of 35 years and over has the highest likelihood of being enrolled in private schools, with 14 (100.0% in the age bracket) enrolled. Conversely, the age group of 5 to 9 year old has the lowest likelihood of being enrolled in a private school, with 27 (100.0% in the age bracket) attending a public institution.
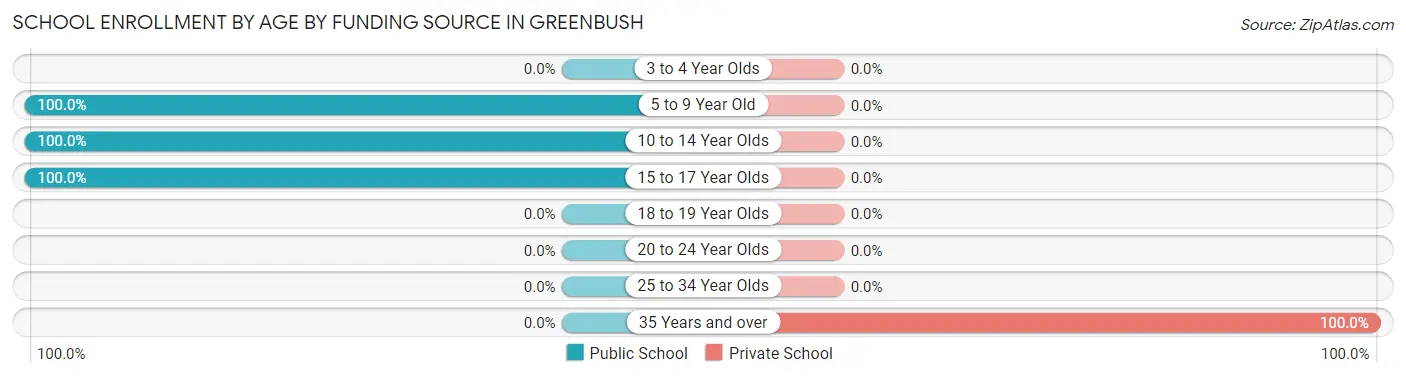
| Age Bracket | Public School | Private School |
| 3 to 4 Year Olds | 0 (0.0%) | 0 (0.0%) |
| 5 to 9 Year Old | 27 (100.0%) | 0 (0.0%) |
| 10 to 14 Year Olds | 22 (100.0%) | 0 (0.0%) |
| 15 to 17 Year Olds | 6 (100.0%) | 0 (0.0%) |
| 18 to 19 Year Olds | 0 (0.0%) | 0 (0.0%) |
| 20 to 24 Year Olds | 0 (0.0%) | 0 (0.0%) |
| 25 to 34 Year Olds | 0 (0.0%) | 0 (0.0%) |
| 35 Years and over | 0 (0.0%) | 14 (100.0%) |
| Total | 55 (79.7%) | 14 (20.3%) |
Educational Attainment by Field of Study in Greenbush
, and computers & mathematics (8 | 100.0%) are the most common fields of study among 8 individuals in Greenbush who have obtained a bachelor's degree or higher.
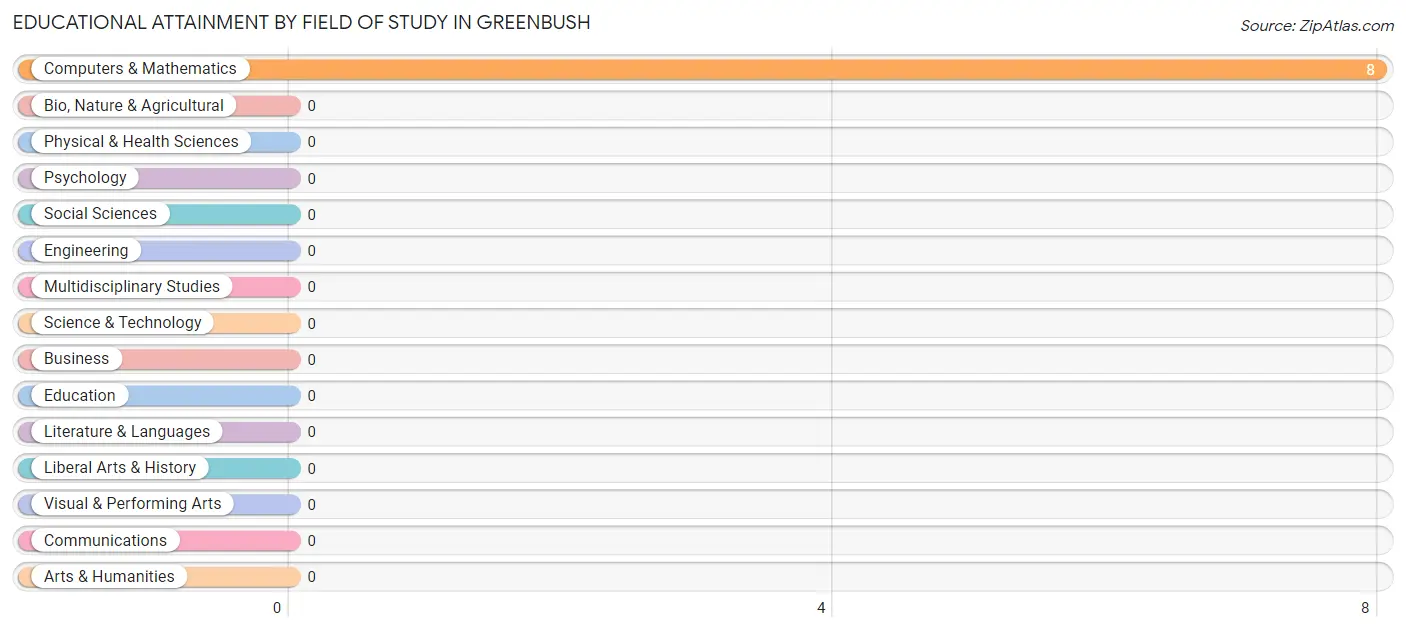
| Field of Study | # Graduates | % Graduates |
| Computers & Mathematics | 8 | 100.0% |
| Bio, Nature & Agricultural | 0 | 0.0% |
| Physical & Health Sciences | 0 | 0.0% |
| Psychology | 0 | 0.0% |
| Social Sciences | 0 | 0.0% |
| Engineering | 0 | 0.0% |
| Multidisciplinary Studies | 0 | 0.0% |
| Science & Technology | 0 | 0.0% |
| Business | 0 | 0.0% |
| Education | 0 | 0.0% |
| Literature & Languages | 0 | 0.0% |
| Liberal Arts & History | 0 | 0.0% |
| Visual & Performing Arts | 0 | 0.0% |
| Communications | 0 | 0.0% |
| Arts & Humanities | 0 | 0.0% |
| Total | 8 | 100.0% |
Transportation & Commute in Greenbush
Vehicle Availability by Sex in Greenbush
The most prevalent vehicle ownership categories in Greenbush are males with 2 vehicles (11, accounting for 55.0%) and females with 2 vehicles (19, making up 37.9%).
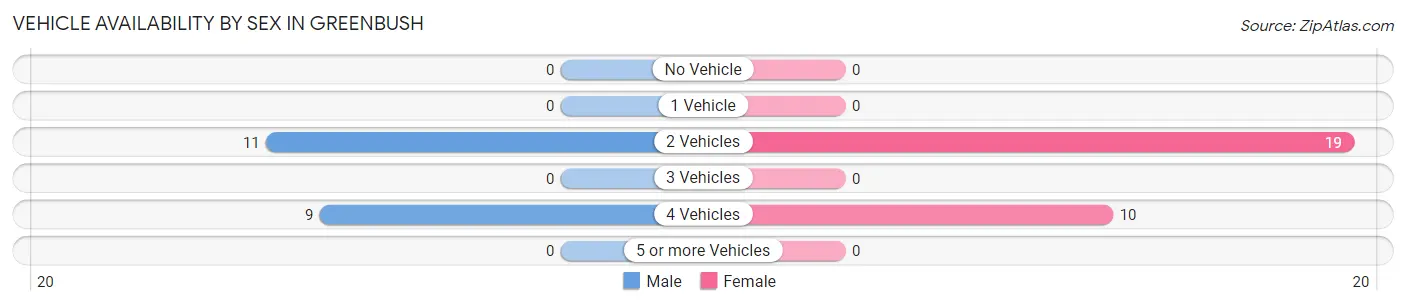
| Vehicles Available | Male | Female |
| No Vehicle | 0 (0.0%) | 0 (0.0%) |
| 1 Vehicle | 0 (0.0%) | 0 (0.0%) |
| 2 Vehicles | 11 (55.0%) | 19 (65.5%) |
| 3 Vehicles | 0 (0.0%) | 0 (0.0%) |
| 4 Vehicles | 9 (45.0%) | 10 (34.5%) |
| 5 or more Vehicles | 0 (0.0%) | 0 (0.0%) |
| Total | 20 (100.0%) | 29 (100.0%) |
Commute Time in Greenbush
The most frequently occuring commute durations in Greenbush are 5 to 9 minutes (14 commuters, 28.6%), 10 to 14 minutes (12 commuters, 24.5%), and 20 to 24 minutes (10 commuters, 20.4%).
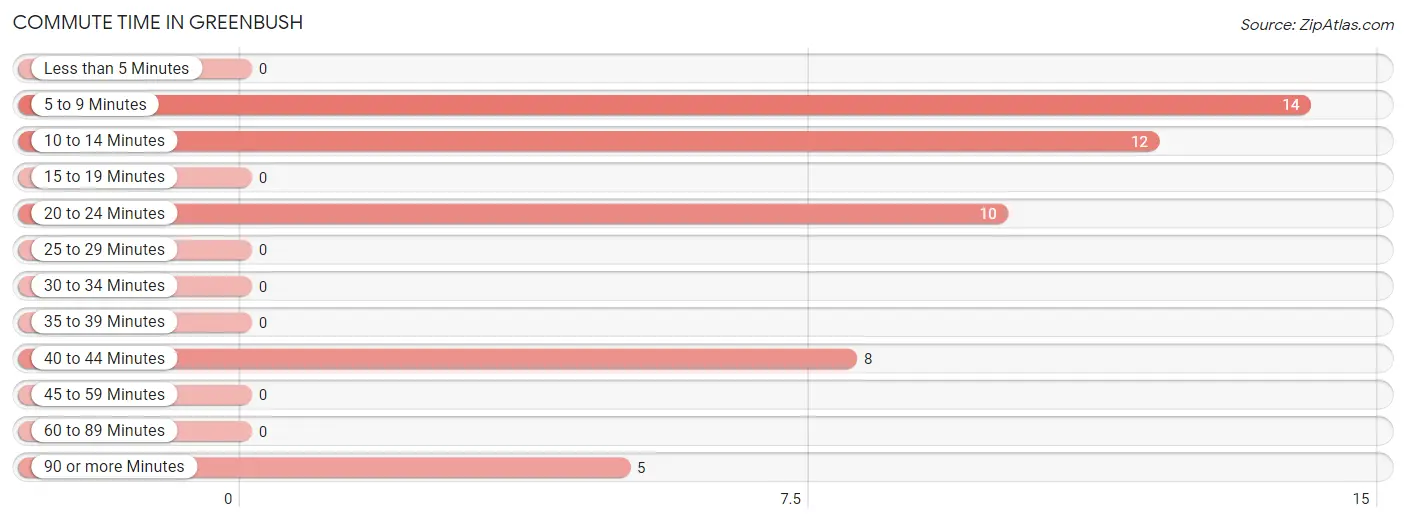
| Commute Time | # Commuters | % Commuters |
| Less than 5 Minutes | 0 | 0.0% |
| 5 to 9 Minutes | 14 | 28.6% |
| 10 to 14 Minutes | 12 | 24.5% |
| 15 to 19 Minutes | 0 | 0.0% |
| 20 to 24 Minutes | 10 | 20.4% |
| 25 to 29 Minutes | 0 | 0.0% |
| 30 to 34 Minutes | 0 | 0.0% |
| 35 to 39 Minutes | 0 | 0.0% |
| 40 to 44 Minutes | 8 | 16.3% |
| 45 to 59 Minutes | 0 | 0.0% |
| 60 to 89 Minutes | 0 | 0.0% |
| 90 or more Minutes | 5 | 10.2% |
Commute Time by Sex in Greenbush
The most common commute times in Greenbush are 10 to 14 minutes (12 commuters, 60.0%) for males and 5 to 9 minutes (14 commuters, 48.3%) for females.
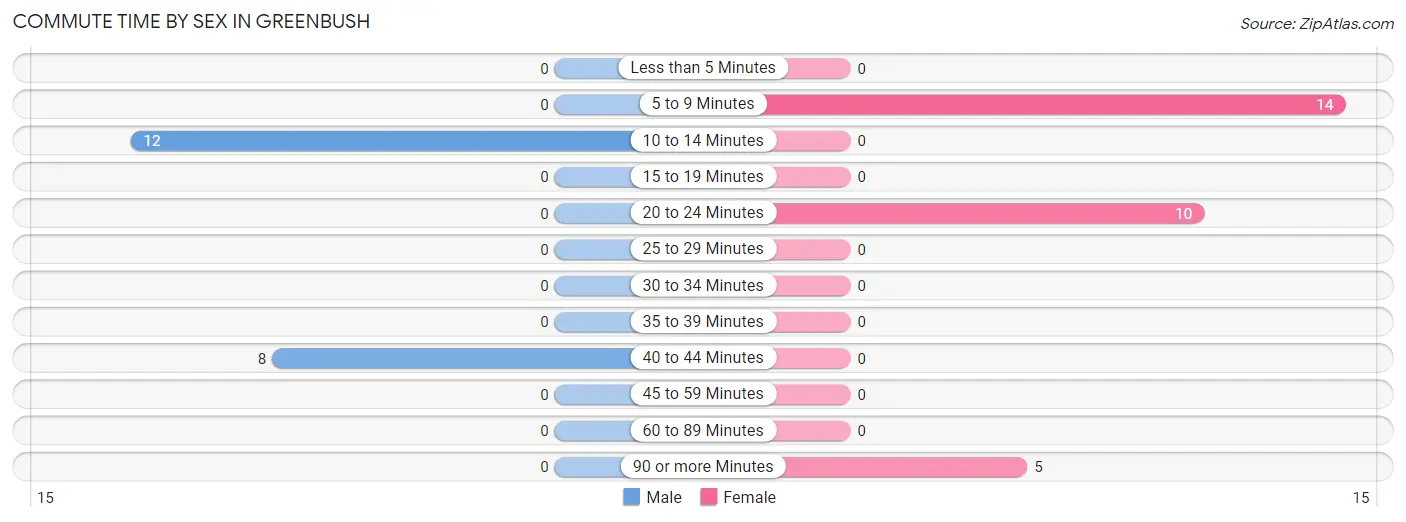
| Commute Time | Male | Female |
| Less than 5 Minutes | 0 (0.0%) | 0 (0.0%) |
| 5 to 9 Minutes | 0 (0.0%) | 14 (48.3%) |
| 10 to 14 Minutes | 12 (60.0%) | 0 (0.0%) |
| 15 to 19 Minutes | 0 (0.0%) | 0 (0.0%) |
| 20 to 24 Minutes | 0 (0.0%) | 10 (34.5%) |
| 25 to 29 Minutes | 0 (0.0%) | 0 (0.0%) |
| 30 to 34 Minutes | 0 (0.0%) | 0 (0.0%) |
| 35 to 39 Minutes | 0 (0.0%) | 0 (0.0%) |
| 40 to 44 Minutes | 8 (40.0%) | 0 (0.0%) |
| 45 to 59 Minutes | 0 (0.0%) | 0 (0.0%) |
| 60 to 89 Minutes | 0 (0.0%) | 0 (0.0%) |
| 90 or more Minutes | 0 (0.0%) | 5 (17.2%) |
Time of Departure to Work by Sex in Greenbush
The most frequent times of departure to work in Greenbush are 7:00 AM to 7:29 AM (17, 85.0%) for males and 7:30 AM to 7:59 AM (14, 48.3%) for females.
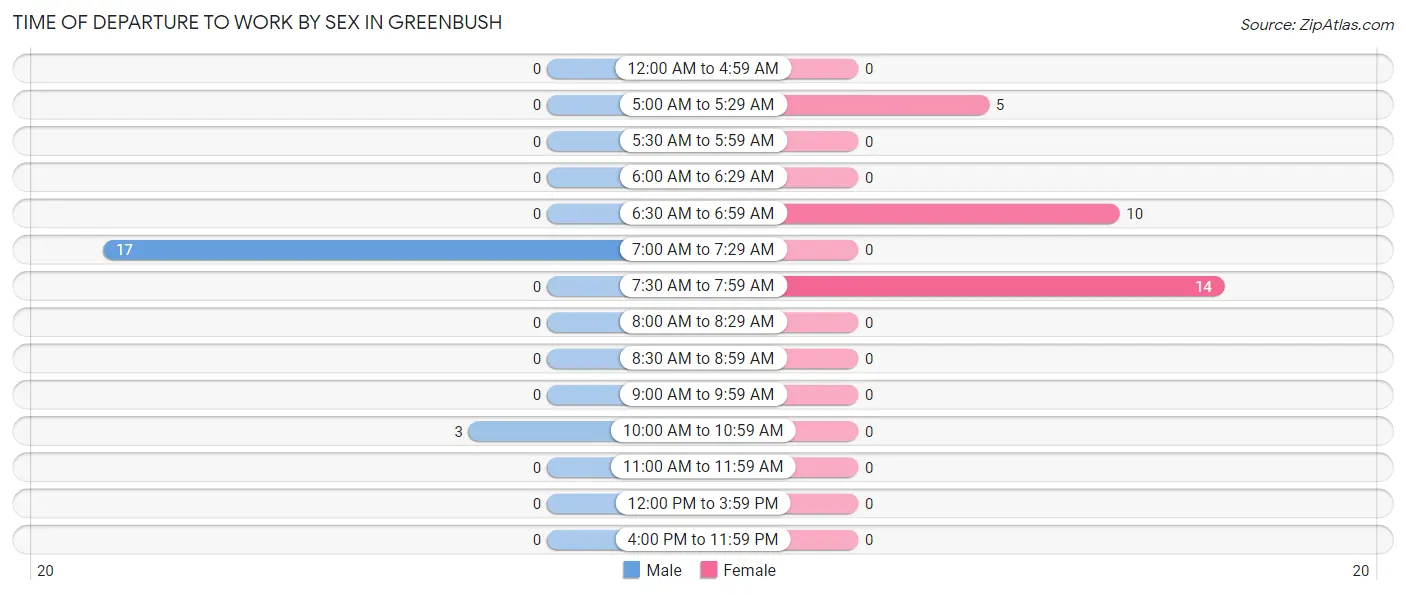
| Time of Departure | Male | Female |
| 12:00 AM to 4:59 AM | 0 (0.0%) | 0 (0.0%) |
| 5:00 AM to 5:29 AM | 0 (0.0%) | 5 (17.2%) |
| 5:30 AM to 5:59 AM | 0 (0.0%) | 0 (0.0%) |
| 6:00 AM to 6:29 AM | 0 (0.0%) | 0 (0.0%) |
| 6:30 AM to 6:59 AM | 0 (0.0%) | 10 (34.5%) |
| 7:00 AM to 7:29 AM | 17 (85.0%) | 0 (0.0%) |
| 7:30 AM to 7:59 AM | 0 (0.0%) | 14 (48.3%) |
| 8:00 AM to 8:29 AM | 0 (0.0%) | 0 (0.0%) |
| 8:30 AM to 8:59 AM | 0 (0.0%) | 0 (0.0%) |
| 9:00 AM to 9:59 AM | 0 (0.0%) | 0 (0.0%) |
| 10:00 AM to 10:59 AM | 3 (15.0%) | 0 (0.0%) |
| 11:00 AM to 11:59 AM | 0 (0.0%) | 0 (0.0%) |
| 12:00 PM to 3:59 PM | 0 (0.0%) | 0 (0.0%) |
| 4:00 PM to 11:59 PM | 0 (0.0%) | 0 (0.0%) |
| Total | 20 (100.0%) | 29 (100.0%) |
Housing Occupancy in Greenbush
Occupancy by Ownership in Greenbush
Of the total 35 dwellings in Greenbush, owner-occupied units account for 35 (100.0%), while renter-occupied units make up 0 (0.0%).
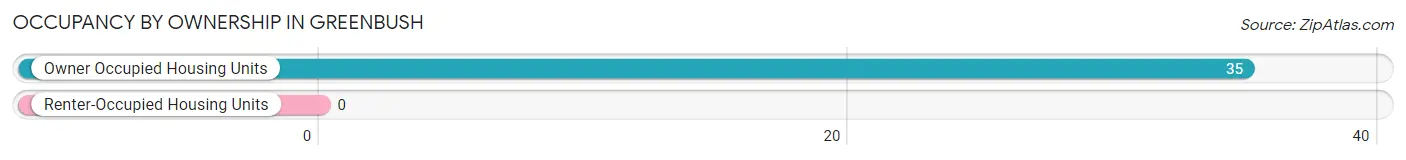
| Occupancy | # Housing Units | % Housing Units |
| Owner Occupied Housing Units | 35 | 100.0% |
| Renter-Occupied Housing Units | 0 | 0.0% |
| Total Occupied Housing Units | 35 | 100.0% |
Occupancy by Household Size in Greenbush
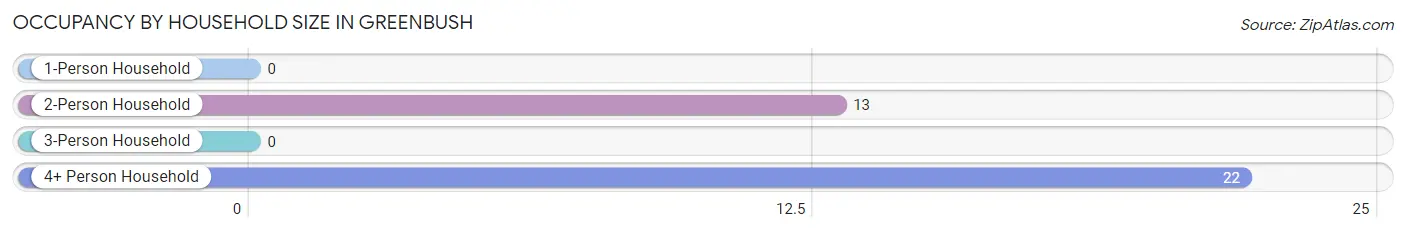
| Household Size | # Housing Units | % Housing Units |
| 1-Person Household | 0 | 0.0% |
| 2-Person Household | 13 | 37.1% |
| 3-Person Household | 0 | 0.0% |
| 4+ Person Household | 22 | 62.9% |
| Total Housing Units | 35 | 100.0% |
Occupancy by Ownership by Household Size in Greenbush
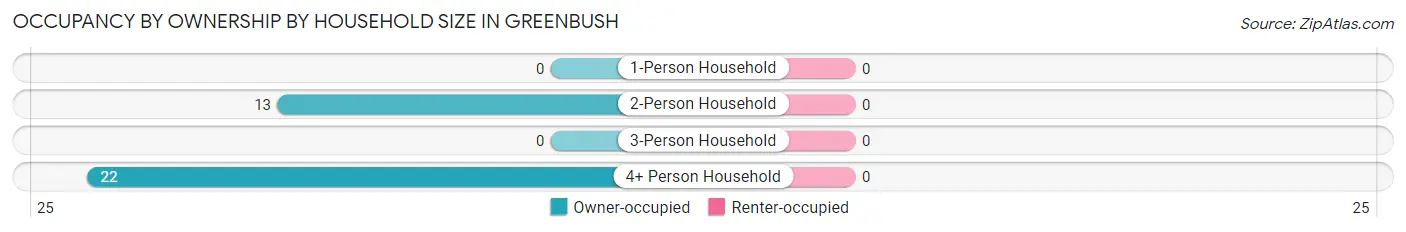
| Household Size | Owner-occupied | Renter-occupied |
| 1-Person Household | 0 (0.0%) | 0 (0.0%) |
| 2-Person Household | 13 (100.0%) | 0 (0.0%) |
| 3-Person Household | 0 (0.0%) | 0 (0.0%) |
| 4+ Person Household | 22 (100.0%) | 0 (0.0%) |
| Total Housing Units | 35 (100.0%) | 0 (0.0%) |
Occupancy by Educational Attainment in Greenbush
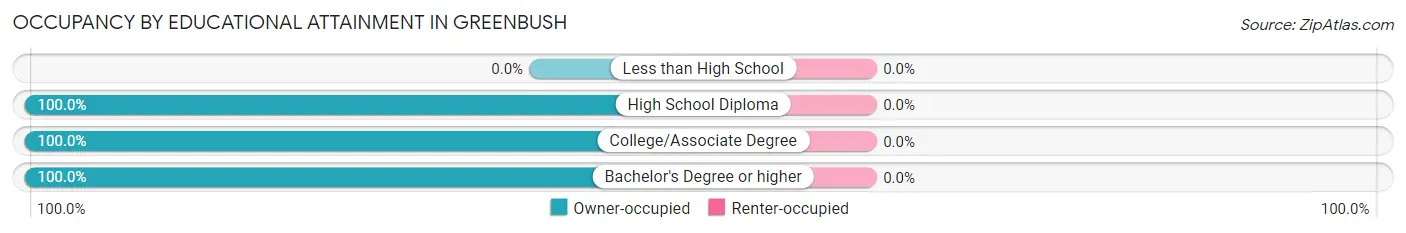
| Household Size | Owner-occupied | Renter-occupied |
| Less than High School | 0 (0.0%) | 0 (0.0%) |
| High School Diploma | 8 (100.0%) | 0 (0.0%) |
| College/Associate Degree | 19 (100.0%) | 0 (0.0%) |
| Bachelor's Degree or higher | 8 (100.0%) | 0 (0.0%) |
Occupancy by Age of Householder in Greenbush
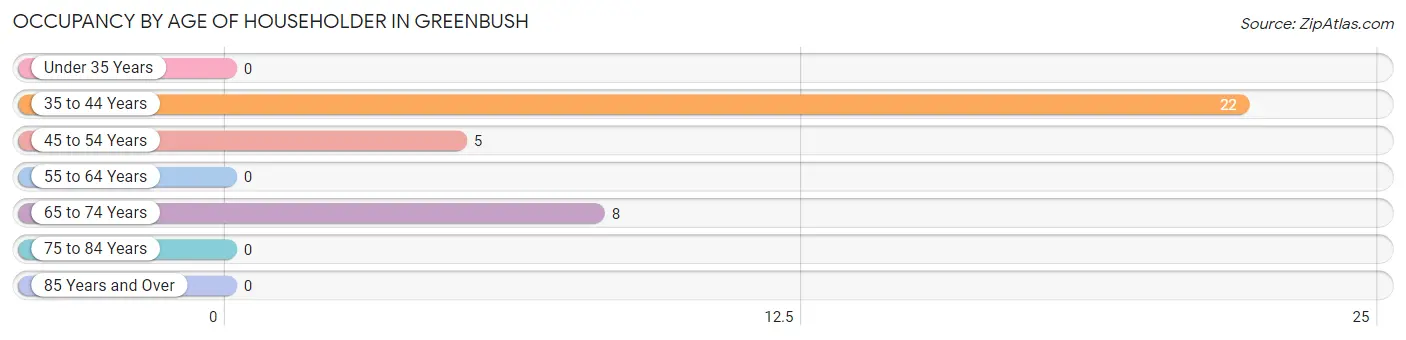
| Age Bracket | # Households | % Households |
| Under 35 Years | 0 | 0.0% |
| 35 to 44 Years | 22 | 62.9% |
| 45 to 54 Years | 5 | 14.3% |
| 55 to 64 Years | 0 | 0.0% |
| 65 to 74 Years | 8 | 22.9% |
| 75 to 84 Years | 0 | 0.0% |
| 85 Years and Over | 0 | 0.0% |
| Total | 35 | 100.0% |
Housing Finances in Greenbush
Median Income by Occupancy in Greenbush
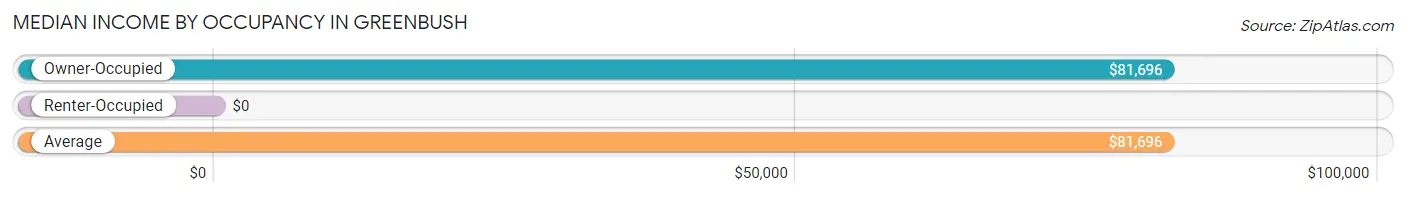
| Occupancy Type | # Households | Median Income |
| Owner-Occupied | 35 (100.0%) | $81,696 |
| Renter-Occupied | 0 (0.0%) | $0 |
| Average | 35 (100.0%) | $81,696 |
Occupancy by Householder Income Bracket in Greenbush
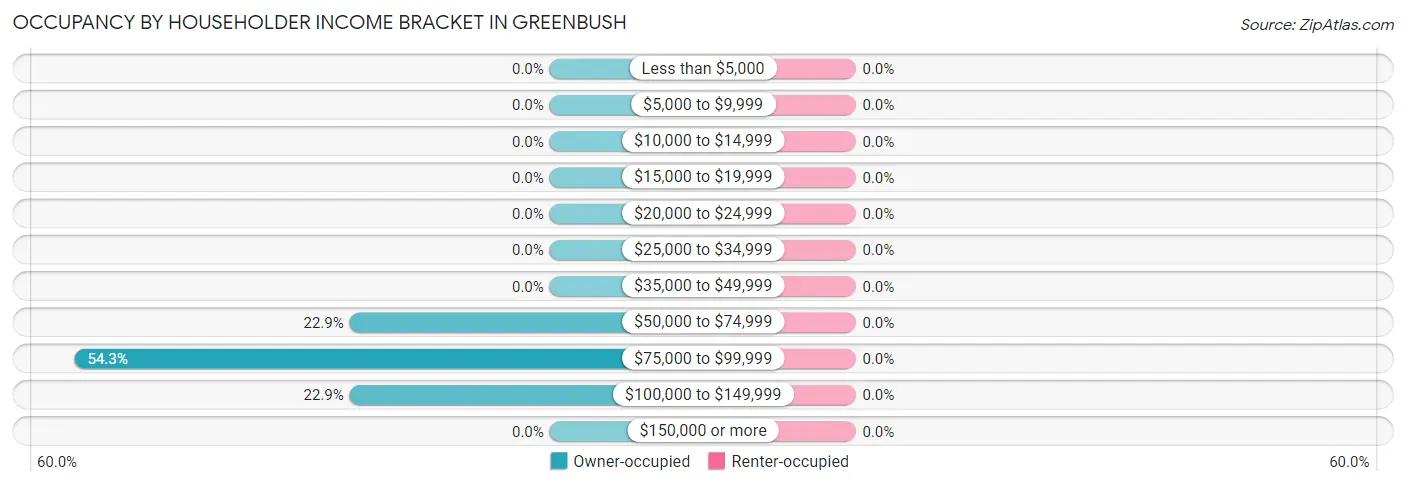
| Income Bracket | Owner-occupied | Renter-occupied |
| Less than $5,000 | 0 (0.0%) | 0 (0.0%) |
| $5,000 to $9,999 | 0 (0.0%) | 0 (0.0%) |
| $10,000 to $14,999 | 0 (0.0%) | 0 (0.0%) |
| $15,000 to $19,999 | 0 (0.0%) | 0 (0.0%) |
| $20,000 to $24,999 | 0 (0.0%) | 0 (0.0%) |
| $25,000 to $34,999 | 0 (0.0%) | 0 (0.0%) |
| $35,000 to $49,999 | 0 (0.0%) | 0 (0.0%) |
| $50,000 to $74,999 | 8 (22.9%) | 0 (0.0%) |
| $75,000 to $99,999 | 19 (54.3%) | 0 (0.0%) |
| $100,000 to $149,999 | 8 (22.9%) | 0 (0.0%) |
| $150,000 or more | 0 (0.0%) | 0 (0.0%) |
| Total | 35 (100.0%) | 0 (0.0%) |
Monthly Housing Cost Tiers in Greenbush
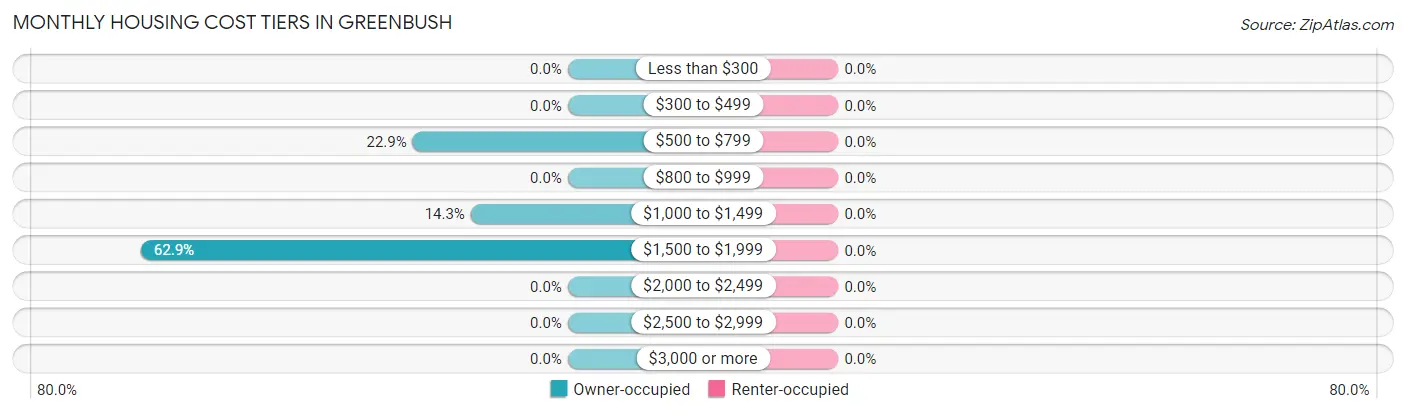
| Monthly Cost | Owner-occupied | Renter-occupied |
| Less than $300 | 0 (0.0%) | 0 (0.0%) |
| $300 to $499 | 0 (0.0%) | 0 (0.0%) |
| $500 to $799 | 8 (22.9%) | 0 (0.0%) |
| $800 to $999 | 0 (0.0%) | 0 (0.0%) |
| $1,000 to $1,499 | 5 (14.3%) | 0 (0.0%) |
| $1,500 to $1,999 | 22 (62.9%) | 0 (0.0%) |
| $2,000 to $2,499 | 0 (0.0%) | 0 (0.0%) |
| $2,500 to $2,999 | 0 (0.0%) | 0 (0.0%) |
| $3,000 or more | 0 (0.0%) | 0 (0.0%) |
| Total | 35 (100.0%) | 0 (0.0%) |
Physical Housing Characteristics in Greenbush
Housing Structures in Greenbush
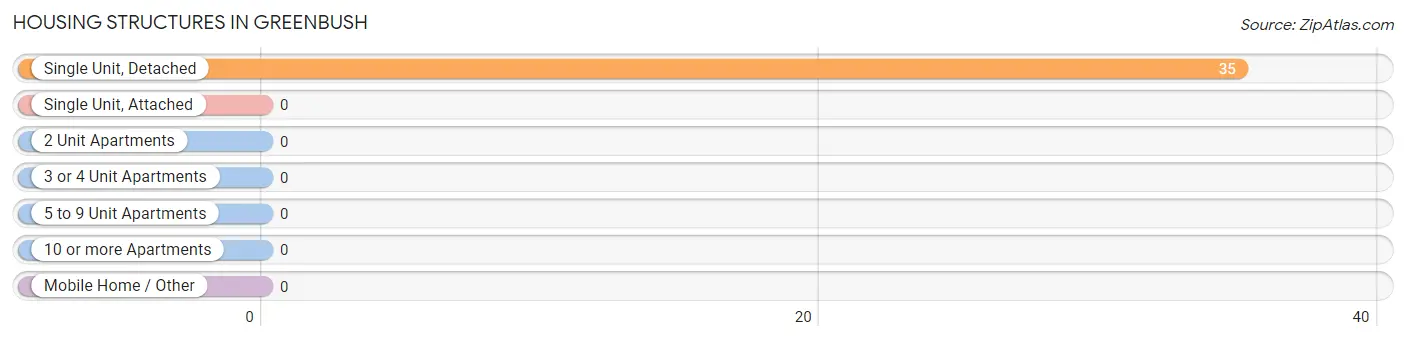
| Structure Type | # Housing Units | % Housing Units |
| Single Unit, Detached | 35 | 100.0% |
| Single Unit, Attached | 0 | 0.0% |
| 2 Unit Apartments | 0 | 0.0% |
| 3 or 4 Unit Apartments | 0 | 0.0% |
| 5 to 9 Unit Apartments | 0 | 0.0% |
| 10 or more Apartments | 0 | 0.0% |
| Mobile Home / Other | 0 | 0.0% |
| Total | 35 | 100.0% |
Housing Structures by Occupancy in Greenbush
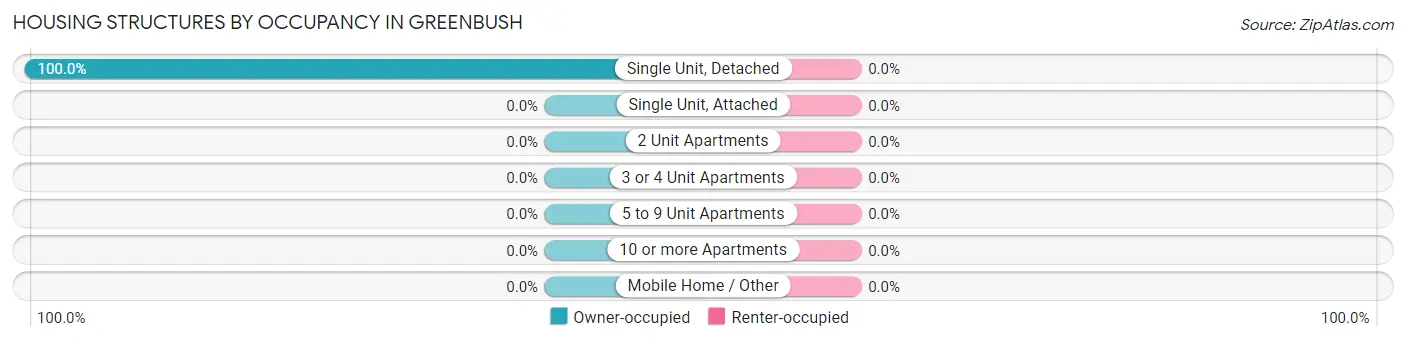
| Structure Type | Owner-occupied | Renter-occupied |
| Single Unit, Detached | 35 (100.0%) | 0 (0.0%) |
| Single Unit, Attached | 0 (0.0%) | 0 (0.0%) |
| 2 Unit Apartments | 0 (0.0%) | 0 (0.0%) |
| 3 or 4 Unit Apartments | 0 (0.0%) | 0 (0.0%) |
| 5 to 9 Unit Apartments | 0 (0.0%) | 0 (0.0%) |
| 10 or more Apartments | 0 (0.0%) | 0 (0.0%) |
| Mobile Home / Other | 0 (0.0%) | 0 (0.0%) |
| Total | 35 (100.0%) | 0 (0.0%) |
Housing Structures by Number of Rooms in Greenbush
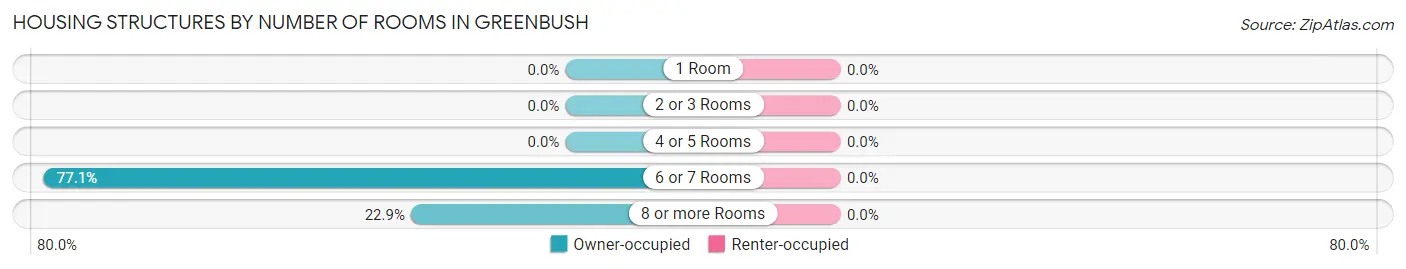
| Number of Rooms | Owner-occupied | Renter-occupied |
| 1 Room | 0 (0.0%) | 0 (0.0%) |
| 2 or 3 Rooms | 0 (0.0%) | 0 (0.0%) |
| 4 or 5 Rooms | 0 (0.0%) | 0 (0.0%) |
| 6 or 7 Rooms | 27 (77.1%) | 0 (0.0%) |
| 8 or more Rooms | 8 (22.9%) | 0 (0.0%) |
| Total | 35 (100.0%) | 0 (0.0%) |
Housing Structure by Heating Type in Greenbush
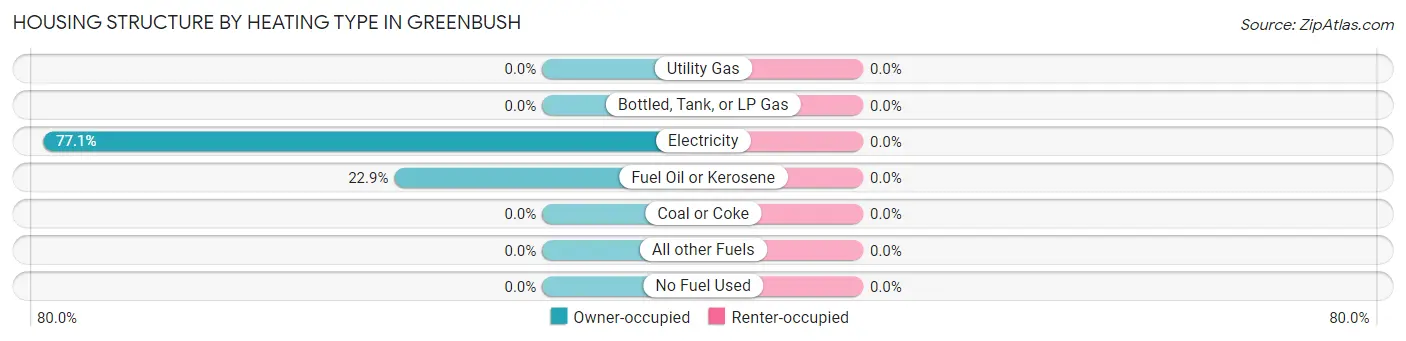
| Heating Type | Owner-occupied | Renter-occupied |
| Utility Gas | 0 (0.0%) | 0 (0.0%) |
| Bottled, Tank, or LP Gas | 0 (0.0%) | 0 (0.0%) |
| Electricity | 27 (77.1%) | 0 (0.0%) |
| Fuel Oil or Kerosene | 8 (22.9%) | 0 (0.0%) |
| Coal or Coke | 0 (0.0%) | 0 (0.0%) |
| All other Fuels | 0 (0.0%) | 0 (0.0%) |
| No Fuel Used | 0 (0.0%) | 0 (0.0%) |
| Total | 35 (100.0%) | 0 (0.0%) |
Household Vehicle Usage in Greenbush
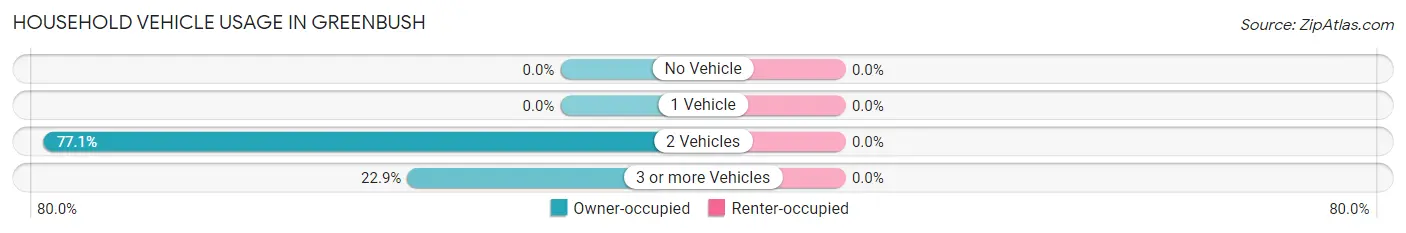
| Vehicles per Household | Owner-occupied | Renter-occupied |
| No Vehicle | 0 (0.0%) | 0 (0.0%) |
| 1 Vehicle | 0 (0.0%) | 0 (0.0%) |
| 2 Vehicles | 27 (77.1%) | 0 (0.0%) |
| 3 or more Vehicles | 8 (22.9%) | 0 (0.0%) |
| Total | 35 (100.0%) | 0 (0.0%) |
Real Estate & Mortgages in Greenbush
Real Estate and Mortgage Overview in Greenbush
| Characteristic | Without Mortgage | With Mortgage |
| Housing Units | 0 | 35 |
| Median Property Value | - | - |
| Median Household Income | - | - |
| Monthly Housing Costs | - | - |
| Real Estate Taxes | - | - |
Property Value by Mortgage Status in Greenbush
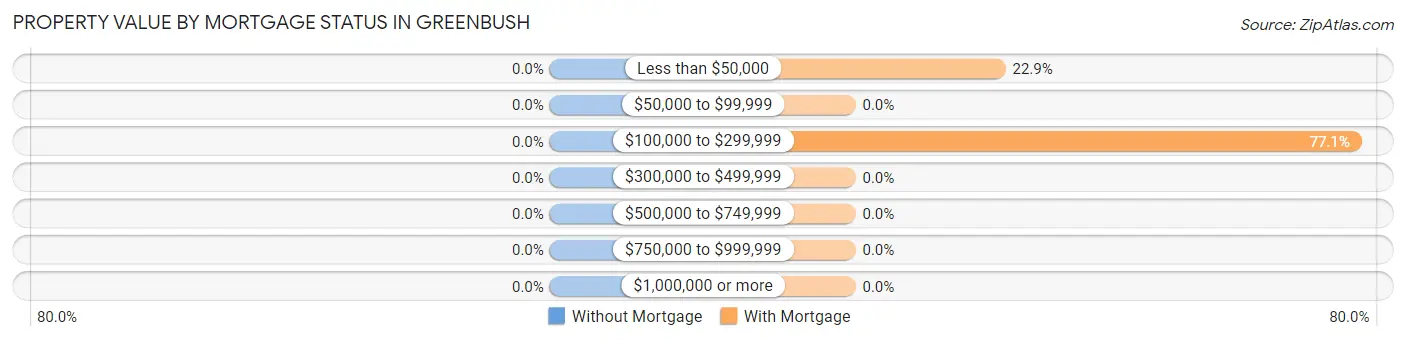
| Property Value | Without Mortgage | With Mortgage |
| Less than $50,000 | 0 (0.0%) | 8 (22.9%) |
| $50,000 to $99,999 | 0 (0.0%) | 0 (0.0%) |
| $100,000 to $299,999 | 0 (0.0%) | 27 (77.1%) |
| $300,000 to $499,999 | 0 (0.0%) | 0 (0.0%) |
| $500,000 to $749,999 | 0 (0.0%) | 0 (0.0%) |
| $750,000 to $999,999 | 0 (0.0%) | 0 (0.0%) |
| $1,000,000 or more | 0 (0.0%) | 0 (0.0%) |
| Total | 0 (0.0%) | 35 (100.0%) |
Household Income by Mortgage Status in Greenbush
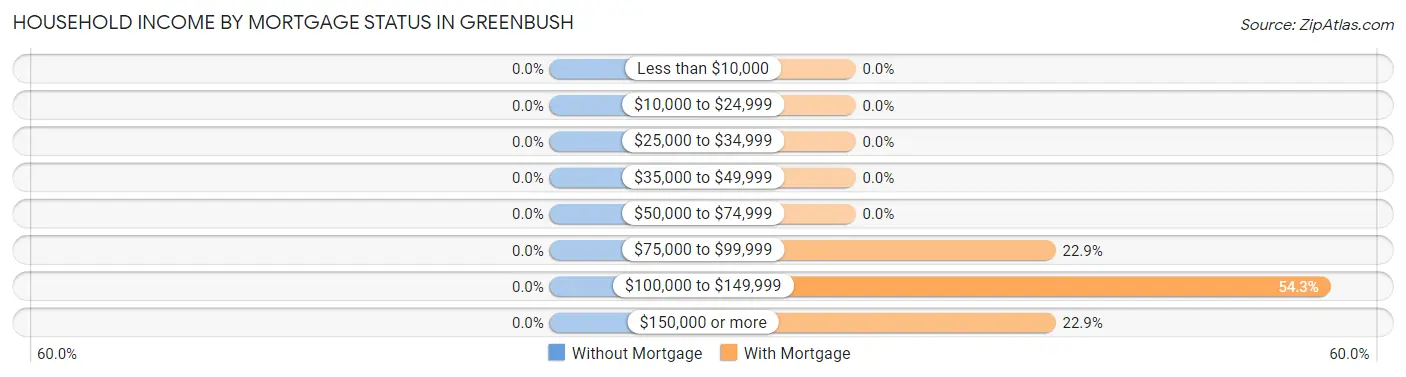
| Household Income | Without Mortgage | With Mortgage |
| Less than $10,000 | 0 (0.0%) | 0 (0.0%) |
| $10,000 to $24,999 | 0 (0.0%) | 0 (0.0%) |
| $25,000 to $34,999 | 0 (0.0%) | 0 (0.0%) |
| $35,000 to $49,999 | 0 (0.0%) | 0 (0.0%) |
| $50,000 to $74,999 | 0 (0.0%) | 0 (0.0%) |
| $75,000 to $99,999 | 0 (0.0%) | 8 (22.9%) |
| $100,000 to $149,999 | 0 (0.0%) | 19 (54.3%) |
| $150,000 or more | 0 (0.0%) | 8 (22.9%) |
| Total | 0 (0.0%) | 35 (100.0%) |
Property Value to Household Income Ratio in Greenbush
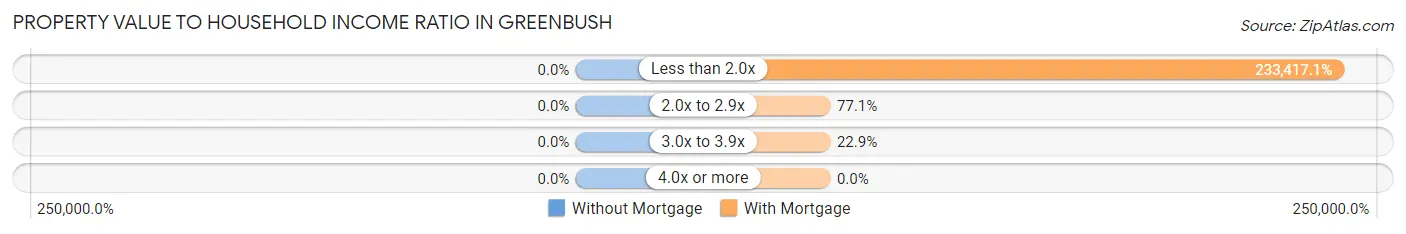
| Value-to-Income Ratio | Without Mortgage | With Mortgage |
| Less than 2.0x | 0 (0.0%) | 81,696 (233,417.1%) |
| 2.0x to 2.9x | 0 (0.0%) | 27 (77.1%) |
| 3.0x to 3.9x | 0 (0.0%) | 8 (22.9%) |
| 4.0x or more | 0 (0.0%) | 0 (0.0%) |
| Total | 0 (0.0%) | 35 (100.0%) |
Real Estate Taxes by Mortgage Status in Greenbush
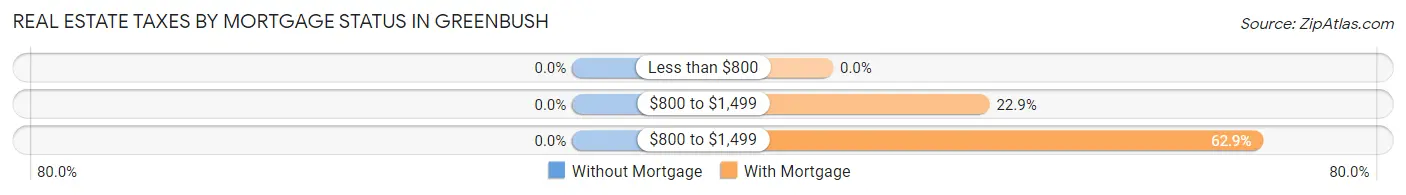
| Property Taxes | Without Mortgage | With Mortgage |
| Less than $800 | 0 (0.0%) | 0 (0.0%) |
| $800 to $1,499 | 0 (0.0%) | 8 (22.9%) |
| $800 to $1,499 | 0 (0.0%) | 22 (62.9%) |
| Total | 0 (0.0%) | 35 (100.0%) |
Health & Disability in Greenbush
Health Insurance Coverage by Age in Greenbush
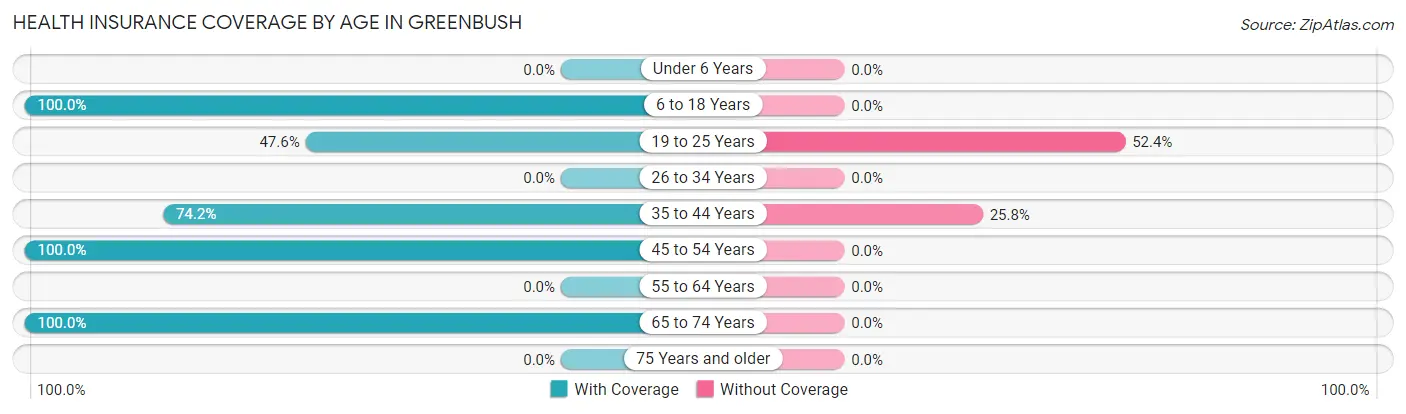
| Age Bracket | With Coverage | Without Coverage |
| Under 6 Years | 0 (0.0%) | 0 (0.0%) |
| 6 to 18 Years | 55 (100.0%) | 0 (0.0%) |
| 19 to 25 Years | 10 (47.6%) | 11 (52.4%) |
| 26 to 34 Years | 0 (0.0%) | 0 (0.0%) |
| 35 to 44 Years | 23 (74.2%) | 8 (25.8%) |
| 45 to 54 Years | 18 (100.0%) | 0 (0.0%) |
| 55 to 64 Years | 0 (0.0%) | 0 (0.0%) |
| 65 to 74 Years | 19 (100.0%) | 0 (0.0%) |
| 75 Years and older | 0 (0.0%) | 0 (0.0%) |
| Total | 125 (86.8%) | 19 (13.2%) |
Health Insurance Coverage by Citizenship Status in Greenbush
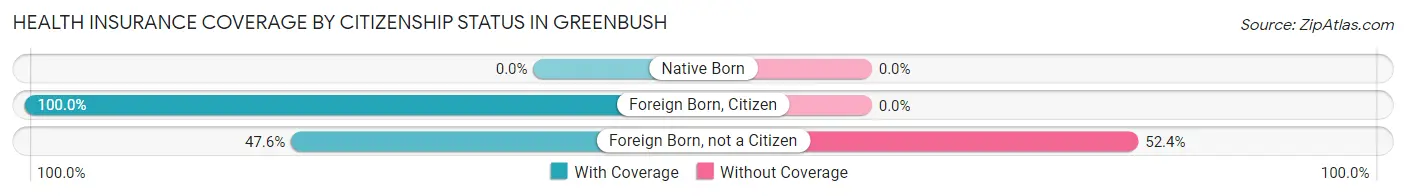
| Citizenship Status | With Coverage | Without Coverage |
| Native Born | 0 (0.0%) | 0 (0.0%) |
| Foreign Born, Citizen | 55 (100.0%) | 0 (0.0%) |
| Foreign Born, not a Citizen | 10 (47.6%) | 11 (52.4%) |
Health Insurance Coverage by Household Income in Greenbush
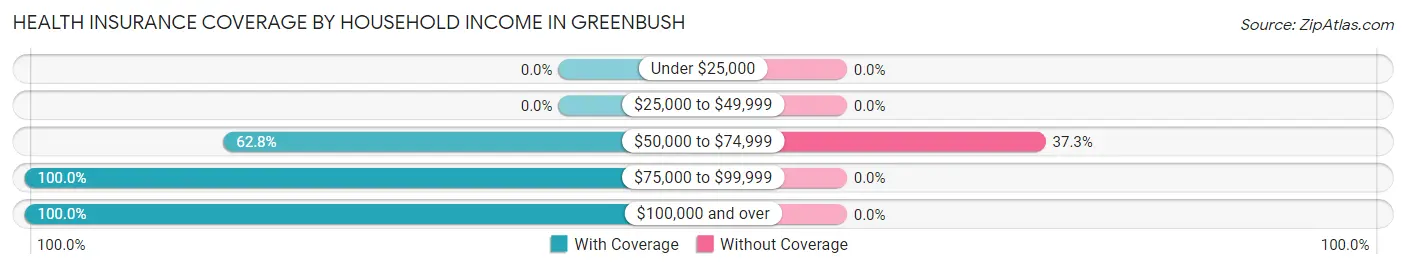
| Household Income | With Coverage | Without Coverage |
| Under $25,000 | 0 (0.0%) | 0 (0.0%) |
| $25,000 to $49,999 | 0 (0.0%) | 0 (0.0%) |
| $50,000 to $74,999 | 32 (62.7%) | 19 (37.2%) |
| $75,000 to $99,999 | 74 (100.0%) | 0 (0.0%) |
| $100,000 and over | 19 (100.0%) | 0 (0.0%) |
Public vs Private Health Insurance Coverage by Age in Greenbush
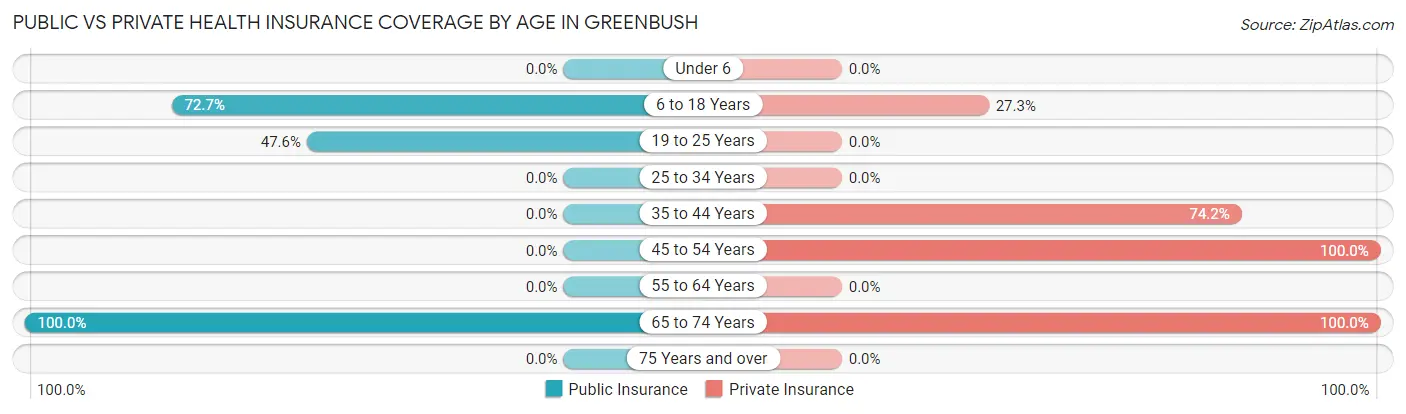
| Age Bracket | Public Insurance | Private Insurance |
| Under 6 | 0 (0.0%) | 0 (0.0%) |
| 6 to 18 Years | 40 (72.7%) | 15 (27.3%) |
| 19 to 25 Years | 10 (47.6%) | 0 (0.0%) |
| 25 to 34 Years | 0 (0.0%) | 0 (0.0%) |
| 35 to 44 Years | 0 (0.0%) | 23 (74.2%) |
| 45 to 54 Years | 0 (0.0%) | 18 (100.0%) |
| 55 to 64 Years | 0 (0.0%) | 0 (0.0%) |
| 65 to 74 Years | 19 (100.0%) | 19 (100.0%) |
| 75 Years and over | 0 (0.0%) | 0 (0.0%) |
| Total | 69 (47.9%) | 75 (52.1%) |
Disability Status by Sex by Age in Greenbush
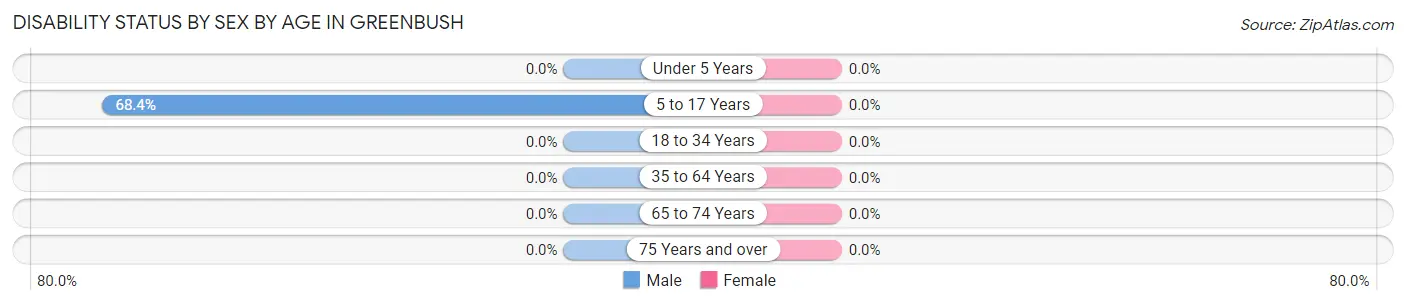
| Age Bracket | Male | Female |
| Under 5 Years | 0 (0.0%) | 0 (0.0%) |
| 5 to 17 Years | 13 (68.4%) | 0 (0.0%) |
| 18 to 34 Years | 0 (0.0%) | 0 (0.0%) |
| 35 to 64 Years | 0 (0.0%) | 0 (0.0%) |
| 65 to 74 Years | 0 (0.0%) | 0 (0.0%) |
| 75 Years and over | 0 (0.0%) | 0 (0.0%) |
Disability Class by Sex by Age in Greenbush
Disability Class: Hearing Difficulty

| Age Bracket | Male | Female |
| Under 5 Years | 0 (0.0%) | 0 (0.0%) |
| 5 to 17 Years | 0 (0.0%) | 0 (0.0%) |
| 18 to 34 Years | 0 (0.0%) | 0 (0.0%) |
| 35 to 64 Years | 0 (0.0%) | 0 (0.0%) |
| 65 to 74 Years | 0 (0.0%) | 0 (0.0%) |
| 75 Years and over | 0 (0.0%) | 0 (0.0%) |
Disability Class: Vision Difficulty
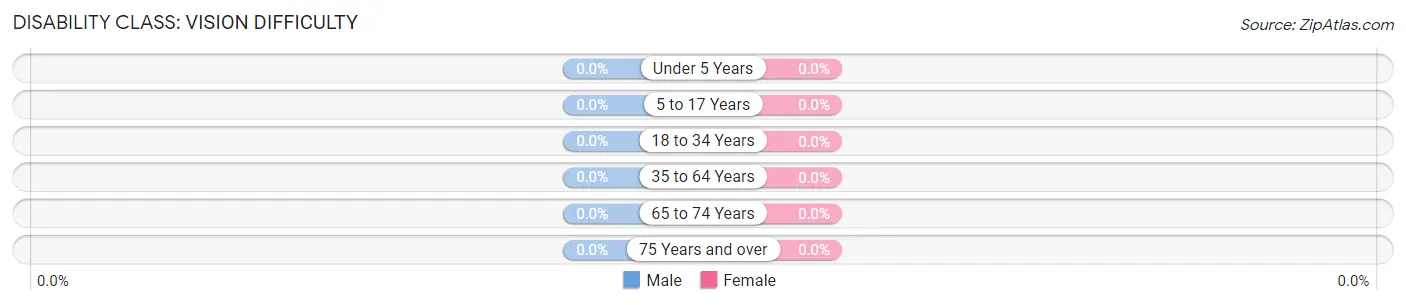
| Age Bracket | Male | Female |
| Under 5 Years | 0 (0.0%) | 0 (0.0%) |
| 5 to 17 Years | 0 (0.0%) | 0 (0.0%) |
| 18 to 34 Years | 0 (0.0%) | 0 (0.0%) |
| 35 to 64 Years | 0 (0.0%) | 0 (0.0%) |
| 65 to 74 Years | 0 (0.0%) | 0 (0.0%) |
| 75 Years and over | 0 (0.0%) | 0 (0.0%) |
Disability Class: Cognitive Difficulty
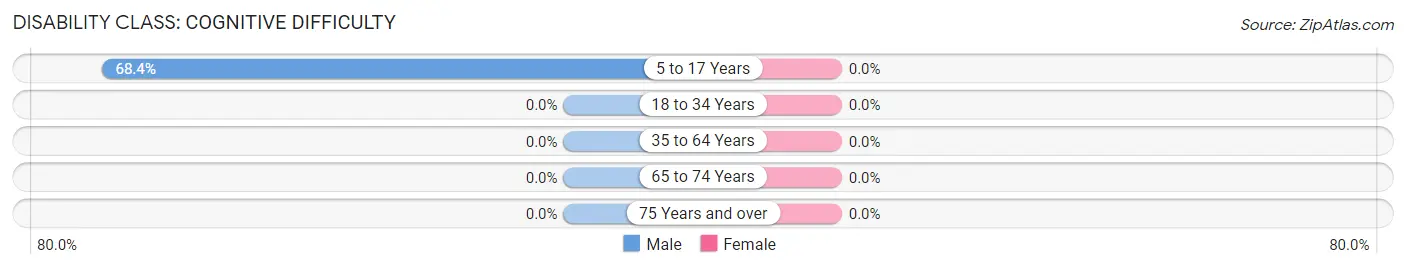
| Age Bracket | Male | Female |
| 5 to 17 Years | 13 (68.4%) | 0 (0.0%) |
| 18 to 34 Years | 0 (0.0%) | 0 (0.0%) |
| 35 to 64 Years | 0 (0.0%) | 0 (0.0%) |
| 65 to 74 Years | 0 (0.0%) | 0 (0.0%) |
| 75 Years and over | 0 (0.0%) | 0 (0.0%) |
Disability Class: Ambulatory Difficulty
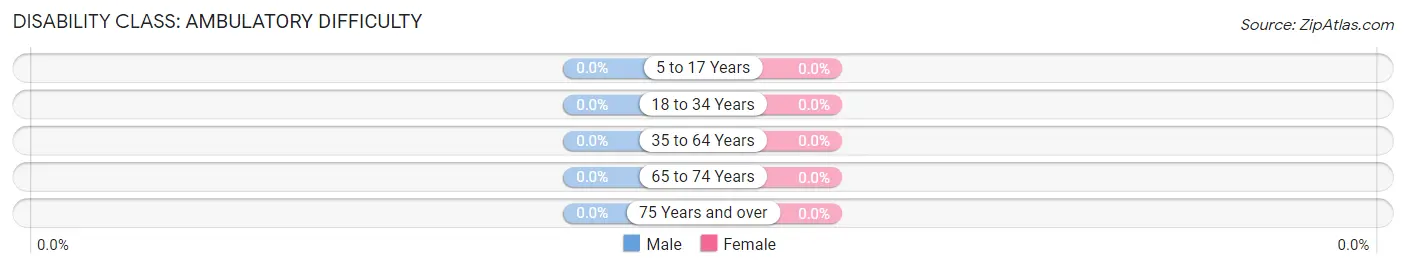
| Age Bracket | Male | Female |
| 5 to 17 Years | 0 (0.0%) | 0 (0.0%) |
| 18 to 34 Years | 0 (0.0%) | 0 (0.0%) |
| 35 to 64 Years | 0 (0.0%) | 0 (0.0%) |
| 65 to 74 Years | 0 (0.0%) | 0 (0.0%) |
| 75 Years and over | 0 (0.0%) | 0 (0.0%) |
Disability Class: Self-Care Difficulty
| Age Bracket | Male | Female |
| 5 to 17 Years | 0 (0.0%) | 0 (0.0%) |
| 18 to 34 Years | 0 (0.0%) | 0 (0.0%) |
| 35 to 64 Years | 0 (0.0%) | 0 (0.0%) |
| 65 to 74 Years | 0 (0.0%) | 0 (0.0%) |
| 75 Years and over | 0 (0.0%) | 0 (0.0%) |
Technology Access in Greenbush
Computing Device Access in Greenbush
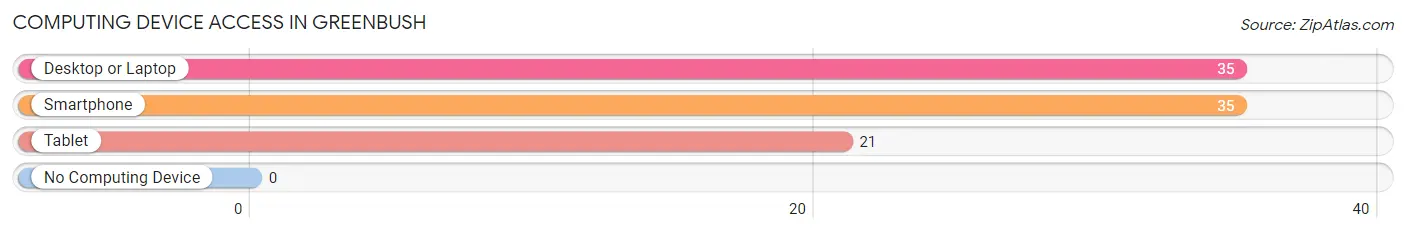
| Device Type | # Households | % Households |
| Desktop or Laptop | 35 | 100.0% |
| Smartphone | 35 | 100.0% |
| Tablet | 21 | 60.0% |
| No Computing Device | 0 | 0.0% |
| Total | 35 | 100.0% |
Internet Access in Greenbush
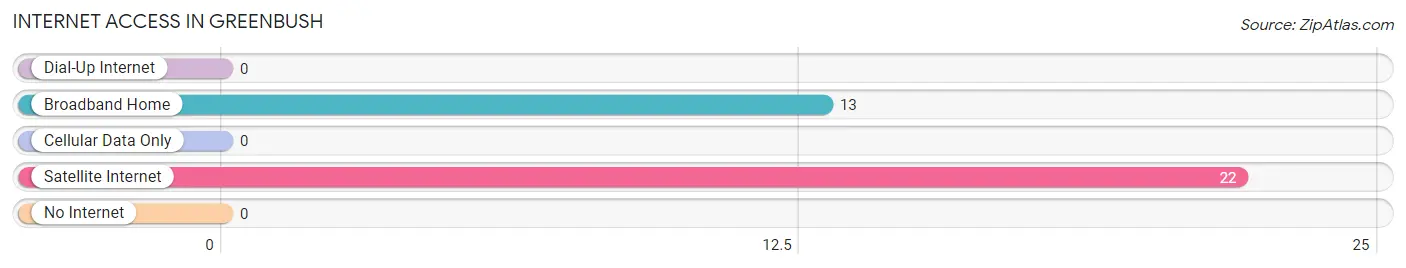
| Internet Type | # Households | % Households |
| Dial-Up Internet | 0 | 0.0% |
| Broadband Home | 13 | 37.1% |
| Cellular Data Only | 0 | 0.0% |
| Satellite Internet | 22 | 62.9% |
| No Internet | 0 | 0.0% |
| Total | 35 | 100.0% |
Greenbush Summary
History
The town of Greenbush, Virginia is located in the Shenandoah Valley of Virginia, and is part of Rockingham County. The town was first settled in the late 1700s by German immigrants, and was originally known as “Greenbush”. The town was officially incorporated in 1820, and was named after the nearby Greenbush Creek.
The town of Greenbush was an important stop on the Valley Turnpike, which was a major transportation route in the area. The town was also a major stop on the Winchester and Potomac Railroad, which was built in the mid-1800s. The railroad was an important part of the town’s economy, as it allowed for the transportation of goods and people to and from the town.
During the Civil War, the town of Greenbush was the site of several battles, including the Battle of Cross Keys and the Battle of Port Republic. The town was also the site of a Confederate hospital, which was used to treat wounded soldiers.
Geography
Greenbush is located in the Shenandoah Valley of Virginia, and is part of Rockingham County. The town is situated at the intersection of the Valley Turnpike and the Winchester and Potomac Railroad. The town is located at the base of the Blue Ridge Mountains, and is surrounded by rolling hills and farmland.
The town of Greenbush is located approximately 30 miles south of Winchester, Virginia, and is approximately 60 miles west of Washington, D.C. The town is located near the Shenandoah River, and is close to several state parks, including Shenandoah National Park and George Washington National Forest.
Economy
The economy of Greenbush is largely based on agriculture and tourism. The town is home to several farms, which produce a variety of crops, including corn, soybeans, wheat, and hay. The town is also home to several wineries, which produce a variety of wines.
The town of Greenbush is also a popular tourist destination, as it is located near several state parks and other attractions. The town is home to several bed and breakfasts, as well as several restaurants and shops. The town is also home to several historic sites, including the Greenbush Historic District, which is listed on the National Register of Historic Places.
Demographics
As of the 2010 census, the town of Greenbush had a population of 1,845. The population is largely white (94.3%), with a small percentage of African Americans (2.3%) and Hispanics (2.2%). The median household income in the town is $45,000, and the median home value is $150,000. The town has a low unemployment rate (3.2%), and a high rate of homeownership (83.3%).
Common Questions
What is Per Capita Income in Greenbush?
Per Capita income in Greenbush is $21,558.
What is the Median Family Income in Greenbush?
Median Family Income in Greenbush is $81,696.
What is the Median Household income in Greenbush?
Median Household Income in Greenbush is $81,696.
What is Income or Wage Gap in Greenbush?
Income or Wage Gap in Greenbush is 23.6%.
Women in Greenbush earn 76.4 cents for every dollar earned by a man.
What is Inequality or Gini Index in Greenbush?
Inequality or Gini Index in Greenbush is 0.10.
What is the Total Population of Greenbush?
Total Population of Greenbush is 149.
What is the Total Male Population of Greenbush?
Total Male Population of Greenbush is 65.
What is the Total Female Population of Greenbush?
Total Female Population of Greenbush is 84.
What is the Ratio of Males per 100 Females in Greenbush?
There are 77.38 Males per 100 Females in Greenbush.
What is the Ratio of Females per 100 Males in Greenbush?
There are 129.23 Females per 100 Males in Greenbush.
What is the Median Population Age in Greenbush?
Median Population Age in Greenbush is 25.9 Years.
What is the Average Family Size in Greenbush
Average Family Size in Greenbush is 4.0 People.
What is the Average Household Size in Greenbush
Average Household Size in Greenbush is 4.3 People.
How Large is the Labor Force in Greenbush?
There are 49 People in the Labor Forcein in Greenbush.
What is the Percentage of People in the Labor Force in Greenbush?
49.0% of People are in the Labor Force in Greenbush.