Scotland, VA Map & Demographics
Scotland Map
Scotland Overview
$41,940
PER CAPITA INCOME
0.46
INEQUALITY / GINI INDEX
123
TOTAL POPULATION
74
MALE POPULATION
49
FEMALE POPULATION
151.02
MALES / 100 FEMALES
66.22
FEMALES / 100 MALES
52.1
MEDIAN AGE
3.9
AVG FAMILY SIZE
2.3
AVG HOUSEHOLD SIZE
48
LABOR FORCE [ PEOPLE ]
49.0%
PERCENT IN LABOR FORCE
Income in Scotland
Income Overview in Scotland
| Characteristic | Number | Measure |
| Per Capita Income | 123 | $41,940 |
| Median Family Income | 17 | $0 |
| Mean Family Income | 17 | $132,712 |
| Median Household Income | 53 | $0 |
| Mean Household Income | 53 | $84,009 |
| Income Deficit | 17 | $0 |
| Wage / Income Gap (%) | 123 | 0.00% |
| Wage / Income Gap ($) | 123 | 100.00¢ per $1 |
| Gini / Inequality Index | 123 | 0.46 |
Earnings by Sex in Scotland
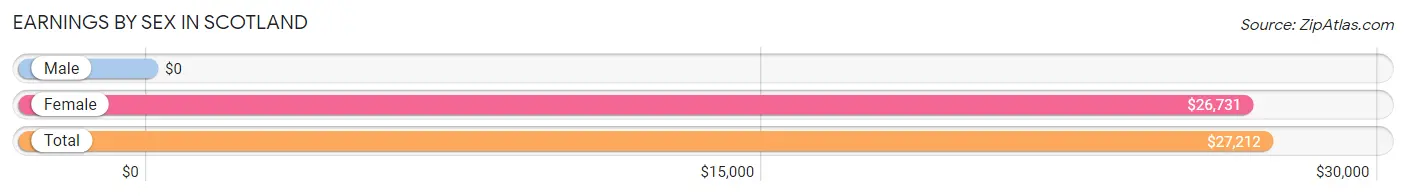
| Sex | Number | Average Earnings |
| Male | 35 (55.6%) | $0 |
| Female | 28 (44.4%) | $26,731 |
| Total | 63 (100.0%) | $27,212 |
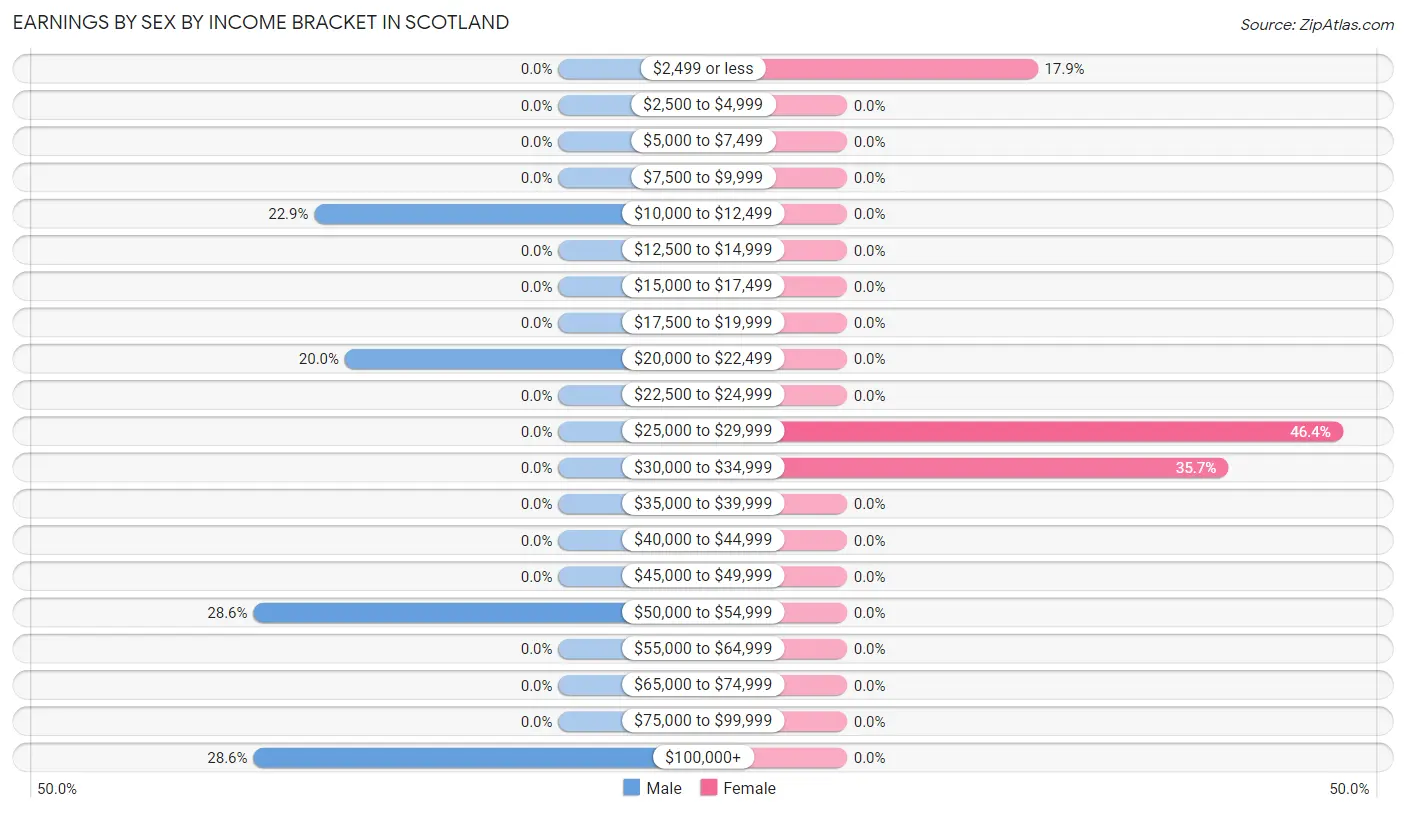
Earnings by Sex by Income Bracket in Scotland
The most common earnings brackets in Scotland are $50,000 to $54,999 for men (10 | 28.6%) and $25,000 to $29,999 for women (13 | 46.4%).
| Income | Male | Female |
| $2,499 or less | 0 (0.0%) | 5 (17.9%) |
| $2,500 to $4,999 | 0 (0.0%) | 0 (0.0%) |
| $5,000 to $7,499 | 0 (0.0%) | 0 (0.0%) |
| $7,500 to $9,999 | 0 (0.0%) | 0 (0.0%) |
| $10,000 to $12,499 | 8 (22.9%) | 0 (0.0%) |
| $12,500 to $14,999 | 0 (0.0%) | 0 (0.0%) |
| $15,000 to $17,499 | 0 (0.0%) | 0 (0.0%) |
| $17,500 to $19,999 | 0 (0.0%) | 0 (0.0%) |
| $20,000 to $22,499 | 7 (20.0%) | 0 (0.0%) |
| $22,500 to $24,999 | 0 (0.0%) | 0 (0.0%) |
| $25,000 to $29,999 | 0 (0.0%) | 13 (46.4%) |
| $30,000 to $34,999 | 0 (0.0%) | 10 (35.7%) |
| $35,000 to $39,999 | 0 (0.0%) | 0 (0.0%) |
| $40,000 to $44,999 | 0 (0.0%) | 0 (0.0%) |
| $45,000 to $49,999 | 0 (0.0%) | 0 (0.0%) |
| $50,000 to $54,999 | 10 (28.6%) | 0 (0.0%) |
| $55,000 to $64,999 | 0 (0.0%) | 0 (0.0%) |
| $65,000 to $74,999 | 0 (0.0%) | 0 (0.0%) |
| $75,000 to $99,999 | 0 (0.0%) | 0 (0.0%) |
| $100,000+ | 10 (28.6%) | 0 (0.0%) |
| Total | 35 (100.0%) | 28 (100.0%) |
Earnings by Sex by Educational Attainment in Scotland
| Educational Attainment | Male Income | Female Income |
| Less than High School | - | - |
| High School Diploma | - | - |
| College or Associate's Degree | - | - |
| Bachelor's Degree | - | - |
| Graduate Degree | - | - |
| Total | - | - |
Family Income in Scotland
Family Income Brackets in Scotland
According to the Scotland family income data, there are 6 families falling into the $15,000 to $24,999 income range, which is the most common income bracket and makes up 35.3% of all families.
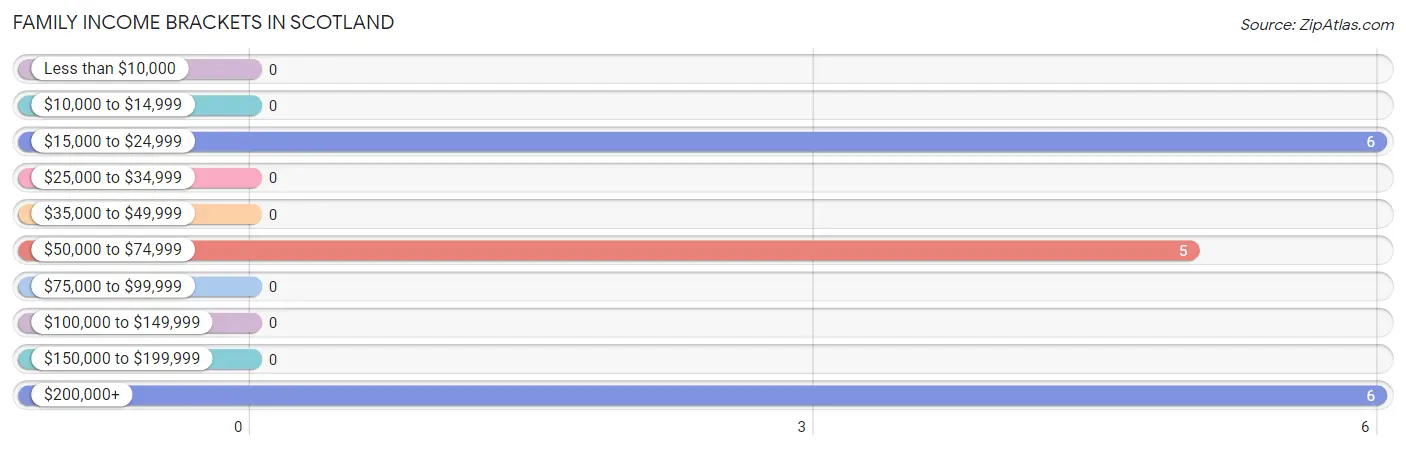
| Income Bracket | # Families | % Families |
| Less than $10,000 | 0 | 0.0% |
| $10,000 to $14,999 | 0 | 0.0% |
| $15,000 to $24,999 | 6 | 35.3% |
| $25,000 to $34,999 | 0 | 0.0% |
| $35,000 to $49,999 | 0 | 0.0% |
| $50,000 to $74,999 | 5 | 29.4% |
| $75,000 to $99,999 | 0 | 0.0% |
| $100,000 to $149,999 | 0 | 0.0% |
| $150,000 to $199,999 | 0 | 0.0% |
| $200,000+ | 6 | 35.3% |
Family Income by Famaliy Size in Scotland
| Income Bracket | # Families | Median Income |
| 2-Person Families | 11 (64.7%) | $0 |
| 3-Person Families | 0 (0.0%) | $0 |
| 4-Person Families | 6 (35.3%) | $0 |
| 5-Person Families | 0 (0.0%) | $0 |
| 6-Person Families | 0 (0.0%) | $0 |
| 7+ Person Families | 0 (0.0%) | $0 |
| Total | 17 (100.0%) | $0 |
Family Income by Number of Earners in Scotland
| Number of Earners | # Families | Median Income |
| No Earners | 0 (0.0%) | $0 |
| 1 Earner | 12 (70.6%) | $0 |
| 2 Earners | 5 (29.4%) | $0 |
| 3+ Earners | 0 (0.0%) | $0 |
| Total | 17 (100.0%) | $0 |
Household Income in Scotland
Household Income Brackets in Scotland
With 17 households falling in the category, the $25,000 to $34,999 income range is the most frequent in Scotland, accounting for 32.1% of all households.
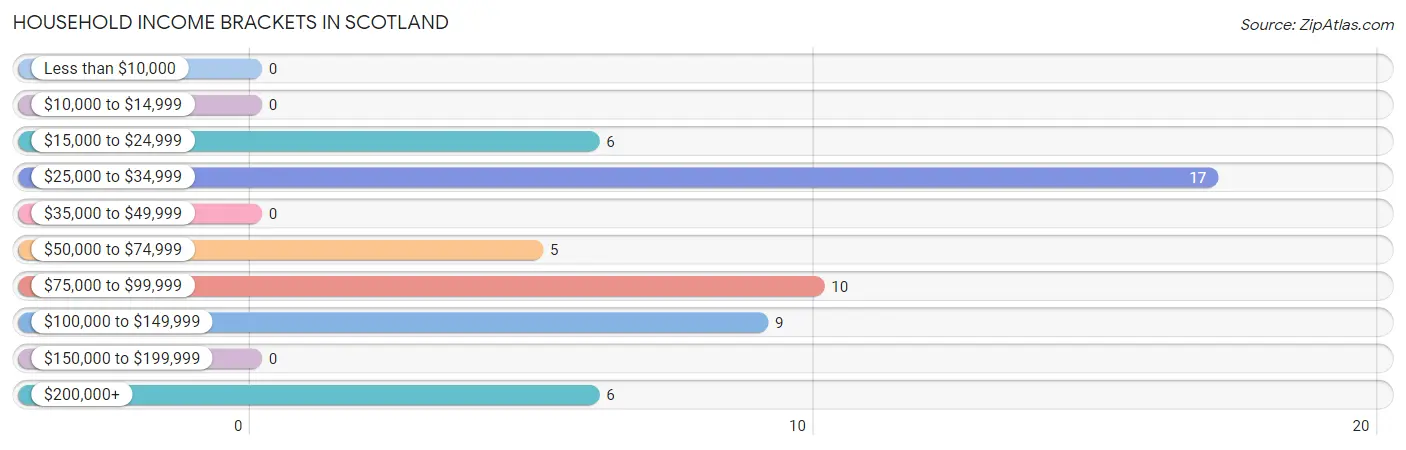
| Income Bracket | # Households | % Households |
| Less than $10,000 | 0 | 0.0% |
| $10,000 to $14,999 | 0 | 0.0% |
| $15,000 to $24,999 | 6 | 11.3% |
| $25,000 to $34,999 | 17 | 32.1% |
| $35,000 to $49,999 | 0 | 0.0% |
| $50,000 to $74,999 | 5 | 9.4% |
| $75,000 to $99,999 | 10 | 18.9% |
| $100,000 to $149,999 | 9 | 17.0% |
| $150,000 to $199,999 | 0 | 0.0% |
| $200,000+ | 6 | 11.3% |
Household Income by Householder Age in Scotland
The median household income in Scotland is $0, with the highest median household income of $100,833 found in the 65+ years age bracket for the primary householder. A total of 24 households (45.3%) fall into this category.
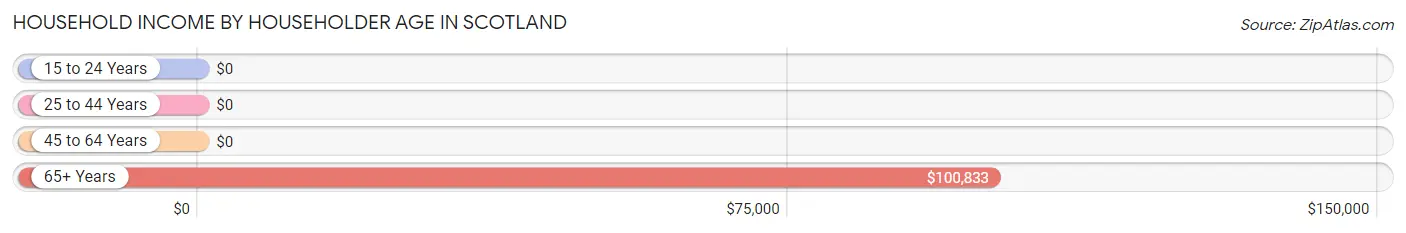
| Income Bracket | # Households | Median Income |
| 15 to 24 Years | 0 (0.0%) | $0 |
| 25 to 44 Years | 6 (11.3%) | $0 |
| 45 to 64 Years | 23 (43.4%) | $0 |
| 65+ Years | 24 (45.3%) | $100,833 |
| Total | 53 (100.0%) | $0 |
Poverty in Scotland
Income Below Poverty by Sex and Age in Scotland
With 56.8% poverty level for males and 12.2% for females among the residents of Scotland, under 5 year old males and 25 to 34 year old females are the most vulnerable to poverty, with 14 males (100.0%) and 6 females (100.0%) in their respective age groups living below the poverty level.
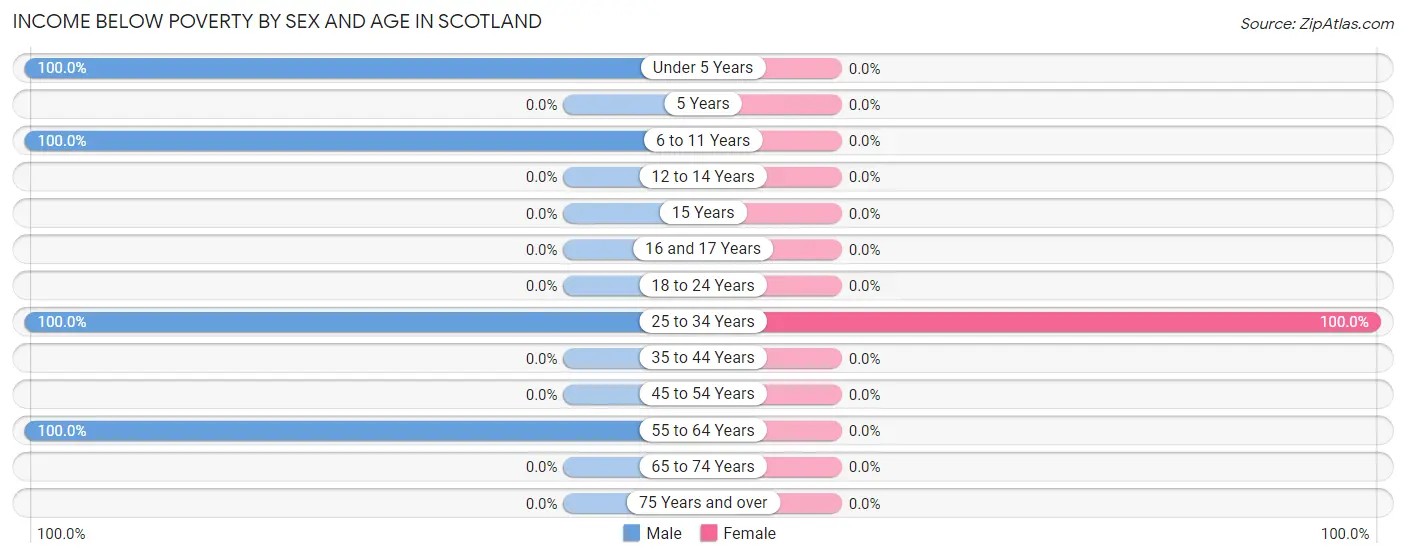
| Age Bracket | Male | Female |
| Under 5 Years | 14 (100.0%) | 0 (0.0%) |
| 5 Years | 0 (0.0%) | 0 (0.0%) |
| 6 to 11 Years | 11 (100.0%) | 0 (0.0%) |
| 12 to 14 Years | 0 (0.0%) | 0 (0.0%) |
| 15 Years | 0 (0.0%) | 0 (0.0%) |
| 16 and 17 Years | 0 (0.0%) | 0 (0.0%) |
| 18 to 24 Years | 0 (0.0%) | 0 (0.0%) |
| 25 to 34 Years | 7 (100.0%) | 6 (100.0%) |
| 35 to 44 Years | 0 (0.0%) | 0 (0.0%) |
| 45 to 54 Years | 0 (0.0%) | 0 (0.0%) |
| 55 to 64 Years | 10 (100.0%) | 0 (0.0%) |
| 65 to 74 Years | 0 (0.0%) | 0 (0.0%) |
| 75 Years and over | 0 (0.0%) | 0 (0.0%) |
| Total | 42 (56.8%) | 6 (12.2%) |
Income Above Poverty by Sex and Age in Scotland
According to the poverty statistics in Scotland, males aged 45 to 54 years and females aged 45 to 54 years are the age groups that are most secure financially, with 100.0% of males and 100.0% of females in these age groups living above the poverty line.
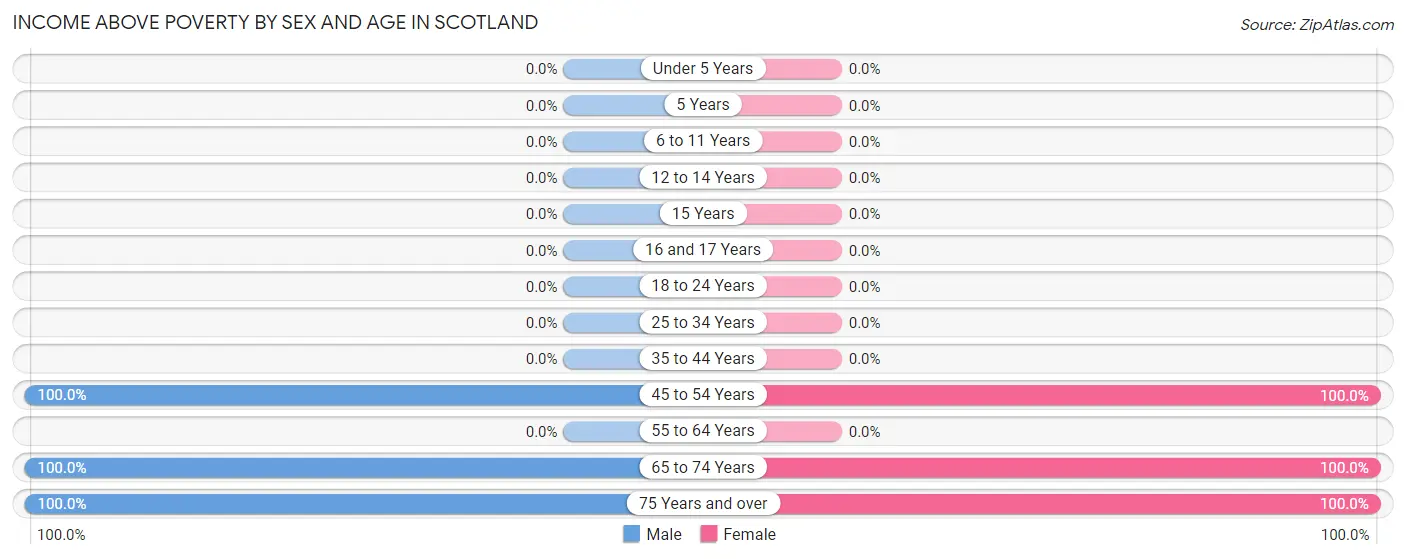
| Age Bracket | Male | Female |
| Under 5 Years | 0 (0.0%) | 0 (0.0%) |
| 5 Years | 0 (0.0%) | 0 (0.0%) |
| 6 to 11 Years | 0 (0.0%) | 0 (0.0%) |
| 12 to 14 Years | 0 (0.0%) | 0 (0.0%) |
| 15 Years | 0 (0.0%) | 0 (0.0%) |
| 16 and 17 Years | 0 (0.0%) | 0 (0.0%) |
| 18 to 24 Years | 0 (0.0%) | 0 (0.0%) |
| 25 to 34 Years | 0 (0.0%) | 0 (0.0%) |
| 35 to 44 Years | 0 (0.0%) | 0 (0.0%) |
| 45 to 54 Years | 10 (100.0%) | 23 (100.0%) |
| 55 to 64 Years | 0 (0.0%) | 0 (0.0%) |
| 65 to 74 Years | 18 (100.0%) | 11 (100.0%) |
| 75 Years and over | 4 (100.0%) | 9 (100.0%) |
| Total | 32 (43.2%) | 43 (87.8%) |
Income Below Poverty Among Married-Couple Families in Scotland
The poverty statistics for married-couple families in Scotland show that 35.3% or 6 of the total 17 families live below the poverty line. Families with 1 or 2 children have the highest poverty rate of 100.0%, comprising of 6 families. On the other hand, families with no children have the lowest poverty rate of 0.0%, which includes 0 families.
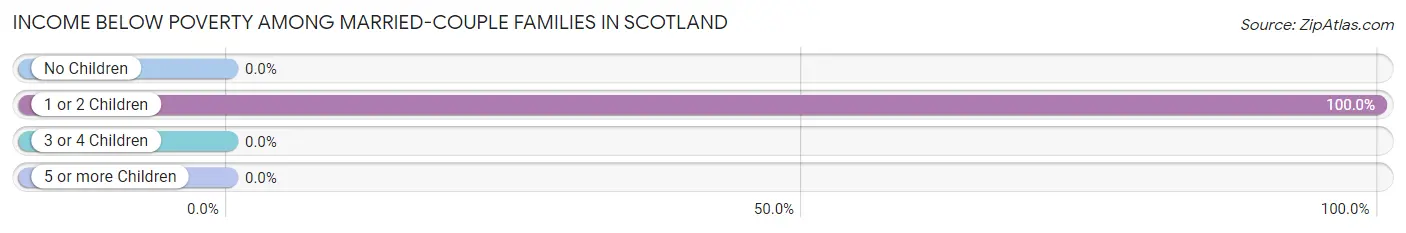
| Children | Above Poverty | Below Poverty |
| No Children | 11 (100.0%) | 0 (0.0%) |
| 1 or 2 Children | 0 (0.0%) | 6 (100.0%) |
| 3 or 4 Children | 0 (0.0%) | 0 (0.0%) |
| 5 or more Children | 0 (0.0%) | 0 (0.0%) |
| Total | 11 (64.7%) | 6 (35.3%) |
Income Below Poverty Among Single-Parent Households in Scotland
| Children | Single Father | Single Mother |
| No Children | 0 (0.0%) | 0 (0.0%) |
| 1 or 2 Children | 0 (0.0%) | 0 (0.0%) |
| 3 or 4 Children | 0 (0.0%) | 0 (0.0%) |
| 5 or more Children | 0 (0.0%) | 0 (0.0%) |
| Total | 0 (0.0%) | 0 (0.0%) |
Income Below Poverty Among Married-Couple vs Single-Parent Households in Scotland
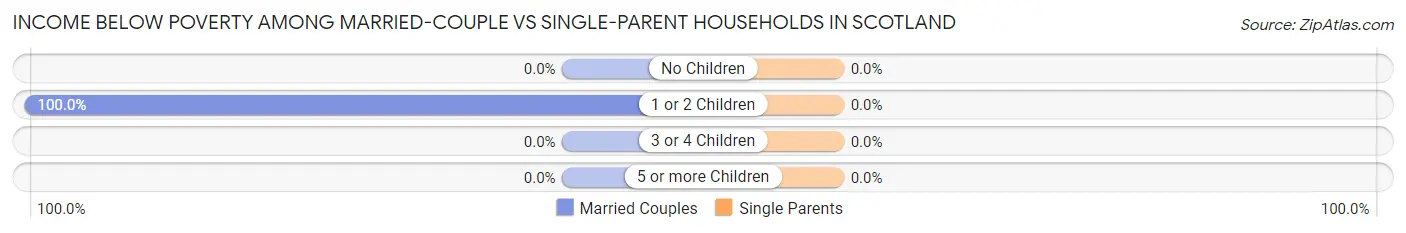
| Children | Married-Couple Families | Single-Parent Households |
| No Children | 0 (0.0%) | 0 (0.0%) |
| 1 or 2 Children | 6 (100.0%) | 0 (0.0%) |
| 3 or 4 Children | 0 (0.0%) | 0 (0.0%) |
| 5 or more Children | 0 (0.0%) | 0 (0.0%) |
| Total | 6 (35.3%) | 0 (0.0%) |
Race in Scotland
The most populous races in Scotland are White / Caucasian (85 | 69.1%), and Black / African American (38 | 30.9%).
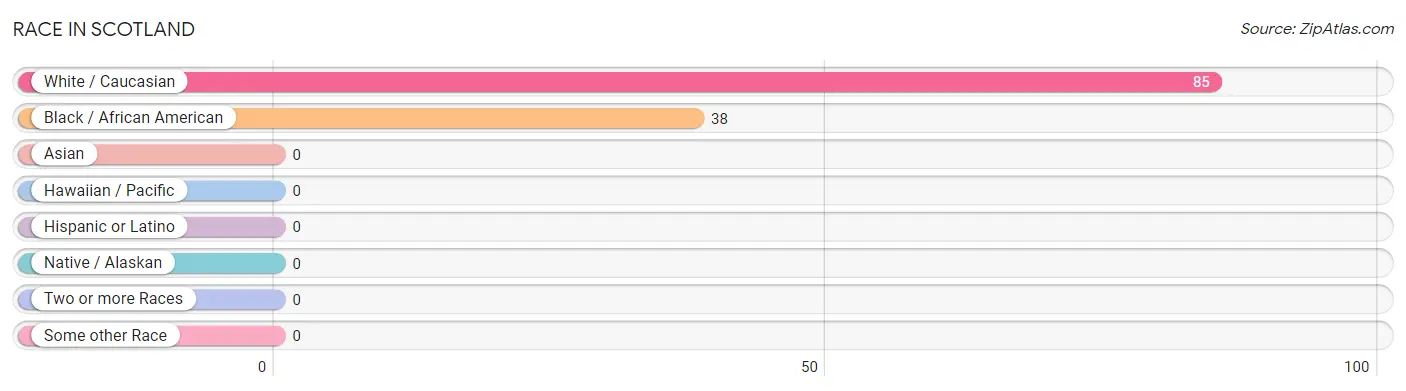
| Race | # Population | % Population |
| Asian | 0 | 0.0% |
| Black / African American | 38 | 30.9% |
| Hawaiian / Pacific | 0 | 0.0% |
| Hispanic or Latino | 0 | 0.0% |
| Native / Alaskan | 0 | 0.0% |
| White / Caucasian | 85 | 69.1% |
| Two or more Races | 0 | 0.0% |
| Some other Race | 0 | 0.0% |
| Total | 123 | 100.0% |
Ancestry in Scotland
The most populous ancestries reported in Scotland are Scottish (29 | 23.6%), English (19 | 15.4%), German (10 | 8.1%), Welsh (10 | 8.1%), and Polish (6 | 4.9%), together accounting for 60.2% of all Scotland residents.
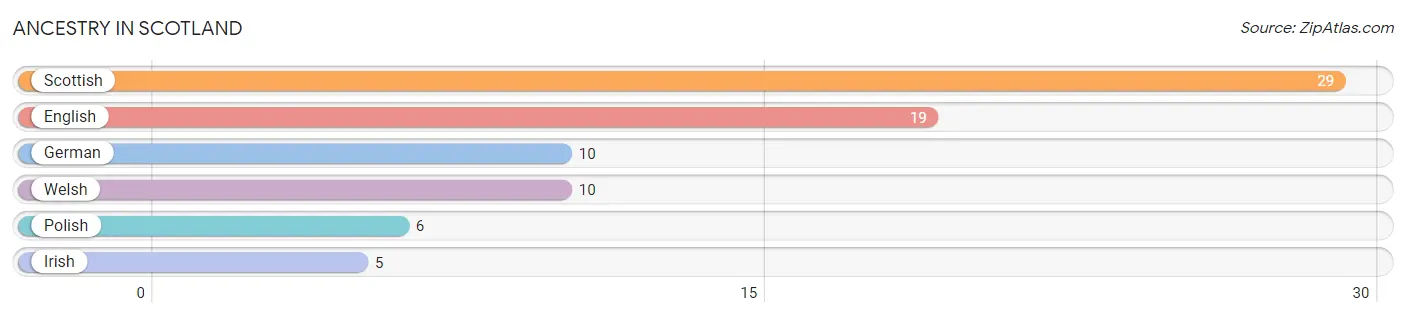
| Ancestry | # Population | % Population |
| English | 19 | 15.4% |
| German | 10 | 8.1% |
| Irish | 5 | 4.1% |
| Polish | 6 | 4.9% |
| Scottish | 29 | 23.6% |
| Welsh | 10 | 8.1% | View All 6 Rows |
Immigrants in Scotland

| Immigration Origin | # Population | % Population | View All 0 Rows |
Sex and Age in Scotland
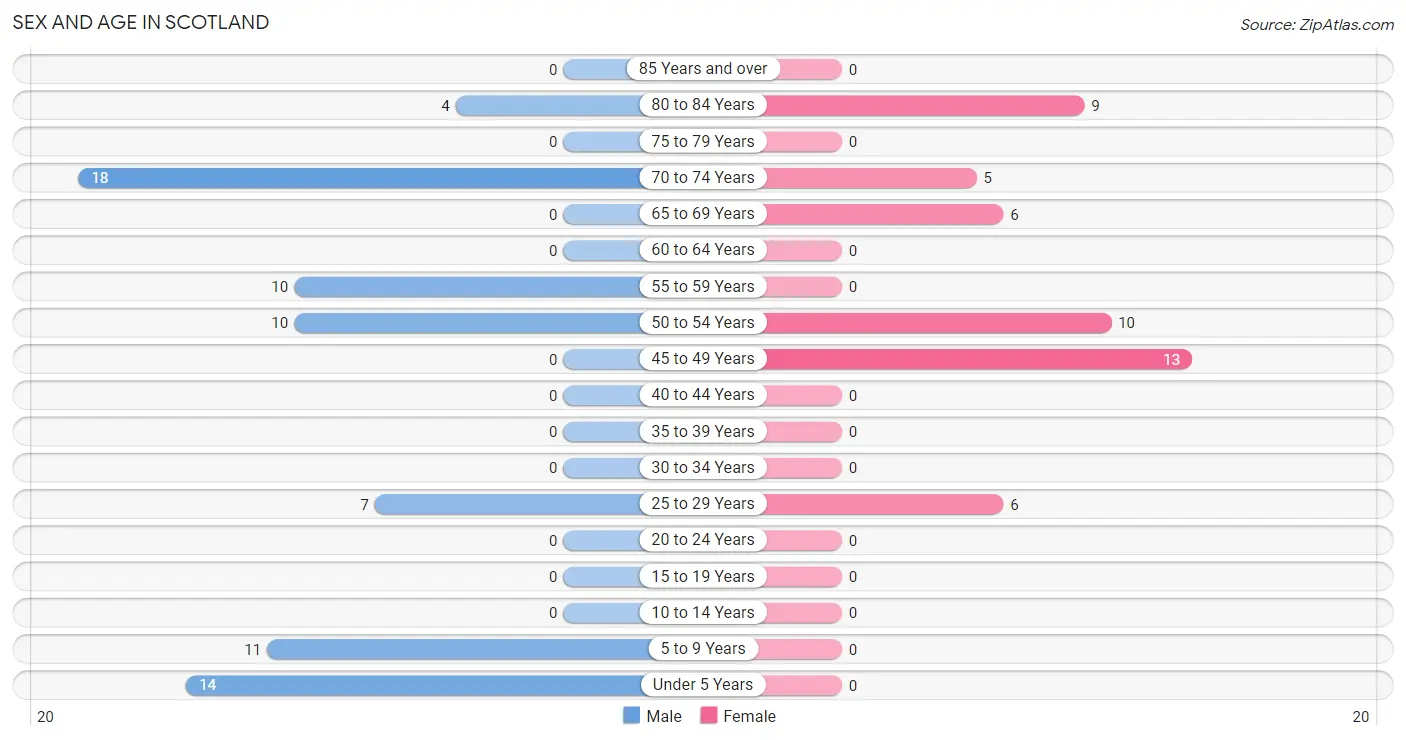
Sex and Age in Scotland
The most populous age groups in Scotland are 70 to 74 Years (18 | 24.3%) for men and 45 to 49 Years (13 | 26.5%) for women.
| Age Bracket | Male | Female |
| Under 5 Years | 14 (18.9%) | 0 (0.0%) |
| 5 to 9 Years | 11 (14.9%) | 0 (0.0%) |
| 10 to 14 Years | 0 (0.0%) | 0 (0.0%) |
| 15 to 19 Years | 0 (0.0%) | 0 (0.0%) |
| 20 to 24 Years | 0 (0.0%) | 0 (0.0%) |
| 25 to 29 Years | 7 (9.5%) | 6 (12.2%) |
| 30 to 34 Years | 0 (0.0%) | 0 (0.0%) |
| 35 to 39 Years | 0 (0.0%) | 0 (0.0%) |
| 40 to 44 Years | 0 (0.0%) | 0 (0.0%) |
| 45 to 49 Years | 0 (0.0%) | 13 (26.5%) |
| 50 to 54 Years | 10 (13.5%) | 10 (20.4%) |
| 55 to 59 Years | 10 (13.5%) | 0 (0.0%) |
| 60 to 64 Years | 0 (0.0%) | 0 (0.0%) |
| 65 to 69 Years | 0 (0.0%) | 6 (12.2%) |
| 70 to 74 Years | 18 (24.3%) | 5 (10.2%) |
| 75 to 79 Years | 0 (0.0%) | 0 (0.0%) |
| 80 to 84 Years | 4 (5.4%) | 9 (18.4%) |
| 85 Years and over | 0 (0.0%) | 0 (0.0%) |
| Total | 74 (100.0%) | 49 (100.0%) |
Families and Households in Scotland
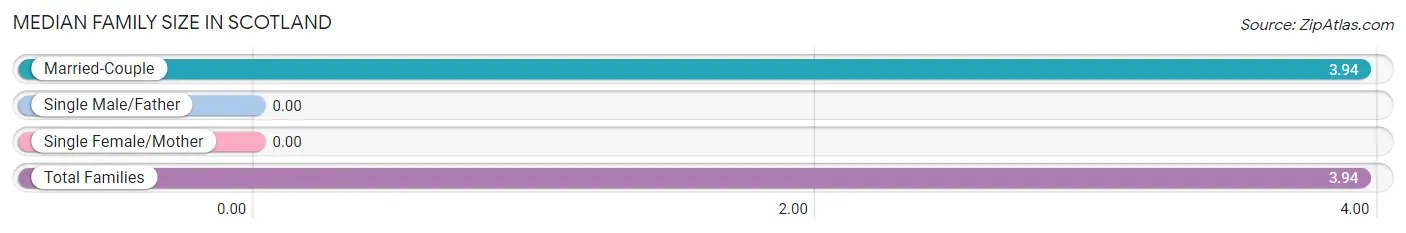
Median Family Size in Scotland
| Family Type | # Families | Family Size |
| Married-Couple | 17 (100.0%) | 3.94 |
| Single Male/Father | 0 (0.0%) | - |
| Single Female/Mother | 0 (0.0%) | - |
| Total Families | 17 (100.0%) | 3.94 |
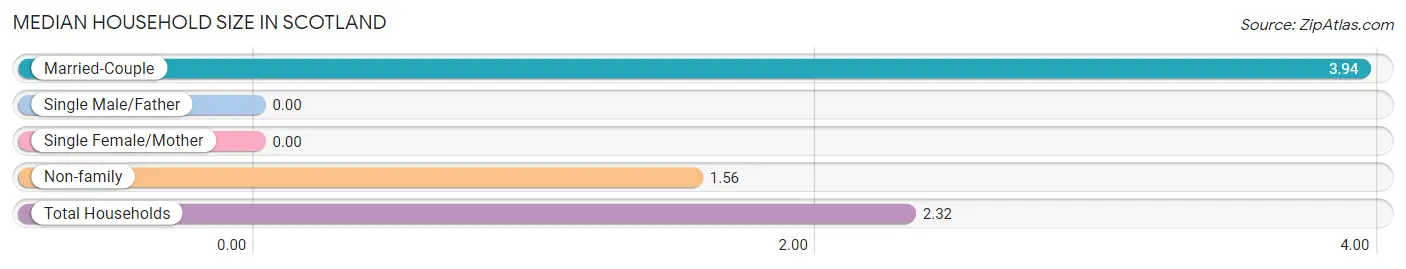
Median Household Size in Scotland
| Household Type | # Households | Household Size |
| Married-Couple | 17 (32.1%) | 3.94 |
| Single Male/Father | 0 (0.0%) | - |
| Single Female/Mother | 0 (0.0%) | - |
| Non-family | 36 (67.9%) | 1.56 |
| Total Households | 53 (100.0%) | 2.32 |
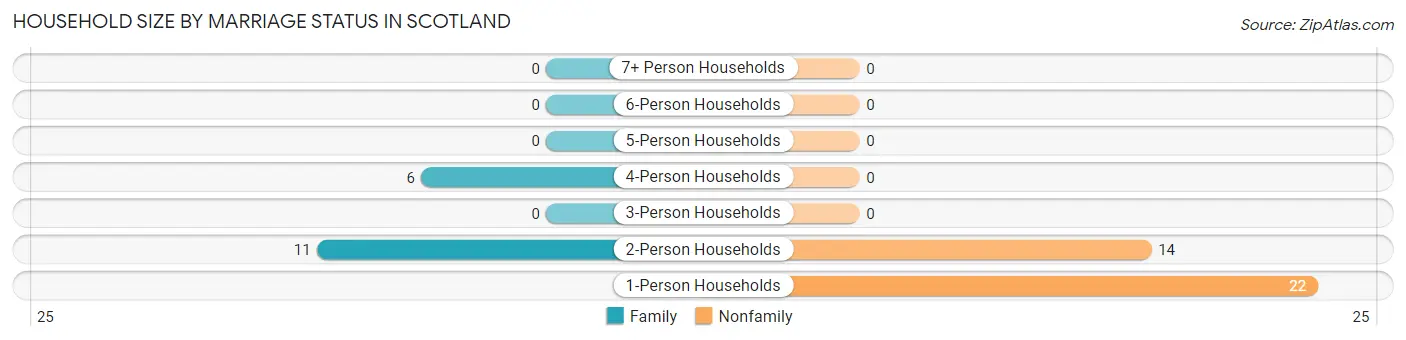
Household Size by Marriage Status in Scotland
Out of a total of 53 households in Scotland, 17 (32.1%) are family households, while 36 (67.9%) are nonfamily households. The most numerous type of family households are 2-person households, comprising 11, and the most common type of nonfamily households are 1-person households, comprising 22.
| Household Size | Family Households | Nonfamily Households |
| 1-Person Households | - | 22 (41.5%) |
| 2-Person Households | 11 (20.7%) | 14 (26.4%) |
| 3-Person Households | 0 (0.0%) | 0 (0.0%) |
| 4-Person Households | 6 (11.3%) | 0 (0.0%) |
| 5-Person Households | 0 (0.0%) | 0 (0.0%) |
| 6-Person Households | 0 (0.0%) | 0 (0.0%) |
| 7+ Person Households | 0 (0.0%) | 0 (0.0%) |
| Total | 17 (32.1%) | 36 (67.9%) |
Female Fertility in Scotland
Fertility by Age in Scotland
| Age Bracket | Women with Births | Births / 1,000 Women |
| 15 to 19 years | 0 (0.0%) | 0.0 |
| 20 to 34 years | 0 (0.0%) | 0.0 |
| 35 to 50 years | 0 (0.0%) | 0.0 |
| Total | 0 (0.0%) | 0.0 |
Fertility by Age by Marriage Status in Scotland
| Age Bracket | Married | Unmarried |
| 15 to 19 years | 0 (0.0%) | 0 (0.0%) |
| 20 to 34 years | 0 (0.0%) | 0 (0.0%) |
| 35 to 50 years | 0 (0.0%) | 0 (0.0%) |
| Total | 0 (0.0%) | 0 (0.0%) |
Fertility by Education in Scotland
| Educational Attainment | Women with Births | Births / 1,000 Women |
| Less than High School | 0 (0.0%) | 0.0 |
| High School Diploma | 0 (0.0%) | 0.0 |
| College or Associate's Degree | 0 (0.0%) | 0.0 |
| Bachelor's Degree | 0 (0.0%) | 0.0 |
| Graduate Degree | 0 (0.0%) | 0.0 |
| Total | 0 (0.0%) | 0.0 |
Fertility by Education by Marriage Status in Scotland
| Educational Attainment | Married | Unmarried |
| Less than High School | 0 (0.0%) | 0 (0.0%) |
| High School Diploma | 0 (0.0%) | 0 (0.0%) |
| College or Associate's Degree | 0 (0.0%) | 0 (0.0%) |
| Bachelor's Degree | 0 (0.0%) | 0 (0.0%) |
| Graduate Degree | 0 (0.0%) | 0 (0.0%) |
| Total | 0 (0.0%) | 0 (0.0%) |
Employment Characteristics in Scotland
Employment by Class of Employer in Scotland
Among the 48 employed individuals in Scotland, private company employees (30 | 62.5%), local government employees (10 | 20.8%), and self-employed (not incorporated) (8 | 16.7%) make up the most common classes of employment.
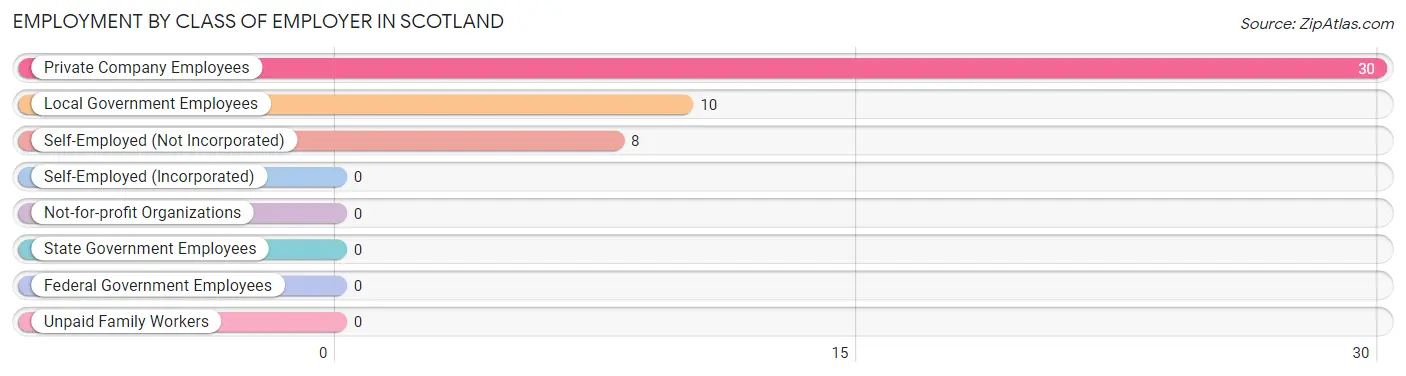
| Employer Class | # Employees | % Employees |
| Private Company Employees | 30 | 62.5% |
| Self-Employed (Incorporated) | 0 | 0.0% |
| Self-Employed (Not Incorporated) | 8 | 16.7% |
| Not-for-profit Organizations | 0 | 0.0% |
| Local Government Employees | 10 | 20.8% |
| State Government Employees | 0 | 0.0% |
| Federal Government Employees | 0 | 0.0% |
| Unpaid Family Workers | 0 | 0.0% |
| Total | 48 | 100.0% |
Employment Status by Age in Scotland
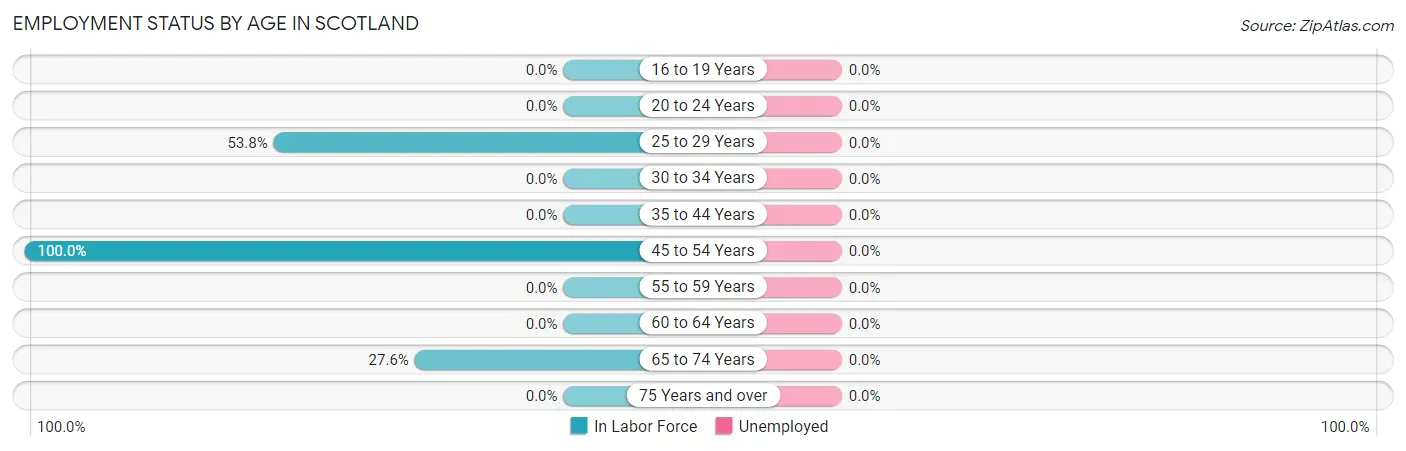
| Age Bracket | In Labor Force | Unemployed |
| 16 to 19 Years | 0 (0.0%) | 0 (0.0%) |
| 20 to 24 Years | 0 (0.0%) | 0 (0.0%) |
| 25 to 29 Years | 7 (53.8%) | 0 (0.0%) |
| 30 to 34 Years | 0 (0.0%) | 0 (0.0%) |
| 35 to 44 Years | 0 (0.0%) | 0 (0.0%) |
| 45 to 54 Years | 33 (100.0%) | 0 (0.0%) |
| 55 to 59 Years | 0 (0.0%) | 0 (0.0%) |
| 60 to 64 Years | 0 (0.0%) | 0 (0.0%) |
| 65 to 74 Years | 8 (27.6%) | 0 (0.0%) |
| 75 Years and over | 0 (0.0%) | 0 (0.0%) |
| Total | 48 (49.0%) | 0 (0.0%) |
Employment Status by Educational Attainment in Scotland
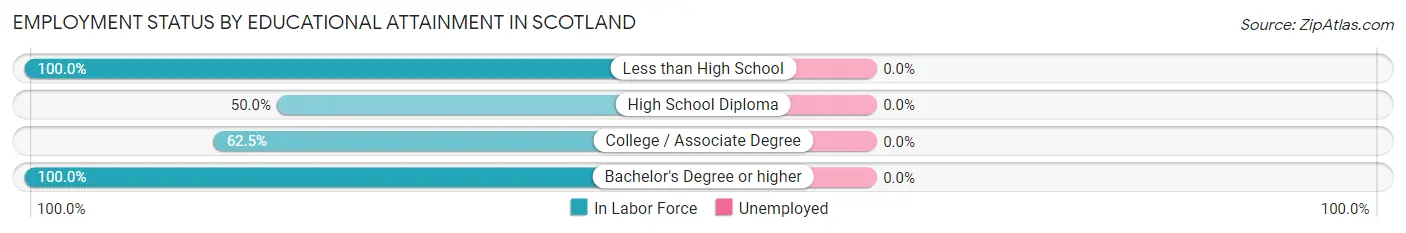
| Educational Attainment | In Labor Force | Unemployed |
| Less than High School | 7 (100.0%) | 0 (0.0%) |
| High School Diploma | 10 (50.0%) | 0 (0.0%) |
| College / Associate Degree | 10 (62.5%) | 0 (0.0%) |
| Bachelor's Degree or higher | 13 (100.0%) | 0 (0.0%) |
| Total | 40 (71.4%) | 0 (0.0%) |
Employment Occupations by Sex in Scotland
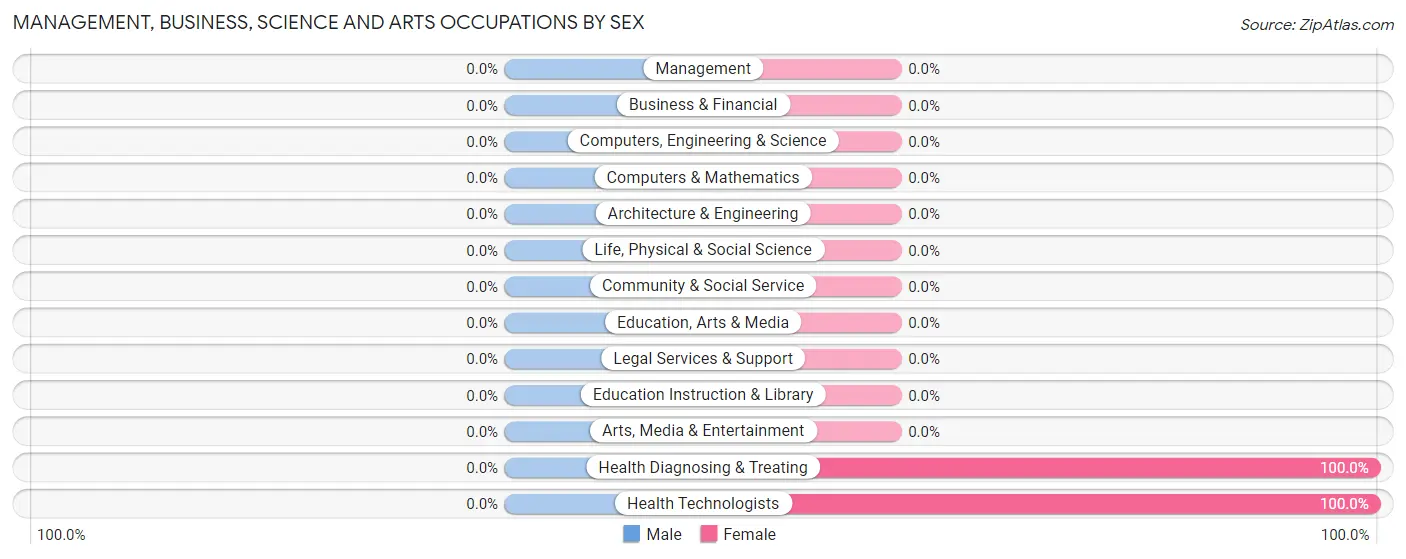
Management, Business, Science and Arts Occupations
The most common Management, Business, Science and Arts occupations in Scotland are Health Diagnosing & Treating (10 | 20.8%), and Health Technologists (10 | 20.8%).
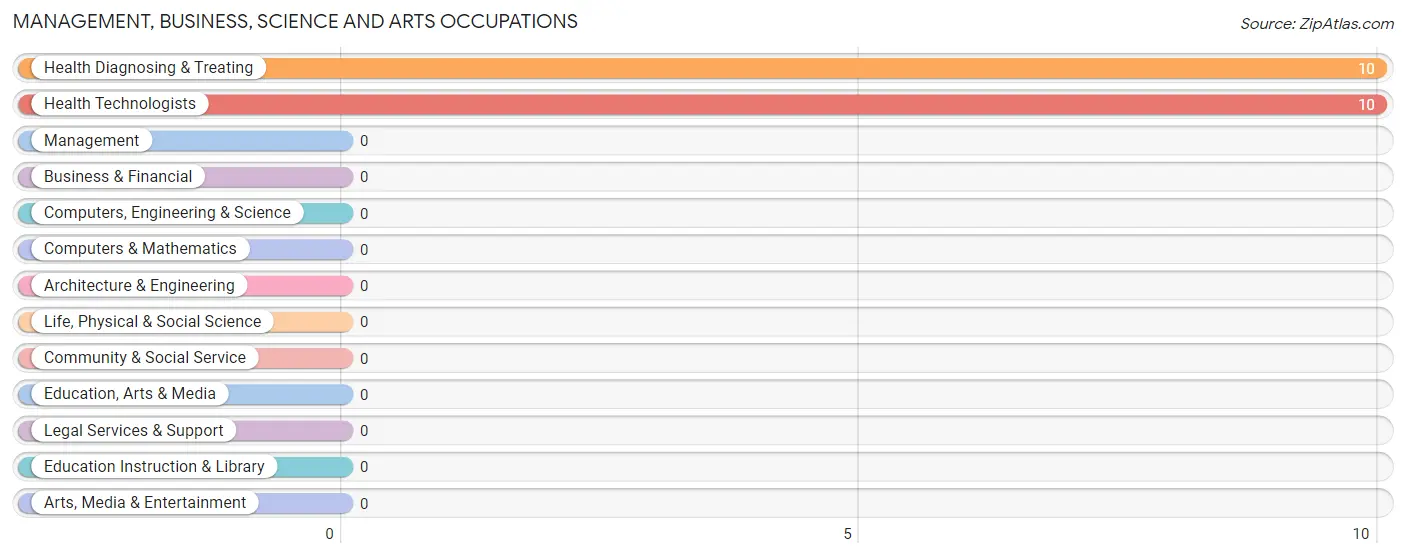
Management, Business, Science and Arts Occupations by Sex
| Occupation | Male | Female |
| Management | 0 (0.0%) | 0 (0.0%) |
| Business & Financial | 0 (0.0%) | 0 (0.0%) |
| Computers, Engineering & Science | 0 (0.0%) | 0 (0.0%) |
| Computers & Mathematics | 0 (0.0%) | 0 (0.0%) |
| Architecture & Engineering | 0 (0.0%) | 0 (0.0%) |
| Life, Physical & Social Science | 0 (0.0%) | 0 (0.0%) |
| Community & Social Service | 0 (0.0%) | 0 (0.0%) |
| Education, Arts & Media | 0 (0.0%) | 0 (0.0%) |
| Legal Services & Support | 0 (0.0%) | 0 (0.0%) |
| Education Instruction & Library | 0 (0.0%) | 0 (0.0%) |
| Arts, Media & Entertainment | 0 (0.0%) | 0 (0.0%) |
| Health Diagnosing & Treating | 0 (0.0%) | 10 (100.0%) |
| Health Technologists | 0 (0.0%) | 10 (100.0%) |
| Total (Category) | 0 (0.0%) | 10 (100.0%) |
| Total (Overall) | 25 (52.1%) | 23 (47.9%) |
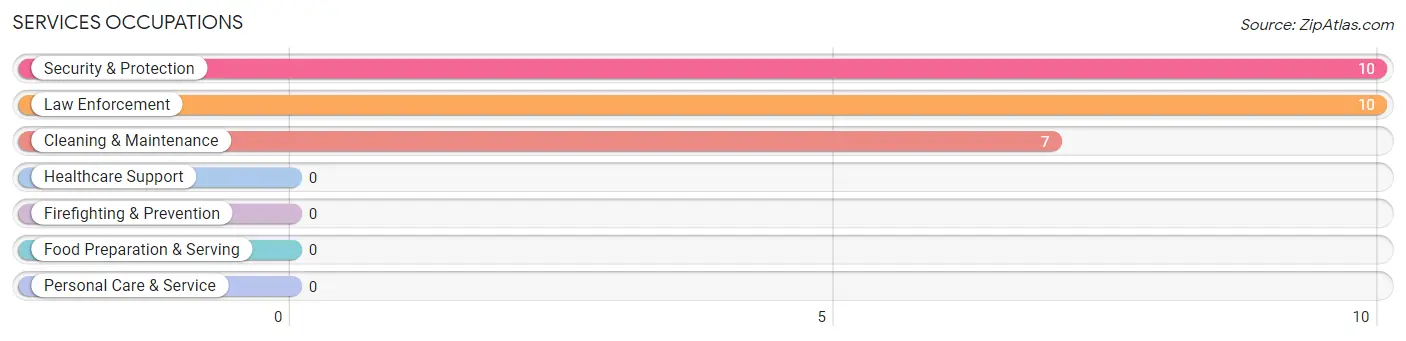
Services Occupations
The most common Services occupations in Scotland are Security & Protection (10 | 20.8%), Law Enforcement (10 | 20.8%), and Cleaning & Maintenance (7 | 14.6%).
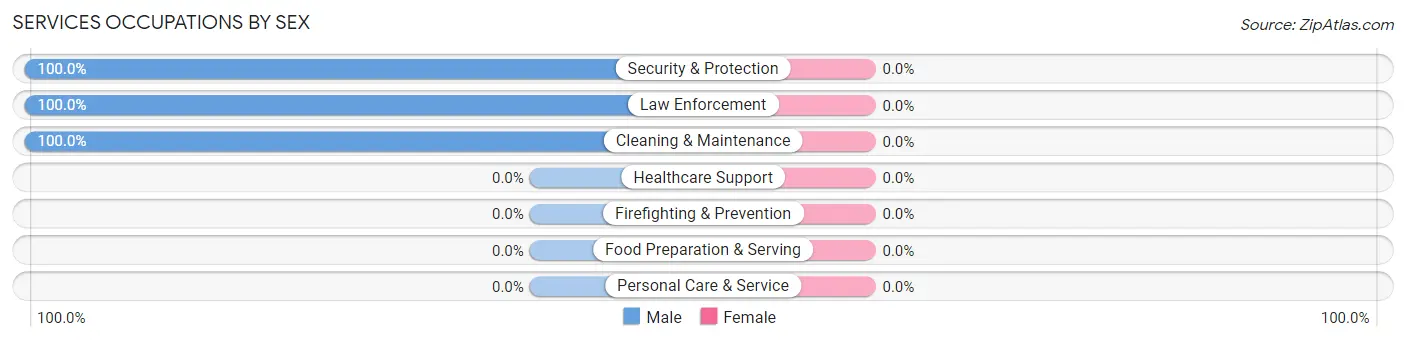
Services Occupations by Sex
| Occupation | Male | Female |
| Healthcare Support | 0 (0.0%) | 0 (0.0%) |
| Security & Protection | 10 (100.0%) | 0 (0.0%) |
| Firefighting & Prevention | 0 (0.0%) | 0 (0.0%) |
| Law Enforcement | 10 (100.0%) | 0 (0.0%) |
| Food Preparation & Serving | 0 (0.0%) | 0 (0.0%) |
| Cleaning & Maintenance | 7 (100.0%) | 0 (0.0%) |
| Personal Care & Service | 0 (0.0%) | 0 (0.0%) |
| Total (Category) | 17 (100.0%) | 0 (0.0%) |
| Total (Overall) | 25 (52.1%) | 23 (47.9%) |
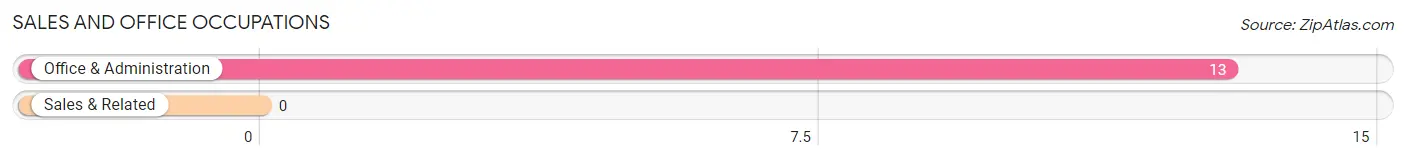
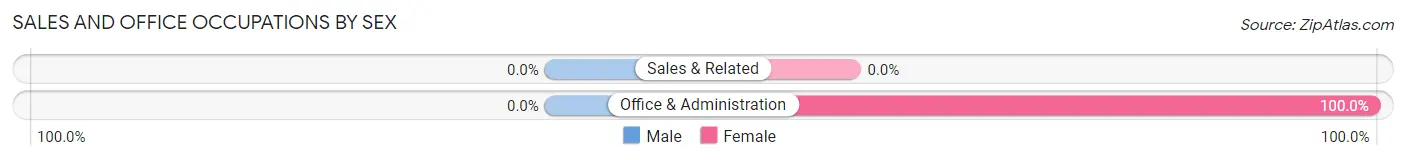
Sales and Office Occupations
The most common Sales and Office occupations in Scotland are , and Office & Administration (13 | 27.1%).
Sales and Office Occupations by Sex
| Occupation | Male | Female |
| Sales & Related | 0 (0.0%) | 0 (0.0%) |
| Office & Administration | 0 (0.0%) | 13 (100.0%) |
| Total (Category) | 0 (0.0%) | 13 (100.0%) |
| Total (Overall) | 25 (52.1%) | 23 (47.9%) |
Natural Resources, Construction and Maintenance Occupations
The most common Natural Resources, Construction and Maintenance occupations in Scotland are , and Installation, Maintenance & Repair (8 | 16.7%).
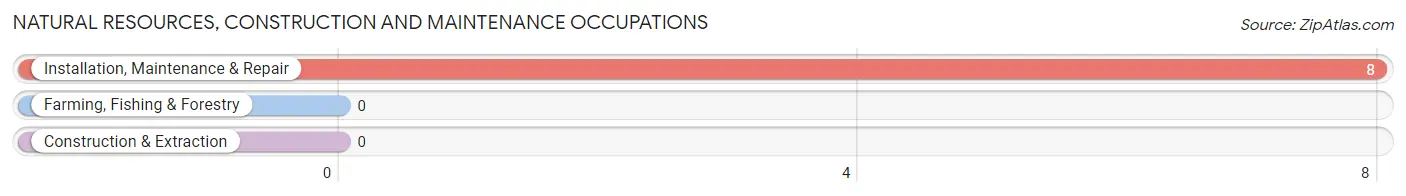
Natural Resources, Construction and Maintenance Occupations by Sex
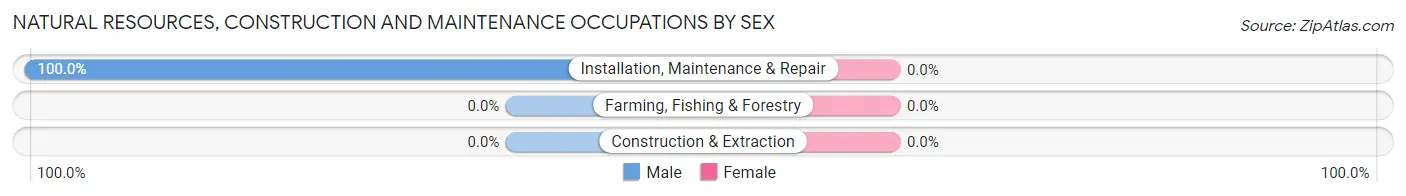
| Occupation | Male | Female |
| Farming, Fishing & Forestry | 0 (0.0%) | 0 (0.0%) |
| Construction & Extraction | 0 (0.0%) | 0 (0.0%) |
| Installation, Maintenance & Repair | 8 (100.0%) | 0 (0.0%) |
| Total (Category) | 8 (100.0%) | 0 (0.0%) |
| Total (Overall) | 25 (52.1%) | 23 (47.9%) |
Production, Transportation and Moving Occupations
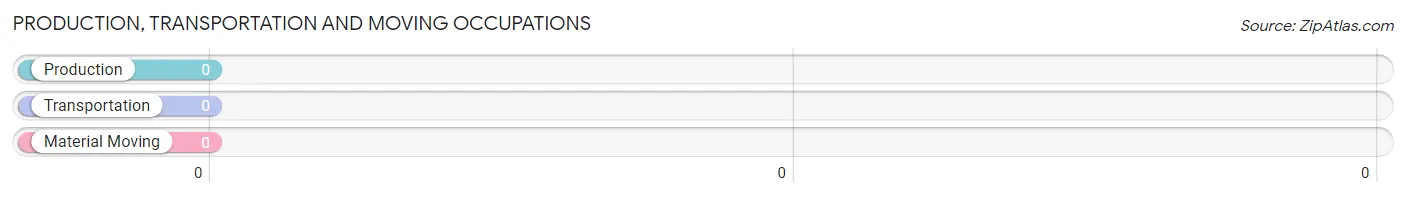
Production, Transportation and Moving Occupations by Sex
| Occupation | Male | Female |
| Production | 0 (0.0%) | 0 (0.0%) |
| Transportation | 0 (0.0%) | 0 (0.0%) |
| Material Moving | 0 (0.0%) | 0 (0.0%) |
| Total (Category) | 0 (0.0%) | 0 (0.0%) |
| Total (Overall) | 25 (52.1%) | 23 (47.9%) |
Employment Industries by Sex in Scotland
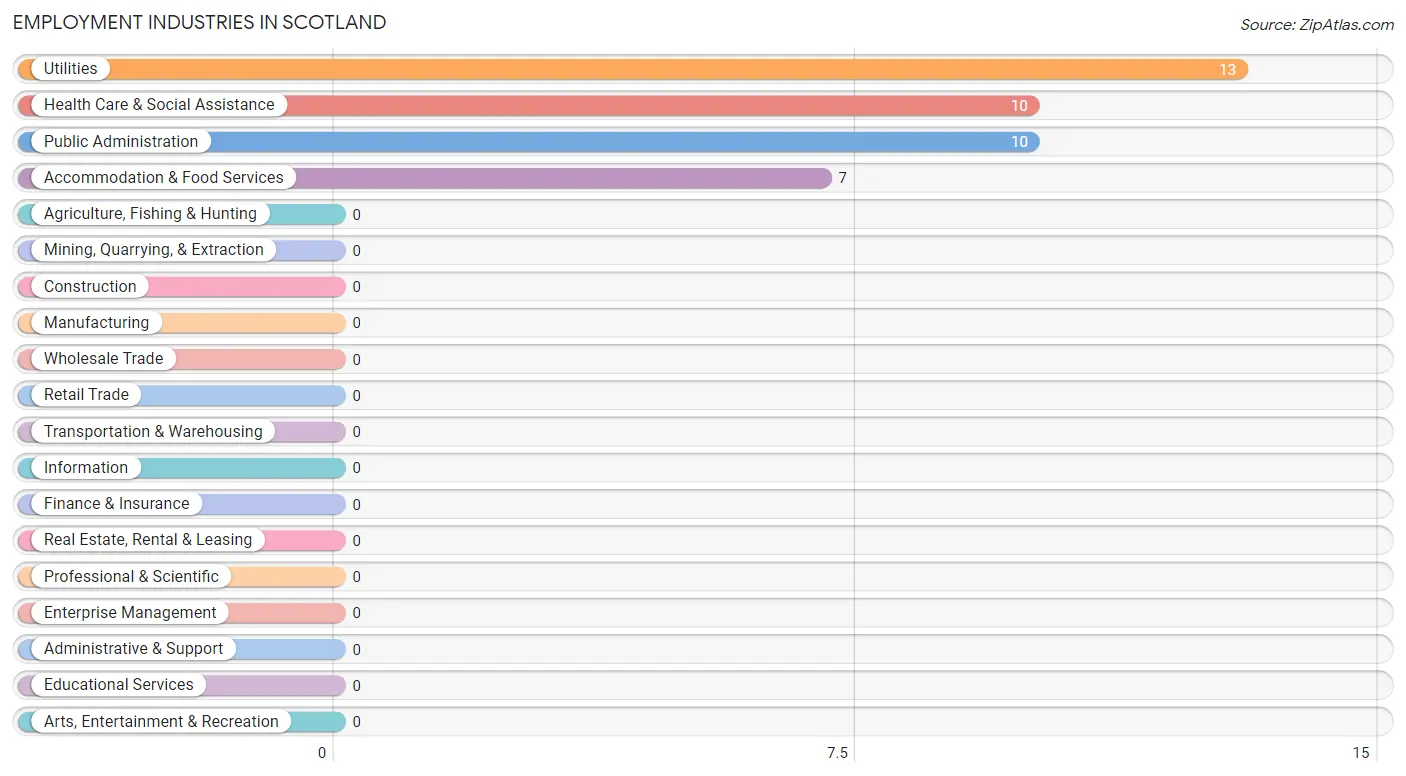
Employment Industries in Scotland
The major employment industries in Scotland include Utilities (13 | 27.1%), Health Care & Social Assistance (10 | 20.8%), Public Administration (10 | 20.8%), and Accommodation & Food Services (7 | 14.6%).
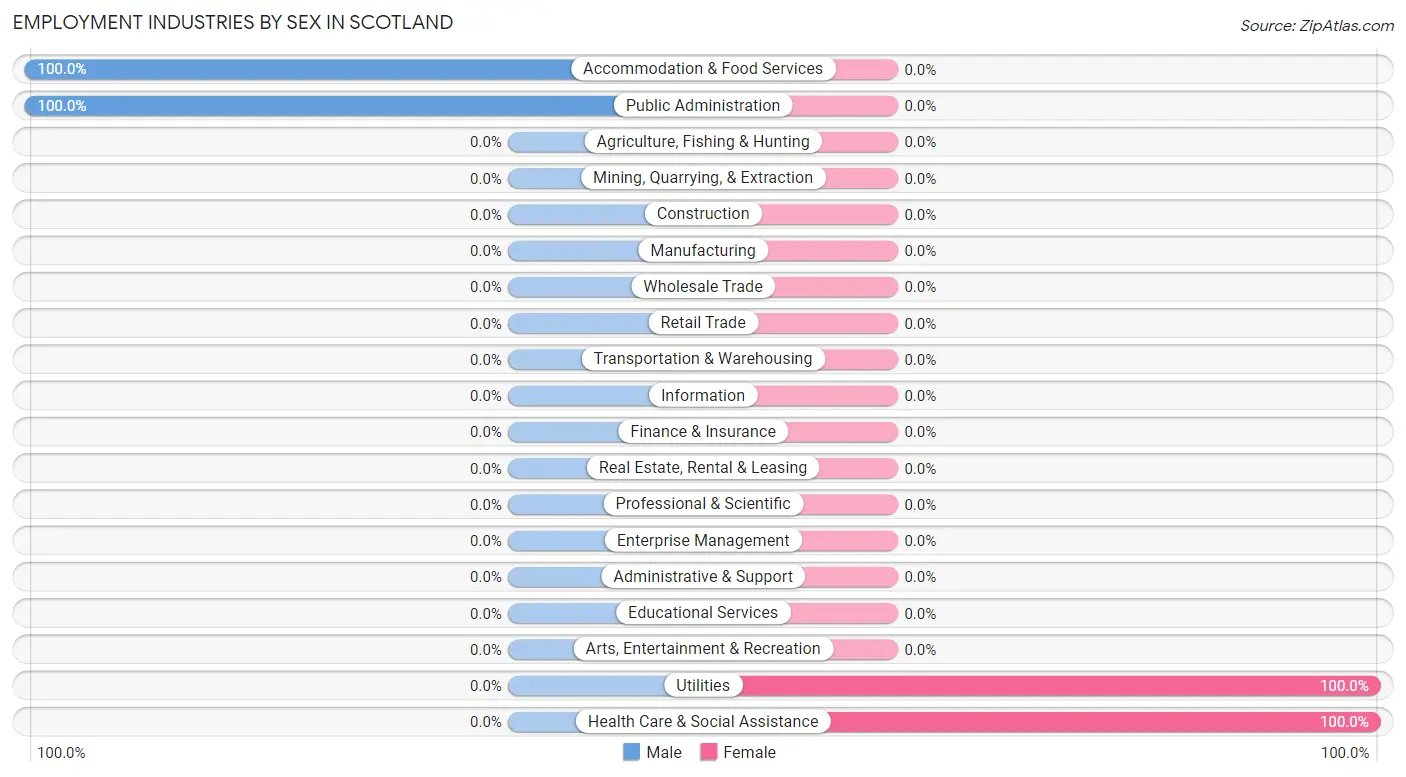
Employment Industries by Sex in Scotland
The Scotland industries that see more men than women are Accommodation & Food Services (100.0%), and Public Administration (100.0%), whereas the industries that tend to have a higher number of women are Utilities (100.0%), and Health Care & Social Assistance (100.0%).
| Industry | Male | Female |
| Agriculture, Fishing & Hunting | 0 (0.0%) | 0 (0.0%) |
| Mining, Quarrying, & Extraction | 0 (0.0%) | 0 (0.0%) |
| Construction | 0 (0.0%) | 0 (0.0%) |
| Manufacturing | 0 (0.0%) | 0 (0.0%) |
| Wholesale Trade | 0 (0.0%) | 0 (0.0%) |
| Retail Trade | 0 (0.0%) | 0 (0.0%) |
| Transportation & Warehousing | 0 (0.0%) | 0 (0.0%) |
| Utilities | 0 (0.0%) | 13 (100.0%) |
| Information | 0 (0.0%) | 0 (0.0%) |
| Finance & Insurance | 0 (0.0%) | 0 (0.0%) |
| Real Estate, Rental & Leasing | 0 (0.0%) | 0 (0.0%) |
| Professional & Scientific | 0 (0.0%) | 0 (0.0%) |
| Enterprise Management | 0 (0.0%) | 0 (0.0%) |
| Administrative & Support | 0 (0.0%) | 0 (0.0%) |
| Educational Services | 0 (0.0%) | 0 (0.0%) |
| Health Care & Social Assistance | 0 (0.0%) | 10 (100.0%) |
| Arts, Entertainment & Recreation | 0 (0.0%) | 0 (0.0%) |
| Accommodation & Food Services | 7 (100.0%) | 0 (0.0%) |
| Public Administration | 10 (100.0%) | 0 (0.0%) |
| Total | 25 (52.1%) | 23 (47.9%) |
Education in Scotland
School Enrollment in Scotland
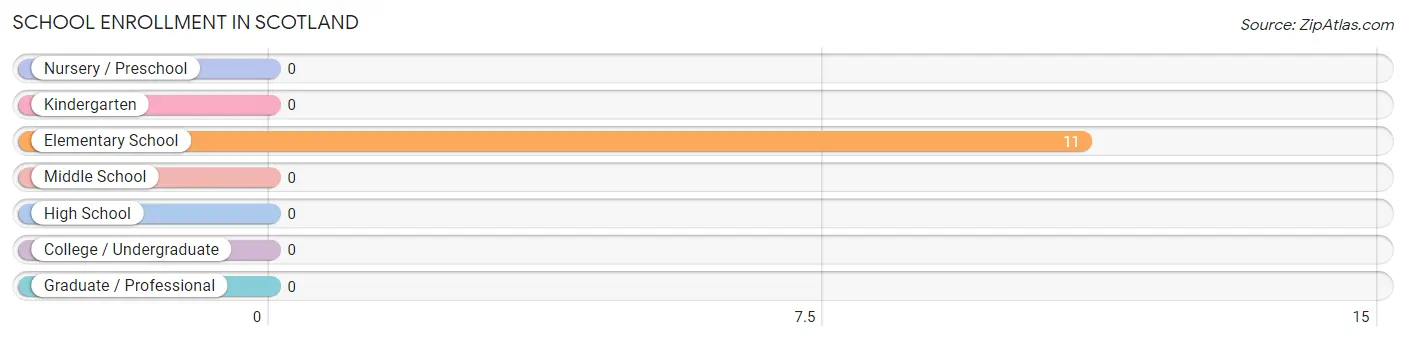
| School Level | # Students | % Students |
| Nursery / Preschool | 0 | 0.0% |
| Kindergarten | 0 | 0.0% |
| Elementary School | 11 | 100.0% |
| Middle School | 0 | 0.0% |
| High School | 0 | 0.0% |
| College / Undergraduate | 0 | 0.0% |
| Graduate / Professional | 0 | 0.0% |
| Total | 11 | 100.0% |
School Enrollment by Age by Funding Source in Scotland
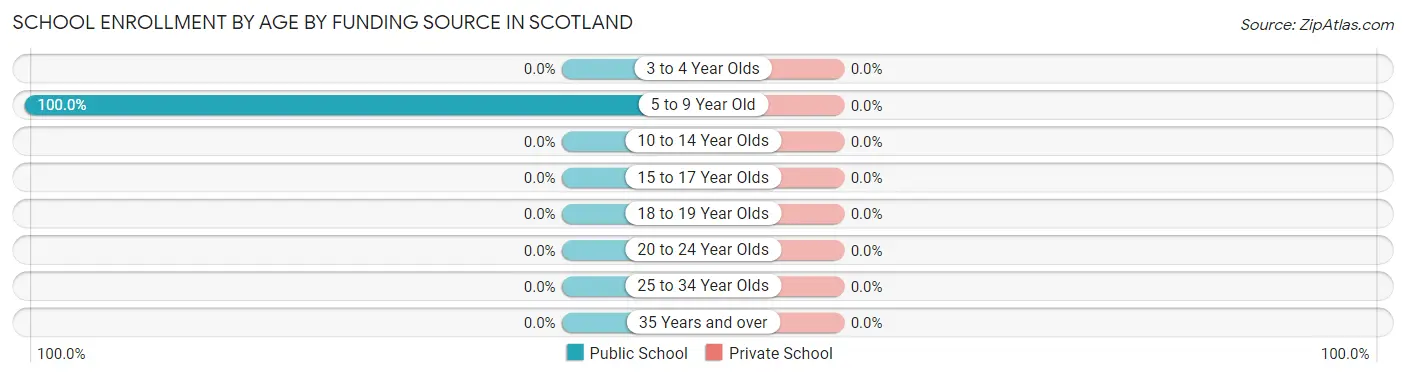
| Age Bracket | Public School | Private School |
| 3 to 4 Year Olds | 0 (0.0%) | 0 (0.0%) |
| 5 to 9 Year Old | 11 (100.0%) | 0 (0.0%) |
| 10 to 14 Year Olds | 0 (0.0%) | 0 (0.0%) |
| 15 to 17 Year Olds | 0 (0.0%) | 0 (0.0%) |
| 18 to 19 Year Olds | 0 (0.0%) | 0 (0.0%) |
| 20 to 24 Year Olds | 0 (0.0%) | 0 (0.0%) |
| 25 to 34 Year Olds | 0 (0.0%) | 0 (0.0%) |
| 35 Years and over | 0 (0.0%) | 0 (0.0%) |
| Total | 11 (100.0%) | 0 (0.0%) |
Educational Attainment by Field of Study in Scotland
Business (13 | 27.1%), computers & mathematics (10 | 20.8%), physical & health sciences (10 | 20.8%), science & technology (9 | 18.8%), and education (6 | 12.5%) are the most common fields of study among 48 individuals in Scotland who have obtained a bachelor's degree or higher.
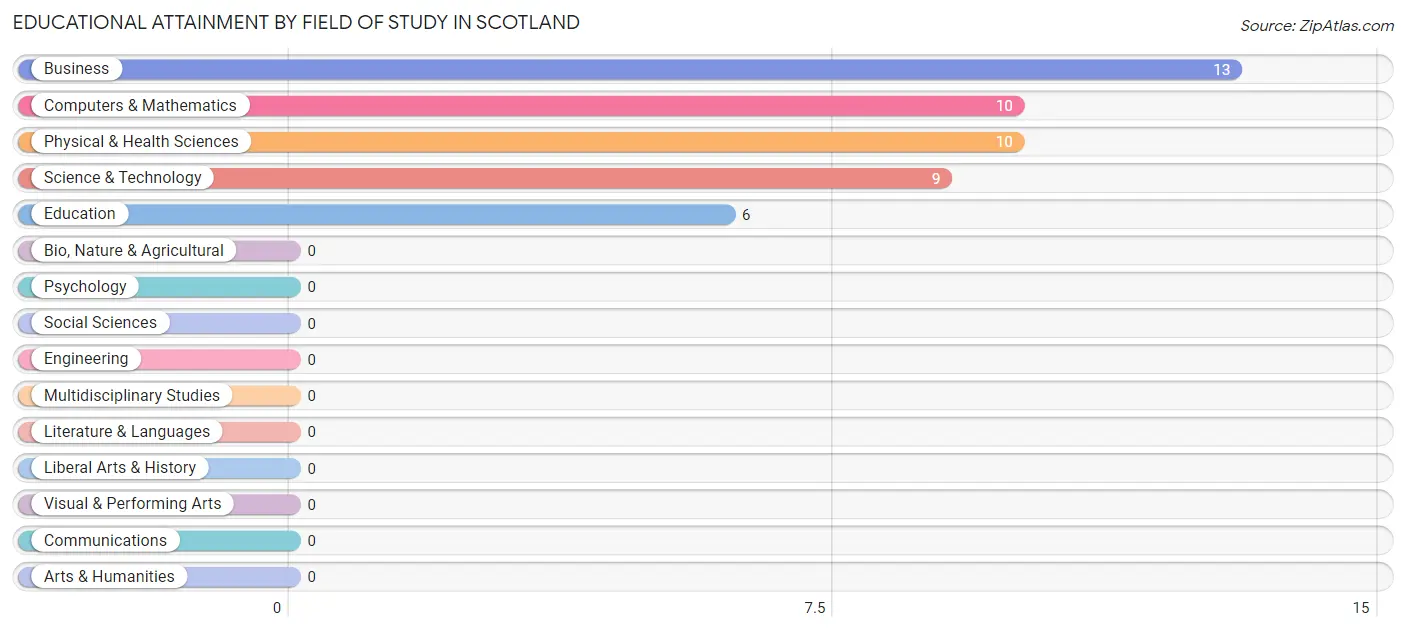
| Field of Study | # Graduates | % Graduates |
| Computers & Mathematics | 10 | 20.8% |
| Bio, Nature & Agricultural | 0 | 0.0% |
| Physical & Health Sciences | 10 | 20.8% |
| Psychology | 0 | 0.0% |
| Social Sciences | 0 | 0.0% |
| Engineering | 0 | 0.0% |
| Multidisciplinary Studies | 0 | 0.0% |
| Science & Technology | 9 | 18.8% |
| Business | 13 | 27.1% |
| Education | 6 | 12.5% |
| Literature & Languages | 0 | 0.0% |
| Liberal Arts & History | 0 | 0.0% |
| Visual & Performing Arts | 0 | 0.0% |
| Communications | 0 | 0.0% |
| Arts & Humanities | 0 | 0.0% |
| Total | 48 | 100.0% |
Transportation & Commute in Scotland
Vehicle Availability by Sex in Scotland
The most prevalent vehicle ownership categories in Scotland are males with 3 vehicles (18, accounting for 72.0%) and females with 3 vehicles (10, making up 78.3%).
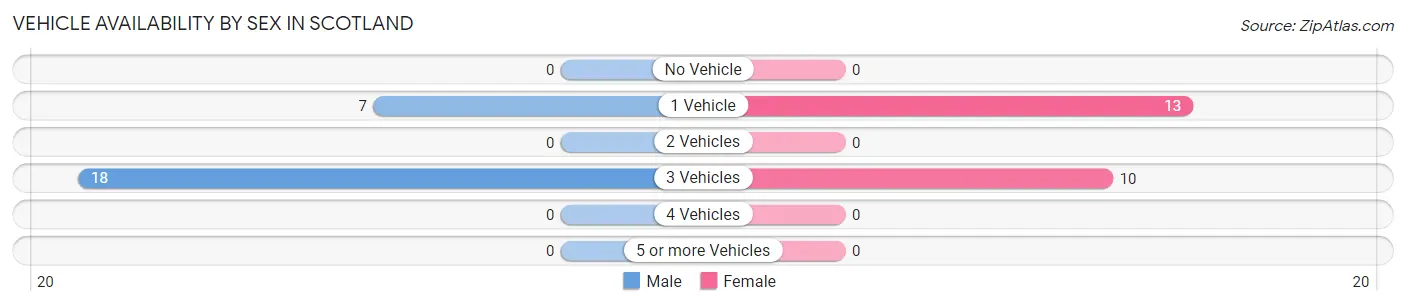
| Vehicles Available | Male | Female |
| No Vehicle | 0 (0.0%) | 0 (0.0%) |
| 1 Vehicle | 7 (28.0%) | 13 (56.5%) |
| 2 Vehicles | 0 (0.0%) | 0 (0.0%) |
| 3 Vehicles | 18 (72.0%) | 10 (43.5%) |
| 4 Vehicles | 0 (0.0%) | 0 (0.0%) |
| 5 or more Vehicles | 0 (0.0%) | 0 (0.0%) |
| Total | 25 (100.0%) | 23 (100.0%) |
Commute Time in Scotland
The most frequently occuring commute durations in Scotland are 60 to 89 minutes (17 commuters, 35.4%), 90 or more minutes (13 commuters, 27.1%), and 20 to 24 minutes (10 commuters, 20.8%).
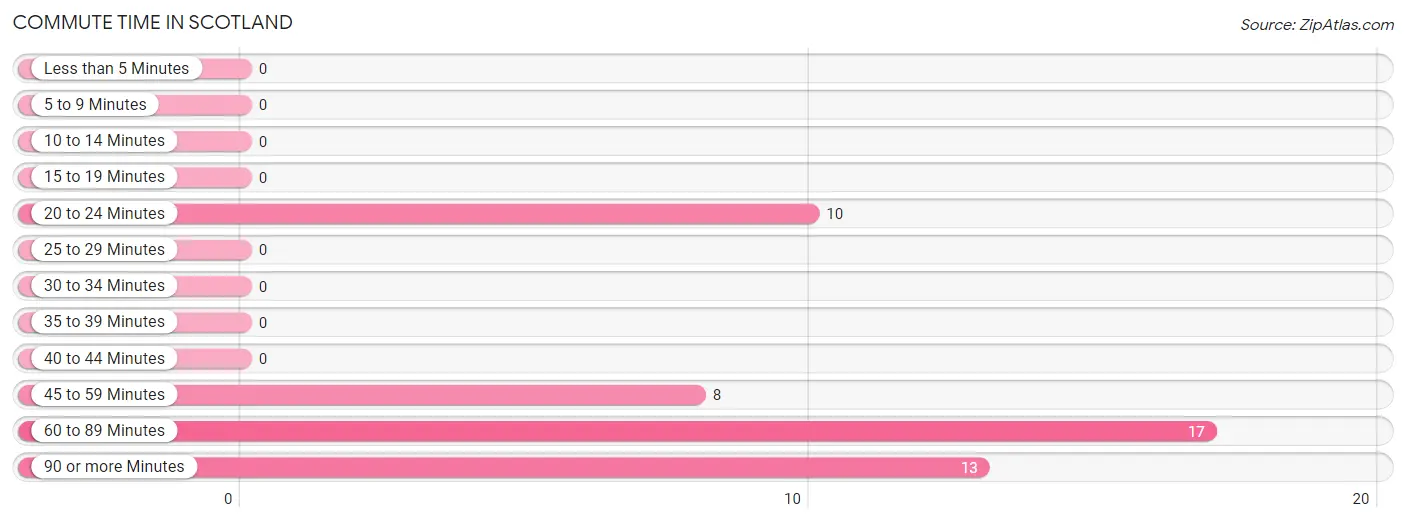
| Commute Time | # Commuters | % Commuters |
| Less than 5 Minutes | 0 | 0.0% |
| 5 to 9 Minutes | 0 | 0.0% |
| 10 to 14 Minutes | 0 | 0.0% |
| 15 to 19 Minutes | 0 | 0.0% |
| 20 to 24 Minutes | 10 | 20.8% |
| 25 to 29 Minutes | 0 | 0.0% |
| 30 to 34 Minutes | 0 | 0.0% |
| 35 to 39 Minutes | 0 | 0.0% |
| 40 to 44 Minutes | 0 | 0.0% |
| 45 to 59 Minutes | 8 | 16.7% |
| 60 to 89 Minutes | 17 | 35.4% |
| 90 or more Minutes | 13 | 27.1% |
Commute Time by Sex in Scotland
The most common commute times in Scotland are 20 to 24 minutes (10 commuters, 40.0%) for males and 90 or more minutes (13 commuters, 56.5%) for females.
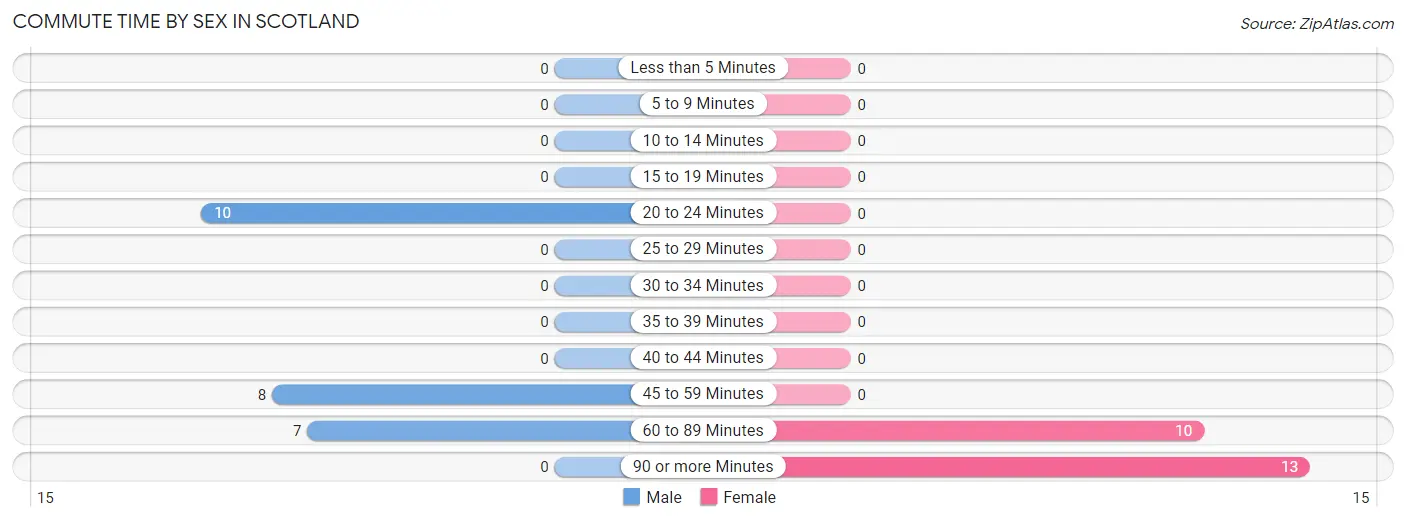
| Commute Time | Male | Female |
| Less than 5 Minutes | 0 (0.0%) | 0 (0.0%) |
| 5 to 9 Minutes | 0 (0.0%) | 0 (0.0%) |
| 10 to 14 Minutes | 0 (0.0%) | 0 (0.0%) |
| 15 to 19 Minutes | 0 (0.0%) | 0 (0.0%) |
| 20 to 24 Minutes | 10 (40.0%) | 0 (0.0%) |
| 25 to 29 Minutes | 0 (0.0%) | 0 (0.0%) |
| 30 to 34 Minutes | 0 (0.0%) | 0 (0.0%) |
| 35 to 39 Minutes | 0 (0.0%) | 0 (0.0%) |
| 40 to 44 Minutes | 0 (0.0%) | 0 (0.0%) |
| 45 to 59 Minutes | 8 (32.0%) | 0 (0.0%) |
| 60 to 89 Minutes | 7 (28.0%) | 10 (43.5%) |
| 90 or more Minutes | 0 (0.0%) | 13 (56.5%) |
Time of Departure to Work by Sex in Scotland
The most frequent times of departure to work in Scotland are 8:00 AM to 8:29 AM (10, 40.0%) for males and 7:00 AM to 7:29 AM (13, 56.5%) for females.
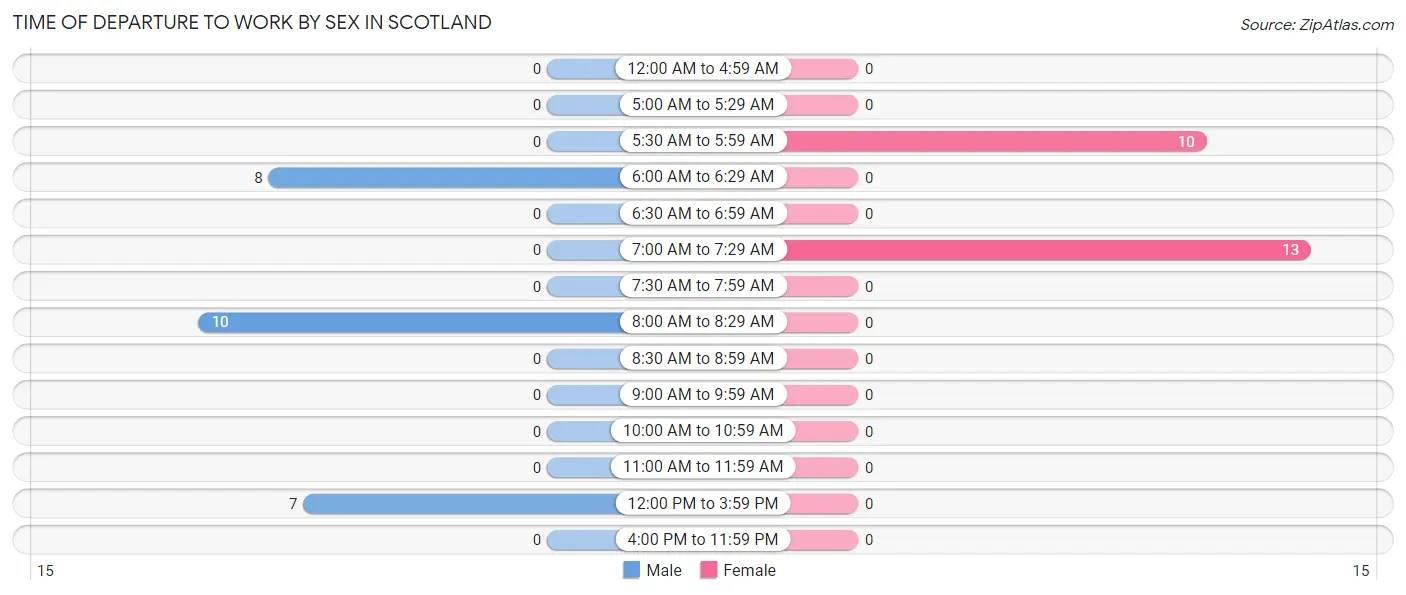
| Time of Departure | Male | Female |
| 12:00 AM to 4:59 AM | 0 (0.0%) | 0 (0.0%) |
| 5:00 AM to 5:29 AM | 0 (0.0%) | 0 (0.0%) |
| 5:30 AM to 5:59 AM | 0 (0.0%) | 10 (43.5%) |
| 6:00 AM to 6:29 AM | 8 (32.0%) | 0 (0.0%) |
| 6:30 AM to 6:59 AM | 0 (0.0%) | 0 (0.0%) |
| 7:00 AM to 7:29 AM | 0 (0.0%) | 13 (56.5%) |
| 7:30 AM to 7:59 AM | 0 (0.0%) | 0 (0.0%) |
| 8:00 AM to 8:29 AM | 10 (40.0%) | 0 (0.0%) |
| 8:30 AM to 8:59 AM | 0 (0.0%) | 0 (0.0%) |
| 9:00 AM to 9:59 AM | 0 (0.0%) | 0 (0.0%) |
| 10:00 AM to 10:59 AM | 0 (0.0%) | 0 (0.0%) |
| 11:00 AM to 11:59 AM | 0 (0.0%) | 0 (0.0%) |
| 12:00 PM to 3:59 PM | 7 (28.0%) | 0 (0.0%) |
| 4:00 PM to 11:59 PM | 0 (0.0%) | 0 (0.0%) |
| Total | 25 (100.0%) | 23 (100.0%) |
Housing Occupancy in Scotland
Occupancy by Ownership in Scotland
Of the total 53 dwellings in Scotland, owner-occupied units account for 34 (64.1%), while renter-occupied units make up 19 (35.8%).
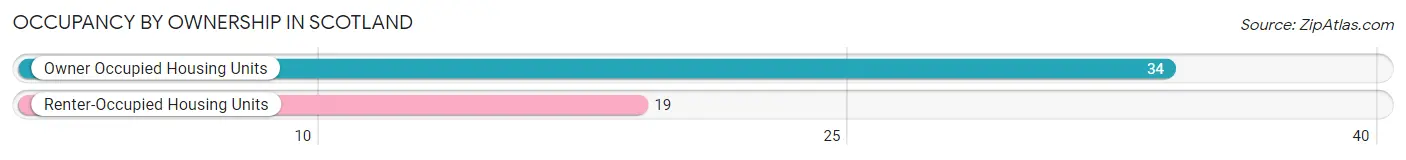
| Occupancy | # Housing Units | % Housing Units |
| Owner Occupied Housing Units | 34 | 64.1% |
| Renter-Occupied Housing Units | 19 | 35.8% |
| Total Occupied Housing Units | 53 | 100.0% |
Occupancy by Household Size in Scotland
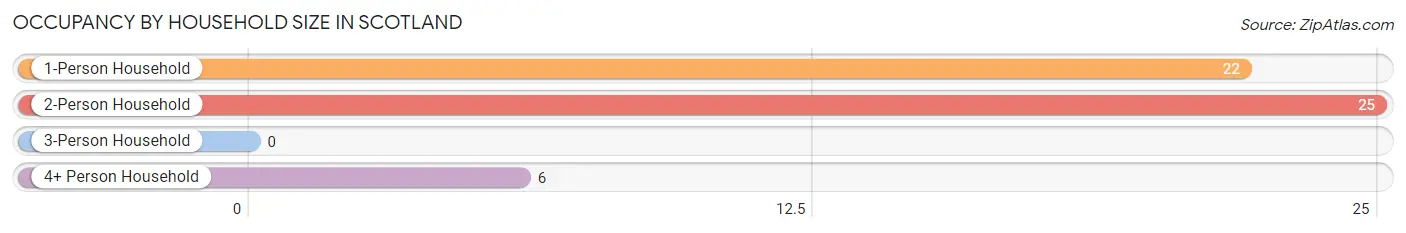
| Household Size | # Housing Units | % Housing Units |
| 1-Person Household | 22 | 41.5% |
| 2-Person Household | 25 | 47.2% |
| 3-Person Household | 0 | 0.0% |
| 4+ Person Household | 6 | 11.3% |
| Total Housing Units | 53 | 100.0% |
Occupancy by Ownership by Household Size in Scotland
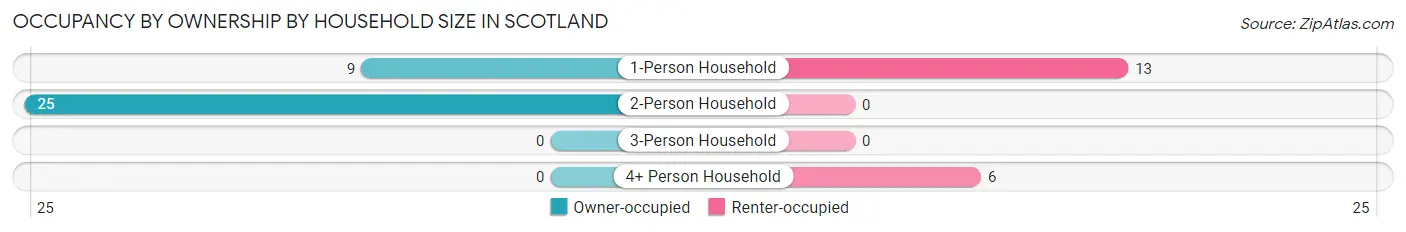
| Household Size | Owner-occupied | Renter-occupied |
| 1-Person Household | 9 (40.9%) | 13 (59.1%) |
| 2-Person Household | 25 (100.0%) | 0 (0.0%) |
| 3-Person Household | 0 (0.0%) | 0 (0.0%) |
| 4+ Person Household | 0 (0.0%) | 6 (100.0%) |
| Total Housing Units | 34 (64.1%) | 19 (35.8%) |
Occupancy by Educational Attainment in Scotland
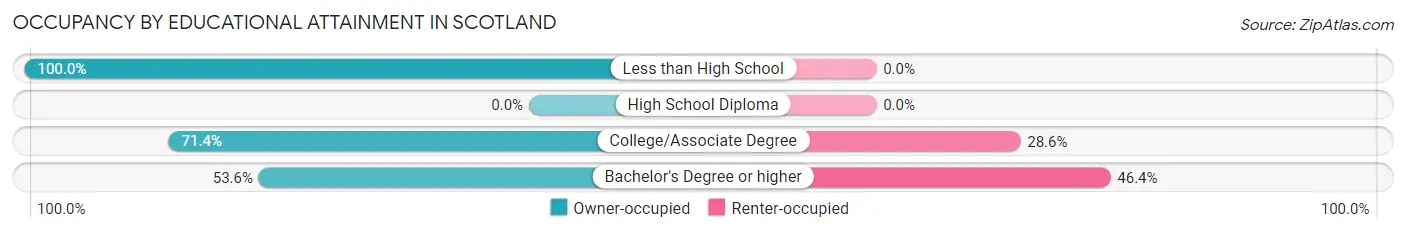
| Household Size | Owner-occupied | Renter-occupied |
| Less than High School | 4 (100.0%) | 0 (0.0%) |
| High School Diploma | 0 (0.0%) | 0 (0.0%) |
| College/Associate Degree | 15 (71.4%) | 6 (28.6%) |
| Bachelor's Degree or higher | 15 (53.6%) | 13 (46.4%) |
Occupancy by Age of Householder in Scotland
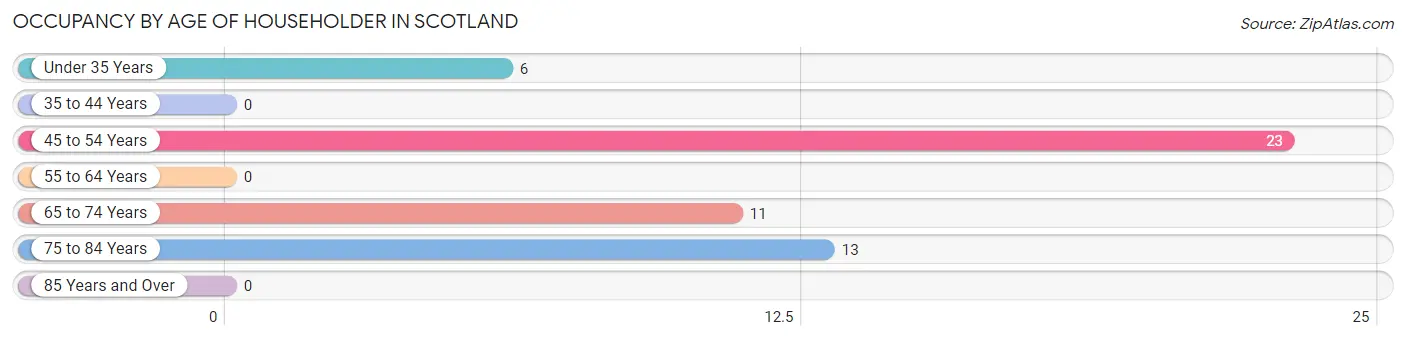
| Age Bracket | # Households | % Households |
| Under 35 Years | 6 | 11.3% |
| 35 to 44 Years | 0 | 0.0% |
| 45 to 54 Years | 23 | 43.4% |
| 55 to 64 Years | 0 | 0.0% |
| 65 to 74 Years | 11 | 20.7% |
| 75 to 84 Years | 13 | 24.5% |
| 85 Years and Over | 0 | 0.0% |
| Total | 53 | 100.0% |
Housing Finances in Scotland
Median Income by Occupancy in Scotland
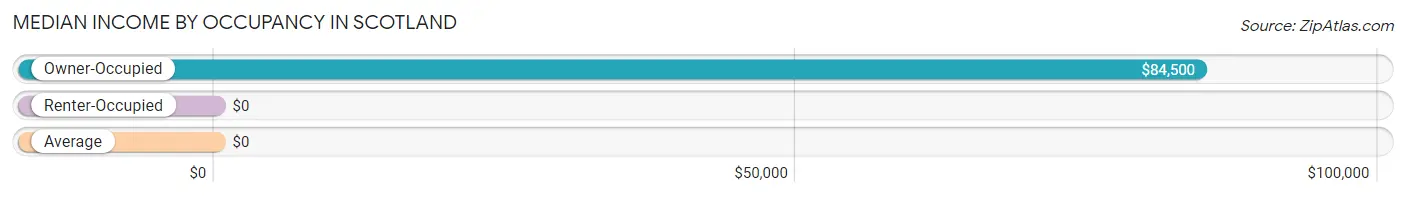
| Occupancy Type | # Households | Median Income |
| Owner-Occupied | 34 (64.1%) | $84,500 |
| Renter-Occupied | 19 (35.8%) | $0 |
| Average | 53 (100.0%) | $0 |
Occupancy by Householder Income Bracket in Scotland
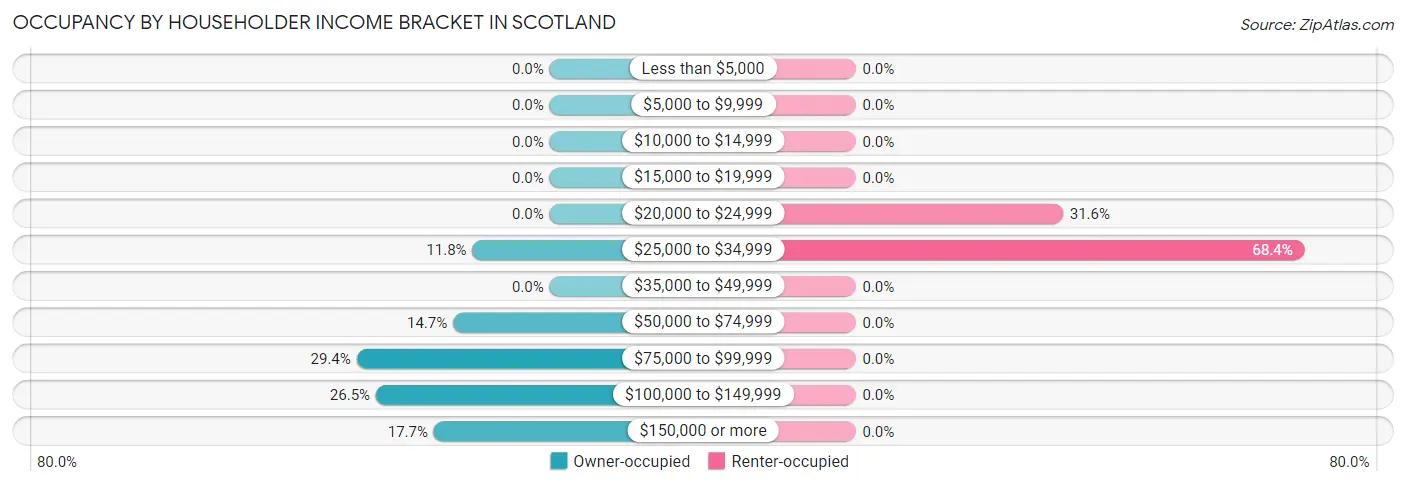
| Income Bracket | Owner-occupied | Renter-occupied |
| Less than $5,000 | 0 (0.0%) | 0 (0.0%) |
| $5,000 to $9,999 | 0 (0.0%) | 0 (0.0%) |
| $10,000 to $14,999 | 0 (0.0%) | 0 (0.0%) |
| $15,000 to $19,999 | 0 (0.0%) | 0 (0.0%) |
| $20,000 to $24,999 | 0 (0.0%) | 6 (31.6%) |
| $25,000 to $34,999 | 4 (11.8%) | 13 (68.4%) |
| $35,000 to $49,999 | 0 (0.0%) | 0 (0.0%) |
| $50,000 to $74,999 | 5 (14.7%) | 0 (0.0%) |
| $75,000 to $99,999 | 10 (29.4%) | 0 (0.0%) |
| $100,000 to $149,999 | 9 (26.5%) | 0 (0.0%) |
| $150,000 or more | 6 (17.6%) | 0 (0.0%) |
| Total | 34 (100.0%) | 19 (100.0%) |
Monthly Housing Cost Tiers in Scotland
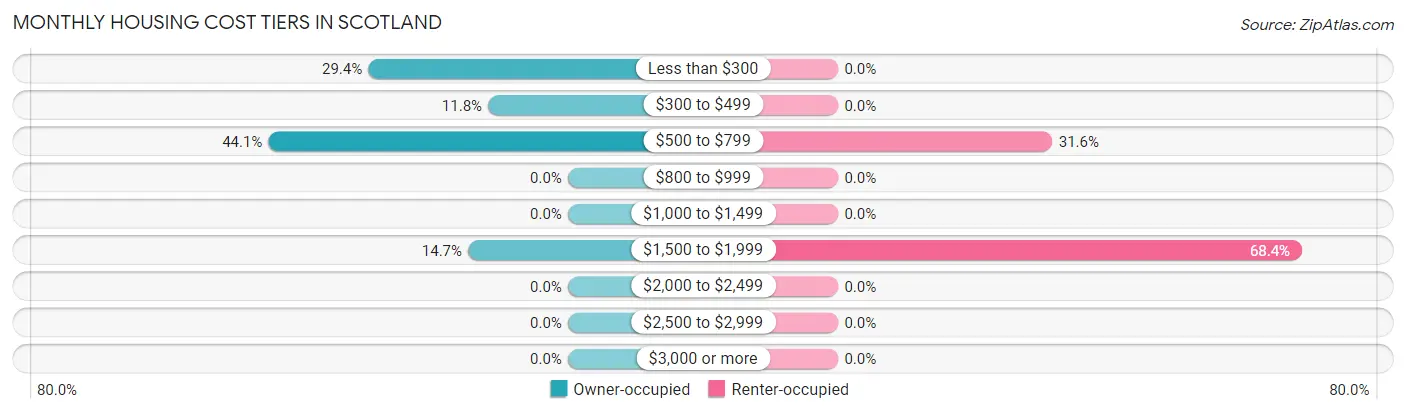
| Monthly Cost | Owner-occupied | Renter-occupied |
| Less than $300 | 10 (29.4%) | 0 (0.0%) |
| $300 to $499 | 4 (11.8%) | 0 (0.0%) |
| $500 to $799 | 15 (44.1%) | 6 (31.6%) |
| $800 to $999 | 0 (0.0%) | 0 (0.0%) |
| $1,000 to $1,499 | 0 (0.0%) | 0 (0.0%) |
| $1,500 to $1,999 | 5 (14.7%) | 13 (68.4%) |
| $2,000 to $2,499 | 0 (0.0%) | 0 (0.0%) |
| $2,500 to $2,999 | 0 (0.0%) | 0 (0.0%) |
| $3,000 or more | 0 (0.0%) | 0 (0.0%) |
| Total | 34 (100.0%) | 19 (100.0%) |
Physical Housing Characteristics in Scotland
Housing Structures in Scotland
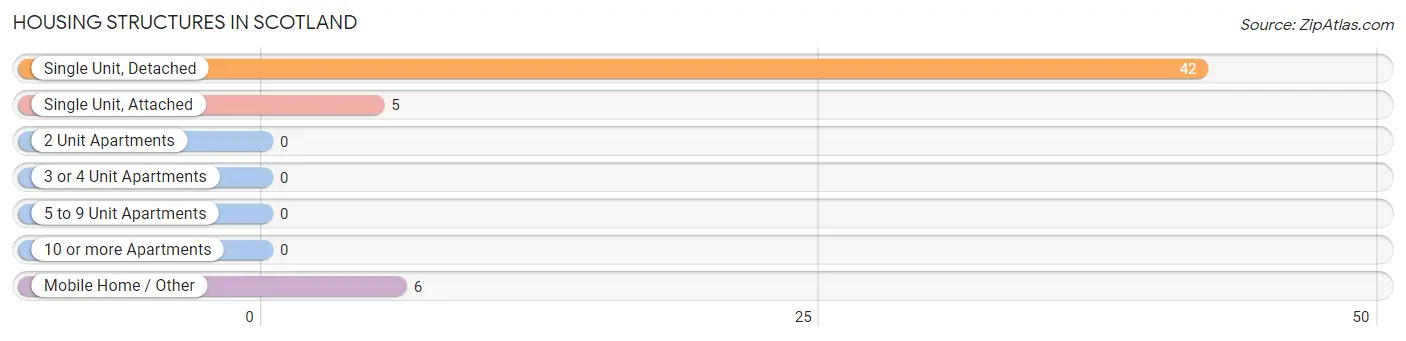
| Structure Type | # Housing Units | % Housing Units |
| Single Unit, Detached | 42 | 79.2% |
| Single Unit, Attached | 5 | 9.4% |
| 2 Unit Apartments | 0 | 0.0% |
| 3 or 4 Unit Apartments | 0 | 0.0% |
| 5 to 9 Unit Apartments | 0 | 0.0% |
| 10 or more Apartments | 0 | 0.0% |
| Mobile Home / Other | 6 | 11.3% |
| Total | 53 | 100.0% |
Housing Structures by Occupancy in Scotland
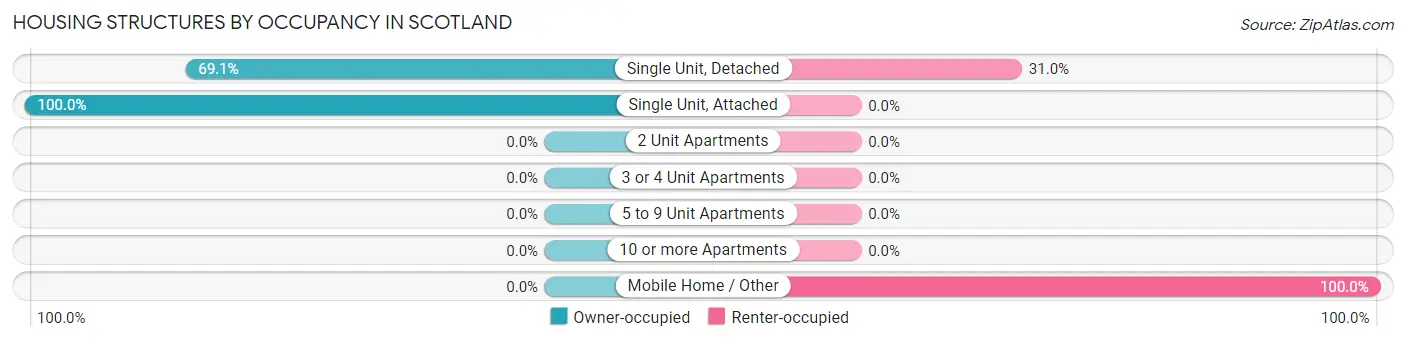
| Structure Type | Owner-occupied | Renter-occupied |
| Single Unit, Detached | 29 (69.1%) | 13 (30.9%) |
| Single Unit, Attached | 5 (100.0%) | 0 (0.0%) |
| 2 Unit Apartments | 0 (0.0%) | 0 (0.0%) |
| 3 or 4 Unit Apartments | 0 (0.0%) | 0 (0.0%) |
| 5 to 9 Unit Apartments | 0 (0.0%) | 0 (0.0%) |
| 10 or more Apartments | 0 (0.0%) | 0 (0.0%) |
| Mobile Home / Other | 0 (0.0%) | 6 (100.0%) |
| Total | 34 (64.1%) | 19 (35.8%) |
Housing Structures by Number of Rooms in Scotland
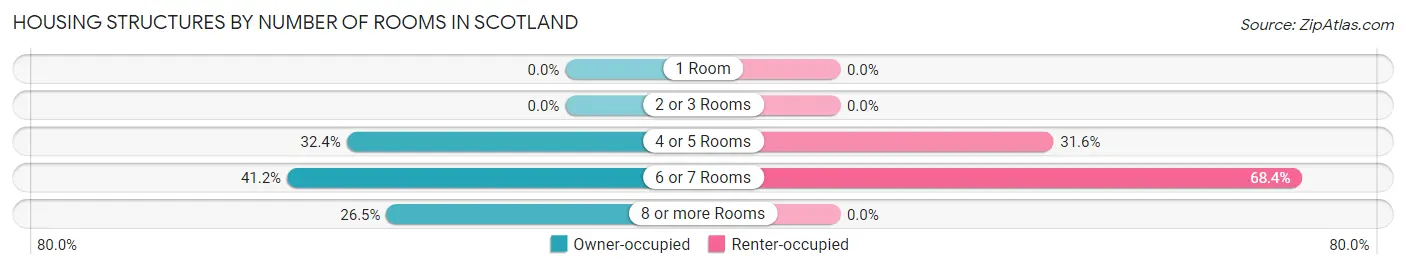
| Number of Rooms | Owner-occupied | Renter-occupied |
| 1 Room | 0 (0.0%) | 0 (0.0%) |
| 2 or 3 Rooms | 0 (0.0%) | 0 (0.0%) |
| 4 or 5 Rooms | 11 (32.4%) | 6 (31.6%) |
| 6 or 7 Rooms | 14 (41.2%) | 13 (68.4%) |
| 8 or more Rooms | 9 (26.5%) | 0 (0.0%) |
| Total | 34 (100.0%) | 19 (100.0%) |
Housing Structure by Heating Type in Scotland
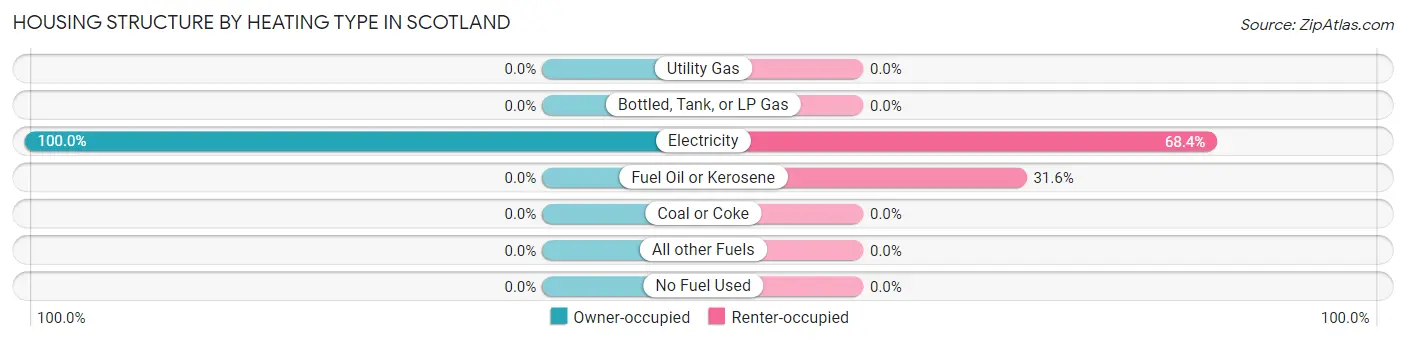
| Heating Type | Owner-occupied | Renter-occupied |
| Utility Gas | 0 (0.0%) | 0 (0.0%) |
| Bottled, Tank, or LP Gas | 0 (0.0%) | 0 (0.0%) |
| Electricity | 34 (100.0%) | 13 (68.4%) |
| Fuel Oil or Kerosene | 0 (0.0%) | 6 (31.6%) |
| Coal or Coke | 0 (0.0%) | 0 (0.0%) |
| All other Fuels | 0 (0.0%) | 0 (0.0%) |
| No Fuel Used | 0 (0.0%) | 0 (0.0%) |
| Total | 34 (100.0%) | 19 (100.0%) |
Household Vehicle Usage in Scotland
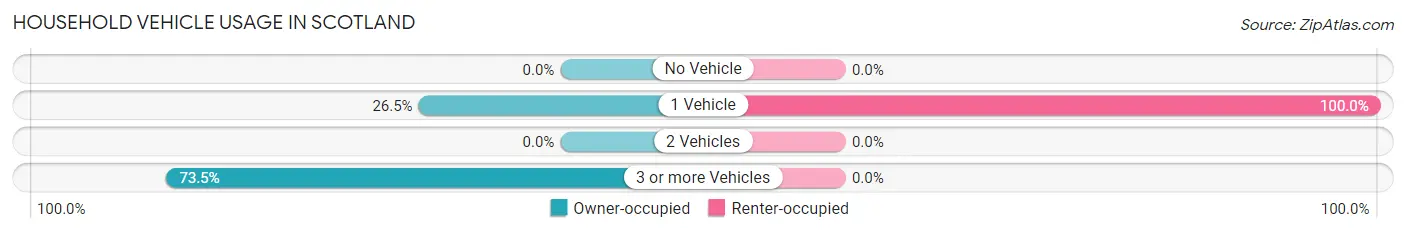
| Vehicles per Household | Owner-occupied | Renter-occupied |
| No Vehicle | 0 (0.0%) | 0 (0.0%) |
| 1 Vehicle | 9 (26.5%) | 19 (100.0%) |
| 2 Vehicles | 0 (0.0%) | 0 (0.0%) |
| 3 or more Vehicles | 25 (73.5%) | 0 (0.0%) |
| Total | 34 (100.0%) | 19 (100.0%) |
Real Estate & Mortgages in Scotland
Real Estate and Mortgage Overview in Scotland
| Characteristic | Without Mortgage | With Mortgage |
| Housing Units | 29 | 5 |
| Median Property Value | - | - |
| Median Household Income | $100,139 | $0 |
| Monthly Housing Costs | - | - |
| Real Estate Taxes | - | - |
Property Value by Mortgage Status in Scotland
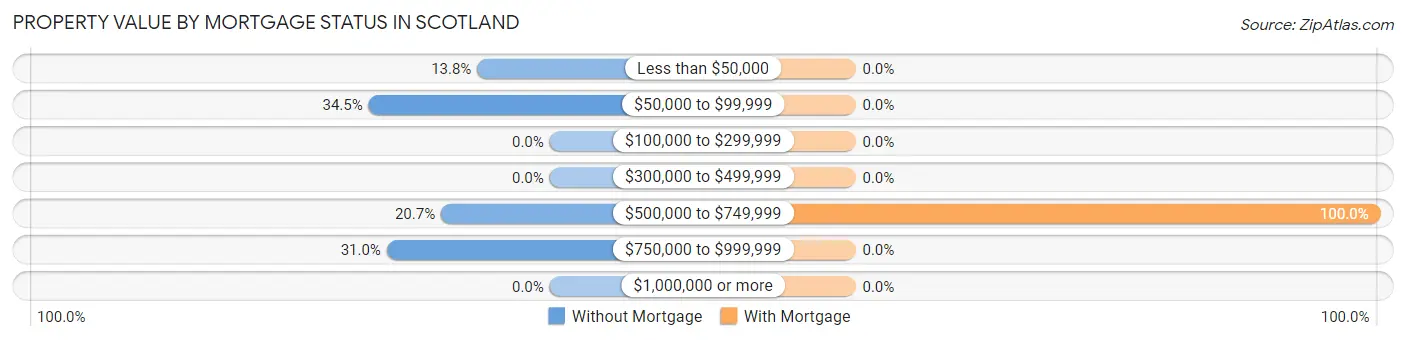
| Property Value | Without Mortgage | With Mortgage |
| Less than $50,000 | 4 (13.8%) | 0 (0.0%) |
| $50,000 to $99,999 | 10 (34.5%) | 0 (0.0%) |
| $100,000 to $299,999 | 0 (0.0%) | 0 (0.0%) |
| $300,000 to $499,999 | 0 (0.0%) | 0 (0.0%) |
| $500,000 to $749,999 | 6 (20.7%) | 5 (100.0%) |
| $750,000 to $999,999 | 9 (31.0%) | 0 (0.0%) |
| $1,000,000 or more | 0 (0.0%) | 0 (0.0%) |
| Total | 29 (100.0%) | 5 (100.0%) |
Household Income by Mortgage Status in Scotland
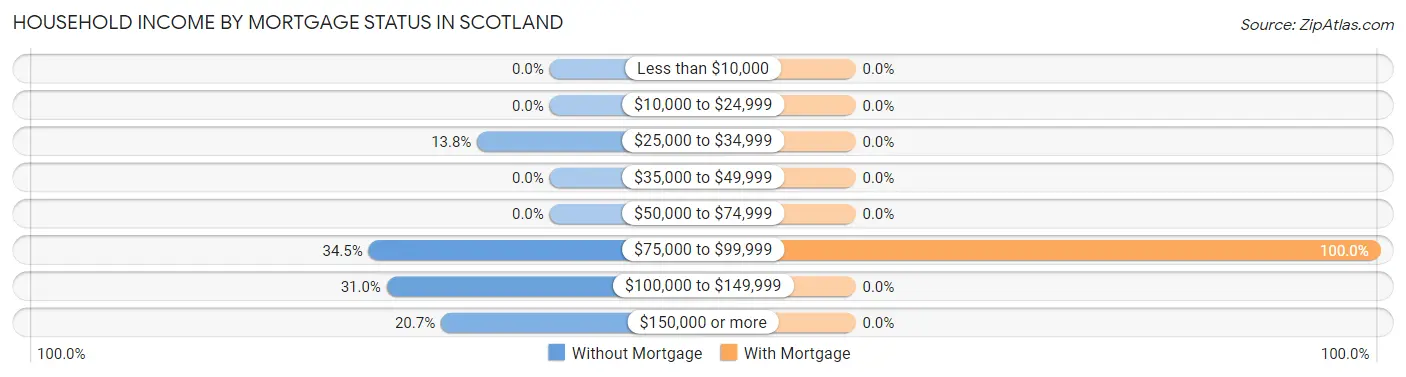
| Household Income | Without Mortgage | With Mortgage |
| Less than $10,000 | 0 (0.0%) | 0 (0.0%) |
| $10,000 to $24,999 | 0 (0.0%) | 0 (0.0%) |
| $25,000 to $34,999 | 4 (13.8%) | 0 (0.0%) |
| $35,000 to $49,999 | 0 (0.0%) | 0 (0.0%) |
| $50,000 to $74,999 | 0 (0.0%) | 0 (0.0%) |
| $75,000 to $99,999 | 10 (34.5%) | 5 (100.0%) |
| $100,000 to $149,999 | 9 (31.0%) | 0 (0.0%) |
| $150,000 or more | 6 (20.7%) | 0 (0.0%) |
| Total | 29 (100.0%) | 5 (100.0%) |
Property Value to Household Income Ratio in Scotland
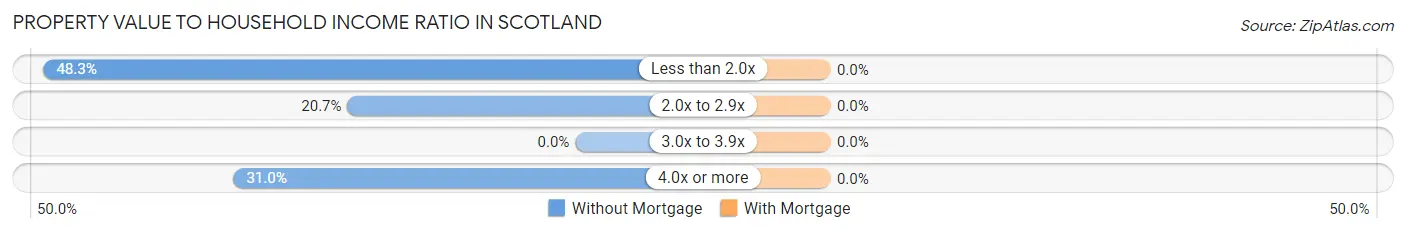
| Value-to-Income Ratio | Without Mortgage | With Mortgage |
| Less than 2.0x | 14 (48.3%) | 0 (0.0%) |
| 2.0x to 2.9x | 6 (20.7%) | 0 (0.0%) |
| 3.0x to 3.9x | 0 (0.0%) | 0 (0.0%) |
| 4.0x or more | 9 (31.0%) | 0 (0.0%) |
| Total | 29 (100.0%) | 5 (100.0%) |
Real Estate Taxes by Mortgage Status in Scotland
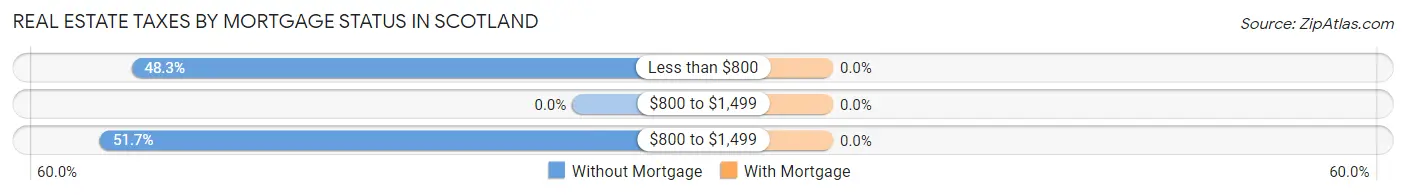
| Property Taxes | Without Mortgage | With Mortgage |
| Less than $800 | 14 (48.3%) | 0 (0.0%) |
| $800 to $1,499 | 0 (0.0%) | 0 (0.0%) |
| $800 to $1,499 | 15 (51.7%) | 0 (0.0%) |
| Total | 29 (100.0%) | 5 (100.0%) |
Health & Disability in Scotland
Health Insurance Coverage by Age in Scotland
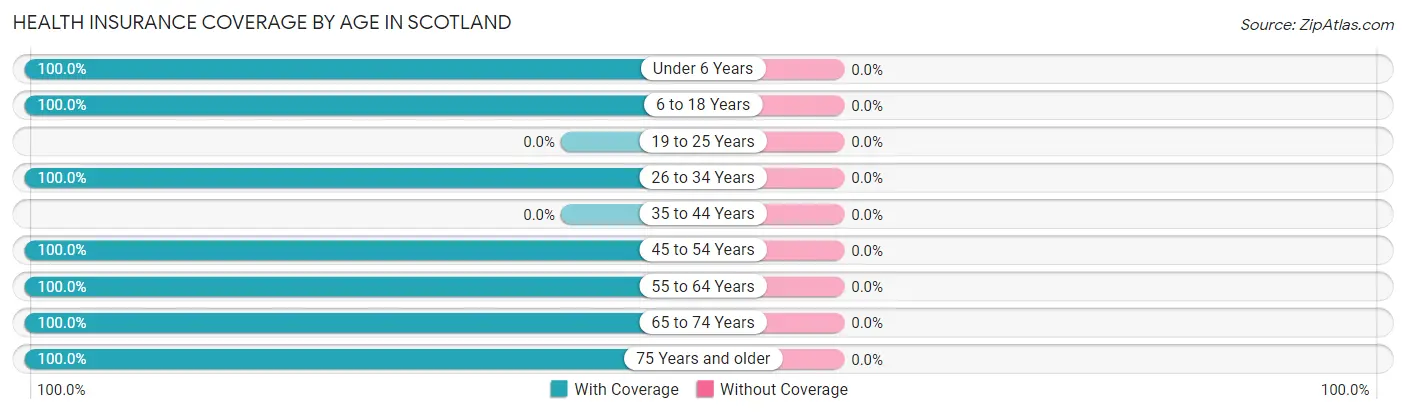
| Age Bracket | With Coverage | Without Coverage |
| Under 6 Years | 14 (100.0%) | 0 (0.0%) |
| 6 to 18 Years | 11 (100.0%) | 0 (0.0%) |
| 19 to 25 Years | 0 (0.0%) | 0 (0.0%) |
| 26 to 34 Years | 13 (100.0%) | 0 (0.0%) |
| 35 to 44 Years | 0 (0.0%) | 0 (0.0%) |
| 45 to 54 Years | 33 (100.0%) | 0 (0.0%) |
| 55 to 64 Years | 10 (100.0%) | 0 (0.0%) |
| 65 to 74 Years | 29 (100.0%) | 0 (0.0%) |
| 75 Years and older | 13 (100.0%) | 0 (0.0%) |
| Total | 123 (100.0%) | 0 (0.0%) |
Health Insurance Coverage by Citizenship Status in Scotland
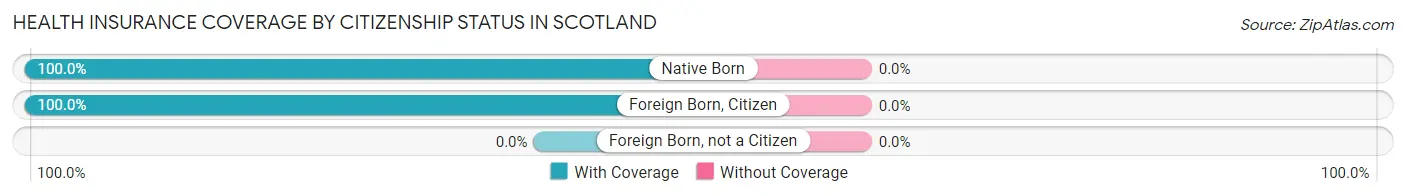
| Citizenship Status | With Coverage | Without Coverage |
| Native Born | 14 (100.0%) | 0 (0.0%) |
| Foreign Born, Citizen | 11 (100.0%) | 0 (0.0%) |
| Foreign Born, not a Citizen | 0 (0.0%) | 0 (0.0%) |
Health Insurance Coverage by Household Income in Scotland
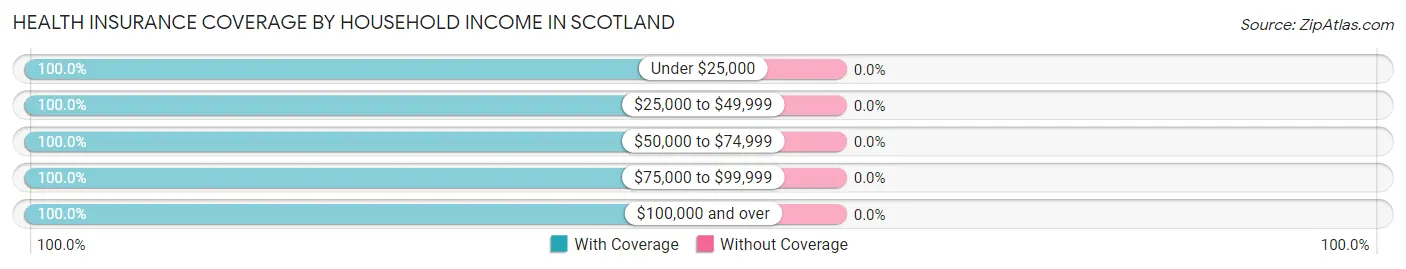
| Household Income | With Coverage | Without Coverage |
| Under $25,000 | 38 (100.0%) | 0 (0.0%) |
| $25,000 to $49,999 | 27 (100.0%) | 0 (0.0%) |
| $50,000 to $74,999 | 13 (100.0%) | 0 (0.0%) |
| $75,000 to $99,999 | 20 (100.0%) | 0 (0.0%) |
| $100,000 and over | 25 (100.0%) | 0 (0.0%) |
Public vs Private Health Insurance Coverage by Age in Scotland
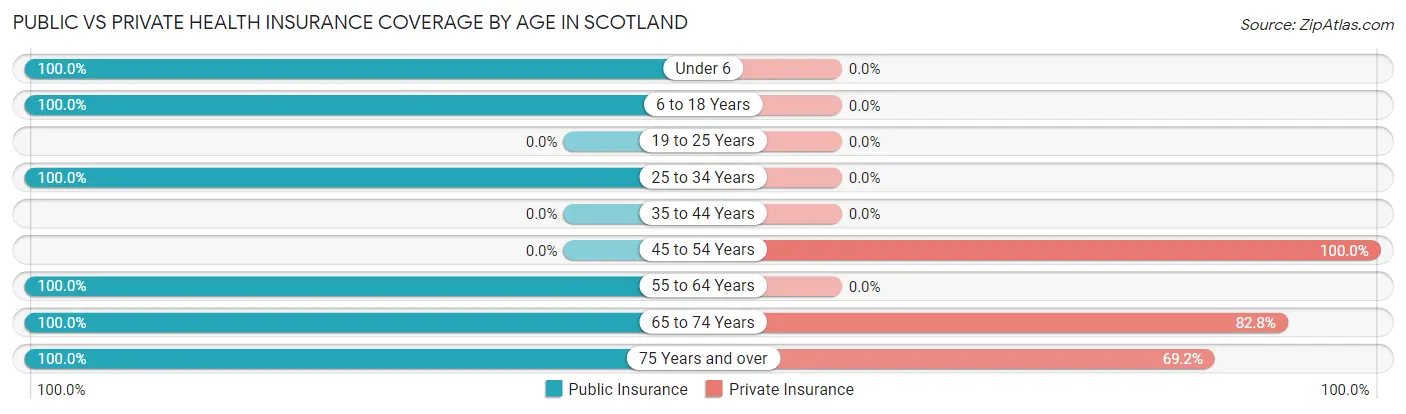
| Age Bracket | Public Insurance | Private Insurance |
| Under 6 | 14 (100.0%) | 0 (0.0%) |
| 6 to 18 Years | 11 (100.0%) | 0 (0.0%) |
| 19 to 25 Years | 0 (0.0%) | 0 (0.0%) |
| 25 to 34 Years | 13 (100.0%) | 0 (0.0%) |
| 35 to 44 Years | 0 (0.0%) | 0 (0.0%) |
| 45 to 54 Years | 0 (0.0%) | 33 (100.0%) |
| 55 to 64 Years | 10 (100.0%) | 0 (0.0%) |
| 65 to 74 Years | 29 (100.0%) | 24 (82.8%) |
| 75 Years and over | 13 (100.0%) | 9 (69.2%) |
| Total | 90 (73.2%) | 66 (53.7%) |
Disability Status by Sex by Age in Scotland
| Age Bracket | Male | Female |
| Under 5 Years | 0 (0.0%) | 0 (0.0%) |
| 5 to 17 Years | 0 (0.0%) | 0 (0.0%) |
| 18 to 34 Years | 0 (0.0%) | 0 (0.0%) |
| 35 to 64 Years | 0 (0.0%) | 0 (0.0%) |
| 65 to 74 Years | 0 (0.0%) | 0 (0.0%) |
| 75 Years and over | 0 (0.0%) | 0 (0.0%) |
Disability Class by Sex by Age in Scotland
Disability Class: Hearing Difficulty
| Age Bracket | Male | Female |
| Under 5 Years | 0 (0.0%) | 0 (0.0%) |
| 5 to 17 Years | 0 (0.0%) | 0 (0.0%) |
| 18 to 34 Years | 0 (0.0%) | 0 (0.0%) |
| 35 to 64 Years | 0 (0.0%) | 0 (0.0%) |
| 65 to 74 Years | 0 (0.0%) | 0 (0.0%) |
| 75 Years and over | 0 (0.0%) | 0 (0.0%) |
Disability Class: Vision Difficulty
| Age Bracket | Male | Female |
| Under 5 Years | 0 (0.0%) | 0 (0.0%) |
| 5 to 17 Years | 0 (0.0%) | 0 (0.0%) |
| 18 to 34 Years | 0 (0.0%) | 0 (0.0%) |
| 35 to 64 Years | 0 (0.0%) | 0 (0.0%) |
| 65 to 74 Years | 0 (0.0%) | 0 (0.0%) |
| 75 Years and over | 0 (0.0%) | 0 (0.0%) |
Disability Class: Cognitive Difficulty

| Age Bracket | Male | Female |
| 5 to 17 Years | 0 (0.0%) | 0 (0.0%) |
| 18 to 34 Years | 0 (0.0%) | 0 (0.0%) |
| 35 to 64 Years | 0 (0.0%) | 0 (0.0%) |
| 65 to 74 Years | 0 (0.0%) | 0 (0.0%) |
| 75 Years and over | 0 (0.0%) | 0 (0.0%) |
Disability Class: Ambulatory Difficulty
| Age Bracket | Male | Female |
| 5 to 17 Years | 0 (0.0%) | 0 (0.0%) |
| 18 to 34 Years | 0 (0.0%) | 0 (0.0%) |
| 35 to 64 Years | 0 (0.0%) | 0 (0.0%) |
| 65 to 74 Years | 0 (0.0%) | 0 (0.0%) |
| 75 Years and over | 0 (0.0%) | 0 (0.0%) |
Disability Class: Self-Care Difficulty
| Age Bracket | Male | Female |
| 5 to 17 Years | 0 (0.0%) | 0 (0.0%) |
| 18 to 34 Years | 0 (0.0%) | 0 (0.0%) |
| 35 to 64 Years | 0 (0.0%) | 0 (0.0%) |
| 65 to 74 Years | 0 (0.0%) | 0 (0.0%) |
| 75 Years and over | 0 (0.0%) | 0 (0.0%) |
Technology Access in Scotland
Computing Device Access in Scotland
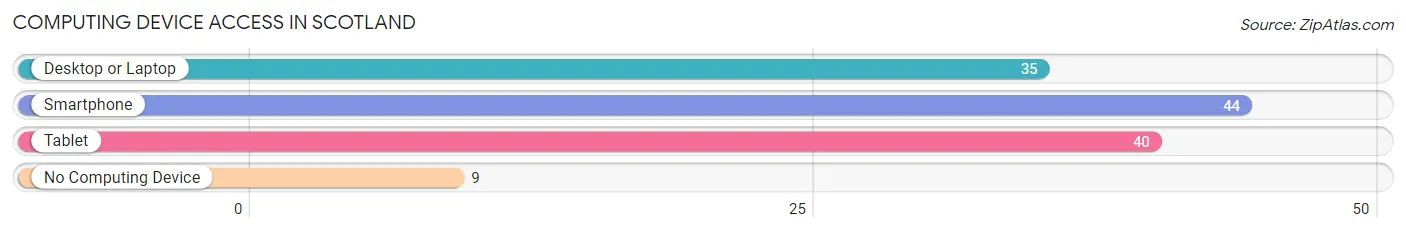
| Device Type | # Households | % Households |
| Desktop or Laptop | 35 | 66.0% |
| Smartphone | 44 | 83.0% |
| Tablet | 40 | 75.5% |
| No Computing Device | 9 | 17.0% |
| Total | 53 | 100.0% |
Internet Access in Scotland
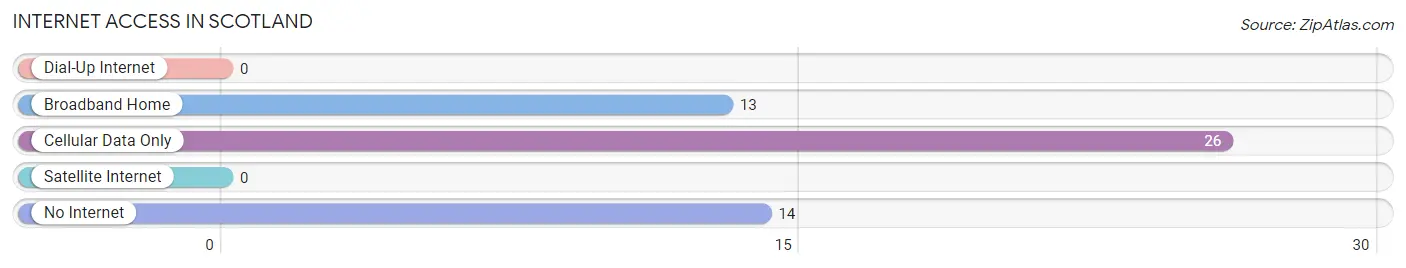
| Internet Type | # Households | % Households |
| Dial-Up Internet | 0 | 0.0% |
| Broadband Home | 13 | 24.5% |
| Cellular Data Only | 26 | 49.1% |
| Satellite Internet | 0 | 0.0% |
| No Internet | 14 | 26.4% |
| Total | 53 | 100.0% |
Scotland Summary
Scotland, VA is a small town located in the south-central part of Virginia, in the United States. It is situated in the heart of the Shenandoah Valley, and is part of the larger Augusta County. The town is located on the banks of the South River, and is surrounded by the Blue Ridge Mountains. The town has a population of just over 1,000 people, and is a rural community with a strong agricultural heritage.
History
Scotland, VA was first settled in the late 1700s by a group of Scots-Irish immigrants. The town was originally known as “Scotchtown”, and was named after the immigrants’ homeland. The town was officially incorporated in 1820, and was named after the nearby Scotland Parish. The town was an important stop on the Valley Turnpike, which connected the Shenandoah Valley to the rest of the state.
During the Civil War, Scotland, VA was the site of several battles, including the Battle of Piedmont and the Battle of Fisher’s Hill. The town was also the site of a Confederate hospital, and many of the town’s buildings were used as hospitals during the war. After the war, the town slowly recovered, and by the early 1900s, it had become a thriving agricultural community.
Geography
Scotland, VA is located in the Shenandoah Valley, in the south-central part of Virginia. The town is situated on the banks of the South River, and is surrounded by the Blue Ridge Mountains. The town is located about 25 miles south of Harrisonburg, and about 50 miles west of Charlottesville. The town is located in a rural area, and is surrounded by farmland and forests.
Economy
Scotland, VA is a rural community with a strong agricultural heritage. The town’s economy is largely based on farming and livestock production. The town is also home to several small businesses, including a grocery store, a hardware store, and a few restaurants. The town is also home to a few small manufacturing companies, which produce a variety of products, including furniture and clothing.
Demographics
As of the 2010 census, Scotland, VA had a population of 1,072 people. The town is predominantly white, with about 90% of the population being white. The town also has a small African American population, which makes up about 5% of the population. The town also has a small Hispanic population, which makes up about 2% of the population. The median household income in the town is about $37,000, and the median home value is about $150,000.
Common Questions
What is Per Capita Income in Scotland?
Per Capita income in Scotland is $41,940.
What is Inequality or Gini Index in Scotland?
Inequality or Gini Index in Scotland is 0.46.
What is the Total Population of Scotland?
Total Population of Scotland is 123.
What is the Total Male Population of Scotland?
Total Male Population of Scotland is 74.
What is the Total Female Population of Scotland?
Total Female Population of Scotland is 49.
What is the Ratio of Males per 100 Females in Scotland?
There are 151.02 Males per 100 Females in Scotland.
What is the Ratio of Females per 100 Males in Scotland?
There are 66.22 Females per 100 Males in Scotland.
What is the Median Population Age in Scotland?
Median Population Age in Scotland is 52.1 Years.
What is the Average Family Size in Scotland
Average Family Size in Scotland is 3.9 People.
What is the Average Household Size in Scotland
Average Household Size in Scotland is 2.3 People.
How Large is the Labor Force in Scotland?
There are 48 People in the Labor Forcein in Scotland.
What is the Percentage of People in the Labor Force in Scotland?
49.0% of People are in the Labor Force in Scotland.