Tangier, VA Map & Demographics
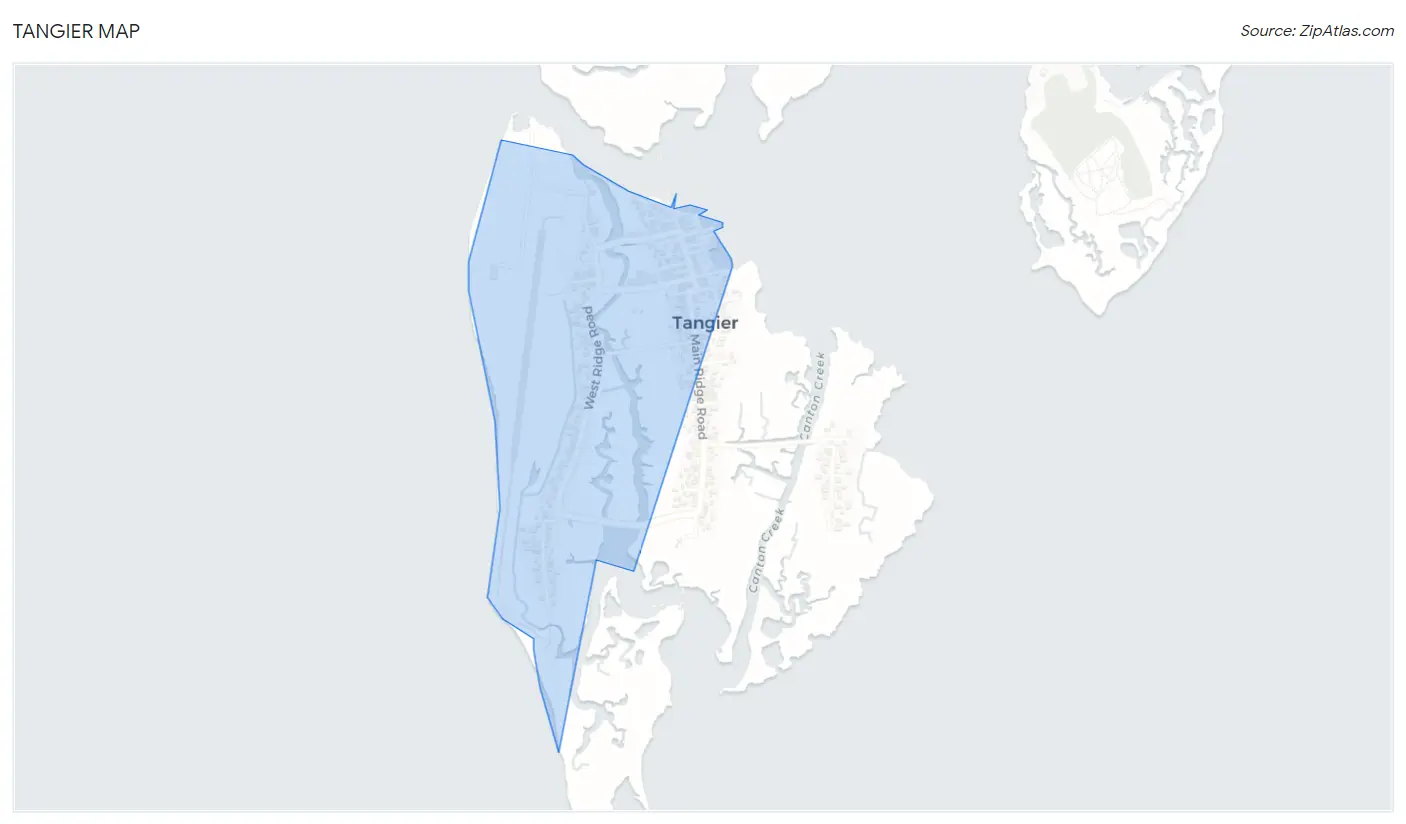
Tangier Map
Tangier Overview
$32,883
PER CAPITA INCOME
84.4%
WAGE / INCOME GAP [ % ]
15.6¢/ $1
WAGE / INCOME GAP [ $ ]
0.44
INEQUALITY / GINI INDEX
345
TOTAL POPULATION
162
MALE POPULATION
183
FEMALE POPULATION
88.52
MALES / 100 FEMALES
112.96
FEMALES / 100 MALES
57.3
MEDIAN AGE
2.5
AVG FAMILY SIZE
1.9
AVG HOUSEHOLD SIZE
197
LABOR FORCE [ PEOPLE ]
61.9%
PERCENT IN LABOR FORCE
5.6%
UNEMPLOYMENT RATE
Tangier Zip Codes
Tangier Area Codes
Income in Tangier
Income Overview in Tangier
| Characteristic | Number | Measure |
| Per Capita Income | 345 | $32,883 |
| Median Family Income | 110 | $0 |
| Mean Family Income | 110 | $80,157 |
| Median Household Income | 179 | $0 |
| Mean Household Income | 179 | $60,875 |
| Income Deficit | 110 | $0 |
| Wage / Income Gap (%) | 345 | 84.37% |
| Wage / Income Gap ($) | 345 | 15.63¢ per $1 |
| Gini / Inequality Index | 345 | 0.44 |
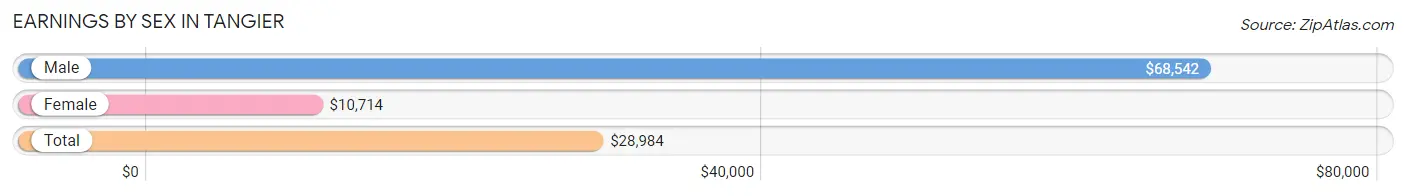
Earnings by Sex in Tangier
Average Earnings in Tangier are $28,984, $68,542 for men and $10,714 for women, a difference of 84.4%.
| Sex | Number | Average Earnings |
| Male | 107 (49.8%) | $68,542 |
| Female | 108 (50.2%) | $10,714 |
| Total | 215 (100.0%) | $28,984 |
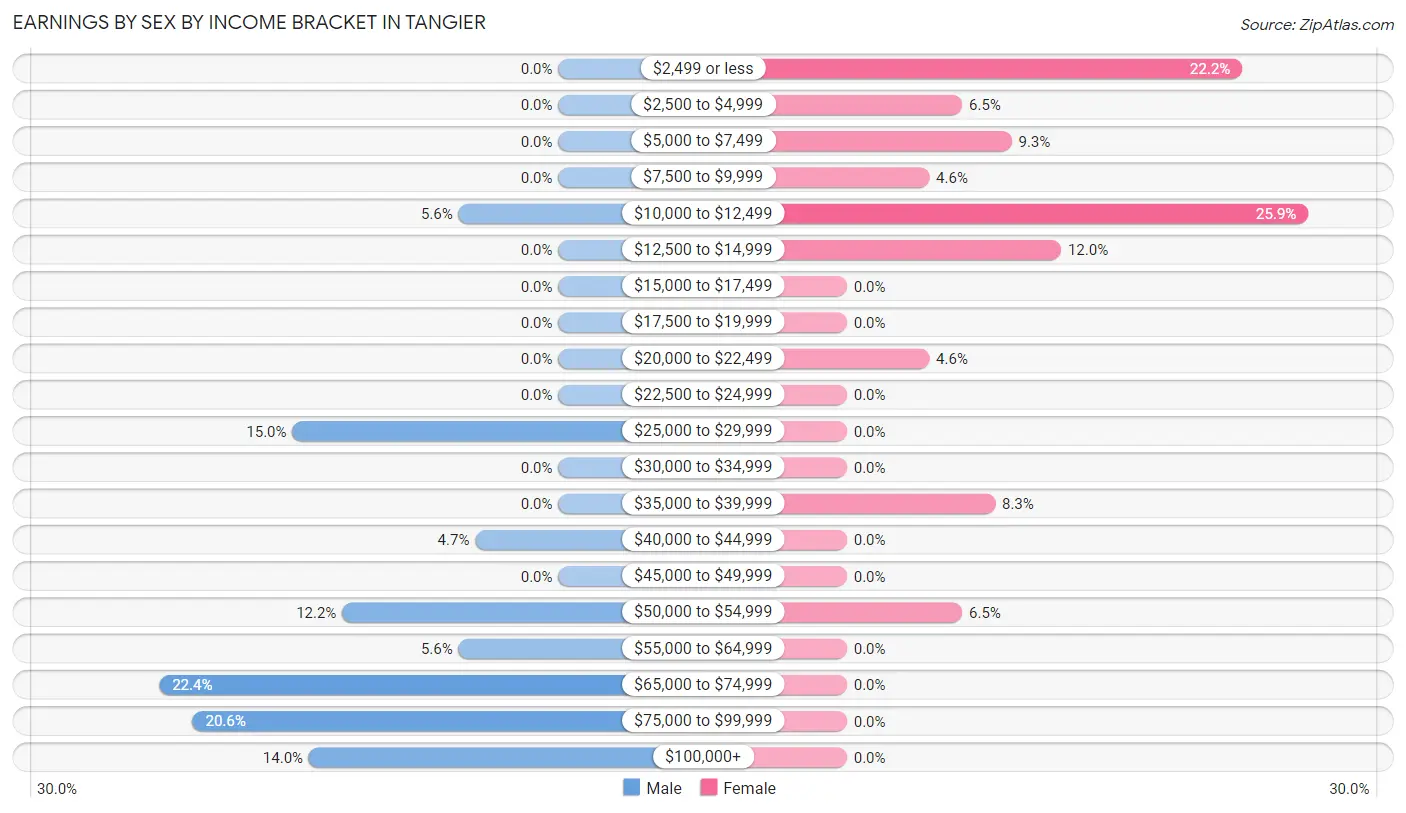
Earnings by Sex by Income Bracket in Tangier
The most common earnings brackets in Tangier are $65,000 to $74,999 for men (24 | 22.4%) and $10,000 to $12,499 for women (28 | 25.9%).
| Income | Male | Female |
| $2,499 or less | 0 (0.0%) | 24 (22.2%) |
| $2,500 to $4,999 | 0 (0.0%) | 7 (6.5%) |
| $5,000 to $7,499 | 0 (0.0%) | 10 (9.3%) |
| $7,500 to $9,999 | 0 (0.0%) | 5 (4.6%) |
| $10,000 to $12,499 | 6 (5.6%) | 28 (25.9%) |
| $12,500 to $14,999 | 0 (0.0%) | 13 (12.0%) |
| $15,000 to $17,499 | 0 (0.0%) | 0 (0.0%) |
| $17,500 to $19,999 | 0 (0.0%) | 0 (0.0%) |
| $20,000 to $22,499 | 0 (0.0%) | 5 (4.6%) |
| $22,500 to $24,999 | 0 (0.0%) | 0 (0.0%) |
| $25,000 to $29,999 | 16 (14.9%) | 0 (0.0%) |
| $30,000 to $34,999 | 0 (0.0%) | 0 (0.0%) |
| $35,000 to $39,999 | 0 (0.0%) | 9 (8.3%) |
| $40,000 to $44,999 | 5 (4.7%) | 0 (0.0%) |
| $45,000 to $49,999 | 0 (0.0%) | 0 (0.0%) |
| $50,000 to $54,999 | 13 (12.1%) | 7 (6.5%) |
| $55,000 to $64,999 | 6 (5.6%) | 0 (0.0%) |
| $65,000 to $74,999 | 24 (22.4%) | 0 (0.0%) |
| $75,000 to $99,999 | 22 (20.6%) | 0 (0.0%) |
| $100,000+ | 15 (14.0%) | 0 (0.0%) |
| Total | 107 (100.0%) | 108 (100.0%) |
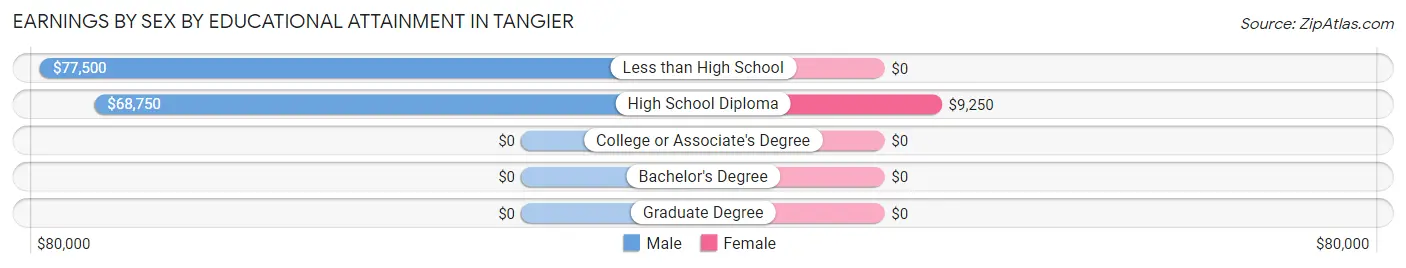
Earnings by Sex by Educational Attainment in Tangier
Average earnings in Tangier are $69,653 for men and $10,893 for women, a difference of 84.4%. Men with an educational attainment of less than high school enjoy the highest average annual earnings of $77,500, while those with high school diploma education earn the least with $68,750. Women with an educational attainment of high school diploma earn the most with the average annual earnings of $9,250, while those with high school diploma education have the smallest earnings of $9,250.
| Educational Attainment | Male Income | Female Income |
| Less than High School | $77,500 | $0 |
| High School Diploma | $68,750 | $9,250 |
| College or Associate's Degree | - | - |
| Bachelor's Degree | - | - |
| Graduate Degree | - | - |
| Total | $69,653 | $10,893 |
Family Income in Tangier
Family Income Brackets in Tangier
According to the Tangier family income data, there are 35 families falling into the $25,000 to $34,999 income range, which is the most common income bracket and makes up 31.8% of all families.
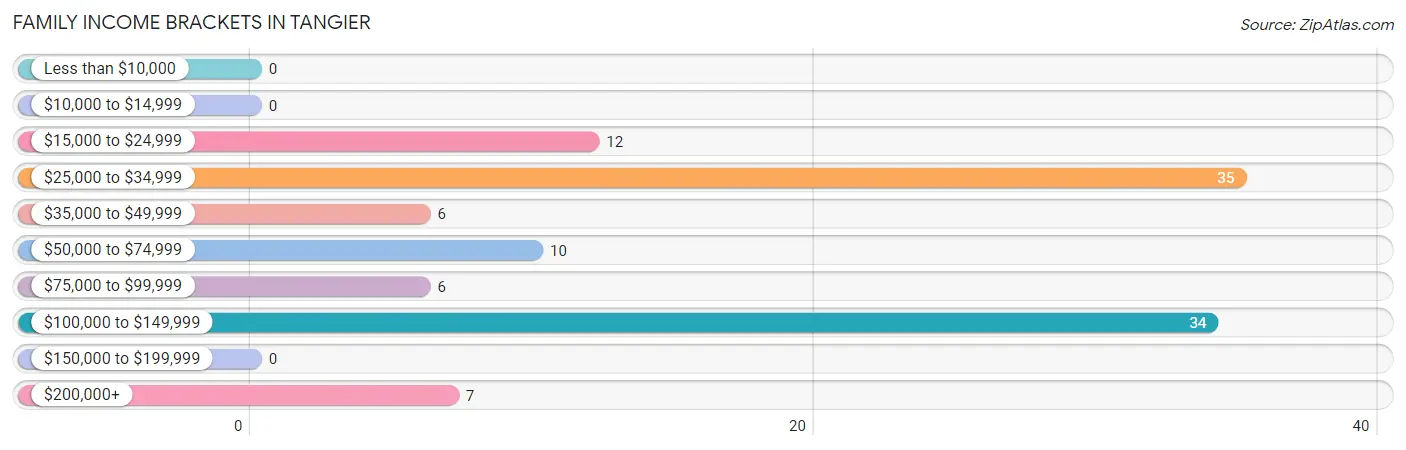
| Income Bracket | # Families | % Families |
| Less than $10,000 | 0 | 0.0% |
| $10,000 to $14,999 | 0 | 0.0% |
| $15,000 to $24,999 | 12 | 10.9% |
| $25,000 to $34,999 | 35 | 31.8% |
| $35,000 to $49,999 | 6 | 5.5% |
| $50,000 to $74,999 | 10 | 9.1% |
| $75,000 to $99,999 | 6 | 5.5% |
| $100,000 to $149,999 | 34 | 30.9% |
| $150,000 to $199,999 | 0 | 0.0% |
| $200,000+ | 7 | 6.4% |
Family Income by Famaliy Size in Tangier
| Income Bracket | # Families | Median Income |
| 2-Person Families | 84 (76.4%) | $0 |
| 3-Person Families | 11 (10.0%) | $0 |
| 4-Person Families | 8 (7.3%) | $0 |
| 5-Person Families | 7 (6.4%) | $0 |
| 6-Person Families | 0 (0.0%) | $0 |
| 7+ Person Families | 0 (0.0%) | $0 |
| Total | 110 (100.0%) | $0 |
Family Income by Number of Earners in Tangier
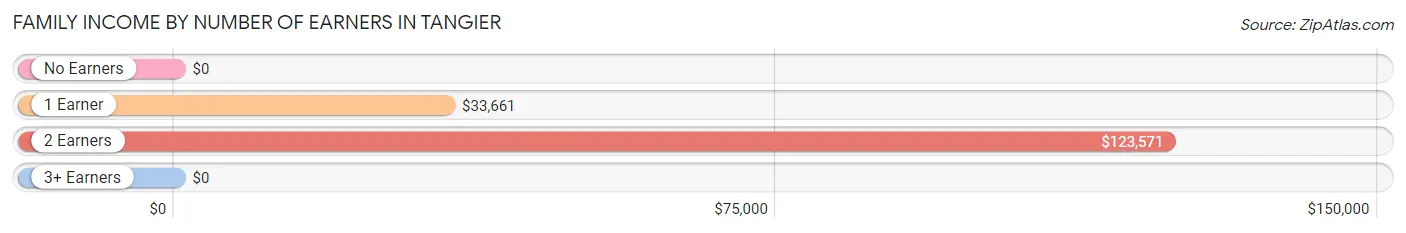
| Number of Earners | # Families | Median Income |
| No Earners | 6 (5.4%) | $0 |
| 1 Earner | 52 (47.3%) | $33,661 |
| 2 Earners | 40 (36.4%) | $123,571 |
| 3+ Earners | 12 (10.9%) | $0 |
| Total | 110 (100.0%) | $0 |
Household Income in Tangier
Household Income Brackets in Tangier
With 58 households falling in the category, the $15,000 to $24,999 income range is the most frequent in Tangier, accounting for 32.4% of all households.
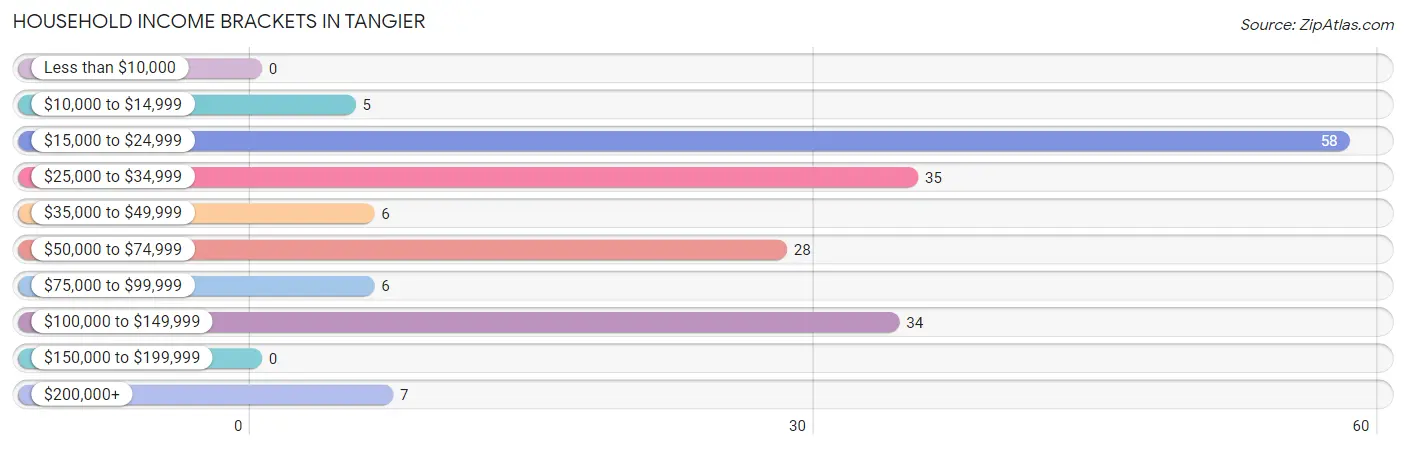
| Income Bracket | # Households | % Households |
| Less than $10,000 | 0 | 0.0% |
| $10,000 to $14,999 | 5 | 2.8% |
| $15,000 to $24,999 | 58 | 32.4% |
| $25,000 to $34,999 | 35 | 19.6% |
| $35,000 to $49,999 | 6 | 3.4% |
| $50,000 to $74,999 | 28 | 15.6% |
| $75,000 to $99,999 | 6 | 3.4% |
| $100,000 to $149,999 | 34 | 19.0% |
| $150,000 to $199,999 | 0 | 0.0% |
| $200,000+ | 7 | 3.9% |
Household Income by Householder Age in Tangier
The median household income in Tangier is $0, with the highest median household income of $133,125 found in the 25 to 44 years age bracket for the primary householder. A total of 26 households (14.5%) fall into this category.
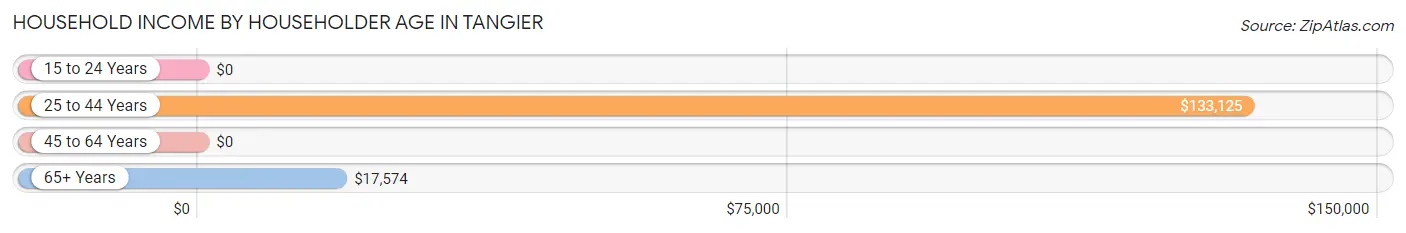
| Income Bracket | # Households | Median Income |
| 15 to 24 Years | 0 (0.0%) | $0 |
| 25 to 44 Years | 26 (14.5%) | $133,125 |
| 45 to 64 Years | 84 (46.9%) | $0 |
| 65+ Years | 69 (38.6%) | $17,574 |
| Total | 179 (100.0%) | $0 |
Poverty in Tangier
Income Below Poverty by Sex and Age in Tangier
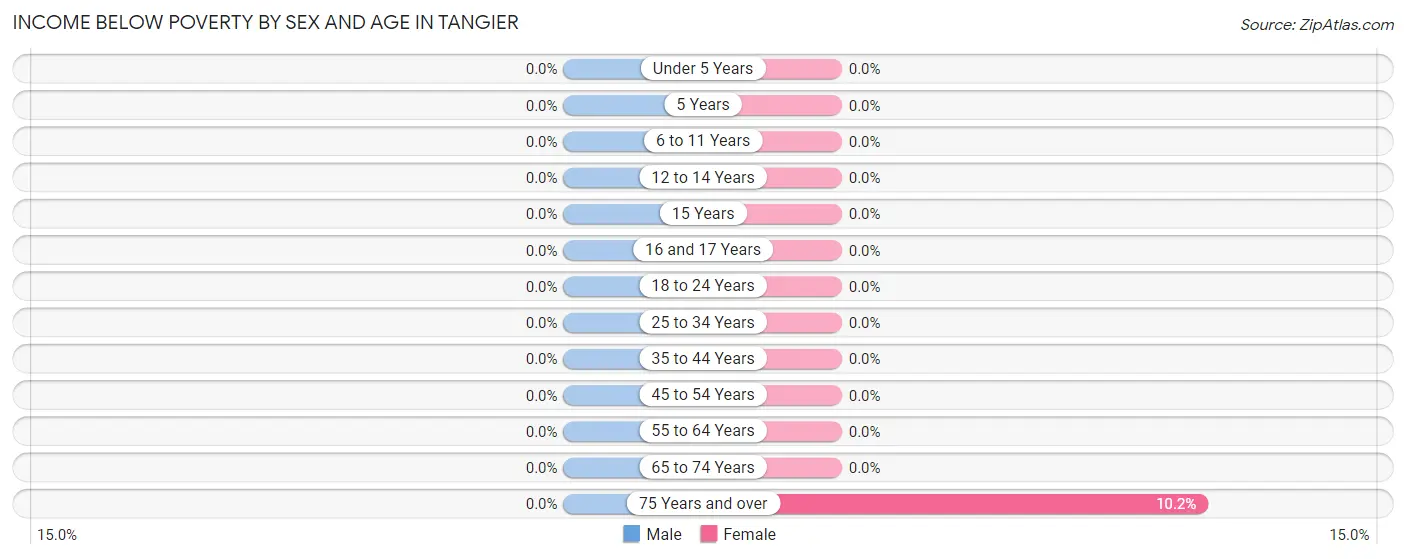
| Age Bracket | Male | Female |
| Under 5 Years | 0 (0.0%) | 0 (0.0%) |
| 5 Years | 0 (0.0%) | 0 (0.0%) |
| 6 to 11 Years | 0 (0.0%) | 0 (0.0%) |
| 12 to 14 Years | 0 (0.0%) | 0 (0.0%) |
| 15 Years | 0 (0.0%) | 0 (0.0%) |
| 16 and 17 Years | 0 (0.0%) | 0 (0.0%) |
| 18 to 24 Years | 0 (0.0%) | 0 (0.0%) |
| 25 to 34 Years | 0 (0.0%) | 0 (0.0%) |
| 35 to 44 Years | 0 (0.0%) | 0 (0.0%) |
| 45 to 54 Years | 0 (0.0%) | 0 (0.0%) |
| 55 to 64 Years | 0 (0.0%) | 0 (0.0%) |
| 65 to 74 Years | 0 (0.0%) | 0 (0.0%) |
| 75 Years and over | 0 (0.0%) | 5 (10.2%) |
| Total | 0 (0.0%) | 5 (2.7%) |
Income Above Poverty by Sex and Age in Tangier
According to the poverty statistics in Tangier, males aged 12 to 14 years and females aged 6 to 11 years are the age groups that are most secure financially, with 100.0% of males and 100.0% of females in these age groups living above the poverty line.
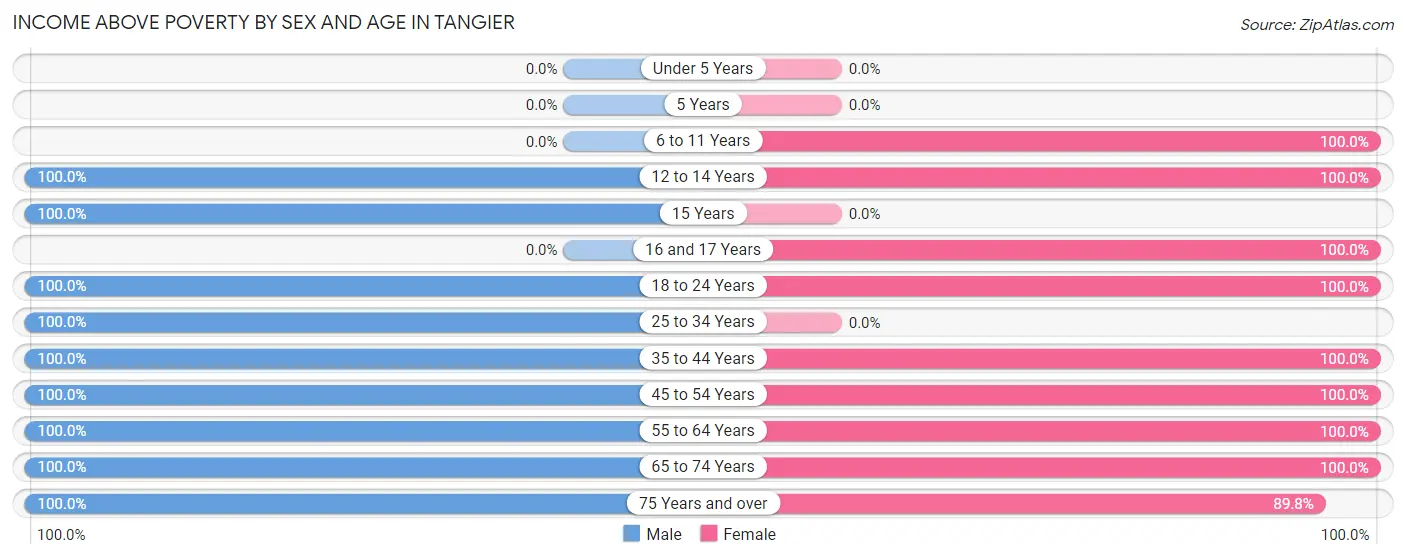
| Age Bracket | Male | Female |
| Under 5 Years | 0 (0.0%) | 0 (0.0%) |
| 5 Years | 0 (0.0%) | 0 (0.0%) |
| 6 to 11 Years | 0 (0.0%) | 6 (100.0%) |
| 12 to 14 Years | 10 (100.0%) | 5 (100.0%) |
| 15 Years | 6 (100.0%) | 0 (0.0%) |
| 16 and 17 Years | 0 (0.0%) | 4 (100.0%) |
| 18 to 24 Years | 16 (100.0%) | 9 (100.0%) |
| 25 to 34 Years | 5 (100.0%) | 0 (0.0%) |
| 35 to 44 Years | 15 (100.0%) | 20 (100.0%) |
| 45 to 54 Years | 30 (100.0%) | 19 (100.0%) |
| 55 to 64 Years | 45 (100.0%) | 54 (100.0%) |
| 65 to 74 Years | 26 (100.0%) | 17 (100.0%) |
| 75 Years and over | 9 (100.0%) | 44 (89.8%) |
| Total | 162 (100.0%) | 178 (97.3%) |
Income Below Poverty Among Married-Couple Families in Tangier
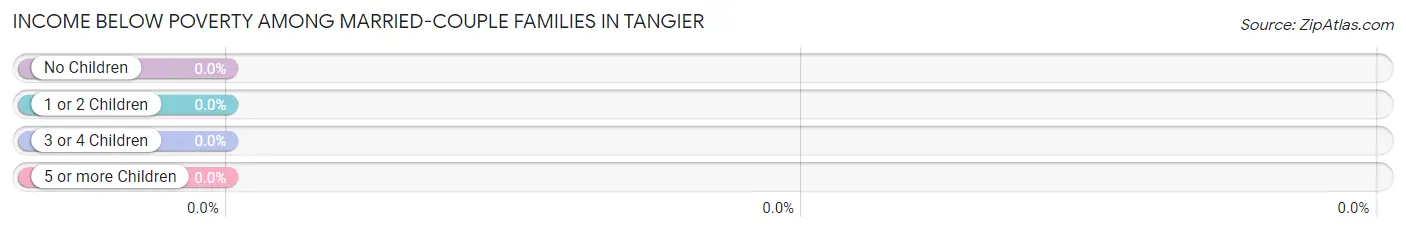
| Children | Above Poverty | Below Poverty |
| No Children | 84 (100.0%) | 0 (0.0%) |
| 1 or 2 Children | 20 (100.0%) | 0 (0.0%) |
| 3 or 4 Children | 0 (0.0%) | 0 (0.0%) |
| 5 or more Children | 0 (0.0%) | 0 (0.0%) |
| Total | 104 (100.0%) | 0 (0.0%) |
Income Below Poverty Among Single-Parent Households in Tangier
| Children | Single Father | Single Mother |
| No Children | 0 (0.0%) | 0 (0.0%) |
| 1 or 2 Children | 0 (0.0%) | 0 (0.0%) |
| 3 or 4 Children | 0 (0.0%) | 0 (0.0%) |
| 5 or more Children | 0 (0.0%) | 0 (0.0%) |
| Total | 0 (0.0%) | 0 (0.0%) |
Income Below Poverty Among Married-Couple vs Single-Parent Households in Tangier
| Children | Married-Couple Families | Single-Parent Households |
| No Children | 0 (0.0%) | 0 (0.0%) |
| 1 or 2 Children | 0 (0.0%) | 0 (0.0%) |
| 3 or 4 Children | 0 (0.0%) | 0 (0.0%) |
| 5 or more Children | 0 (0.0%) | 0 (0.0%) |
| Total | 0 (0.0%) | 0 (0.0%) |
Race in Tangier
The most populous races in Tangier are , and White / Caucasian (345 | 100.0%).
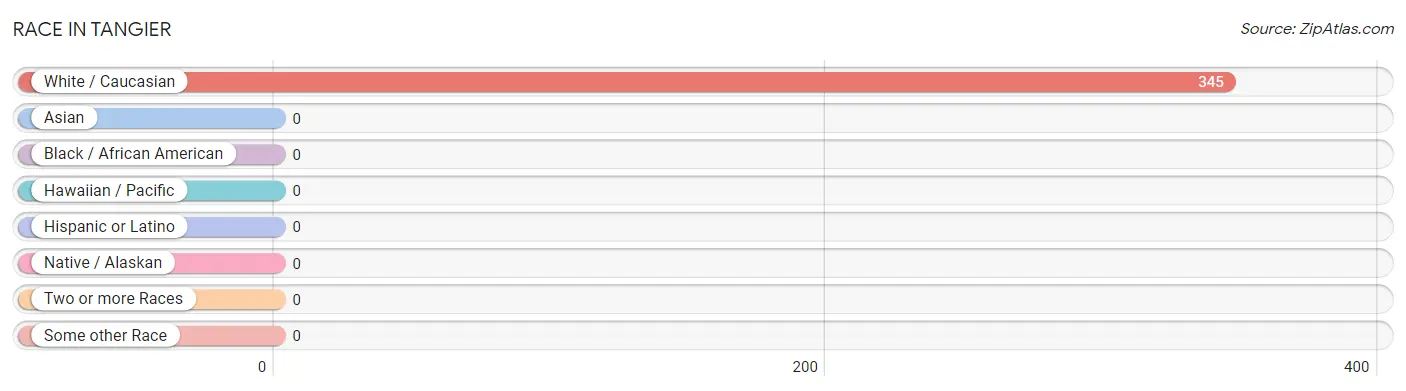
| Race | # Population | % Population |
| Asian | 0 | 0.0% |
| Black / African American | 0 | 0.0% |
| Hawaiian / Pacific | 0 | 0.0% |
| Hispanic or Latino | 0 | 0.0% |
| Native / Alaskan | 0 | 0.0% |
| White / Caucasian | 345 | 100.0% |
| Two or more Races | 0 | 0.0% |
| Some other Race | 0 | 0.0% |
| Total | 345 | 100.0% |
Ancestry in Tangier
The most populous ancestries reported in Tangier are American (295 | 85.5%), English (43 | 12.5%), Irish (7 | 2.0%), Italian (7 | 2.0%), and Canadian (5 | 1.5%), together accounting for 103.5% of all Tangier residents.
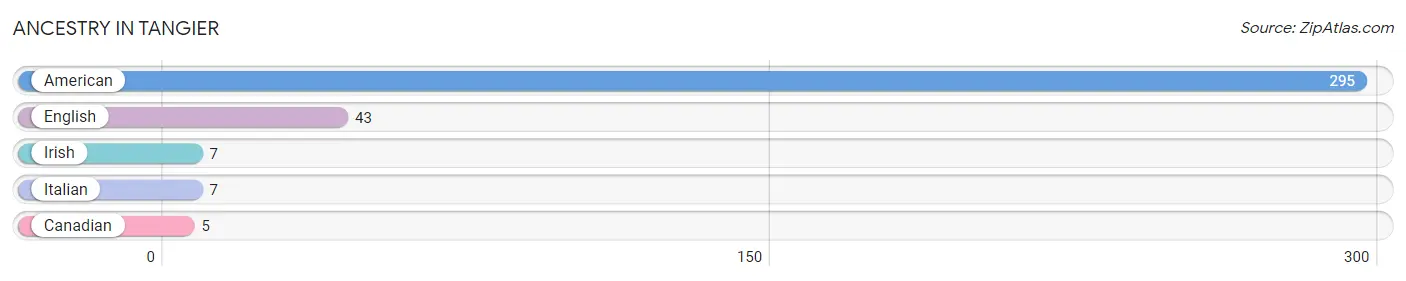
| Ancestry | # Population | % Population |
| American | 295 | 85.5% |
| Canadian | 5 | 1.5% |
| English | 43 | 12.5% |
| Irish | 7 | 2.0% |
| Italian | 7 | 2.0% | View All 5 Rows |
Immigrants in Tangier

| Immigration Origin | # Population | % Population | View All 0 Rows |
Sex and Age in Tangier
Sex and Age in Tangier
The most populous age groups in Tangier are 60 to 64 Years (33 | 20.4%) for men and 55 to 59 Years (41 | 22.4%) for women.
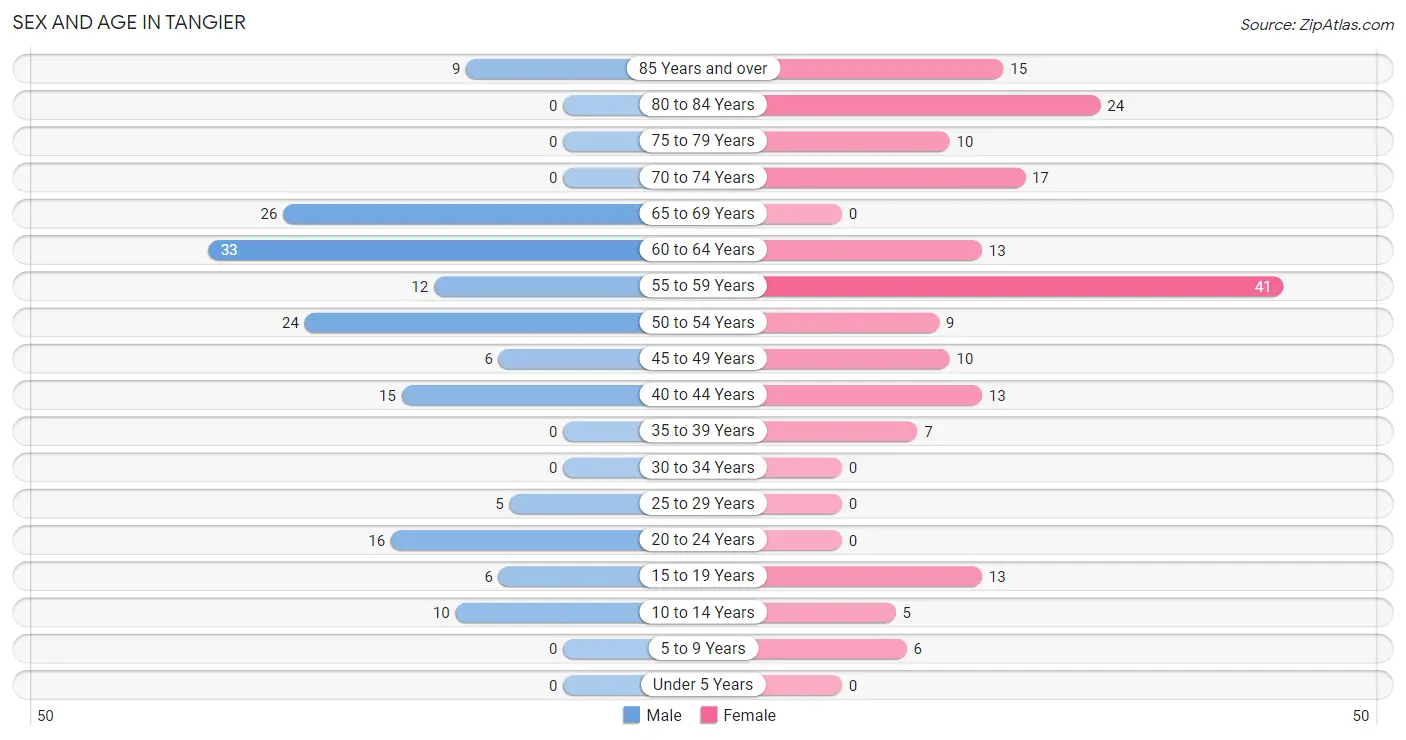
| Age Bracket | Male | Female |
| Under 5 Years | 0 (0.0%) | 0 (0.0%) |
| 5 to 9 Years | 0 (0.0%) | 6 (3.3%) |
| 10 to 14 Years | 10 (6.2%) | 5 (2.7%) |
| 15 to 19 Years | 6 (3.7%) | 13 (7.1%) |
| 20 to 24 Years | 16 (9.9%) | 0 (0.0%) |
| 25 to 29 Years | 5 (3.1%) | 0 (0.0%) |
| 30 to 34 Years | 0 (0.0%) | 0 (0.0%) |
| 35 to 39 Years | 0 (0.0%) | 7 (3.8%) |
| 40 to 44 Years | 15 (9.3%) | 13 (7.1%) |
| 45 to 49 Years | 6 (3.7%) | 10 (5.5%) |
| 50 to 54 Years | 24 (14.8%) | 9 (4.9%) |
| 55 to 59 Years | 12 (7.4%) | 41 (22.4%) |
| 60 to 64 Years | 33 (20.4%) | 13 (7.1%) |
| 65 to 69 Years | 26 (16.1%) | 0 (0.0%) |
| 70 to 74 Years | 0 (0.0%) | 17 (9.3%) |
| 75 to 79 Years | 0 (0.0%) | 10 (5.5%) |
| 80 to 84 Years | 0 (0.0%) | 24 (13.1%) |
| 85 Years and over | 9 (5.6%) | 15 (8.2%) |
| Total | 162 (100.0%) | 183 (100.0%) |
Families and Households in Tangier
Median Family Size in Tangier
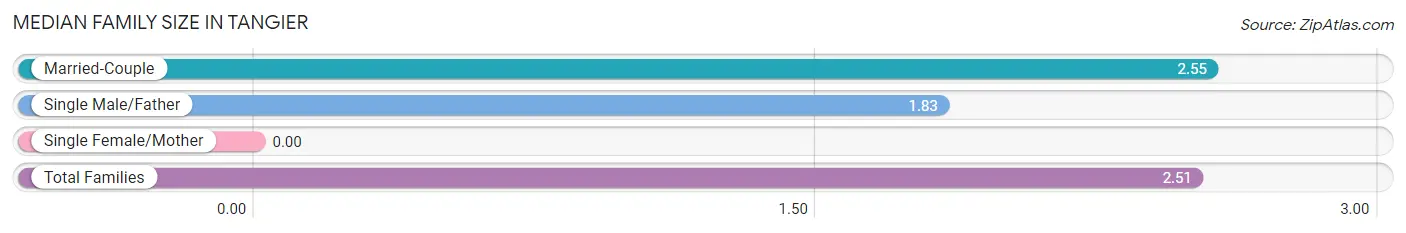
| Family Type | # Families | Family Size |
| Married-Couple | 104 (94.6%) | 2.55 |
| Single Male/Father | 6 (5.4%) | 1.83 |
| Single Female/Mother | 0 (0.0%) | - |
| Total Families | 110 (100.0%) | 2.51 |
Median Household Size in Tangier
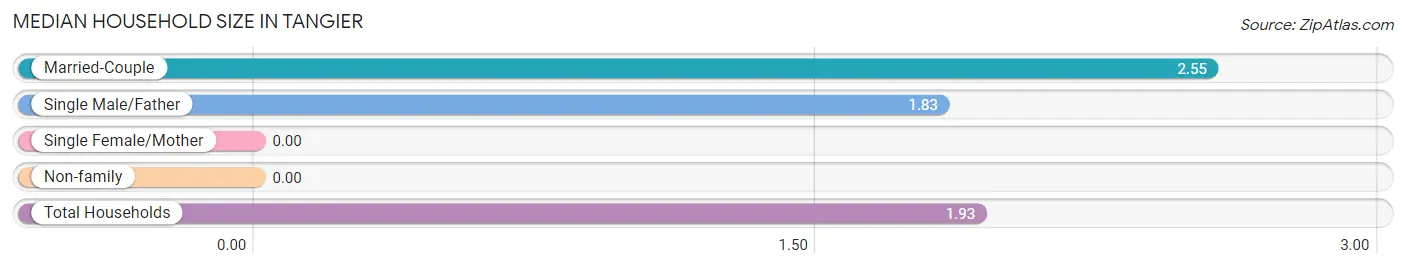
| Household Type | # Households | Household Size |
| Married-Couple | 104 (58.1%) | 2.55 |
| Single Male/Father | 6 (3.4%) | 1.83 |
| Single Female/Mother | 0 (0.0%) | - |
| Non-family | 69 (38.6%) | - |
| Total Households | 179 (100.0%) | 1.93 |
Household Size by Marriage Status in Tangier
Out of a total of 179 households in Tangier, 110 (61.5%) are family households, while 69 (38.6%) are nonfamily households. The most numerous type of family households are 2-person households, comprising 84, and the most common type of nonfamily households are 1-person households, comprising 69.
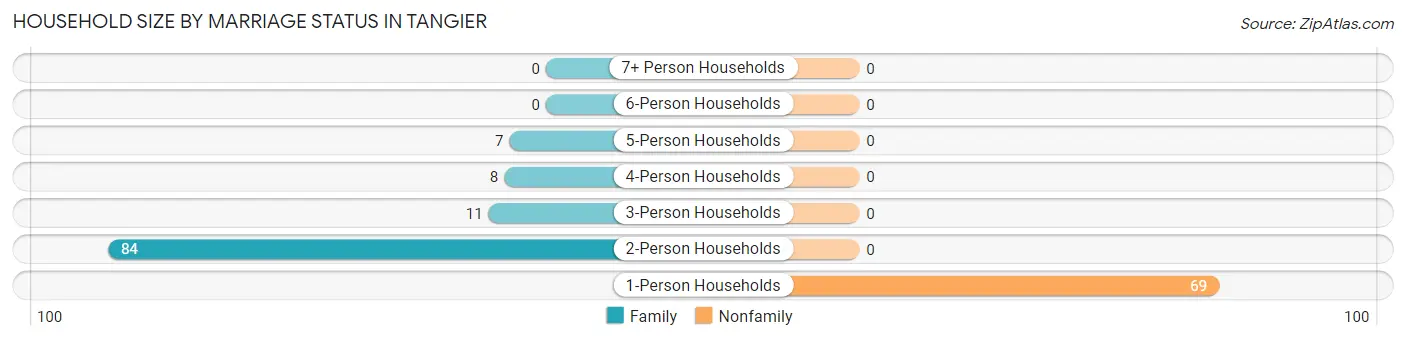
| Household Size | Family Households | Nonfamily Households |
| 1-Person Households | - | 69 (38.6%) |
| 2-Person Households | 84 (46.9%) | 0 (0.0%) |
| 3-Person Households | 11 (6.1%) | 0 (0.0%) |
| 4-Person Households | 8 (4.5%) | 0 (0.0%) |
| 5-Person Households | 7 (3.9%) | 0 (0.0%) |
| 6-Person Households | 0 (0.0%) | 0 (0.0%) |
| 7+ Person Households | 0 (0.0%) | 0 (0.0%) |
| Total | 110 (61.5%) | 69 (38.6%) |
Female Fertility in Tangier
Fertility by Age in Tangier
| Age Bracket | Women with Births | Births / 1,000 Women |
| 15 to 19 years | 0 (0.0%) | 0.0 |
| 20 to 34 years | 0 (0.0%) | 0.0 |
| 35 to 50 years | 0 (0.0%) | 0.0 |
| Total | 0 (0.0%) | 0.0 |
Fertility by Age by Marriage Status in Tangier
| Age Bracket | Married | Unmarried |
| 15 to 19 years | 0 (0.0%) | 0 (0.0%) |
| 20 to 34 years | 0 (0.0%) | 0 (0.0%) |
| 35 to 50 years | 0 (0.0%) | 0 (0.0%) |
| Total | 0 (0.0%) | 0 (0.0%) |
Fertility by Education in Tangier
| Educational Attainment | Women with Births | Births / 1,000 Women |
| Less than High School | 0 (0.0%) | 0.0 |
| High School Diploma | 0 (0.0%) | 0.0 |
| College or Associate's Degree | 0 (0.0%) | 0.0 |
| Bachelor's Degree | 0 (0.0%) | 0.0 |
| Graduate Degree | 0 (0.0%) | 0.0 |
| Total | 0 (0.0%) | 0.0 |
Fertility by Education by Marriage Status in Tangier
| Educational Attainment | Married | Unmarried |
| Less than High School | 0 (0.0%) | 0 (0.0%) |
| High School Diploma | 0 (0.0%) | 0 (0.0%) |
| College or Associate's Degree | 0 (0.0%) | 0 (0.0%) |
| Bachelor's Degree | 0 (0.0%) | 0 (0.0%) |
| Graduate Degree | 0 (0.0%) | 0 (0.0%) |
| Total | 0 (0.0%) | 0 (0.0%) |
Employment Characteristics in Tangier
Employment by Class of Employer in Tangier
Among the 186 employed individuals in Tangier, private company employees (68 | 36.6%), local government employees (67 | 36.0%), and unpaid family workers (16 | 8.6%) make up the most common classes of employment.
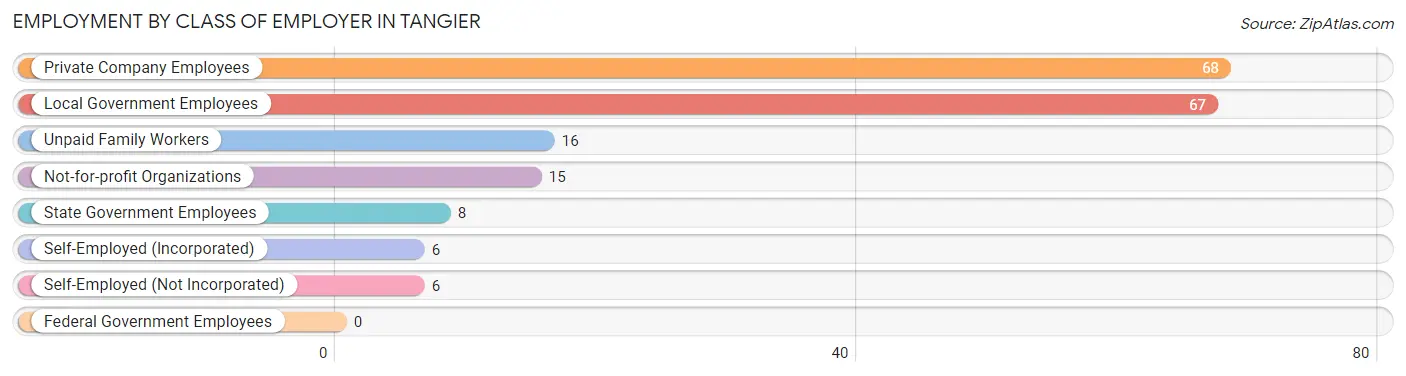
| Employer Class | # Employees | % Employees |
| Private Company Employees | 68 | 36.6% |
| Self-Employed (Incorporated) | 6 | 3.2% |
| Self-Employed (Not Incorporated) | 6 | 3.2% |
| Not-for-profit Organizations | 15 | 8.1% |
| Local Government Employees | 67 | 36.0% |
| State Government Employees | 8 | 4.3% |
| Federal Government Employees | 0 | 0.0% |
| Unpaid Family Workers | 16 | 8.6% |
| Total | 186 | 100.0% |
Employment Status by Age in Tangier
According to the labor force statistics for Tangier, out of the total population over 16 years of age (318), 61.9% or 197 individuals are in the labor force, with 5.6% or 11 of them unemployed. The age group with the highest labor force participation rate is 20 to 24 years, with 100.0% or 16 individuals in the labor force. Within the labor force, the 65 to 74 years age range has the highest percentage of unemployed individuals, with 14.3% or 5 of them being unemployed.
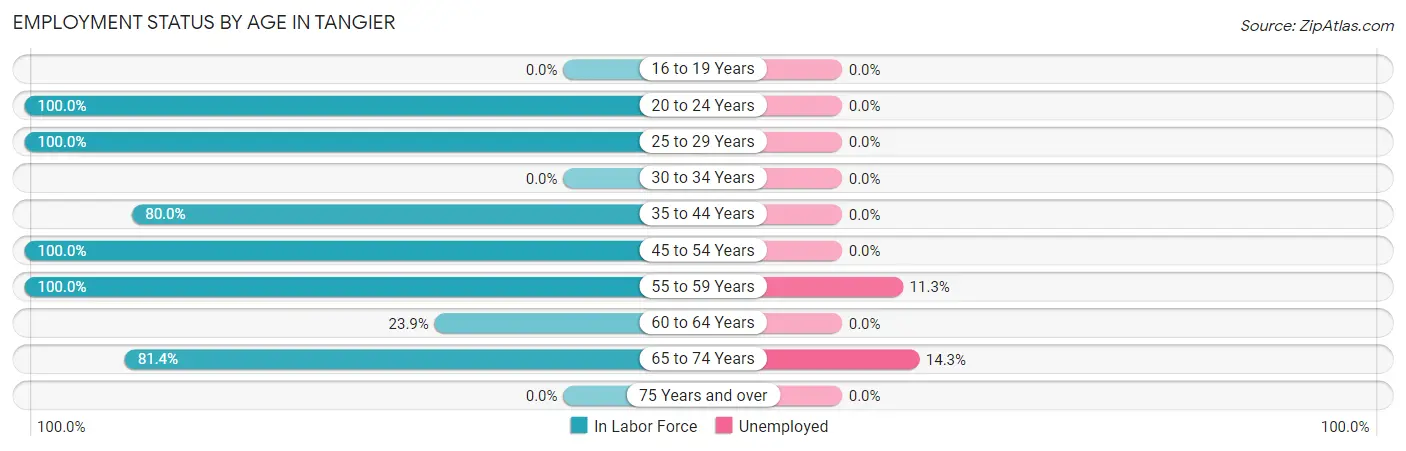
| Age Bracket | In Labor Force | Unemployed |
| 16 to 19 Years | 0 (0.0%) | 0 (0.0%) |
| 20 to 24 Years | 16 (100.0%) | 0 (0.0%) |
| 25 to 29 Years | 5 (100.0%) | 0 (0.0%) |
| 30 to 34 Years | 0 (0.0%) | 0 (0.0%) |
| 35 to 44 Years | 28 (80.0%) | 0 (0.0%) |
| 45 to 54 Years | 49 (100.0%) | 0 (0.0%) |
| 55 to 59 Years | 53 (100.0%) | 6 (11.3%) |
| 60 to 64 Years | 11 (23.9%) | 0 (0.0%) |
| 65 to 74 Years | 35 (81.4%) | 5 (14.3%) |
| 75 Years and over | 0 (0.0%) | 0 (0.0%) |
| Total | 197 (61.9%) | 11 (5.6%) |
Employment Status by Educational Attainment in Tangier
According to labor force statistics for Tangier, 77.7% of individuals (146) out of the total population between 25 and 64 years of age (188) are in the labor force, with 4.1% or 6 of them being unemployed. The group with the highest labor force participation rate are those with the educational attainment of college / associate degree, with 100.0% or 17 individuals in the labor force. Within the labor force, individuals with less than high school education have the highest percentage of unemployment, with 22.2% or 6 of them being unemployed.
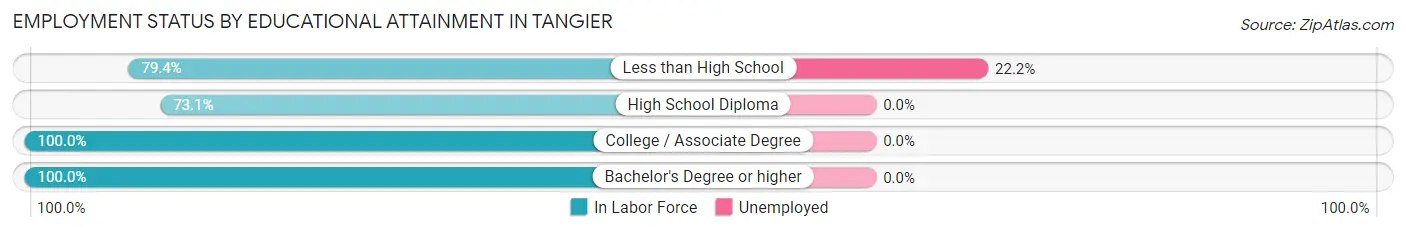
| Educational Attainment | In Labor Force | Unemployed |
| Less than High School | 27 (79.4%) | 8 (22.2%) |
| High School Diploma | 95 (73.1%) | 0 (0.0%) |
| College / Associate Degree | 17 (100.0%) | 0 (0.0%) |
| Bachelor's Degree or higher | 7 (100.0%) | 0 (0.0%) |
| Total | 146 (77.7%) | 8 (4.1%) |
Employment Occupations by Sex in Tangier
Management, Business, Science and Arts Occupations
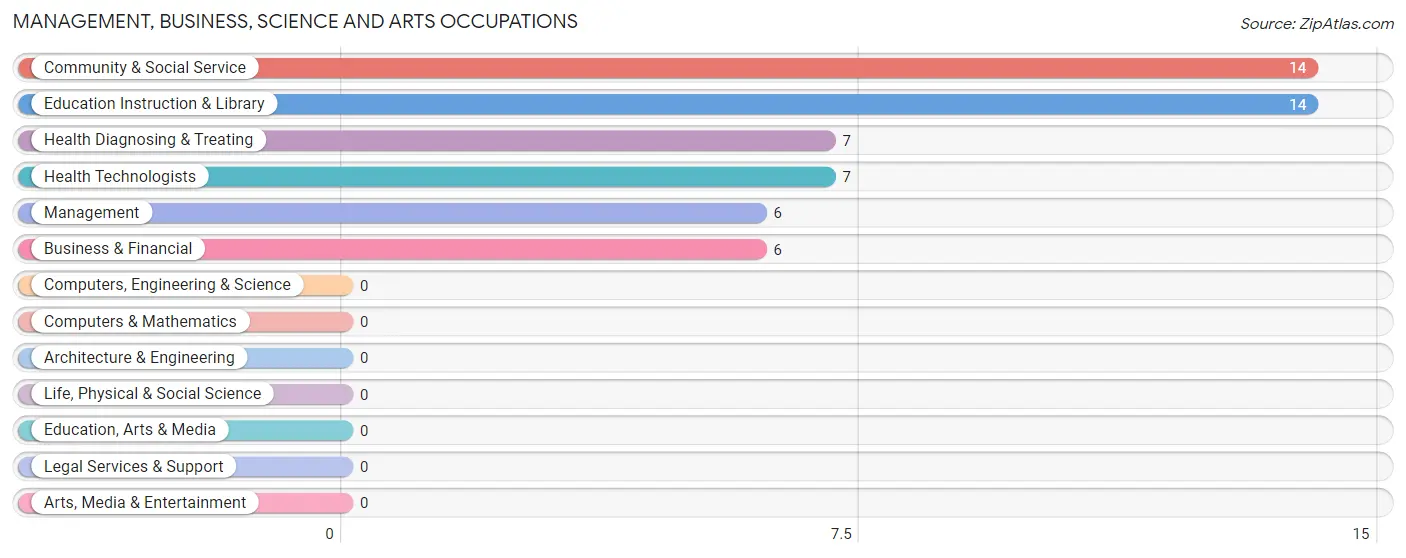
The most common Management, Business, Science and Arts occupations in Tangier are Community & Social Service (14 | 7.5%), Education Instruction & Library (14 | 7.5%), Health Diagnosing & Treating (7 | 3.8%), Health Technologists (7 | 3.8%), and Management (6 | 3.2%).
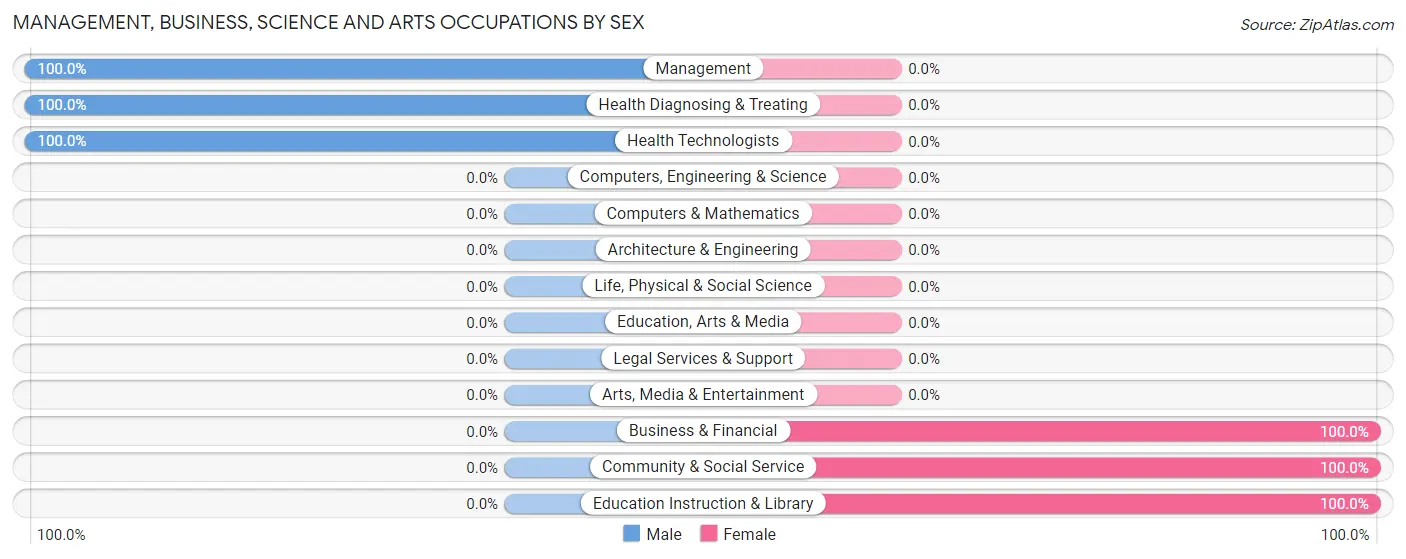
Management, Business, Science and Arts Occupations by Sex
Within the Management, Business, Science and Arts occupations in Tangier, the most male-oriented occupations are Management (100.0%), Health Diagnosing & Treating (100.0%), and Health Technologists (100.0%), while the most female-oriented occupations are Business & Financial (100.0%), Community & Social Service (100.0%), and Education Instruction & Library (100.0%).
| Occupation | Male | Female |
| Management | 6 (100.0%) | 0 (0.0%) |
| Business & Financial | 0 (0.0%) | 6 (100.0%) |
| Computers, Engineering & Science | 0 (0.0%) | 0 (0.0%) |
| Computers & Mathematics | 0 (0.0%) | 0 (0.0%) |
| Architecture & Engineering | 0 (0.0%) | 0 (0.0%) |
| Life, Physical & Social Science | 0 (0.0%) | 0 (0.0%) |
| Community & Social Service | 0 (0.0%) | 14 (100.0%) |
| Education, Arts & Media | 0 (0.0%) | 0 (0.0%) |
| Legal Services & Support | 0 (0.0%) | 0 (0.0%) |
| Education Instruction & Library | 0 (0.0%) | 14 (100.0%) |
| Arts, Media & Entertainment | 0 (0.0%) | 0 (0.0%) |
| Health Diagnosing & Treating | 7 (100.0%) | 0 (0.0%) |
| Health Technologists | 7 (100.0%) | 0 (0.0%) |
| Total (Category) | 13 (39.4%) | 20 (60.6%) |
| Total (Overall) | 89 (47.8%) | 97 (52.1%) |
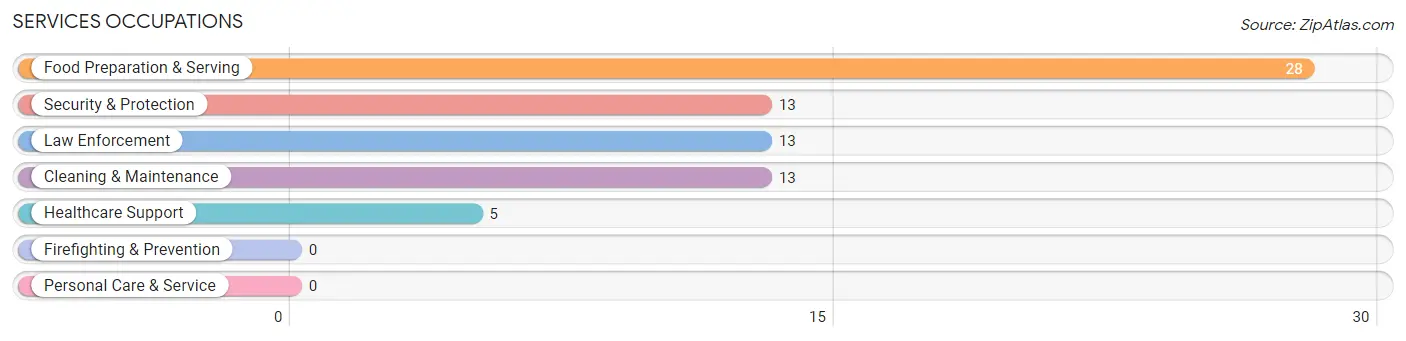
Services Occupations
The most common Services occupations in Tangier are Food Preparation & Serving (28 | 15.0%), Security & Protection (13 | 7.0%), Law Enforcement (13 | 7.0%), Cleaning & Maintenance (13 | 7.0%), and Healthcare Support (5 | 2.7%).
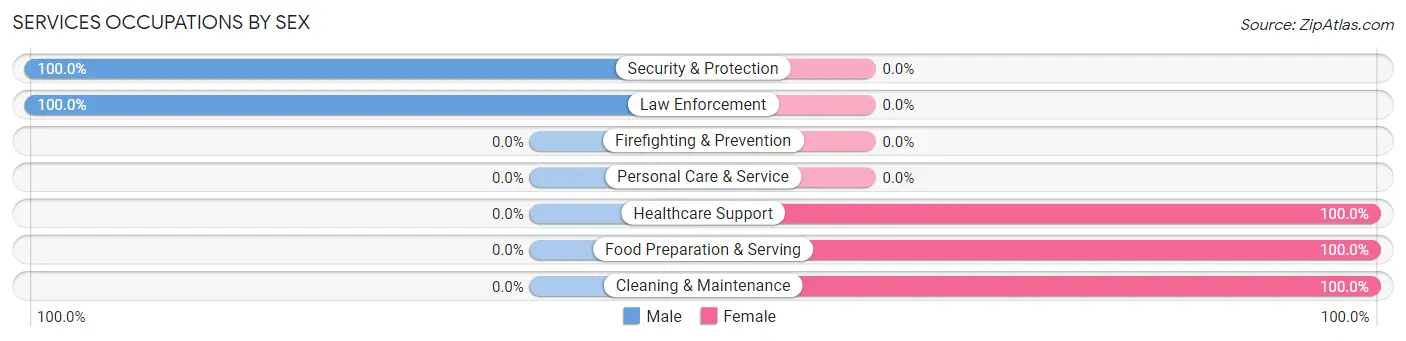
Services Occupations by Sex
Within the Services occupations in Tangier, the most male-oriented occupations are Security & Protection (100.0%), and Law Enforcement (100.0%), while the most female-oriented occupations are Healthcare Support (100.0%), Food Preparation & Serving (100.0%), and Cleaning & Maintenance (100.0%).
| Occupation | Male | Female |
| Healthcare Support | 0 (0.0%) | 5 (100.0%) |
| Security & Protection | 13 (100.0%) | 0 (0.0%) |
| Firefighting & Prevention | 0 (0.0%) | 0 (0.0%) |
| Law Enforcement | 13 (100.0%) | 0 (0.0%) |
| Food Preparation & Serving | 0 (0.0%) | 28 (100.0%) |
| Cleaning & Maintenance | 0 (0.0%) | 13 (100.0%) |
| Personal Care & Service | 0 (0.0%) | 0 (0.0%) |
| Total (Category) | 13 (22.0%) | 46 (78.0%) |
| Total (Overall) | 89 (47.8%) | 97 (52.1%) |
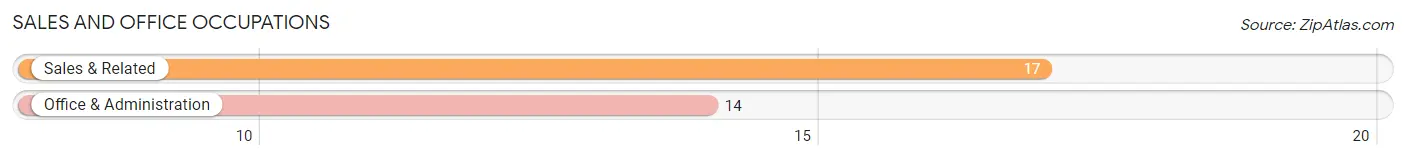
Sales and Office Occupations
The most common Sales and Office occupations in Tangier are Sales & Related (17 | 9.1%), and Office & Administration (14 | 7.5%).
Sales and Office Occupations by Sex
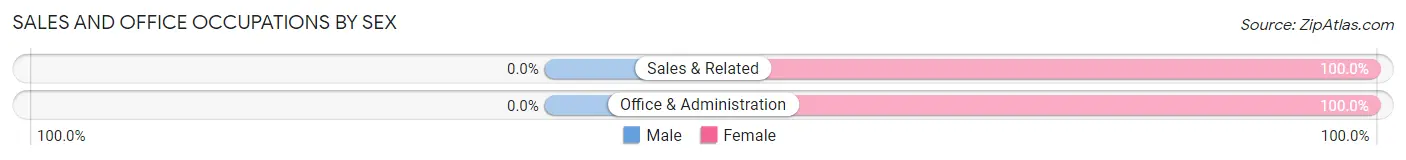
| Occupation | Male | Female |
| Sales & Related | 0 (0.0%) | 17 (100.0%) |
| Office & Administration | 0 (0.0%) | 14 (100.0%) |
| Total (Category) | 0 (0.0%) | 31 (100.0%) |
| Total (Overall) | 89 (47.8%) | 97 (52.1%) |
Natural Resources, Construction and Maintenance Occupations
The most common Natural Resources, Construction and Maintenance occupations in Tangier are Farming, Fishing & Forestry (27 | 14.5%), and Installation, Maintenance & Repair (8 | 4.3%).
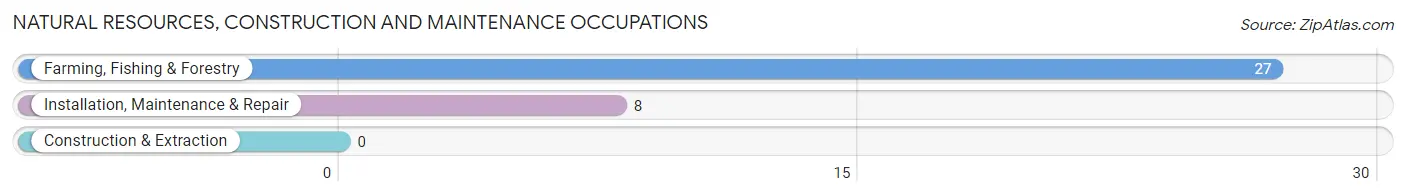
Natural Resources, Construction and Maintenance Occupations by Sex
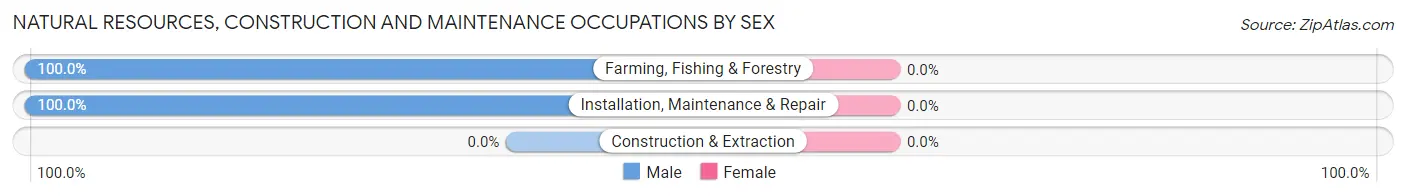
| Occupation | Male | Female |
| Farming, Fishing & Forestry | 27 (100.0%) | 0 (0.0%) |
| Construction & Extraction | 0 (0.0%) | 0 (0.0%) |
| Installation, Maintenance & Repair | 8 (100.0%) | 0 (0.0%) |
| Total (Category) | 35 (100.0%) | 0 (0.0%) |
| Total (Overall) | 89 (47.8%) | 97 (52.1%) |
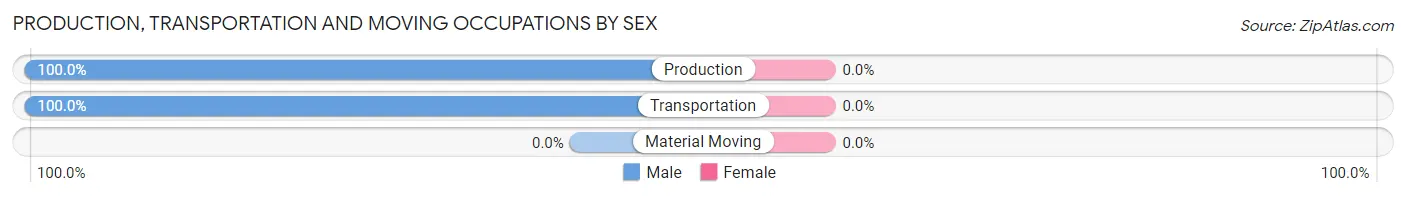
Production, Transportation and Moving Occupations
The most common Production, Transportation and Moving occupations in Tangier are Transportation (20 | 10.7%), and Production (8 | 4.3%).
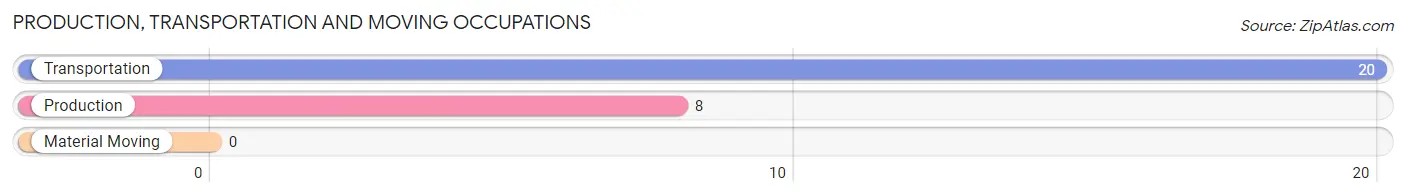
Production, Transportation and Moving Occupations by Sex
| Occupation | Male | Female |
| Production | 8 (100.0%) | 0 (0.0%) |
| Transportation | 20 (100.0%) | 0 (0.0%) |
| Material Moving | 0 (0.0%) | 0 (0.0%) |
| Total (Category) | 28 (100.0%) | 0 (0.0%) |
| Total (Overall) | 89 (47.8%) | 97 (52.1%) |
Employment Industries by Sex in Tangier
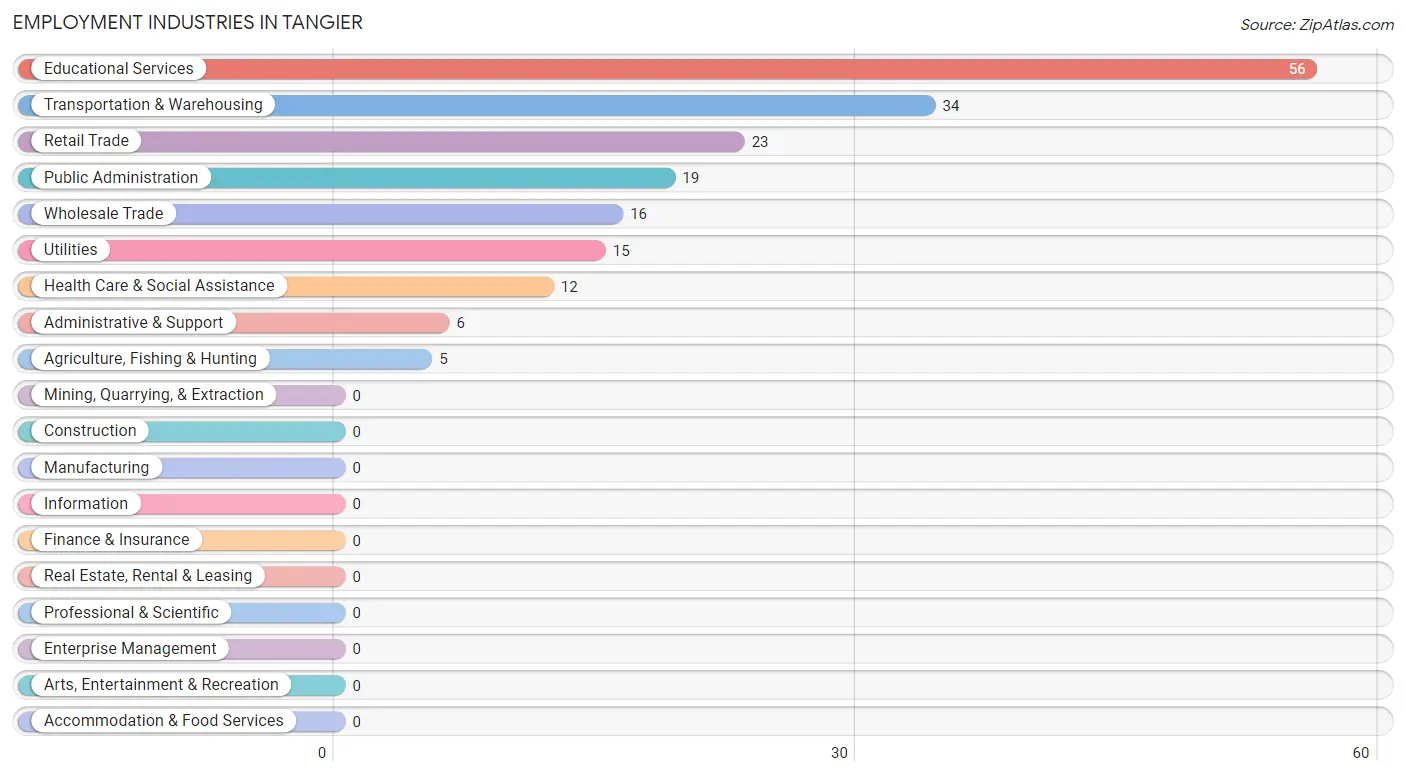
Employment Industries in Tangier
The major employment industries in Tangier include Educational Services (56 | 30.1%), Transportation & Warehousing (34 | 18.3%), Retail Trade (23 | 12.4%), Public Administration (19 | 10.2%), and Wholesale Trade (16 | 8.6%).
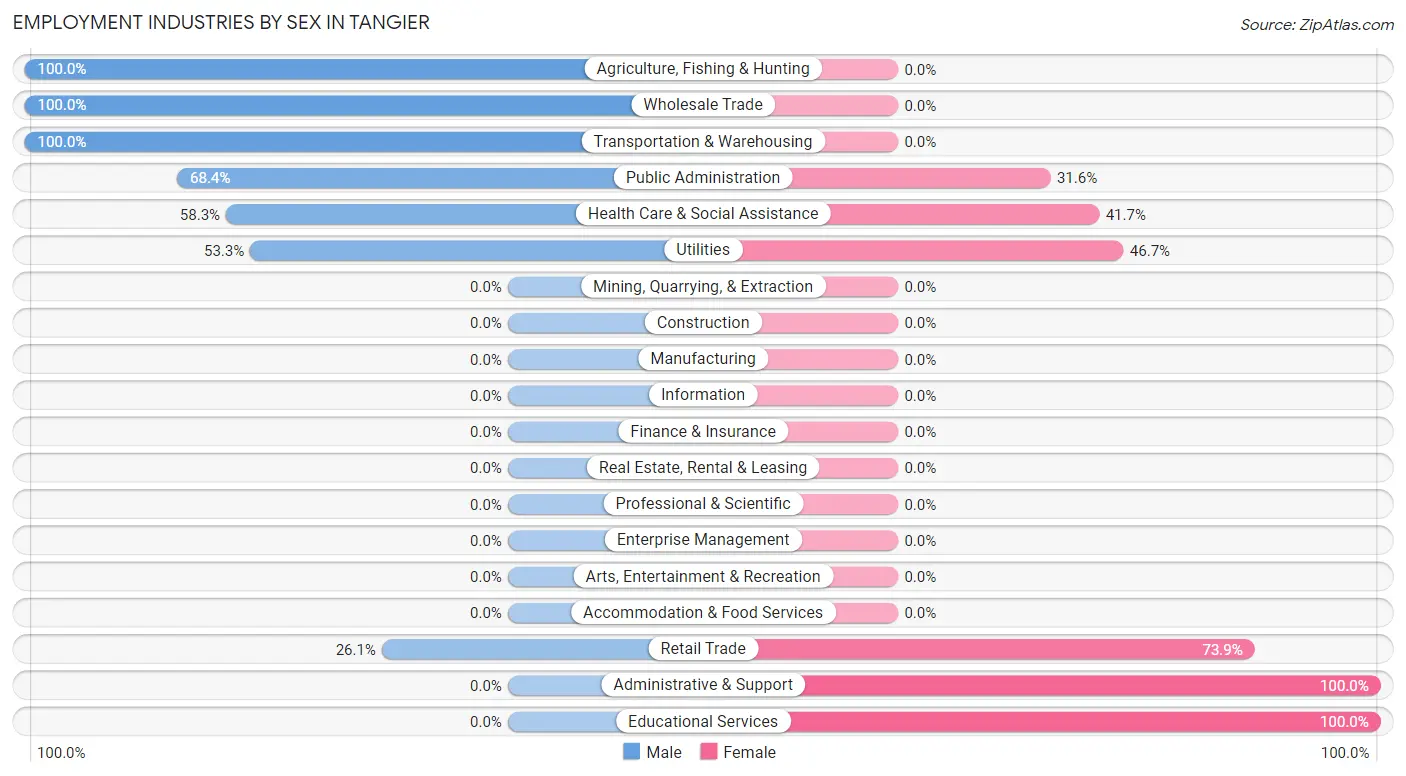
Employment Industries by Sex in Tangier
The Tangier industries that see more men than women are Agriculture, Fishing & Hunting (100.0%), Wholesale Trade (100.0%), and Transportation & Warehousing (100.0%), whereas the industries that tend to have a higher number of women are Administrative & Support (100.0%), Educational Services (100.0%), and Retail Trade (73.9%).
| Industry | Male | Female |
| Agriculture, Fishing & Hunting | 5 (100.0%) | 0 (0.0%) |
| Mining, Quarrying, & Extraction | 0 (0.0%) | 0 (0.0%) |
| Construction | 0 (0.0%) | 0 (0.0%) |
| Manufacturing | 0 (0.0%) | 0 (0.0%) |
| Wholesale Trade | 16 (100.0%) | 0 (0.0%) |
| Retail Trade | 6 (26.1%) | 17 (73.9%) |
| Transportation & Warehousing | 34 (100.0%) | 0 (0.0%) |
| Utilities | 8 (53.3%) | 7 (46.7%) |
| Information | 0 (0.0%) | 0 (0.0%) |
| Finance & Insurance | 0 (0.0%) | 0 (0.0%) |
| Real Estate, Rental & Leasing | 0 (0.0%) | 0 (0.0%) |
| Professional & Scientific | 0 (0.0%) | 0 (0.0%) |
| Enterprise Management | 0 (0.0%) | 0 (0.0%) |
| Administrative & Support | 0 (0.0%) | 6 (100.0%) |
| Educational Services | 0 (0.0%) | 56 (100.0%) |
| Health Care & Social Assistance | 7 (58.3%) | 5 (41.7%) |
| Arts, Entertainment & Recreation | 0 (0.0%) | 0 (0.0%) |
| Accommodation & Food Services | 0 (0.0%) | 0 (0.0%) |
| Public Administration | 13 (68.4%) | 6 (31.6%) |
| Total | 89 (47.8%) | 97 (52.1%) |
Education in Tangier
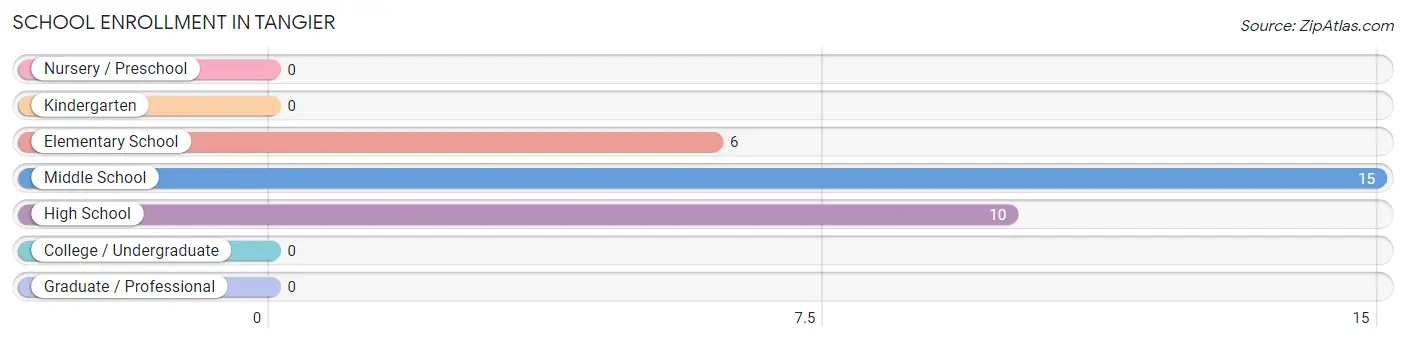
School Enrollment in Tangier
The most common levels of schooling among the 31 students in Tangier are middle school (15 | 48.4%), high school (10 | 32.3%), and elementary school (6 | 19.4%).
| School Level | # Students | % Students |
| Nursery / Preschool | 0 | 0.0% |
| Kindergarten | 0 | 0.0% |
| Elementary School | 6 | 19.4% |
| Middle School | 15 | 48.4% |
| High School | 10 | 32.3% |
| College / Undergraduate | 0 | 0.0% |
| Graduate / Professional | 0 | 0.0% |
| Total | 31 | 100.0% |
School Enrollment by Age by Funding Source in Tangier
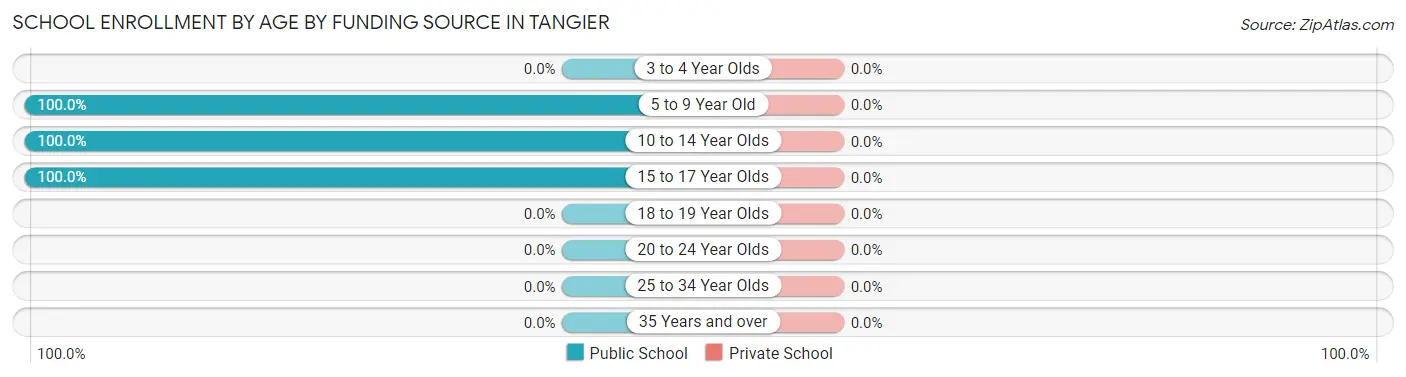
| Age Bracket | Public School | Private School |
| 3 to 4 Year Olds | 0 (0.0%) | 0 (0.0%) |
| 5 to 9 Year Old | 6 (100.0%) | 0 (0.0%) |
| 10 to 14 Year Olds | 15 (100.0%) | 0 (0.0%) |
| 15 to 17 Year Olds | 10 (100.0%) | 0 (0.0%) |
| 18 to 19 Year Olds | 0 (0.0%) | 0 (0.0%) |
| 20 to 24 Year Olds | 0 (0.0%) | 0 (0.0%) |
| 25 to 34 Year Olds | 0 (0.0%) | 0 (0.0%) |
| 35 Years and over | 0 (0.0%) | 0 (0.0%) |
| Total | 31 (100.0%) | 0 (0.0%) |
Educational Attainment by Field of Study in Tangier
Computers & mathematics (7 | 50.0%), and psychology (7 | 50.0%) are the most common fields of study among 14 individuals in Tangier who have obtained a bachelor's degree or higher.
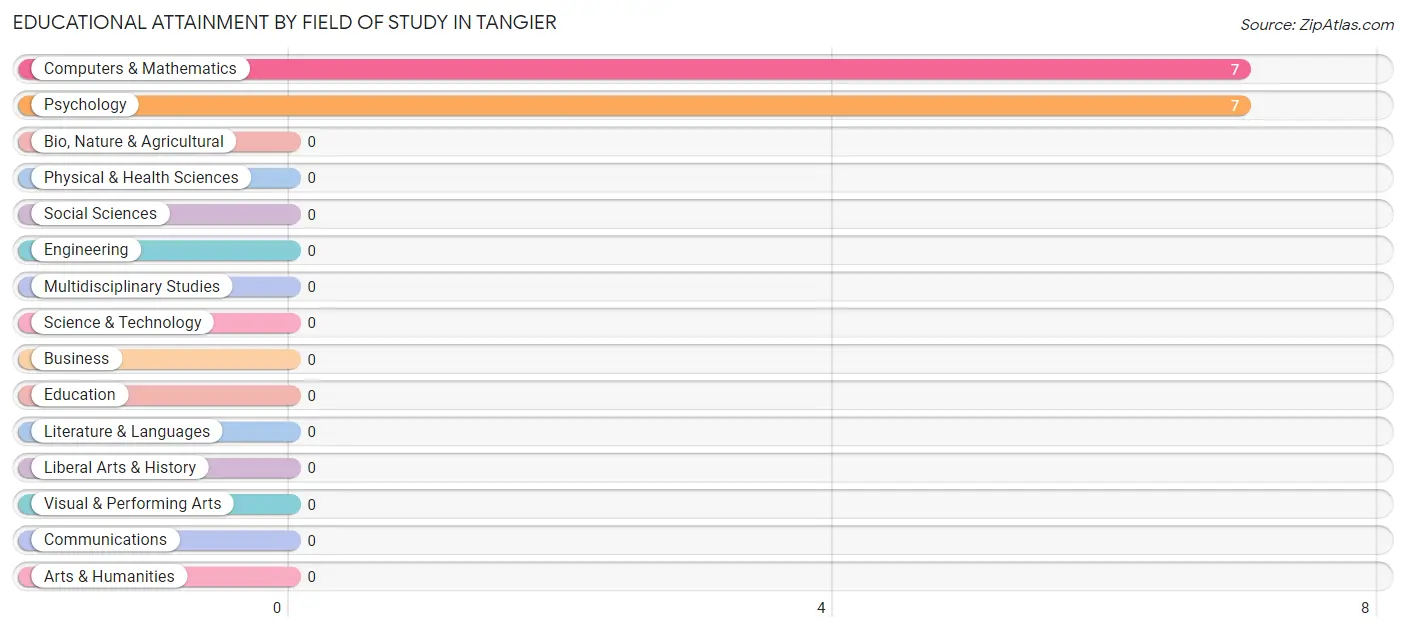
| Field of Study | # Graduates | % Graduates |
| Computers & Mathematics | 7 | 50.0% |
| Bio, Nature & Agricultural | 0 | 0.0% |
| Physical & Health Sciences | 0 | 0.0% |
| Psychology | 7 | 50.0% |
| Social Sciences | 0 | 0.0% |
| Engineering | 0 | 0.0% |
| Multidisciplinary Studies | 0 | 0.0% |
| Science & Technology | 0 | 0.0% |
| Business | 0 | 0.0% |
| Education | 0 | 0.0% |
| Literature & Languages | 0 | 0.0% |
| Liberal Arts & History | 0 | 0.0% |
| Visual & Performing Arts | 0 | 0.0% |
| Communications | 0 | 0.0% |
| Arts & Humanities | 0 | 0.0% |
| Total | 14 | 100.0% |
Transportation & Commute in Tangier
Vehicle Availability by Sex in Tangier
The most prevalent vehicle ownership categories in Tangier are males with no vehicle (48, accounting for 53.9%) and females with no vehicle (42, making up 49.5%).
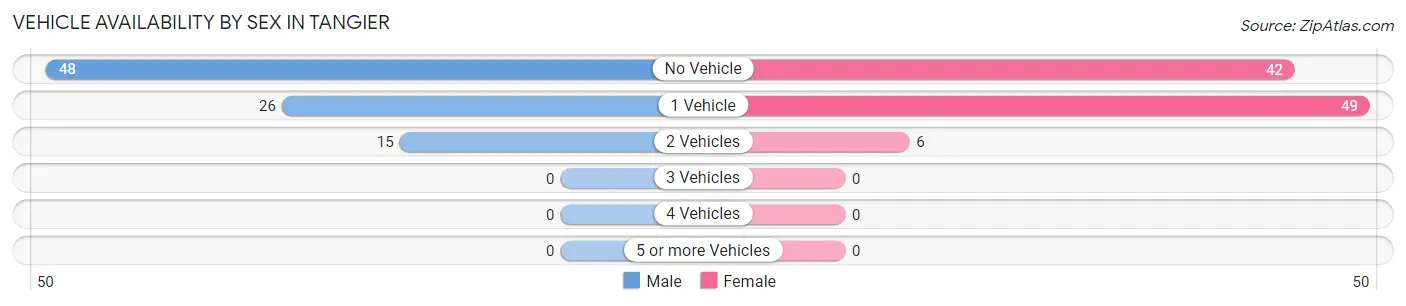
| Vehicles Available | Male | Female |
| No Vehicle | 48 (53.9%) | 42 (43.3%) |
| 1 Vehicle | 26 (29.2%) | 49 (50.5%) |
| 2 Vehicles | 15 (16.9%) | 6 (6.2%) |
| 3 Vehicles | 0 (0.0%) | 0 (0.0%) |
| 4 Vehicles | 0 (0.0%) | 0 (0.0%) |
| 5 or more Vehicles | 0 (0.0%) | 0 (0.0%) |
| Total | 89 (100.0%) | 97 (100.0%) |
Commute Time in Tangier
The most frequently occuring commute durations in Tangier are 5 to 9 minutes (115 commuters, 61.8%), 10 to 14 minutes (37 commuters, 19.9%), and less than 5 minutes (14 commuters, 7.5%).
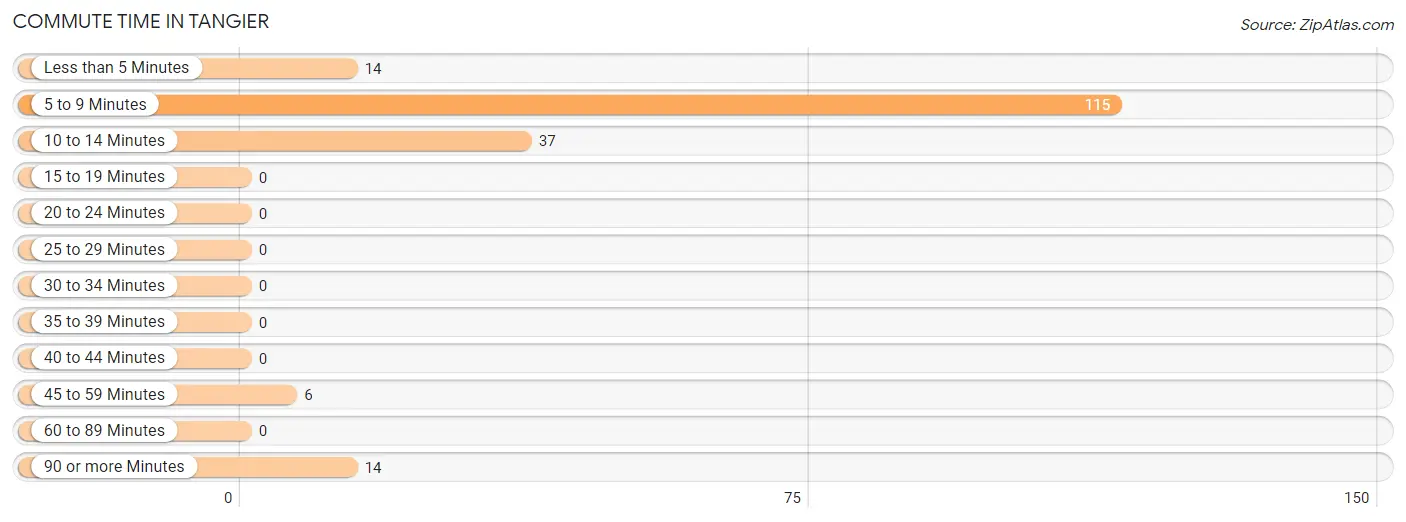
| Commute Time | # Commuters | % Commuters |
| Less than 5 Minutes | 14 | 7.5% |
| 5 to 9 Minutes | 115 | 61.8% |
| 10 to 14 Minutes | 37 | 19.9% |
| 15 to 19 Minutes | 0 | 0.0% |
| 20 to 24 Minutes | 0 | 0.0% |
| 25 to 29 Minutes | 0 | 0.0% |
| 30 to 34 Minutes | 0 | 0.0% |
| 35 to 39 Minutes | 0 | 0.0% |
| 40 to 44 Minutes | 0 | 0.0% |
| 45 to 59 Minutes | 6 | 3.2% |
| 60 to 89 Minutes | 0 | 0.0% |
| 90 or more Minutes | 14 | 7.5% |
Commute Time by Sex in Tangier
The most common commute times in Tangier are 5 to 9 minutes (49 commuters, 55.1%) for males and 5 to 9 minutes (66 commuters, 68.0%) for females.
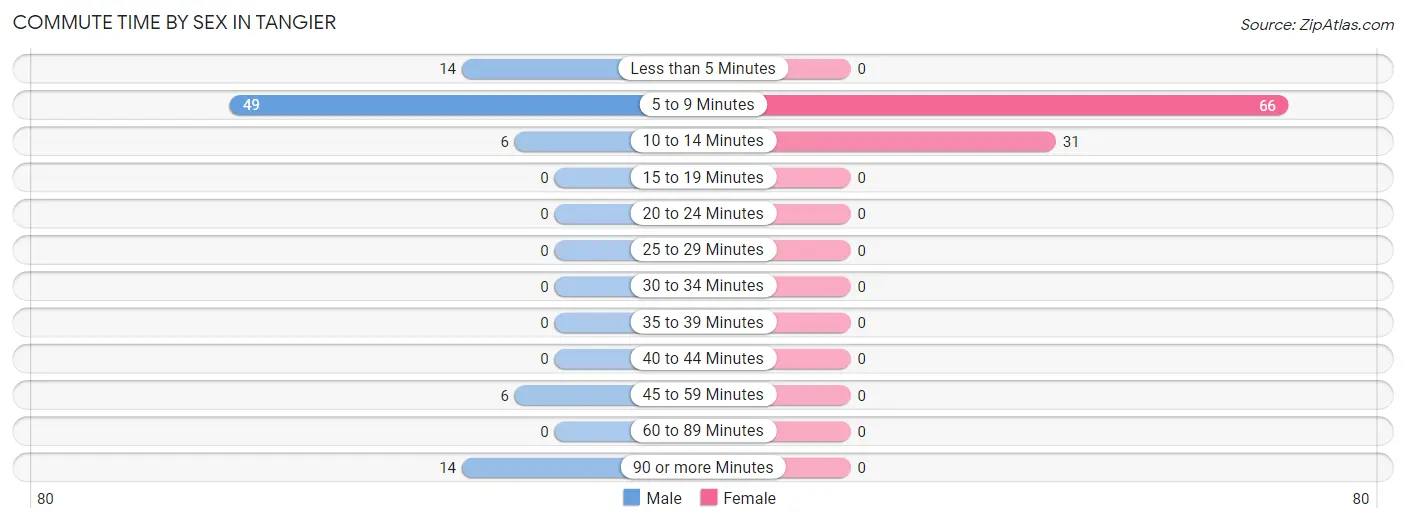
| Commute Time | Male | Female |
| Less than 5 Minutes | 14 (15.7%) | 0 (0.0%) |
| 5 to 9 Minutes | 49 (55.1%) | 66 (68.0%) |
| 10 to 14 Minutes | 6 (6.7%) | 31 (32.0%) |
| 15 to 19 Minutes | 0 (0.0%) | 0 (0.0%) |
| 20 to 24 Minutes | 0 (0.0%) | 0 (0.0%) |
| 25 to 29 Minutes | 0 (0.0%) | 0 (0.0%) |
| 30 to 34 Minutes | 0 (0.0%) | 0 (0.0%) |
| 35 to 39 Minutes | 0 (0.0%) | 0 (0.0%) |
| 40 to 44 Minutes | 0 (0.0%) | 0 (0.0%) |
| 45 to 59 Minutes | 6 (6.7%) | 0 (0.0%) |
| 60 to 89 Minutes | 0 (0.0%) | 0 (0.0%) |
| 90 or more Minutes | 14 (15.7%) | 0 (0.0%) |
Time of Departure to Work by Sex in Tangier
The most frequent times of departure to work in Tangier are 8:00 AM to 8:29 AM (33, 37.1%) for males and 9:00 AM to 9:59 AM (30, 30.9%) for females.
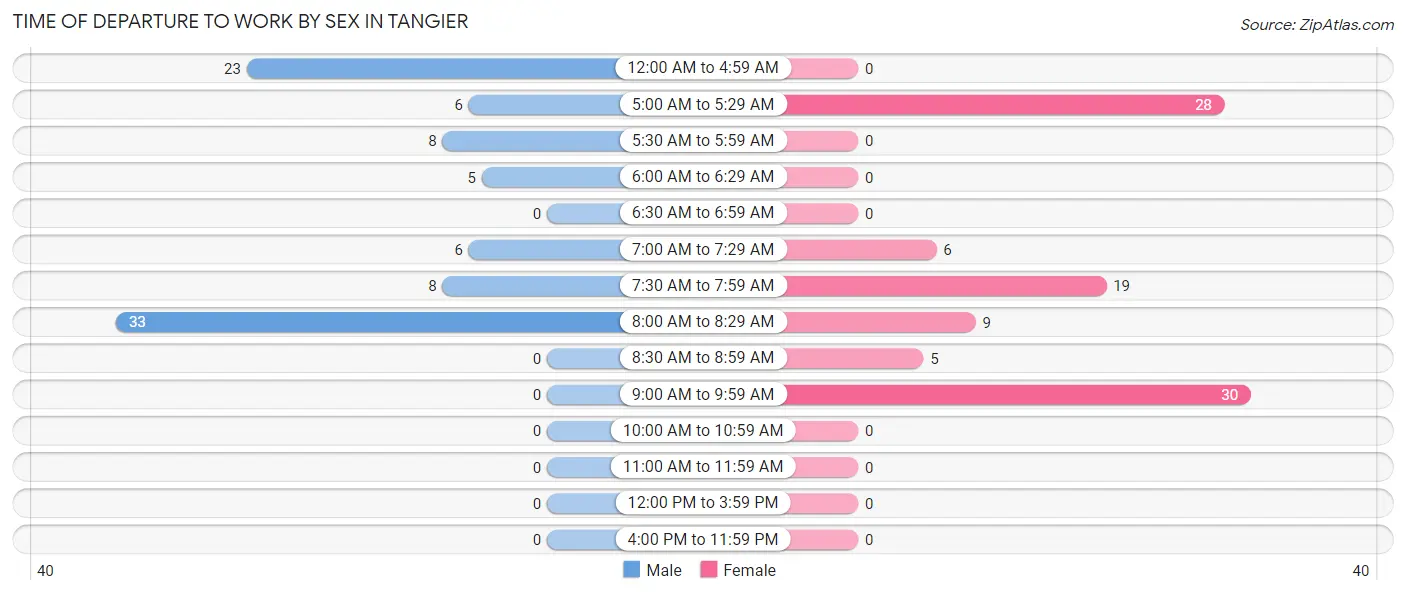
| Time of Departure | Male | Female |
| 12:00 AM to 4:59 AM | 23 (25.8%) | 0 (0.0%) |
| 5:00 AM to 5:29 AM | 6 (6.7%) | 28 (28.9%) |
| 5:30 AM to 5:59 AM | 8 (9.0%) | 0 (0.0%) |
| 6:00 AM to 6:29 AM | 5 (5.6%) | 0 (0.0%) |
| 6:30 AM to 6:59 AM | 0 (0.0%) | 0 (0.0%) |
| 7:00 AM to 7:29 AM | 6 (6.7%) | 6 (6.2%) |
| 7:30 AM to 7:59 AM | 8 (9.0%) | 19 (19.6%) |
| 8:00 AM to 8:29 AM | 33 (37.1%) | 9 (9.3%) |
| 8:30 AM to 8:59 AM | 0 (0.0%) | 5 (5.1%) |
| 9:00 AM to 9:59 AM | 0 (0.0%) | 30 (30.9%) |
| 10:00 AM to 10:59 AM | 0 (0.0%) | 0 (0.0%) |
| 11:00 AM to 11:59 AM | 0 (0.0%) | 0 (0.0%) |
| 12:00 PM to 3:59 PM | 0 (0.0%) | 0 (0.0%) |
| 4:00 PM to 11:59 PM | 0 (0.0%) | 0 (0.0%) |
| Total | 89 (100.0%) | 97 (100.0%) |
Housing Occupancy in Tangier
Occupancy by Ownership in Tangier
Of the total 179 dwellings in Tangier, owner-occupied units account for 174 (97.2%), while renter-occupied units make up 5 (2.8%).
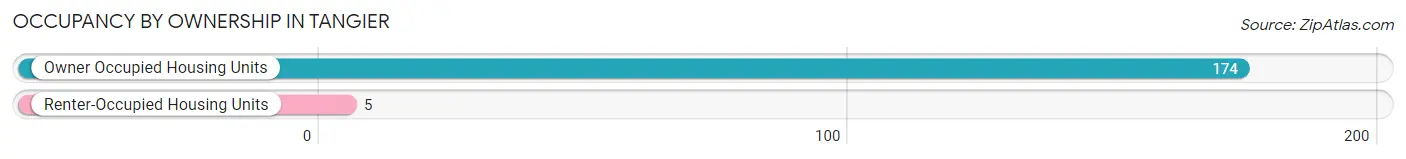
| Occupancy | # Housing Units | % Housing Units |
| Owner Occupied Housing Units | 174 | 97.2% |
| Renter-Occupied Housing Units | 5 | 2.8% |
| Total Occupied Housing Units | 179 | 100.0% |
Occupancy by Household Size in Tangier
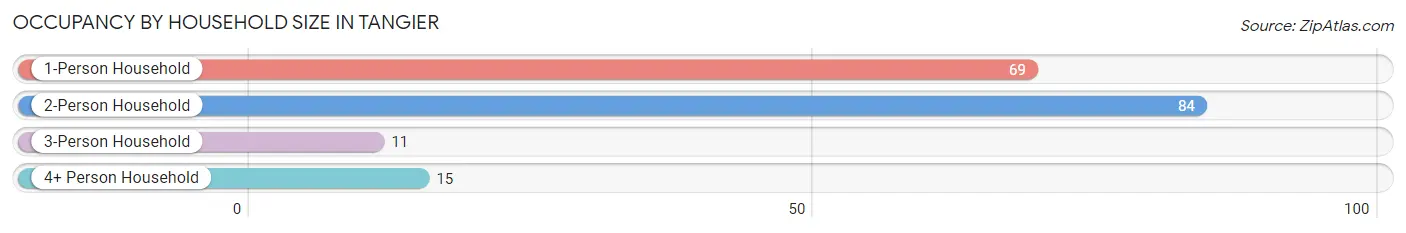
| Household Size | # Housing Units | % Housing Units |
| 1-Person Household | 69 | 38.6% |
| 2-Person Household | 84 | 46.9% |
| 3-Person Household | 11 | 6.1% |
| 4+ Person Household | 15 | 8.4% |
| Total Housing Units | 179 | 100.0% |
Occupancy by Ownership by Household Size in Tangier
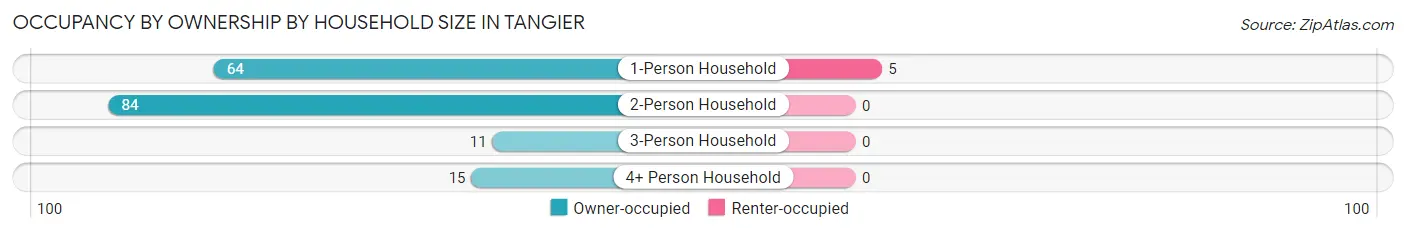
| Household Size | Owner-occupied | Renter-occupied |
| 1-Person Household | 64 (92.7%) | 5 (7.2%) |
| 2-Person Household | 84 (100.0%) | 0 (0.0%) |
| 3-Person Household | 11 (100.0%) | 0 (0.0%) |
| 4+ Person Household | 15 (100.0%) | 0 (0.0%) |
| Total Housing Units | 174 (97.2%) | 5 (2.8%) |
Occupancy by Educational Attainment in Tangier
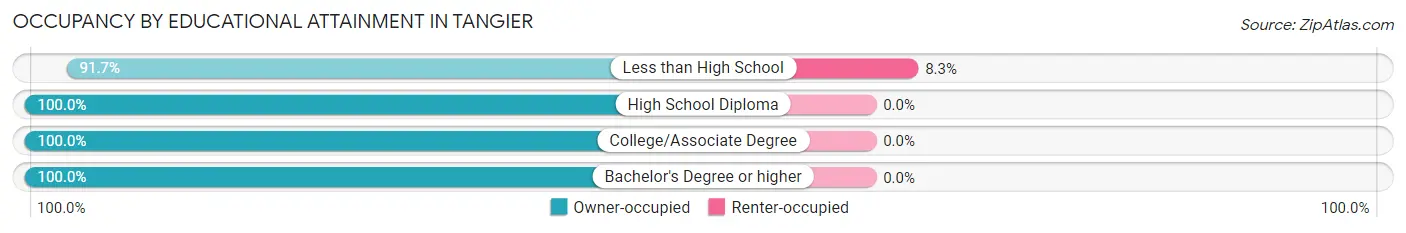
| Household Size | Owner-occupied | Renter-occupied |
| Less than High School | 55 (91.7%) | 5 (8.3%) |
| High School Diploma | 97 (100.0%) | 0 (0.0%) |
| College/Associate Degree | 8 (100.0%) | 0 (0.0%) |
| Bachelor's Degree or higher | 14 (100.0%) | 0 (0.0%) |
Occupancy by Age of Householder in Tangier
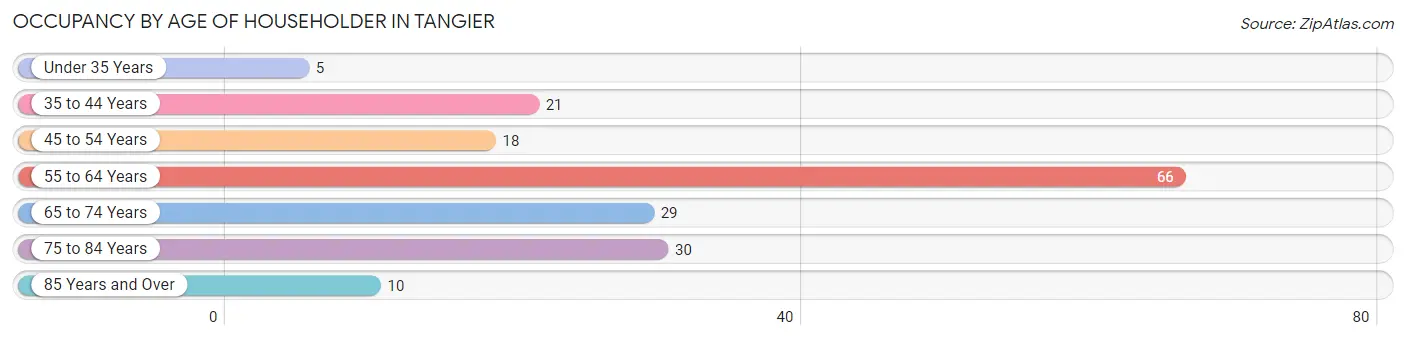
| Age Bracket | # Households | % Households |
| Under 35 Years | 5 | 2.8% |
| 35 to 44 Years | 21 | 11.7% |
| 45 to 54 Years | 18 | 10.1% |
| 55 to 64 Years | 66 | 36.9% |
| 65 to 74 Years | 29 | 16.2% |
| 75 to 84 Years | 30 | 16.8% |
| 85 Years and Over | 10 | 5.6% |
| Total | 179 | 100.0% |
Housing Finances in Tangier
Median Income by Occupancy in Tangier
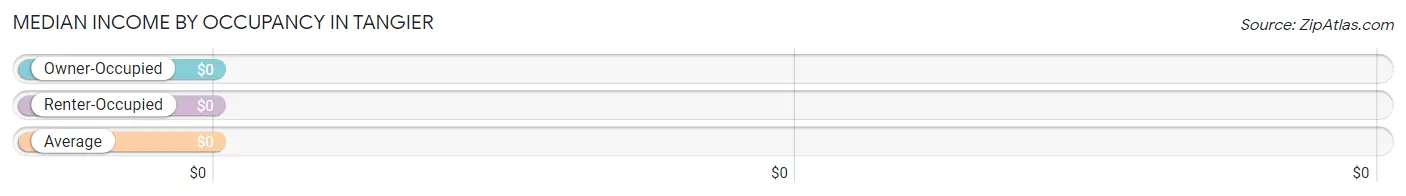
| Occupancy Type | # Households | Median Income |
| Owner-Occupied | 174 (97.2%) | $0 |
| Renter-Occupied | 5 (2.8%) | $0 |
| Average | 179 (100.0%) | $0 |
Occupancy by Householder Income Bracket in Tangier
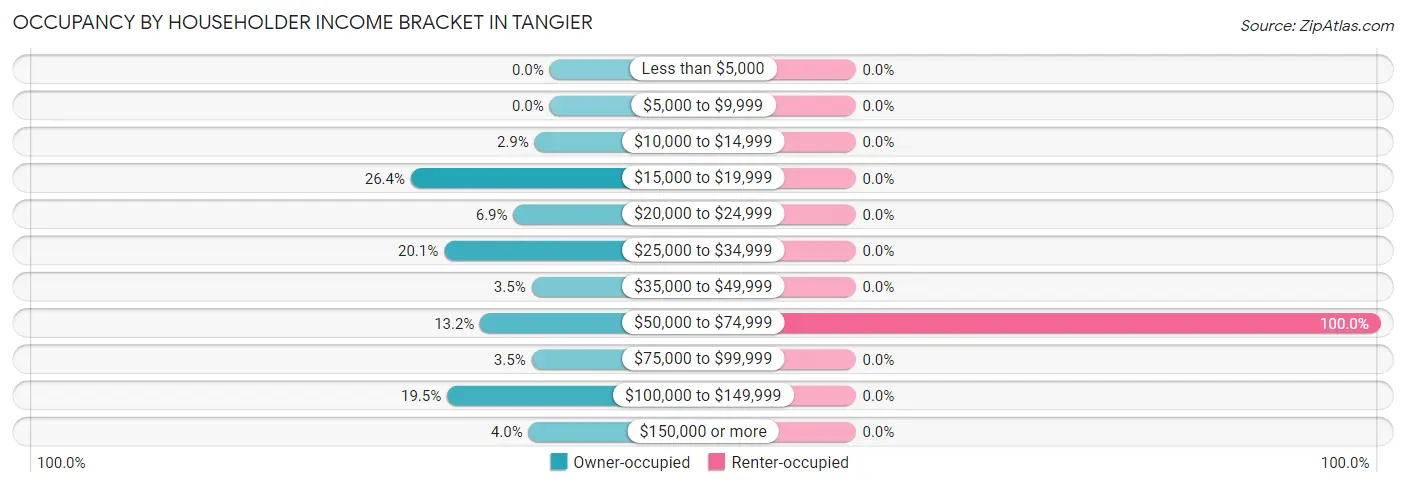
| Income Bracket | Owner-occupied | Renter-occupied |
| Less than $5,000 | 0 (0.0%) | 0 (0.0%) |
| $5,000 to $9,999 | 0 (0.0%) | 0 (0.0%) |
| $10,000 to $14,999 | 5 (2.9%) | 0 (0.0%) |
| $15,000 to $19,999 | 46 (26.4%) | 0 (0.0%) |
| $20,000 to $24,999 | 12 (6.9%) | 0 (0.0%) |
| $25,000 to $34,999 | 35 (20.1%) | 0 (0.0%) |
| $35,000 to $49,999 | 6 (3.5%) | 0 (0.0%) |
| $50,000 to $74,999 | 23 (13.2%) | 5 (100.0%) |
| $75,000 to $99,999 | 6 (3.5%) | 0 (0.0%) |
| $100,000 to $149,999 | 34 (19.5%) | 0 (0.0%) |
| $150,000 or more | 7 (4.0%) | 0 (0.0%) |
| Total | 174 (100.0%) | 5 (100.0%) |
Monthly Housing Cost Tiers in Tangier
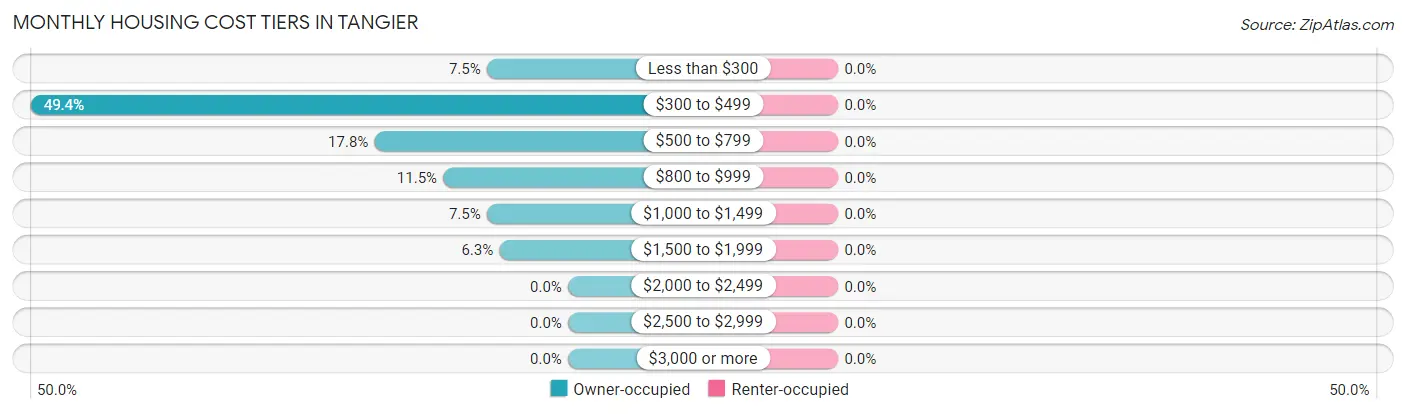
| Monthly Cost | Owner-occupied | Renter-occupied |
| Less than $300 | 13 (7.5%) | 0 (0.0%) |
| $300 to $499 | 86 (49.4%) | 0 (0.0%) |
| $500 to $799 | 31 (17.8%) | 0 (0.0%) |
| $800 to $999 | 20 (11.5%) | 0 (0.0%) |
| $1,000 to $1,499 | 13 (7.5%) | 0 (0.0%) |
| $1,500 to $1,999 | 11 (6.3%) | 0 (0.0%) |
| $2,000 to $2,499 | 0 (0.0%) | 0 (0.0%) |
| $2,500 to $2,999 | 0 (0.0%) | 0 (0.0%) |
| $3,000 or more | 0 (0.0%) | 0 (0.0%) |
| Total | 174 (100.0%) | 5 (100.0%) |
Physical Housing Characteristics in Tangier
Housing Structures in Tangier
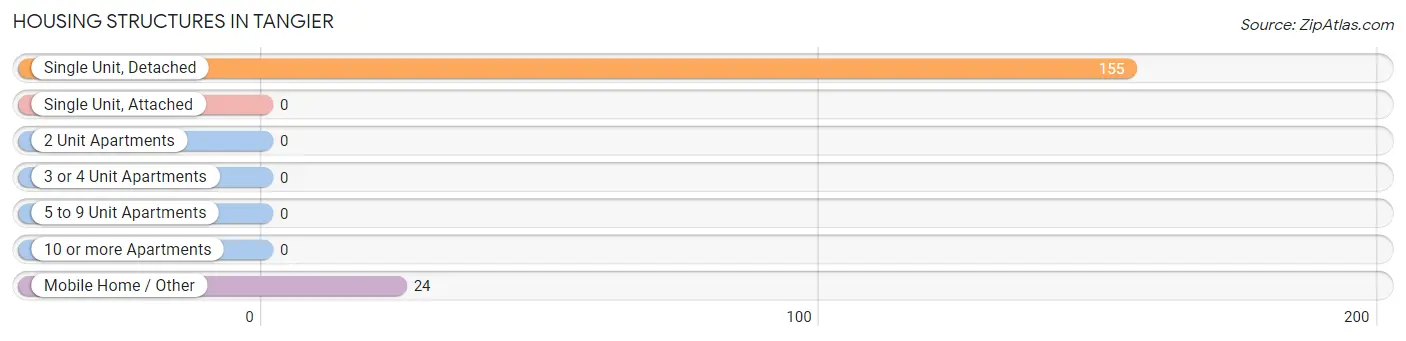
| Structure Type | # Housing Units | % Housing Units |
| Single Unit, Detached | 155 | 86.6% |
| Single Unit, Attached | 0 | 0.0% |
| 2 Unit Apartments | 0 | 0.0% |
| 3 or 4 Unit Apartments | 0 | 0.0% |
| 5 to 9 Unit Apartments | 0 | 0.0% |
| 10 or more Apartments | 0 | 0.0% |
| Mobile Home / Other | 24 | 13.4% |
| Total | 179 | 100.0% |
Housing Structures by Occupancy in Tangier
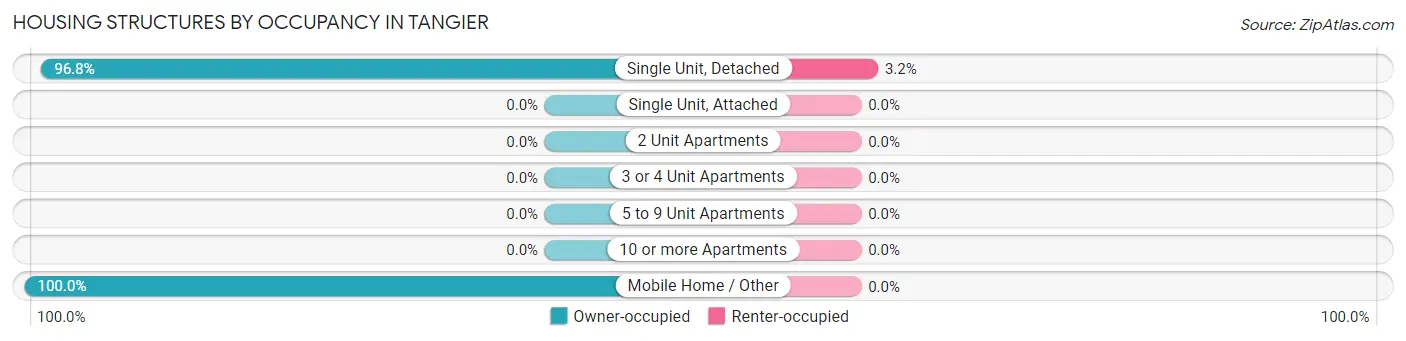
| Structure Type | Owner-occupied | Renter-occupied |
| Single Unit, Detached | 150 (96.8%) | 5 (3.2%) |
| Single Unit, Attached | 0 (0.0%) | 0 (0.0%) |
| 2 Unit Apartments | 0 (0.0%) | 0 (0.0%) |
| 3 or 4 Unit Apartments | 0 (0.0%) | 0 (0.0%) |
| 5 to 9 Unit Apartments | 0 (0.0%) | 0 (0.0%) |
| 10 or more Apartments | 0 (0.0%) | 0 (0.0%) |
| Mobile Home / Other | 24 (100.0%) | 0 (0.0%) |
| Total | 174 (97.2%) | 5 (2.8%) |
Housing Structures by Number of Rooms in Tangier
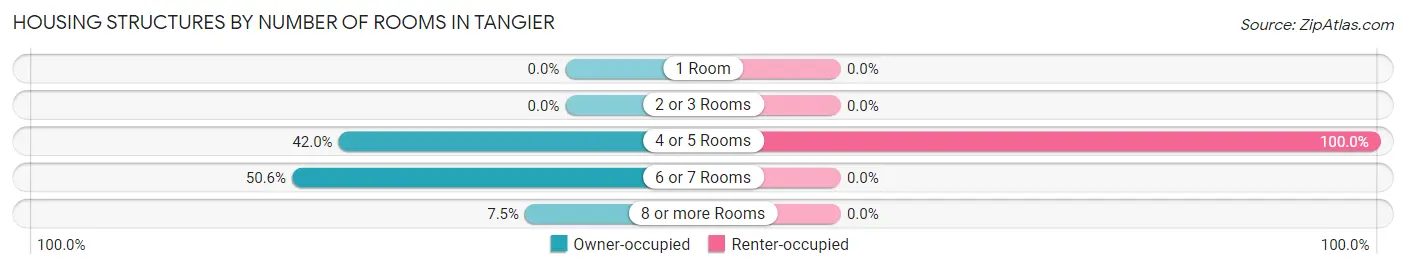
| Number of Rooms | Owner-occupied | Renter-occupied |
| 1 Room | 0 (0.0%) | 0 (0.0%) |
| 2 or 3 Rooms | 0 (0.0%) | 0 (0.0%) |
| 4 or 5 Rooms | 73 (41.9%) | 5 (100.0%) |
| 6 or 7 Rooms | 88 (50.6%) | 0 (0.0%) |
| 8 or more Rooms | 13 (7.5%) | 0 (0.0%) |
| Total | 174 (100.0%) | 5 (100.0%) |
Housing Structure by Heating Type in Tangier
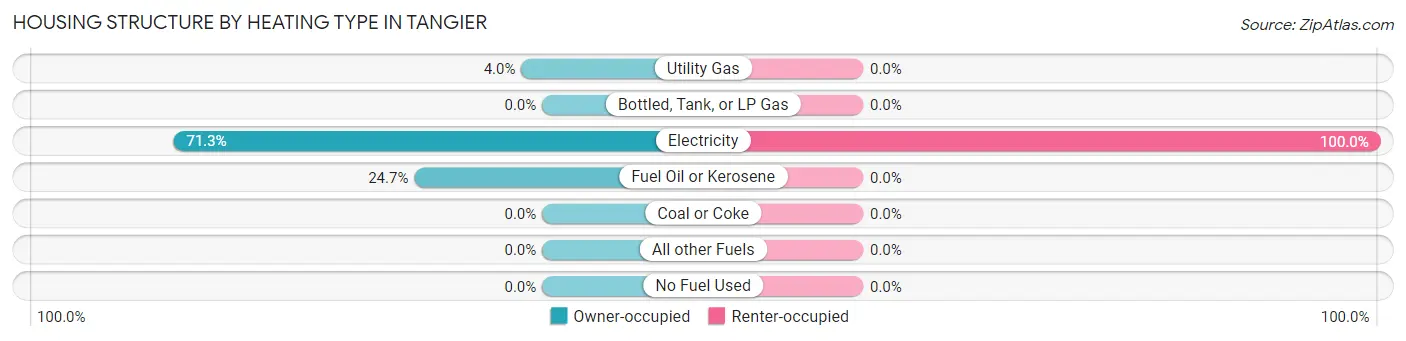
| Heating Type | Owner-occupied | Renter-occupied |
| Utility Gas | 7 (4.0%) | 0 (0.0%) |
| Bottled, Tank, or LP Gas | 0 (0.0%) | 0 (0.0%) |
| Electricity | 124 (71.3%) | 5 (100.0%) |
| Fuel Oil or Kerosene | 43 (24.7%) | 0 (0.0%) |
| Coal or Coke | 0 (0.0%) | 0 (0.0%) |
| All other Fuels | 0 (0.0%) | 0 (0.0%) |
| No Fuel Used | 0 (0.0%) | 0 (0.0%) |
| Total | 174 (100.0%) | 5 (100.0%) |
Household Vehicle Usage in Tangier
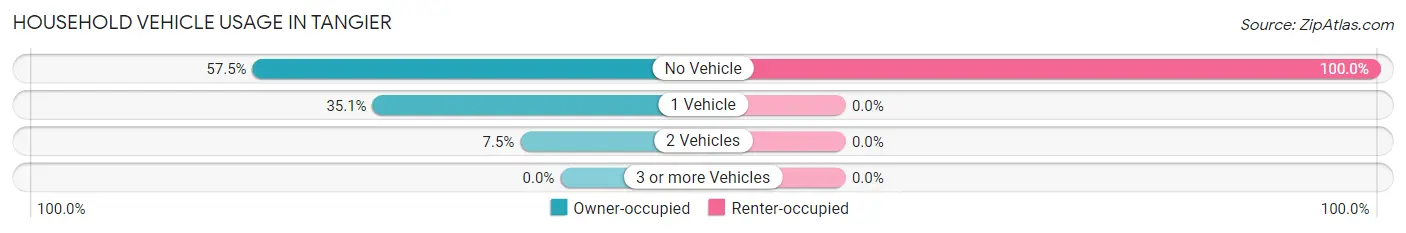
| Vehicles per Household | Owner-occupied | Renter-occupied |
| No Vehicle | 100 (57.5%) | 5 (100.0%) |
| 1 Vehicle | 61 (35.1%) | 0 (0.0%) |
| 2 Vehicles | 13 (7.5%) | 0 (0.0%) |
| 3 or more Vehicles | 0 (0.0%) | 0 (0.0%) |
| Total | 174 (100.0%) | 5 (100.0%) |
Real Estate & Mortgages in Tangier
Real Estate and Mortgage Overview in Tangier
| Characteristic | Without Mortgage | With Mortgage |
| Housing Units | 125 | 49 |
| Median Property Value | $134,900 | $95,000 |
| Median Household Income | $32,813 | $7 |
| Monthly Housing Costs | $441 | $0 |
| Real Estate Taxes | $874 | $0 |
Property Value by Mortgage Status in Tangier
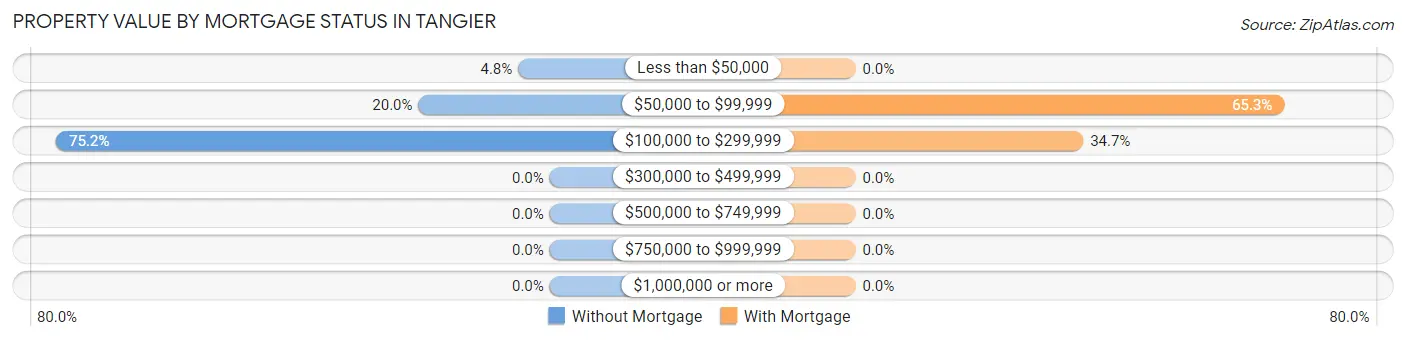
| Property Value | Without Mortgage | With Mortgage |
| Less than $50,000 | 6 (4.8%) | 0 (0.0%) |
| $50,000 to $99,999 | 25 (20.0%) | 32 (65.3%) |
| $100,000 to $299,999 | 94 (75.2%) | 17 (34.7%) |
| $300,000 to $499,999 | 0 (0.0%) | 0 (0.0%) |
| $500,000 to $749,999 | 0 (0.0%) | 0 (0.0%) |
| $750,000 to $999,999 | 0 (0.0%) | 0 (0.0%) |
| $1,000,000 or more | 0 (0.0%) | 0 (0.0%) |
| Total | 125 (100.0%) | 49 (100.0%) |
Household Income by Mortgage Status in Tangier
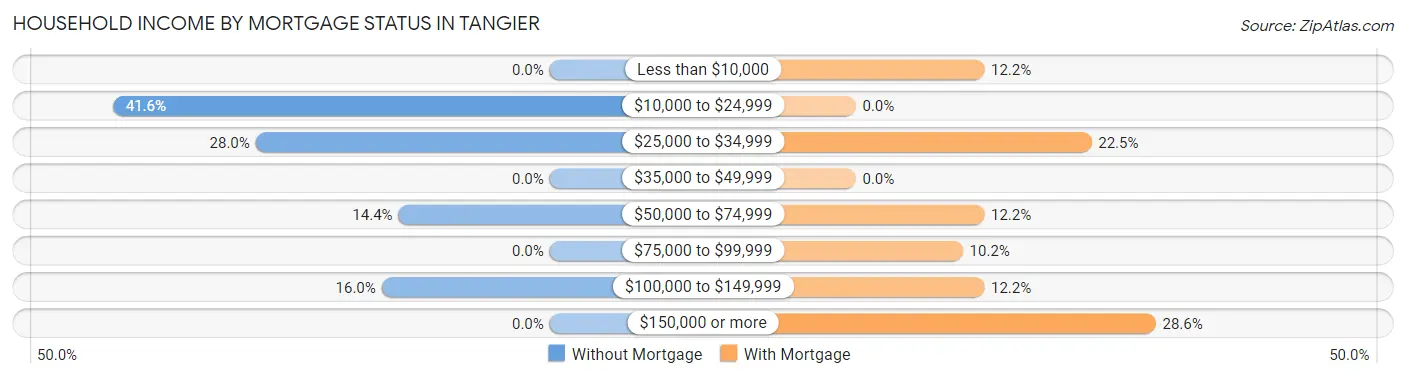
| Household Income | Without Mortgage | With Mortgage |
| Less than $10,000 | 0 (0.0%) | 6 (12.2%) |
| $10,000 to $24,999 | 52 (41.6%) | 0 (0.0%) |
| $25,000 to $34,999 | 35 (28.0%) | 11 (22.5%) |
| $35,000 to $49,999 | 0 (0.0%) | 0 (0.0%) |
| $50,000 to $74,999 | 18 (14.4%) | 6 (12.2%) |
| $75,000 to $99,999 | 0 (0.0%) | 5 (10.2%) |
| $100,000 to $149,999 | 20 (16.0%) | 6 (12.2%) |
| $150,000 or more | 0 (0.0%) | 14 (28.6%) |
| Total | 125 (100.0%) | 49 (100.0%) |
Property Value to Household Income Ratio in Tangier
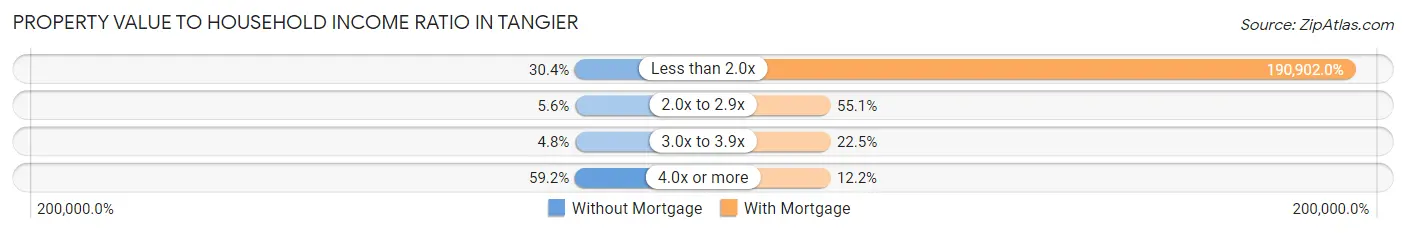
| Value-to-Income Ratio | Without Mortgage | With Mortgage |
| Less than 2.0x | 38 (30.4%) | 93,542 (190,902.0%) |
| 2.0x to 2.9x | 7 (5.6%) | 27 (55.1%) |
| 3.0x to 3.9x | 6 (4.8%) | 11 (22.5%) |
| 4.0x or more | 74 (59.2%) | 6 (12.2%) |
| Total | 125 (100.0%) | 49 (100.0%) |
Real Estate Taxes by Mortgage Status in Tangier
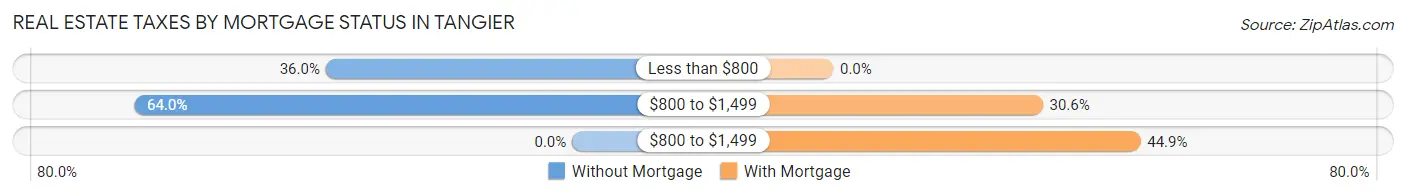
| Property Taxes | Without Mortgage | With Mortgage |
| Less than $800 | 45 (36.0%) | 0 (0.0%) |
| $800 to $1,499 | 80 (64.0%) | 15 (30.6%) |
| $800 to $1,499 | 0 (0.0%) | 22 (44.9%) |
| Total | 125 (100.0%) | 49 (100.0%) |
Health & Disability in Tangier
Health Insurance Coverage by Age in Tangier
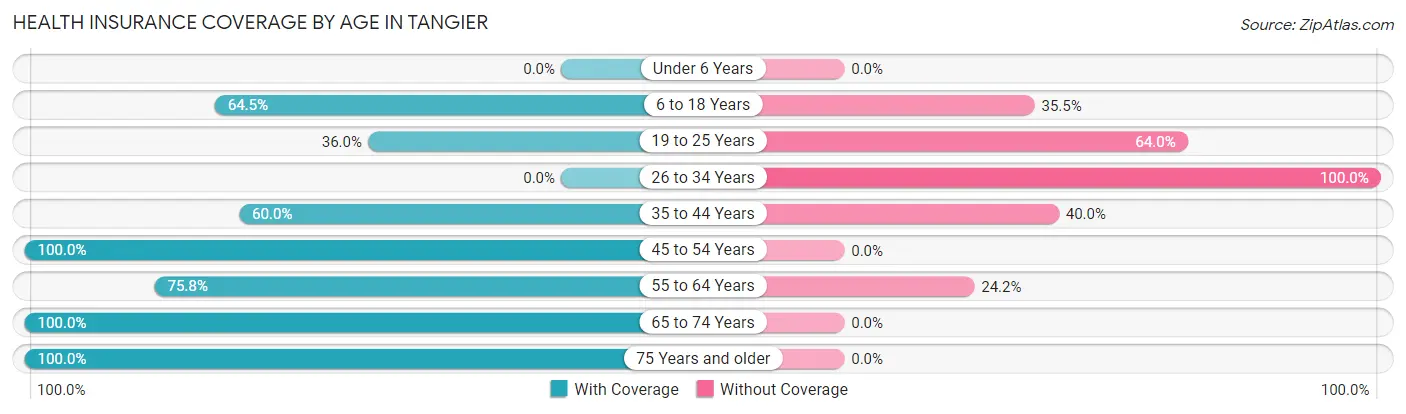
| Age Bracket | With Coverage | Without Coverage |
| Under 6 Years | 0 (0.0%) | 0 (0.0%) |
| 6 to 18 Years | 20 (64.5%) | 11 (35.5%) |
| 19 to 25 Years | 9 (36.0%) | 16 (64.0%) |
| 26 to 34 Years | 0 (0.0%) | 5 (100.0%) |
| 35 to 44 Years | 21 (60.0%) | 14 (40.0%) |
| 45 to 54 Years | 49 (100.0%) | 0 (0.0%) |
| 55 to 64 Years | 75 (75.8%) | 24 (24.2%) |
| 65 to 74 Years | 43 (100.0%) | 0 (0.0%) |
| 75 Years and older | 58 (100.0%) | 0 (0.0%) |
| Total | 275 (79.7%) | 70 (20.3%) |
Health Insurance Coverage by Citizenship Status in Tangier
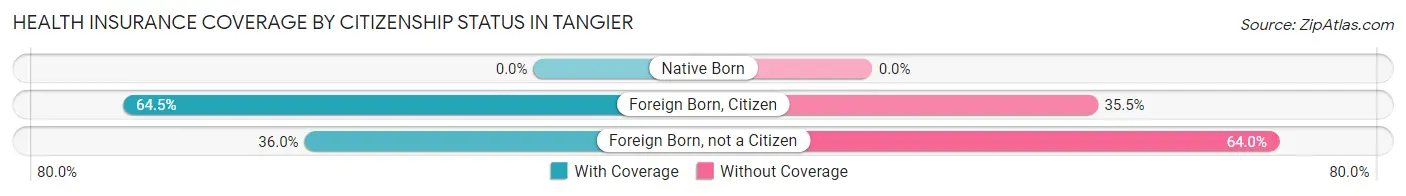
| Citizenship Status | With Coverage | Without Coverage |
| Native Born | 0 (0.0%) | 0 (0.0%) |
| Foreign Born, Citizen | 20 (64.5%) | 11 (35.5%) |
| Foreign Born, not a Citizen | 9 (36.0%) | 16 (64.0%) |
Health Insurance Coverage by Household Income in Tangier
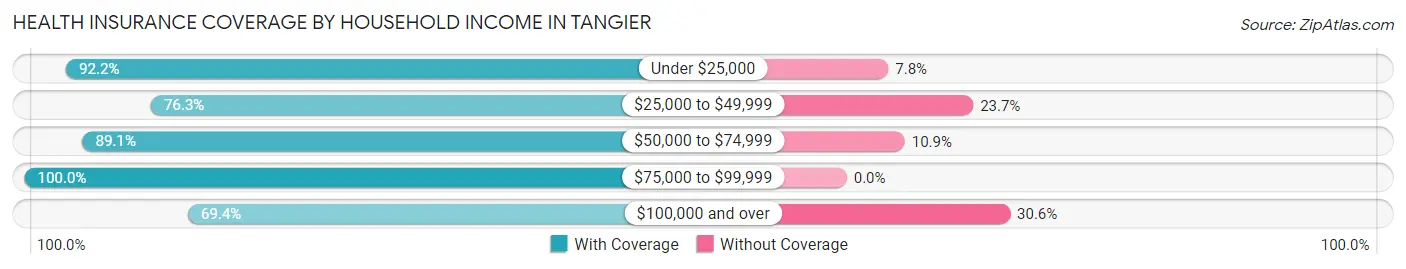
| Household Income | With Coverage | Without Coverage |
| Under $25,000 | 71 (92.2%) | 6 (7.8%) |
| $25,000 to $49,999 | 58 (76.3%) | 18 (23.7%) |
| $50,000 to $74,999 | 41 (89.1%) | 5 (10.9%) |
| $75,000 to $99,999 | 12 (100.0%) | 0 (0.0%) |
| $100,000 and over | 93 (69.4%) | 41 (30.6%) |
Public vs Private Health Insurance Coverage by Age in Tangier
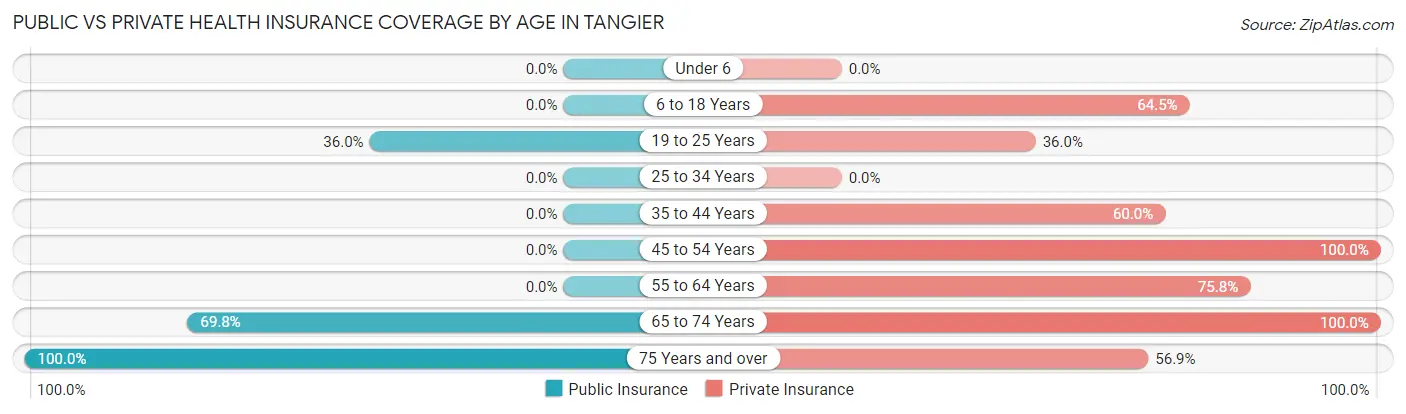
| Age Bracket | Public Insurance | Private Insurance |
| Under 6 | 0 (0.0%) | 0 (0.0%) |
| 6 to 18 Years | 0 (0.0%) | 20 (64.5%) |
| 19 to 25 Years | 9 (36.0%) | 9 (36.0%) |
| 25 to 34 Years | 0 (0.0%) | 0 (0.0%) |
| 35 to 44 Years | 0 (0.0%) | 21 (60.0%) |
| 45 to 54 Years | 0 (0.0%) | 49 (100.0%) |
| 55 to 64 Years | 0 (0.0%) | 75 (75.8%) |
| 65 to 74 Years | 30 (69.8%) | 43 (100.0%) |
| 75 Years and over | 58 (100.0%) | 33 (56.9%) |
| Total | 97 (28.1%) | 250 (72.5%) |
Disability Status by Sex by Age in Tangier
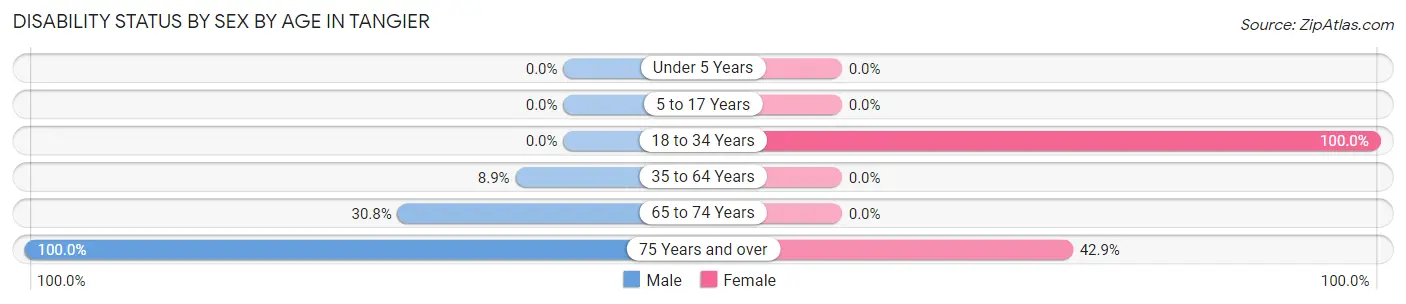
| Age Bracket | Male | Female |
| Under 5 Years | 0 (0.0%) | 0 (0.0%) |
| 5 to 17 Years | 0 (0.0%) | 0 (0.0%) |
| 18 to 34 Years | 0 (0.0%) | 9 (100.0%) |
| 35 to 64 Years | 8 (8.9%) | 0 (0.0%) |
| 65 to 74 Years | 8 (30.8%) | 0 (0.0%) |
| 75 Years and over | 9 (100.0%) | 21 (42.9%) |
Disability Class by Sex by Age in Tangier
Disability Class: Hearing Difficulty
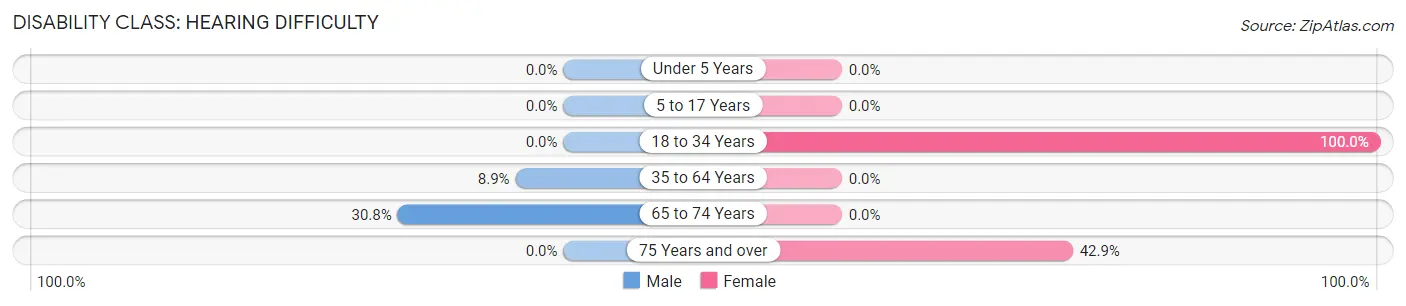
| Age Bracket | Male | Female |
| Under 5 Years | 0 (0.0%) | 0 (0.0%) |
| 5 to 17 Years | 0 (0.0%) | 0 (0.0%) |
| 18 to 34 Years | 0 (0.0%) | 9 (100.0%) |
| 35 to 64 Years | 8 (8.9%) | 0 (0.0%) |
| 65 to 74 Years | 8 (30.8%) | 0 (0.0%) |
| 75 Years and over | 0 (0.0%) | 21 (42.9%) |
Disability Class: Vision Difficulty
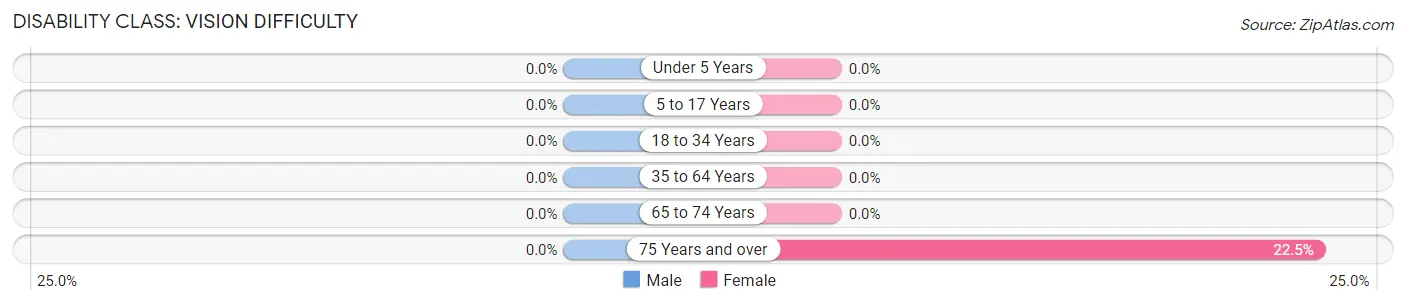
| Age Bracket | Male | Female |
| Under 5 Years | 0 (0.0%) | 0 (0.0%) |
| 5 to 17 Years | 0 (0.0%) | 0 (0.0%) |
| 18 to 34 Years | 0 (0.0%) | 0 (0.0%) |
| 35 to 64 Years | 0 (0.0%) | 0 (0.0%) |
| 65 to 74 Years | 0 (0.0%) | 0 (0.0%) |
| 75 Years and over | 0 (0.0%) | 11 (22.5%) |
Disability Class: Cognitive Difficulty
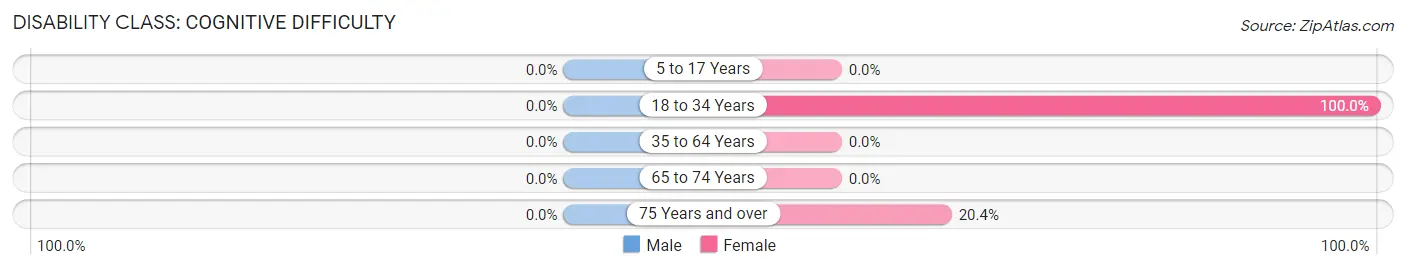
| Age Bracket | Male | Female |
| 5 to 17 Years | 0 (0.0%) | 0 (0.0%) |
| 18 to 34 Years | 0 (0.0%) | 9 (100.0%) |
| 35 to 64 Years | 0 (0.0%) | 0 (0.0%) |
| 65 to 74 Years | 0 (0.0%) | 0 (0.0%) |
| 75 Years and over | 0 (0.0%) | 10 (20.4%) |
Disability Class: Ambulatory Difficulty
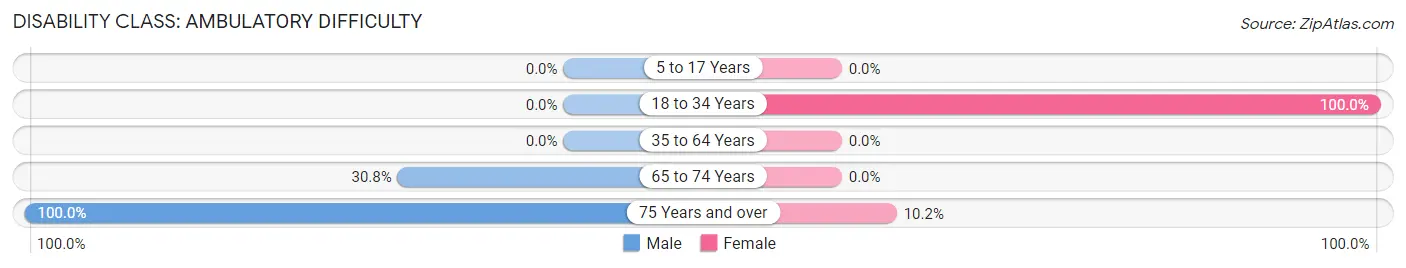
| Age Bracket | Male | Female |
| 5 to 17 Years | 0 (0.0%) | 0 (0.0%) |
| 18 to 34 Years | 0 (0.0%) | 9 (100.0%) |
| 35 to 64 Years | 0 (0.0%) | 0 (0.0%) |
| 65 to 74 Years | 8 (30.8%) | 0 (0.0%) |
| 75 Years and over | 9 (100.0%) | 5 (10.2%) |
Disability Class: Self-Care Difficulty
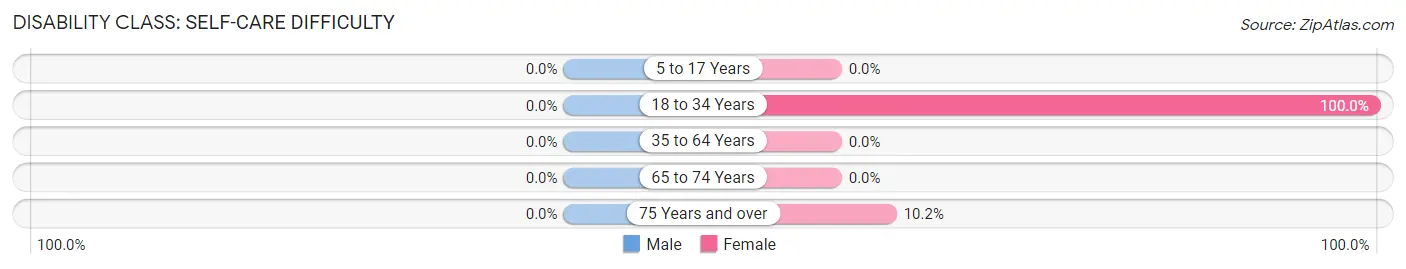
| Age Bracket | Male | Female |
| 5 to 17 Years | 0 (0.0%) | 0 (0.0%) |
| 18 to 34 Years | 0 (0.0%) | 9 (100.0%) |
| 35 to 64 Years | 0 (0.0%) | 0 (0.0%) |
| 65 to 74 Years | 0 (0.0%) | 0 (0.0%) |
| 75 Years and over | 0 (0.0%) | 5 (10.2%) |
Technology Access in Tangier
Computing Device Access in Tangier
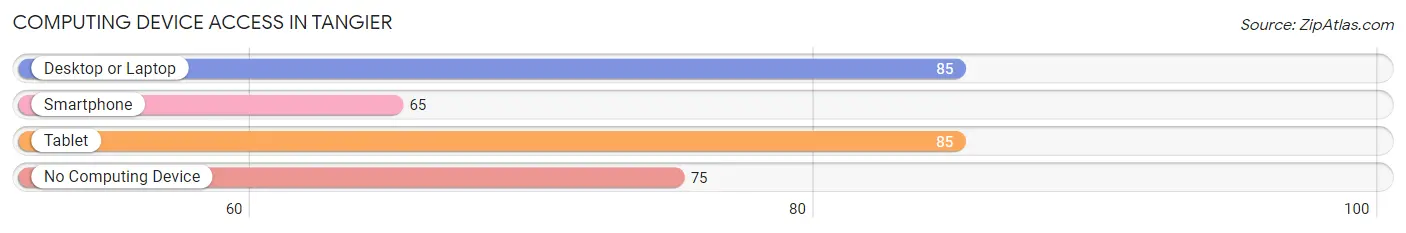
| Device Type | # Households | % Households |
| Desktop or Laptop | 85 | 47.5% |
| Smartphone | 65 | 36.3% |
| Tablet | 85 | 47.5% |
| No Computing Device | 75 | 41.9% |
| Total | 179 | 100.0% |
Internet Access in Tangier
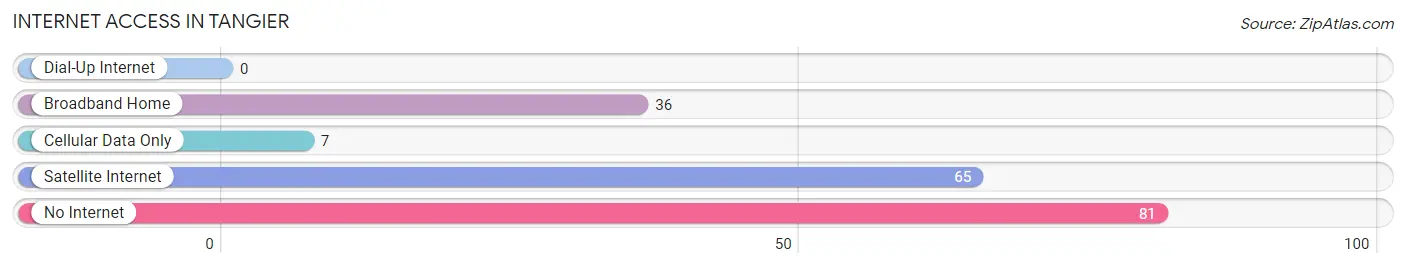
| Internet Type | # Households | % Households |
| Dial-Up Internet | 0 | 0.0% |
| Broadband Home | 36 | 20.1% |
| Cellular Data Only | 7 | 3.9% |
| Satellite Internet | 65 | 36.3% |
| No Internet | 81 | 45.3% |
| Total | 179 | 100.0% |
Tangier Summary
History
Tangier is a small island located in the Chesapeake Bay off the coast of Virginia. It is part of Accomack County and is the only inhabited island in the Chesapeake Bay. The island has a long and rich history, dating back to the 1600s when it was first settled by English colonists. The island was originally known as Hog Island, but was later renamed Tangier in honor of the Tangier Islands in the Mediterranean Sea.
The island was first settled by English colonists in 1686, and the first permanent settlement was established in 1778. The island was used primarily for fishing and farming, and the population grew steadily over the years. In the late 1800s, the island became a popular tourist destination, and many of the island’s buildings were built during this time.
In the early 1900s, the island’s population began to decline as the fishing industry declined and the island’s economy shifted to tourism. The island’s population continued to decline until the 1950s, when the island was purchased by the U.S. government and designated as a wildlife refuge. The island’s population has since stabilized, and the island is now home to around 500 people.
Geography
Tangier is located in the Chesapeake Bay off the coast of Virginia. The island is approximately 4.5 miles long and 1.5 miles wide, and is surrounded by shallow waters. The island is composed of low-lying marshland and is mostly flat, with the highest point being only 16 feet above sea level.
The island is located in a temperate climate, with mild winters and hot, humid summers. The island receives an average of 45 inches of rain per year, and is prone to flooding during heavy rains.
Economy
The economy of Tangier is largely based on tourism and fishing. The island is a popular tourist destination, and many of the island’s businesses cater to tourists. The island also has a small fishing industry, and many of the island’s residents make their living by fishing in the Chesapeake Bay.
The island also has a small manufacturing sector, and many of the island’s businesses produce items such as seafood, clothing, and furniture. The island also has a small agricultural sector, and many of the island’s residents grow crops such as corn, soybeans, and wheat.
Demographics
As of the 2010 census, the population of Tangier was 476. The island is predominantly white, with 94.3% of the population identifying as white. The island also has a small African American population, with 4.2% of the population identifying as African American. The island also has a small Hispanic population, with 1.5% of the population identifying as Hispanic or Latino.
The median household income on the island is $41,250, and the median home value is $179,000. The island has a high rate of poverty, with 24.3% of the population living below the poverty line. The island also has a high rate of unemployment, with 8.3% of the population unemployed.
Common Questions
What is Per Capita Income in Tangier?
Per Capita income in Tangier is $32,883.
What is Income or Wage Gap in Tangier?
Income or Wage Gap in Tangier is 84.4%.
Women in Tangier earn 15.6 cents for every dollar earned by a man.
What is Inequality or Gini Index in Tangier?
Inequality or Gini Index in Tangier is 0.44.
What is the Total Population of Tangier?
Total Population of Tangier is 345.
What is the Total Male Population of Tangier?
Total Male Population of Tangier is 162.
What is the Total Female Population of Tangier?
Total Female Population of Tangier is 183.
What is the Ratio of Males per 100 Females in Tangier?
There are 88.52 Males per 100 Females in Tangier.
What is the Ratio of Females per 100 Males in Tangier?
There are 112.96 Females per 100 Males in Tangier.
What is the Median Population Age in Tangier?
Median Population Age in Tangier is 57.3 Years.
What is the Average Family Size in Tangier
Average Family Size in Tangier is 2.5 People.
What is the Average Household Size in Tangier
Average Household Size in Tangier is 1.9 People.
How Large is the Labor Force in Tangier?
There are 197 People in the Labor Forcein in Tangier.
What is the Percentage of People in the Labor Force in Tangier?
61.9% of People are in the Labor Force in Tangier.
What is the Unemployment Rate in Tangier?
Unemployment Rate in Tangier is 5.6%.