Vansant, VA Map & Demographics
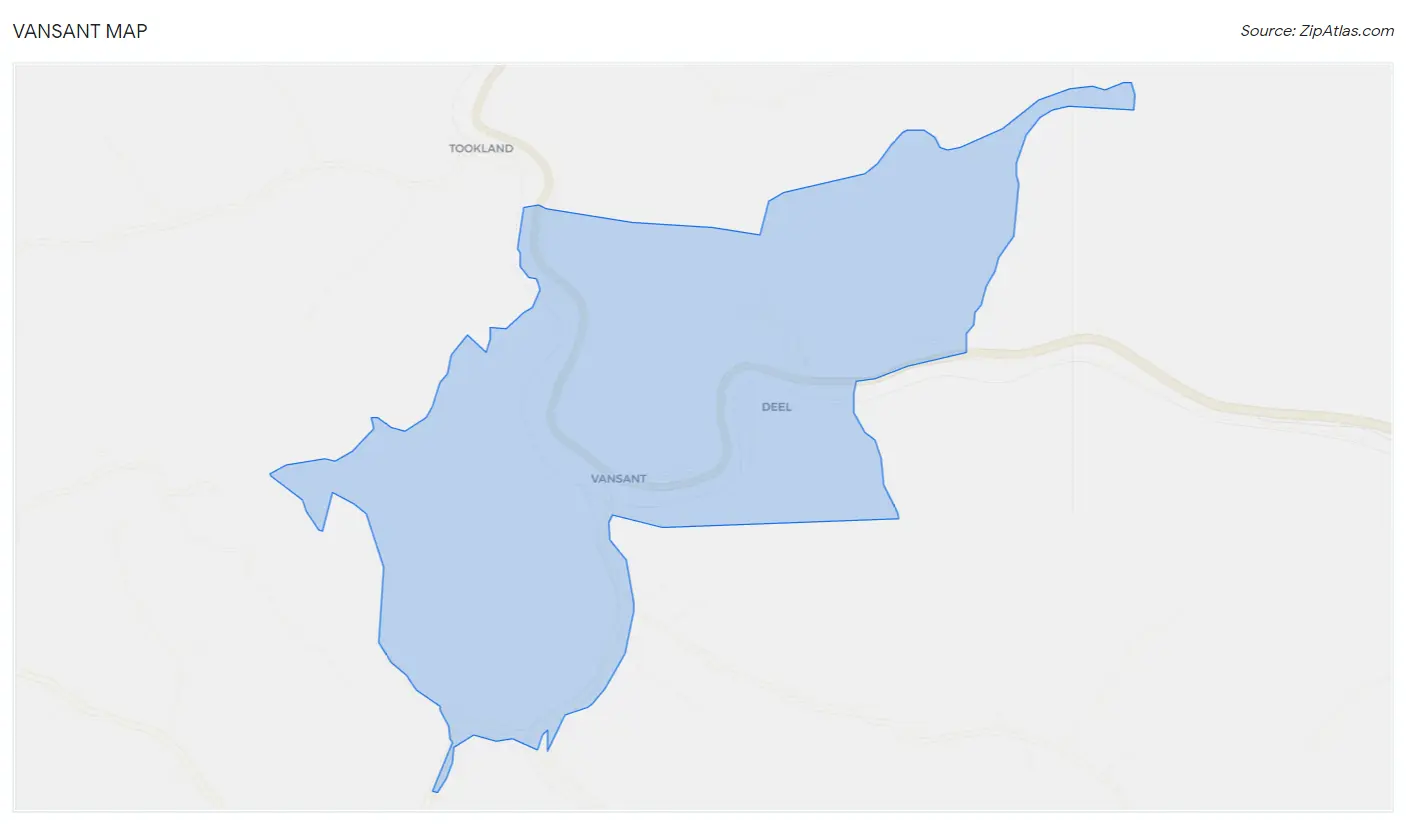
Vansant Map
Vansant Overview
$33,324
PER CAPITA INCOME
0.70
INEQUALITY / GINI INDEX
229
TOTAL POPULATION
136
MALE POPULATION
93
FEMALE POPULATION
146.24
MALES / 100 FEMALES
68.38
FEMALES / 100 MALES
29.5
MEDIAN AGE
2.8
AVG FAMILY SIZE
2.2
AVG HOUSEHOLD SIZE
101
LABOR FORCE [ PEOPLE ]
52.1%
PERCENT IN LABOR FORCE
Vansant Zip Codes
Vansant Area Codes
Income in Vansant
Income Overview in Vansant
| Characteristic | Number | Measure |
| Per Capita Income | 229 | $33,324 |
| Median Family Income | 60 | $0 |
| Mean Family Income | 60 | $118,767 |
| Median Household Income | 104 | $0 |
| Mean Household Income | 104 | $79,499 |
| Income Deficit | 60 | $0 |
| Wage / Income Gap (%) | 229 | 0.00% |
| Wage / Income Gap ($) | 229 | 100.00¢ per $1 |
| Gini / Inequality Index | 229 | 0.70 |
Earnings by Sex in Vansant
| Sex | Number | Average Earnings |
| Male | 78 (61.9%) | $0 |
| Female | 48 (38.1%) | $0 |
| Total | 126 (100.0%) | $0 |
Earnings by Sex by Income Bracket in Vansant
The most common earnings brackets in Vansant are $30,000 to $34,999 for men (27 | 34.6%) and $7,500 to $9,999 for women (18 | 37.5%).
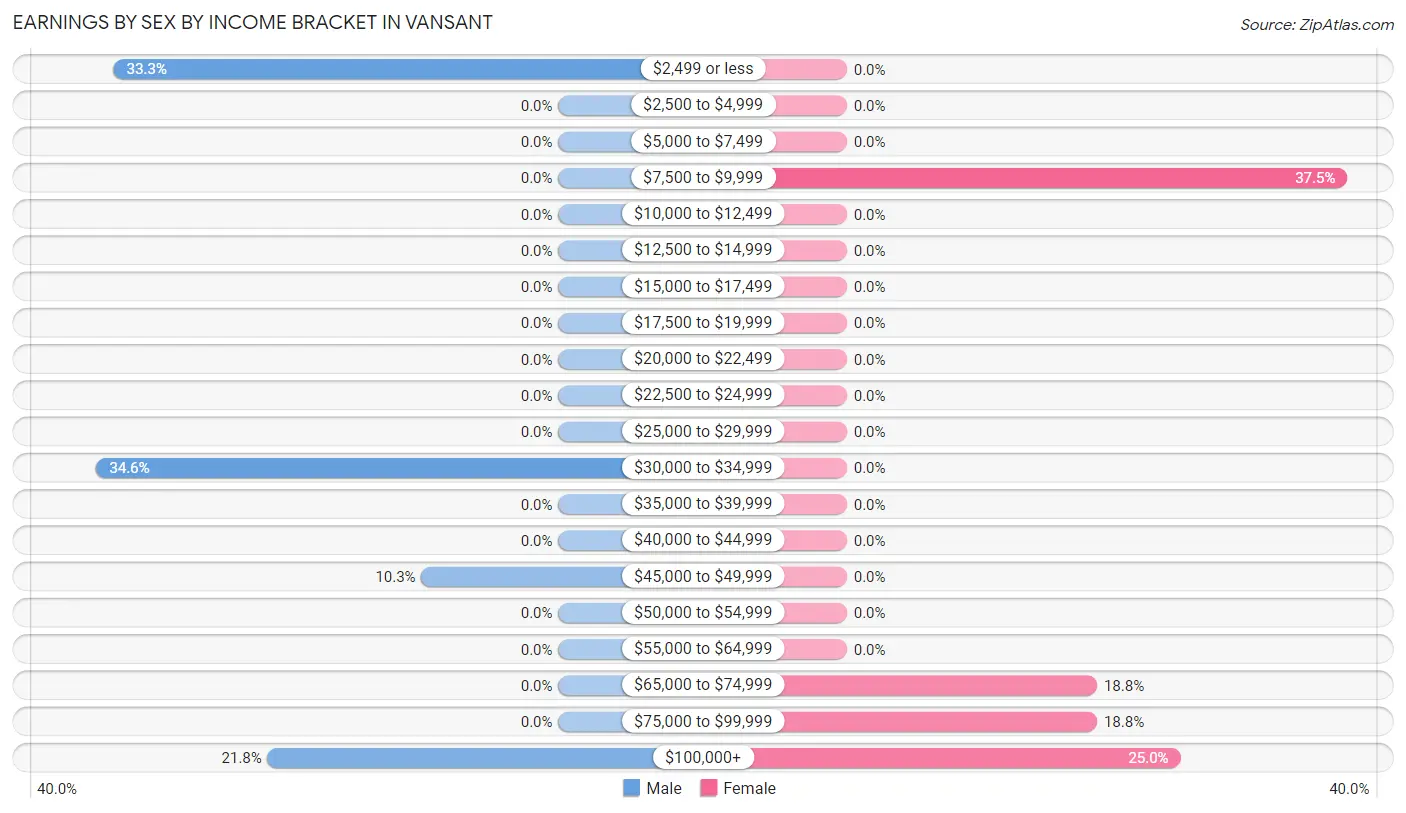
| Income | Male | Female |
| $2,499 or less | 26 (33.3%) | 0 (0.0%) |
| $2,500 to $4,999 | 0 (0.0%) | 0 (0.0%) |
| $5,000 to $7,499 | 0 (0.0%) | 0 (0.0%) |
| $7,500 to $9,999 | 0 (0.0%) | 18 (37.5%) |
| $10,000 to $12,499 | 0 (0.0%) | 0 (0.0%) |
| $12,500 to $14,999 | 0 (0.0%) | 0 (0.0%) |
| $15,000 to $17,499 | 0 (0.0%) | 0 (0.0%) |
| $17,500 to $19,999 | 0 (0.0%) | 0 (0.0%) |
| $20,000 to $22,499 | 0 (0.0%) | 0 (0.0%) |
| $22,500 to $24,999 | 0 (0.0%) | 0 (0.0%) |
| $25,000 to $29,999 | 0 (0.0%) | 0 (0.0%) |
| $30,000 to $34,999 | 27 (34.6%) | 0 (0.0%) |
| $35,000 to $39,999 | 0 (0.0%) | 0 (0.0%) |
| $40,000 to $44,999 | 0 (0.0%) | 0 (0.0%) |
| $45,000 to $49,999 | 8 (10.3%) | 0 (0.0%) |
| $50,000 to $54,999 | 0 (0.0%) | 0 (0.0%) |
| $55,000 to $64,999 | 0 (0.0%) | 0 (0.0%) |
| $65,000 to $74,999 | 0 (0.0%) | 9 (18.8%) |
| $75,000 to $99,999 | 0 (0.0%) | 9 (18.8%) |
| $100,000+ | 17 (21.8%) | 12 (25.0%) |
| Total | 78 (100.0%) | 48 (100.0%) |
Earnings by Sex by Educational Attainment in Vansant
| Educational Attainment | Male Income | Female Income |
| Less than High School | - | - |
| High School Diploma | - | - |
| College or Associate's Degree | - | - |
| Bachelor's Degree | - | - |
| Graduate Degree | - | - |
| Total | - | - |
Family Income in Vansant
Family Income Brackets in Vansant
According to the Vansant family income data, there are 18 families falling into the $25,000 to $34,999 income range, which is the most common income bracket and makes up 30.0% of all families.
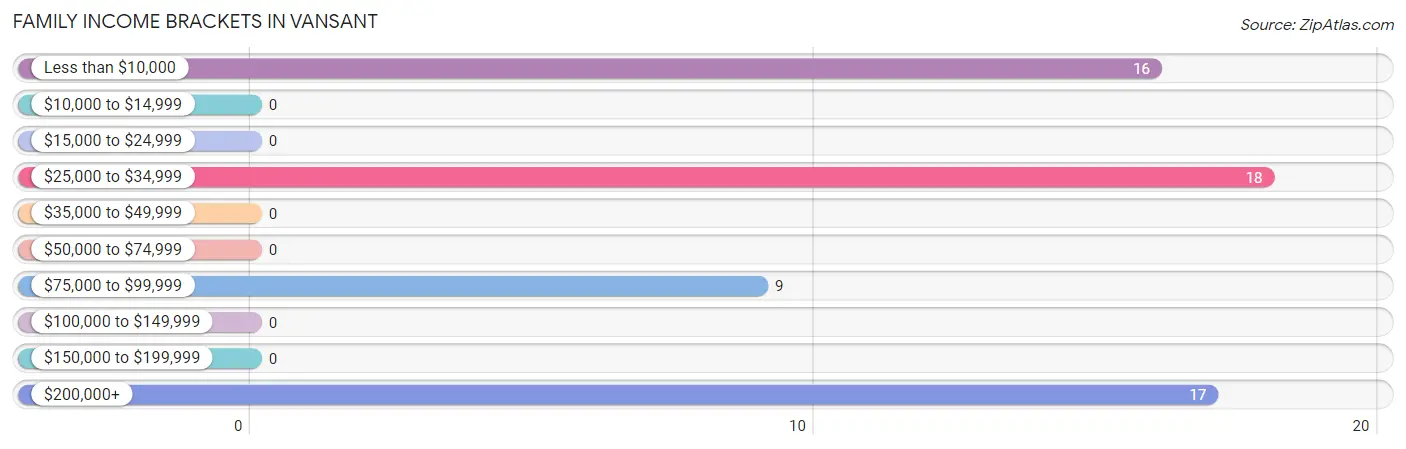
| Income Bracket | # Families | % Families |
| Less than $10,000 | 16 | 26.7% |
| $10,000 to $14,999 | 0 | 0.0% |
| $15,000 to $24,999 | 0 | 0.0% |
| $25,000 to $34,999 | 18 | 30.0% |
| $35,000 to $49,999 | 0 | 0.0% |
| $50,000 to $74,999 | 0 | 0.0% |
| $75,000 to $99,999 | 9 | 15.0% |
| $100,000 to $149,999 | 0 | 0.0% |
| $150,000 to $199,999 | 0 | 0.0% |
| $200,000+ | 17 | 28.3% |
Family Income by Famaliy Size in Vansant
| Income Bracket | # Families | Median Income |
| 2-Person Families | 16 (26.7%) | $0 |
| 3-Person Families | 44 (73.3%) | $0 |
| 4-Person Families | 0 (0.0%) | $0 |
| 5-Person Families | 0 (0.0%) | $0 |
| 6-Person Families | 0 (0.0%) | $0 |
| 7+ Person Families | 0 (0.0%) | $0 |
| Total | 60 (100.0%) | $0 |
Family Income by Number of Earners in Vansant
| Number of Earners | # Families | Median Income |
| No Earners | 0 (0.0%) | $0 |
| 1 Earner | 43 (71.7%) | $0 |
| 2 Earners | 0 (0.0%) | $0 |
| 3+ Earners | 17 (28.3%) | $0 |
| Total | 60 (100.0%) | $0 |
Household Income in Vansant
Household Income Brackets in Vansant
With 51 households falling in the category, the less than $10,000 income range is the most frequent in Vansant, accounting for 49.0% of all households.
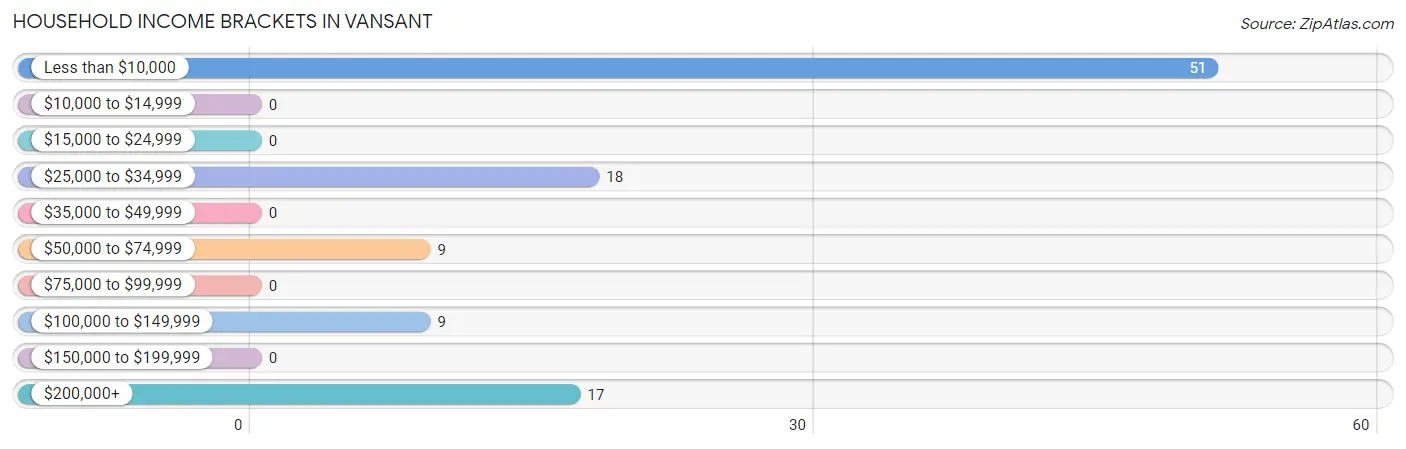
| Income Bracket | # Households | % Households |
| Less than $10,000 | 51 | 49.0% |
| $10,000 to $14,999 | 0 | 0.0% |
| $15,000 to $24,999 | 0 | 0.0% |
| $25,000 to $34,999 | 18 | 17.3% |
| $35,000 to $49,999 | 0 | 0.0% |
| $50,000 to $74,999 | 9 | 8.7% |
| $75,000 to $99,999 | 0 | 0.0% |
| $100,000 to $149,999 | 9 | 8.7% |
| $150,000 to $199,999 | 0 | 0.0% |
| $200,000+ | 17 | 16.3% |
Household Income by Householder Age in Vansant
The median household income in Vansant is $0, with the highest median household income of $2,499 found in the 25 to 44 years age bracket for the primary householder. A total of 43 households (41.3%) fall into this category.
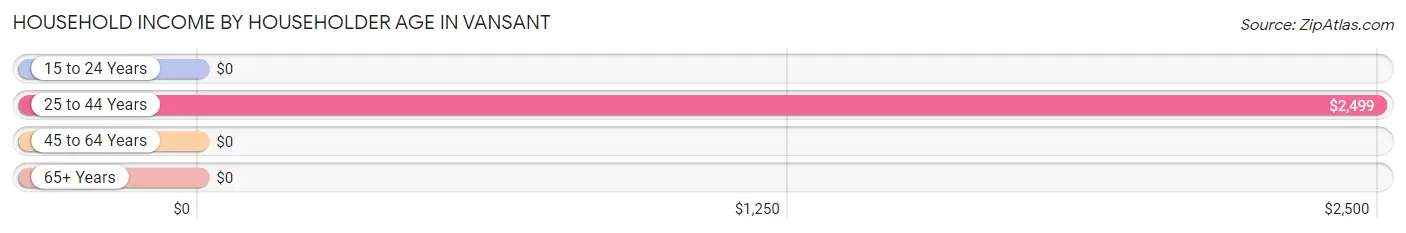
| Income Bracket | # Households | Median Income |
| 15 to 24 Years | 0 (0.0%) | $0 |
| 25 to 44 Years | 43 (41.3%) | $2,499 |
| 45 to 64 Years | 51 (49.0%) | $0 |
| 65+ Years | 10 (9.6%) | $0 |
| Total | 104 (100.0%) | $0 |
Poverty in Vansant
Income Below Poverty by Sex and Age in Vansant
With 37.5% poverty level for males and 28.0% for females among the residents of Vansant, 65 to 74 year old males and 18 to 24 year old females are the most vulnerable to poverty, with 16 males (100.0%) and 10 females (100.0%) in their respective age groups living below the poverty level.
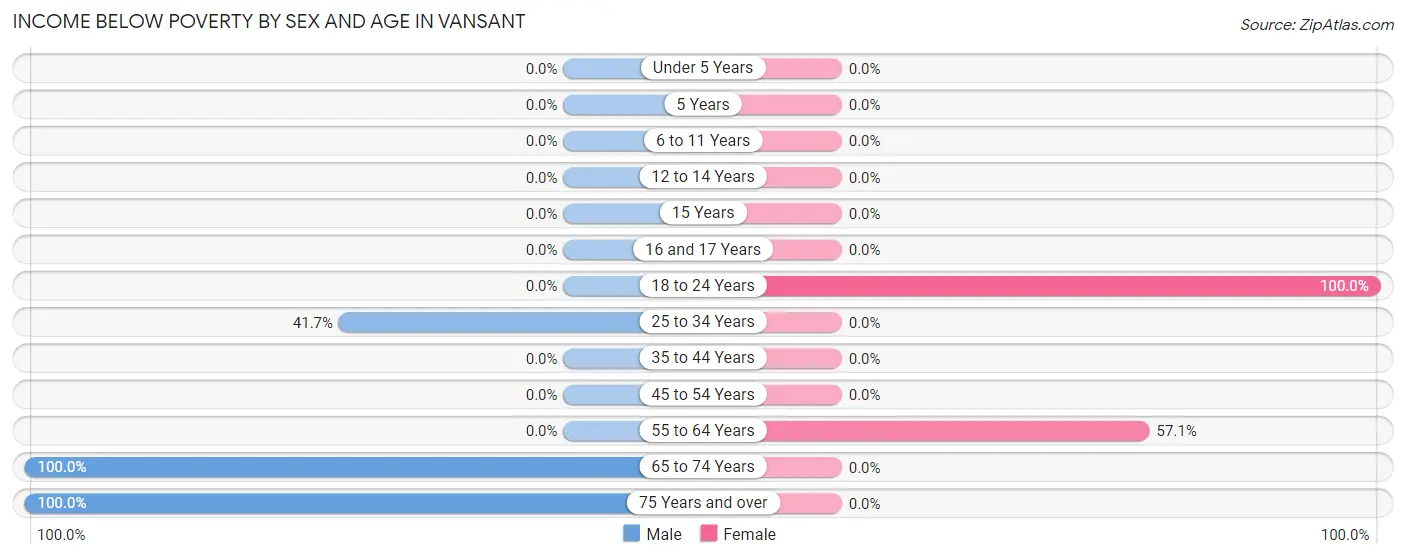
| Age Bracket | Male | Female |
| Under 5 Years | 0 (0.0%) | 0 (0.0%) |
| 5 Years | 0 (0.0%) | 0 (0.0%) |
| 6 to 11 Years | 0 (0.0%) | 0 (0.0%) |
| 12 to 14 Years | 0 (0.0%) | 0 (0.0%) |
| 15 Years | 0 (0.0%) | 0 (0.0%) |
| 16 and 17 Years | 0 (0.0%) | 0 (0.0%) |
| 18 to 24 Years | 0 (0.0%) | 10 (100.0%) |
| 25 to 34 Years | 25 (41.7%) | 0 (0.0%) |
| 35 to 44 Years | 0 (0.0%) | 0 (0.0%) |
| 45 to 54 Years | 0 (0.0%) | 0 (0.0%) |
| 55 to 64 Years | 0 (0.0%) | 16 (57.1%) |
| 65 to 74 Years | 16 (100.0%) | 0 (0.0%) |
| 75 Years and over | 10 (100.0%) | 0 (0.0%) |
| Total | 51 (37.5%) | 26 (28.0%) |
Income Above Poverty by Sex and Age in Vansant
According to the poverty statistics in Vansant, males aged 12 to 14 years and females aged under 5 years are the age groups that are most secure financially, with 100.0% of males and 100.0% of females in these age groups living above the poverty line.
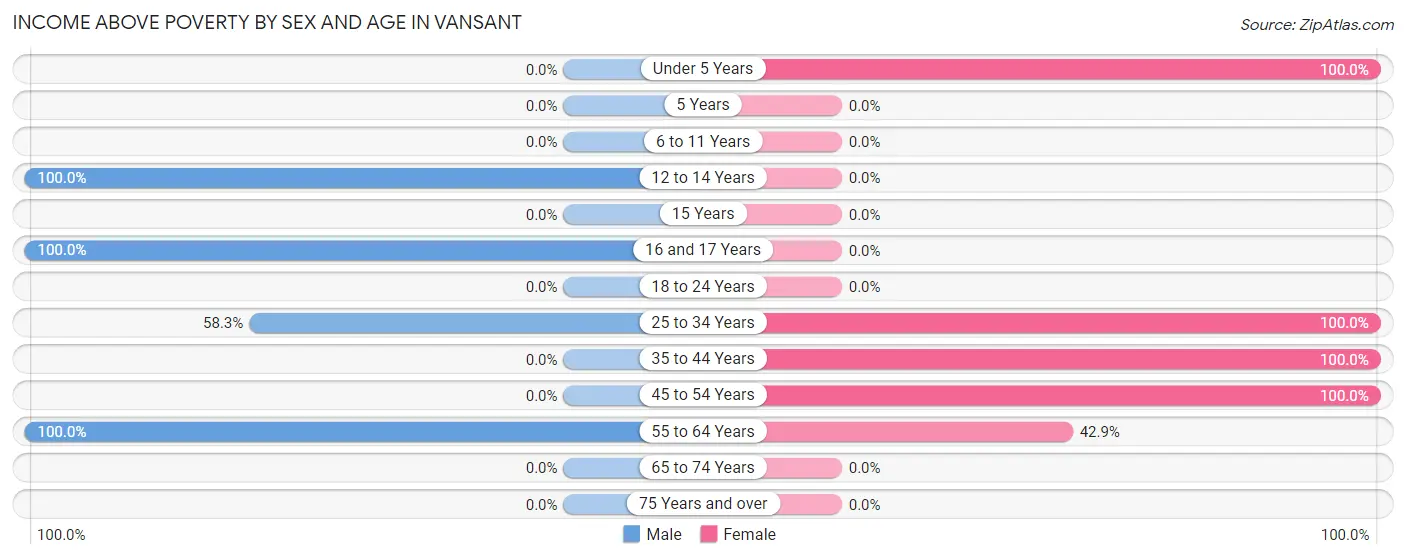
| Age Bracket | Male | Female |
| Under 5 Years | 0 (0.0%) | 19 (100.0%) |
| 5 Years | 0 (0.0%) | 0 (0.0%) |
| 6 to 11 Years | 0 (0.0%) | 0 (0.0%) |
| 12 to 14 Years | 16 (100.0%) | 0 (0.0%) |
| 15 Years | 0 (0.0%) | 0 (0.0%) |
| 16 and 17 Years | 17 (100.0%) | 0 (0.0%) |
| 18 to 24 Years | 0 (0.0%) | 0 (0.0%) |
| 25 to 34 Years | 35 (58.3%) | 9 (100.0%) |
| 35 to 44 Years | 0 (0.0%) | 9 (100.0%) |
| 45 to 54 Years | 0 (0.0%) | 18 (100.0%) |
| 55 to 64 Years | 17 (100.0%) | 12 (42.9%) |
| 65 to 74 Years | 0 (0.0%) | 0 (0.0%) |
| 75 Years and over | 0 (0.0%) | 0 (0.0%) |
| Total | 85 (62.5%) | 67 (72.0%) |
Income Below Poverty Among Married-Couple Families in Vansant
The poverty statistics for married-couple families in Vansant show that 48.5% or 16 of the total 33 families live below the poverty line. Families with no children have the highest poverty rate of 48.5%, comprising of 16 families. On the other hand, families with no children have the lowest poverty rate of 48.5%, which includes 16 families.
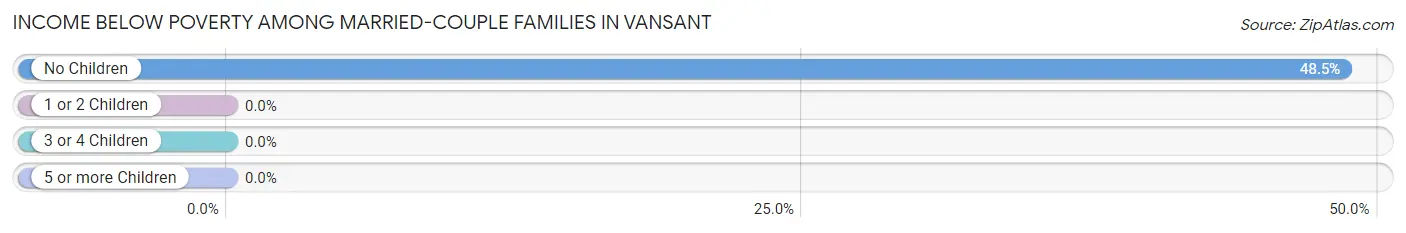
| Children | Above Poverty | Below Poverty |
| No Children | 17 (51.5%) | 16 (48.5%) |
| 1 or 2 Children | 0 (0.0%) | 0 (0.0%) |
| 3 or 4 Children | 0 (0.0%) | 0 (0.0%) |
| 5 or more Children | 0 (0.0%) | 0 (0.0%) |
| Total | 17 (51.5%) | 16 (48.5%) |
Income Below Poverty Among Single-Parent Households in Vansant
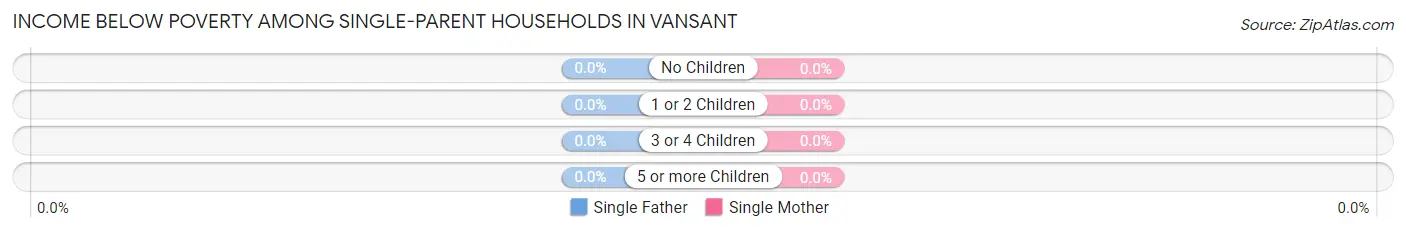
| Children | Single Father | Single Mother |
| No Children | 0 (0.0%) | 0 (0.0%) |
| 1 or 2 Children | 0 (0.0%) | 0 (0.0%) |
| 3 or 4 Children | 0 (0.0%) | 0 (0.0%) |
| 5 or more Children | 0 (0.0%) | 0 (0.0%) |
| Total | 0 (0.0%) | 0 (0.0%) |
Income Below Poverty Among Married-Couple vs Single-Parent Households in Vansant
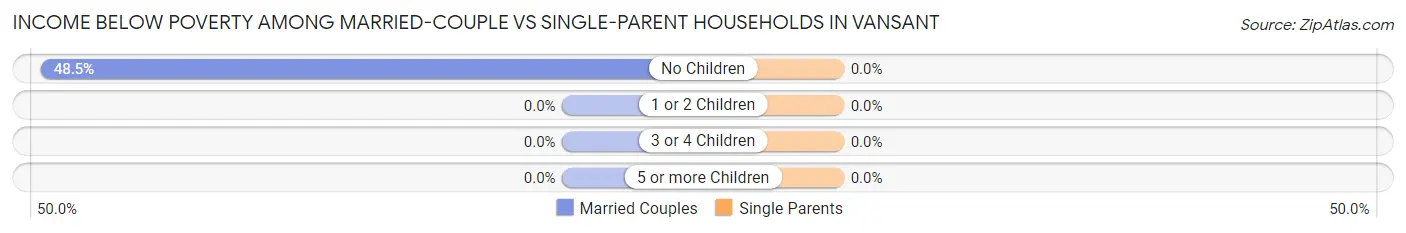
| Children | Married-Couple Families | Single-Parent Households |
| No Children | 16 (48.5%) | 0 (0.0%) |
| 1 or 2 Children | 0 (0.0%) | 0 (0.0%) |
| 3 or 4 Children | 0 (0.0%) | 0 (0.0%) |
| 5 or more Children | 0 (0.0%) | 0 (0.0%) |
| Total | 16 (48.5%) | 0 (0.0%) |
Race in Vansant
The most populous races in Vansant are White / Caucasian (194 | 84.7%), and Black / African American (35 | 15.3%).
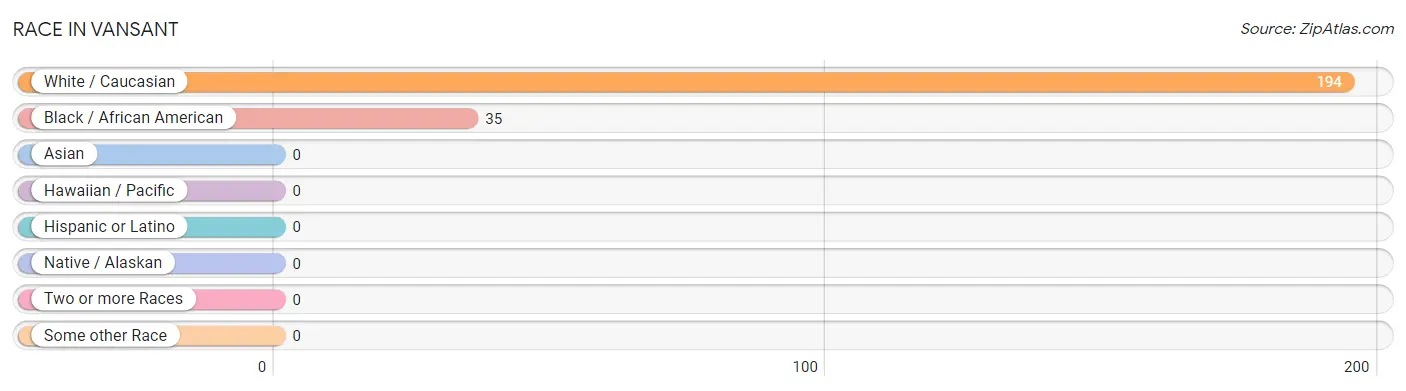
| Race | # Population | % Population |
| Asian | 0 | 0.0% |
| Black / African American | 35 | 15.3% |
| Hawaiian / Pacific | 0 | 0.0% |
| Hispanic or Latino | 0 | 0.0% |
| Native / Alaskan | 0 | 0.0% |
| White / Caucasian | 194 | 84.7% |
| Two or more Races | 0 | 0.0% |
| Some other Race | 0 | 0.0% |
| Total | 229 | 100.0% |
Ancestry in Vansant
The most populous ancestries reported in Vansant are American (177 | 77.3%), Arab (32 | 14.0%), Lebanese (32 | 14.0%), Ghanaian (10 | 4.4%), and Scotch-Irish (10 | 4.4%), together accounting for 114.0% of all Vansant residents.
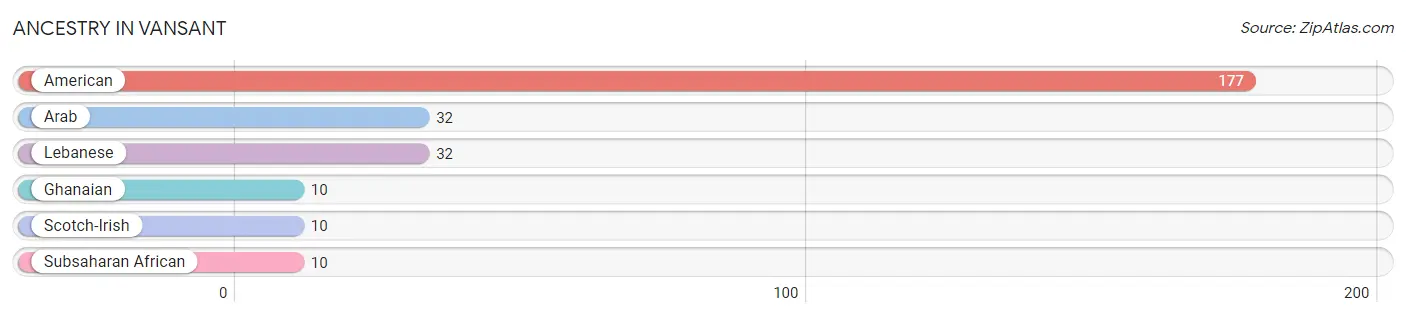
| Ancestry | # Population | % Population |
| American | 177 | 77.3% |
| Arab | 32 | 14.0% |
| Ghanaian | 10 | 4.4% |
| Lebanese | 32 | 14.0% |
| Scotch-Irish | 10 | 4.4% |
| Subsaharan African | 10 | 4.4% | View All 6 Rows |
Immigrants in Vansant
The most numerous immigrant groups reported in Vansant came from Asia (32 | 14.0%), Lebanon (32 | 14.0%), Western Asia (32 | 14.0%), Africa (10 | 4.4%), and Ghana (10 | 4.4%), together accounting for 50.6% of all Vansant residents.
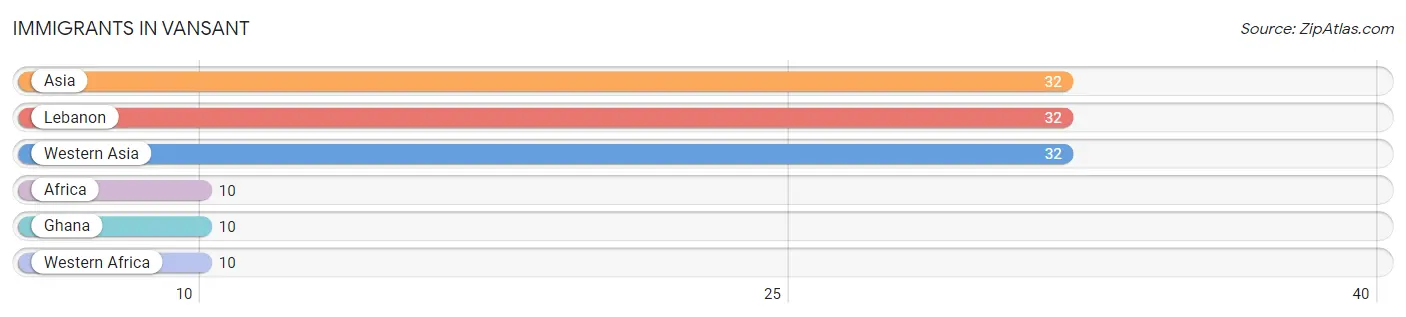
| Immigration Origin | # Population | % Population |
| Africa | 10 | 4.4% |
| Asia | 32 | 14.0% |
| Ghana | 10 | 4.4% |
| Lebanon | 32 | 14.0% |
| Western Africa | 10 | 4.4% |
| Western Asia | 32 | 14.0% | View All 6 Rows |
Sex and Age in Vansant
Sex and Age in Vansant
The most populous age groups in Vansant are 25 to 29 Years (60 | 44.1%) for men and 55 to 59 Years (28 | 30.1%) for women.
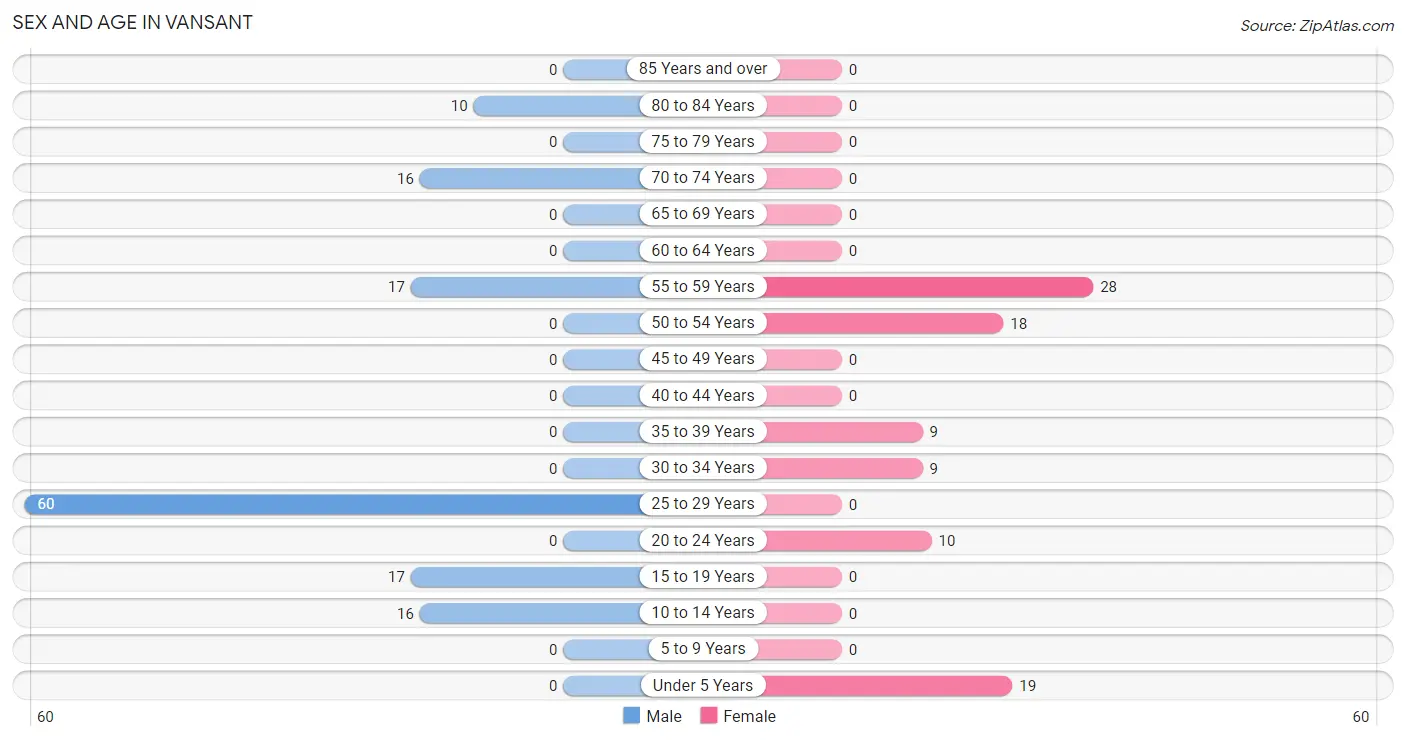
| Age Bracket | Male | Female |
| Under 5 Years | 0 (0.0%) | 19 (20.4%) |
| 5 to 9 Years | 0 (0.0%) | 0 (0.0%) |
| 10 to 14 Years | 16 (11.8%) | 0 (0.0%) |
| 15 to 19 Years | 17 (12.5%) | 0 (0.0%) |
| 20 to 24 Years | 0 (0.0%) | 10 (10.7%) |
| 25 to 29 Years | 60 (44.1%) | 0 (0.0%) |
| 30 to 34 Years | 0 (0.0%) | 9 (9.7%) |
| 35 to 39 Years | 0 (0.0%) | 9 (9.7%) |
| 40 to 44 Years | 0 (0.0%) | 0 (0.0%) |
| 45 to 49 Years | 0 (0.0%) | 0 (0.0%) |
| 50 to 54 Years | 0 (0.0%) | 18 (19.4%) |
| 55 to 59 Years | 17 (12.5%) | 28 (30.1%) |
| 60 to 64 Years | 0 (0.0%) | 0 (0.0%) |
| 65 to 69 Years | 0 (0.0%) | 0 (0.0%) |
| 70 to 74 Years | 16 (11.8%) | 0 (0.0%) |
| 75 to 79 Years | 0 (0.0%) | 0 (0.0%) |
| 80 to 84 Years | 10 (7.3%) | 0 (0.0%) |
| 85 Years and over | 0 (0.0%) | 0 (0.0%) |
| Total | 136 (100.0%) | 93 (100.0%) |
Families and Households in Vansant
Median Family Size in Vansant
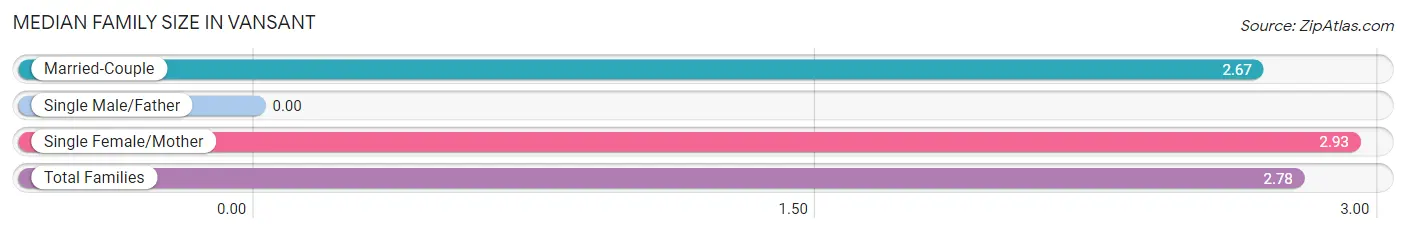
| Family Type | # Families | Family Size |
| Married-Couple | 33 (55.0%) | 2.67 |
| Single Male/Father | 0 (0.0%) | - |
| Single Female/Mother | 27 (45.0%) | 2.93 |
| Total Families | 60 (100.0%) | 2.78 |
Median Household Size in Vansant
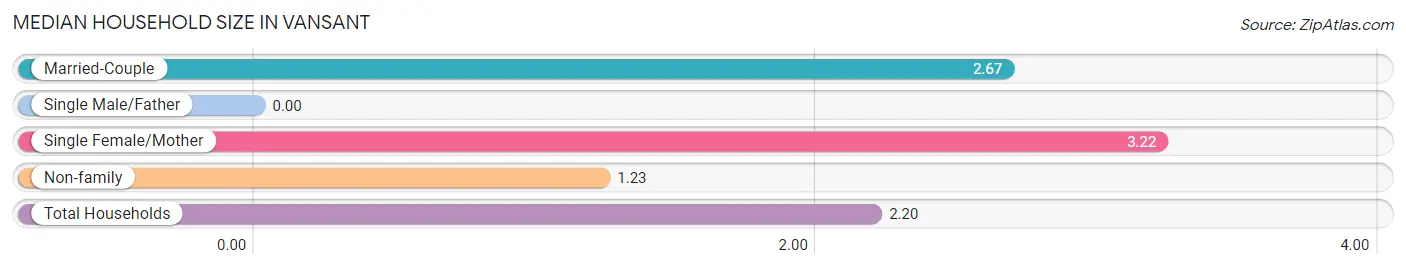
| Household Type | # Households | Household Size |
| Married-Couple | 33 (31.7%) | 2.67 |
| Single Male/Father | 0 (0.0%) | - |
| Single Female/Mother | 27 (26.0%) | 3.22 |
| Non-family | 44 (42.3%) | 1.23 |
| Total Households | 104 (100.0%) | 2.20 |
Household Size by Marriage Status in Vansant
Out of a total of 104 households in Vansant, 60 (57.7%) are family households, while 44 (42.3%) are nonfamily households. The most numerous type of family households are 3-person households, comprising 35, and the most common type of nonfamily households are 1-person households, comprising 29.
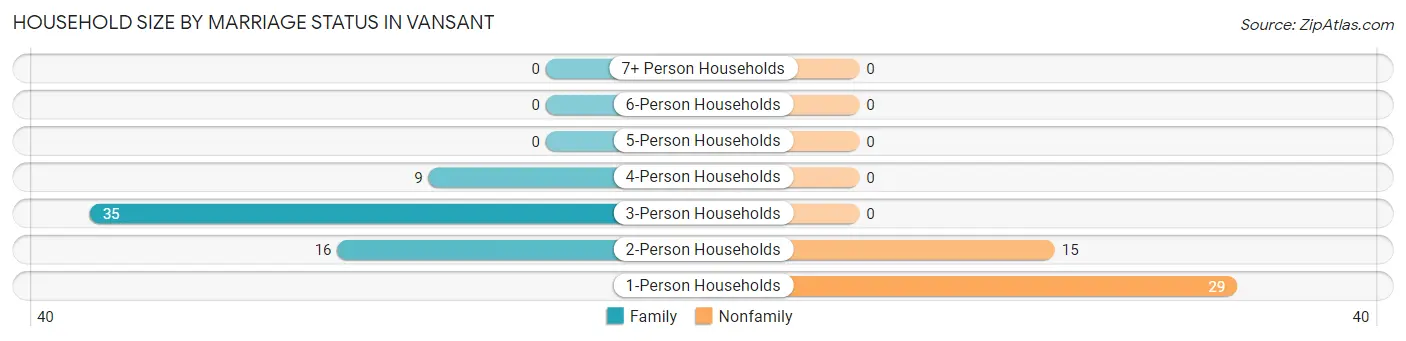
| Household Size | Family Households | Nonfamily Households |
| 1-Person Households | - | 29 (27.9%) |
| 2-Person Households | 16 (15.4%) | 15 (14.4%) |
| 3-Person Households | 35 (33.7%) | 0 (0.0%) |
| 4-Person Households | 9 (8.6%) | 0 (0.0%) |
| 5-Person Households | 0 (0.0%) | 0 (0.0%) |
| 6-Person Households | 0 (0.0%) | 0 (0.0%) |
| 7+ Person Households | 0 (0.0%) | 0 (0.0%) |
| Total | 60 (57.7%) | 44 (42.3%) |
Female Fertility in Vansant
Fertility by Age in Vansant
| Age Bracket | Women with Births | Births / 1,000 Women |
| 15 to 19 years | 0 (0.0%) | 0.0 |
| 20 to 34 years | 0 (0.0%) | 0.0 |
| 35 to 50 years | 0 (0.0%) | 0.0 |
| Total | 0 (0.0%) | 0.0 |
Fertility by Age by Marriage Status in Vansant
| Age Bracket | Married | Unmarried |
| 15 to 19 years | 0 (0.0%) | 0 (0.0%) |
| 20 to 34 years | 0 (0.0%) | 0 (0.0%) |
| 35 to 50 years | 0 (0.0%) | 0 (0.0%) |
| Total | 0 (0.0%) | 0 (0.0%) |
Fertility by Education in Vansant
| Educational Attainment | Women with Births | Births / 1,000 Women |
| Less than High School | 0 (0.0%) | 0.0 |
| High School Diploma | 0 (0.0%) | 0.0 |
| College or Associate's Degree | 0 (0.0%) | 0.0 |
| Bachelor's Degree | 0 (0.0%) | 0.0 |
| Graduate Degree | 0 (0.0%) | 0.0 |
| Total | 0 (0.0%) | 0.0 |
Fertility by Education by Marriage Status in Vansant
| Educational Attainment | Married | Unmarried |
| Less than High School | 0 (0.0%) | 0 (0.0%) |
| High School Diploma | 0 (0.0%) | 0 (0.0%) |
| College or Associate's Degree | 0 (0.0%) | 0 (0.0%) |
| Bachelor's Degree | 0 (0.0%) | 0 (0.0%) |
| Graduate Degree | 0 (0.0%) | 0 (0.0%) |
| Total | 0 (0.0%) | 0 (0.0%) |
Employment Characteristics in Vansant
Employment by Class of Employer in Vansant
Among the 101 employed individuals in Vansant, private company employees (66 | 65.3%), local government employees (25 | 24.7%), and not-for-profit organizations (10 | 9.9%) make up the most common classes of employment.
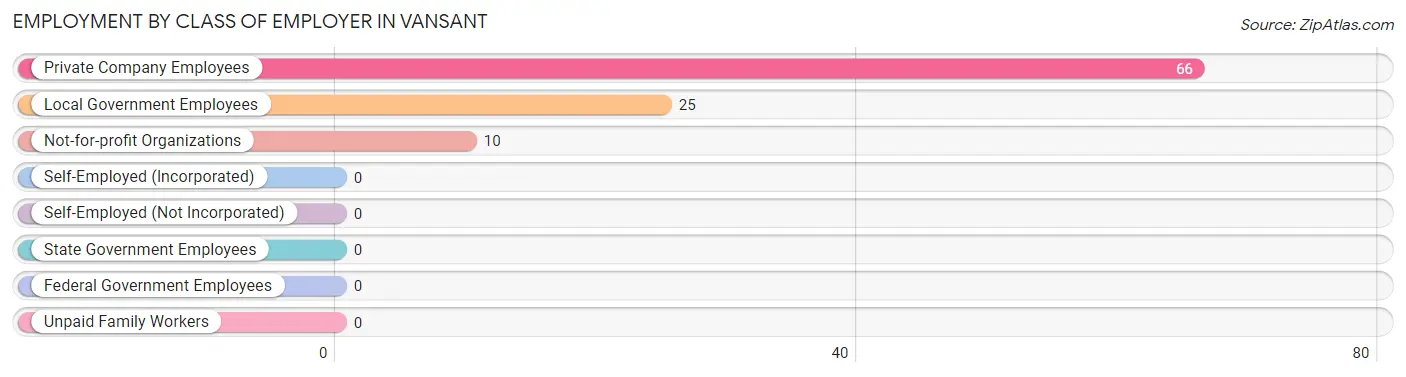
| Employer Class | # Employees | % Employees |
| Private Company Employees | 66 | 65.3% |
| Self-Employed (Incorporated) | 0 | 0.0% |
| Self-Employed (Not Incorporated) | 0 | 0.0% |
| Not-for-profit Organizations | 10 | 9.9% |
| Local Government Employees | 25 | 24.7% |
| State Government Employees | 0 | 0.0% |
| Federal Government Employees | 0 | 0.0% |
| Unpaid Family Workers | 0 | 0.0% |
| Total | 101 | 100.0% |
Employment Status by Age in Vansant
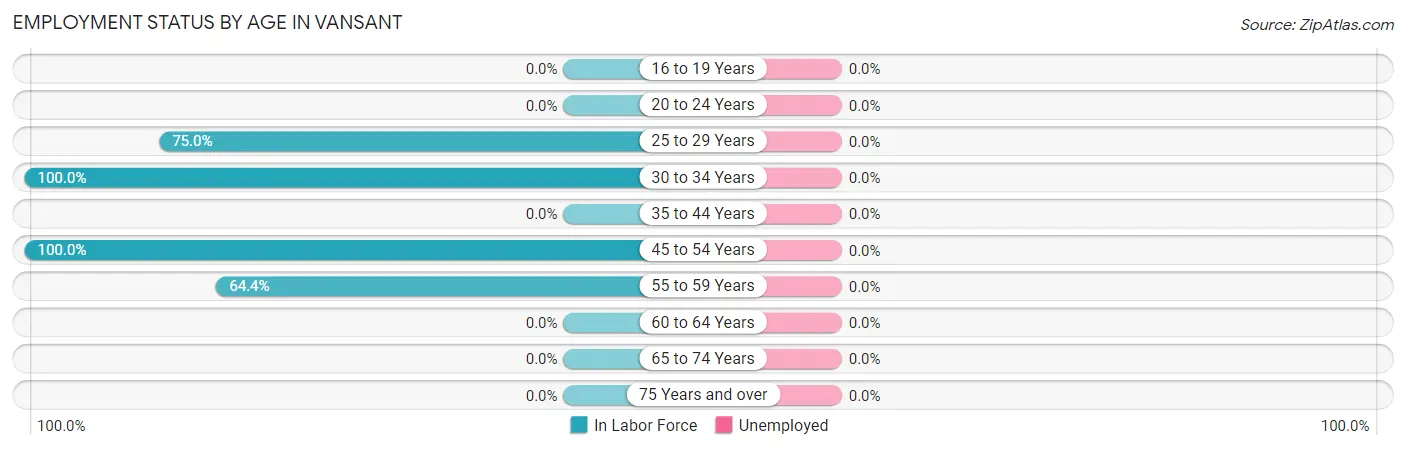
| Age Bracket | In Labor Force | Unemployed |
| 16 to 19 Years | 0 (0.0%) | 0 (0.0%) |
| 20 to 24 Years | 0 (0.0%) | 0 (0.0%) |
| 25 to 29 Years | 45 (75.0%) | 0 (0.0%) |
| 30 to 34 Years | 9 (100.0%) | 0 (0.0%) |
| 35 to 44 Years | 0 (0.0%) | 0 (0.0%) |
| 45 to 54 Years | 18 (100.0%) | 0 (0.0%) |
| 55 to 59 Years | 29 (64.4%) | 0 (0.0%) |
| 60 to 64 Years | 0 (0.0%) | 0 (0.0%) |
| 65 to 74 Years | 0 (0.0%) | 0 (0.0%) |
| 75 Years and over | 0 (0.0%) | 0 (0.0%) |
| Total | 101 (52.1%) | 0 (0.0%) |
Employment Status by Educational Attainment in Vansant
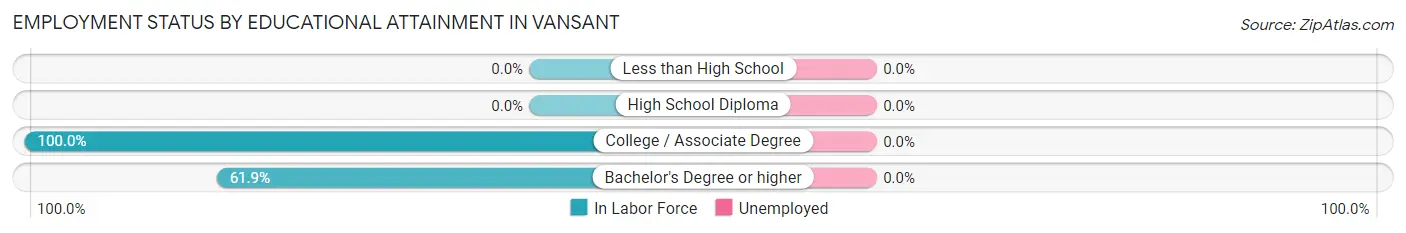
| Educational Attainment | In Labor Force | Unemployed |
| Less than High School | 0 (0.0%) | 0 (0.0%) |
| High School Diploma | 0 (0.0%) | 0 (0.0%) |
| College / Associate Degree | 62 (100.0%) | 0 (0.0%) |
| Bachelor's Degree or higher | 39 (61.9%) | 0 (0.0%) |
| Total | 101 (71.6%) | 0 (0.0%) |
Employment Occupations by Sex in Vansant
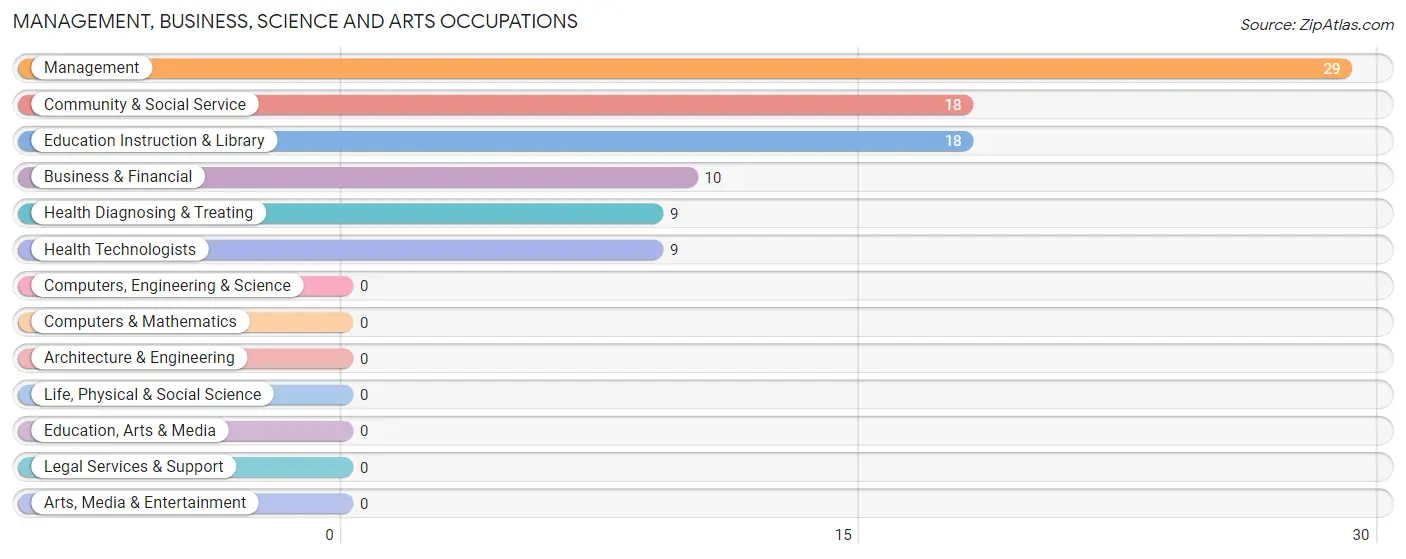
Management, Business, Science and Arts Occupations
The most common Management, Business, Science and Arts occupations in Vansant are Management (29 | 28.7%), Community & Social Service (18 | 17.8%), Education Instruction & Library (18 | 17.8%), Business & Financial (10 | 9.9%), and Health Diagnosing & Treating (9 | 8.9%).
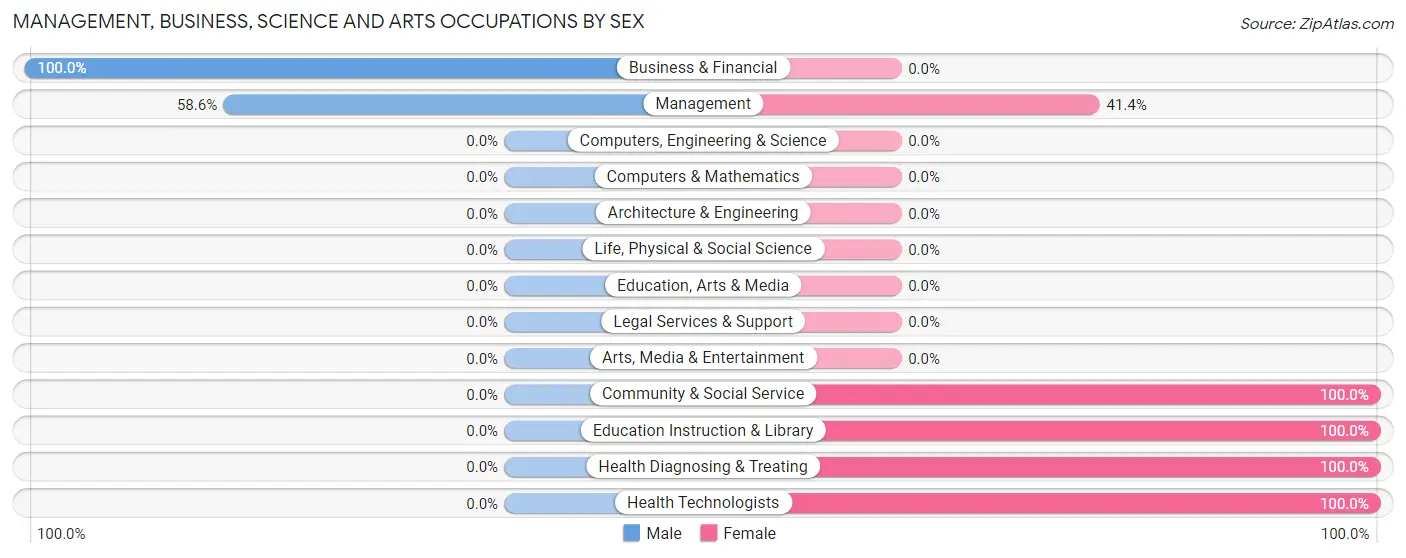
Management, Business, Science and Arts Occupations by Sex
Within the Management, Business, Science and Arts occupations in Vansant, the most male-oriented occupations are Business & Financial (100.0%), and Management (58.6%), while the most female-oriented occupations are Community & Social Service (100.0%), Education Instruction & Library (100.0%), and Health Diagnosing & Treating (100.0%).
| Occupation | Male | Female |
| Management | 17 (58.6%) | 12 (41.4%) |
| Business & Financial | 10 (100.0%) | 0 (0.0%) |
| Computers, Engineering & Science | 0 (0.0%) | 0 (0.0%) |
| Computers & Mathematics | 0 (0.0%) | 0 (0.0%) |
| Architecture & Engineering | 0 (0.0%) | 0 (0.0%) |
| Life, Physical & Social Science | 0 (0.0%) | 0 (0.0%) |
| Community & Social Service | 0 (0.0%) | 18 (100.0%) |
| Education, Arts & Media | 0 (0.0%) | 0 (0.0%) |
| Legal Services & Support | 0 (0.0%) | 0 (0.0%) |
| Education Instruction & Library | 0 (0.0%) | 18 (100.0%) |
| Arts, Media & Entertainment | 0 (0.0%) | 0 (0.0%) |
| Health Diagnosing & Treating | 0 (0.0%) | 9 (100.0%) |
| Health Technologists | 0 (0.0%) | 9 (100.0%) |
| Total (Category) | 27 (40.9%) | 39 (59.1%) |
| Total (Overall) | 62 (61.4%) | 39 (38.6%) |
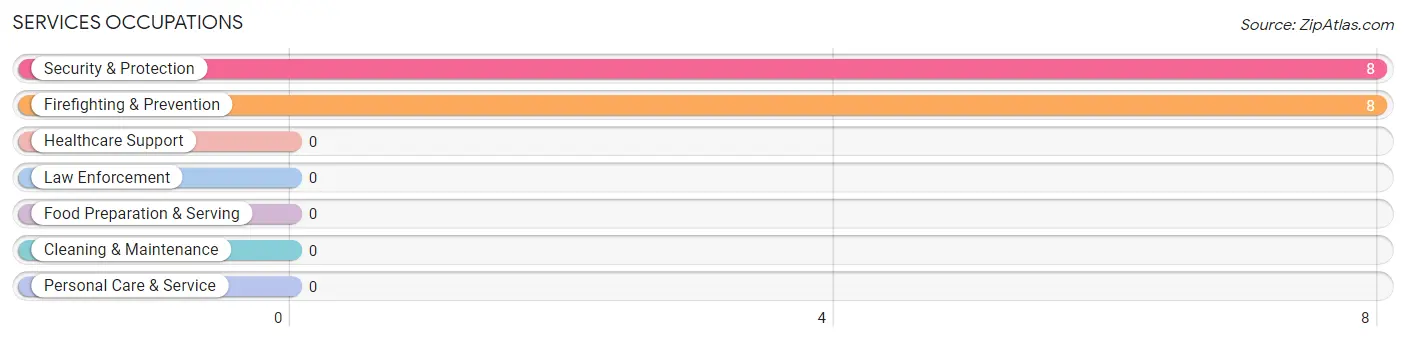
Services Occupations
The most common Services occupations in Vansant are Security & Protection (8 | 7.9%), and Firefighting & Prevention (8 | 7.9%).
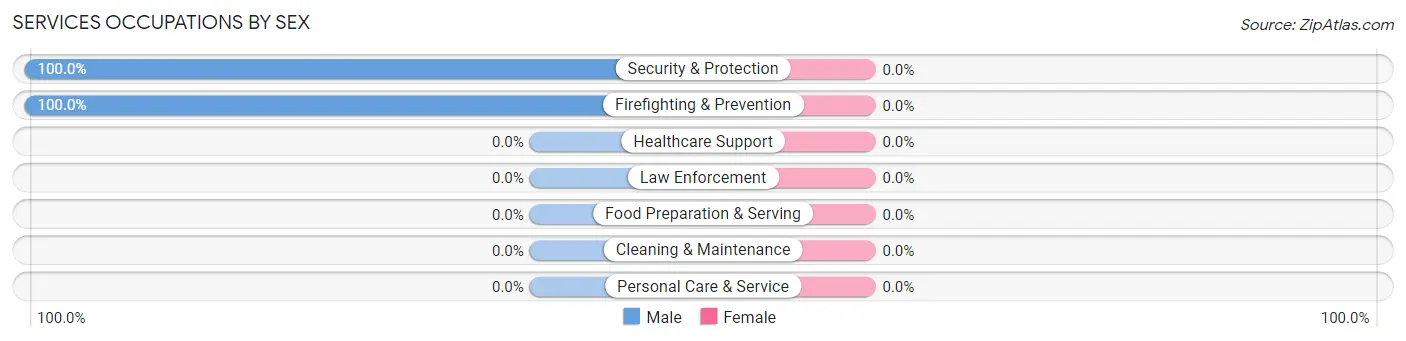
Services Occupations by Sex
| Occupation | Male | Female |
| Healthcare Support | 0 (0.0%) | 0 (0.0%) |
| Security & Protection | 8 (100.0%) | 0 (0.0%) |
| Firefighting & Prevention | 8 (100.0%) | 0 (0.0%) |
| Law Enforcement | 0 (0.0%) | 0 (0.0%) |
| Food Preparation & Serving | 0 (0.0%) | 0 (0.0%) |
| Cleaning & Maintenance | 0 (0.0%) | 0 (0.0%) |
| Personal Care & Service | 0 (0.0%) | 0 (0.0%) |
| Total (Category) | 8 (100.0%) | 0 (0.0%) |
| Total (Overall) | 62 (61.4%) | 39 (38.6%) |
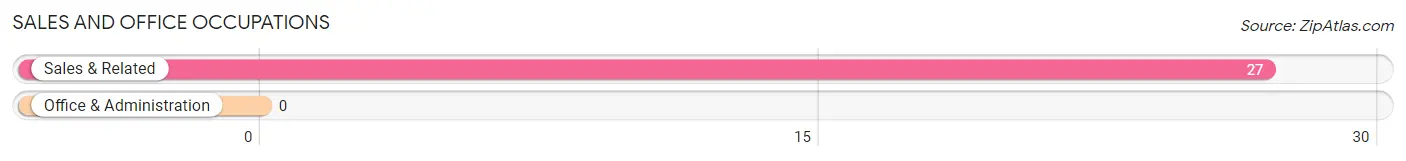
Sales and Office Occupations
The most common Sales and Office occupations in Vansant are , and Sales & Related (27 | 26.7%).
Sales and Office Occupations by Sex
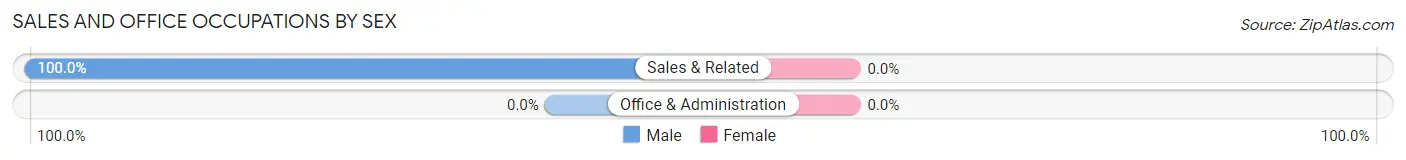
| Occupation | Male | Female |
| Sales & Related | 27 (100.0%) | 0 (0.0%) |
| Office & Administration | 0 (0.0%) | 0 (0.0%) |
| Total (Category) | 27 (100.0%) | 0 (0.0%) |
| Total (Overall) | 62 (61.4%) | 39 (38.6%) |
Natural Resources, Construction and Maintenance Occupations
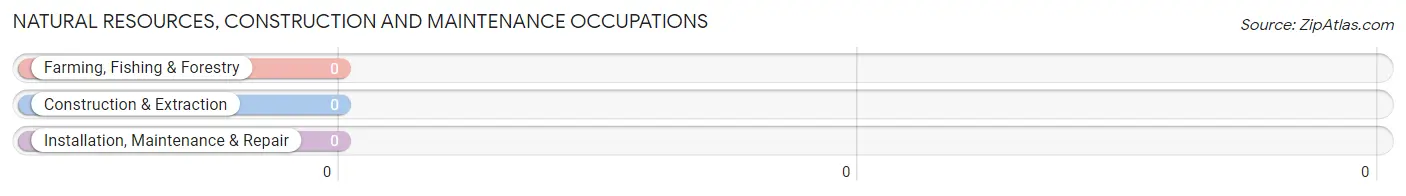
Natural Resources, Construction and Maintenance Occupations by Sex
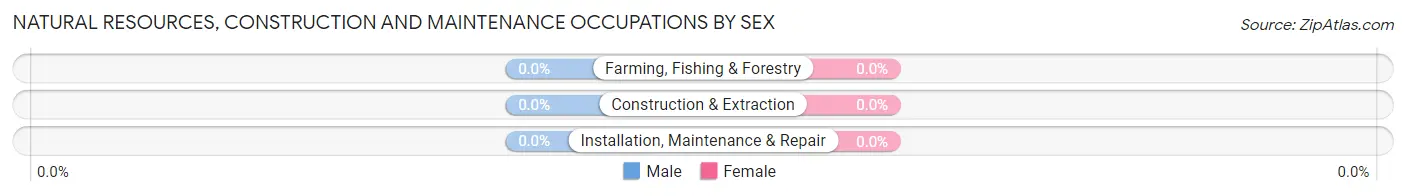
| Occupation | Male | Female |
| Farming, Fishing & Forestry | 0 (0.0%) | 0 (0.0%) |
| Construction & Extraction | 0 (0.0%) | 0 (0.0%) |
| Installation, Maintenance & Repair | 0 (0.0%) | 0 (0.0%) |
| Total (Category) | 0 (0.0%) | 0 (0.0%) |
| Total (Overall) | 62 (61.4%) | 39 (38.6%) |
Production, Transportation and Moving Occupations
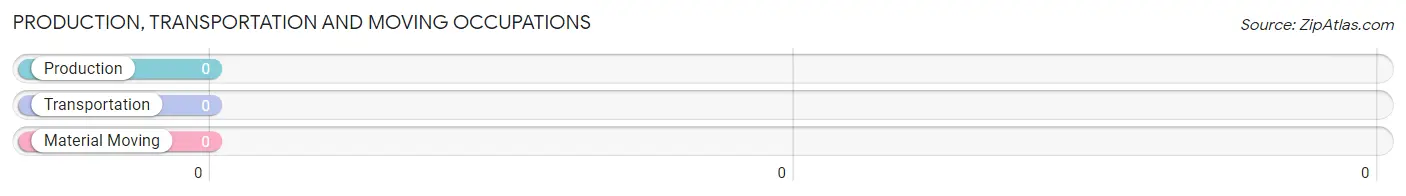
Production, Transportation and Moving Occupations by Sex
| Occupation | Male | Female |
| Production | 0 (0.0%) | 0 (0.0%) |
| Transportation | 0 (0.0%) | 0 (0.0%) |
| Material Moving | 0 (0.0%) | 0 (0.0%) |
| Total (Category) | 0 (0.0%) | 0 (0.0%) |
| Total (Overall) | 62 (61.4%) | 39 (38.6%) |
Employment Industries by Sex in Vansant
Employment Industries in Vansant
The major employment industries in Vansant include Retail Trade (27 | 26.7%), Health Care & Social Assistance (27 | 26.7%), Educational Services (17 | 16.8%), Mining, Quarrying, & Extraction (12 | 11.9%), and Professional & Scientific (10 | 9.9%).
Employment Industries by Sex in Vansant
The Vansant industries that see more men than women are Retail Trade (100.0%), Professional & Scientific (100.0%), and Educational Services (100.0%), whereas the industries that tend to have a higher number of women are Mining, Quarrying, & Extraction (100.0%), and Health Care & Social Assistance (100.0%).
| Industry | Male | Female |
| Agriculture, Fishing & Hunting | 0 (0.0%) | 0 (0.0%) |
| Mining, Quarrying, & Extraction | 0 (0.0%) | 12 (100.0%) |
| Construction | 0 (0.0%) | 0 (0.0%) |
| Manufacturing | 0 (0.0%) | 0 (0.0%) |
| Wholesale Trade | 0 (0.0%) | 0 (0.0%) |
| Retail Trade | 27 (100.0%) | 0 (0.0%) |
| Transportation & Warehousing | 0 (0.0%) | 0 (0.0%) |
| Utilities | 0 (0.0%) | 0 (0.0%) |
| Information | 0 (0.0%) | 0 (0.0%) |
| Finance & Insurance | 0 (0.0%) | 0 (0.0%) |
| Real Estate, Rental & Leasing | 0 (0.0%) | 0 (0.0%) |
| Professional & Scientific | 10 (100.0%) | 0 (0.0%) |
| Enterprise Management | 0 (0.0%) | 0 (0.0%) |
| Administrative & Support | 0 (0.0%) | 0 (0.0%) |
| Educational Services | 17 (100.0%) | 0 (0.0%) |
| Health Care & Social Assistance | 0 (0.0%) | 27 (100.0%) |
| Arts, Entertainment & Recreation | 0 (0.0%) | 0 (0.0%) |
| Accommodation & Food Services | 0 (0.0%) | 0 (0.0%) |
| Public Administration | 8 (100.0%) | 0 (0.0%) |
| Total | 62 (61.4%) | 39 (38.6%) |
Education in Vansant
School Enrollment in Vansant
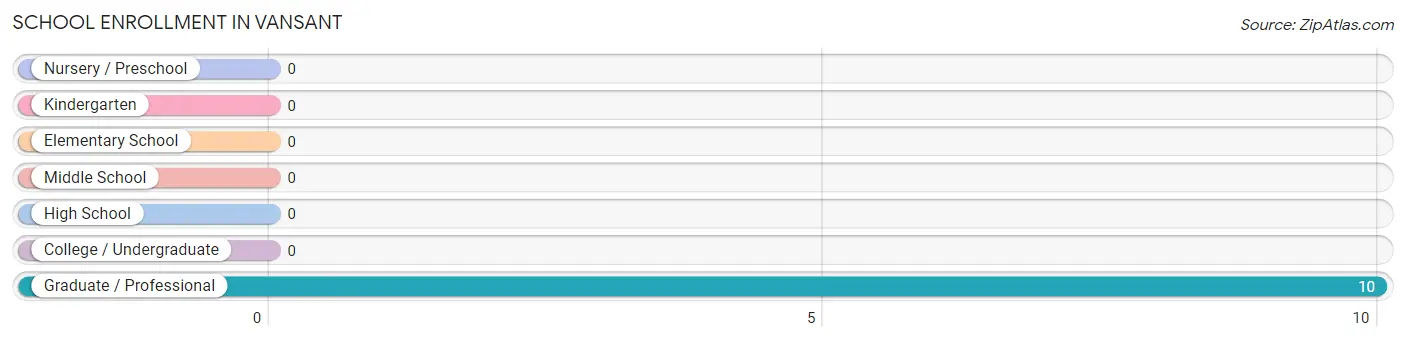
| School Level | # Students | % Students |
| Nursery / Preschool | 0 | 0.0% |
| Kindergarten | 0 | 0.0% |
| Elementary School | 0 | 0.0% |
| Middle School | 0 | 0.0% |
| High School | 0 | 0.0% |
| College / Undergraduate | 0 | 0.0% |
| Graduate / Professional | 10 | 100.0% |
| Total | 10 | 100.0% |
School Enrollment by Age by Funding Source in Vansant
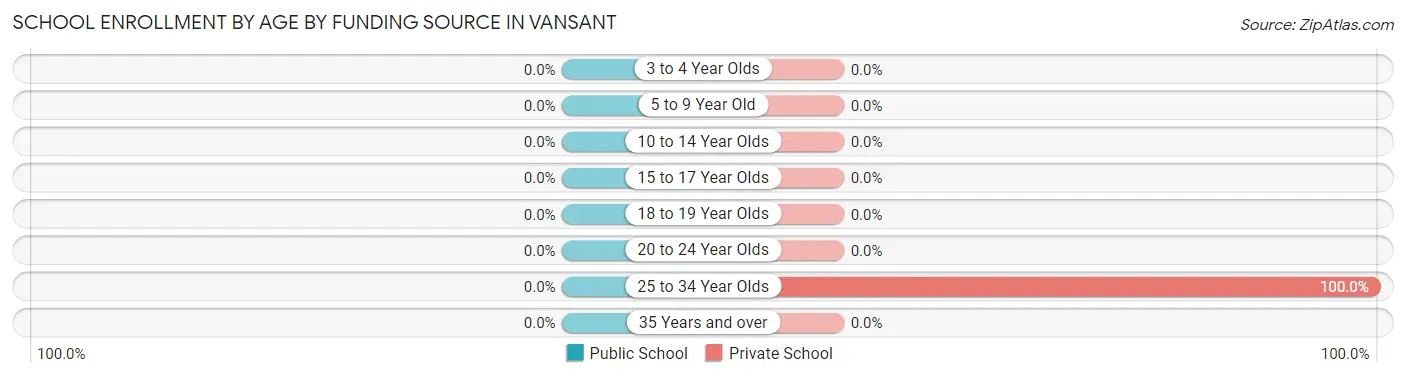
| Age Bracket | Public School | Private School |
| 3 to 4 Year Olds | 0 (0.0%) | 0 (0.0%) |
| 5 to 9 Year Old | 0 (0.0%) | 0 (0.0%) |
| 10 to 14 Year Olds | 0 (0.0%) | 0 (0.0%) |
| 15 to 17 Year Olds | 0 (0.0%) | 0 (0.0%) |
| 18 to 19 Year Olds | 0 (0.0%) | 0 (0.0%) |
| 20 to 24 Year Olds | 0 (0.0%) | 0 (0.0%) |
| 25 to 34 Year Olds | 0 (0.0%) | 10 (100.0%) |
| 35 Years and over | 0 (0.0%) | 0 (0.0%) |
| Total | 0 (0.0%) | 10 (100.0%) |
Educational Attainment by Field of Study in Vansant
Business (43 | 45.7%), education (17 | 18.1%), psychology (15 | 16.0%), science & technology (10 | 10.6%), and literature & languages (9 | 9.6%) are the most common fields of study among 94 individuals in Vansant who have obtained a bachelor's degree or higher.
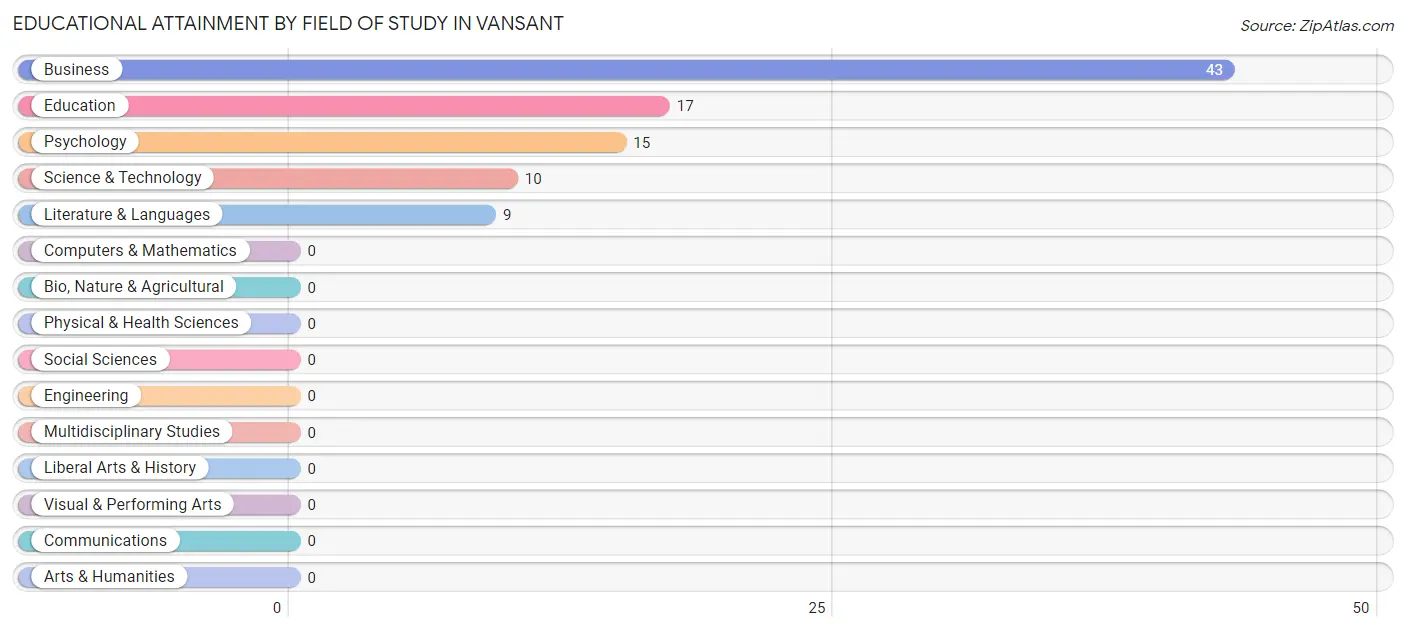
| Field of Study | # Graduates | % Graduates |
| Computers & Mathematics | 0 | 0.0% |
| Bio, Nature & Agricultural | 0 | 0.0% |
| Physical & Health Sciences | 0 | 0.0% |
| Psychology | 15 | 16.0% |
| Social Sciences | 0 | 0.0% |
| Engineering | 0 | 0.0% |
| Multidisciplinary Studies | 0 | 0.0% |
| Science & Technology | 10 | 10.6% |
| Business | 43 | 45.7% |
| Education | 17 | 18.1% |
| Literature & Languages | 9 | 9.6% |
| Liberal Arts & History | 0 | 0.0% |
| Visual & Performing Arts | 0 | 0.0% |
| Communications | 0 | 0.0% |
| Arts & Humanities | 0 | 0.0% |
| Total | 94 | 100.0% |
Transportation & Commute in Vansant
Vehicle Availability by Sex in Vansant
The most prevalent vehicle ownership categories in Vansant are males with 3 vehicles (44, accounting for 71.0%) and females with 3 vehicles (12, making up 112.8%).
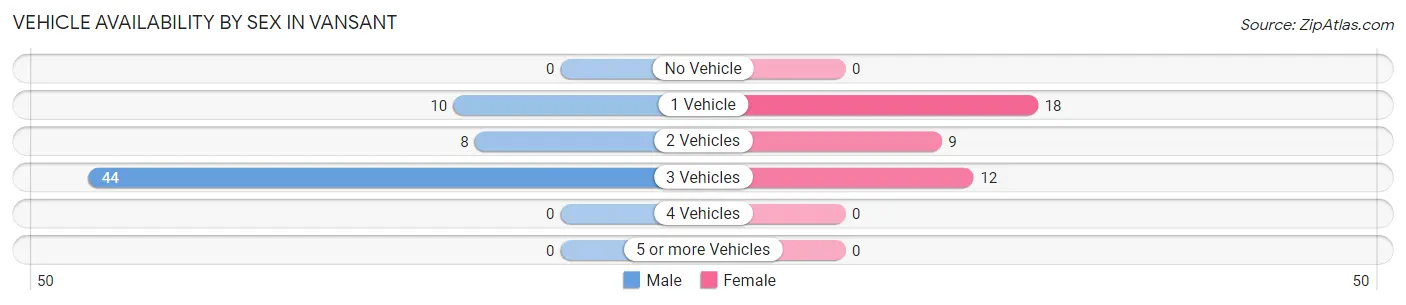
| Vehicles Available | Male | Female |
| No Vehicle | 0 (0.0%) | 0 (0.0%) |
| 1 Vehicle | 10 (16.1%) | 18 (46.2%) |
| 2 Vehicles | 8 (12.9%) | 9 (23.1%) |
| 3 Vehicles | 44 (71.0%) | 12 (30.8%) |
| 4 Vehicles | 0 (0.0%) | 0 (0.0%) |
| 5 or more Vehicles | 0 (0.0%) | 0 (0.0%) |
| Total | 62 (100.0%) | 39 (100.0%) |
Commute Time in Vansant
The most frequently occuring commute durations in Vansant are 5 to 9 minutes (55 commuters, 54.5%), 40 to 44 minutes (21 commuters, 20.8%), and 20 to 24 minutes (17 commuters, 16.8%).
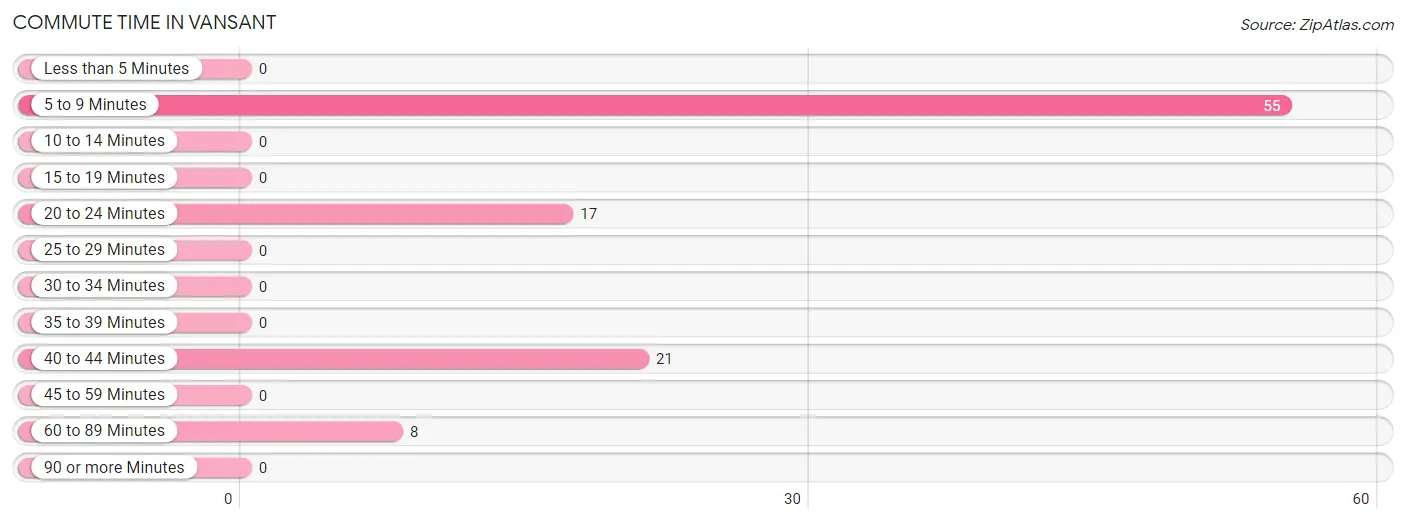
| Commute Time | # Commuters | % Commuters |
| Less than 5 Minutes | 0 | 0.0% |
| 5 to 9 Minutes | 55 | 54.5% |
| 10 to 14 Minutes | 0 | 0.0% |
| 15 to 19 Minutes | 0 | 0.0% |
| 20 to 24 Minutes | 17 | 16.8% |
| 25 to 29 Minutes | 0 | 0.0% |
| 30 to 34 Minutes | 0 | 0.0% |
| 35 to 39 Minutes | 0 | 0.0% |
| 40 to 44 Minutes | 21 | 20.8% |
| 45 to 59 Minutes | 0 | 0.0% |
| 60 to 89 Minutes | 8 | 7.9% |
| 90 or more Minutes | 0 | 0.0% |
Commute Time by Sex in Vansant
The most common commute times in Vansant are 5 to 9 minutes (37 commuters, 59.7%) for males and 40 to 44 minutes (21 commuters, 53.8%) for females.
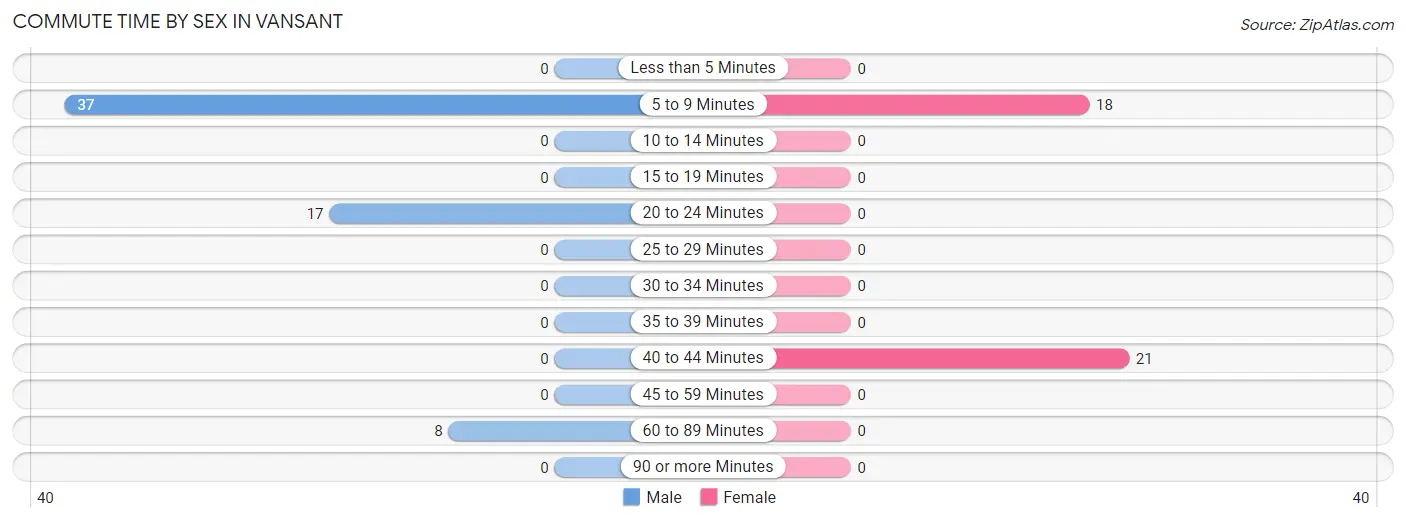
| Commute Time | Male | Female |
| Less than 5 Minutes | 0 (0.0%) | 0 (0.0%) |
| 5 to 9 Minutes | 37 (59.7%) | 18 (46.2%) |
| 10 to 14 Minutes | 0 (0.0%) | 0 (0.0%) |
| 15 to 19 Minutes | 0 (0.0%) | 0 (0.0%) |
| 20 to 24 Minutes | 17 (27.4%) | 0 (0.0%) |
| 25 to 29 Minutes | 0 (0.0%) | 0 (0.0%) |
| 30 to 34 Minutes | 0 (0.0%) | 0 (0.0%) |
| 35 to 39 Minutes | 0 (0.0%) | 0 (0.0%) |
| 40 to 44 Minutes | 0 (0.0%) | 21 (53.8%) |
| 45 to 59 Minutes | 0 (0.0%) | 0 (0.0%) |
| 60 to 89 Minutes | 8 (12.9%) | 0 (0.0%) |
| 90 or more Minutes | 0 (0.0%) | 0 (0.0%) |
Time of Departure to Work by Sex in Vansant
The most frequent times of departure to work in Vansant are 7:30 AM to 7:59 AM (54, 87.1%) for males and 8:00 AM to 8:29 AM (27, 69.2%) for females.
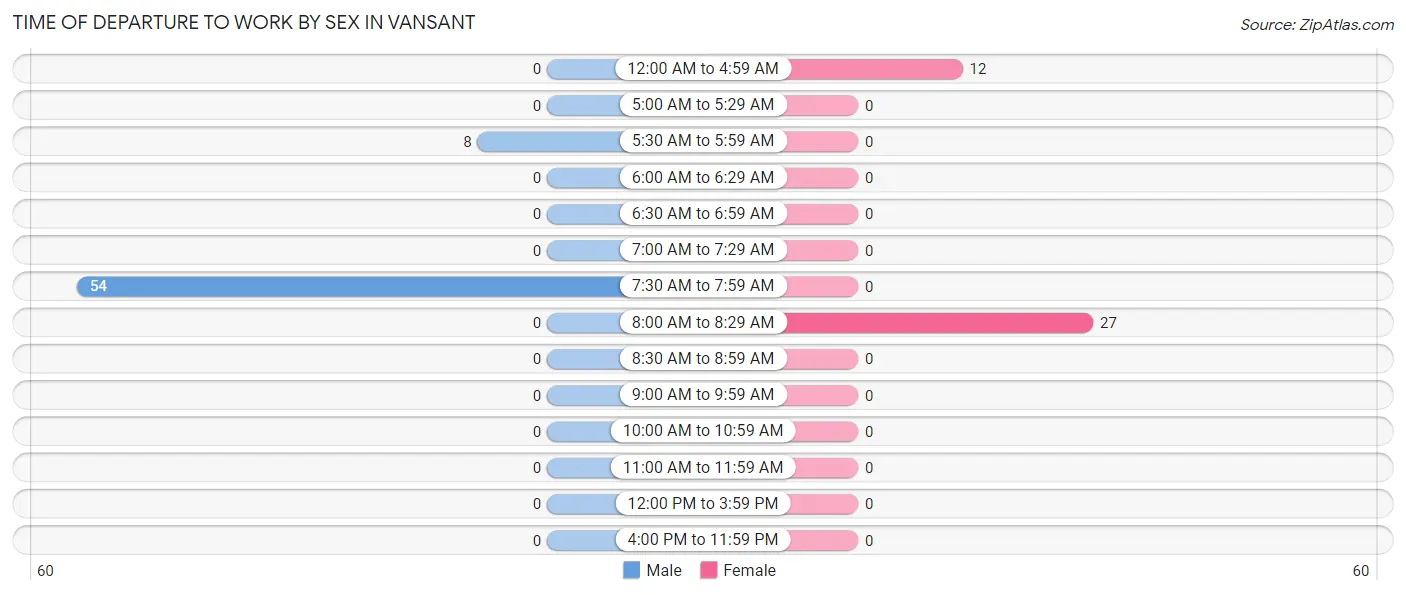
| Time of Departure | Male | Female |
| 12:00 AM to 4:59 AM | 0 (0.0%) | 12 (30.8%) |
| 5:00 AM to 5:29 AM | 0 (0.0%) | 0 (0.0%) |
| 5:30 AM to 5:59 AM | 8 (12.9%) | 0 (0.0%) |
| 6:00 AM to 6:29 AM | 0 (0.0%) | 0 (0.0%) |
| 6:30 AM to 6:59 AM | 0 (0.0%) | 0 (0.0%) |
| 7:00 AM to 7:29 AM | 0 (0.0%) | 0 (0.0%) |
| 7:30 AM to 7:59 AM | 54 (87.1%) | 0 (0.0%) |
| 8:00 AM to 8:29 AM | 0 (0.0%) | 27 (69.2%) |
| 8:30 AM to 8:59 AM | 0 (0.0%) | 0 (0.0%) |
| 9:00 AM to 9:59 AM | 0 (0.0%) | 0 (0.0%) |
| 10:00 AM to 10:59 AM | 0 (0.0%) | 0 (0.0%) |
| 11:00 AM to 11:59 AM | 0 (0.0%) | 0 (0.0%) |
| 12:00 PM to 3:59 PM | 0 (0.0%) | 0 (0.0%) |
| 4:00 PM to 11:59 PM | 0 (0.0%) | 0 (0.0%) |
| Total | 62 (100.0%) | 39 (100.0%) |
Housing Occupancy in Vansant
Occupancy by Ownership in Vansant
Of the total 104 dwellings in Vansant, owner-occupied units account for 52 (50.0%), while renter-occupied units make up 52 (50.0%).
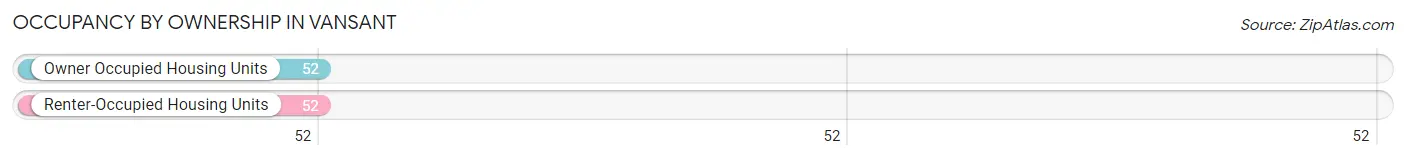
| Occupancy | # Housing Units | % Housing Units |
| Owner Occupied Housing Units | 52 | 50.0% |
| Renter-Occupied Housing Units | 52 | 50.0% |
| Total Occupied Housing Units | 104 | 100.0% |
Occupancy by Household Size in Vansant
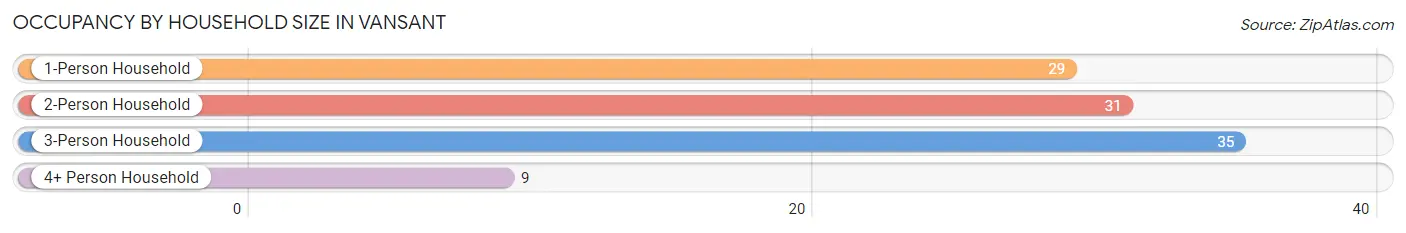
| Household Size | # Housing Units | % Housing Units |
| 1-Person Household | 29 | 27.9% |
| 2-Person Household | 31 | 29.8% |
| 3-Person Household | 35 | 33.7% |
| 4+ Person Household | 9 | 8.6% |
| Total Housing Units | 104 | 100.0% |
Occupancy by Ownership by Household Size in Vansant
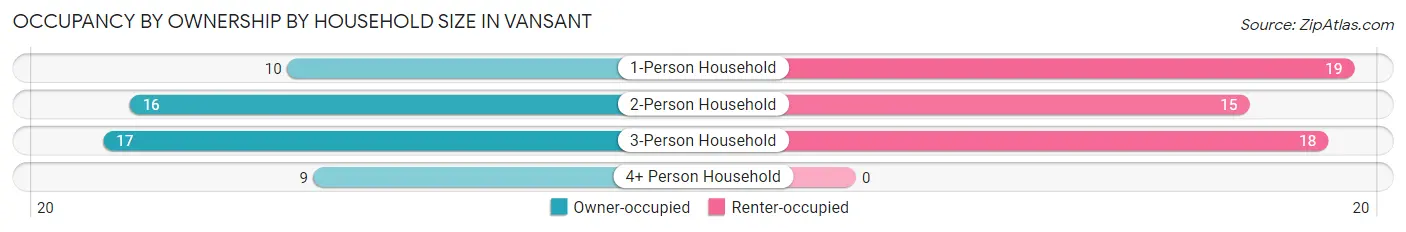
| Household Size | Owner-occupied | Renter-occupied |
| 1-Person Household | 10 (34.5%) | 19 (65.5%) |
| 2-Person Household | 16 (51.6%) | 15 (48.4%) |
| 3-Person Household | 17 (48.6%) | 18 (51.4%) |
| 4+ Person Household | 9 (100.0%) | 0 (0.0%) |
| Total Housing Units | 52 (50.0%) | 52 (50.0%) |
Occupancy by Educational Attainment in Vansant
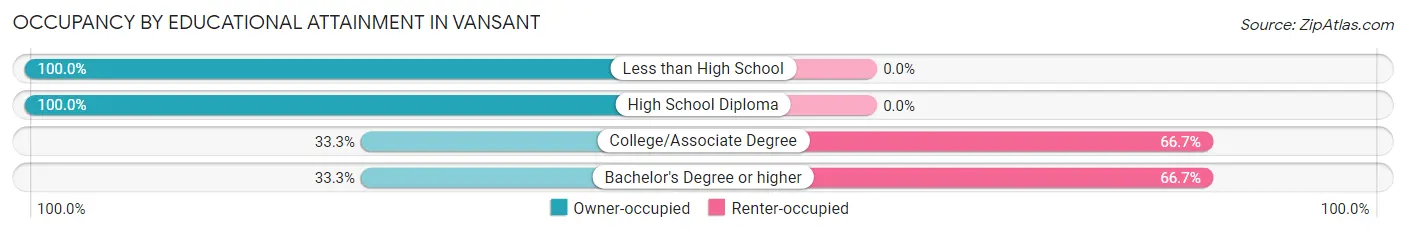
| Household Size | Owner-occupied | Renter-occupied |
| Less than High School | 16 (100.0%) | 0 (0.0%) |
| High School Diploma | 10 (100.0%) | 0 (0.0%) |
| College/Associate Degree | 9 (33.3%) | 18 (66.7%) |
| Bachelor's Degree or higher | 17 (33.3%) | 34 (66.7%) |
Occupancy by Age of Householder in Vansant
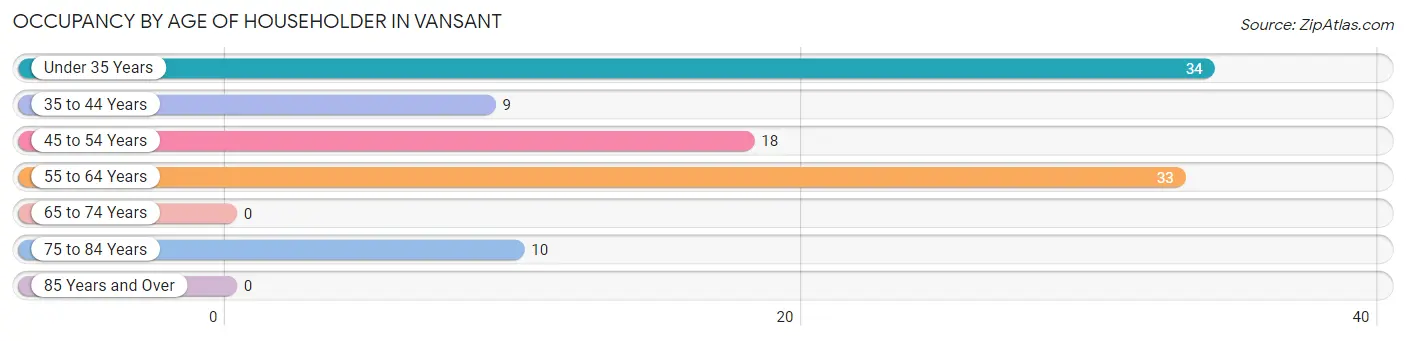
| Age Bracket | # Households | % Households |
| Under 35 Years | 34 | 32.7% |
| 35 to 44 Years | 9 | 8.6% |
| 45 to 54 Years | 18 | 17.3% |
| 55 to 64 Years | 33 | 31.7% |
| 65 to 74 Years | 0 | 0.0% |
| 75 to 84 Years | 10 | 9.6% |
| 85 Years and Over | 0 | 0.0% |
| Total | 104 | 100.0% |
Housing Finances in Vansant
Median Income by Occupancy in Vansant
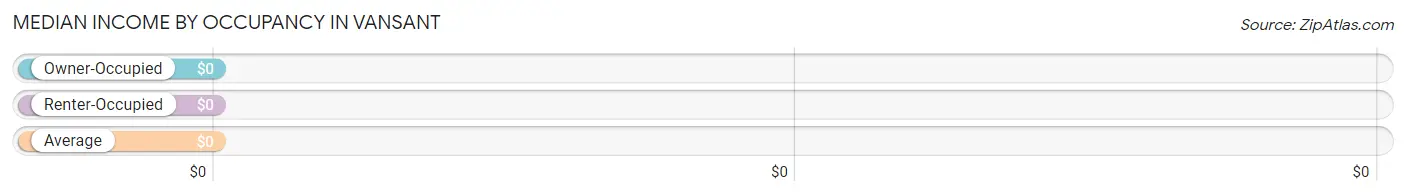
| Occupancy Type | # Households | Median Income |
| Owner-Occupied | 52 (50.0%) | $0 |
| Renter-Occupied | 52 (50.0%) | $0 |
| Average | 104 (100.0%) | $0 |
Occupancy by Householder Income Bracket in Vansant
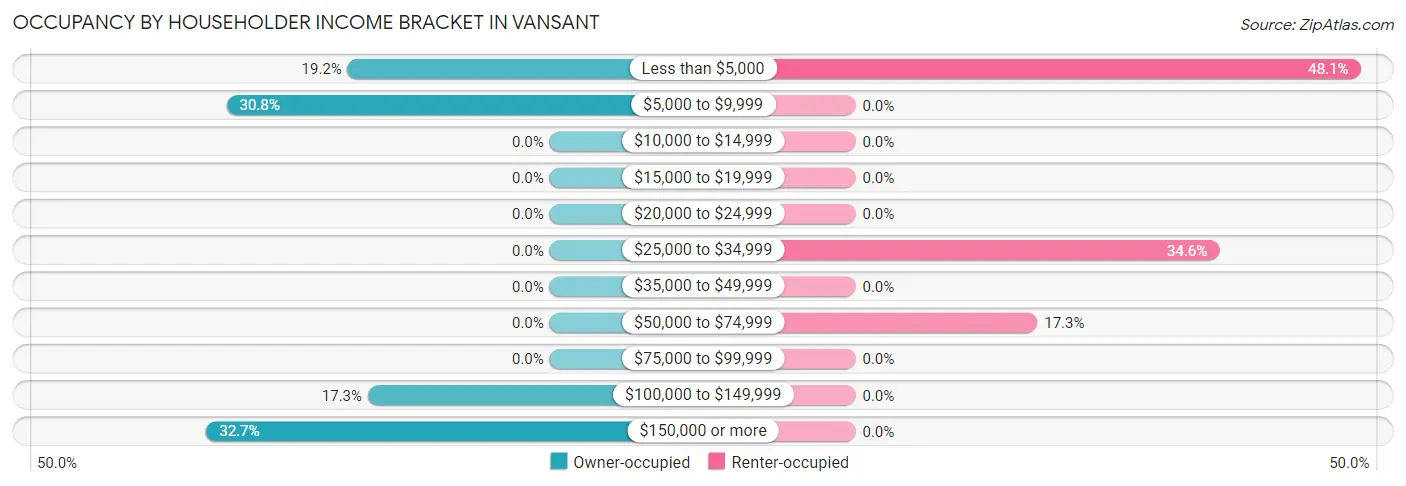
| Income Bracket | Owner-occupied | Renter-occupied |
| Less than $5,000 | 10 (19.2%) | 25 (48.1%) |
| $5,000 to $9,999 | 16 (30.8%) | 0 (0.0%) |
| $10,000 to $14,999 | 0 (0.0%) | 0 (0.0%) |
| $15,000 to $19,999 | 0 (0.0%) | 0 (0.0%) |
| $20,000 to $24,999 | 0 (0.0%) | 0 (0.0%) |
| $25,000 to $34,999 | 0 (0.0%) | 18 (34.6%) |
| $35,000 to $49,999 | 0 (0.0%) | 0 (0.0%) |
| $50,000 to $74,999 | 0 (0.0%) | 9 (17.3%) |
| $75,000 to $99,999 | 0 (0.0%) | 0 (0.0%) |
| $100,000 to $149,999 | 9 (17.3%) | 0 (0.0%) |
| $150,000 or more | 17 (32.7%) | 0 (0.0%) |
| Total | 52 (100.0%) | 52 (100.0%) |
Monthly Housing Cost Tiers in Vansant
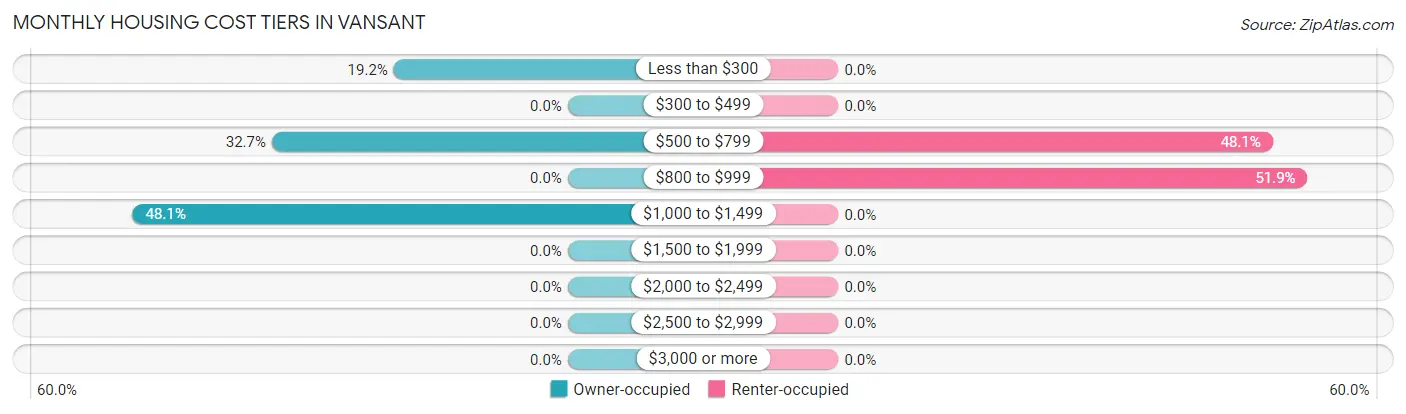
| Monthly Cost | Owner-occupied | Renter-occupied |
| Less than $300 | 10 (19.2%) | 0 (0.0%) |
| $300 to $499 | 0 (0.0%) | 0 (0.0%) |
| $500 to $799 | 17 (32.7%) | 25 (48.1%) |
| $800 to $999 | 0 (0.0%) | 27 (51.9%) |
| $1,000 to $1,499 | 25 (48.1%) | 0 (0.0%) |
| $1,500 to $1,999 | 0 (0.0%) | 0 (0.0%) |
| $2,000 to $2,499 | 0 (0.0%) | 0 (0.0%) |
| $2,500 to $2,999 | 0 (0.0%) | 0 (0.0%) |
| $3,000 or more | 0 (0.0%) | 0 (0.0%) |
| Total | 52 (100.0%) | 52 (100.0%) |
Physical Housing Characteristics in Vansant
Housing Structures in Vansant
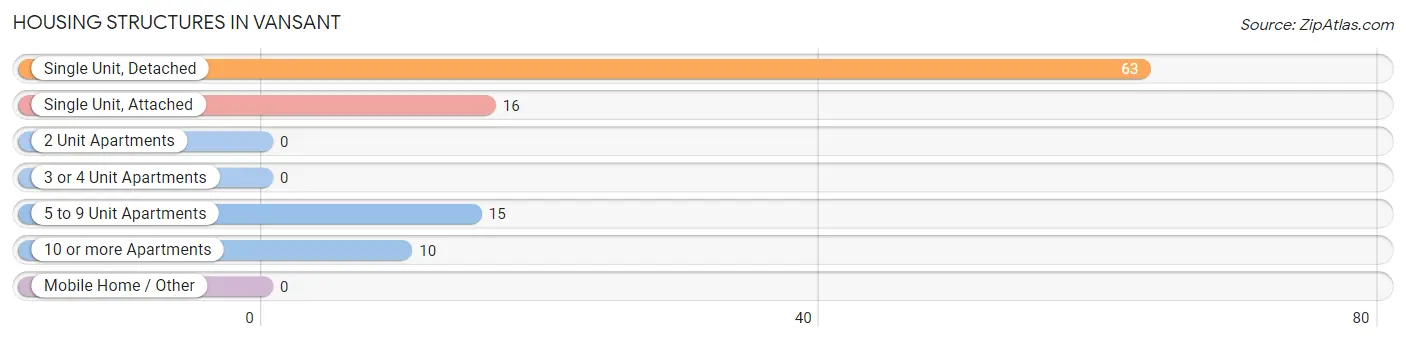
| Structure Type | # Housing Units | % Housing Units |
| Single Unit, Detached | 63 | 60.6% |
| Single Unit, Attached | 16 | 15.4% |
| 2 Unit Apartments | 0 | 0.0% |
| 3 or 4 Unit Apartments | 0 | 0.0% |
| 5 to 9 Unit Apartments | 15 | 14.4% |
| 10 or more Apartments | 10 | 9.6% |
| Mobile Home / Other | 0 | 0.0% |
| Total | 104 | 100.0% |
Housing Structures by Occupancy in Vansant
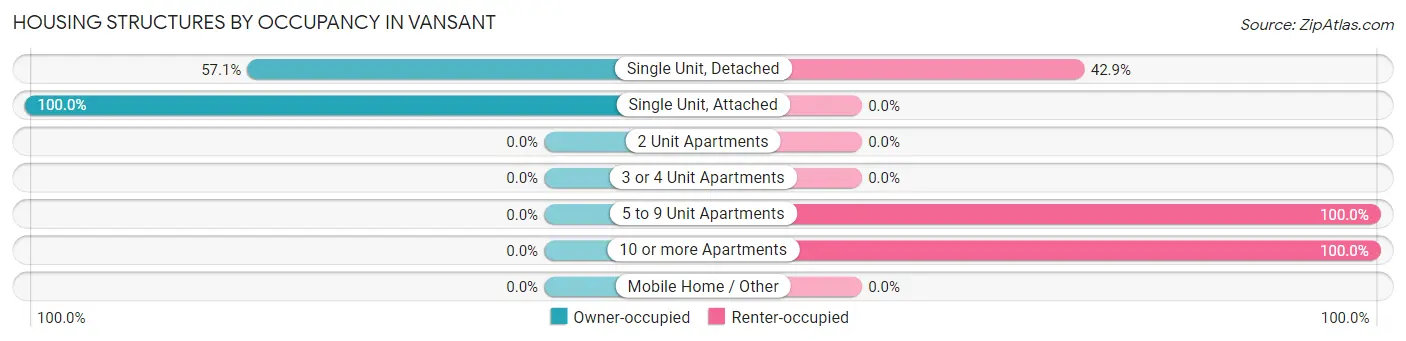
| Structure Type | Owner-occupied | Renter-occupied |
| Single Unit, Detached | 36 (57.1%) | 27 (42.9%) |
| Single Unit, Attached | 16 (100.0%) | 0 (0.0%) |
| 2 Unit Apartments | 0 (0.0%) | 0 (0.0%) |
| 3 or 4 Unit Apartments | 0 (0.0%) | 0 (0.0%) |
| 5 to 9 Unit Apartments | 0 (0.0%) | 15 (100.0%) |
| 10 or more Apartments | 0 (0.0%) | 10 (100.0%) |
| Mobile Home / Other | 0 (0.0%) | 0 (0.0%) |
| Total | 52 (50.0%) | 52 (50.0%) |
Housing Structures by Number of Rooms in Vansant
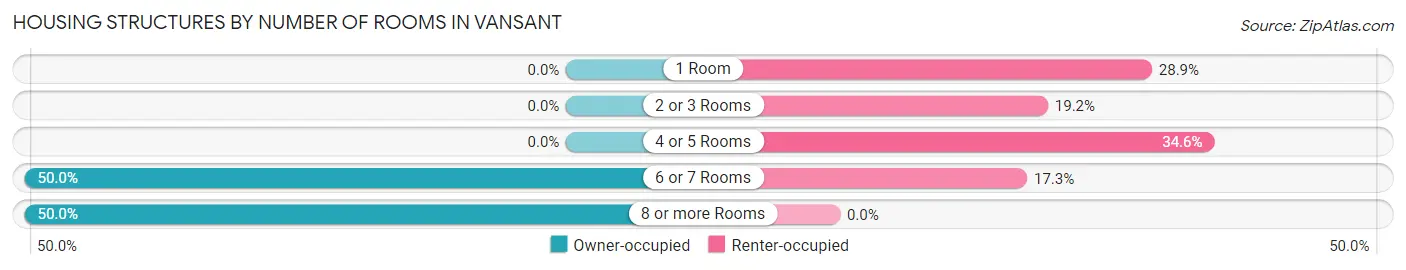
| Number of Rooms | Owner-occupied | Renter-occupied |
| 1 Room | 0 (0.0%) | 15 (28.8%) |
| 2 or 3 Rooms | 0 (0.0%) | 10 (19.2%) |
| 4 or 5 Rooms | 0 (0.0%) | 18 (34.6%) |
| 6 or 7 Rooms | 26 (50.0%) | 9 (17.3%) |
| 8 or more Rooms | 26 (50.0%) | 0 (0.0%) |
| Total | 52 (100.0%) | 52 (100.0%) |
Housing Structure by Heating Type in Vansant
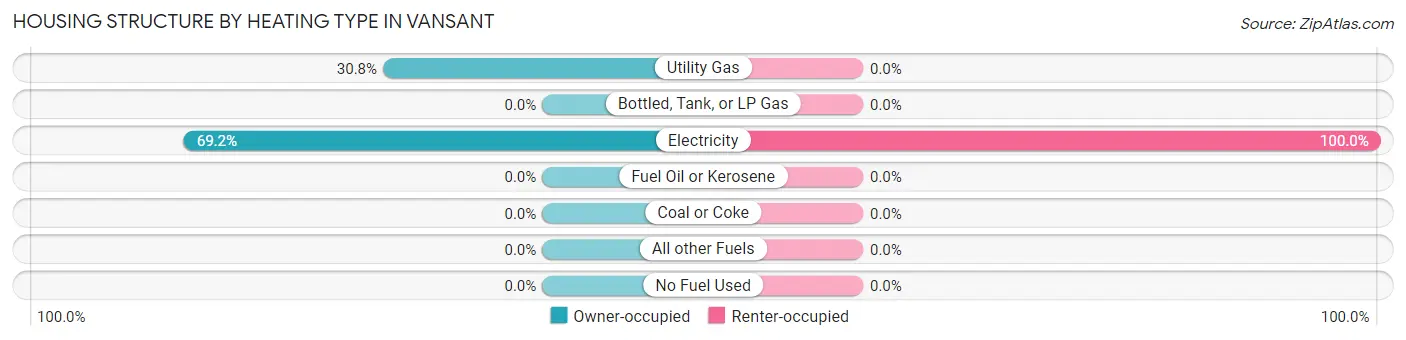
| Heating Type | Owner-occupied | Renter-occupied |
| Utility Gas | 16 (30.8%) | 0 (0.0%) |
| Bottled, Tank, or LP Gas | 0 (0.0%) | 0 (0.0%) |
| Electricity | 36 (69.2%) | 52 (100.0%) |
| Fuel Oil or Kerosene | 0 (0.0%) | 0 (0.0%) |
| Coal or Coke | 0 (0.0%) | 0 (0.0%) |
| All other Fuels | 0 (0.0%) | 0 (0.0%) |
| No Fuel Used | 0 (0.0%) | 0 (0.0%) |
| Total | 52 (100.0%) | 52 (100.0%) |
Household Vehicle Usage in Vansant
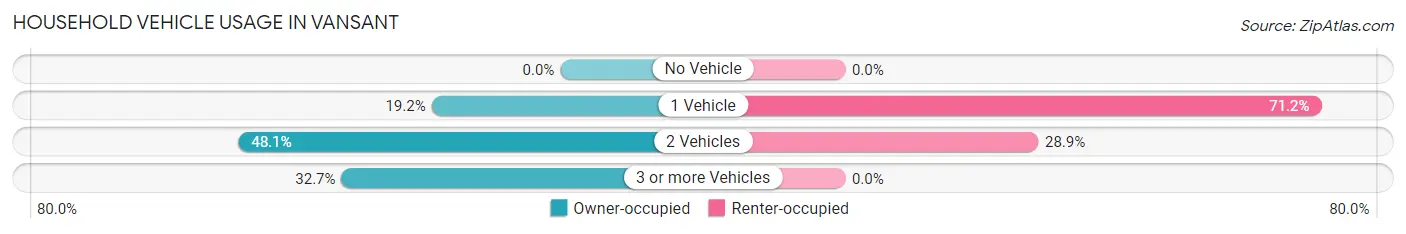
| Vehicles per Household | Owner-occupied | Renter-occupied |
| No Vehicle | 0 (0.0%) | 0 (0.0%) |
| 1 Vehicle | 10 (19.2%) | 37 (71.2%) |
| 2 Vehicles | 25 (48.1%) | 15 (28.8%) |
| 3 or more Vehicles | 17 (32.7%) | 0 (0.0%) |
| Total | 52 (100.0%) | 52 (100.0%) |
Real Estate & Mortgages in Vansant
Real Estate and Mortgage Overview in Vansant
| Characteristic | Without Mortgage | With Mortgage |
| Housing Units | 27 | 25 |
| Median Property Value | - | - |
| Median Household Income | - | - |
| Monthly Housing Costs | - | - |
| Real Estate Taxes | - | - |
Property Value by Mortgage Status in Vansant
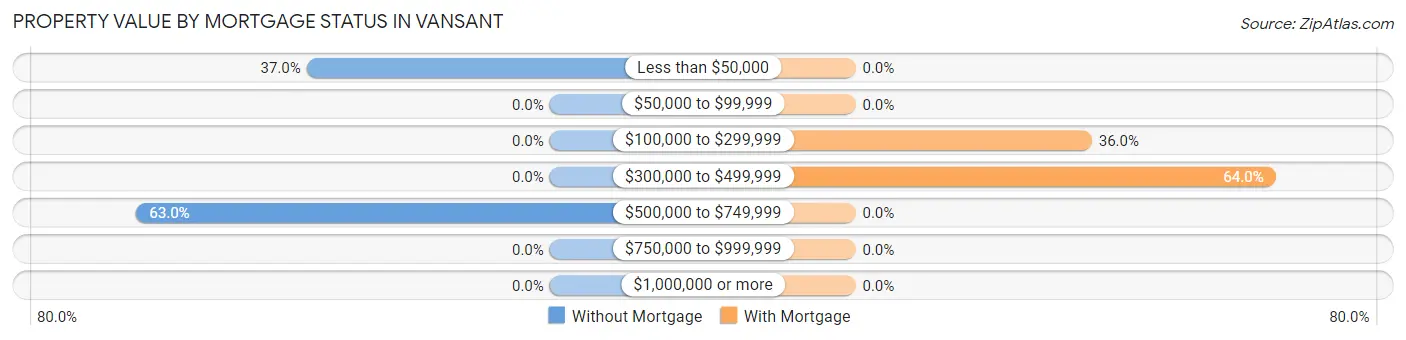
| Property Value | Without Mortgage | With Mortgage |
| Less than $50,000 | 10 (37.0%) | 0 (0.0%) |
| $50,000 to $99,999 | 0 (0.0%) | 0 (0.0%) |
| $100,000 to $299,999 | 0 (0.0%) | 9 (36.0%) |
| $300,000 to $499,999 | 0 (0.0%) | 16 (64.0%) |
| $500,000 to $749,999 | 17 (63.0%) | 0 (0.0%) |
| $750,000 to $999,999 | 0 (0.0%) | 0 (0.0%) |
| $1,000,000 or more | 0 (0.0%) | 0 (0.0%) |
| Total | 27 (100.0%) | 25 (100.0%) |
Household Income by Mortgage Status in Vansant
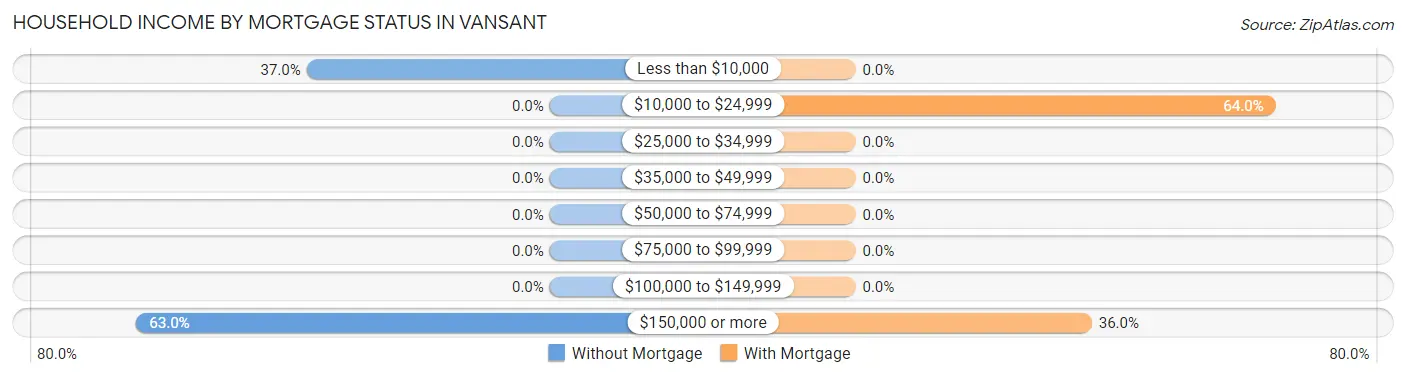
| Household Income | Without Mortgage | With Mortgage |
| Less than $10,000 | 10 (37.0%) | 0 (0.0%) |
| $10,000 to $24,999 | 0 (0.0%) | 16 (64.0%) |
| $25,000 to $34,999 | 0 (0.0%) | 0 (0.0%) |
| $35,000 to $49,999 | 0 (0.0%) | 0 (0.0%) |
| $50,000 to $74,999 | 0 (0.0%) | 0 (0.0%) |
| $75,000 to $99,999 | 0 (0.0%) | 0 (0.0%) |
| $100,000 to $149,999 | 0 (0.0%) | 0 (0.0%) |
| $150,000 or more | 17 (63.0%) | 9 (36.0%) |
| Total | 27 (100.0%) | 25 (100.0%) |
Property Value to Household Income Ratio in Vansant
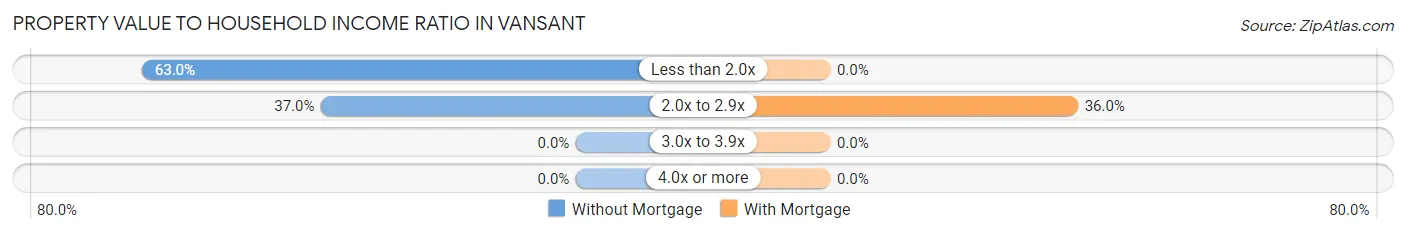
| Value-to-Income Ratio | Without Mortgage | With Mortgage |
| Less than 2.0x | 17 (63.0%) | 0 (0.0%) |
| 2.0x to 2.9x | 10 (37.0%) | 9 (36.0%) |
| 3.0x to 3.9x | 0 (0.0%) | 0 (0.0%) |
| 4.0x or more | 0 (0.0%) | 0 (0.0%) |
| Total | 27 (100.0%) | 25 (100.0%) |
Real Estate Taxes by Mortgage Status in Vansant
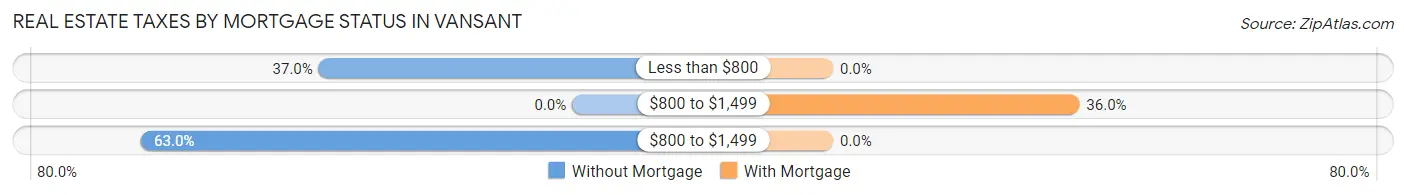
| Property Taxes | Without Mortgage | With Mortgage |
| Less than $800 | 10 (37.0%) | 0 (0.0%) |
| $800 to $1,499 | 0 (0.0%) | 9 (36.0%) |
| $800 to $1,499 | 17 (63.0%) | 0 (0.0%) |
| Total | 27 (100.0%) | 25 (100.0%) |
Health & Disability in Vansant
Health Insurance Coverage by Age in Vansant
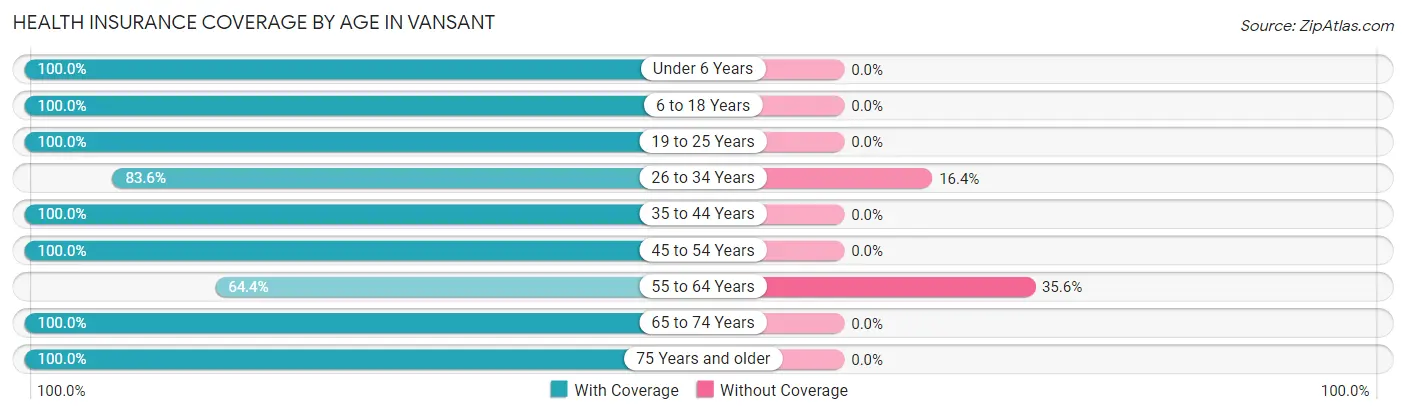
| Age Bracket | With Coverage | Without Coverage |
| Under 6 Years | 19 (100.0%) | 0 (0.0%) |
| 6 to 18 Years | 33 (100.0%) | 0 (0.0%) |
| 19 to 25 Years | 18 (100.0%) | 0 (0.0%) |
| 26 to 34 Years | 51 (83.6%) | 10 (16.4%) |
| 35 to 44 Years | 9 (100.0%) | 0 (0.0%) |
| 45 to 54 Years | 18 (100.0%) | 0 (0.0%) |
| 55 to 64 Years | 29 (64.4%) | 16 (35.6%) |
| 65 to 74 Years | 16 (100.0%) | 0 (0.0%) |
| 75 Years and older | 10 (100.0%) | 0 (0.0%) |
| Total | 203 (88.6%) | 26 (11.4%) |
Health Insurance Coverage by Citizenship Status in Vansant
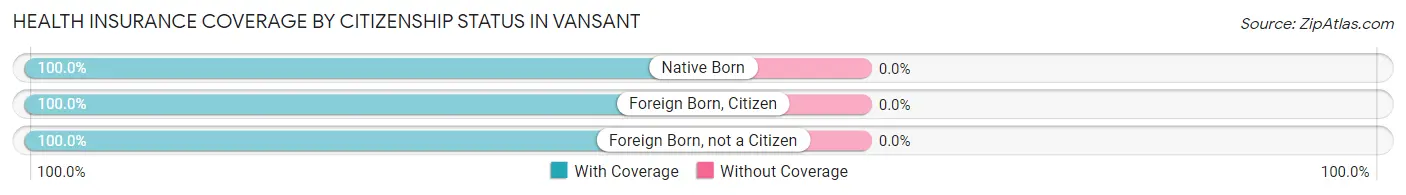
| Citizenship Status | With Coverage | Without Coverage |
| Native Born | 19 (100.0%) | 0 (0.0%) |
| Foreign Born, Citizen | 33 (100.0%) | 0 (0.0%) |
| Foreign Born, not a Citizen | 18 (100.0%) | 0 (0.0%) |
Health Insurance Coverage by Household Income in Vansant
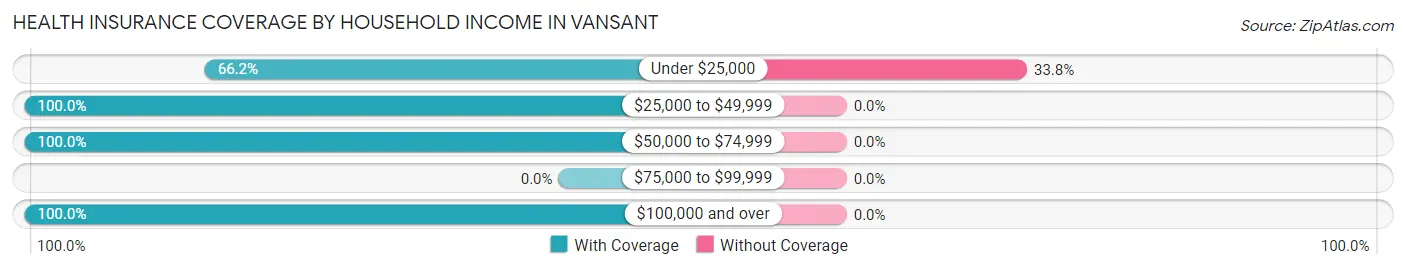
| Household Income | With Coverage | Without Coverage |
| Under $25,000 | 51 (66.2%) | 26 (33.8%) |
| $25,000 to $49,999 | 54 (100.0%) | 0 (0.0%) |
| $50,000 to $74,999 | 9 (100.0%) | 0 (0.0%) |
| $75,000 to $99,999 | 0 (0.0%) | 0 (0.0%) |
| $100,000 and over | 89 (100.0%) | 0 (0.0%) |
Public vs Private Health Insurance Coverage by Age in Vansant
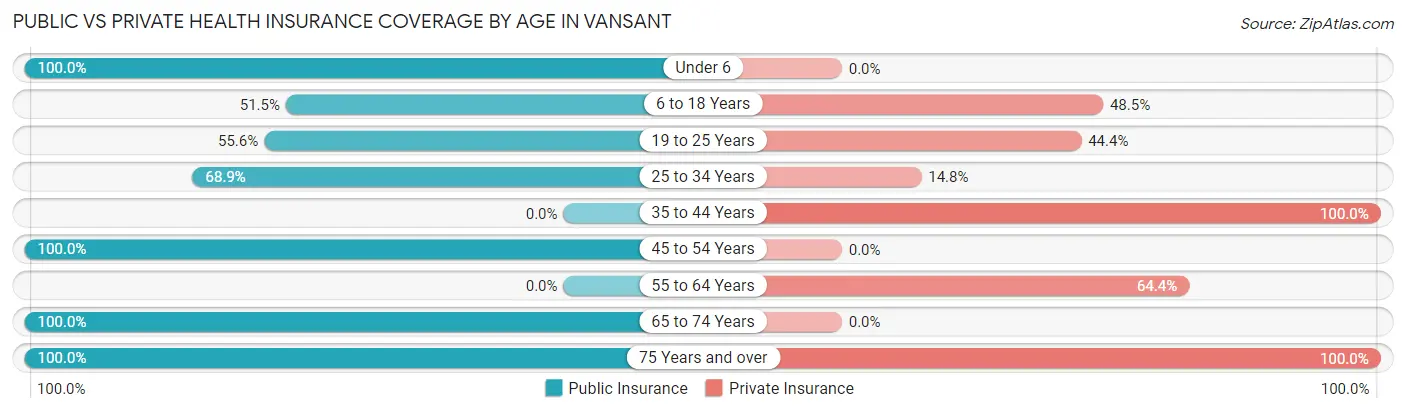
| Age Bracket | Public Insurance | Private Insurance |
| Under 6 | 19 (100.0%) | 0 (0.0%) |
| 6 to 18 Years | 17 (51.5%) | 16 (48.5%) |
| 19 to 25 Years | 10 (55.6%) | 8 (44.4%) |
| 25 to 34 Years | 42 (68.9%) | 9 (14.7%) |
| 35 to 44 Years | 0 (0.0%) | 9 (100.0%) |
| 45 to 54 Years | 18 (100.0%) | 0 (0.0%) |
| 55 to 64 Years | 0 (0.0%) | 29 (64.4%) |
| 65 to 74 Years | 16 (100.0%) | 0 (0.0%) |
| 75 Years and over | 10 (100.0%) | 10 (100.0%) |
| Total | 132 (57.6%) | 81 (35.4%) |
Disability Status by Sex by Age in Vansant
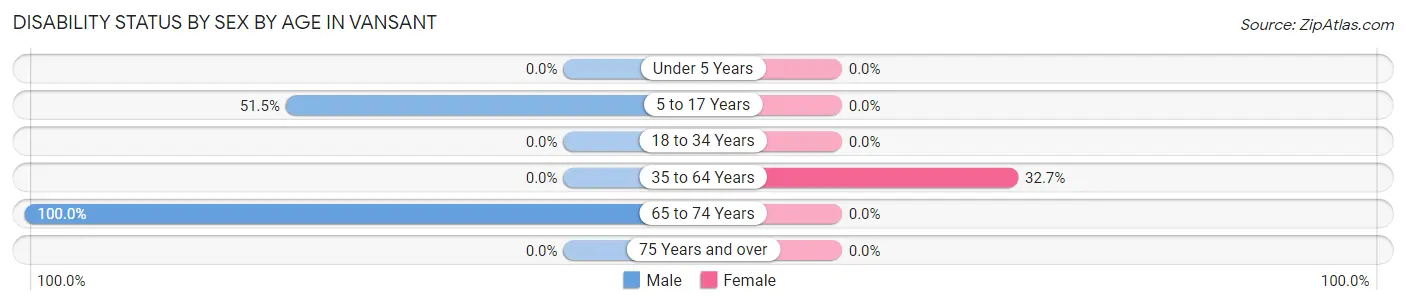
| Age Bracket | Male | Female |
| Under 5 Years | 0 (0.0%) | 0 (0.0%) |
| 5 to 17 Years | 17 (51.5%) | 0 (0.0%) |
| 18 to 34 Years | 0 (0.0%) | 0 (0.0%) |
| 35 to 64 Years | 0 (0.0%) | 18 (32.7%) |
| 65 to 74 Years | 16 (100.0%) | 0 (0.0%) |
| 75 Years and over | 0 (0.0%) | 0 (0.0%) |
Disability Class by Sex by Age in Vansant
Disability Class: Hearing Difficulty
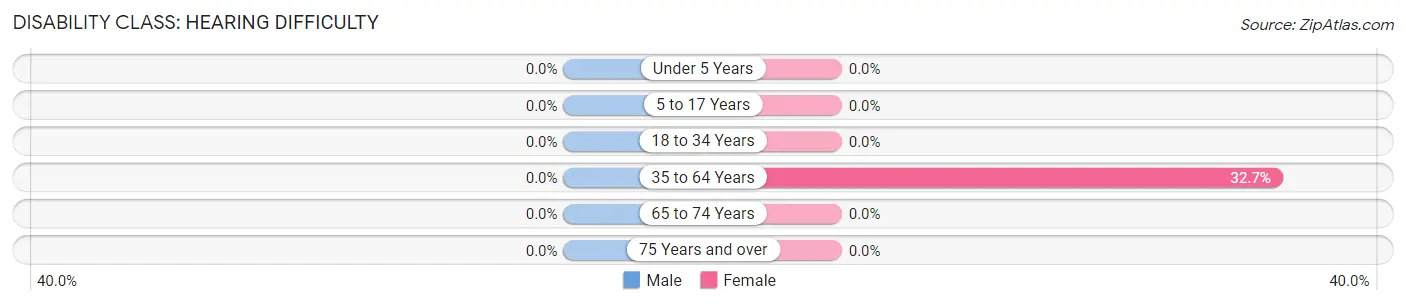
| Age Bracket | Male | Female |
| Under 5 Years | 0 (0.0%) | 0 (0.0%) |
| 5 to 17 Years | 0 (0.0%) | 0 (0.0%) |
| 18 to 34 Years | 0 (0.0%) | 0 (0.0%) |
| 35 to 64 Years | 0 (0.0%) | 18 (32.7%) |
| 65 to 74 Years | 0 (0.0%) | 0 (0.0%) |
| 75 Years and over | 0 (0.0%) | 0 (0.0%) |
Disability Class: Vision Difficulty
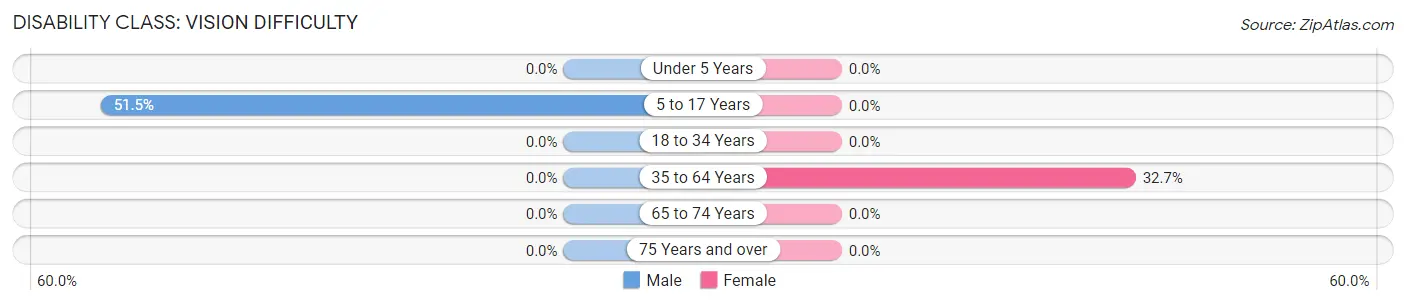
| Age Bracket | Male | Female |
| Under 5 Years | 0 (0.0%) | 0 (0.0%) |
| 5 to 17 Years | 17 (51.5%) | 0 (0.0%) |
| 18 to 34 Years | 0 (0.0%) | 0 (0.0%) |
| 35 to 64 Years | 0 (0.0%) | 18 (32.7%) |
| 65 to 74 Years | 0 (0.0%) | 0 (0.0%) |
| 75 Years and over | 0 (0.0%) | 0 (0.0%) |
Disability Class: Cognitive Difficulty
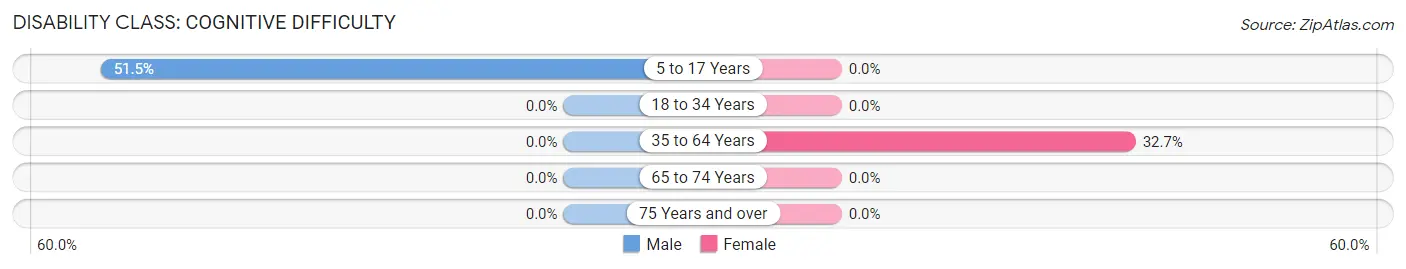
| Age Bracket | Male | Female |
| 5 to 17 Years | 17 (51.5%) | 0 (0.0%) |
| 18 to 34 Years | 0 (0.0%) | 0 (0.0%) |
| 35 to 64 Years | 0 (0.0%) | 18 (32.7%) |
| 65 to 74 Years | 0 (0.0%) | 0 (0.0%) |
| 75 Years and over | 0 (0.0%) | 0 (0.0%) |
Disability Class: Ambulatory Difficulty
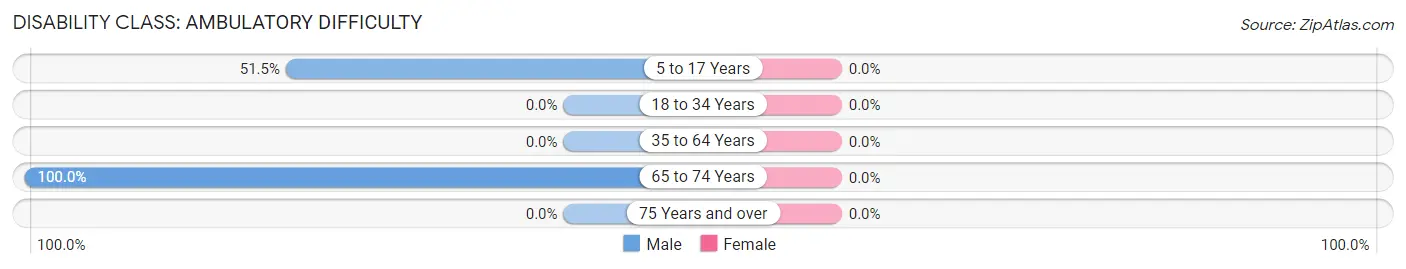
| Age Bracket | Male | Female |
| 5 to 17 Years | 17 (51.5%) | 0 (0.0%) |
| 18 to 34 Years | 0 (0.0%) | 0 (0.0%) |
| 35 to 64 Years | 0 (0.0%) | 0 (0.0%) |
| 65 to 74 Years | 16 (100.0%) | 0 (0.0%) |
| 75 Years and over | 0 (0.0%) | 0 (0.0%) |
Disability Class: Self-Care Difficulty
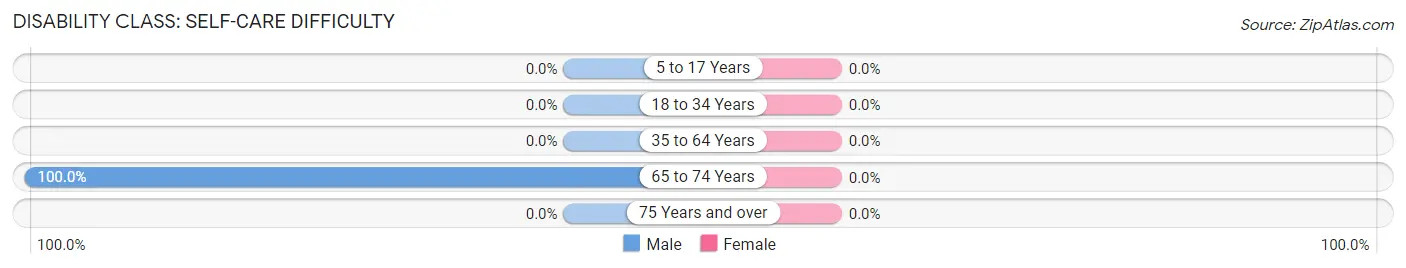
| Age Bracket | Male | Female |
| 5 to 17 Years | 0 (0.0%) | 0 (0.0%) |
| 18 to 34 Years | 0 (0.0%) | 0 (0.0%) |
| 35 to 64 Years | 0 (0.0%) | 0 (0.0%) |
| 65 to 74 Years | 16 (100.0%) | 0 (0.0%) |
| 75 Years and over | 0 (0.0%) | 0 (0.0%) |
Technology Access in Vansant
Computing Device Access in Vansant
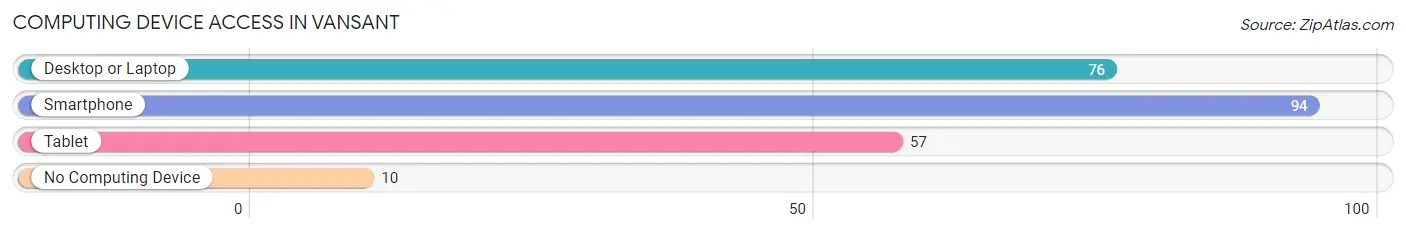
| Device Type | # Households | % Households |
| Desktop or Laptop | 76 | 73.1% |
| Smartphone | 94 | 90.4% |
| Tablet | 57 | 54.8% |
| No Computing Device | 10 | 9.6% |
| Total | 104 | 100.0% |
Internet Access in Vansant
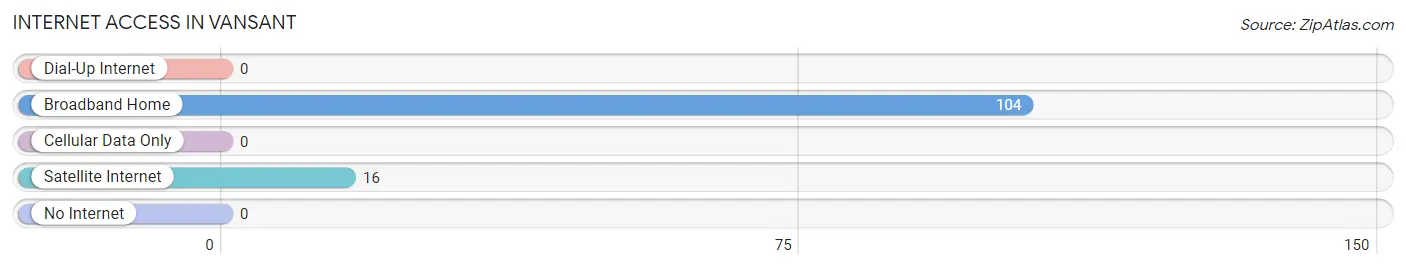
| Internet Type | # Households | % Households |
| Dial-Up Internet | 0 | 0.0% |
| Broadband Home | 104 | 100.0% |
| Cellular Data Only | 0 | 0.0% |
| Satellite Internet | 16 | 15.4% |
| No Internet | 0 | 0.0% |
| Total | 104 | 100.0% |
Vansant Summary
Vansant is a small town located in Buchanan County, Virginia. It is situated in the Appalachian Mountains and is part of the Appalachian Plateau. The town has a population of approximately 1,000 people and is located in the heart of the Appalachian coal mining region.
The town of Vansant was founded in 1883 by the Virginia Coal and Iron Company. The company was established to exploit the coal reserves in the area and to provide employment for the local population. The town was named after the company's founder, John Vansant.
The town of Vansant is located in the Appalachian Mountains and is part of the Appalachian Plateau. The town is situated at an elevation of 1,400 feet and is surrounded by mountains and valleys. The town is located in a rural area and is surrounded by forests and farmland.
The economy of Vansant is largely based on coal mining and related industries. The town is home to several coal mines, including the Vansant Mine, which is the largest coal mine in the area. The town also has several other industries, including timber, manufacturing, and tourism.
The population of Vansant is approximately 1,000 people. The town is predominantly white, with a small African American population. The median household income in Vansant is $25,000, which is lower than the national average. The town has a high poverty rate, with nearly one-third of the population living below the poverty line.
Vansant is served by the Buchanan County Public Schools system. The town has one elementary school, one middle school, and one high school. The town also has a library and a community center.
Vansant is home to several parks and recreational areas, including the Vansant Nature Preserve, which is a popular destination for hikers and nature lovers. The town also has several churches, including the First Baptist Church of Vansant.
Vansant is a small town with a rich history and a unique culture. The town is home to a diverse population and is a great place to live and work. The town has a strong economy and is a great place to raise a family.
Common Questions
What is Per Capita Income in Vansant?
Per Capita income in Vansant is $33,324.
What is Inequality or Gini Index in Vansant?
Inequality or Gini Index in Vansant is 0.70.
What is the Total Population of Vansant?
Total Population of Vansant is 229.
What is the Total Male Population of Vansant?
Total Male Population of Vansant is 136.
What is the Total Female Population of Vansant?
Total Female Population of Vansant is 93.
What is the Ratio of Males per 100 Females in Vansant?
There are 146.24 Males per 100 Females in Vansant.
What is the Ratio of Females per 100 Males in Vansant?
There are 68.38 Females per 100 Males in Vansant.
What is the Median Population Age in Vansant?
Median Population Age in Vansant is 29.5 Years.
What is the Average Family Size in Vansant
Average Family Size in Vansant is 2.8 People.
What is the Average Household Size in Vansant
Average Household Size in Vansant is 2.2 People.
How Large is the Labor Force in Vansant?
There are 101 People in the Labor Forcein in Vansant.
What is the Percentage of People in the Labor Force in Vansant?
52.1% of People are in the Labor Force in Vansant.