Melfa, VA Map & Demographics
Melfa Map
Melfa Overview
$21,561
PER CAPITA INCOME
$39,000
AVG FAMILY INCOME
$28,667
AVG HOUSEHOLD INCOME
26.5%
WAGE / INCOME GAP [ % ]
73.5¢/ $1
WAGE / INCOME GAP [ $ ]
0.45
INEQUALITY / GINI INDEX
436
TOTAL POPULATION
183
MALE POPULATION
253
FEMALE POPULATION
72.33
MALES / 100 FEMALES
138.25
FEMALES / 100 MALES
45.3
MEDIAN AGE
2.8
AVG FAMILY SIZE
2.0
AVG HOUSEHOLD SIZE
194
LABOR FORCE [ PEOPLE ]
55.3%
PERCENT IN LABOR FORCE
4.6%
UNEMPLOYMENT RATE
Melfa Zip Codes
Melfa Area Codes
Income in Melfa
Income Overview in Melfa
Per Capita Income in Melfa is $21,561, while median incomes of families and households are $39,000 and $28,667 respectively.
| Characteristic | Number | Measure |
| Per Capita Income | 436 | $21,561 |
| Median Family Income | 118 | $39,000 |
| Mean Family Income | 118 | $56,257 |
| Median Household Income | 222 | $28,667 |
| Mean Household Income | 222 | $42,492 |
| Income Deficit | 118 | $0 |
| Wage / Income Gap (%) | 436 | 26.54% |
| Wage / Income Gap ($) | 436 | 73.46¢ per $1 |
| Gini / Inequality Index | 436 | 0.45 |
Earnings by Sex in Melfa
Average Earnings in Melfa are $28,125, $33,438 for men and $24,565 for women, a difference of 26.5%.
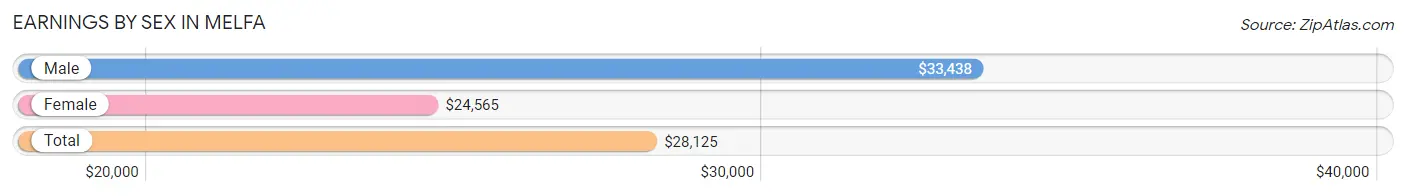
| Sex | Number | Average Earnings |
| Male | 73 (36.3%) | $33,438 |
| Female | 128 (63.7%) | $24,565 |
| Total | 201 (100.0%) | $28,125 |
Earnings by Sex by Income Bracket in Melfa
The most common earnings brackets in Melfa are $25,000 to $29,999 for men (17 | 23.3%) and $22,500 to $24,999 for women (23 | 18.0%).
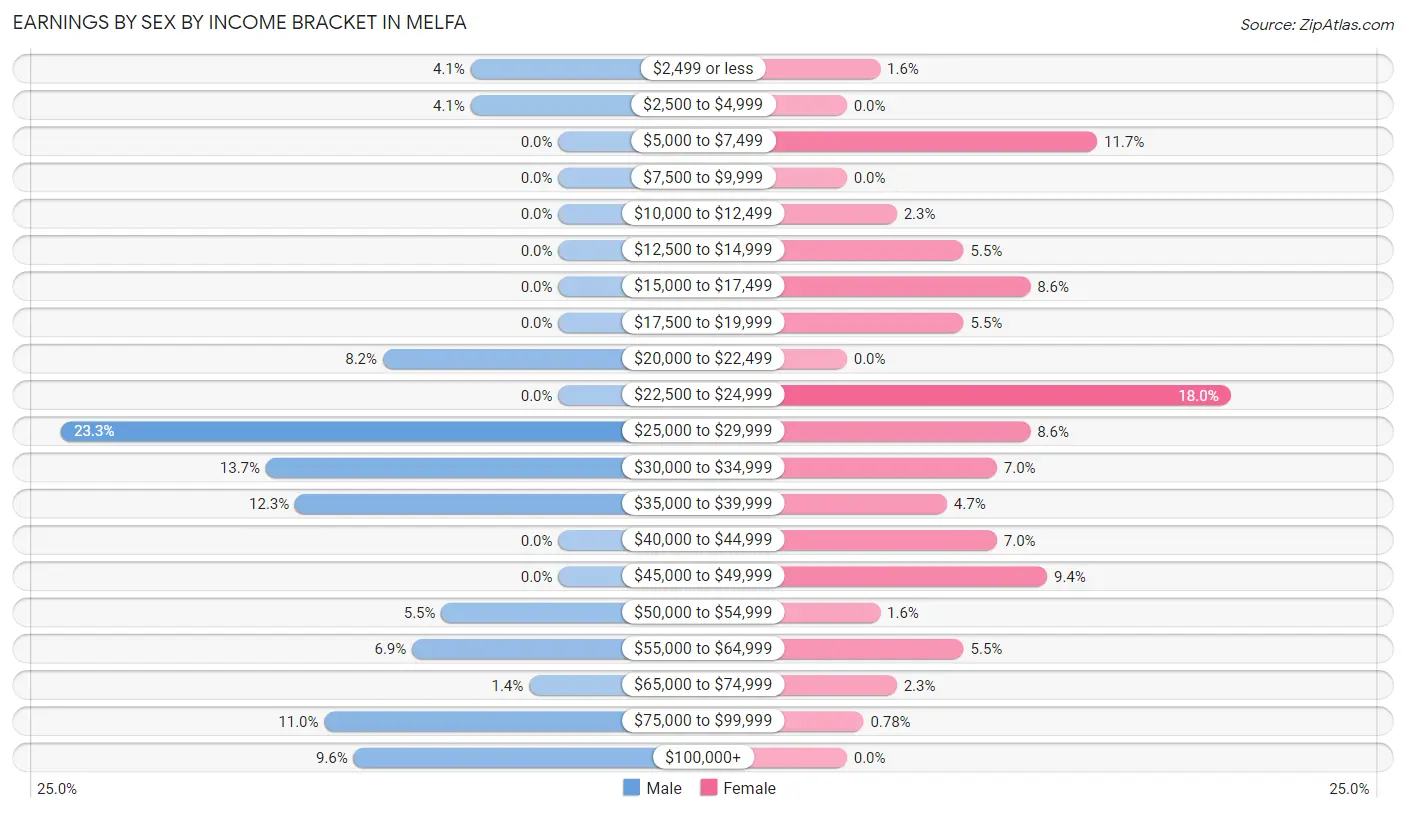
| Income | Male | Female |
| $2,499 or less | 3 (4.1%) | 2 (1.6%) |
| $2,500 to $4,999 | 3 (4.1%) | 0 (0.0%) |
| $5,000 to $7,499 | 0 (0.0%) | 15 (11.7%) |
| $7,500 to $9,999 | 0 (0.0%) | 0 (0.0%) |
| $10,000 to $12,499 | 0 (0.0%) | 3 (2.3%) |
| $12,500 to $14,999 | 0 (0.0%) | 7 (5.5%) |
| $15,000 to $17,499 | 0 (0.0%) | 11 (8.6%) |
| $17,500 to $19,999 | 0 (0.0%) | 7 (5.5%) |
| $20,000 to $22,499 | 6 (8.2%) | 0 (0.0%) |
| $22,500 to $24,999 | 0 (0.0%) | 23 (18.0%) |
| $25,000 to $29,999 | 17 (23.3%) | 11 (8.6%) |
| $30,000 to $34,999 | 10 (13.7%) | 9 (7.0%) |
| $35,000 to $39,999 | 9 (12.3%) | 6 (4.7%) |
| $40,000 to $44,999 | 0 (0.0%) | 9 (7.0%) |
| $45,000 to $49,999 | 0 (0.0%) | 12 (9.4%) |
| $50,000 to $54,999 | 4 (5.5%) | 2 (1.6%) |
| $55,000 to $64,999 | 5 (6.9%) | 7 (5.5%) |
| $65,000 to $74,999 | 1 (1.4%) | 3 (2.3%) |
| $75,000 to $99,999 | 8 (11.0%) | 1 (0.8%) |
| $100,000+ | 7 (9.6%) | 0 (0.0%) |
| Total | 73 (100.0%) | 128 (100.0%) |
Earnings by Sex by Educational Attainment in Melfa
Average earnings in Melfa are $34,688 for men and $24,457 for women, a difference of 29.5%. Men with an educational attainment of college or associate's degree enjoy the highest average annual earnings of $51,875, while those with high school diploma education earn the least with $30,417. Women with an educational attainment of graduate degree earn the most with the average annual earnings of $47,188, while those with college or associate's degree education have the smallest earnings of $19,464.
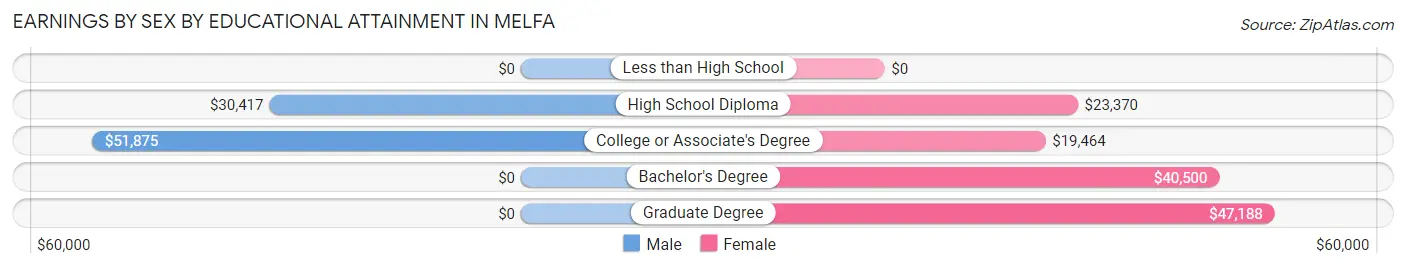
| Educational Attainment | Male Income | Female Income |
| Less than High School | - | - |
| High School Diploma | $30,417 | $23,370 |
| College or Associate's Degree | $51,875 | $19,464 |
| Bachelor's Degree | - | - |
| Graduate Degree | - | - |
| Total | $34,688 | $24,457 |
Family Income in Melfa
Family Income Brackets in Melfa
According to the Melfa family income data, there are 33 families falling into the $15,000 to $24,999 income range, which is the most common income bracket and makes up 28.0% of all families.
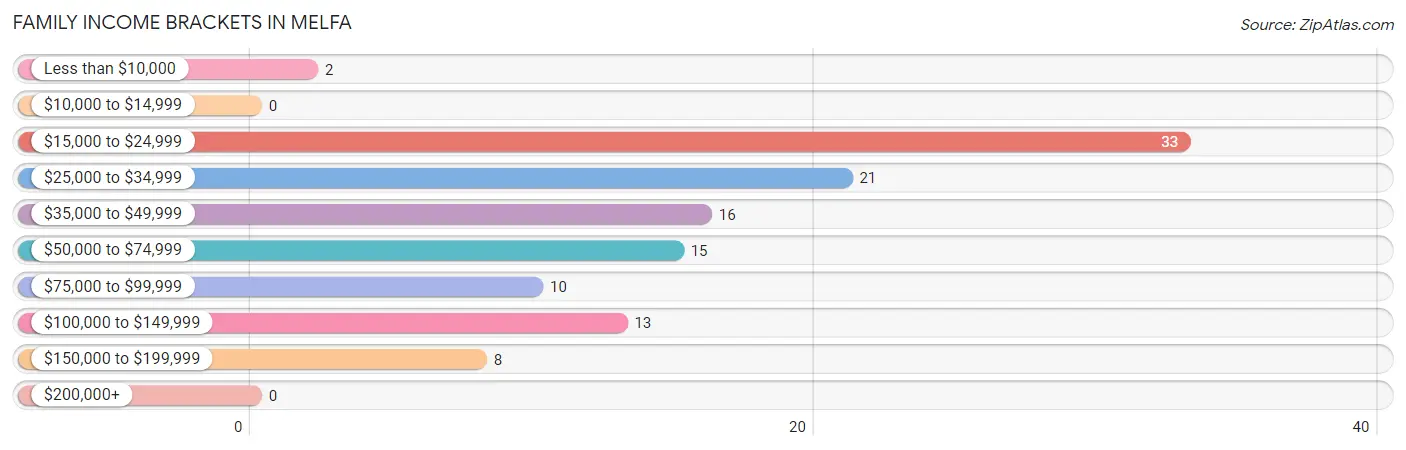
| Income Bracket | # Families | % Families |
| Less than $10,000 | 2 | 1.7% |
| $10,000 to $14,999 | 0 | 0.0% |
| $15,000 to $24,999 | 33 | 28.0% |
| $25,000 to $34,999 | 21 | 17.8% |
| $35,000 to $49,999 | 16 | 13.6% |
| $50,000 to $74,999 | 15 | 12.7% |
| $75,000 to $99,999 | 10 | 8.5% |
| $100,000 to $149,999 | 13 | 11.0% |
| $150,000 to $199,999 | 8 | 6.8% |
| $200,000+ | 0 | 0.0% |
Family Income by Famaliy Size in Melfa
3-person families (17 | 14.4%) account for the highest median family income in Melfa with $46,563 per family, while 3-person families (17 | 14.4%) have the highest median income of $15,521 per family member.
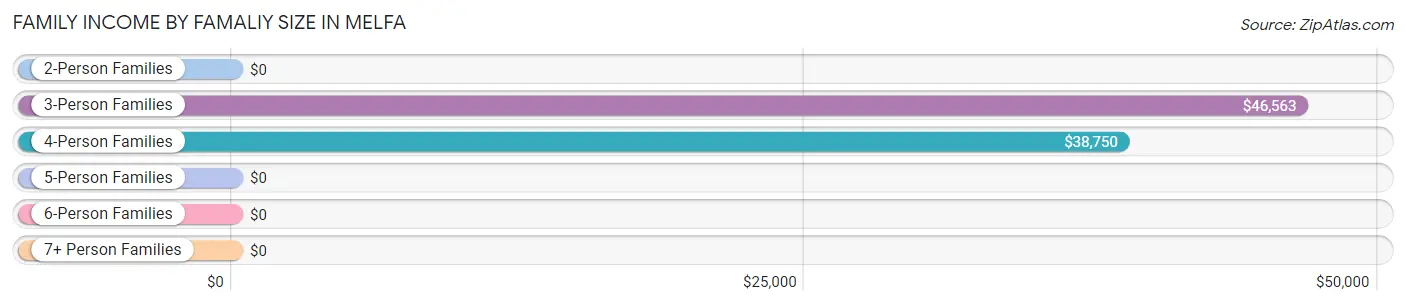
| Income Bracket | # Families | Median Income |
| 2-Person Families | 71 (60.2%) | $0 |
| 3-Person Families | 17 (14.4%) | $46,563 |
| 4-Person Families | 23 (19.5%) | $38,750 |
| 5-Person Families | 7 (5.9%) | $0 |
| 6-Person Families | 0 (0.0%) | $0 |
| 7+ Person Families | 0 (0.0%) | $0 |
| Total | 118 (100.0%) | $39,000 |
Family Income by Number of Earners in Melfa
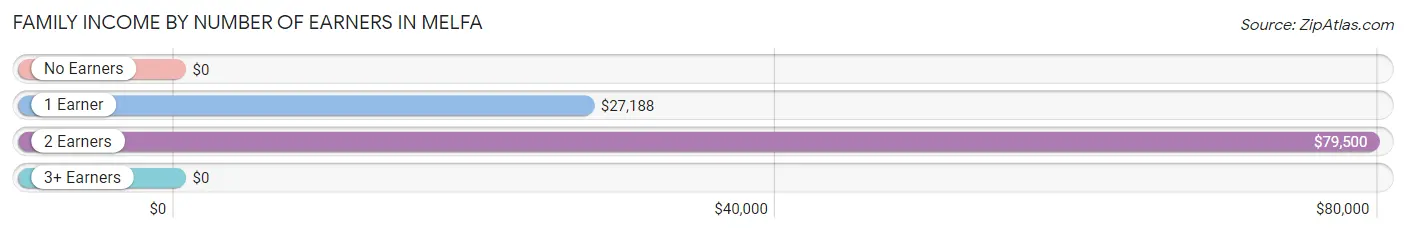
| Number of Earners | # Families | Median Income |
| No Earners | 11 (9.3%) | $0 |
| 1 Earner | 67 (56.8%) | $27,188 |
| 2 Earners | 40 (33.9%) | $79,500 |
| 3+ Earners | 0 (0.0%) | $0 |
| Total | 118 (100.0%) | $39,000 |
Household Income in Melfa
Household Income Brackets in Melfa
With 52 households falling in the category, the $25,000 to $34,999 income range is the most frequent in Melfa, accounting for 23.4% of all households.
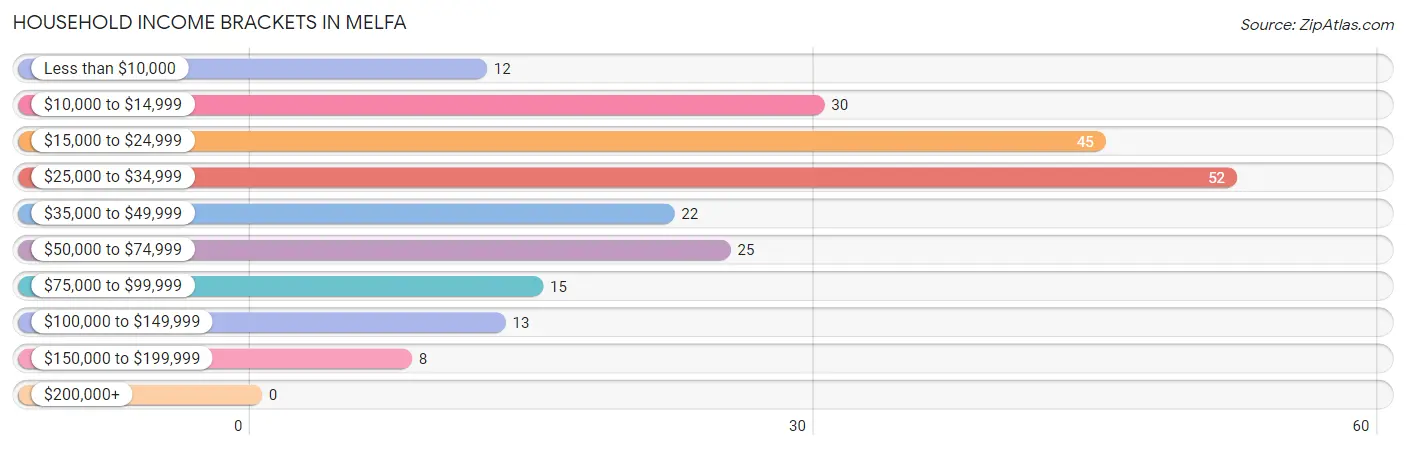
| Income Bracket | # Households | % Households |
| Less than $10,000 | 12 | 5.4% |
| $10,000 to $14,999 | 30 | 13.5% |
| $15,000 to $24,999 | 45 | 20.3% |
| $25,000 to $34,999 | 52 | 23.4% |
| $35,000 to $49,999 | 22 | 9.9% |
| $50,000 to $74,999 | 25 | 11.3% |
| $75,000 to $99,999 | 15 | 6.8% |
| $100,000 to $149,999 | 13 | 5.9% |
| $150,000 to $199,999 | 8 | 3.6% |
| $200,000+ | 0 | 0.0% |
Household Income by Householder Age in Melfa
The median household income in Melfa is $28,667, with the highest median household income of $51,563 found in the 25 to 44 years age bracket for the primary householder. A total of 39 households (17.6%) fall into this category. Meanwhile, the 15 to 24 years age bracket for the primary householder has the lowest median household income of $0, with 6 households (2.7%) in this group.
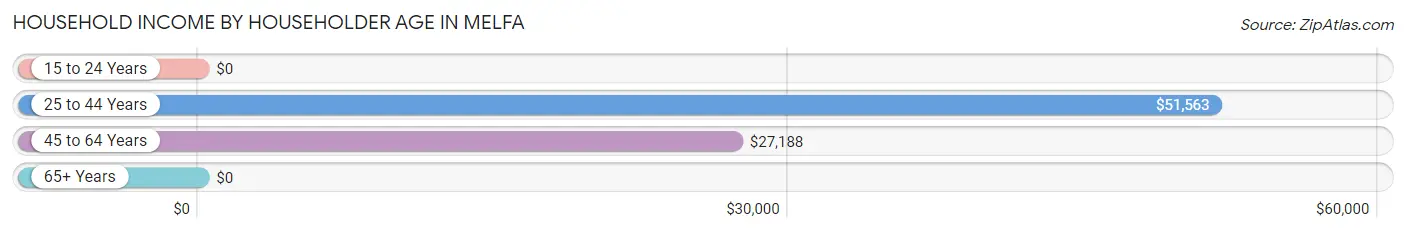
| Income Bracket | # Households | Median Income |
| 15 to 24 Years | 6 (2.7%) | $0 |
| 25 to 44 Years | 39 (17.6%) | $51,563 |
| 45 to 64 Years | 106 (47.7%) | $27,188 |
| 65+ Years | 71 (32.0%) | $0 |
| Total | 222 (100.0%) | $28,667 |
Poverty in Melfa
Income Below Poverty by Sex and Age in Melfa
With 16.9% poverty level for males and 32.8% for females among the residents of Melfa, under 5 year old males and under 5 year old females are the most vulnerable to poverty, with 14 males (82.4%) and 13 females (86.7%) in their respective age groups living below the poverty level.
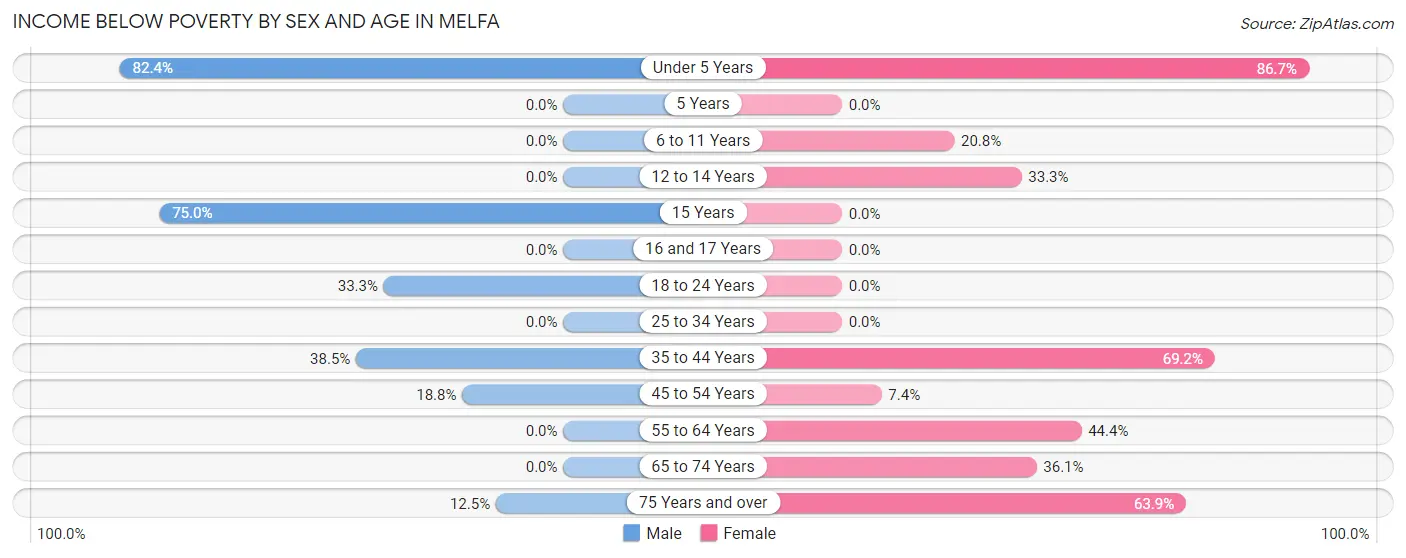
| Age Bracket | Male | Female |
| Under 5 Years | 14 (82.4%) | 13 (86.7%) |
| 5 Years | 0 (0.0%) | 0 (0.0%) |
| 6 to 11 Years | 0 (0.0%) | 5 (20.8%) |
| 12 to 14 Years | 0 (0.0%) | 3 (33.3%) |
| 15 Years | 3 (75.0%) | 0 (0.0%) |
| 16 and 17 Years | 0 (0.0%) | 0 (0.0%) |
| 18 to 24 Years | 2 (33.3%) | 0 (0.0%) |
| 25 to 34 Years | 0 (0.0%) | 0 (0.0%) |
| 35 to 44 Years | 5 (38.5%) | 9 (69.2%) |
| 45 to 54 Years | 6 (18.8%) | 5 (7.3%) |
| 55 to 64 Years | 0 (0.0%) | 12 (44.4%) |
| 65 to 74 Years | 0 (0.0%) | 13 (36.1%) |
| 75 Years and over | 1 (12.5%) | 23 (63.9%) |
| Total | 31 (16.9%) | 83 (32.8%) |
Income Above Poverty by Sex and Age in Melfa
According to the poverty statistics in Melfa, males aged 5 years and females aged 16 and 17 years are the age groups that are most secure financially, with 100.0% of males and 100.0% of females in these age groups living above the poverty line.
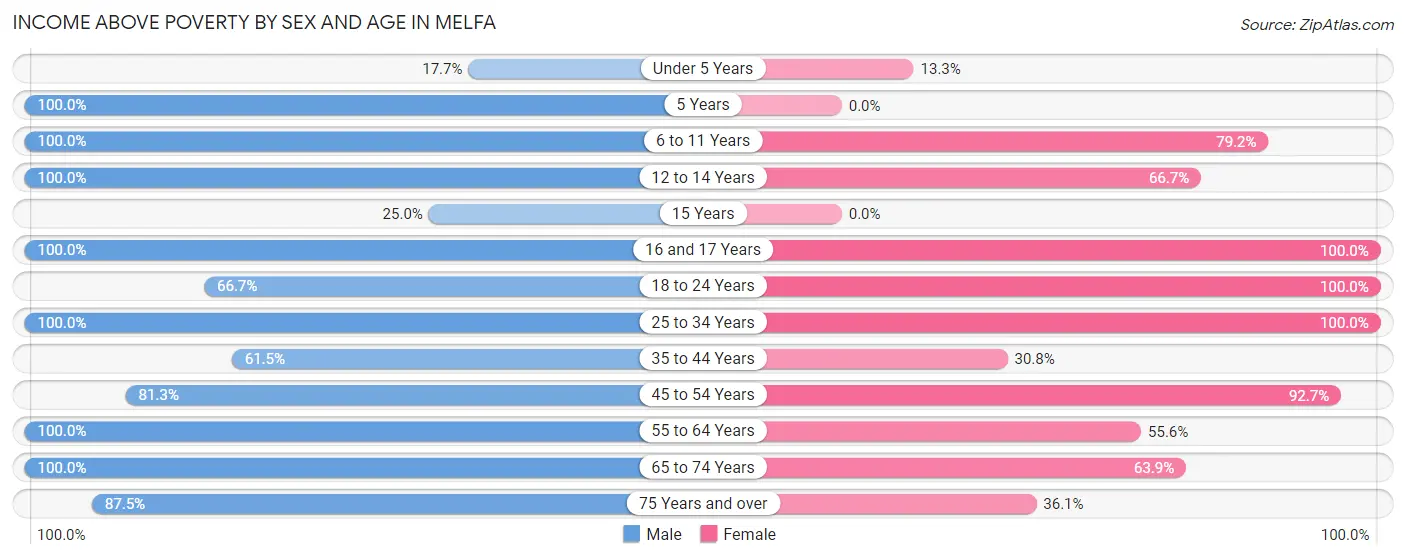
| Age Bracket | Male | Female |
| Under 5 Years | 3 (17.6%) | 2 (13.3%) |
| 5 Years | 1 (100.0%) | 0 (0.0%) |
| 6 to 11 Years | 4 (100.0%) | 19 (79.2%) |
| 12 to 14 Years | 11 (100.0%) | 6 (66.7%) |
| 15 Years | 1 (25.0%) | 0 (0.0%) |
| 16 and 17 Years | 49 (100.0%) | 3 (100.0%) |
| 18 to 24 Years | 4 (66.7%) | 2 (100.0%) |
| 25 to 34 Years | 16 (100.0%) | 20 (100.0%) |
| 35 to 44 Years | 8 (61.5%) | 4 (30.8%) |
| 45 to 54 Years | 26 (81.2%) | 63 (92.6%) |
| 55 to 64 Years | 13 (100.0%) | 15 (55.6%) |
| 65 to 74 Years | 9 (100.0%) | 23 (63.9%) |
| 75 Years and over | 7 (87.5%) | 13 (36.1%) |
| Total | 152 (83.1%) | 170 (67.2%) |
Income Below Poverty Among Married-Couple Families in Melfa
The poverty statistics for married-couple families in Melfa show that 11.1% or 5 of the total 45 families live below the poverty line. Families with 3 or 4 children have the highest poverty rate of 71.4%, comprising of 5 families. On the other hand, families with no children have the lowest poverty rate of 0.0%, which includes 0 families.
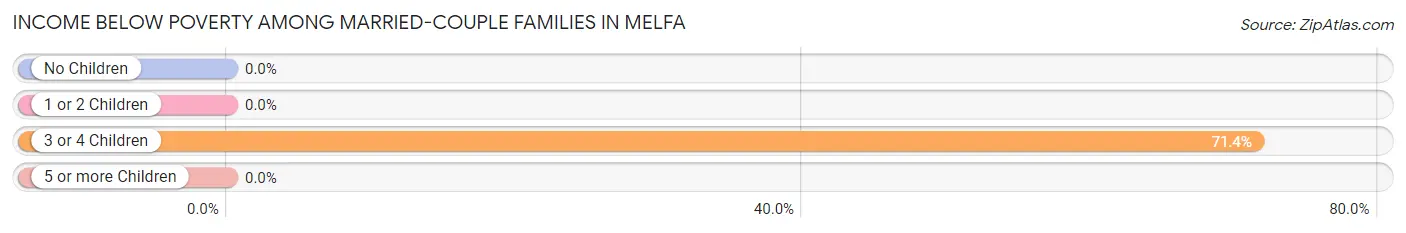
| Children | Above Poverty | Below Poverty |
| No Children | 17 (100.0%) | 0 (0.0%) |
| 1 or 2 Children | 21 (100.0%) | 0 (0.0%) |
| 3 or 4 Children | 2 (28.6%) | 5 (71.4%) |
| 5 or more Children | 0 (0.0%) | 0 (0.0%) |
| Total | 40 (88.9%) | 5 (11.1%) |
Income Below Poverty Among Single-Parent Households in Melfa
According to the poverty data in Melfa, 33.3% or 2 single-father households and 17.9% or 12 single-mother households are living below the poverty line. Among single-father households, those with no children have the highest poverty rate, with 2 households (33.3%) experiencing poverty. Likewise, among single-mother households, those with 3 or 4 children have the highest poverty rate, with 7 households (100.0%) falling below the poverty line.
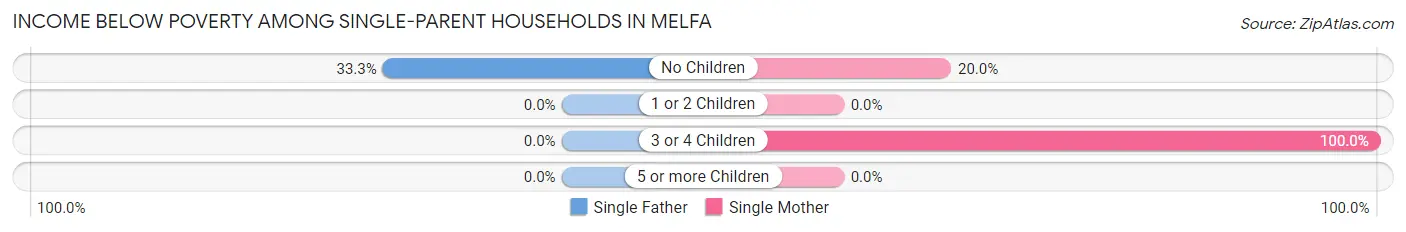
| Children | Single Father | Single Mother |
| No Children | 2 (33.3%) | 5 (20.0%) |
| 1 or 2 Children | 0 (0.0%) | 0 (0.0%) |
| 3 or 4 Children | 0 (0.0%) | 7 (100.0%) |
| 5 or more Children | 0 (0.0%) | 0 (0.0%) |
| Total | 2 (33.3%) | 12 (17.9%) |
Income Below Poverty Among Married-Couple vs Single-Parent Households in Melfa
The poverty data for Melfa shows that 5 of the married-couple family households (11.1%) and 14 of the single-parent households (19.2%) are living below the poverty level. Within the married-couple family households, those with 3 or 4 children have the highest poverty rate, with 5 households (71.4%) falling below the poverty line. Among the single-parent households, those with 3 or 4 children have the highest poverty rate, with 7 household (100.0%) living below poverty.
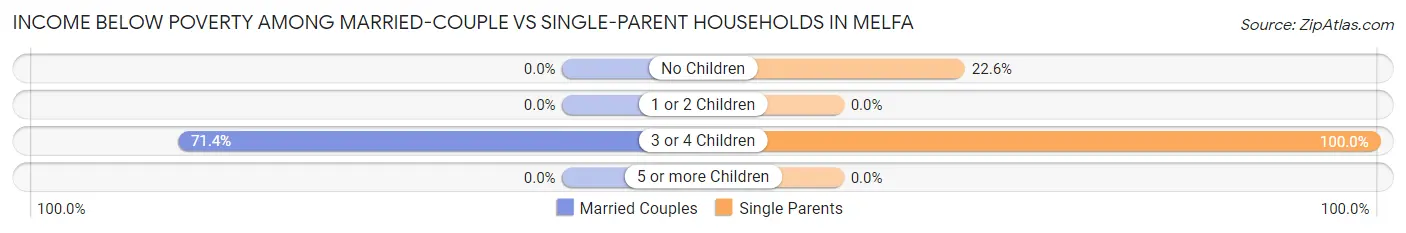
| Children | Married-Couple Families | Single-Parent Households |
| No Children | 0 (0.0%) | 7 (22.6%) |
| 1 or 2 Children | 0 (0.0%) | 0 (0.0%) |
| 3 or 4 Children | 5 (71.4%) | 7 (100.0%) |
| 5 or more Children | 0 (0.0%) | 0 (0.0%) |
| Total | 5 (11.1%) | 14 (19.2%) |
Race in Melfa
The most populous races in Melfa are White / Caucasian (281 | 64.4%), Black / African American (109 | 25.0%), and Two or more Races (23 | 5.3%).
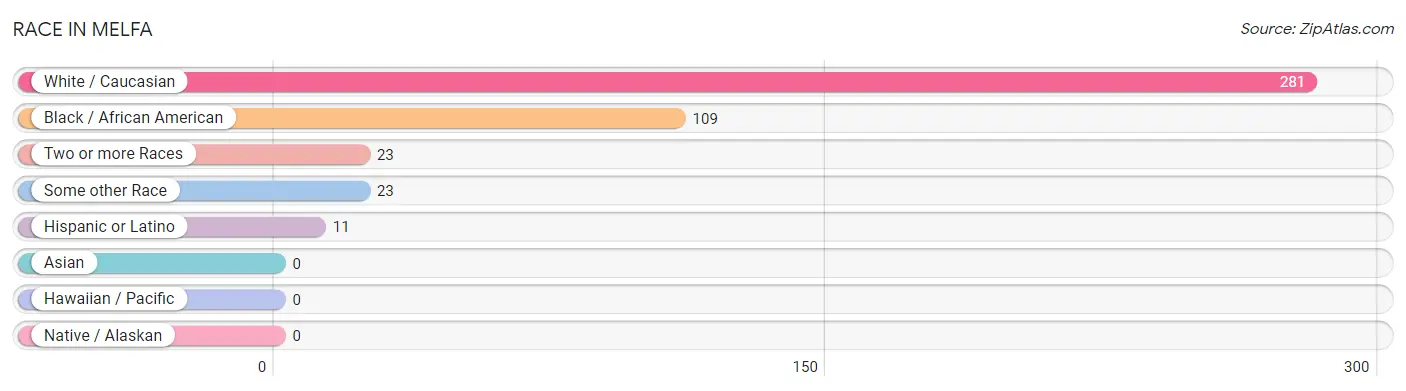
| Race | # Population | % Population |
| Asian | 0 | 0.0% |
| Black / African American | 109 | 25.0% |
| Hawaiian / Pacific | 0 | 0.0% |
| Hispanic or Latino | 11 | 2.5% |
| Native / Alaskan | 0 | 0.0% |
| White / Caucasian | 281 | 64.4% |
| Two or more Races | 23 | 5.3% |
| Some other Race | 23 | 5.3% |
| Total | 436 | 100.0% |
Ancestry in Melfa
The most populous ancestries reported in Melfa are American (206 | 47.2%), German (52 | 11.9%), English (48 | 11.0%), Irish (23 | 5.3%), and Haitian (18 | 4.1%), together accounting for 79.6% of all Melfa residents.
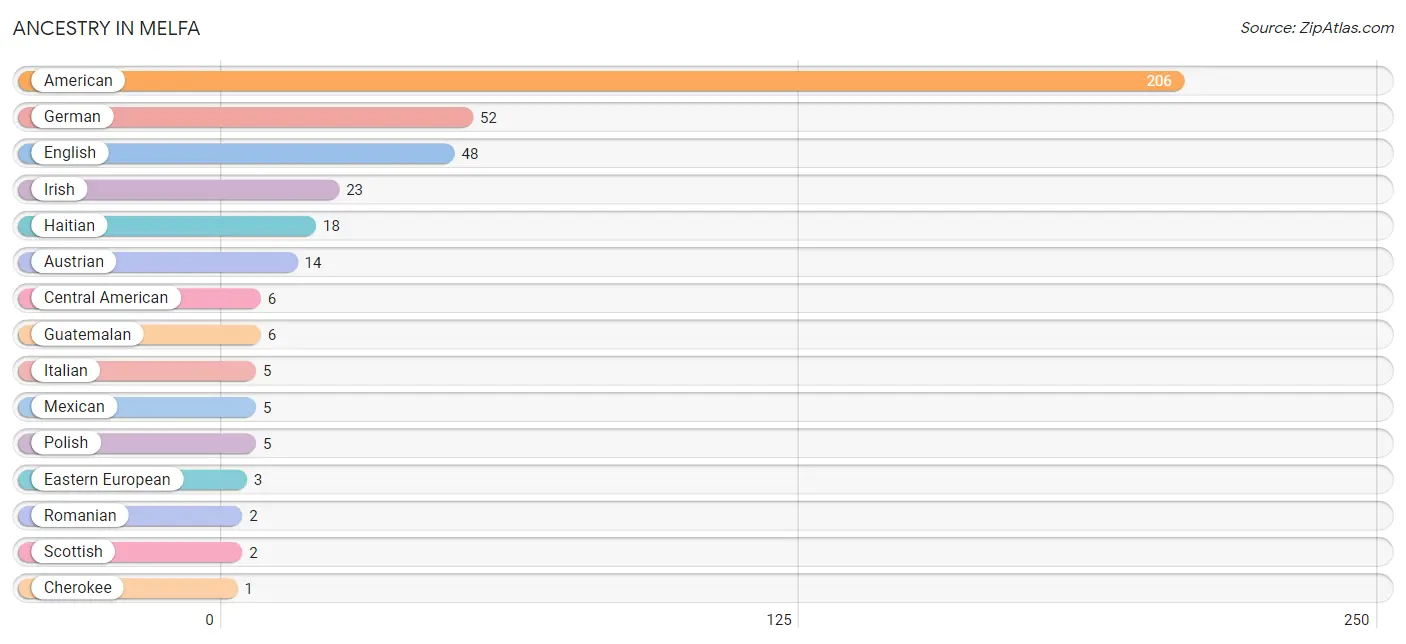
| Ancestry | # Population | % Population |
| American | 206 | 47.2% |
| Austrian | 14 | 3.2% |
| Central American | 6 | 1.4% |
| Cherokee | 1 | 0.2% |
| Eastern European | 3 | 0.7% |
| English | 48 | 11.0% |
| French | 1 | 0.2% |
| German | 52 | 11.9% |
| Guatemalan | 6 | 1.4% |
| Haitian | 18 | 4.1% |
| Irish | 23 | 5.3% |
| Italian | 5 | 1.1% |
| Mexican | 5 | 1.1% |
| Polish | 5 | 1.1% |
| Romanian | 2 | 0.5% |
| Scottish | 2 | 0.5% | View All 16 Rows |
Immigrants in Melfa
The most numerous immigrant groups reported in Melfa came from Latin America (26 | 6.0%), Caribbean (20 | 4.6%), Haiti (20 | 4.6%), Central America (6 | 1.4%), and Guatemala (6 | 1.4%), together accounting for 17.9% of all Melfa residents.
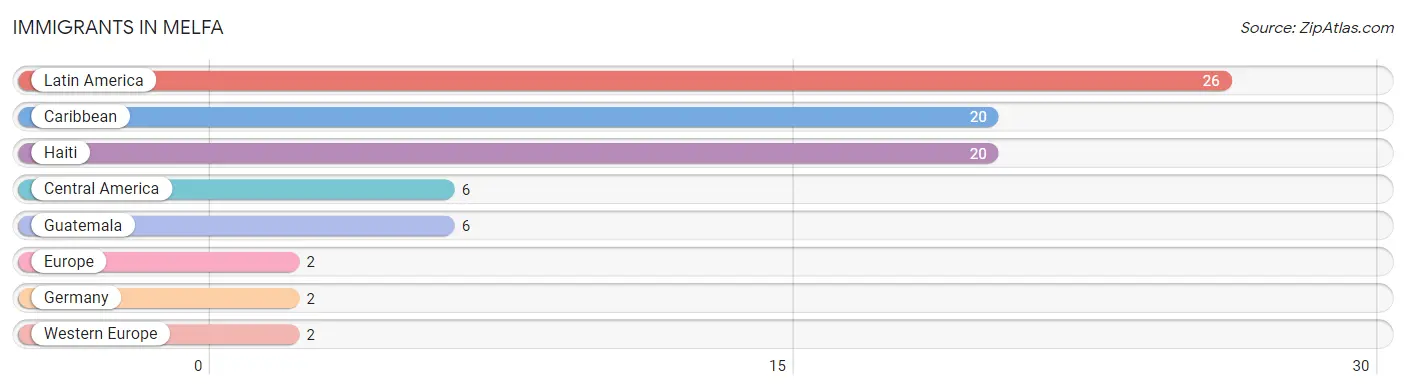
| Immigration Origin | # Population | % Population |
| Caribbean | 20 | 4.6% |
| Central America | 6 | 1.4% |
| Europe | 2 | 0.5% |
| Germany | 2 | 0.5% |
| Guatemala | 6 | 1.4% |
| Haiti | 20 | 4.6% |
| Latin America | 26 | 6.0% |
| Western Europe | 2 | 0.5% | View All 8 Rows |
Sex and Age in Melfa
Sex and Age in Melfa
The most populous age groups in Melfa are 15 to 19 Years (55 | 30.0%) for men and 45 to 49 Years (57 | 22.5%) for women.
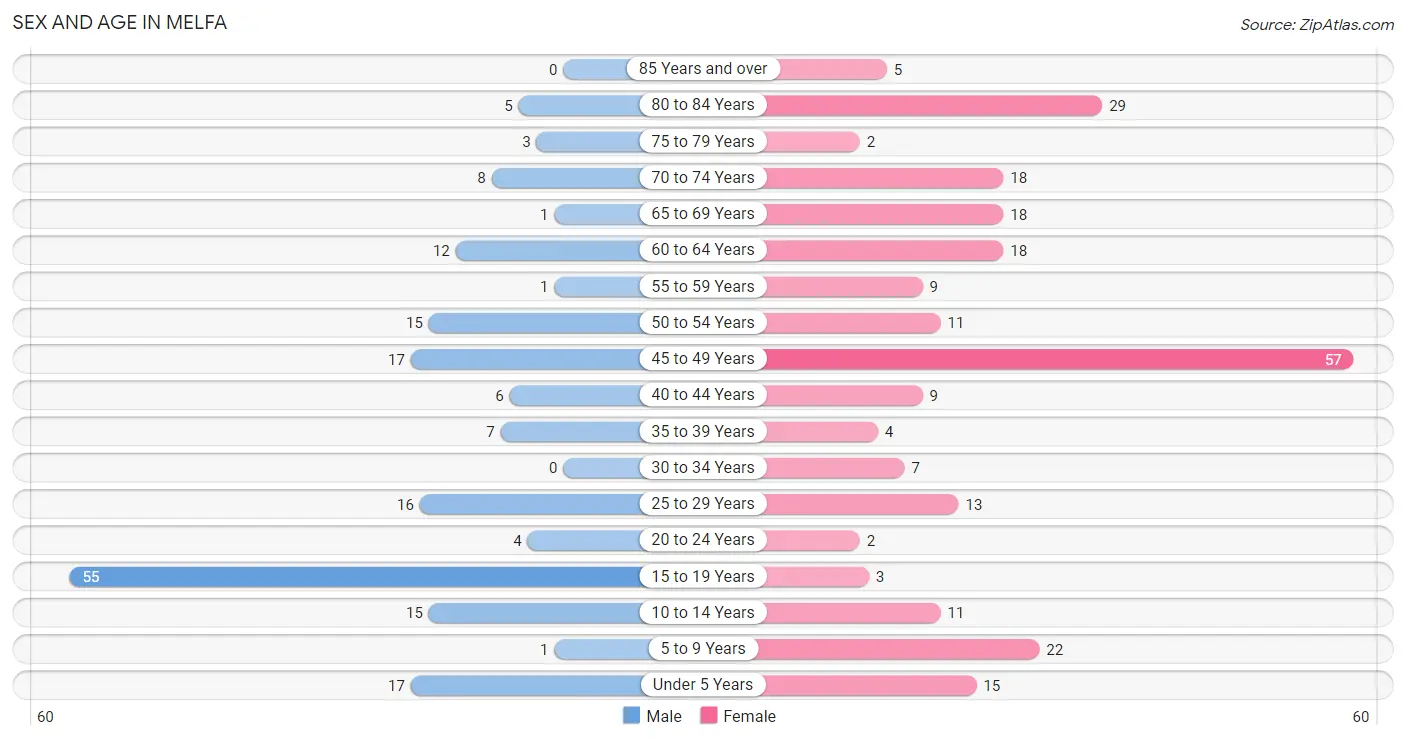
| Age Bracket | Male | Female |
| Under 5 Years | 17 (9.3%) | 15 (5.9%) |
| 5 to 9 Years | 1 (0.5%) | 22 (8.7%) |
| 10 to 14 Years | 15 (8.2%) | 11 (4.3%) |
| 15 to 19 Years | 55 (30.0%) | 3 (1.2%) |
| 20 to 24 Years | 4 (2.2%) | 2 (0.8%) |
| 25 to 29 Years | 16 (8.7%) | 13 (5.1%) |
| 30 to 34 Years | 0 (0.0%) | 7 (2.8%) |
| 35 to 39 Years | 7 (3.8%) | 4 (1.6%) |
| 40 to 44 Years | 6 (3.3%) | 9 (3.6%) |
| 45 to 49 Years | 17 (9.3%) | 57 (22.5%) |
| 50 to 54 Years | 15 (8.2%) | 11 (4.3%) |
| 55 to 59 Years | 1 (0.5%) | 9 (3.6%) |
| 60 to 64 Years | 12 (6.6%) | 18 (7.1%) |
| 65 to 69 Years | 1 (0.5%) | 18 (7.1%) |
| 70 to 74 Years | 8 (4.4%) | 18 (7.1%) |
| 75 to 79 Years | 3 (1.6%) | 2 (0.8%) |
| 80 to 84 Years | 5 (2.7%) | 29 (11.5%) |
| 85 Years and over | 0 (0.0%) | 5 (2.0%) |
| Total | 183 (100.0%) | 253 (100.0%) |
Families and Households in Melfa
Median Family Size in Melfa
The median family size in Melfa is 2.76 persons per family, with married-couple families (45 | 38.1%) accounting for the largest median family size of 3.16 persons per family. On the other hand, single male/father families (6 | 5.1%) represent the smallest median family size with 1.50 persons per family.
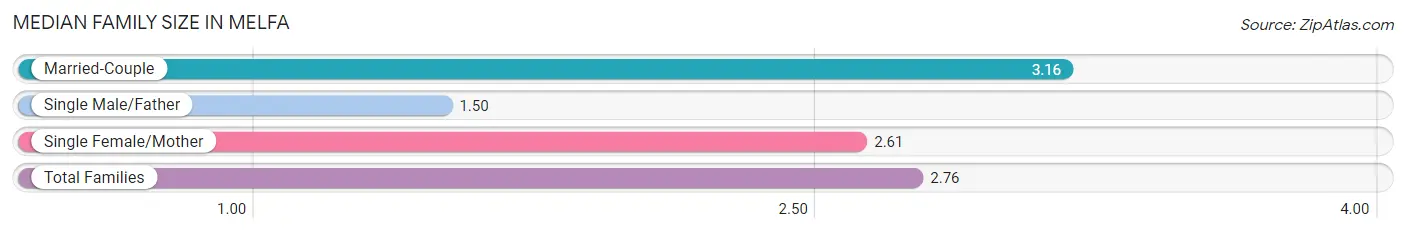
| Family Type | # Families | Family Size |
| Married-Couple | 45 (38.1%) | 3.16 |
| Single Male/Father | 6 (5.1%) | 1.50 |
| Single Female/Mother | 67 (56.8%) | 2.61 |
| Total Families | 118 (100.0%) | 2.76 |
Median Household Size in Melfa
The median household size in Melfa is 1.96 persons per household, with married-couple households (45 | 20.3%) accounting for the largest median household size of 3.16 persons per household. non-family households (104 | 46.9%) represent the smallest median household size with 1.06 persons per household.
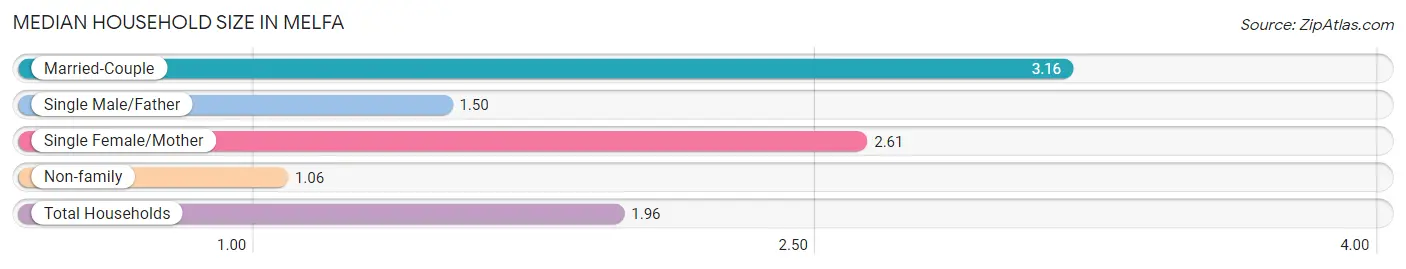
| Household Type | # Households | Household Size |
| Married-Couple | 45 (20.3%) | 3.16 |
| Single Male/Father | 6 (2.7%) | 1.50 |
| Single Female/Mother | 67 (30.2%) | 2.61 |
| Non-family | 104 (46.9%) | 1.06 |
| Total Households | 222 (100.0%) | 1.96 |
Household Size by Marriage Status in Melfa
Out of a total of 222 households in Melfa, 118 (53.1%) are family households, while 104 (46.9%) are nonfamily households. The most numerous type of family households are 2-person households, comprising 71, and the most common type of nonfamily households are 1-person households, comprising 98.
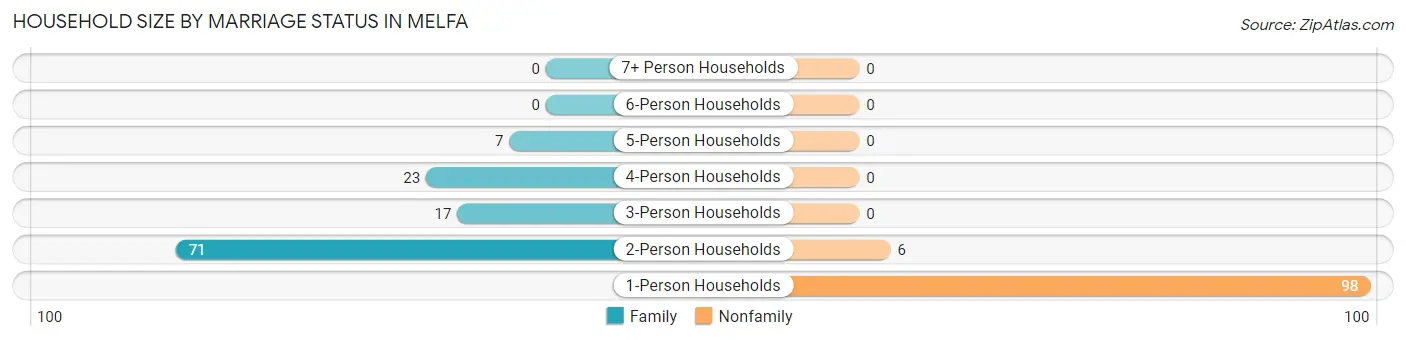
| Household Size | Family Households | Nonfamily Households |
| 1-Person Households | - | 98 (44.1%) |
| 2-Person Households | 71 (32.0%) | 6 (2.7%) |
| 3-Person Households | 17 (7.7%) | 0 (0.0%) |
| 4-Person Households | 23 (10.4%) | 0 (0.0%) |
| 5-Person Households | 7 (3.2%) | 0 (0.0%) |
| 6-Person Households | 0 (0.0%) | 0 (0.0%) |
| 7+ Person Households | 0 (0.0%) | 0 (0.0%) |
| Total | 118 (53.1%) | 104 (46.9%) |
Female Fertility in Melfa
Fertility by Age in Melfa
Average fertility rate in Melfa is 19.0 births per 1,000 women. Women in the age bracket of 35 to 50 years have the highest fertility rate with 25.0 births per 1,000 women. Women in the age bracket of 35 to 50 years acount for 100.0% of all women with births.
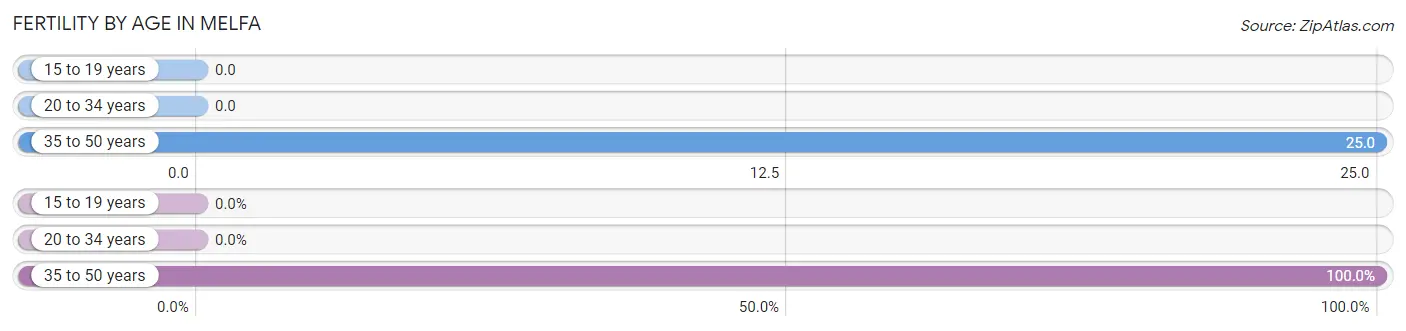
| Age Bracket | Women with Births | Births / 1,000 Women |
| 15 to 19 years | 0 (0.0%) | 0.0 |
| 20 to 34 years | 0 (0.0%) | 0.0 |
| 35 to 50 years | 2 (100.0%) | 25.0 |
| Total | 2 (100.0%) | 19.0 |
Fertility by Age by Marriage Status in Melfa
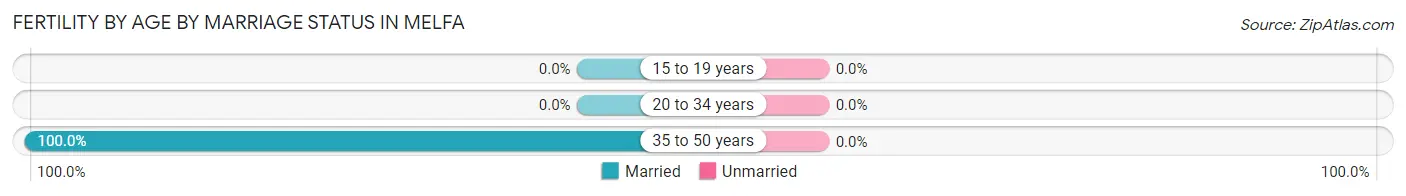
| Age Bracket | Married | Unmarried |
| 15 to 19 years | 0 (0.0%) | 0 (0.0%) |
| 20 to 34 years | 0 (0.0%) | 0 (0.0%) |
| 35 to 50 years | 2 (100.0%) | 0 (0.0%) |
| Total | 2 (100.0%) | 0 (0.0%) |
Fertility by Education in Melfa
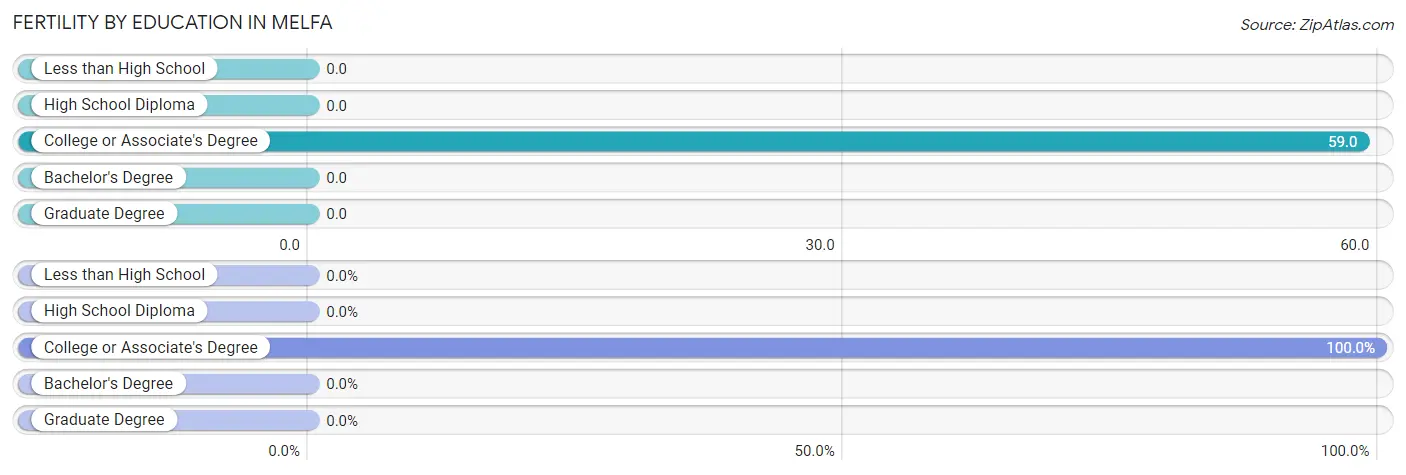
| Educational Attainment | Women with Births | Births / 1,000 Women |
| Less than High School | 0 (0.0%) | 0.0 |
| High School Diploma | 0 (0.0%) | 0.0 |
| College or Associate's Degree | 2 (100.0%) | 59.0 |
| Bachelor's Degree | 0 (0.0%) | 0.0 |
| Graduate Degree | 0 (0.0%) | 0.0 |
| Total | 2 (100.0%) | 19.0 |
Fertility by Education by Marriage Status in Melfa
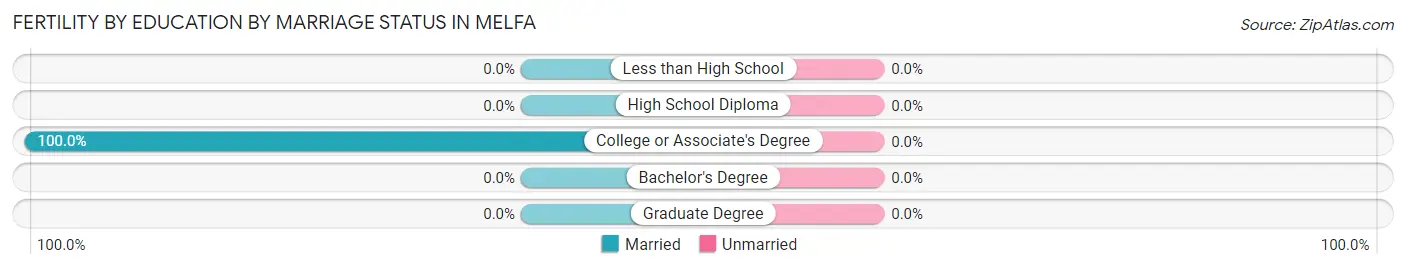
| Educational Attainment | Married | Unmarried |
| Less than High School | 0 (0.0%) | 0 (0.0%) |
| High School Diploma | 0 (0.0%) | 0 (0.0%) |
| College or Associate's Degree | 2 (100.0%) | 0 (0.0%) |
| Bachelor's Degree | 0 (0.0%) | 0 (0.0%) |
| Graduate Degree | 0 (0.0%) | 0 (0.0%) |
| Total | 2 (100.0%) | 0 (0.0%) |
Employment Characteristics in Melfa
Employment by Class of Employer in Melfa
Among the 176 employed individuals in Melfa, private company employees (117 | 66.5%), local government employees (29 | 16.5%), and self-employed (not incorporated) (13 | 7.4%) make up the most common classes of employment.
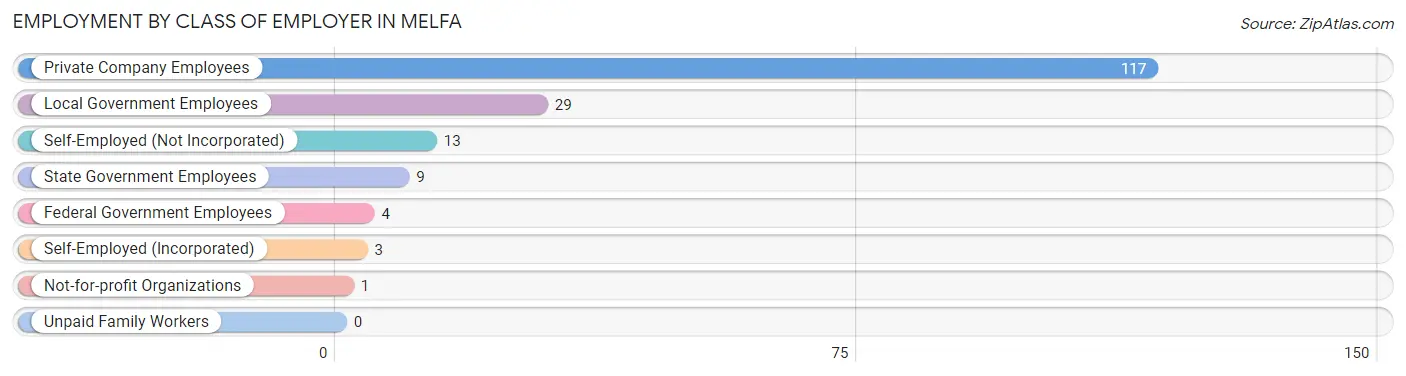
| Employer Class | # Employees | % Employees |
| Private Company Employees | 117 | 66.5% |
| Self-Employed (Incorporated) | 3 | 1.7% |
| Self-Employed (Not Incorporated) | 13 | 7.4% |
| Not-for-profit Organizations | 1 | 0.6% |
| Local Government Employees | 29 | 16.5% |
| State Government Employees | 9 | 5.1% |
| Federal Government Employees | 4 | 2.3% |
| Unpaid Family Workers | 0 | 0.0% |
| Total | 176 | 100.0% |
Employment Status by Age in Melfa
According to the labor force statistics for Melfa, out of the total population over 16 years of age (351), 55.3% or 194 individuals are in the labor force, with 4.6% or 9 of them unemployed. The age group with the highest labor force participation rate is 20 to 24 years, with 100.0% or 6 individuals in the labor force. Within the labor force, the 35 to 44 years age range has the highest percentage of unemployed individuals, with 10.0% or 2 of them being unemployed.
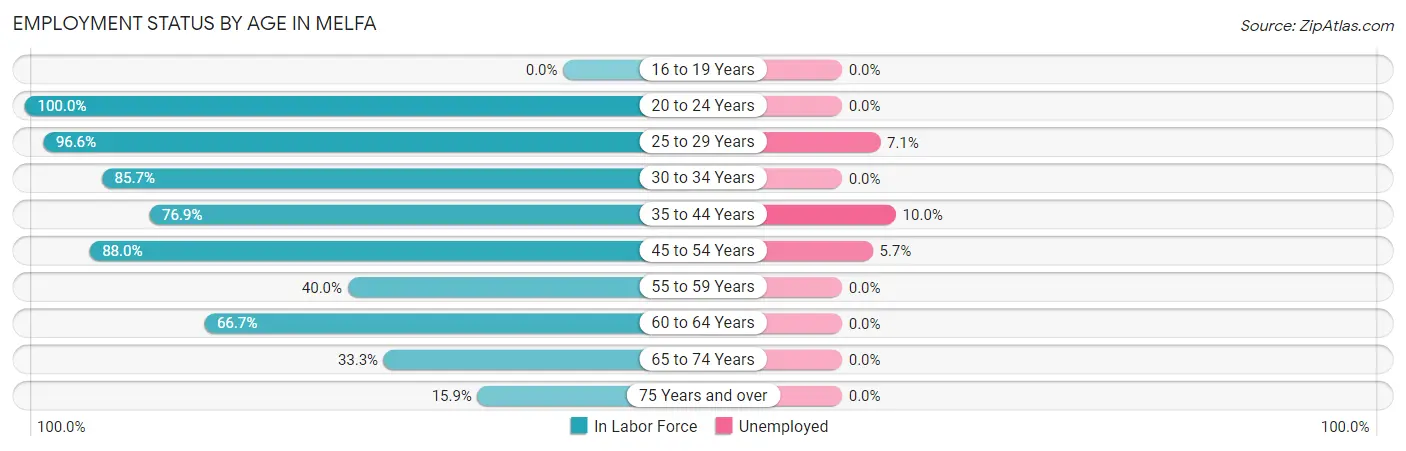
| Age Bracket | In Labor Force | Unemployed |
| 16 to 19 Years | 0 (0.0%) | 0 (0.0%) |
| 20 to 24 Years | 6 (100.0%) | 0 (0.0%) |
| 25 to 29 Years | 28 (96.6%) | 2 (7.1%) |
| 30 to 34 Years | 6 (85.7%) | 0 (0.0%) |
| 35 to 44 Years | 20 (76.9%) | 2 (10.0%) |
| 45 to 54 Years | 88 (88.0%) | 5 (5.7%) |
| 55 to 59 Years | 4 (40.0%) | 0 (0.0%) |
| 60 to 64 Years | 20 (66.7%) | 0 (0.0%) |
| 65 to 74 Years | 15 (33.3%) | 0 (0.0%) |
| 75 Years and over | 7 (15.9%) | 0 (0.0%) |
| Total | 194 (55.3%) | 9 (4.6%) |
Employment Status by Educational Attainment in Melfa
According to labor force statistics for Melfa, 82.2% of individuals (166) out of the total population between 25 and 64 years of age (202) are in the labor force, with 5.4% or 9 of them being unemployed. The group with the highest labor force participation rate are those with the educational attainment of high school diploma, with 97.6% or 80 individuals in the labor force. Within the labor force, individuals with less than high school education have the highest percentage of unemployment, with 33.3% or 2 of them being unemployed.
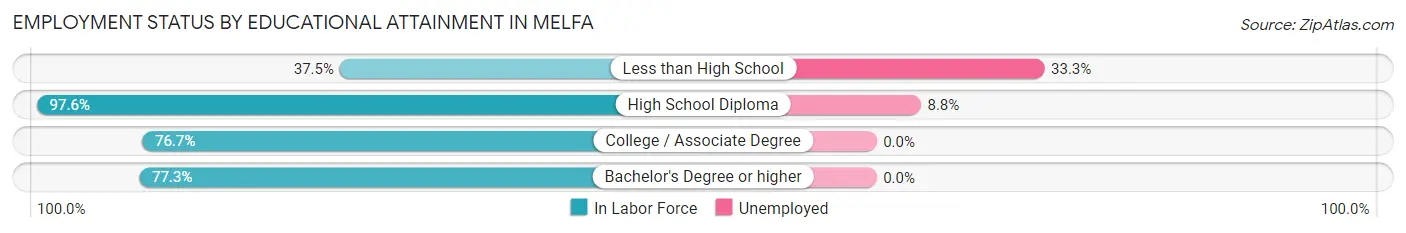
| Educational Attainment | In Labor Force | Unemployed |
| Less than High School | 6 (37.5%) | 5 (33.3%) |
| High School Diploma | 80 (97.6%) | 7 (8.8%) |
| College / Associate Degree | 46 (76.7%) | 0 (0.0%) |
| Bachelor's Degree or higher | 34 (77.3%) | 0 (0.0%) |
| Total | 166 (82.2%) | 11 (5.4%) |
Employment Occupations by Sex in Melfa
Management, Business, Science and Arts Occupations
The most common Management, Business, Science and Arts occupations in Melfa are Community & Social Service (34 | 18.4%), Education Instruction & Library (26 | 14.1%), Business & Financial (12 | 6.5%), Management (8 | 4.3%), and Education, Arts & Media (8 | 4.3%).
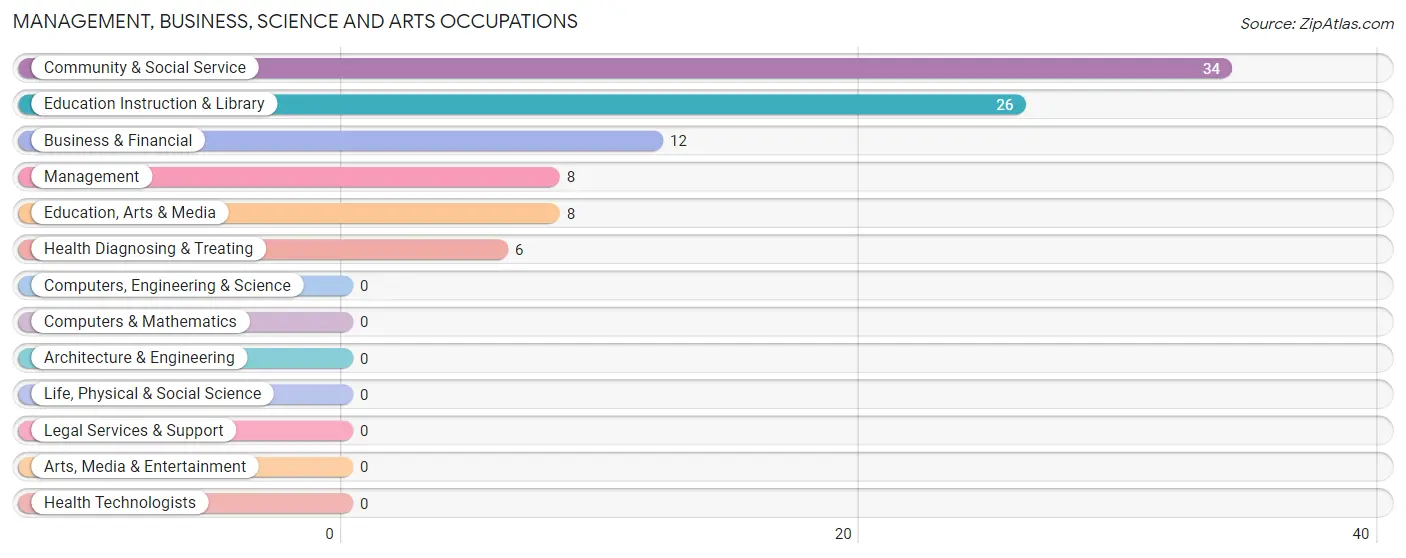
Management, Business, Science and Arts Occupations by Sex
Within the Management, Business, Science and Arts occupations in Melfa, the most male-oriented occupations are Management (100.0%), Education, Arts & Media (62.5%), and Community & Social Service (14.7%), while the most female-oriented occupations are Business & Financial (100.0%), Education Instruction & Library (100.0%), and Health Diagnosing & Treating (100.0%).
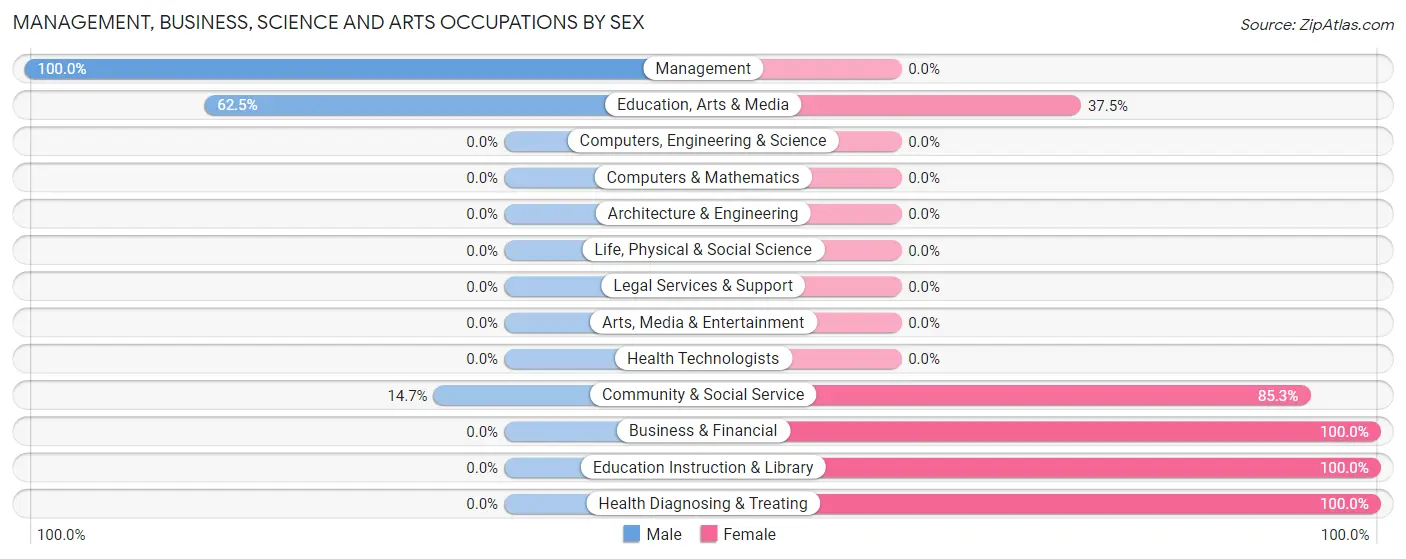
| Occupation | Male | Female |
| Management | 8 (100.0%) | 0 (0.0%) |
| Business & Financial | 0 (0.0%) | 12 (100.0%) |
| Computers, Engineering & Science | 0 (0.0%) | 0 (0.0%) |
| Computers & Mathematics | 0 (0.0%) | 0 (0.0%) |
| Architecture & Engineering | 0 (0.0%) | 0 (0.0%) |
| Life, Physical & Social Science | 0 (0.0%) | 0 (0.0%) |
| Community & Social Service | 5 (14.7%) | 29 (85.3%) |
| Education, Arts & Media | 5 (62.5%) | 3 (37.5%) |
| Legal Services & Support | 0 (0.0%) | 0 (0.0%) |
| Education Instruction & Library | 0 (0.0%) | 26 (100.0%) |
| Arts, Media & Entertainment | 0 (0.0%) | 0 (0.0%) |
| Health Diagnosing & Treating | 0 (0.0%) | 6 (100.0%) |
| Health Technologists | 0 (0.0%) | 0 (0.0%) |
| Total (Category) | 13 (21.7%) | 47 (78.3%) |
| Total (Overall) | 64 (34.6%) | 121 (65.4%) |
Services Occupations
The most common Services occupations in Melfa are Security & Protection (12 | 6.5%), Cleaning & Maintenance (10 | 5.4%), Healthcare Support (6 | 3.2%), Firefighting & Prevention (6 | 3.2%), and Law Enforcement (6 | 3.2%).
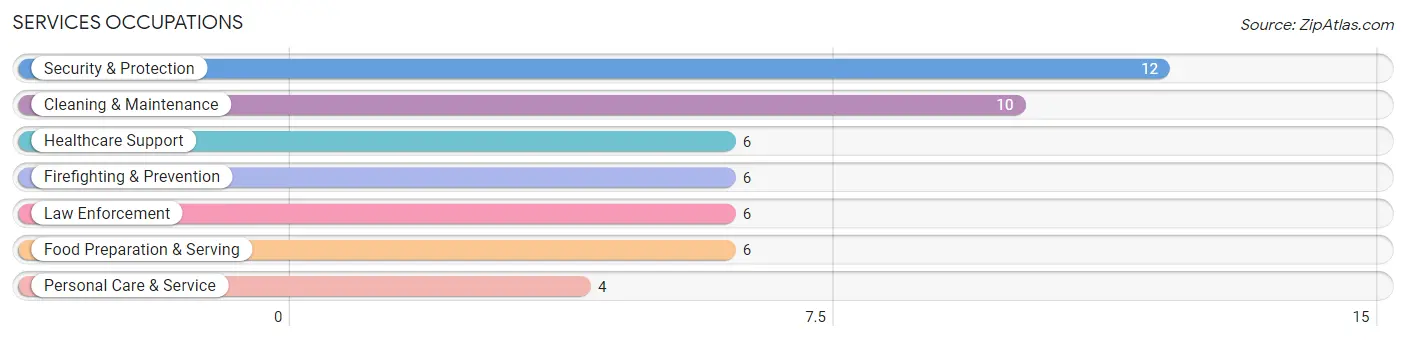
Services Occupations by Sex
Within the Services occupations in Melfa, the most male-oriented occupations are Firefighting & Prevention (100.0%), Cleaning & Maintenance (100.0%), and Security & Protection (75.0%), while the most female-oriented occupations are Healthcare Support (100.0%), Food Preparation & Serving (100.0%), and Personal Care & Service (100.0%).
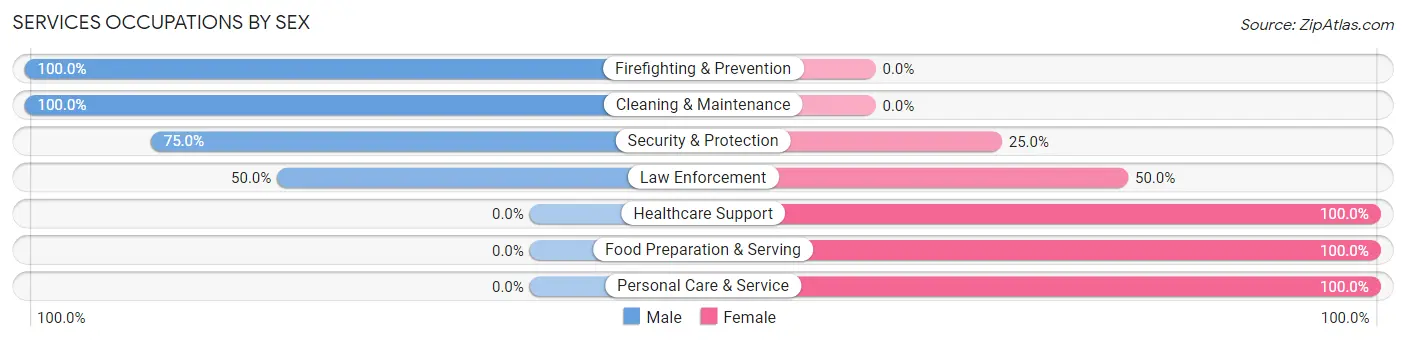
| Occupation | Male | Female |
| Healthcare Support | 0 (0.0%) | 6 (100.0%) |
| Security & Protection | 9 (75.0%) | 3 (25.0%) |
| Firefighting & Prevention | 6 (100.0%) | 0 (0.0%) |
| Law Enforcement | 3 (50.0%) | 3 (50.0%) |
| Food Preparation & Serving | 0 (0.0%) | 6 (100.0%) |
| Cleaning & Maintenance | 10 (100.0%) | 0 (0.0%) |
| Personal Care & Service | 0 (0.0%) | 4 (100.0%) |
| Total (Category) | 19 (50.0%) | 19 (50.0%) |
| Total (Overall) | 64 (34.6%) | 121 (65.4%) |
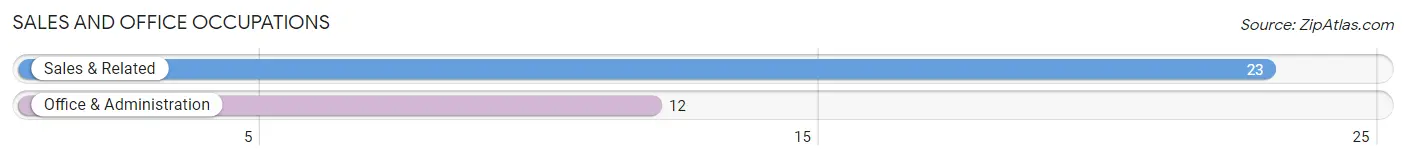
Sales and Office Occupations
The most common Sales and Office occupations in Melfa are Sales & Related (23 | 12.4%), and Office & Administration (12 | 6.5%).
Sales and Office Occupations by Sex
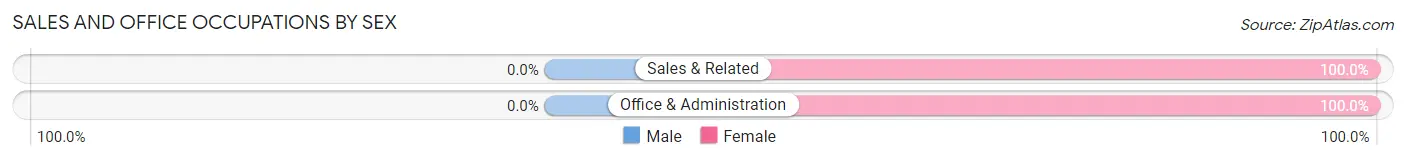
| Occupation | Male | Female |
| Sales & Related | 0 (0.0%) | 23 (100.0%) |
| Office & Administration | 0 (0.0%) | 12 (100.0%) |
| Total (Category) | 0 (0.0%) | 35 (100.0%) |
| Total (Overall) | 64 (34.6%) | 121 (65.4%) |
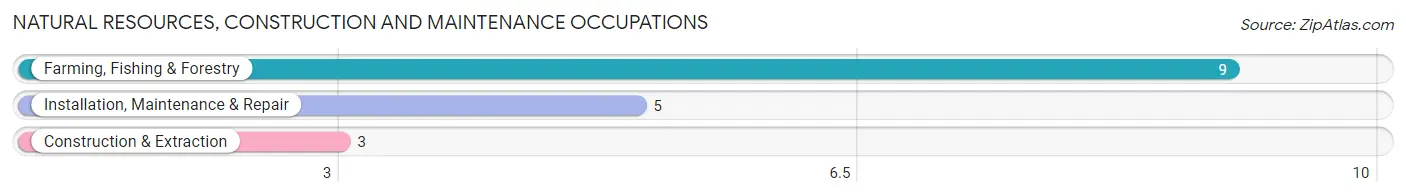
Natural Resources, Construction and Maintenance Occupations
The most common Natural Resources, Construction and Maintenance occupations in Melfa are Farming, Fishing & Forestry (9 | 4.9%), Installation, Maintenance & Repair (5 | 2.7%), and Construction & Extraction (3 | 1.6%).
Natural Resources, Construction and Maintenance Occupations by Sex
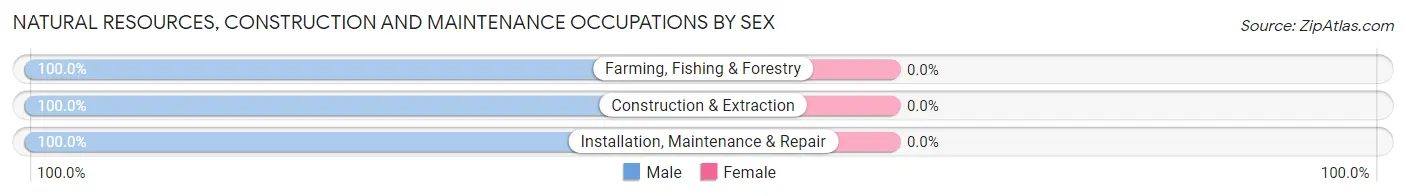
| Occupation | Male | Female |
| Farming, Fishing & Forestry | 9 (100.0%) | 0 (0.0%) |
| Construction & Extraction | 3 (100.0%) | 0 (0.0%) |
| Installation, Maintenance & Repair | 5 (100.0%) | 0 (0.0%) |
| Total (Category) | 17 (100.0%) | 0 (0.0%) |
| Total (Overall) | 64 (34.6%) | 121 (65.4%) |
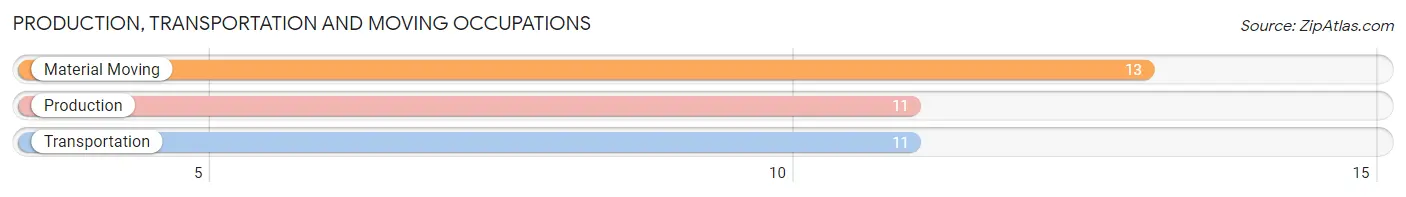
Production, Transportation and Moving Occupations
The most common Production, Transportation and Moving occupations in Melfa are Material Moving (13 | 7.0%), Production (11 | 5.9%), and Transportation (11 | 5.9%).
Production, Transportation and Moving Occupations by Sex
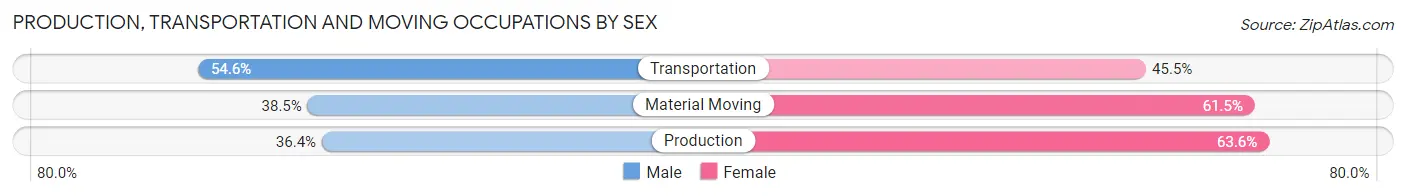
| Occupation | Male | Female |
| Production | 4 (36.4%) | 7 (63.6%) |
| Transportation | 6 (54.5%) | 5 (45.5%) |
| Material Moving | 5 (38.5%) | 8 (61.5%) |
| Total (Category) | 15 (42.9%) | 20 (57.1%) |
| Total (Overall) | 64 (34.6%) | 121 (65.4%) |
Employment Industries by Sex in Melfa
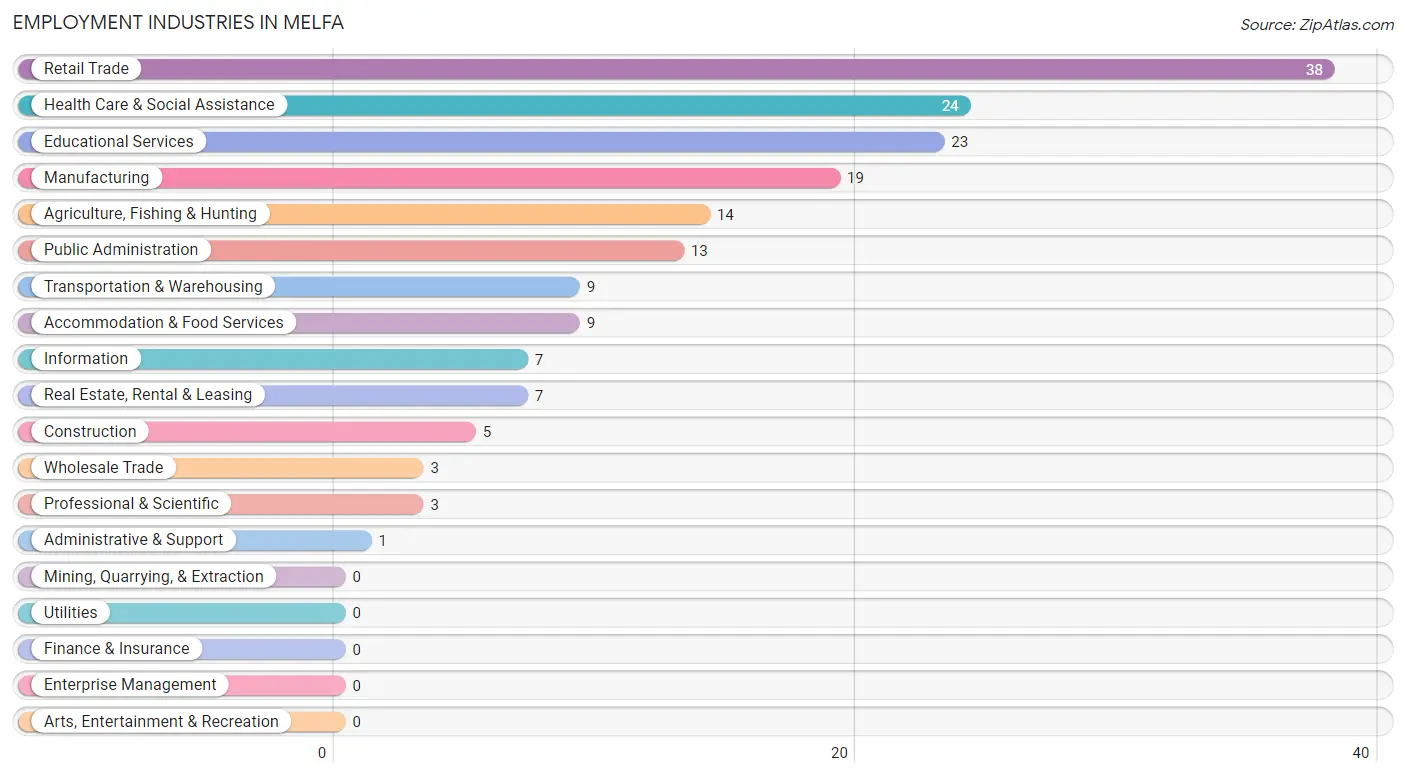
Employment Industries in Melfa
The major employment industries in Melfa include Retail Trade (38 | 20.5%), Health Care & Social Assistance (24 | 13.0%), Educational Services (23 | 12.4%), Manufacturing (19 | 10.3%), and Agriculture, Fishing & Hunting (14 | 7.6%).
Employment Industries by Sex in Melfa
The Melfa industries that see more men than women are Construction (80.0%), Wholesale Trade (66.7%), and Agriculture, Fishing & Hunting (64.3%), whereas the industries that tend to have a higher number of women are Information (100.0%), Real Estate, Rental & Leasing (100.0%), and Professional & Scientific (100.0%).
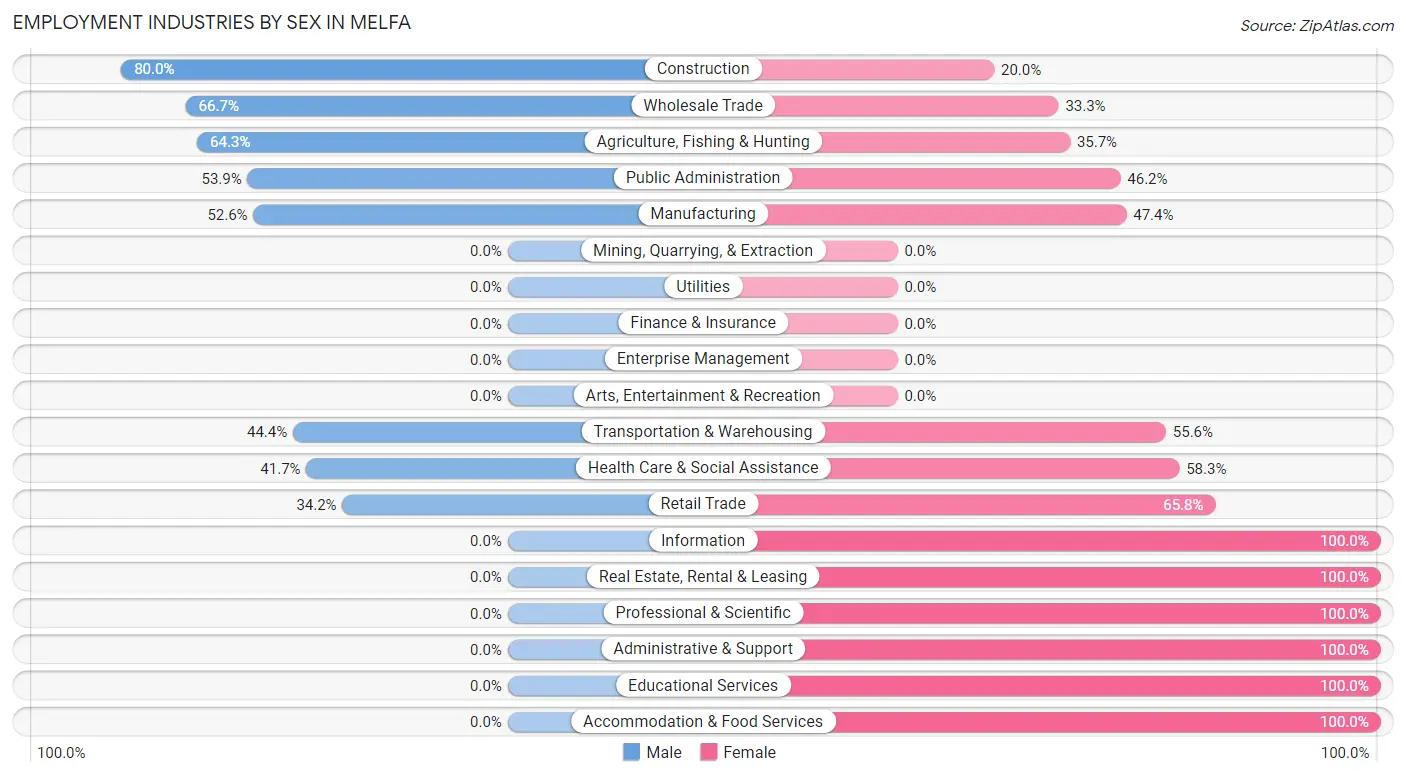
| Industry | Male | Female |
| Agriculture, Fishing & Hunting | 9 (64.3%) | 5 (35.7%) |
| Mining, Quarrying, & Extraction | 0 (0.0%) | 0 (0.0%) |
| Construction | 4 (80.0%) | 1 (20.0%) |
| Manufacturing | 10 (52.6%) | 9 (47.4%) |
| Wholesale Trade | 2 (66.7%) | 1 (33.3%) |
| Retail Trade | 13 (34.2%) | 25 (65.8%) |
| Transportation & Warehousing | 4 (44.4%) | 5 (55.6%) |
| Utilities | 0 (0.0%) | 0 (0.0%) |
| Information | 0 (0.0%) | 7 (100.0%) |
| Finance & Insurance | 0 (0.0%) | 0 (0.0%) |
| Real Estate, Rental & Leasing | 0 (0.0%) | 7 (100.0%) |
| Professional & Scientific | 0 (0.0%) | 3 (100.0%) |
| Enterprise Management | 0 (0.0%) | 0 (0.0%) |
| Administrative & Support | 0 (0.0%) | 1 (100.0%) |
| Educational Services | 0 (0.0%) | 23 (100.0%) |
| Health Care & Social Assistance | 10 (41.7%) | 14 (58.3%) |
| Arts, Entertainment & Recreation | 0 (0.0%) | 0 (0.0%) |
| Accommodation & Food Services | 0 (0.0%) | 9 (100.0%) |
| Public Administration | 7 (53.8%) | 6 (46.2%) |
| Total | 64 (34.6%) | 121 (65.4%) |
Education in Melfa
School Enrollment in Melfa
The most common levels of schooling among the 114 students in Melfa are high school (68 | 59.7%), elementary school (23 | 20.2%), and middle school (15 | 13.2%).
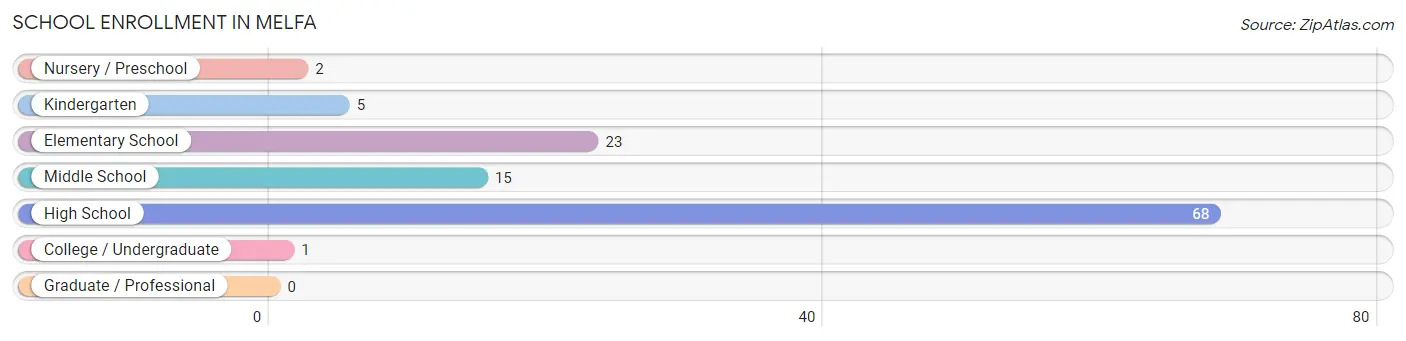
| School Level | # Students | % Students |
| Nursery / Preschool | 2 | 1.8% |
| Kindergarten | 5 | 4.4% |
| Elementary School | 23 | 20.2% |
| Middle School | 15 | 13.2% |
| High School | 68 | 59.7% |
| College / Undergraduate | 1 | 0.9% |
| Graduate / Professional | 0 | 0.0% |
| Total | 114 | 100.0% |
School Enrollment by Age by Funding Source in Melfa
Out of a total of 114 students who are enrolled in schools in Melfa, 16 (14.0%) attend a private institution, while the remaining 98 (86.0%) are enrolled in public schools. The age group of 35 years and over has the highest likelihood of being enrolled in private schools, with 1 (100.0% in the age bracket) enrolled. Conversely, the age group of 3 to 4 year olds has the lowest likelihood of being enrolled in a private school, with 6 (100.0% in the age bracket) attending a public institution.
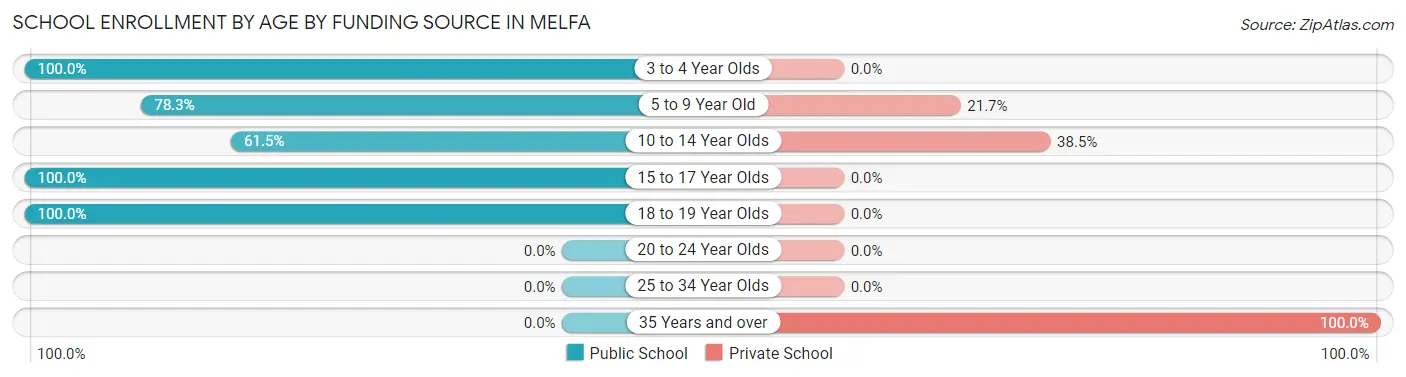
| Age Bracket | Public School | Private School |
| 3 to 4 Year Olds | 6 (100.0%) | 0 (0.0%) |
| 5 to 9 Year Old | 18 (78.3%) | 5 (21.7%) |
| 10 to 14 Year Olds | 16 (61.5%) | 10 (38.5%) |
| 15 to 17 Year Olds | 56 (100.0%) | 0 (0.0%) |
| 18 to 19 Year Olds | 2 (100.0%) | 0 (0.0%) |
| 20 to 24 Year Olds | 0 (0.0%) | 0 (0.0%) |
| 25 to 34 Year Olds | 0 (0.0%) | 0 (0.0%) |
| 35 Years and over | 0 (0.0%) | 1 (100.0%) |
| Total | 98 (86.0%) | 16 (14.0%) |
Educational Attainment by Field of Study in Melfa
Visual & performing arts (23 | 29.5%), education (16 | 20.5%), science & technology (10 | 12.8%), business (8 | 10.3%), and psychology (7 | 9.0%) are the most common fields of study among 78 individuals in Melfa who have obtained a bachelor's degree or higher.
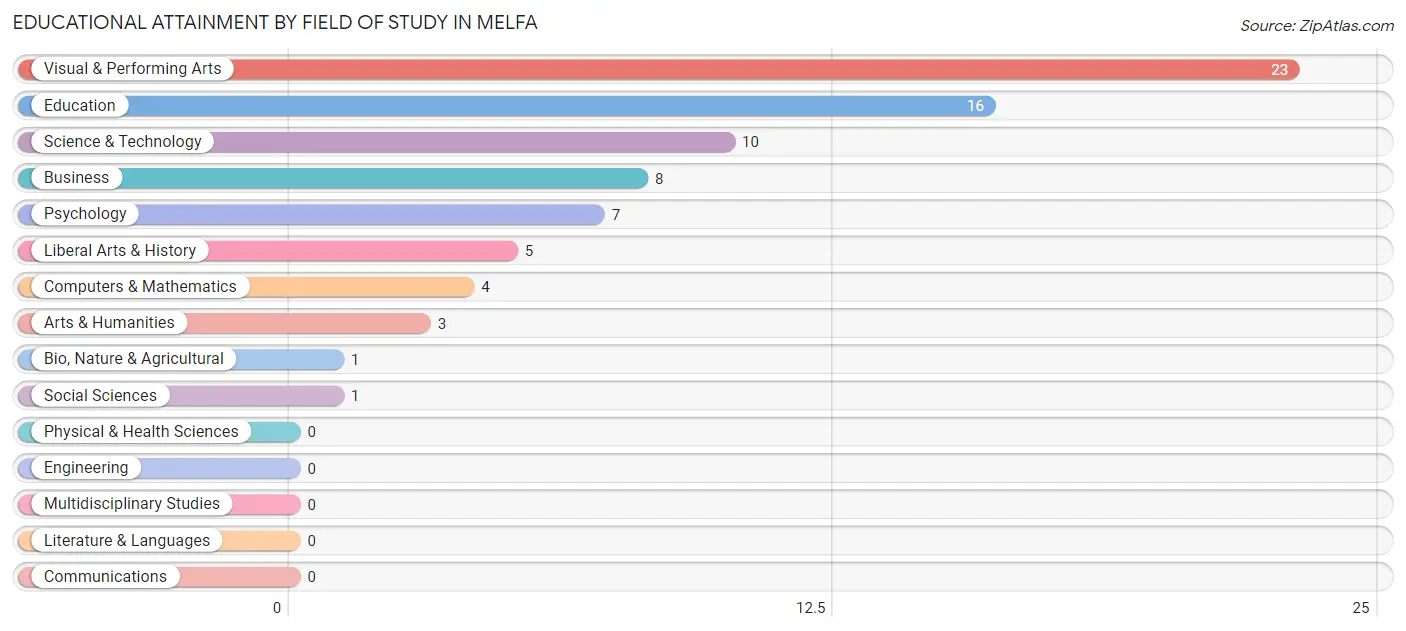
| Field of Study | # Graduates | % Graduates |
| Computers & Mathematics | 4 | 5.1% |
| Bio, Nature & Agricultural | 1 | 1.3% |
| Physical & Health Sciences | 0 | 0.0% |
| Psychology | 7 | 9.0% |
| Social Sciences | 1 | 1.3% |
| Engineering | 0 | 0.0% |
| Multidisciplinary Studies | 0 | 0.0% |
| Science & Technology | 10 | 12.8% |
| Business | 8 | 10.3% |
| Education | 16 | 20.5% |
| Literature & Languages | 0 | 0.0% |
| Liberal Arts & History | 5 | 6.4% |
| Visual & Performing Arts | 23 | 29.5% |
| Communications | 0 | 0.0% |
| Arts & Humanities | 3 | 3.8% |
| Total | 78 | 100.0% |
Transportation & Commute in Melfa
Vehicle Availability by Sex in Melfa
The most prevalent vehicle ownership categories in Melfa are males with 2 vehicles (40, accounting for 62.5%) and females with 2 vehicles (64, making up 35.7%).
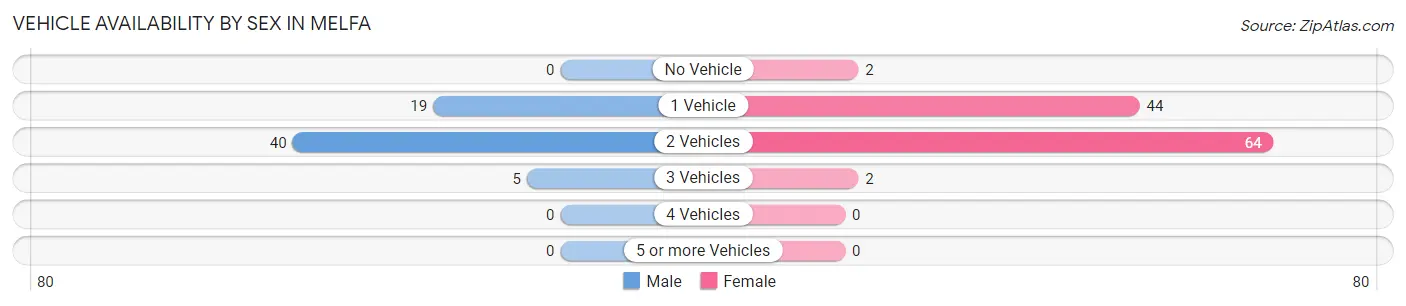
| Vehicles Available | Male | Female |
| No Vehicle | 0 (0.0%) | 2 (1.8%) |
| 1 Vehicle | 19 (29.7%) | 44 (39.3%) |
| 2 Vehicles | 40 (62.5%) | 64 (57.1%) |
| 3 Vehicles | 5 (7.8%) | 2 (1.8%) |
| 4 Vehicles | 0 (0.0%) | 0 (0.0%) |
| 5 or more Vehicles | 0 (0.0%) | 0 (0.0%) |
| Total | 64 (100.0%) | 112 (100.0%) |
Commute Time in Melfa
The most frequently occuring commute durations in Melfa are 15 to 19 minutes (43 commuters, 27.4%), 10 to 14 minutes (28 commuters, 17.8%), and 20 to 24 minutes (27 commuters, 17.2%).
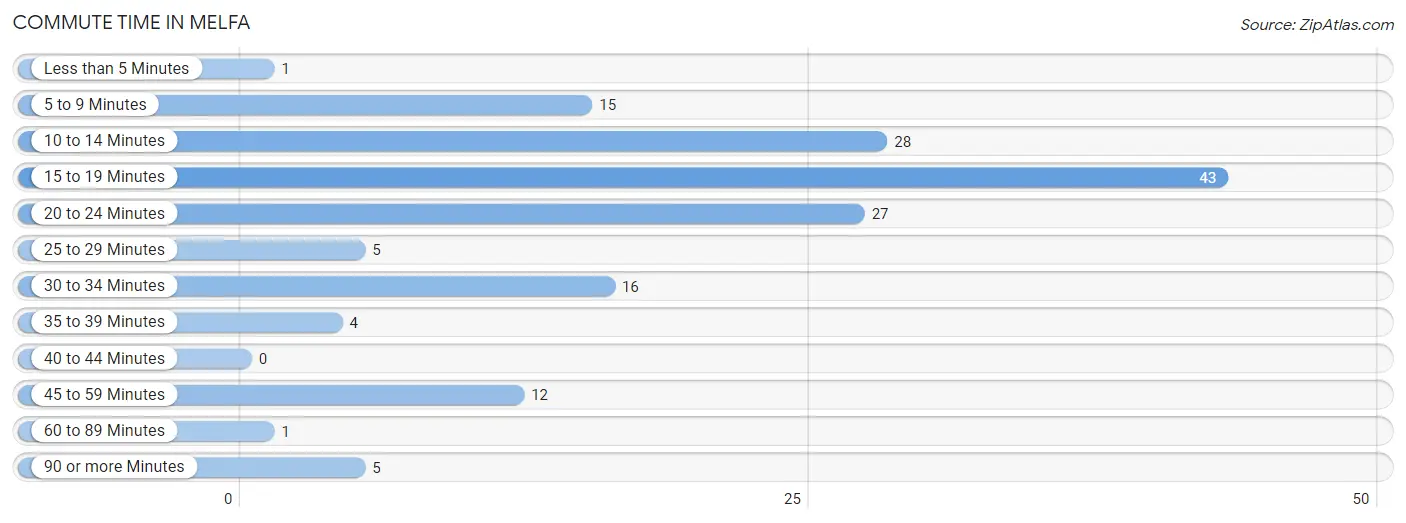
| Commute Time | # Commuters | % Commuters |
| Less than 5 Minutes | 1 | 0.6% |
| 5 to 9 Minutes | 15 | 9.6% |
| 10 to 14 Minutes | 28 | 17.8% |
| 15 to 19 Minutes | 43 | 27.4% |
| 20 to 24 Minutes | 27 | 17.2% |
| 25 to 29 Minutes | 5 | 3.2% |
| 30 to 34 Minutes | 16 | 10.2% |
| 35 to 39 Minutes | 4 | 2.5% |
| 40 to 44 Minutes | 0 | 0.0% |
| 45 to 59 Minutes | 12 | 7.6% |
| 60 to 89 Minutes | 1 | 0.6% |
| 90 or more Minutes | 5 | 3.2% |
Commute Time by Sex in Melfa
The most common commute times in Melfa are 20 to 24 minutes (16 commuters, 29.1%) for males and 15 to 19 minutes (34 commuters, 33.3%) for females.
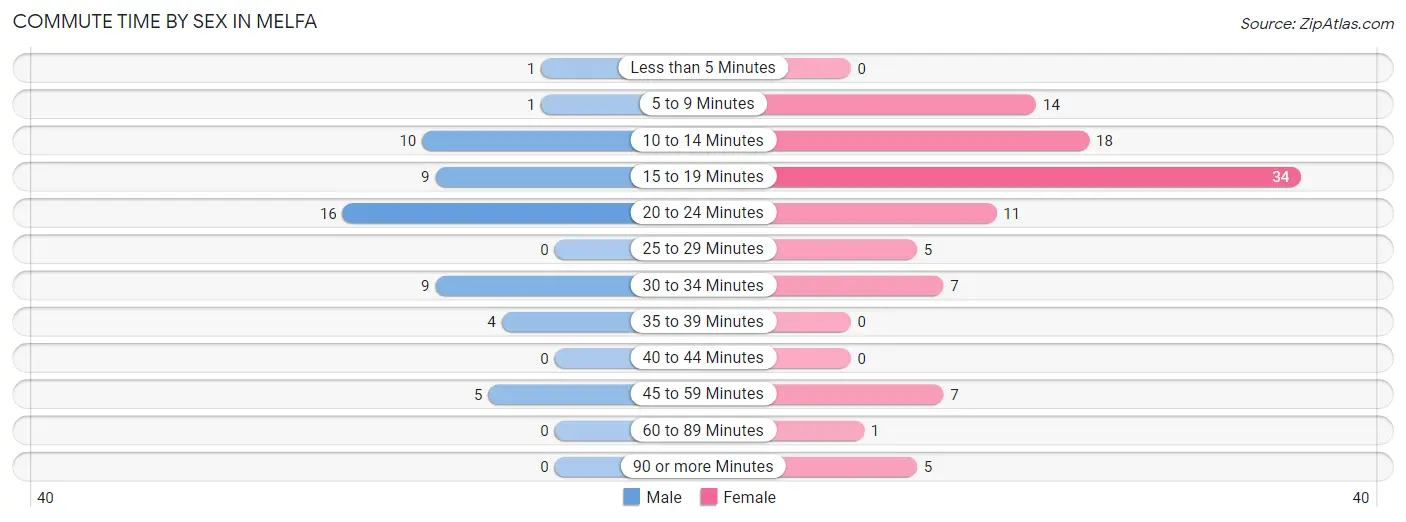
| Commute Time | Male | Female |
| Less than 5 Minutes | 1 (1.8%) | 0 (0.0%) |
| 5 to 9 Minutes | 1 (1.8%) | 14 (13.7%) |
| 10 to 14 Minutes | 10 (18.2%) | 18 (17.6%) |
| 15 to 19 Minutes | 9 (16.4%) | 34 (33.3%) |
| 20 to 24 Minutes | 16 (29.1%) | 11 (10.8%) |
| 25 to 29 Minutes | 0 (0.0%) | 5 (4.9%) |
| 30 to 34 Minutes | 9 (16.4%) | 7 (6.9%) |
| 35 to 39 Minutes | 4 (7.3%) | 0 (0.0%) |
| 40 to 44 Minutes | 0 (0.0%) | 0 (0.0%) |
| 45 to 59 Minutes | 5 (9.1%) | 7 (6.9%) |
| 60 to 89 Minutes | 0 (0.0%) | 1 (1.0%) |
| 90 or more Minutes | 0 (0.0%) | 5 (4.9%) |
Time of Departure to Work by Sex in Melfa
The most frequent times of departure to work in Melfa are 12:00 AM to 4:59 AM (15, 27.3%) for males and 7:30 AM to 7:59 AM (27, 26.5%) for females.
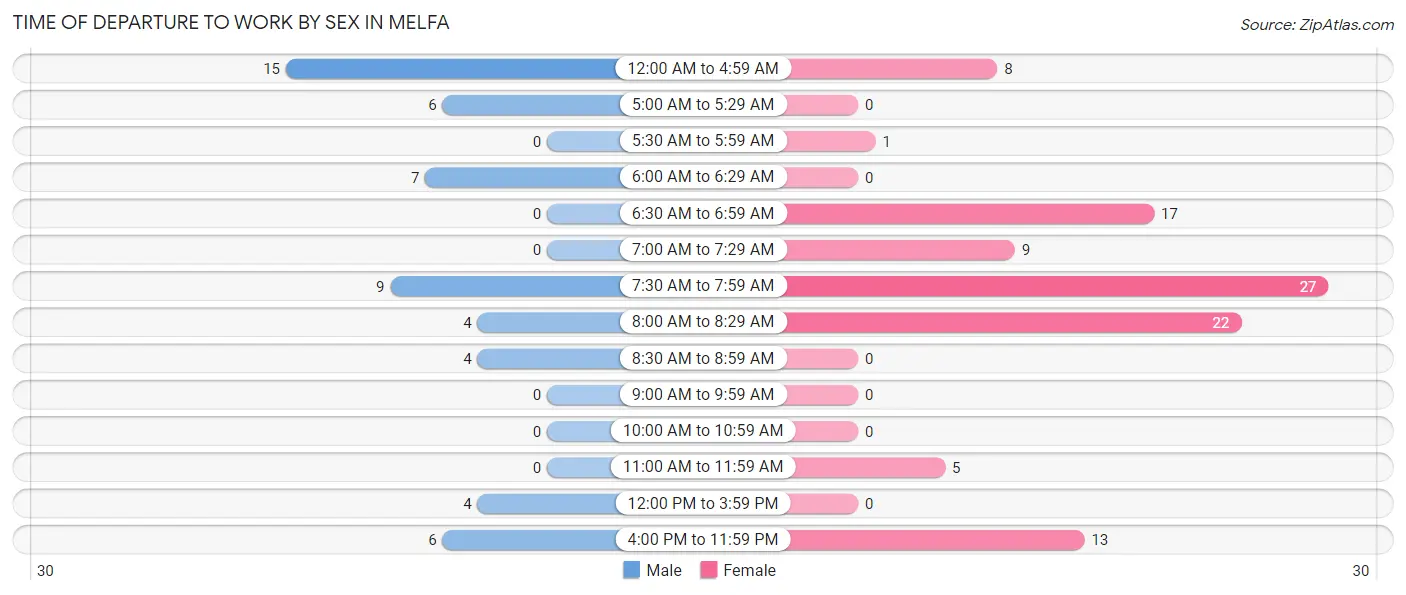
| Time of Departure | Male | Female |
| 12:00 AM to 4:59 AM | 15 (27.3%) | 8 (7.8%) |
| 5:00 AM to 5:29 AM | 6 (10.9%) | 0 (0.0%) |
| 5:30 AM to 5:59 AM | 0 (0.0%) | 1 (1.0%) |
| 6:00 AM to 6:29 AM | 7 (12.7%) | 0 (0.0%) |
| 6:30 AM to 6:59 AM | 0 (0.0%) | 17 (16.7%) |
| 7:00 AM to 7:29 AM | 0 (0.0%) | 9 (8.8%) |
| 7:30 AM to 7:59 AM | 9 (16.4%) | 27 (26.5%) |
| 8:00 AM to 8:29 AM | 4 (7.3%) | 22 (21.6%) |
| 8:30 AM to 8:59 AM | 4 (7.3%) | 0 (0.0%) |
| 9:00 AM to 9:59 AM | 0 (0.0%) | 0 (0.0%) |
| 10:00 AM to 10:59 AM | 0 (0.0%) | 0 (0.0%) |
| 11:00 AM to 11:59 AM | 0 (0.0%) | 5 (4.9%) |
| 12:00 PM to 3:59 PM | 4 (7.3%) | 0 (0.0%) |
| 4:00 PM to 11:59 PM | 6 (10.9%) | 13 (12.8%) |
| Total | 55 (100.0%) | 102 (100.0%) |
Housing Occupancy in Melfa
Occupancy by Ownership in Melfa
Of the total 222 dwellings in Melfa, owner-occupied units account for 120 (54.0%), while renter-occupied units make up 102 (46.0%).
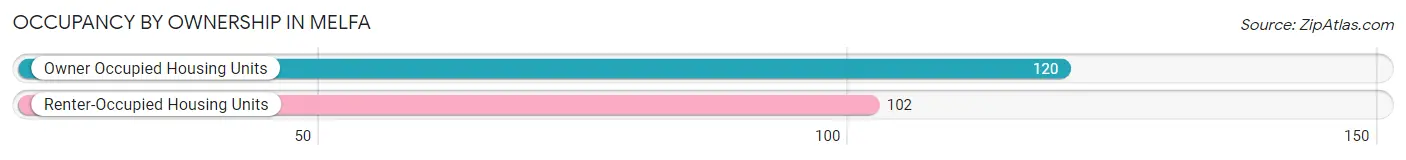
| Occupancy | # Housing Units | % Housing Units |
| Owner Occupied Housing Units | 120 | 54.0% |
| Renter-Occupied Housing Units | 102 | 46.0% |
| Total Occupied Housing Units | 222 | 100.0% |
Occupancy by Household Size in Melfa
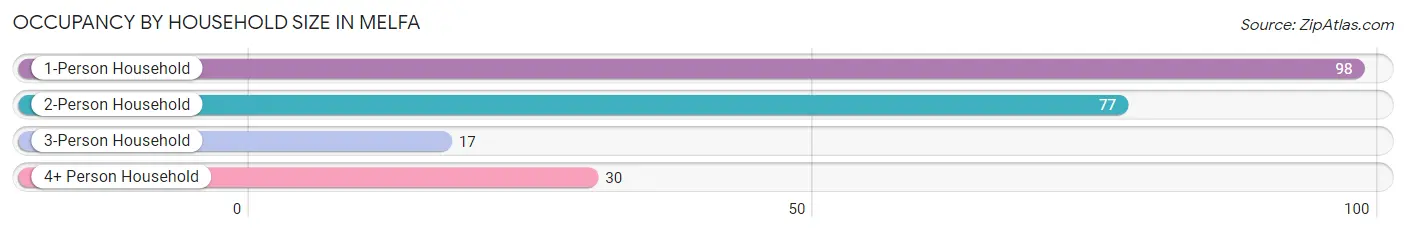
| Household Size | # Housing Units | % Housing Units |
| 1-Person Household | 98 | 44.1% |
| 2-Person Household | 77 | 34.7% |
| 3-Person Household | 17 | 7.7% |
| 4+ Person Household | 30 | 13.5% |
| Total Housing Units | 222 | 100.0% |
Occupancy by Ownership by Household Size in Melfa
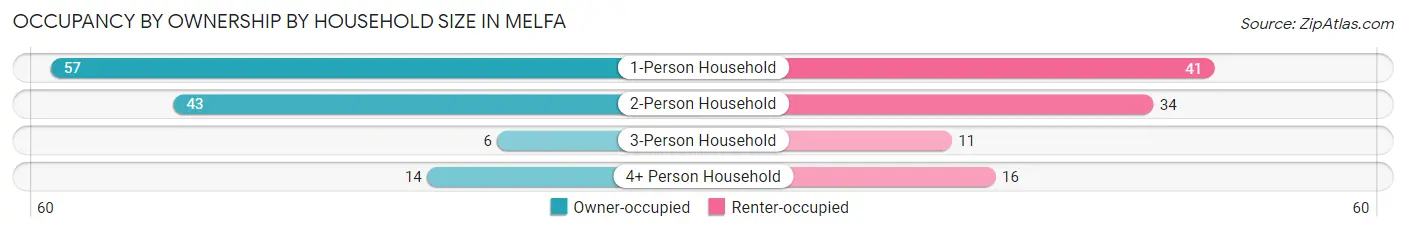
| Household Size | Owner-occupied | Renter-occupied |
| 1-Person Household | 57 (58.2%) | 41 (41.8%) |
| 2-Person Household | 43 (55.8%) | 34 (44.2%) |
| 3-Person Household | 6 (35.3%) | 11 (64.7%) |
| 4+ Person Household | 14 (46.7%) | 16 (53.3%) |
| Total Housing Units | 120 (54.0%) | 102 (46.0%) |
Occupancy by Educational Attainment in Melfa
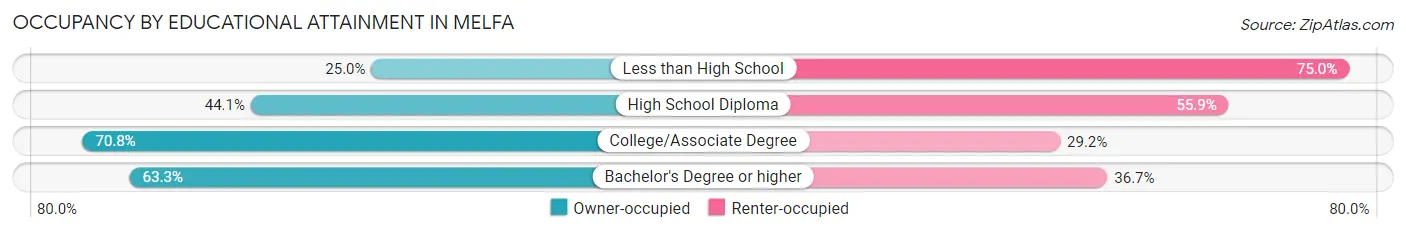
| Household Size | Owner-occupied | Renter-occupied |
| Less than High School | 3 (25.0%) | 9 (75.0%) |
| High School Diploma | 45 (44.1%) | 57 (55.9%) |
| College/Associate Degree | 34 (70.8%) | 14 (29.2%) |
| Bachelor's Degree or higher | 38 (63.3%) | 22 (36.7%) |
Occupancy by Age of Householder in Melfa
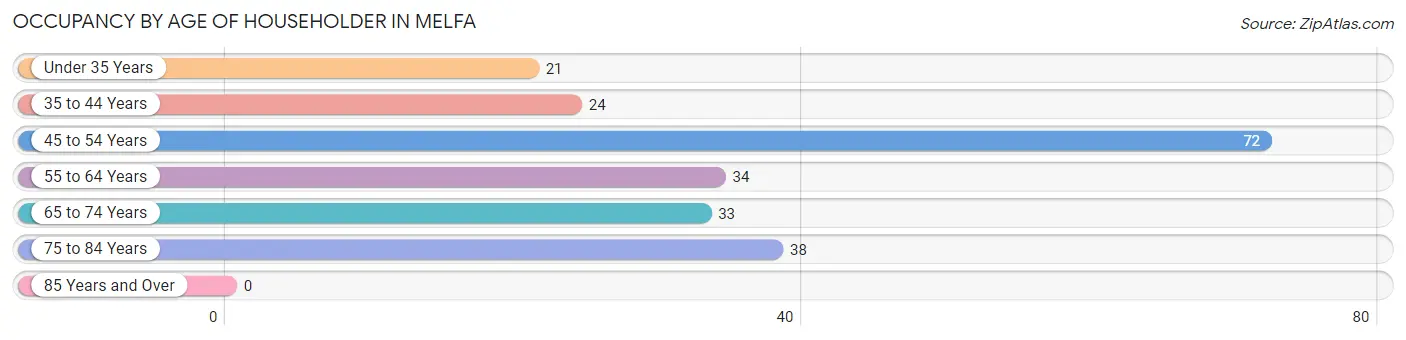
| Age Bracket | # Households | % Households |
| Under 35 Years | 21 | 9.5% |
| 35 to 44 Years | 24 | 10.8% |
| 45 to 54 Years | 72 | 32.4% |
| 55 to 64 Years | 34 | 15.3% |
| 65 to 74 Years | 33 | 14.9% |
| 75 to 84 Years | 38 | 17.1% |
| 85 Years and Over | 0 | 0.0% |
| Total | 222 | 100.0% |
Housing Finances in Melfa
Median Income by Occupancy in Melfa
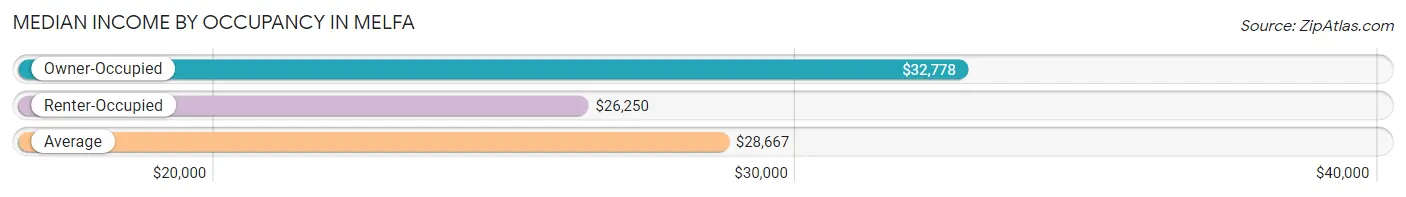
| Occupancy Type | # Households | Median Income |
| Owner-Occupied | 120 (54.0%) | $32,778 |
| Renter-Occupied | 102 (46.0%) | $26,250 |
| Average | 222 (100.0%) | $28,667 |
Occupancy by Householder Income Bracket in Melfa
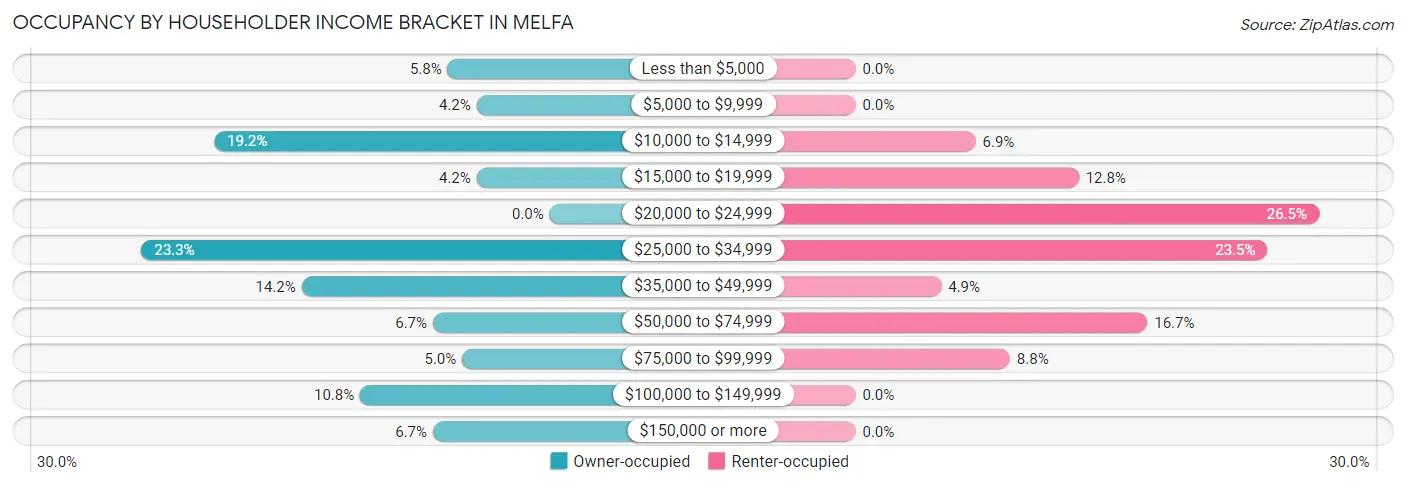
| Income Bracket | Owner-occupied | Renter-occupied |
| Less than $5,000 | 7 (5.8%) | 0 (0.0%) |
| $5,000 to $9,999 | 5 (4.2%) | 0 (0.0%) |
| $10,000 to $14,999 | 23 (19.2%) | 7 (6.9%) |
| $15,000 to $19,999 | 5 (4.2%) | 13 (12.8%) |
| $20,000 to $24,999 | 0 (0.0%) | 27 (26.5%) |
| $25,000 to $34,999 | 28 (23.3%) | 24 (23.5%) |
| $35,000 to $49,999 | 17 (14.2%) | 5 (4.9%) |
| $50,000 to $74,999 | 8 (6.7%) | 17 (16.7%) |
| $75,000 to $99,999 | 6 (5.0%) | 9 (8.8%) |
| $100,000 to $149,999 | 13 (10.8%) | 0 (0.0%) |
| $150,000 or more | 8 (6.7%) | 0 (0.0%) |
| Total | 120 (100.0%) | 102 (100.0%) |
Monthly Housing Cost Tiers in Melfa
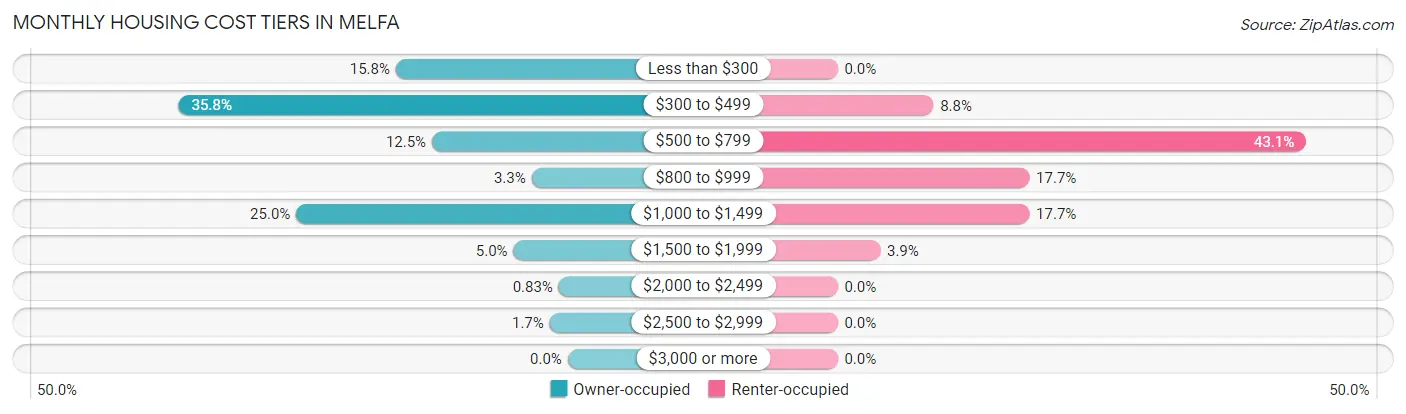
| Monthly Cost | Owner-occupied | Renter-occupied |
| Less than $300 | 19 (15.8%) | 0 (0.0%) |
| $300 to $499 | 43 (35.8%) | 9 (8.8%) |
| $500 to $799 | 15 (12.5%) | 44 (43.1%) |
| $800 to $999 | 4 (3.3%) | 18 (17.6%) |
| $1,000 to $1,499 | 30 (25.0%) | 18 (17.6%) |
| $1,500 to $1,999 | 6 (5.0%) | 4 (3.9%) |
| $2,000 to $2,499 | 1 (0.8%) | 0 (0.0%) |
| $2,500 to $2,999 | 2 (1.7%) | 0 (0.0%) |
| $3,000 or more | 0 (0.0%) | 0 (0.0%) |
| Total | 120 (100.0%) | 102 (100.0%) |
Physical Housing Characteristics in Melfa
Housing Structures in Melfa
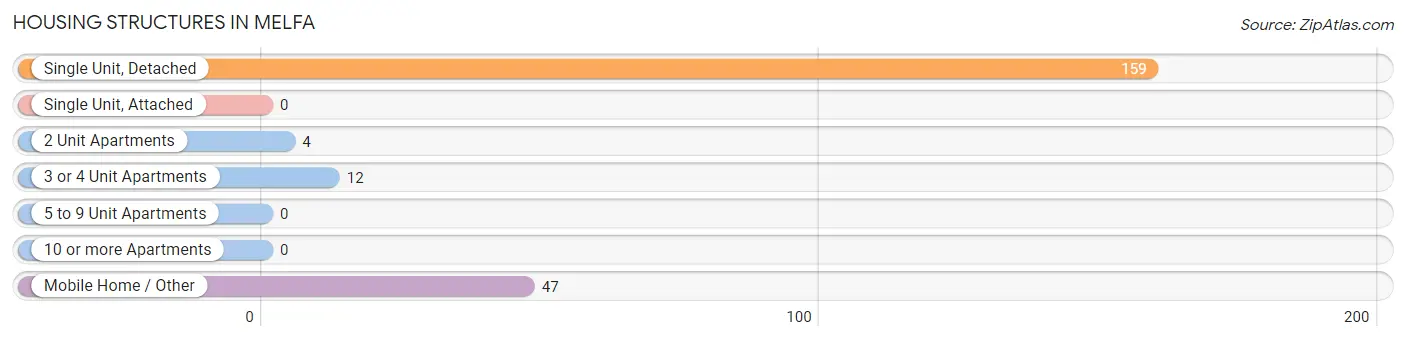
| Structure Type | # Housing Units | % Housing Units |
| Single Unit, Detached | 159 | 71.6% |
| Single Unit, Attached | 0 | 0.0% |
| 2 Unit Apartments | 4 | 1.8% |
| 3 or 4 Unit Apartments | 12 | 5.4% |
| 5 to 9 Unit Apartments | 0 | 0.0% |
| 10 or more Apartments | 0 | 0.0% |
| Mobile Home / Other | 47 | 21.2% |
| Total | 222 | 100.0% |
Housing Structures by Occupancy in Melfa
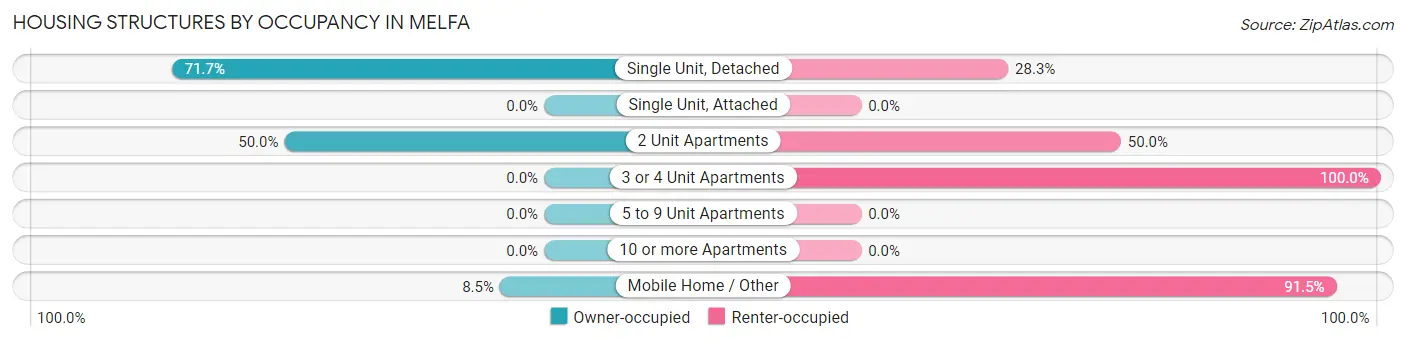
| Structure Type | Owner-occupied | Renter-occupied |
| Single Unit, Detached | 114 (71.7%) | 45 (28.3%) |
| Single Unit, Attached | 0 (0.0%) | 0 (0.0%) |
| 2 Unit Apartments | 2 (50.0%) | 2 (50.0%) |
| 3 or 4 Unit Apartments | 0 (0.0%) | 12 (100.0%) |
| 5 to 9 Unit Apartments | 0 (0.0%) | 0 (0.0%) |
| 10 or more Apartments | 0 (0.0%) | 0 (0.0%) |
| Mobile Home / Other | 4 (8.5%) | 43 (91.5%) |
| Total | 120 (54.0%) | 102 (46.0%) |
Housing Structures by Number of Rooms in Melfa
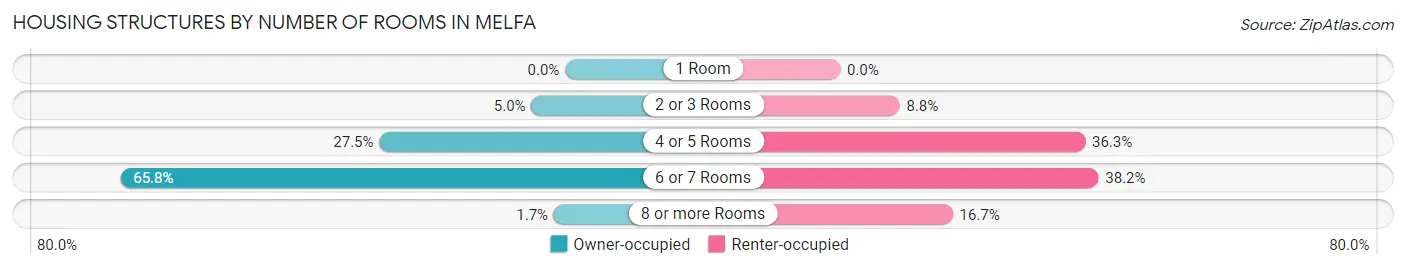
| Number of Rooms | Owner-occupied | Renter-occupied |
| 1 Room | 0 (0.0%) | 0 (0.0%) |
| 2 or 3 Rooms | 6 (5.0%) | 9 (8.8%) |
| 4 or 5 Rooms | 33 (27.5%) | 37 (36.3%) |
| 6 or 7 Rooms | 79 (65.8%) | 39 (38.2%) |
| 8 or more Rooms | 2 (1.7%) | 17 (16.7%) |
| Total | 120 (100.0%) | 102 (100.0%) |
Housing Structure by Heating Type in Melfa
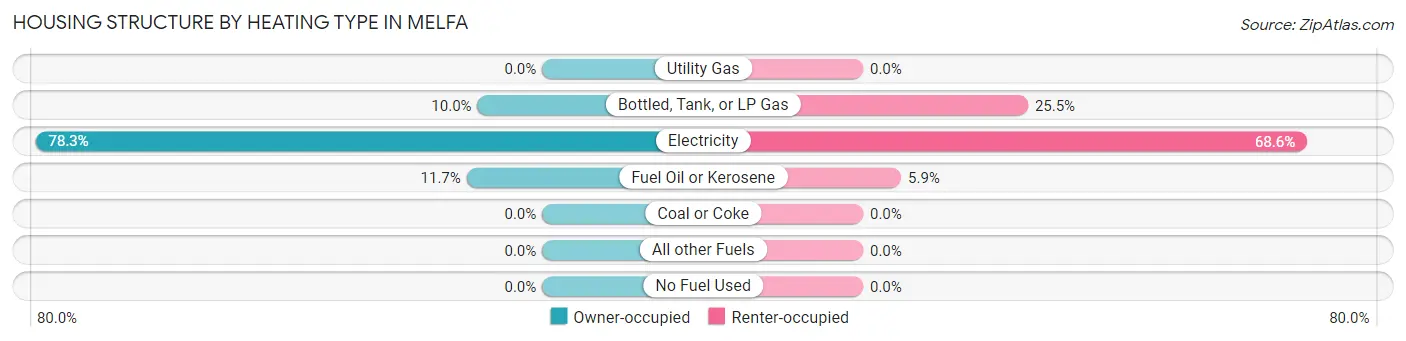
| Heating Type | Owner-occupied | Renter-occupied |
| Utility Gas | 0 (0.0%) | 0 (0.0%) |
| Bottled, Tank, or LP Gas | 12 (10.0%) | 26 (25.5%) |
| Electricity | 94 (78.3%) | 70 (68.6%) |
| Fuel Oil or Kerosene | 14 (11.7%) | 6 (5.9%) |
| Coal or Coke | 0 (0.0%) | 0 (0.0%) |
| All other Fuels | 0 (0.0%) | 0 (0.0%) |
| No Fuel Used | 0 (0.0%) | 0 (0.0%) |
| Total | 120 (100.0%) | 102 (100.0%) |
Household Vehicle Usage in Melfa
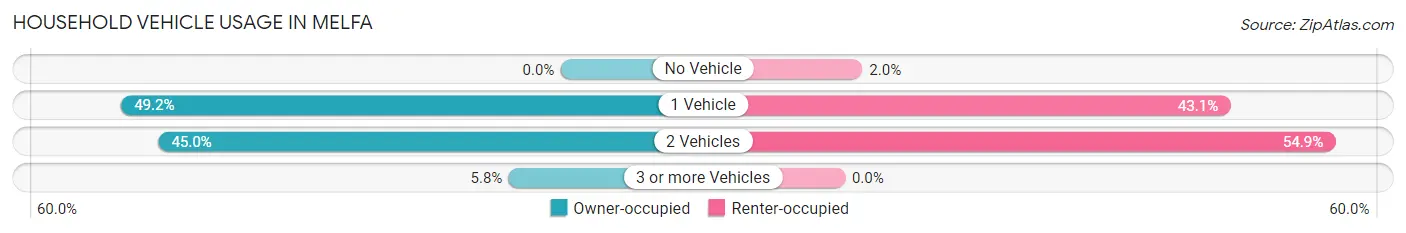
| Vehicles per Household | Owner-occupied | Renter-occupied |
| No Vehicle | 0 (0.0%) | 2 (2.0%) |
| 1 Vehicle | 59 (49.2%) | 44 (43.1%) |
| 2 Vehicles | 54 (45.0%) | 56 (54.9%) |
| 3 or more Vehicles | 7 (5.8%) | 0 (0.0%) |
| Total | 120 (100.0%) | 102 (100.0%) |
Real Estate & Mortgages in Melfa
Real Estate and Mortgage Overview in Melfa
| Characteristic | Without Mortgage | With Mortgage |
| Housing Units | 69 | 51 |
| Median Property Value | $121,500 | $182,300 |
| Median Household Income | - | - |
| Monthly Housing Costs | $426 | $0 |
| Real Estate Taxes | $726 | $5 |
Property Value by Mortgage Status in Melfa
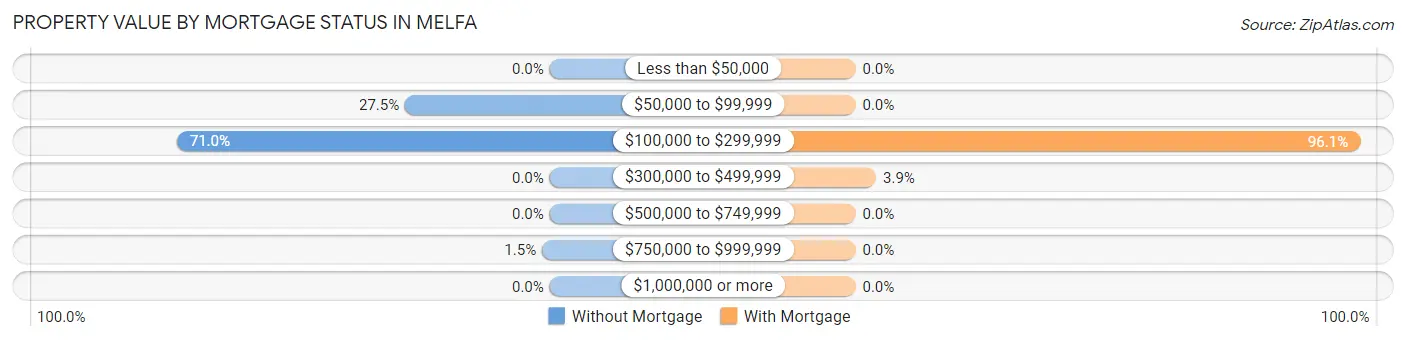
| Property Value | Without Mortgage | With Mortgage |
| Less than $50,000 | 0 (0.0%) | 0 (0.0%) |
| $50,000 to $99,999 | 19 (27.5%) | 0 (0.0%) |
| $100,000 to $299,999 | 49 (71.0%) | 49 (96.1%) |
| $300,000 to $499,999 | 0 (0.0%) | 2 (3.9%) |
| $500,000 to $749,999 | 0 (0.0%) | 0 (0.0%) |
| $750,000 to $999,999 | 1 (1.5%) | 0 (0.0%) |
| $1,000,000 or more | 0 (0.0%) | 0 (0.0%) |
| Total | 69 (100.0%) | 51 (100.0%) |
Household Income by Mortgage Status in Melfa
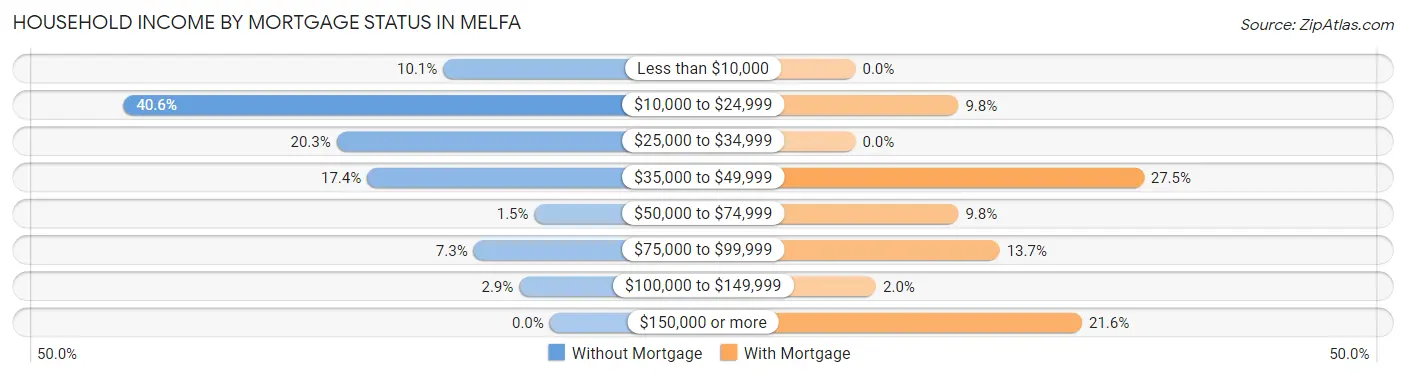
| Household Income | Without Mortgage | With Mortgage |
| Less than $10,000 | 7 (10.1%) | 0 (0.0%) |
| $10,000 to $24,999 | 28 (40.6%) | 5 (9.8%) |
| $25,000 to $34,999 | 14 (20.3%) | 0 (0.0%) |
| $35,000 to $49,999 | 12 (17.4%) | 14 (27.5%) |
| $50,000 to $74,999 | 1 (1.5%) | 5 (9.8%) |
| $75,000 to $99,999 | 5 (7.2%) | 7 (13.7%) |
| $100,000 to $149,999 | 2 (2.9%) | 1 (2.0%) |
| $150,000 or more | 0 (0.0%) | 11 (21.6%) |
| Total | 69 (100.0%) | 51 (100.0%) |
Property Value to Household Income Ratio in Melfa
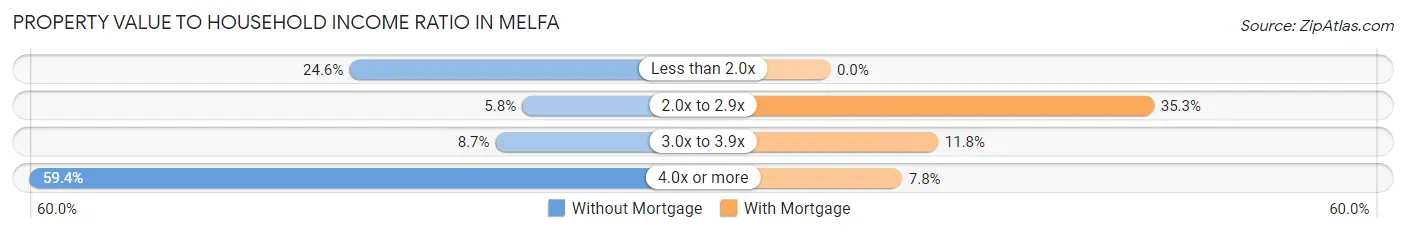
| Value-to-Income Ratio | Without Mortgage | With Mortgage |
| Less than 2.0x | 17 (24.6%) | 0 (0.0%) |
| 2.0x to 2.9x | 4 (5.8%) | 18 (35.3%) |
| 3.0x to 3.9x | 6 (8.7%) | 6 (11.8%) |
| 4.0x or more | 41 (59.4%) | 4 (7.8%) |
| Total | 69 (100.0%) | 51 (100.0%) |
Real Estate Taxes by Mortgage Status in Melfa
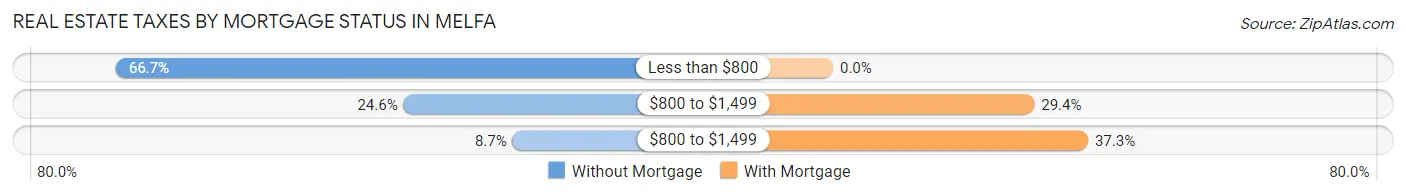
| Property Taxes | Without Mortgage | With Mortgage |
| Less than $800 | 46 (66.7%) | 0 (0.0%) |
| $800 to $1,499 | 17 (24.6%) | 15 (29.4%) |
| $800 to $1,499 | 6 (8.7%) | 19 (37.2%) |
| Total | 69 (100.0%) | 51 (100.0%) |
Health & Disability in Melfa
Health Insurance Coverage by Age in Melfa
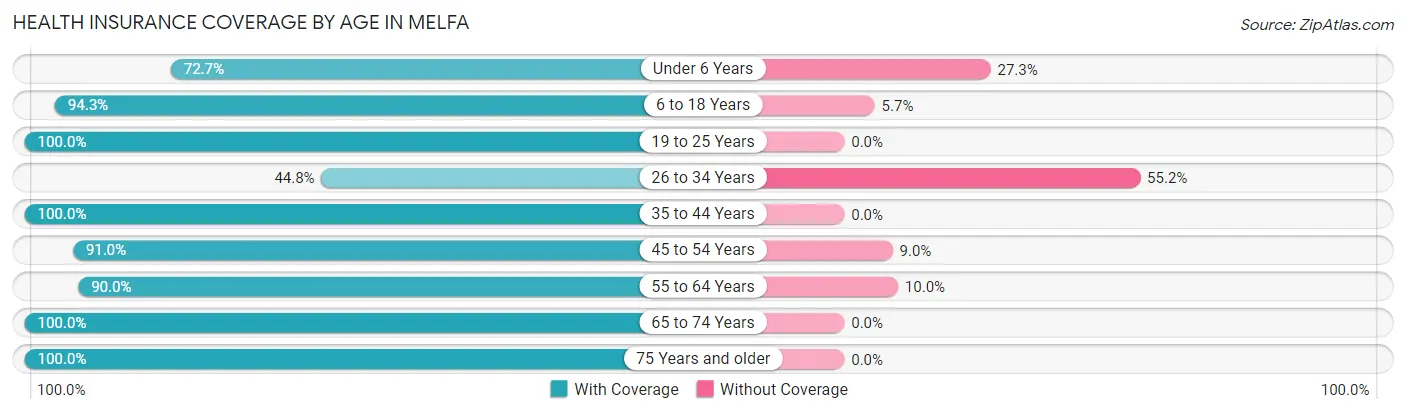
| Age Bracket | With Coverage | Without Coverage |
| Under 6 Years | 24 (72.7%) | 9 (27.3%) |
| 6 to 18 Years | 100 (94.3%) | 6 (5.7%) |
| 19 to 25 Years | 13 (100.0%) | 0 (0.0%) |
| 26 to 34 Years | 13 (44.8%) | 16 (55.2%) |
| 35 to 44 Years | 26 (100.0%) | 0 (0.0%) |
| 45 to 54 Years | 91 (91.0%) | 9 (9.0%) |
| 55 to 64 Years | 36 (90.0%) | 4 (10.0%) |
| 65 to 74 Years | 45 (100.0%) | 0 (0.0%) |
| 75 Years and older | 44 (100.0%) | 0 (0.0%) |
| Total | 392 (89.9%) | 44 (10.1%) |
Health Insurance Coverage by Citizenship Status in Melfa
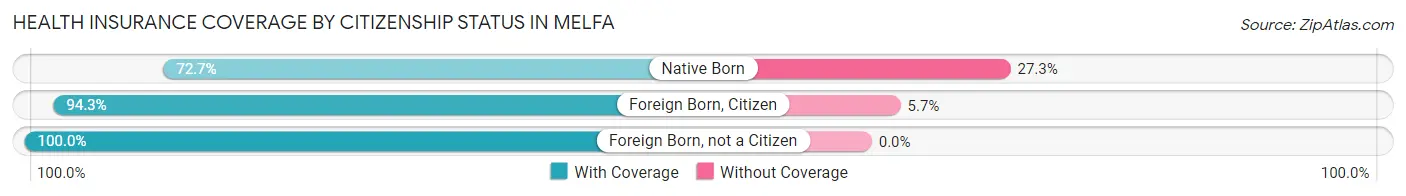
| Citizenship Status | With Coverage | Without Coverage |
| Native Born | 24 (72.7%) | 9 (27.3%) |
| Foreign Born, Citizen | 100 (94.3%) | 6 (5.7%) |
| Foreign Born, not a Citizen | 13 (100.0%) | 0 (0.0%) |
Health Insurance Coverage by Household Income in Melfa
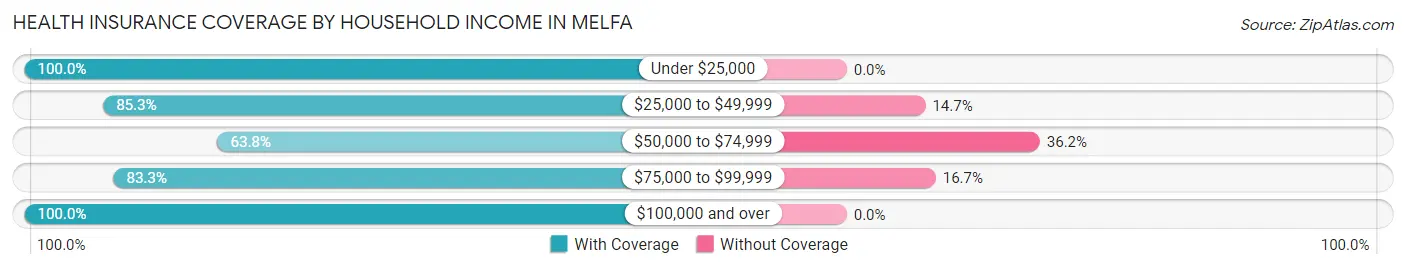
| Household Income | With Coverage | Without Coverage |
| Under $25,000 | 156 (100.0%) | 0 (0.0%) |
| $25,000 to $49,999 | 133 (85.3%) | 23 (14.7%) |
| $50,000 to $74,999 | 30 (63.8%) | 17 (36.2%) |
| $75,000 to $99,999 | 20 (83.3%) | 4 (16.7%) |
| $100,000 and over | 53 (100.0%) | 0 (0.0%) |
Public vs Private Health Insurance Coverage by Age in Melfa
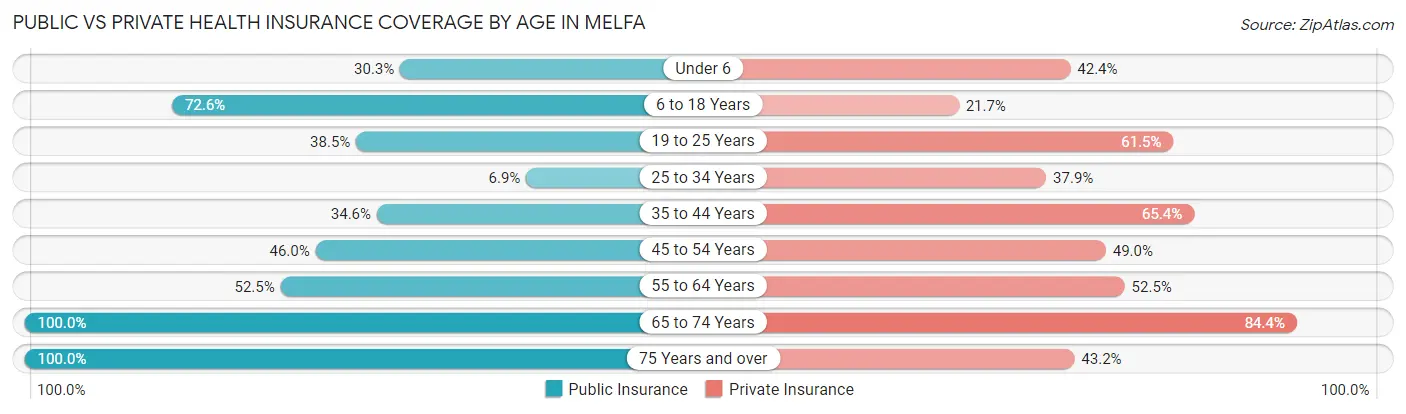
| Age Bracket | Public Insurance | Private Insurance |
| Under 6 | 10 (30.3%) | 14 (42.4%) |
| 6 to 18 Years | 77 (72.6%) | 23 (21.7%) |
| 19 to 25 Years | 5 (38.5%) | 8 (61.5%) |
| 25 to 34 Years | 2 (6.9%) | 11 (37.9%) |
| 35 to 44 Years | 9 (34.6%) | 17 (65.4%) |
| 45 to 54 Years | 46 (46.0%) | 49 (49.0%) |
| 55 to 64 Years | 21 (52.5%) | 21 (52.5%) |
| 65 to 74 Years | 45 (100.0%) | 38 (84.4%) |
| 75 Years and over | 44 (100.0%) | 19 (43.2%) |
| Total | 259 (59.4%) | 200 (45.9%) |
Disability Status by Sex by Age in Melfa
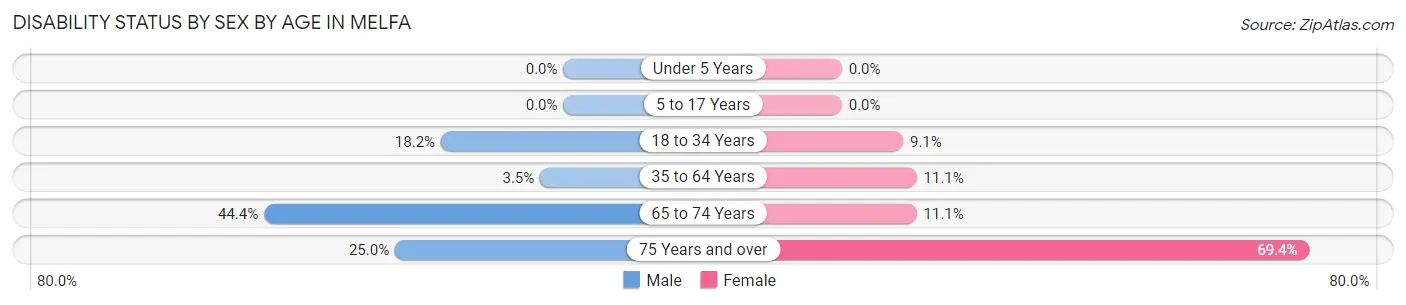
| Age Bracket | Male | Female |
| Under 5 Years | 0 (0.0%) | 0 (0.0%) |
| 5 to 17 Years | 0 (0.0%) | 0 (0.0%) |
| 18 to 34 Years | 4 (18.2%) | 2 (9.1%) |
| 35 to 64 Years | 2 (3.5%) | 12 (11.1%) |
| 65 to 74 Years | 4 (44.4%) | 4 (11.1%) |
| 75 Years and over | 2 (25.0%) | 25 (69.4%) |
Disability Class by Sex by Age in Melfa
Disability Class: Hearing Difficulty
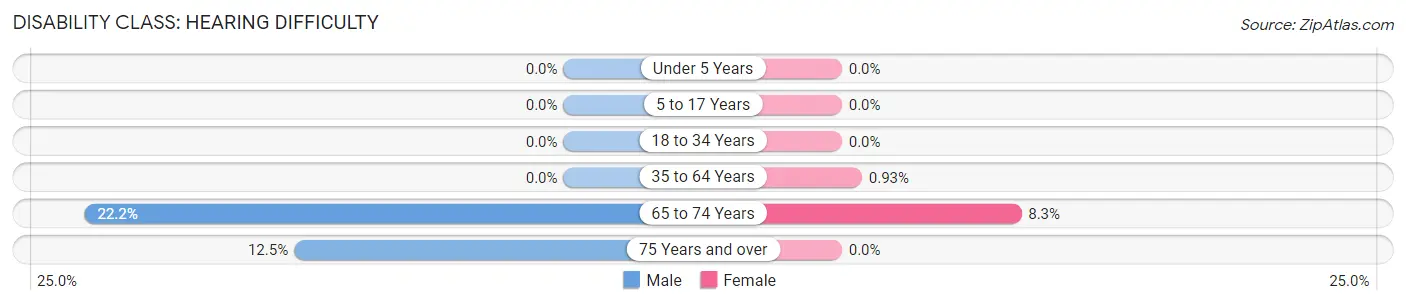
| Age Bracket | Male | Female |
| Under 5 Years | 0 (0.0%) | 0 (0.0%) |
| 5 to 17 Years | 0 (0.0%) | 0 (0.0%) |
| 18 to 34 Years | 0 (0.0%) | 0 (0.0%) |
| 35 to 64 Years | 0 (0.0%) | 1 (0.9%) |
| 65 to 74 Years | 2 (22.2%) | 3 (8.3%) |
| 75 Years and over | 1 (12.5%) | 0 (0.0%) |
Disability Class: Vision Difficulty
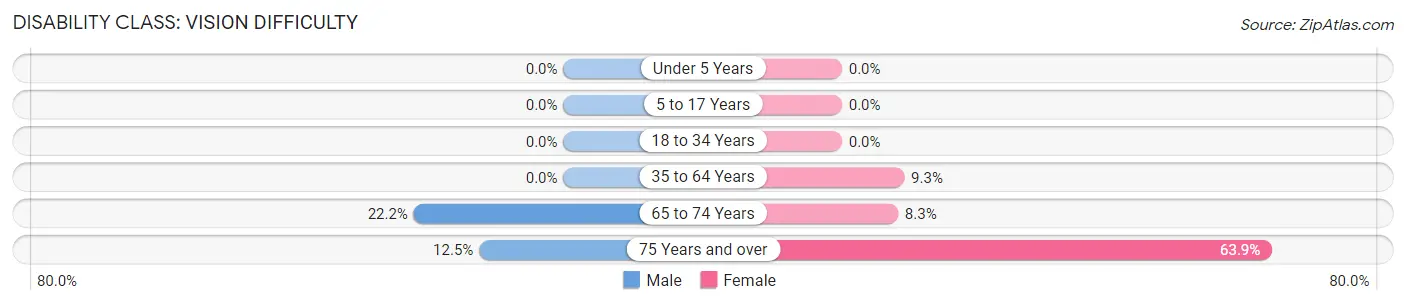
| Age Bracket | Male | Female |
| Under 5 Years | 0 (0.0%) | 0 (0.0%) |
| 5 to 17 Years | 0 (0.0%) | 0 (0.0%) |
| 18 to 34 Years | 0 (0.0%) | 0 (0.0%) |
| 35 to 64 Years | 0 (0.0%) | 10 (9.3%) |
| 65 to 74 Years | 2 (22.2%) | 3 (8.3%) |
| 75 Years and over | 1 (12.5%) | 23 (63.9%) |
Disability Class: Cognitive Difficulty
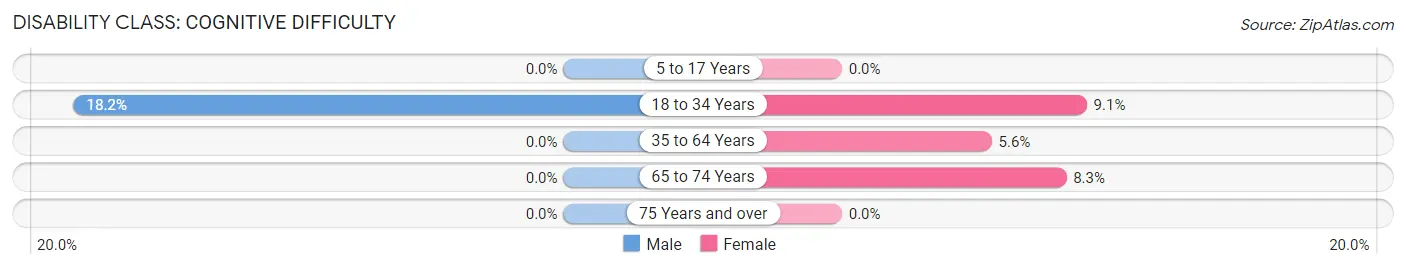
| Age Bracket | Male | Female |
| 5 to 17 Years | 0 (0.0%) | 0 (0.0%) |
| 18 to 34 Years | 4 (18.2%) | 2 (9.1%) |
| 35 to 64 Years | 0 (0.0%) | 6 (5.6%) |
| 65 to 74 Years | 0 (0.0%) | 3 (8.3%) |
| 75 Years and over | 0 (0.0%) | 0 (0.0%) |
Disability Class: Ambulatory Difficulty
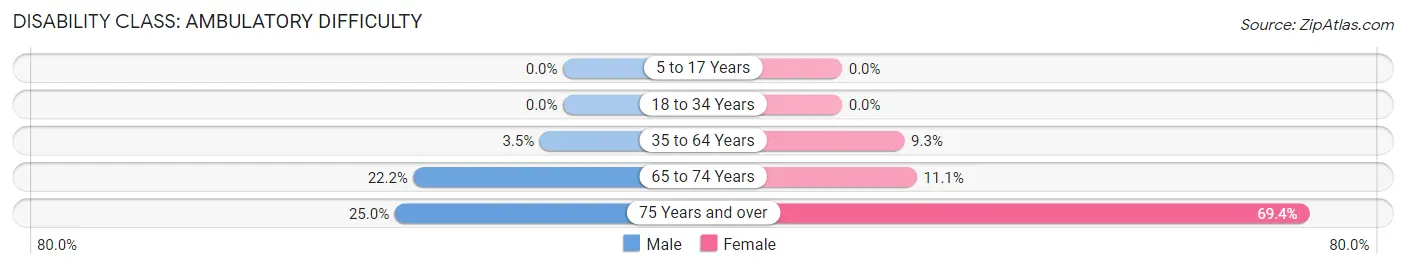
| Age Bracket | Male | Female |
| 5 to 17 Years | 0 (0.0%) | 0 (0.0%) |
| 18 to 34 Years | 0 (0.0%) | 0 (0.0%) |
| 35 to 64 Years | 2 (3.5%) | 10 (9.3%) |
| 65 to 74 Years | 2 (22.2%) | 4 (11.1%) |
| 75 Years and over | 2 (25.0%) | 25 (69.4%) |
Disability Class: Self-Care Difficulty
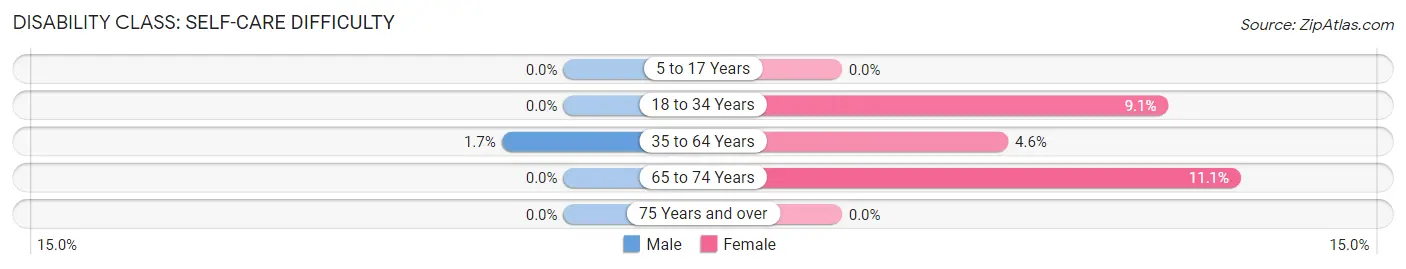
| Age Bracket | Male | Female |
| 5 to 17 Years | 0 (0.0%) | 0 (0.0%) |
| 18 to 34 Years | 0 (0.0%) | 2 (9.1%) |
| 35 to 64 Years | 1 (1.7%) | 5 (4.6%) |
| 65 to 74 Years | 0 (0.0%) | 4 (11.1%) |
| 75 Years and over | 0 (0.0%) | 0 (0.0%) |
Technology Access in Melfa
Computing Device Access in Melfa
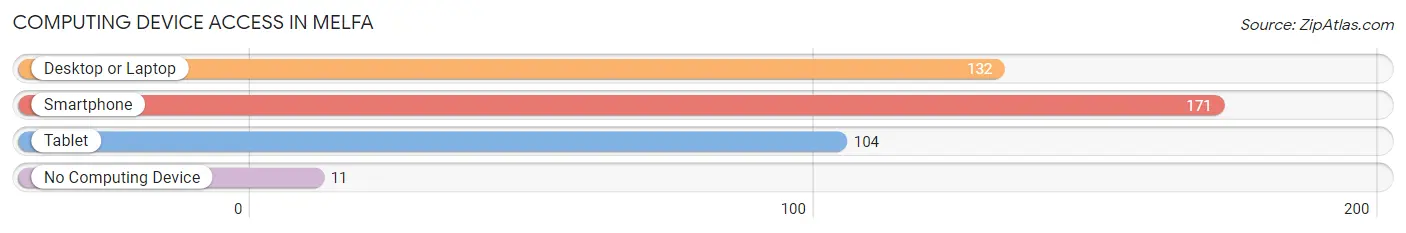
| Device Type | # Households | % Households |
| Desktop or Laptop | 132 | 59.5% |
| Smartphone | 171 | 77.0% |
| Tablet | 104 | 46.9% |
| No Computing Device | 11 | 5.0% |
| Total | 222 | 100.0% |
Internet Access in Melfa
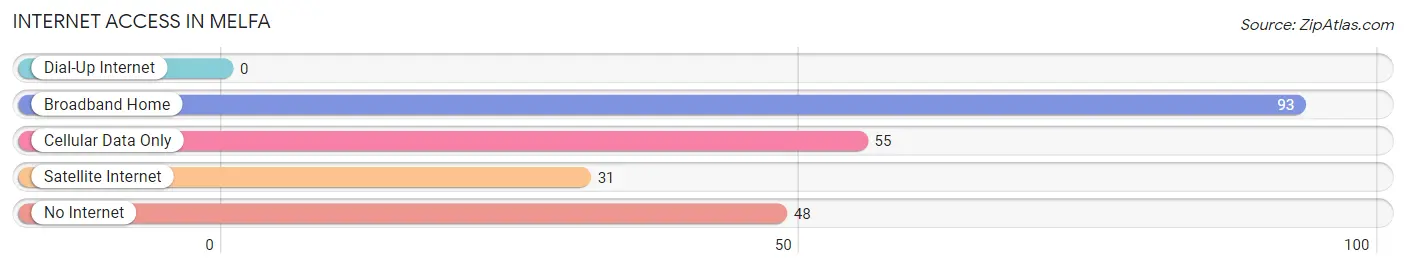
| Internet Type | # Households | % Households |
| Dial-Up Internet | 0 | 0.0% |
| Broadband Home | 93 | 41.9% |
| Cellular Data Only | 55 | 24.8% |
| Satellite Internet | 31 | 14.0% |
| No Internet | 48 | 21.6% |
| Total | 222 | 100.0% |
Melfa Summary
Melfa is a small town located in Accomack County, Virginia. It is situated on the Eastern Shore of the Chesapeake Bay, approximately 20 miles south of the Maryland border. The town has a population of approximately 1,000 people and is part of the larger Hampton Roads metropolitan area.
History
Melfa was first settled in the early 1700s by English colonists. The town was originally known as “Melfa’s Crossroads” due to its location at the intersection of two major roads. The town was officially incorporated in 1872 and was named after the nearby Melfa River.
In the late 19th century, Melfa was a thriving agricultural community. The town was home to several large farms and was known for its production of corn, wheat, and other crops. In the early 20th century, the town began to diversify its economy and began to attract new businesses.
Geography
Melfa is located in the southeastern corner of Accomack County, Virginia. The town is situated on the Eastern Shore of the Chesapeake Bay, approximately 20 miles south of the Maryland border. The town is bordered by the towns of Onancock, Parksley, and Painter.
The town is located in a rural area and is surrounded by farmland and forests. The town is located near several bodies of water, including the Chesapeake Bay, the Atlantic Ocean, and the Melfa River.
Economy
Melfa’s economy is largely based on agriculture and tourism. The town is home to several large farms that produce corn, wheat, and other crops. The town is also home to several seafood processing plants, which process and package seafood for local restaurants and markets.
The town is also home to several small businesses, including restaurants, shops, and other services. The town is also home to several bed and breakfasts, which attract tourists from around the region.
Demographics
As of the 2010 census, the population of Melfa was 1,000 people. The town is predominantly white, with approximately 95% of the population identifying as white. The town is also home to a small African American population, with approximately 4% of the population identifying as African American.
The median household income in Melfa is approximately $45,000, which is slightly lower than the national average. The town has a poverty rate of approximately 10%, which is slightly higher than the national average.
Conclusion
Melfa is a small town located in Accomack County, Virginia. The town has a population of approximately 1,000 people and is part of the larger Hampton Roads metropolitan area. The town’s economy is largely based on agriculture and tourism, and the town is home to several small businesses. The town is predominantly white, with a small African American population. The median household income in Melfa is slightly lower than the national average, and the town has a poverty rate of approximately 10%.
Common Questions
What is Per Capita Income in Melfa?
Per Capita income in Melfa is $21,561.
What is the Median Family Income in Melfa?
Median Family Income in Melfa is $39,000.
What is the Median Household income in Melfa?
Median Household Income in Melfa is $28,667.
What is Income or Wage Gap in Melfa?
Income or Wage Gap in Melfa is 26.5%.
Women in Melfa earn 73.5 cents for every dollar earned by a man.
What is Inequality or Gini Index in Melfa?
Inequality or Gini Index in Melfa is 0.45.
What is the Total Population of Melfa?
Total Population of Melfa is 436.
What is the Total Male Population of Melfa?
Total Male Population of Melfa is 183.
What is the Total Female Population of Melfa?
Total Female Population of Melfa is 253.
What is the Ratio of Males per 100 Females in Melfa?
There are 72.33 Males per 100 Females in Melfa.
What is the Ratio of Females per 100 Males in Melfa?
There are 138.25 Females per 100 Males in Melfa.
What is the Median Population Age in Melfa?
Median Population Age in Melfa is 45.3 Years.
What is the Average Family Size in Melfa
Average Family Size in Melfa is 2.8 People.
What is the Average Household Size in Melfa
Average Household Size in Melfa is 2.0 People.
How Large is the Labor Force in Melfa?
There are 194 People in the Labor Forcein in Melfa.
What is the Percentage of People in the Labor Force in Melfa?
55.3% of People are in the Labor Force in Melfa.
What is the Unemployment Rate in Melfa?
Unemployment Rate in Melfa is 4.6%.