Riverview, VA Map & Demographics
Riverview Map
Riverview Overview
$21,936
PER CAPITA INCOME
$41,818
AVG HOUSEHOLD INCOME
0.27
INEQUALITY / GINI INDEX
479
TOTAL POPULATION
259
MALE POPULATION
220
FEMALE POPULATION
117.73
MALES / 100 FEMALES
84.94
FEMALES / 100 MALES
59.8
MEDIAN AGE
2.3
AVG FAMILY SIZE
1.9
AVG HOUSEHOLD SIZE
86
LABOR FORCE [ PEOPLE ]
19.7%
PERCENT IN LABOR FORCE
16.3%
UNEMPLOYMENT RATE
Income in Riverview
Income Overview in Riverview
| Characteristic | Number | Measure |
| Per Capita Income | 479 | $21,936 |
| Median Family Income | 151 | $0 |
| Mean Family Income | 151 | $43,932 |
| Median Household Income | 254 | $41,818 |
| Mean Household Income | 254 | $40,664 |
| Income Deficit | 151 | $0 |
| Wage / Income Gap (%) | 479 | 0.00% |
| Wage / Income Gap ($) | 479 | 100.00¢ per $1 |
| Gini / Inequality Index | 479 | 0.27 |
Earnings by Sex in Riverview
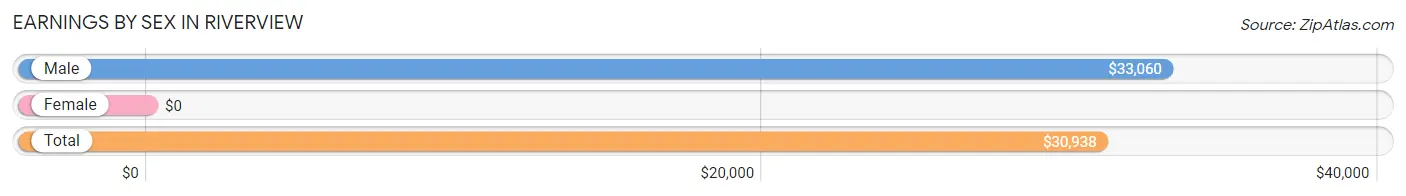
| Sex | Number | Average Earnings |
| Male | 63 (73.3%) | $33,060 |
| Female | 23 (26.7%) | $0 |
| Total | 86 (100.0%) | $30,938 |
Earnings by Sex by Income Bracket in Riverview
The most common earnings brackets in Riverview are $30,000 to $34,999 for men (37 | 58.7%) and $2,500 to $4,999 for women (14 | 60.9%).
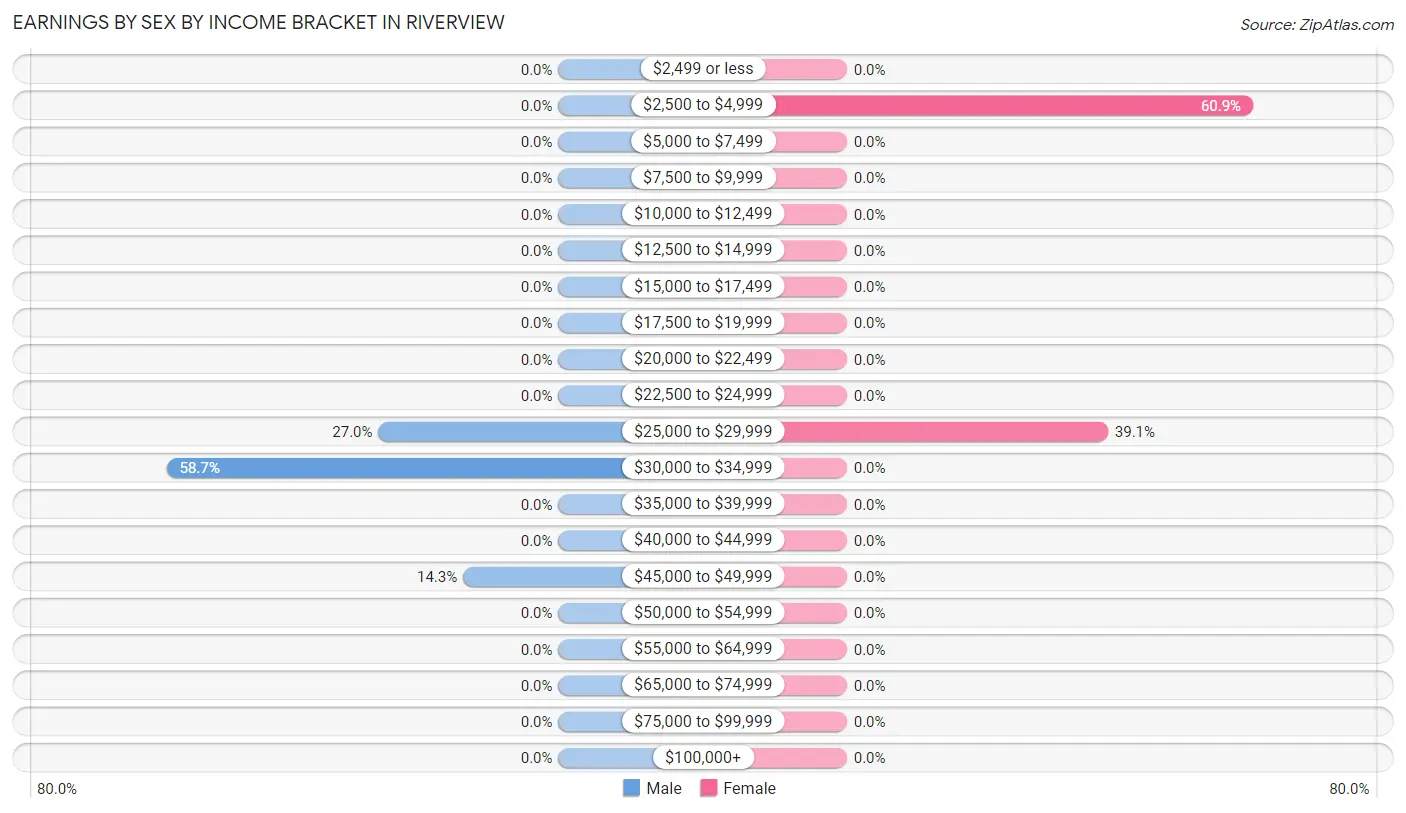
| Income | Male | Female |
| $2,499 or less | 0 (0.0%) | 0 (0.0%) |
| $2,500 to $4,999 | 0 (0.0%) | 14 (60.9%) |
| $5,000 to $7,499 | 0 (0.0%) | 0 (0.0%) |
| $7,500 to $9,999 | 0 (0.0%) | 0 (0.0%) |
| $10,000 to $12,499 | 0 (0.0%) | 0 (0.0%) |
| $12,500 to $14,999 | 0 (0.0%) | 0 (0.0%) |
| $15,000 to $17,499 | 0 (0.0%) | 0 (0.0%) |
| $17,500 to $19,999 | 0 (0.0%) | 0 (0.0%) |
| $20,000 to $22,499 | 0 (0.0%) | 0 (0.0%) |
| $22,500 to $24,999 | 0 (0.0%) | 0 (0.0%) |
| $25,000 to $29,999 | 17 (27.0%) | 9 (39.1%) |
| $30,000 to $34,999 | 37 (58.7%) | 0 (0.0%) |
| $35,000 to $39,999 | 0 (0.0%) | 0 (0.0%) |
| $40,000 to $44,999 | 0 (0.0%) | 0 (0.0%) |
| $45,000 to $49,999 | 9 (14.3%) | 0 (0.0%) |
| $50,000 to $54,999 | 0 (0.0%) | 0 (0.0%) |
| $55,000 to $64,999 | 0 (0.0%) | 0 (0.0%) |
| $65,000 to $74,999 | 0 (0.0%) | 0 (0.0%) |
| $75,000 to $99,999 | 0 (0.0%) | 0 (0.0%) |
| $100,000+ | 0 (0.0%) | 0 (0.0%) |
| Total | 63 (100.0%) | 23 (100.0%) |
Earnings by Sex by Educational Attainment in Riverview
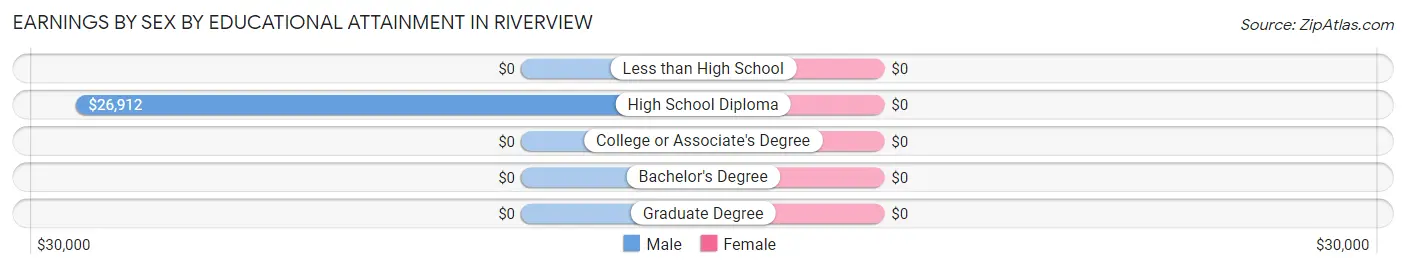
| Educational Attainment | Male Income | Female Income |
| Less than High School | - | - |
| High School Diploma | $26,912 | $0 |
| College or Associate's Degree | - | - |
| Bachelor's Degree | - | - |
| Graduate Degree | - | - |
| Total | $33,405 | $0 |
Family Income in Riverview
Family Income Brackets in Riverview
According to the Riverview family income data, there are 76 families falling into the $25,000 to $34,999 income range, which is the most common income bracket and makes up 50.3% of all families.
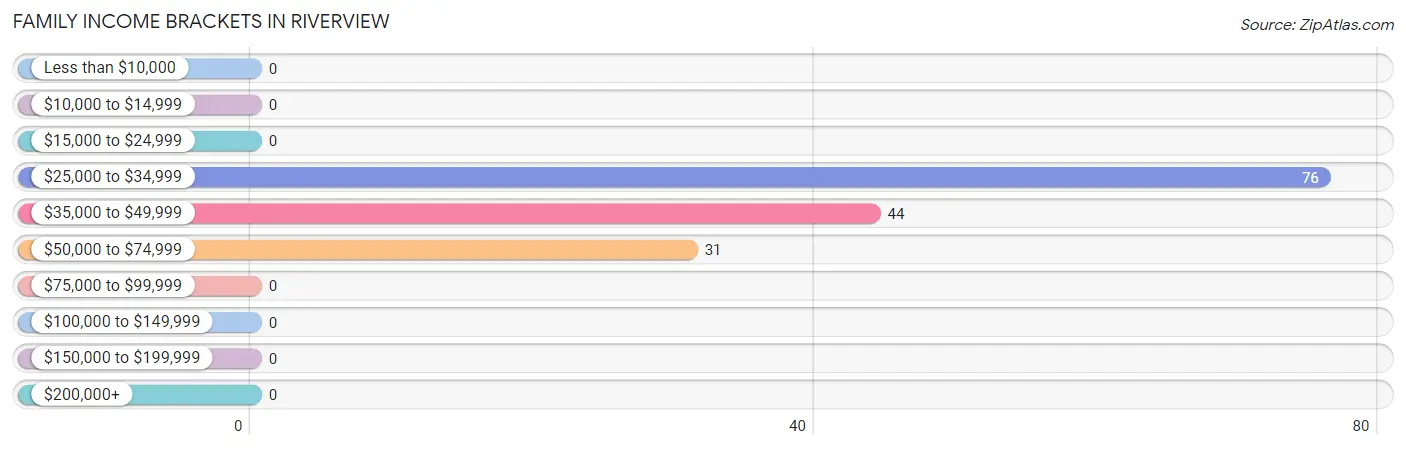
| Income Bracket | # Families | % Families |
| Less than $10,000 | 0 | 0.0% |
| $10,000 to $14,999 | 0 | 0.0% |
| $15,000 to $24,999 | 0 | 0.0% |
| $25,000 to $34,999 | 76 | 50.3% |
| $35,000 to $49,999 | 44 | 29.1% |
| $50,000 to $74,999 | 31 | 20.5% |
| $75,000 to $99,999 | 0 | 0.0% |
| $100,000 to $149,999 | 0 | 0.0% |
| $150,000 to $199,999 | 0 | 0.0% |
| $200,000+ | 0 | 0.0% |
Family Income by Famaliy Size in Riverview
3-person families (50 | 33.1%) account for the highest median family income in Riverview with $72,984 per family, while 3-person families (50 | 33.1%) have the highest median income of $24,328 per family member.
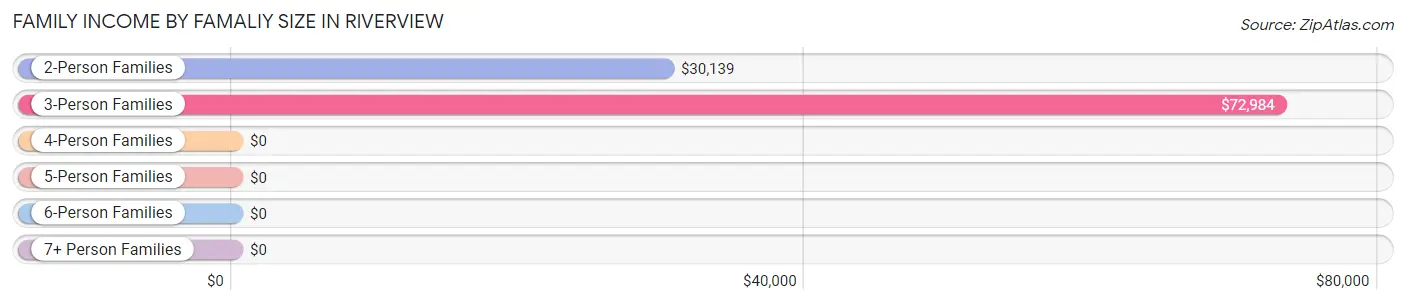
| Income Bracket | # Families | Median Income |
| 2-Person Families | 101 (66.9%) | $30,139 |
| 3-Person Families | 50 (33.1%) | $72,984 |
| 4-Person Families | 0 (0.0%) | $0 |
| 5-Person Families | 0 (0.0%) | $0 |
| 6-Person Families | 0 (0.0%) | $0 |
| 7+ Person Families | 0 (0.0%) | $0 |
| Total | 151 (100.0%) | $0 |
Family Income by Number of Earners in Riverview
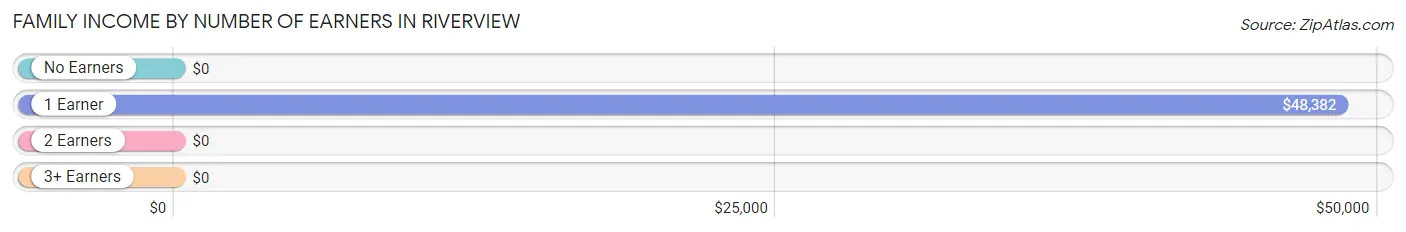
| Number of Earners | # Families | Median Income |
| No Earners | 93 (61.6%) | $0 |
| 1 Earner | 44 (29.1%) | $48,382 |
| 2 Earners | 14 (9.3%) | $0 |
| 3+ Earners | 0 (0.0%) | $0 |
| Total | 151 (100.0%) | $0 |
Household Income in Riverview
Household Income Brackets in Riverview
With 80 households falling in the category, the $50,000 to $74,999 income range is the most frequent in Riverview, accounting for 31.5% of all households.
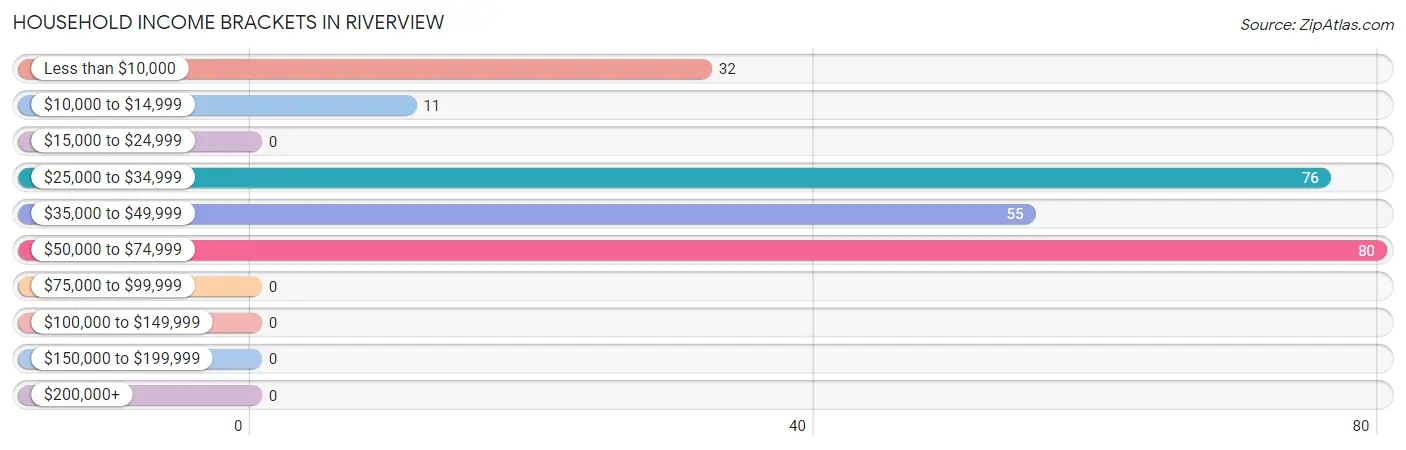
| Income Bracket | # Households | % Households |
| Less than $10,000 | 32 | 12.6% |
| $10,000 to $14,999 | 11 | 4.3% |
| $15,000 to $24,999 | 0 | 0.0% |
| $25,000 to $34,999 | 76 | 29.9% |
| $35,000 to $49,999 | 55 | 21.7% |
| $50,000 to $74,999 | 80 | 31.5% |
| $75,000 to $99,999 | 0 | 0.0% |
| $100,000 to $149,999 | 0 | 0.0% |
| $150,000 to $199,999 | 0 | 0.0% |
| $200,000+ | 0 | 0.0% |
Household Income by Householder Age in Riverview
The median household income in Riverview is $41,818, with the highest median household income of $29,250 found in the 65+ years age bracket for the primary householder. A total of 113 households (44.5%) fall into this category. Meanwhile, the 15 to 24 years age bracket for the primary householder has the lowest median household income of $0, with 5 households (2.0%) in this group.
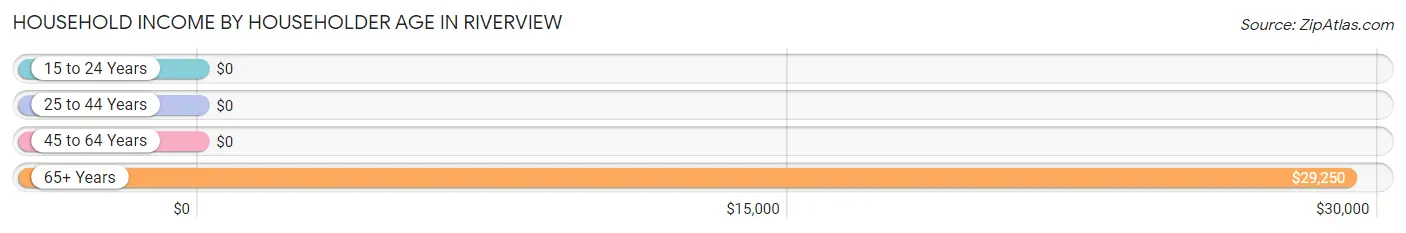
| Income Bracket | # Households | Median Income |
| 15 to 24 Years | 5 (2.0%) | $0 |
| 25 to 44 Years | 74 (29.1%) | $0 |
| 45 to 64 Years | 62 (24.4%) | $0 |
| 65+ Years | 113 (44.5%) | $29,250 |
| Total | 254 (100.0%) | $41,818 |
Poverty in Riverview
Income Below Poverty by Sex and Age in Riverview
With 3.1% poverty level for males and 24.5% for females among the residents of Riverview, 16 and 17 year old males and 75 year old and over females are the most vulnerable to poverty, with 8 males (100.0%) and 32 females (54.2%) in their respective age groups living below the poverty level.
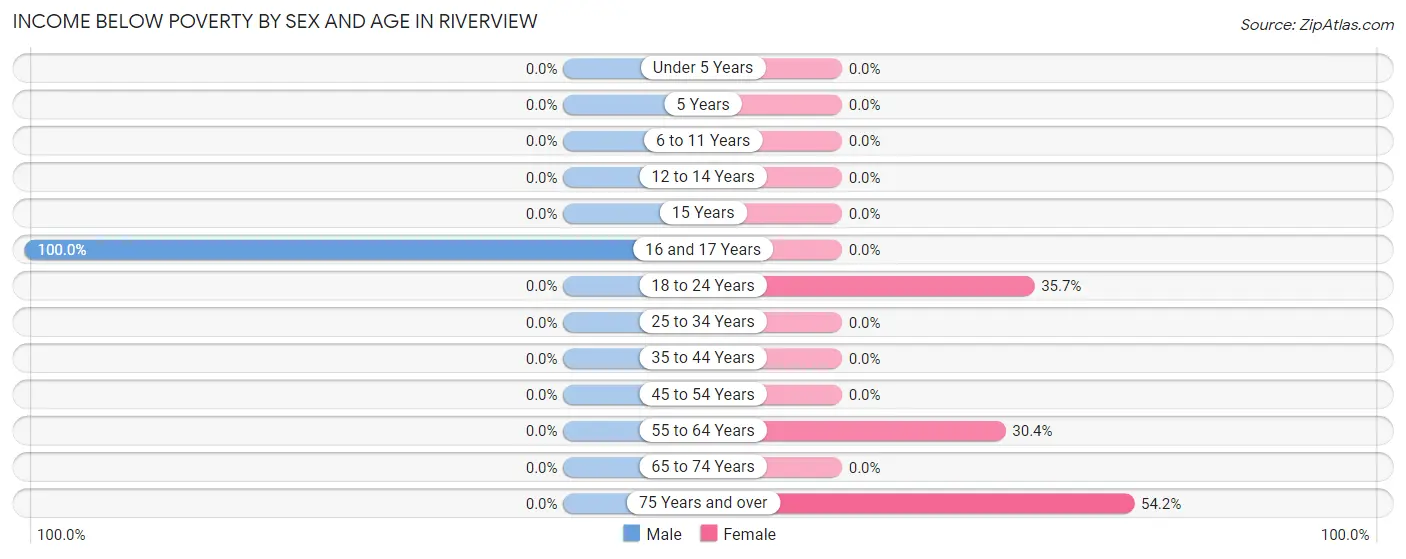
| Age Bracket | Male | Female |
| Under 5 Years | 0 (0.0%) | 0 (0.0%) |
| 5 Years | 0 (0.0%) | 0 (0.0%) |
| 6 to 11 Years | 0 (0.0%) | 0 (0.0%) |
| 12 to 14 Years | 0 (0.0%) | 0 (0.0%) |
| 15 Years | 0 (0.0%) | 0 (0.0%) |
| 16 and 17 Years | 8 (100.0%) | 0 (0.0%) |
| 18 to 24 Years | 0 (0.0%) | 5 (35.7%) |
| 25 to 34 Years | 0 (0.0%) | 0 (0.0%) |
| 35 to 44 Years | 0 (0.0%) | 0 (0.0%) |
| 45 to 54 Years | 0 (0.0%) | 0 (0.0%) |
| 55 to 64 Years | 0 (0.0%) | 17 (30.4%) |
| 65 to 74 Years | 0 (0.0%) | 0 (0.0%) |
| 75 Years and over | 0 (0.0%) | 32 (54.2%) |
| Total | 8 (3.1%) | 54 (24.5%) |
Income Above Poverty by Sex and Age in Riverview
According to the poverty statistics in Riverview, males aged 12 to 14 years and females aged 12 to 14 years are the age groups that are most secure financially, with 100.0% of males and 100.0% of females in these age groups living above the poverty line.
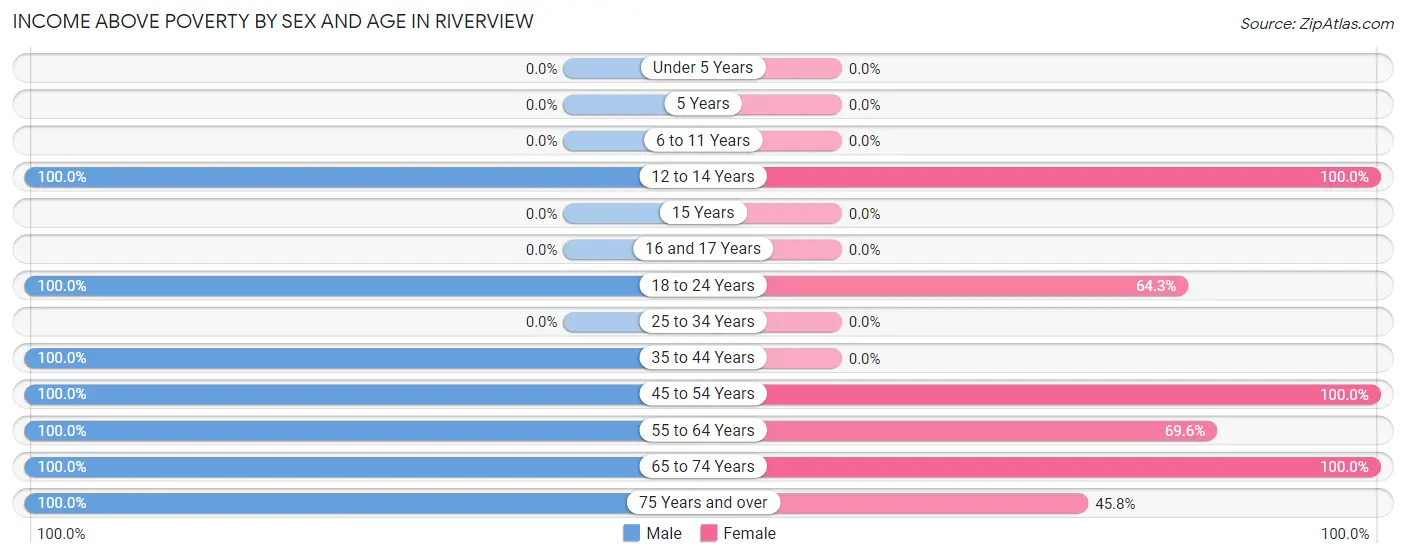
| Age Bracket | Male | Female |
| Under 5 Years | 0 (0.0%) | 0 (0.0%) |
| 5 Years | 0 (0.0%) | 0 (0.0%) |
| 6 to 11 Years | 0 (0.0%) | 0 (0.0%) |
| 12 to 14 Years | 11 (100.0%) | 32 (100.0%) |
| 15 Years | 0 (0.0%) | 0 (0.0%) |
| 16 and 17 Years | 0 (0.0%) | 0 (0.0%) |
| 18 to 24 Years | 8 (100.0%) | 9 (64.3%) |
| 25 to 34 Years | 0 (0.0%) | 0 (0.0%) |
| 35 to 44 Years | 74 (100.0%) | 0 (0.0%) |
| 45 to 54 Years | 29 (100.0%) | 14 (100.0%) |
| 55 to 64 Years | 17 (100.0%) | 39 (69.6%) |
| 65 to 74 Years | 99 (100.0%) | 45 (100.0%) |
| 75 Years and over | 13 (100.0%) | 27 (45.8%) |
| Total | 251 (96.9%) | 166 (75.4%) |
Income Below Poverty Among Married-Couple Families in Riverview
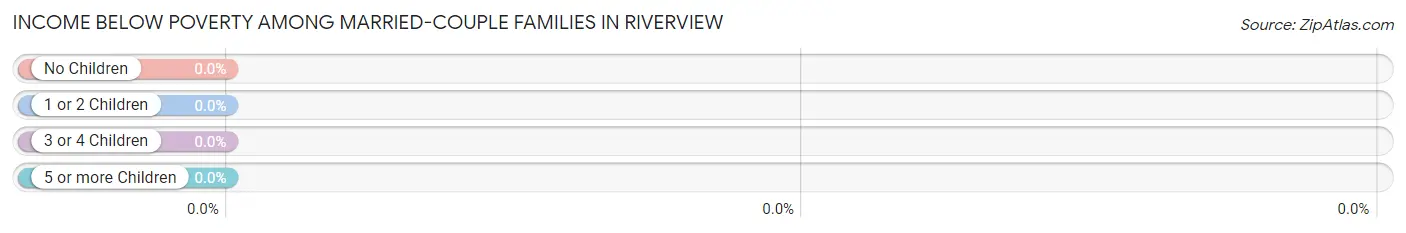
| Children | Above Poverty | Below Poverty |
| No Children | 59 (100.0%) | 0 (0.0%) |
| 1 or 2 Children | 40 (100.0%) | 0 (0.0%) |
| 3 or 4 Children | 0 (0.0%) | 0 (0.0%) |
| 5 or more Children | 0 (0.0%) | 0 (0.0%) |
| Total | 99 (100.0%) | 0 (0.0%) |
Income Below Poverty Among Single-Parent Households in Riverview
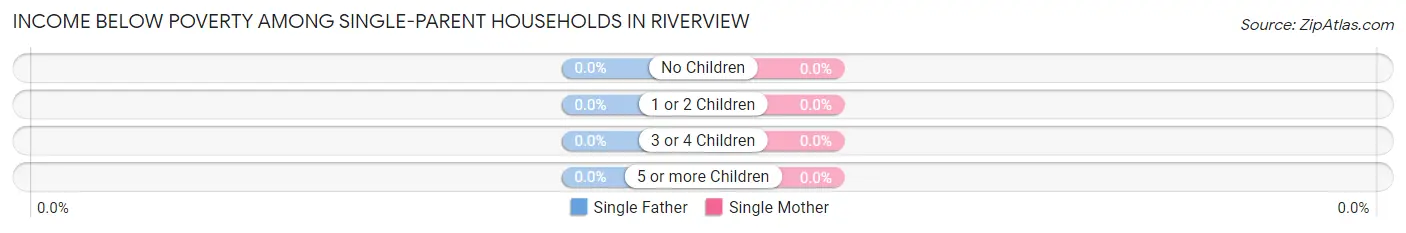
| Children | Single Father | Single Mother |
| No Children | 0 (0.0%) | 0 (0.0%) |
| 1 or 2 Children | 0 (0.0%) | 0 (0.0%) |
| 3 or 4 Children | 0 (0.0%) | 0 (0.0%) |
| 5 or more Children | 0 (0.0%) | 0 (0.0%) |
| Total | 0 (0.0%) | 0 (0.0%) |
Income Below Poverty Among Married-Couple vs Single-Parent Households in Riverview
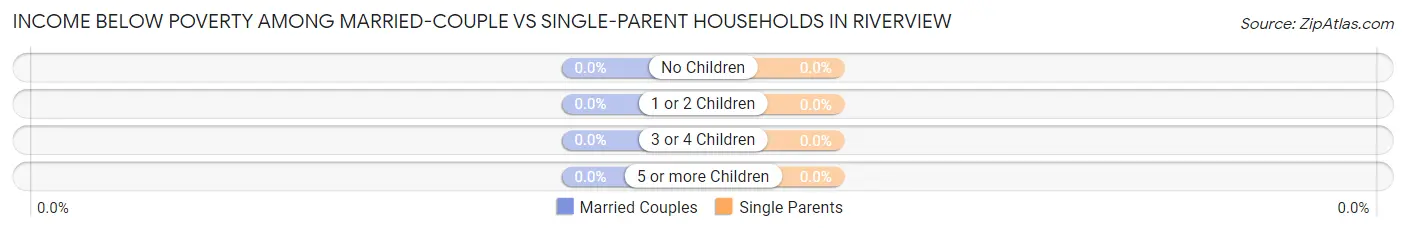
| Children | Married-Couple Families | Single-Parent Households |
| No Children | 0 (0.0%) | 0 (0.0%) |
| 1 or 2 Children | 0 (0.0%) | 0 (0.0%) |
| 3 or 4 Children | 0 (0.0%) | 0 (0.0%) |
| 5 or more Children | 0 (0.0%) | 0 (0.0%) |
| Total | 0 (0.0%) | 0 (0.0%) |
Race in Riverview
The most populous races in Riverview are White / Caucasian (470 | 98.1%), and Native / Alaskan (9 | 1.9%).
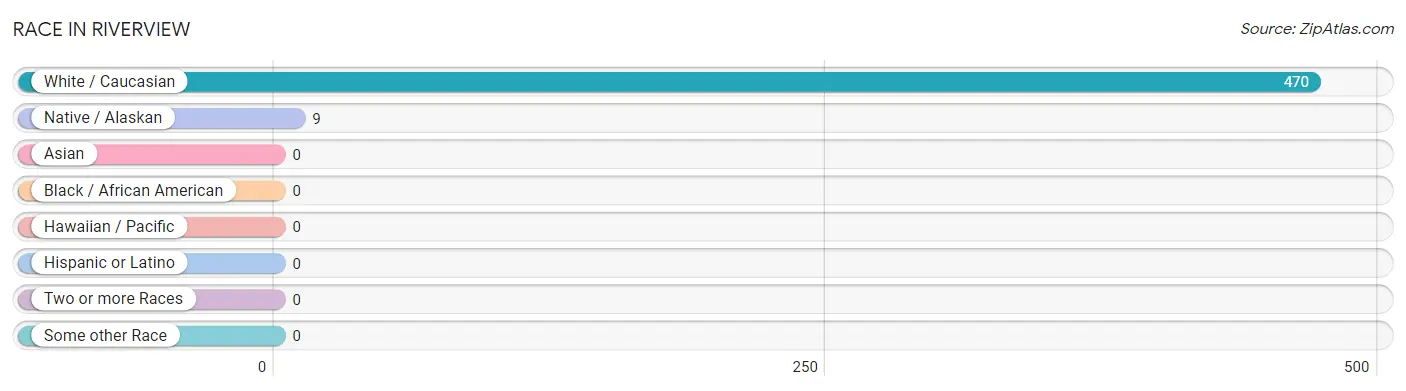
| Race | # Population | % Population |
| Asian | 0 | 0.0% |
| Black / African American | 0 | 0.0% |
| Hawaiian / Pacific | 0 | 0.0% |
| Hispanic or Latino | 0 | 0.0% |
| Native / Alaskan | 9 | 1.9% |
| White / Caucasian | 470 | 98.1% |
| Two or more Races | 0 | 0.0% |
| Some other Race | 0 | 0.0% |
| Total | 479 | 100.0% |
Ancestry in Riverview
The most populous ancestries reported in Riverview are American (177 | 36.9%), German (92 | 19.2%), English (38 | 7.9%), Scottish (35 | 7.3%), and Sioux (9 | 1.9%), together accounting for 73.3% of all Riverview residents.
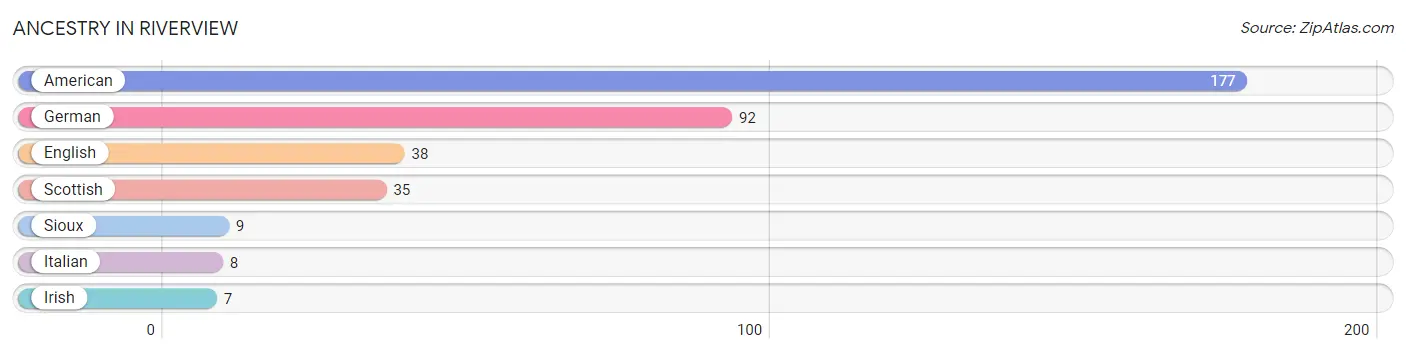
| Ancestry | # Population | % Population |
| American | 177 | 36.9% |
| English | 38 | 7.9% |
| German | 92 | 19.2% |
| Irish | 7 | 1.5% |
| Italian | 8 | 1.7% |
| Scottish | 35 | 7.3% |
| Sioux | 9 | 1.9% | View All 7 Rows |
Immigrants in Riverview

| Immigration Origin | # Population | % Population | View All 0 Rows |
Sex and Age in Riverview
Sex and Age in Riverview
The most populous age groups in Riverview are 65 to 69 Years (99 | 38.2%) for men and 65 to 69 Years (45 | 20.4%) for women.
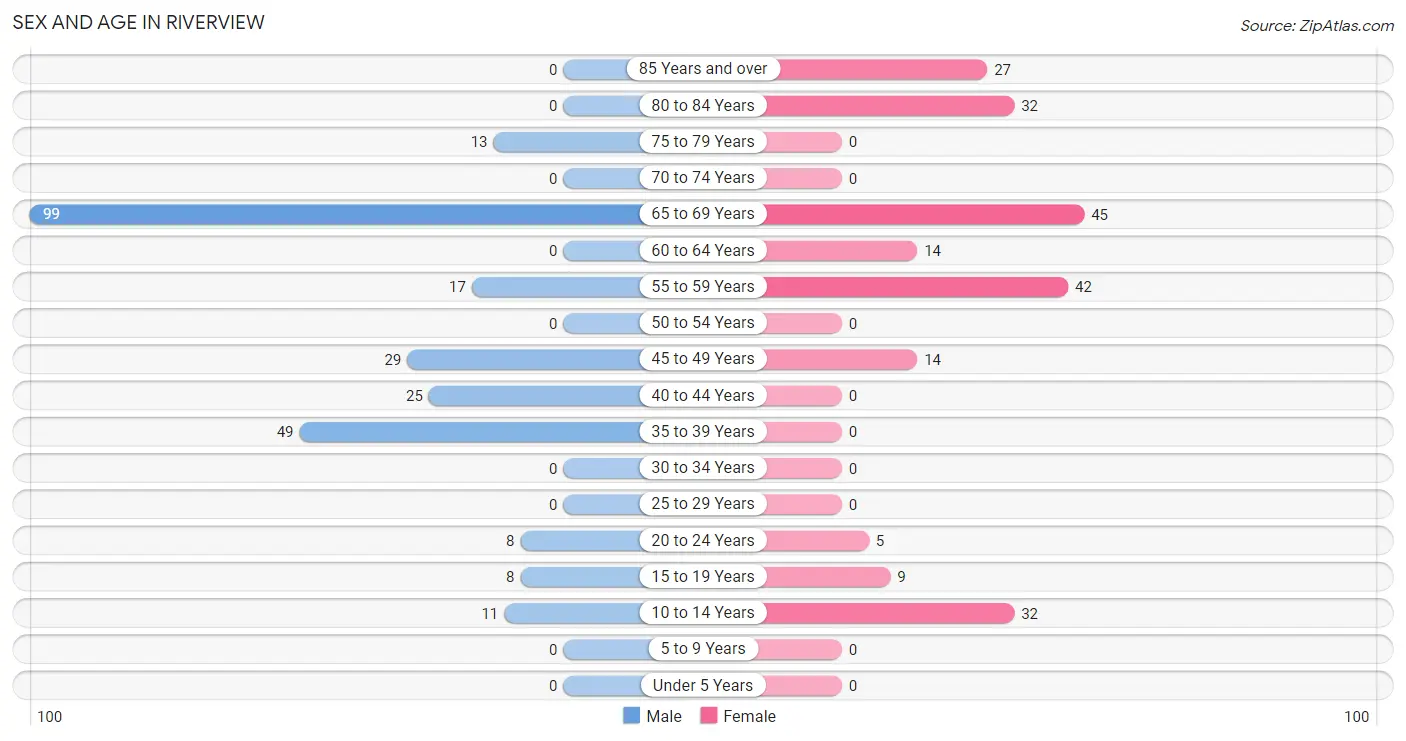
| Age Bracket | Male | Female |
| Under 5 Years | 0 (0.0%) | 0 (0.0%) |
| 5 to 9 Years | 0 (0.0%) | 0 (0.0%) |
| 10 to 14 Years | 11 (4.3%) | 32 (14.5%) |
| 15 to 19 Years | 8 (3.1%) | 9 (4.1%) |
| 20 to 24 Years | 8 (3.1%) | 5 (2.3%) |
| 25 to 29 Years | 0 (0.0%) | 0 (0.0%) |
| 30 to 34 Years | 0 (0.0%) | 0 (0.0%) |
| 35 to 39 Years | 49 (18.9%) | 0 (0.0%) |
| 40 to 44 Years | 25 (9.7%) | 0 (0.0%) |
| 45 to 49 Years | 29 (11.2%) | 14 (6.4%) |
| 50 to 54 Years | 0 (0.0%) | 0 (0.0%) |
| 55 to 59 Years | 17 (6.6%) | 42 (19.1%) |
| 60 to 64 Years | 0 (0.0%) | 14 (6.4%) |
| 65 to 69 Years | 99 (38.2%) | 45 (20.4%) |
| 70 to 74 Years | 0 (0.0%) | 0 (0.0%) |
| 75 to 79 Years | 13 (5.0%) | 0 (0.0%) |
| 80 to 84 Years | 0 (0.0%) | 32 (14.5%) |
| 85 Years and over | 0 (0.0%) | 27 (12.3%) |
| Total | 259 (100.0%) | 220 (100.0%) |
Families and Households in Riverview
Median Family Size in Riverview
The median family size in Riverview is 2.34 persons per family, with married-couple families (99 | 65.6%) accounting for the largest median family size of 2.52 persons per family. On the other hand, single female/mother families (27 | 17.9%) represent the smallest median family size with 1.85 persons per family.
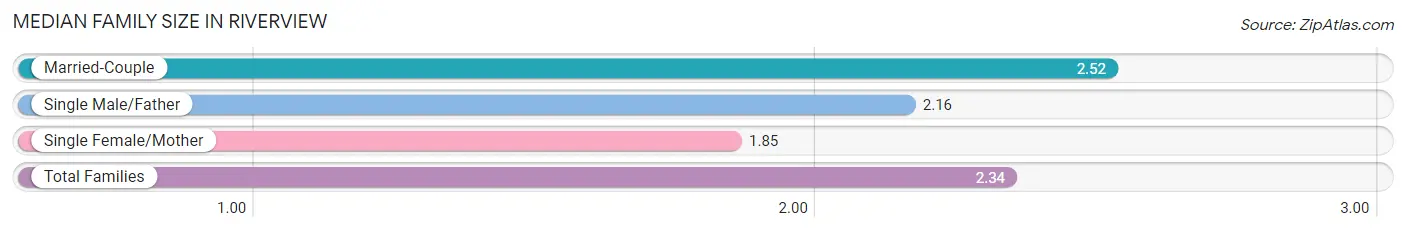
| Family Type | # Families | Family Size |
| Married-Couple | 99 (65.6%) | 2.52 |
| Single Male/Father | 25 (16.6%) | 2.16 |
| Single Female/Mother | 27 (17.9%) | 1.85 |
| Total Families | 151 (100.0%) | 2.34 |
Median Household Size in Riverview
The median household size in Riverview is 1.89 persons per household, with married-couple households (99 | 39.0%) accounting for the largest median household size of 2.52 persons per household. non-family households (103 | 40.6%) represent the smallest median household size with 1.22 persons per household.
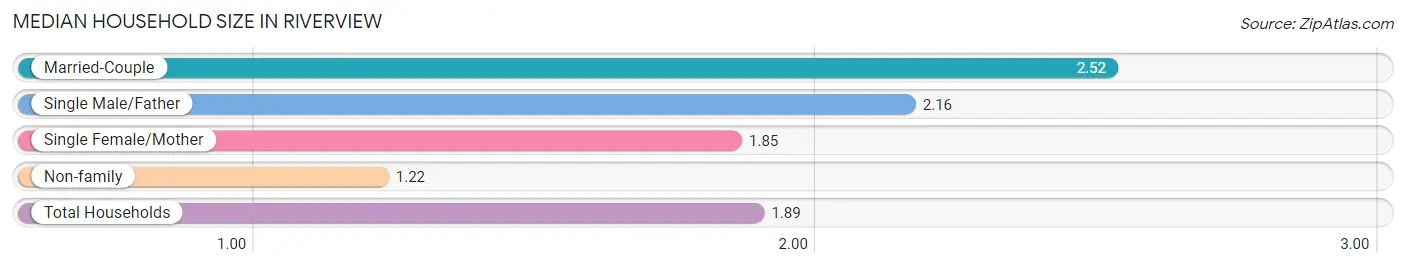
| Household Type | # Households | Household Size |
| Married-Couple | 99 (39.0%) | 2.52 |
| Single Male/Father | 25 (9.8%) | 2.16 |
| Single Female/Mother | 27 (10.6%) | 1.85 |
| Non-family | 103 (40.6%) | 1.22 |
| Total Households | 254 (100.0%) | 1.89 |
Household Size by Marriage Status in Riverview
Out of a total of 254 households in Riverview, 151 (59.5%) are family households, while 103 (40.6%) are nonfamily households. The most numerous type of family households are 2-person households, comprising 101, and the most common type of nonfamily households are 1-person households, comprising 92.
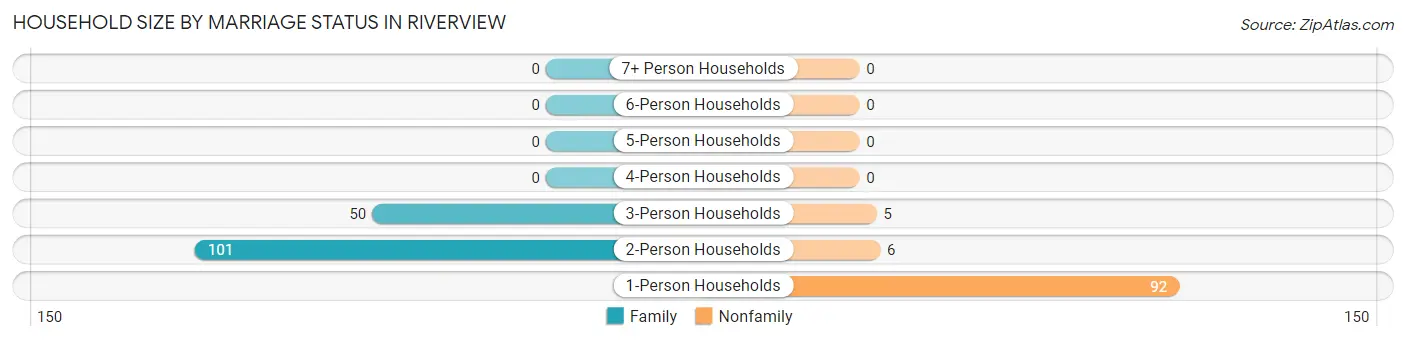
| Household Size | Family Households | Nonfamily Households |
| 1-Person Households | - | 92 (36.2%) |
| 2-Person Households | 101 (39.8%) | 6 (2.4%) |
| 3-Person Households | 50 (19.7%) | 5 (2.0%) |
| 4-Person Households | 0 (0.0%) | 0 (0.0%) |
| 5-Person Households | 0 (0.0%) | 0 (0.0%) |
| 6-Person Households | 0 (0.0%) | 0 (0.0%) |
| 7+ Person Households | 0 (0.0%) | 0 (0.0%) |
| Total | 151 (59.5%) | 103 (40.6%) |
Female Fertility in Riverview
Fertility by Age in Riverview
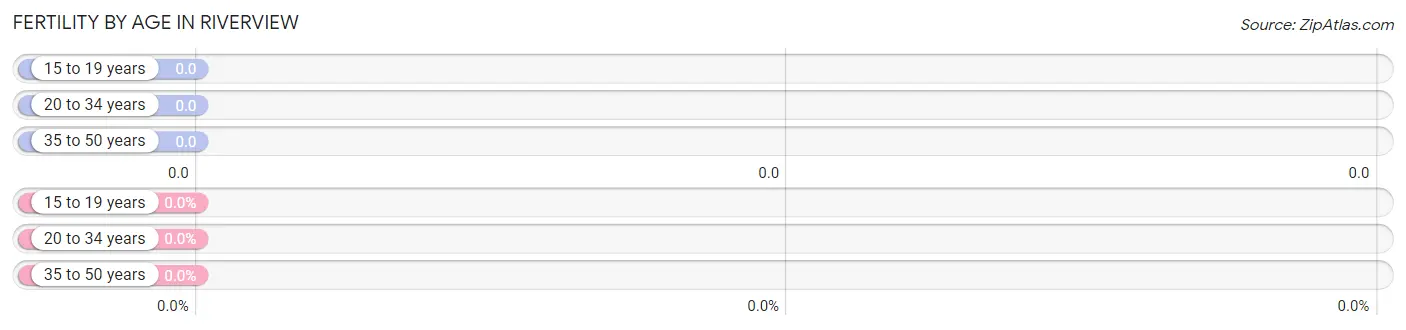
| Age Bracket | Women with Births | Births / 1,000 Women |
| 15 to 19 years | 0 (0.0%) | 0.0 |
| 20 to 34 years | 0 (0.0%) | 0.0 |
| 35 to 50 years | 0 (0.0%) | 0.0 |
| Total | 0 (0.0%) | 0.0 |
Fertility by Age by Marriage Status in Riverview
| Age Bracket | Married | Unmarried |
| 15 to 19 years | 0 (0.0%) | 0 (0.0%) |
| 20 to 34 years | 0 (0.0%) | 0 (0.0%) |
| 35 to 50 years | 0 (0.0%) | 0 (0.0%) |
| Total | 0 (0.0%) | 0 (0.0%) |
Fertility by Education in Riverview
| Educational Attainment | Women with Births | Births / 1,000 Women |
| Less than High School | 0 (0.0%) | 0.0 |
| High School Diploma | 0 (0.0%) | 0.0 |
| College or Associate's Degree | 0 (0.0%) | 0.0 |
| Bachelor's Degree | 0 (0.0%) | 0.0 |
| Graduate Degree | 0 (0.0%) | 0.0 |
| Total | 0 (0.0%) | 0.0 |
Fertility by Education by Marriage Status in Riverview
| Educational Attainment | Married | Unmarried |
| Less than High School | 0 (0.0%) | 0 (0.0%) |
| High School Diploma | 0 (0.0%) | 0 (0.0%) |
| College or Associate's Degree | 0 (0.0%) | 0 (0.0%) |
| Bachelor's Degree | 0 (0.0%) | 0 (0.0%) |
| Graduate Degree | 0 (0.0%) | 0 (0.0%) |
| Total | 0 (0.0%) | 0 (0.0%) |
Employment Characteristics in Riverview
Employment by Class of Employer in Riverview
Among the 72 employed individuals in Riverview, private company employees (64 | 88.9%), and federal government employees (8 | 11.1%) make up the most common classes of employment.
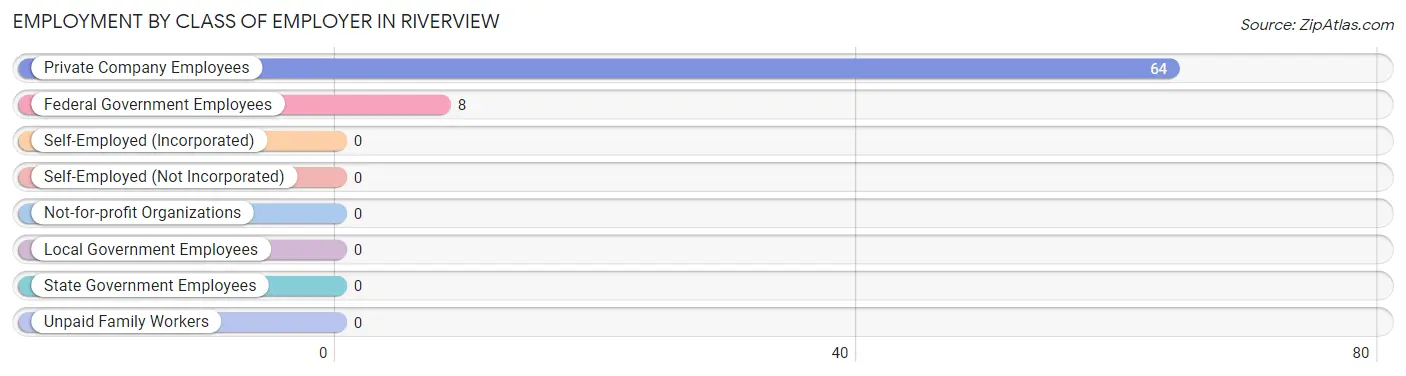
| Employer Class | # Employees | % Employees |
| Private Company Employees | 64 | 88.9% |
| Self-Employed (Incorporated) | 0 | 0.0% |
| Self-Employed (Not Incorporated) | 0 | 0.0% |
| Not-for-profit Organizations | 0 | 0.0% |
| Local Government Employees | 0 | 0.0% |
| State Government Employees | 0 | 0.0% |
| Federal Government Employees | 8 | 11.1% |
| Unpaid Family Workers | 0 | 0.0% |
| Total | 72 | 100.0% |
Employment Status by Age in Riverview
According to the labor force statistics for Riverview, out of the total population over 16 years of age (436), 19.7% or 86 individuals are in the labor force, with 16.3% or 14 of them unemployed. The age group with the highest labor force participation rate is 45 to 54 years, with 100.0% or 43 individuals in the labor force. Within the labor force, the 45 to 54 years age range has the highest percentage of unemployed individuals, with 32.6% or 14 of them being unemployed.
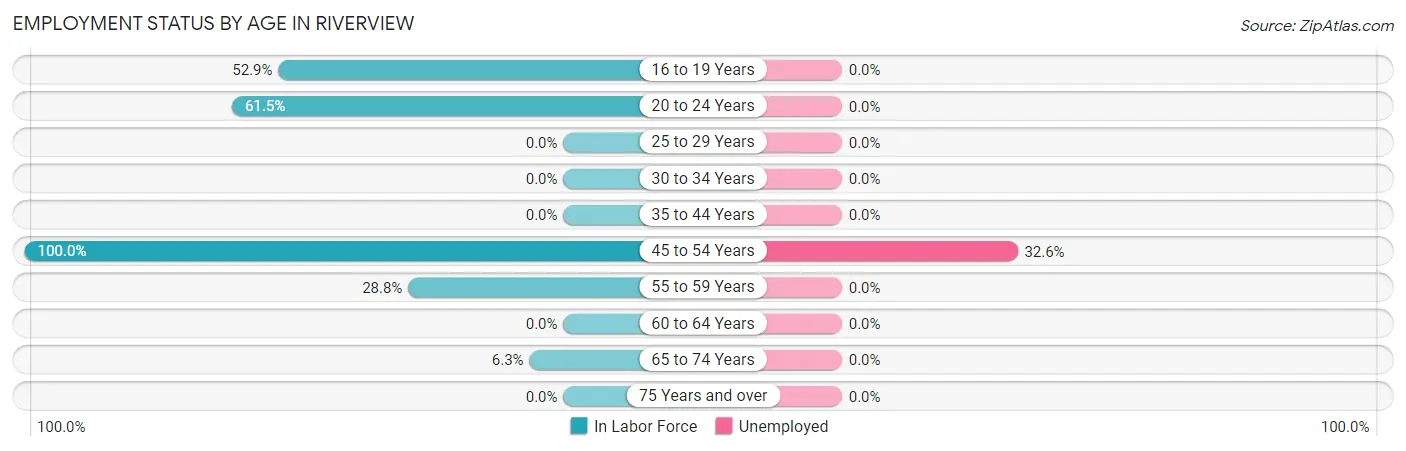
| Age Bracket | In Labor Force | Unemployed |
| 16 to 19 Years | 9 (52.9%) | 0 (0.0%) |
| 20 to 24 Years | 8 (61.5%) | 0 (0.0%) |
| 25 to 29 Years | 0 (0.0%) | 0 (0.0%) |
| 30 to 34 Years | 0 (0.0%) | 0 (0.0%) |
| 35 to 44 Years | 0 (0.0%) | 0 (0.0%) |
| 45 to 54 Years | 43 (100.0%) | 14 (32.6%) |
| 55 to 59 Years | 17 (28.8%) | 0 (0.0%) |
| 60 to 64 Years | 0 (0.0%) | 0 (0.0%) |
| 65 to 74 Years | 9 (6.3%) | 0 (0.0%) |
| 75 Years and over | 0 (0.0%) | 0 (0.0%) |
| Total | 86 (19.7%) | 14 (16.3%) |
Employment Status by Educational Attainment in Riverview
According to labor force statistics for Riverview, 31.6% of individuals (60) out of the total population between 25 and 64 years of age (190) are in the labor force, with 23.3% or 14 of them being unemployed. The group with the highest labor force participation rate are those with the educational attainment of high school diploma, with 41.3% or 31 individuals in the labor force. Within the labor force, individuals with high school diploma education have the highest percentage of unemployment, with 45.2% or 14 of them being unemployed.
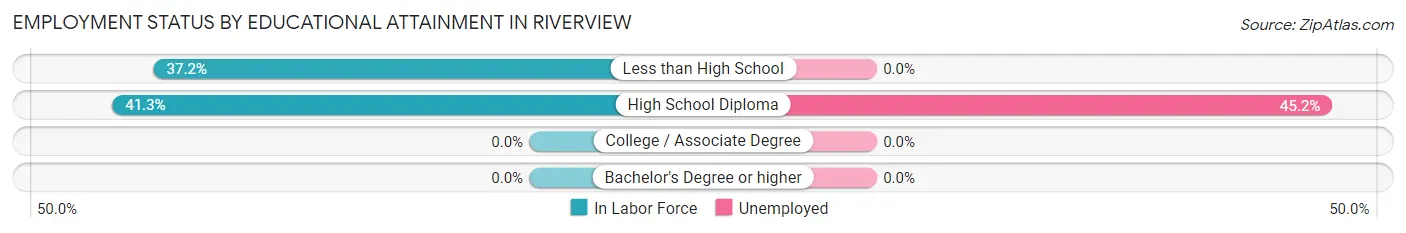
| Educational Attainment | In Labor Force | Unemployed |
| Less than High School | 29 (37.2%) | 0 (0.0%) |
| High School Diploma | 31 (41.3%) | 34 (45.2%) |
| College / Associate Degree | 0 (0.0%) | 0 (0.0%) |
| Bachelor's Degree or higher | 0 (0.0%) | 0 (0.0%) |
| Total | 60 (31.6%) | 44 (23.3%) |
Employment Occupations by Sex in Riverview
Management, Business, Science and Arts Occupations
Management, Business, Science and Arts Occupations by Sex
| Occupation | Male | Female |
| Management | 0 (0.0%) | 0 (0.0%) |
| Business & Financial | 0 (0.0%) | 0 (0.0%) |
| Computers, Engineering & Science | 0 (0.0%) | 0 (0.0%) |
| Computers & Mathematics | 0 (0.0%) | 0 (0.0%) |
| Architecture & Engineering | 0 (0.0%) | 0 (0.0%) |
| Life, Physical & Social Science | 0 (0.0%) | 0 (0.0%) |
| Community & Social Service | 0 (0.0%) | 0 (0.0%) |
| Education, Arts & Media | 0 (0.0%) | 0 (0.0%) |
| Legal Services & Support | 0 (0.0%) | 0 (0.0%) |
| Education Instruction & Library | 0 (0.0%) | 0 (0.0%) |
| Arts, Media & Entertainment | 0 (0.0%) | 0 (0.0%) |
| Health Diagnosing & Treating | 0 (0.0%) | 0 (0.0%) |
| Health Technologists | 0 (0.0%) | 0 (0.0%) |
| Total (Category) | 0 (0.0%) | 0 (0.0%) |
| Total (Overall) | 63 (87.5%) | 9 (12.5%) |
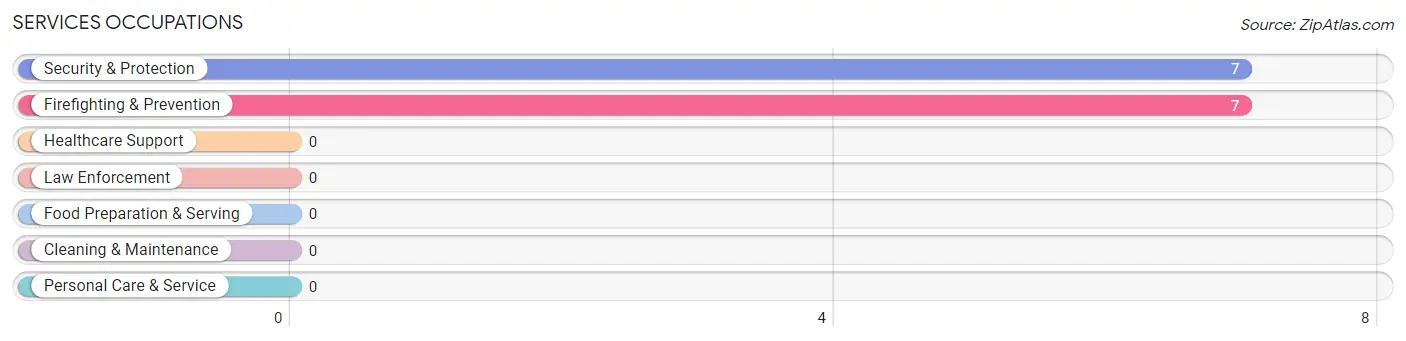
Services Occupations
The most common Services occupations in Riverview are Security & Protection (7 | 9.7%), and Firefighting & Prevention (7 | 9.7%).
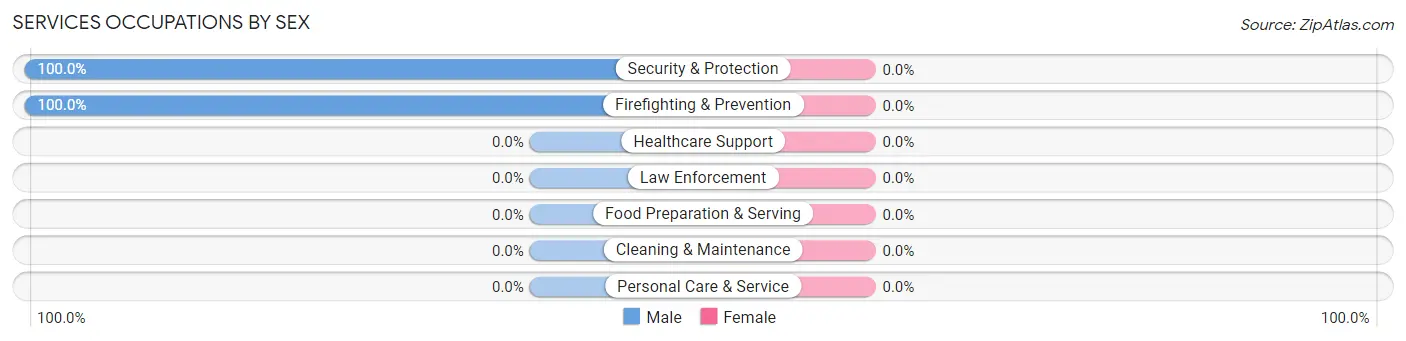
Services Occupations by Sex
| Occupation | Male | Female |
| Healthcare Support | 0 (0.0%) | 0 (0.0%) |
| Security & Protection | 7 (100.0%) | 0 (0.0%) |
| Firefighting & Prevention | 7 (100.0%) | 0 (0.0%) |
| Law Enforcement | 0 (0.0%) | 0 (0.0%) |
| Food Preparation & Serving | 0 (0.0%) | 0 (0.0%) |
| Cleaning & Maintenance | 0 (0.0%) | 0 (0.0%) |
| Personal Care & Service | 0 (0.0%) | 0 (0.0%) |
| Total (Category) | 7 (100.0%) | 0 (0.0%) |
| Total (Overall) | 63 (87.5%) | 9 (12.5%) |
Sales and Office Occupations
The most common Sales and Office occupations in Riverview are Sales & Related (18 | 25.0%), and Office & Administration (8 | 11.1%).

Sales and Office Occupations by Sex

| Occupation | Male | Female |
| Sales & Related | 9 (50.0%) | 9 (50.0%) |
| Office & Administration | 8 (100.0%) | 0 (0.0%) |
| Total (Category) | 17 (65.4%) | 9 (34.6%) |
| Total (Overall) | 63 (87.5%) | 9 (12.5%) |
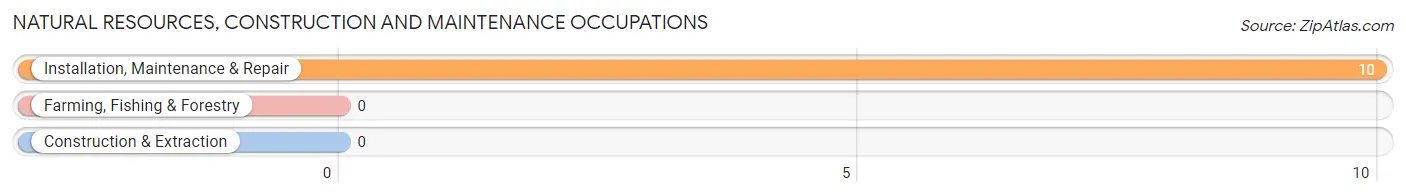
Natural Resources, Construction and Maintenance Occupations
The most common Natural Resources, Construction and Maintenance occupations in Riverview are , and Installation, Maintenance & Repair (10 | 13.9%).
Natural Resources, Construction and Maintenance Occupations by Sex

| Occupation | Male | Female |
| Farming, Fishing & Forestry | 0 (0.0%) | 0 (0.0%) |
| Construction & Extraction | 0 (0.0%) | 0 (0.0%) |
| Installation, Maintenance & Repair | 10 (100.0%) | 0 (0.0%) |
| Total (Category) | 10 (100.0%) | 0 (0.0%) |
| Total (Overall) | 63 (87.5%) | 9 (12.5%) |
Production, Transportation and Moving Occupations
The most common Production, Transportation and Moving occupations in Riverview are , and Material Moving (29 | 40.3%).
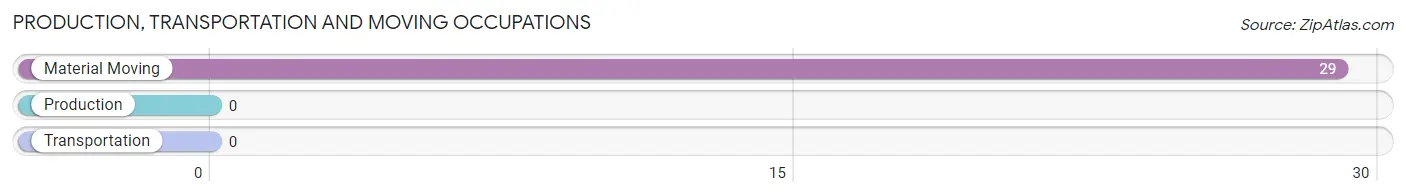
Production, Transportation and Moving Occupations by Sex
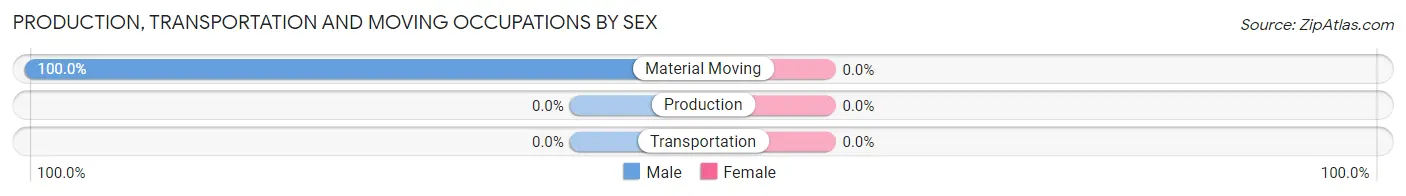
| Occupation | Male | Female |
| Production | 0 (0.0%) | 0 (0.0%) |
| Transportation | 0 (0.0%) | 0 (0.0%) |
| Material Moving | 29 (100.0%) | 0 (0.0%) |
| Total (Category) | 29 (100.0%) | 0 (0.0%) |
| Total (Overall) | 63 (87.5%) | 9 (12.5%) |
Employment Industries by Sex in Riverview
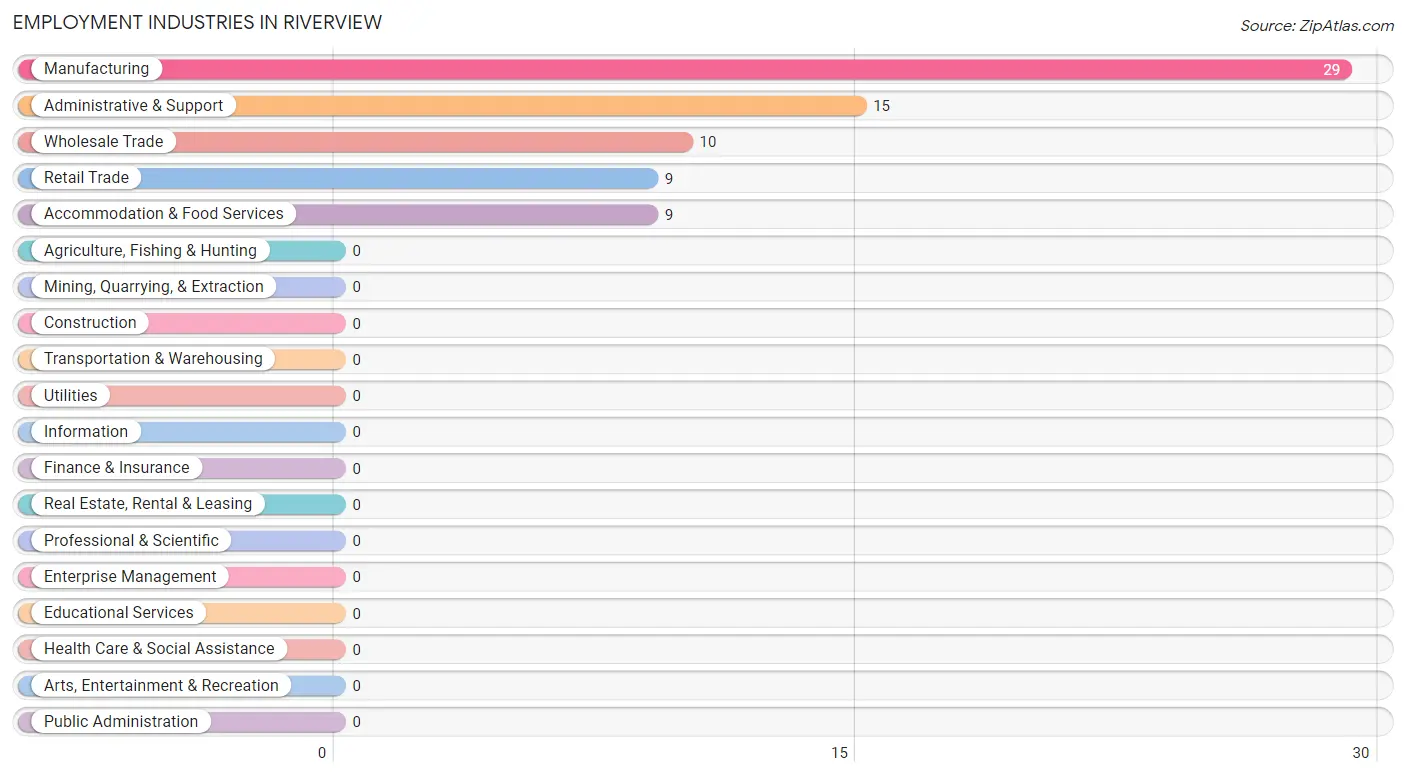
Employment Industries in Riverview
The major employment industries in Riverview include Manufacturing (29 | 40.3%), Administrative & Support (15 | 20.8%), Wholesale Trade (10 | 13.9%), Retail Trade (9 | 12.5%), and Accommodation & Food Services (9 | 12.5%).
Employment Industries by Sex in Riverview
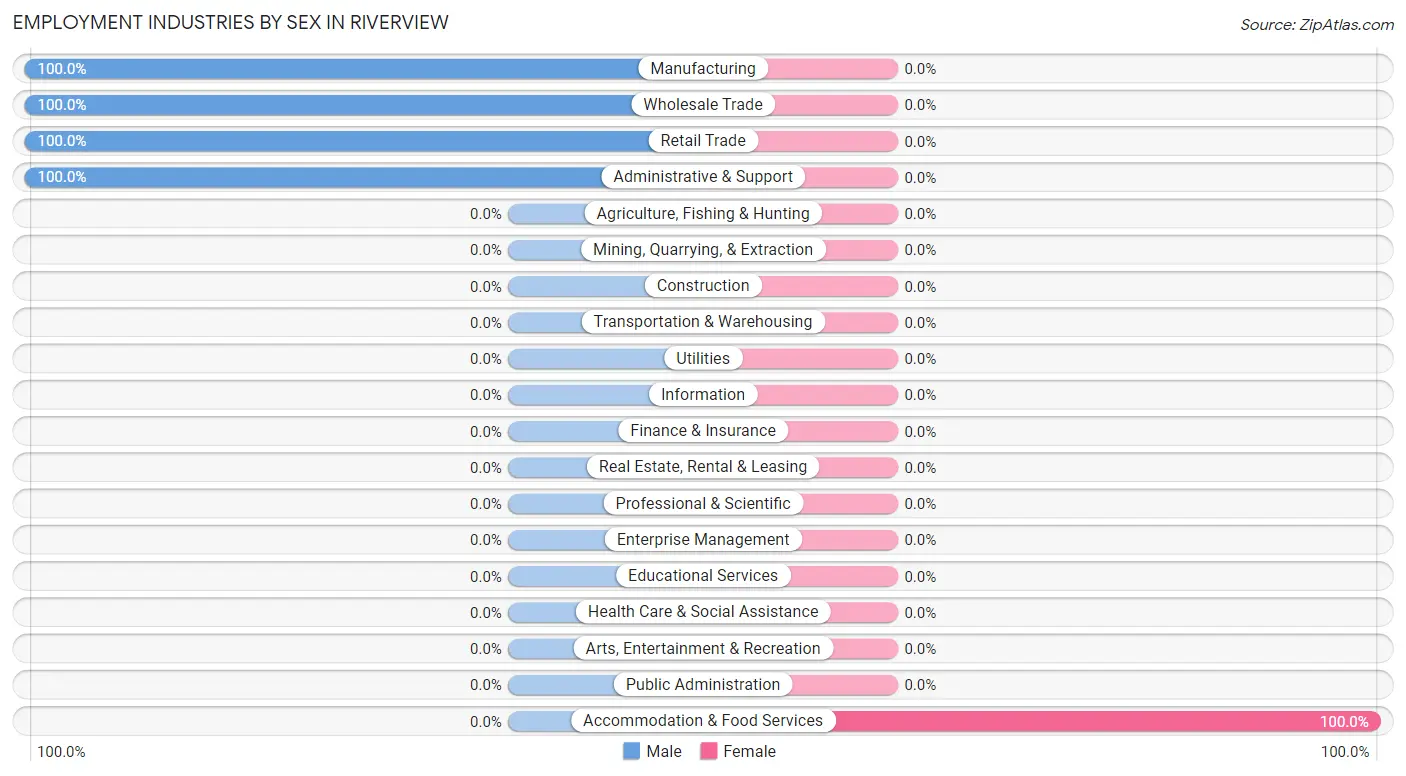
| Industry | Male | Female |
| Agriculture, Fishing & Hunting | 0 (0.0%) | 0 (0.0%) |
| Mining, Quarrying, & Extraction | 0 (0.0%) | 0 (0.0%) |
| Construction | 0 (0.0%) | 0 (0.0%) |
| Manufacturing | 29 (100.0%) | 0 (0.0%) |
| Wholesale Trade | 10 (100.0%) | 0 (0.0%) |
| Retail Trade | 9 (100.0%) | 0 (0.0%) |
| Transportation & Warehousing | 0 (0.0%) | 0 (0.0%) |
| Utilities | 0 (0.0%) | 0 (0.0%) |
| Information | 0 (0.0%) | 0 (0.0%) |
| Finance & Insurance | 0 (0.0%) | 0 (0.0%) |
| Real Estate, Rental & Leasing | 0 (0.0%) | 0 (0.0%) |
| Professional & Scientific | 0 (0.0%) | 0 (0.0%) |
| Enterprise Management | 0 (0.0%) | 0 (0.0%) |
| Administrative & Support | 15 (100.0%) | 0 (0.0%) |
| Educational Services | 0 (0.0%) | 0 (0.0%) |
| Health Care & Social Assistance | 0 (0.0%) | 0 (0.0%) |
| Arts, Entertainment & Recreation | 0 (0.0%) | 0 (0.0%) |
| Accommodation & Food Services | 0 (0.0%) | 9 (100.0%) |
| Public Administration | 0 (0.0%) | 0 (0.0%) |
| Total | 63 (87.5%) | 9 (12.5%) |
Education in Riverview
School Enrollment in Riverview
The most common levels of schooling among the 60 students in Riverview are middle school (43 | 71.7%), and high school (17 | 28.3%).
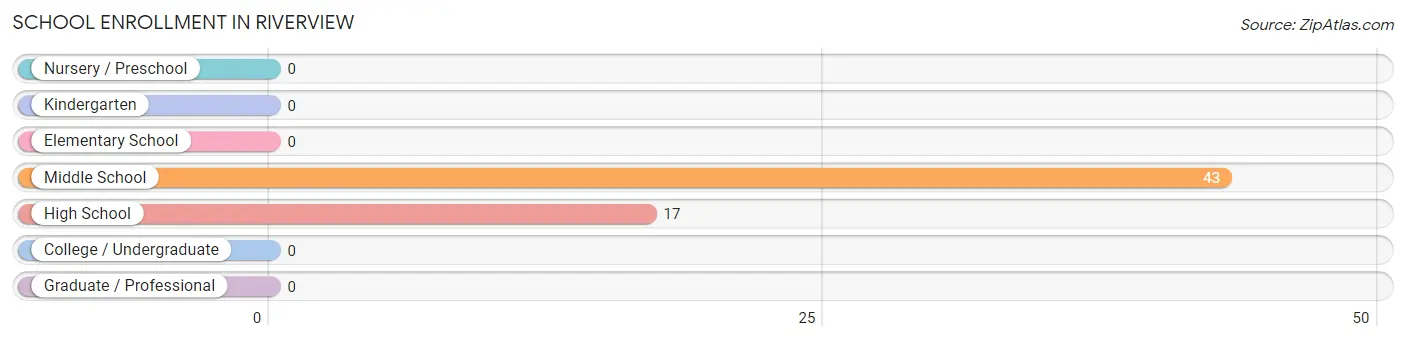
| School Level | # Students | % Students |
| Nursery / Preschool | 0 | 0.0% |
| Kindergarten | 0 | 0.0% |
| Elementary School | 0 | 0.0% |
| Middle School | 43 | 71.7% |
| High School | 17 | 28.3% |
| College / Undergraduate | 0 | 0.0% |
| Graduate / Professional | 0 | 0.0% |
| Total | 60 | 100.0% |
School Enrollment by Age by Funding Source in Riverview
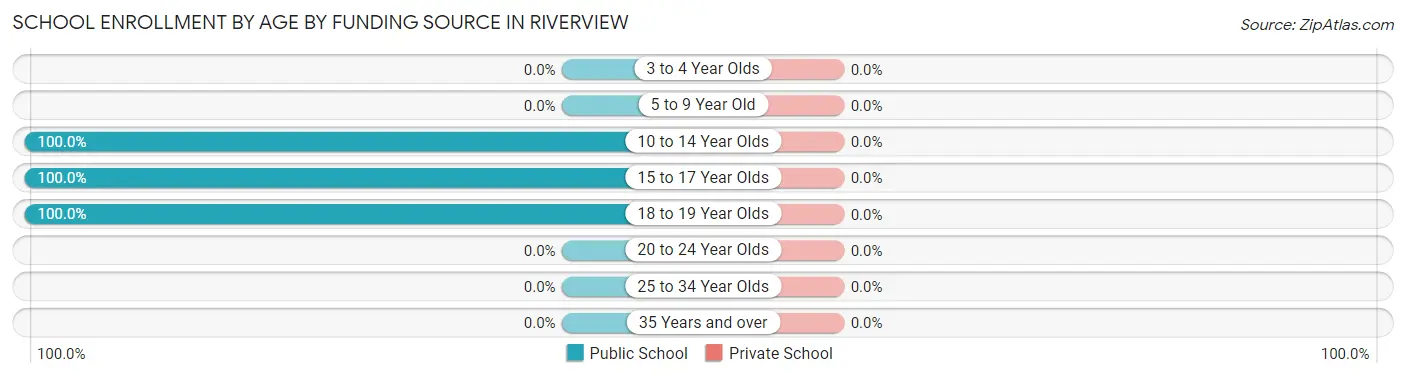
| Age Bracket | Public School | Private School |
| 3 to 4 Year Olds | 0 (0.0%) | 0 (0.0%) |
| 5 to 9 Year Old | 0 (0.0%) | 0 (0.0%) |
| 10 to 14 Year Olds | 43 (100.0%) | 0 (0.0%) |
| 15 to 17 Year Olds | 8 (100.0%) | 0 (0.0%) |
| 18 to 19 Year Olds | 9 (100.0%) | 0 (0.0%) |
| 20 to 24 Year Olds | 0 (0.0%) | 0 (0.0%) |
| 25 to 34 Year Olds | 0 (0.0%) | 0 (0.0%) |
| 35 Years and over | 0 (0.0%) | 0 (0.0%) |
| Total | 60 (100.0%) | 0 (0.0%) |
Educational Attainment by Field of Study in Riverview
, and education (31 | 100.0%) are the most common fields of study among 31 individuals in Riverview who have obtained a bachelor's degree or higher.
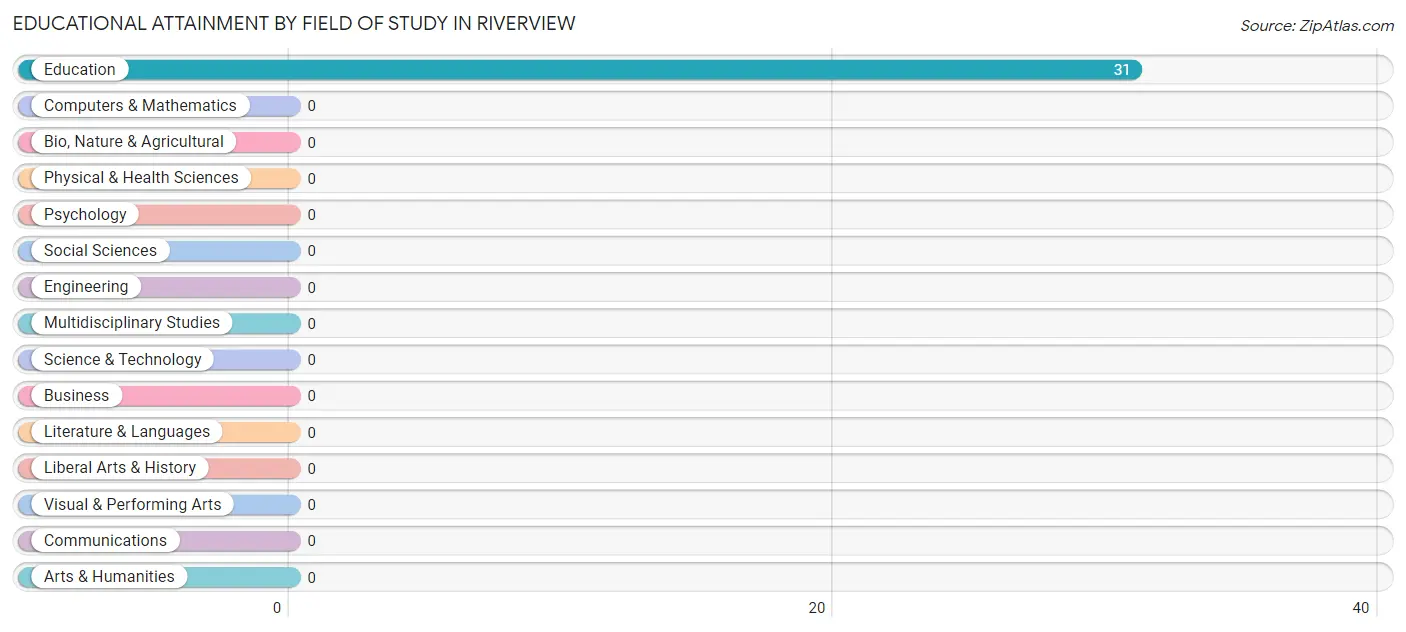
| Field of Study | # Graduates | % Graduates |
| Computers & Mathematics | 0 | 0.0% |
| Bio, Nature & Agricultural | 0 | 0.0% |
| Physical & Health Sciences | 0 | 0.0% |
| Psychology | 0 | 0.0% |
| Social Sciences | 0 | 0.0% |
| Engineering | 0 | 0.0% |
| Multidisciplinary Studies | 0 | 0.0% |
| Science & Technology | 0 | 0.0% |
| Business | 0 | 0.0% |
| Education | 31 | 100.0% |
| Literature & Languages | 0 | 0.0% |
| Liberal Arts & History | 0 | 0.0% |
| Visual & Performing Arts | 0 | 0.0% |
| Communications | 0 | 0.0% |
| Arts & Humanities | 0 | 0.0% |
| Total | 31 | 100.0% |
Transportation & Commute in Riverview
Vehicle Availability by Sex in Riverview
The most prevalent vehicle ownership categories in Riverview are males with 1 vehicle (46, accounting for 73.0%) and females with 1 vehicle (0, making up 511.1%).
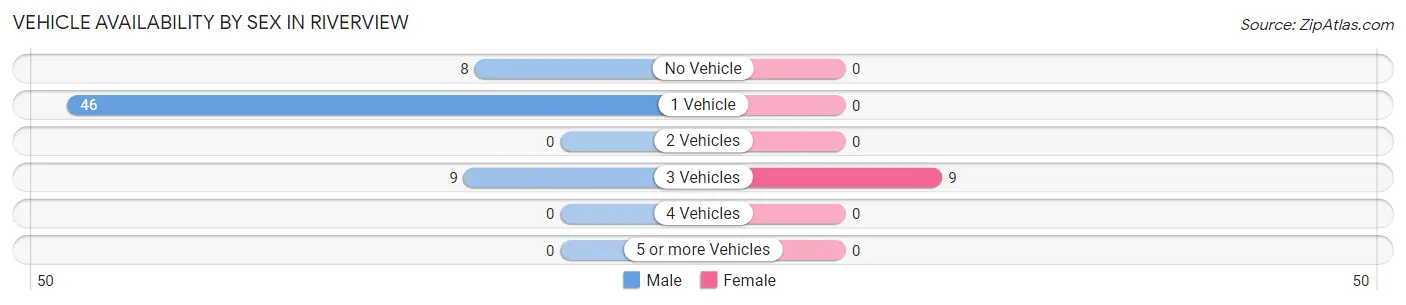
| Vehicles Available | Male | Female |
| No Vehicle | 8 (12.7%) | 0 (0.0%) |
| 1 Vehicle | 46 (73.0%) | 0 (0.0%) |
| 2 Vehicles | 0 (0.0%) | 0 (0.0%) |
| 3 Vehicles | 9 (14.3%) | 9 (100.0%) |
| 4 Vehicles | 0 (0.0%) | 0 (0.0%) |
| 5 or more Vehicles | 0 (0.0%) | 0 (0.0%) |
| Total | 63 (100.0%) | 9 (100.0%) |
Commute Time in Riverview
The most frequently occuring commute durations in Riverview are 45 to 59 minutes (29 commuters, 45.3%), 10 to 14 minutes (19 commuters, 29.7%), and 15 to 19 minutes (16 commuters, 25.0%).
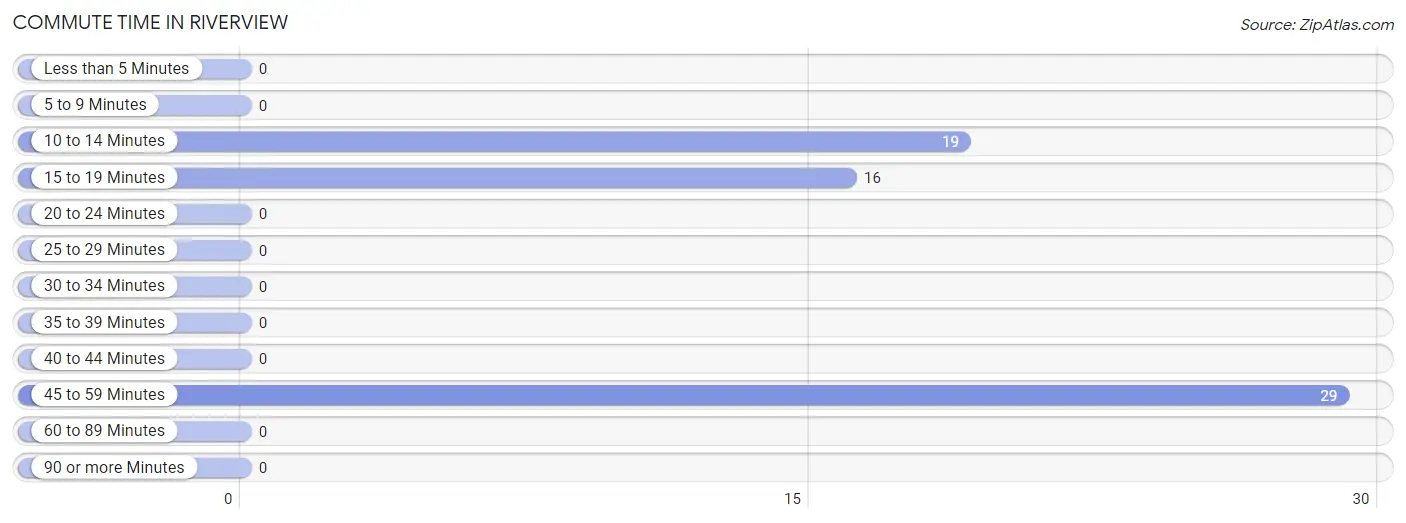
| Commute Time | # Commuters | % Commuters |
| Less than 5 Minutes | 0 | 0.0% |
| 5 to 9 Minutes | 0 | 0.0% |
| 10 to 14 Minutes | 19 | 29.7% |
| 15 to 19 Minutes | 16 | 25.0% |
| 20 to 24 Minutes | 0 | 0.0% |
| 25 to 29 Minutes | 0 | 0.0% |
| 30 to 34 Minutes | 0 | 0.0% |
| 35 to 39 Minutes | 0 | 0.0% |
| 40 to 44 Minutes | 0 | 0.0% |
| 45 to 59 Minutes | 29 | 45.3% |
| 60 to 89 Minutes | 0 | 0.0% |
| 90 or more Minutes | 0 | 0.0% |
Commute Time by Sex in Riverview
The most common commute times in Riverview are 45 to 59 minutes (29 commuters, 52.7%) for males and 10 to 14 minutes (9 commuters, 100.0%) for females.
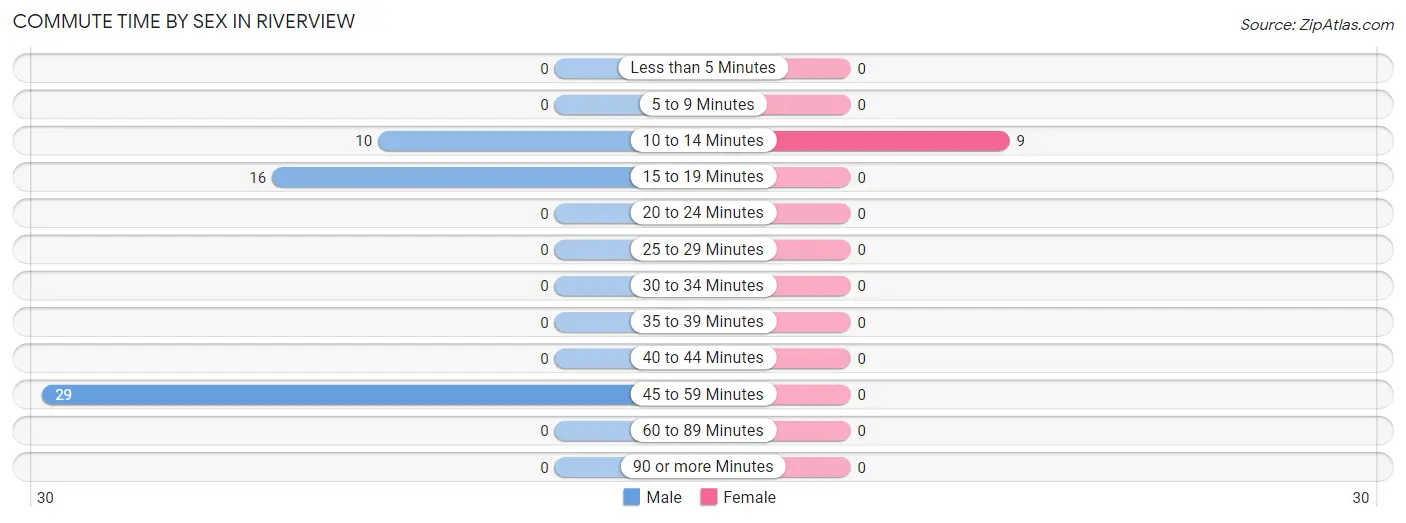
| Commute Time | Male | Female |
| Less than 5 Minutes | 0 (0.0%) | 0 (0.0%) |
| 5 to 9 Minutes | 0 (0.0%) | 0 (0.0%) |
| 10 to 14 Minutes | 10 (18.2%) | 9 (100.0%) |
| 15 to 19 Minutes | 16 (29.1%) | 0 (0.0%) |
| 20 to 24 Minutes | 0 (0.0%) | 0 (0.0%) |
| 25 to 29 Minutes | 0 (0.0%) | 0 (0.0%) |
| 30 to 34 Minutes | 0 (0.0%) | 0 (0.0%) |
| 35 to 39 Minutes | 0 (0.0%) | 0 (0.0%) |
| 40 to 44 Minutes | 0 (0.0%) | 0 (0.0%) |
| 45 to 59 Minutes | 29 (52.7%) | 0 (0.0%) |
| 60 to 89 Minutes | 0 (0.0%) | 0 (0.0%) |
| 90 or more Minutes | 0 (0.0%) | 0 (0.0%) |
Time of Departure to Work by Sex in Riverview
The most frequent times of departure to work in Riverview are 12:00 AM to 4:59 AM (29, 52.7%) for males and 9:00 AM to 9:59 AM (9, 100.0%) for females.
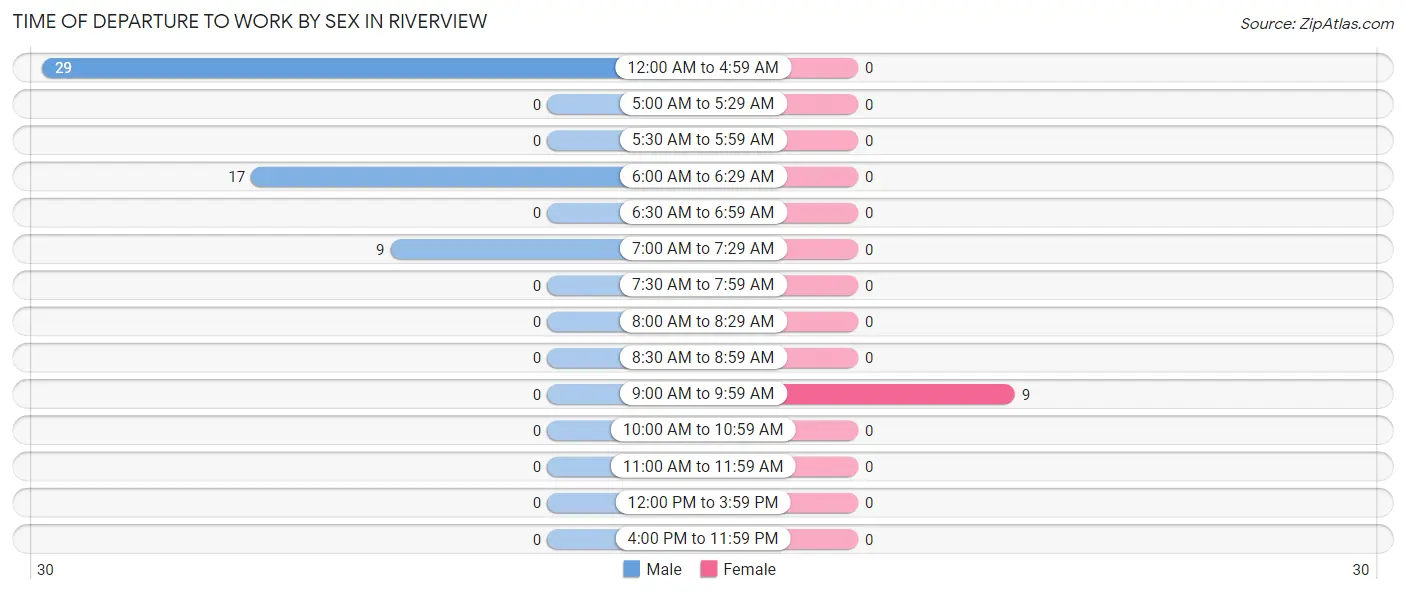
| Time of Departure | Male | Female |
| 12:00 AM to 4:59 AM | 29 (52.7%) | 0 (0.0%) |
| 5:00 AM to 5:29 AM | 0 (0.0%) | 0 (0.0%) |
| 5:30 AM to 5:59 AM | 0 (0.0%) | 0 (0.0%) |
| 6:00 AM to 6:29 AM | 17 (30.9%) | 0 (0.0%) |
| 6:30 AM to 6:59 AM | 0 (0.0%) | 0 (0.0%) |
| 7:00 AM to 7:29 AM | 9 (16.4%) | 0 (0.0%) |
| 7:30 AM to 7:59 AM | 0 (0.0%) | 0 (0.0%) |
| 8:00 AM to 8:29 AM | 0 (0.0%) | 0 (0.0%) |
| 8:30 AM to 8:59 AM | 0 (0.0%) | 0 (0.0%) |
| 9:00 AM to 9:59 AM | 0 (0.0%) | 9 (100.0%) |
| 10:00 AM to 10:59 AM | 0 (0.0%) | 0 (0.0%) |
| 11:00 AM to 11:59 AM | 0 (0.0%) | 0 (0.0%) |
| 12:00 PM to 3:59 PM | 0 (0.0%) | 0 (0.0%) |
| 4:00 PM to 11:59 PM | 0 (0.0%) | 0 (0.0%) |
| Total | 55 (100.0%) | 9 (100.0%) |
Housing Occupancy in Riverview
Occupancy by Ownership in Riverview
Of the total 254 dwellings in Riverview, owner-occupied units account for 243 (95.7%), while renter-occupied units make up 11 (4.3%).
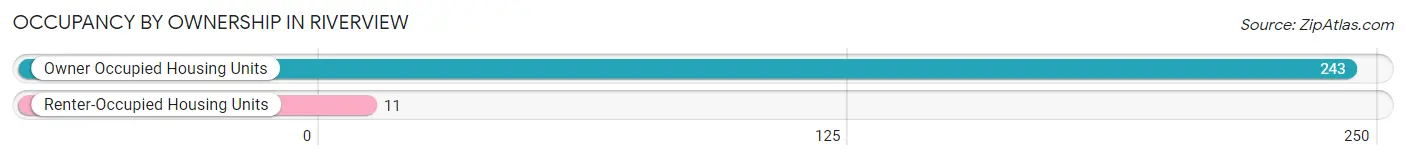
| Occupancy | # Housing Units | % Housing Units |
| Owner Occupied Housing Units | 243 | 95.7% |
| Renter-Occupied Housing Units | 11 | 4.3% |
| Total Occupied Housing Units | 254 | 100.0% |
Occupancy by Household Size in Riverview
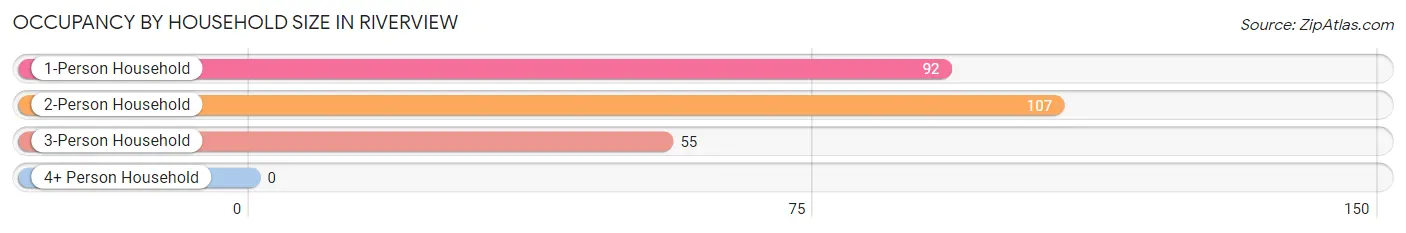
| Household Size | # Housing Units | % Housing Units |
| 1-Person Household | 92 | 36.2% |
| 2-Person Household | 107 | 42.1% |
| 3-Person Household | 55 | 21.6% |
| 4+ Person Household | 0 | 0.0% |
| Total Housing Units | 254 | 100.0% |
Occupancy by Ownership by Household Size in Riverview
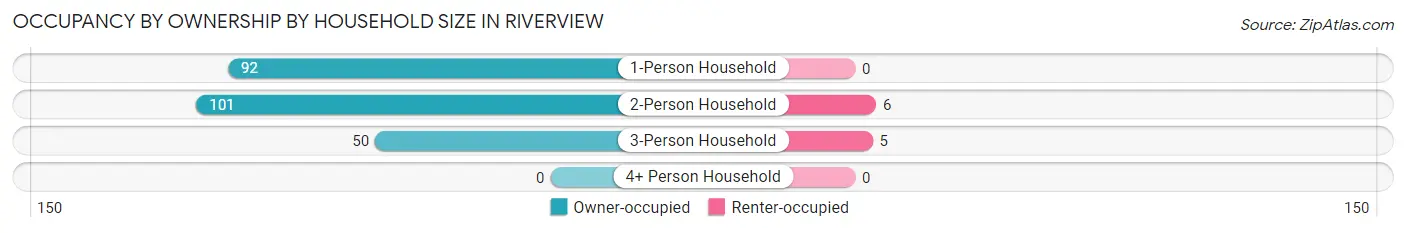
| Household Size | Owner-occupied | Renter-occupied |
| 1-Person Household | 92 (100.0%) | 0 (0.0%) |
| 2-Person Household | 101 (94.4%) | 6 (5.6%) |
| 3-Person Household | 50 (90.9%) | 5 (9.1%) |
| 4+ Person Household | 0 (0.0%) | 0 (0.0%) |
| Total Housing Units | 243 (95.7%) | 11 (4.3%) |
Occupancy by Educational Attainment in Riverview
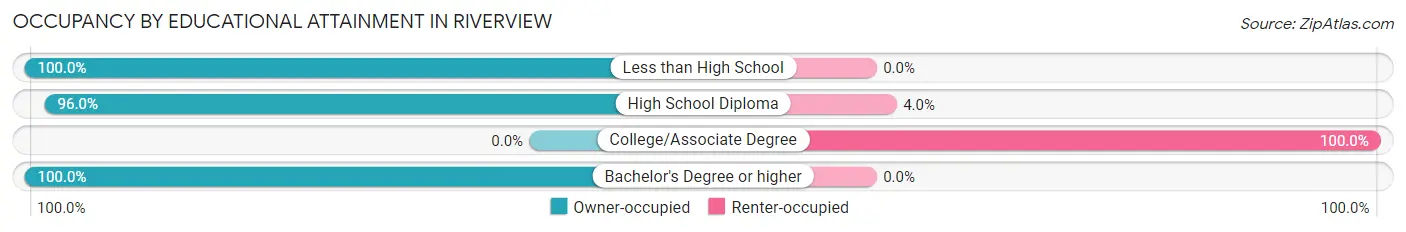
| Household Size | Owner-occupied | Renter-occupied |
| Less than High School | 91 (100.0%) | 0 (0.0%) |
| High School Diploma | 121 (96.0%) | 5 (4.0%) |
| College/Associate Degree | 0 (0.0%) | 6 (100.0%) |
| Bachelor's Degree or higher | 31 (100.0%) | 0 (0.0%) |
Occupancy by Age of Householder in Riverview
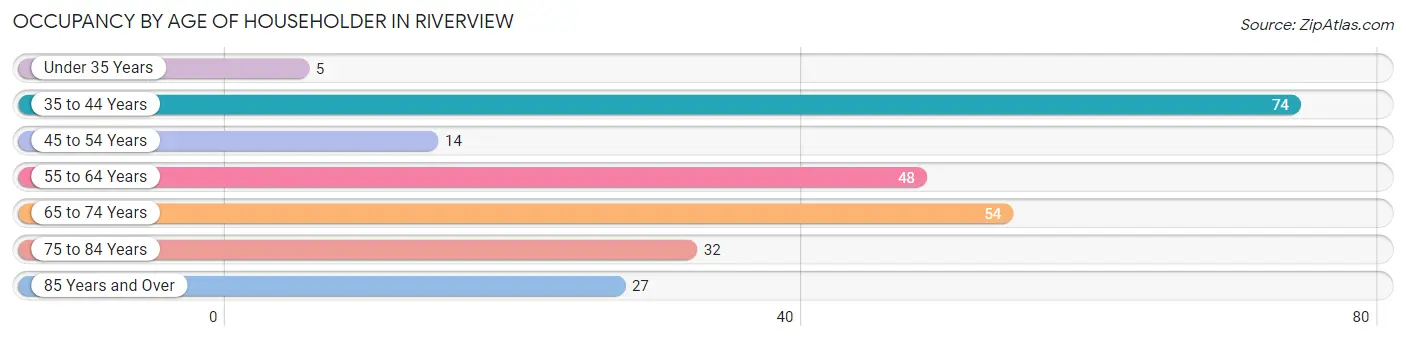
| Age Bracket | # Households | % Households |
| Under 35 Years | 5 | 2.0% |
| 35 to 44 Years | 74 | 29.1% |
| 45 to 54 Years | 14 | 5.5% |
| 55 to 64 Years | 48 | 18.9% |
| 65 to 74 Years | 54 | 21.3% |
| 75 to 84 Years | 32 | 12.6% |
| 85 Years and Over | 27 | 10.6% |
| Total | 254 | 100.0% |
Housing Finances in Riverview
Median Income by Occupancy in Riverview
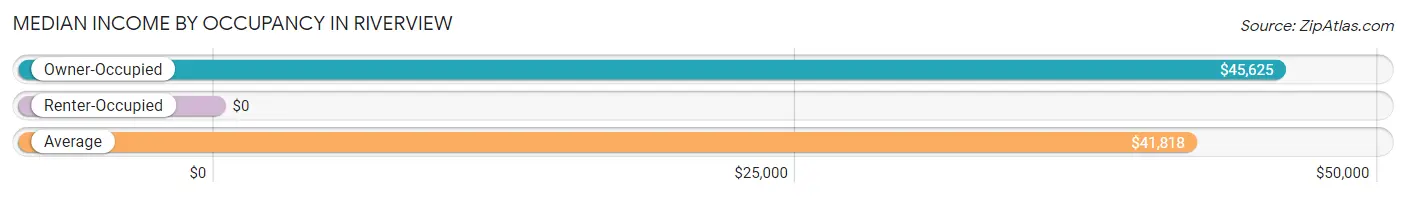
| Occupancy Type | # Households | Median Income |
| Owner-Occupied | 243 (95.7%) | $45,625 |
| Renter-Occupied | 11 (4.3%) | $0 |
| Average | 254 (100.0%) | $41,818 |
Occupancy by Householder Income Bracket in Riverview
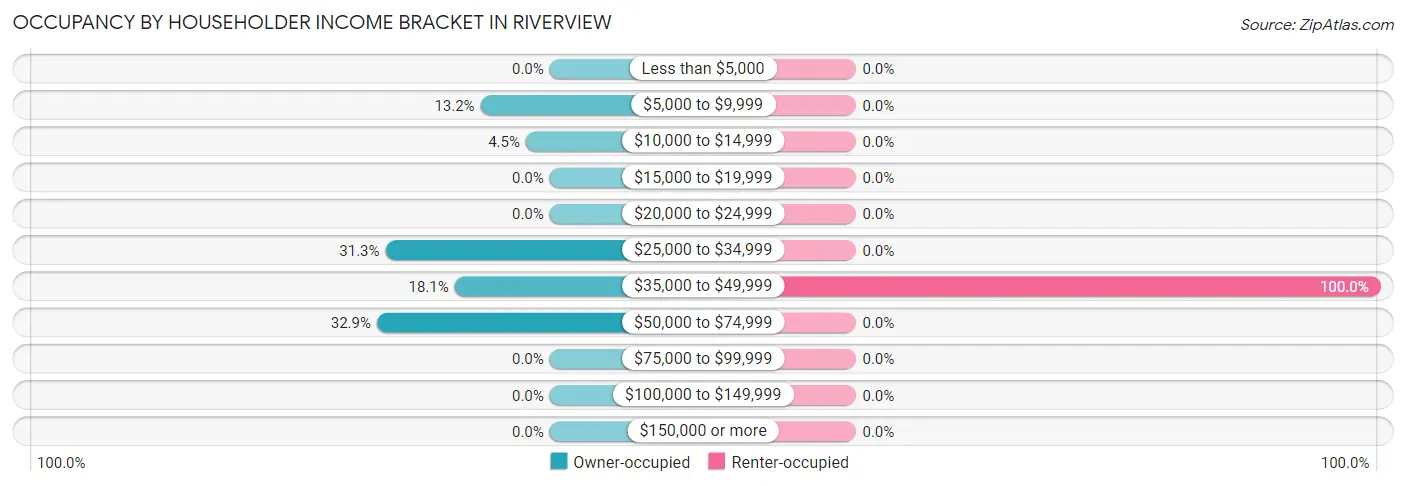
| Income Bracket | Owner-occupied | Renter-occupied |
| Less than $5,000 | 0 (0.0%) | 0 (0.0%) |
| $5,000 to $9,999 | 32 (13.2%) | 0 (0.0%) |
| $10,000 to $14,999 | 11 (4.5%) | 0 (0.0%) |
| $15,000 to $19,999 | 0 (0.0%) | 0 (0.0%) |
| $20,000 to $24,999 | 0 (0.0%) | 0 (0.0%) |
| $25,000 to $34,999 | 76 (31.3%) | 0 (0.0%) |
| $35,000 to $49,999 | 44 (18.1%) | 11 (100.0%) |
| $50,000 to $74,999 | 80 (32.9%) | 0 (0.0%) |
| $75,000 to $99,999 | 0 (0.0%) | 0 (0.0%) |
| $100,000 to $149,999 | 0 (0.0%) | 0 (0.0%) |
| $150,000 or more | 0 (0.0%) | 0 (0.0%) |
| Total | 243 (100.0%) | 11 (100.0%) |
Monthly Housing Cost Tiers in Riverview
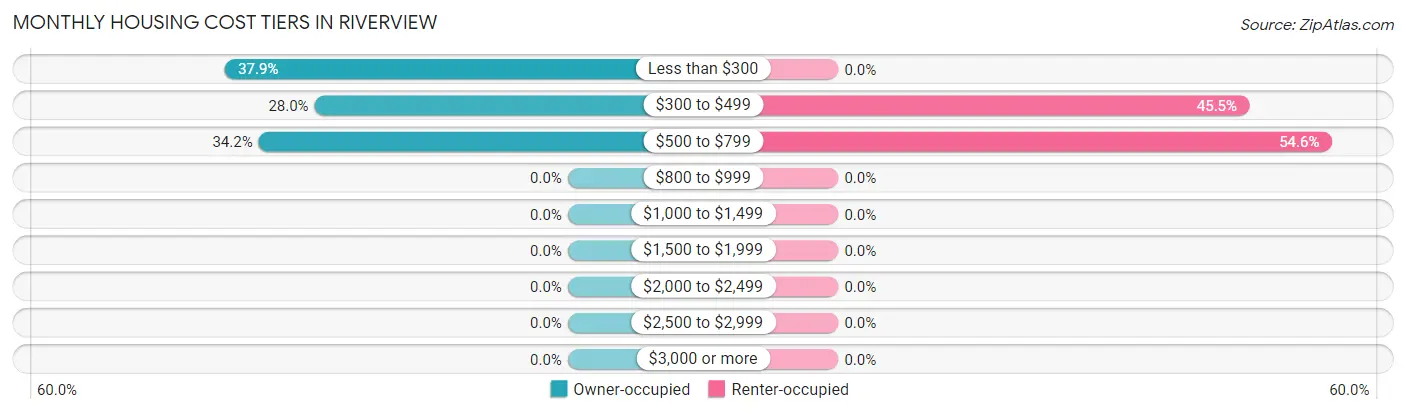
| Monthly Cost | Owner-occupied | Renter-occupied |
| Less than $300 | 92 (37.9%) | 0 (0.0%) |
| $300 to $499 | 68 (28.0%) | 5 (45.5%) |
| $500 to $799 | 83 (34.2%) | 6 (54.5%) |
| $800 to $999 | 0 (0.0%) | 0 (0.0%) |
| $1,000 to $1,499 | 0 (0.0%) | 0 (0.0%) |
| $1,500 to $1,999 | 0 (0.0%) | 0 (0.0%) |
| $2,000 to $2,499 | 0 (0.0%) | 0 (0.0%) |
| $2,500 to $2,999 | 0 (0.0%) | 0 (0.0%) |
| $3,000 or more | 0 (0.0%) | 0 (0.0%) |
| Total | 243 (100.0%) | 11 (100.0%) |
Physical Housing Characteristics in Riverview
Housing Structures in Riverview
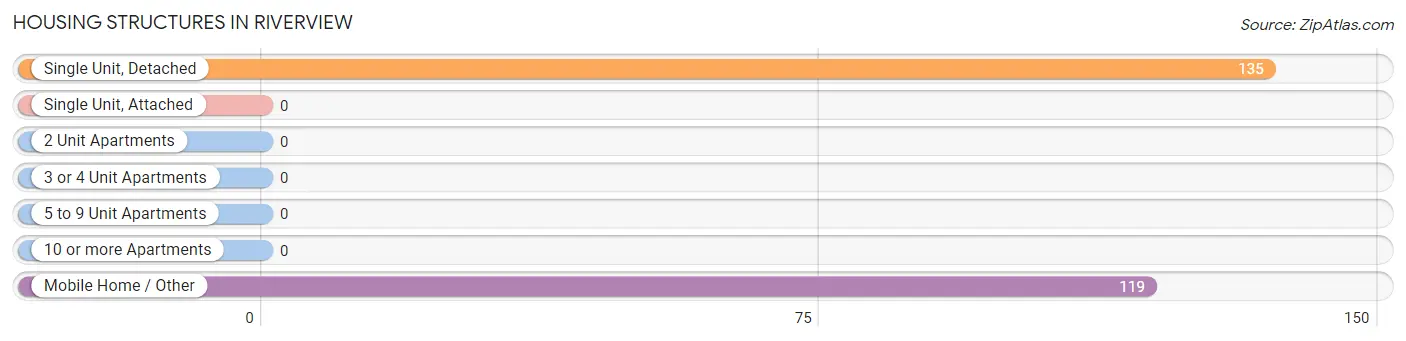
| Structure Type | # Housing Units | % Housing Units |
| Single Unit, Detached | 135 | 53.1% |
| Single Unit, Attached | 0 | 0.0% |
| 2 Unit Apartments | 0 | 0.0% |
| 3 or 4 Unit Apartments | 0 | 0.0% |
| 5 to 9 Unit Apartments | 0 | 0.0% |
| 10 or more Apartments | 0 | 0.0% |
| Mobile Home / Other | 119 | 46.9% |
| Total | 254 | 100.0% |
Housing Structures by Occupancy in Riverview
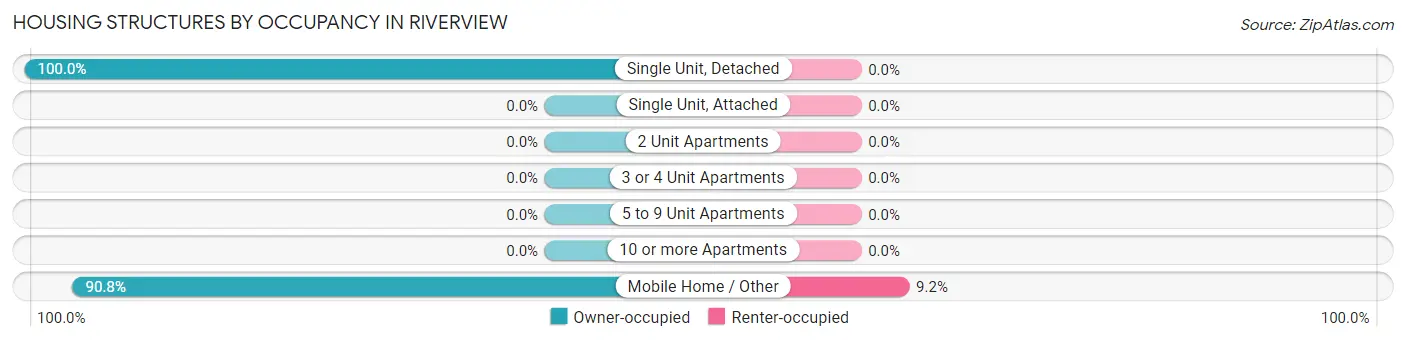
| Structure Type | Owner-occupied | Renter-occupied |
| Single Unit, Detached | 135 (100.0%) | 0 (0.0%) |
| Single Unit, Attached | 0 (0.0%) | 0 (0.0%) |
| 2 Unit Apartments | 0 (0.0%) | 0 (0.0%) |
| 3 or 4 Unit Apartments | 0 (0.0%) | 0 (0.0%) |
| 5 to 9 Unit Apartments | 0 (0.0%) | 0 (0.0%) |
| 10 or more Apartments | 0 (0.0%) | 0 (0.0%) |
| Mobile Home / Other | 108 (90.8%) | 11 (9.2%) |
| Total | 243 (95.7%) | 11 (4.3%) |
Housing Structures by Number of Rooms in Riverview
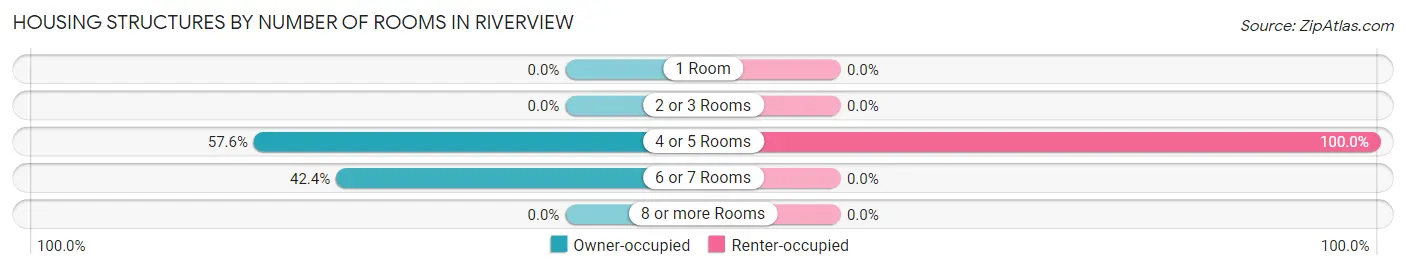
| Number of Rooms | Owner-occupied | Renter-occupied |
| 1 Room | 0 (0.0%) | 0 (0.0%) |
| 2 or 3 Rooms | 0 (0.0%) | 0 (0.0%) |
| 4 or 5 Rooms | 140 (57.6%) | 11 (100.0%) |
| 6 or 7 Rooms | 103 (42.4%) | 0 (0.0%) |
| 8 or more Rooms | 0 (0.0%) | 0 (0.0%) |
| Total | 243 (100.0%) | 11 (100.0%) |
Housing Structure by Heating Type in Riverview
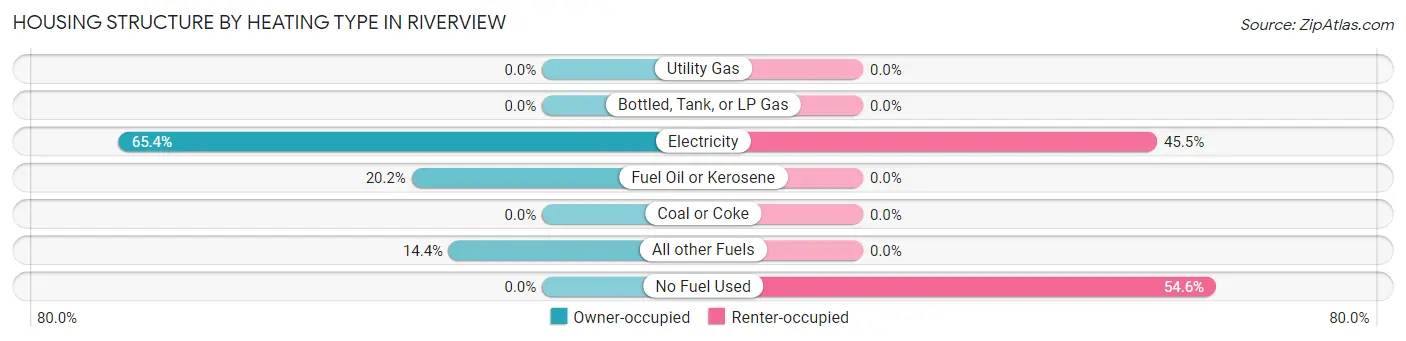
| Heating Type | Owner-occupied | Renter-occupied |
| Utility Gas | 0 (0.0%) | 0 (0.0%) |
| Bottled, Tank, or LP Gas | 0 (0.0%) | 0 (0.0%) |
| Electricity | 159 (65.4%) | 5 (45.5%) |
| Fuel Oil or Kerosene | 49 (20.2%) | 0 (0.0%) |
| Coal or Coke | 0 (0.0%) | 0 (0.0%) |
| All other Fuels | 35 (14.4%) | 0 (0.0%) |
| No Fuel Used | 0 (0.0%) | 6 (54.5%) |
| Total | 243 (100.0%) | 11 (100.0%) |
Household Vehicle Usage in Riverview
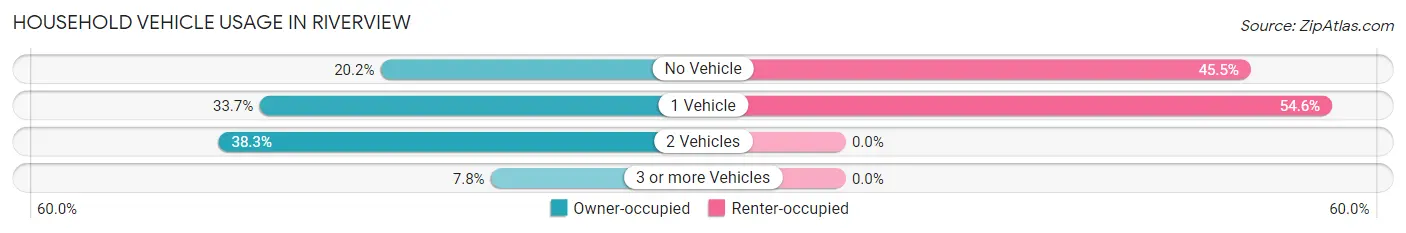
| Vehicles per Household | Owner-occupied | Renter-occupied |
| No Vehicle | 49 (20.2%) | 5 (45.5%) |
| 1 Vehicle | 82 (33.7%) | 6 (54.5%) |
| 2 Vehicles | 93 (38.3%) | 0 (0.0%) |
| 3 or more Vehicles | 19 (7.8%) | 0 (0.0%) |
| Total | 243 (100.0%) | 11 (100.0%) |
Real Estate & Mortgages in Riverview
Real Estate and Mortgage Overview in Riverview
| Characteristic | Without Mortgage | With Mortgage |
| Housing Units | 218 | 25 |
| Median Property Value | $36,500 | $0 |
| Median Household Income | - | - |
| Monthly Housing Costs | $412 | $0 |
| Real Estate Taxes | $690 | $0 |
Property Value by Mortgage Status in Riverview
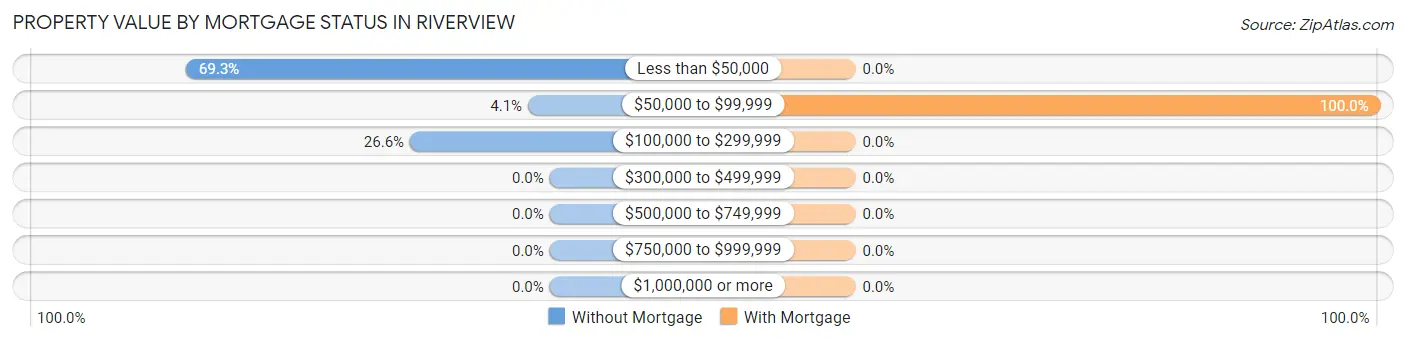
| Property Value | Without Mortgage | With Mortgage |
| Less than $50,000 | 151 (69.3%) | 0 (0.0%) |
| $50,000 to $99,999 | 9 (4.1%) | 25 (100.0%) |
| $100,000 to $299,999 | 58 (26.6%) | 0 (0.0%) |
| $300,000 to $499,999 | 0 (0.0%) | 0 (0.0%) |
| $500,000 to $749,999 | 0 (0.0%) | 0 (0.0%) |
| $750,000 to $999,999 | 0 (0.0%) | 0 (0.0%) |
| $1,000,000 or more | 0 (0.0%) | 0 (0.0%) |
| Total | 218 (100.0%) | 25 (100.0%) |
Household Income by Mortgage Status in Riverview
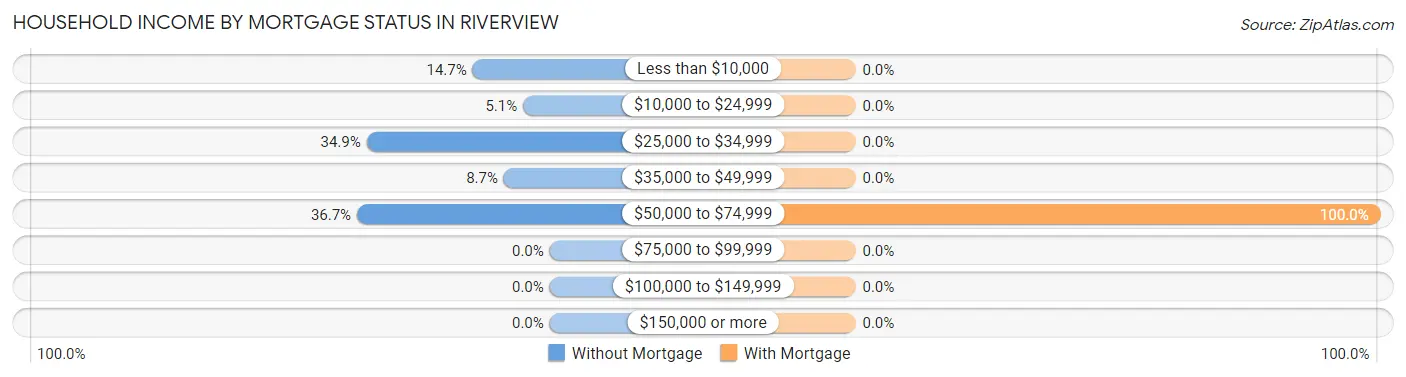
| Household Income | Without Mortgage | With Mortgage |
| Less than $10,000 | 32 (14.7%) | 0 (0.0%) |
| $10,000 to $24,999 | 11 (5.1%) | 0 (0.0%) |
| $25,000 to $34,999 | 76 (34.9%) | 0 (0.0%) |
| $35,000 to $49,999 | 19 (8.7%) | 0 (0.0%) |
| $50,000 to $74,999 | 80 (36.7%) | 25 (100.0%) |
| $75,000 to $99,999 | 0 (0.0%) | 0 (0.0%) |
| $100,000 to $149,999 | 0 (0.0%) | 0 (0.0%) |
| $150,000 or more | 0 (0.0%) | 0 (0.0%) |
| Total | 218 (100.0%) | 25 (100.0%) |
Property Value to Household Income Ratio in Riverview
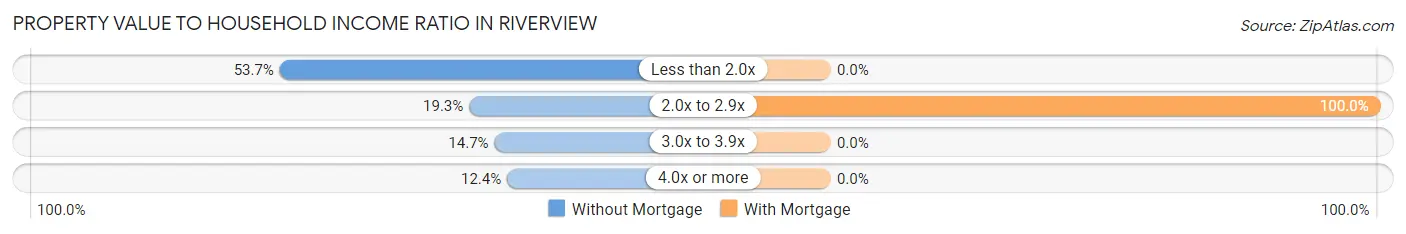
| Value-to-Income Ratio | Without Mortgage | With Mortgage |
| Less than 2.0x | 117 (53.7%) | 0 (0.0%) |
| 2.0x to 2.9x | 42 (19.3%) | 25 (100.0%) |
| 3.0x to 3.9x | 32 (14.7%) | 0 (0.0%) |
| 4.0x or more | 27 (12.4%) | 0 (0.0%) |
| Total | 218 (100.0%) | 25 (100.0%) |
Real Estate Taxes by Mortgage Status in Riverview
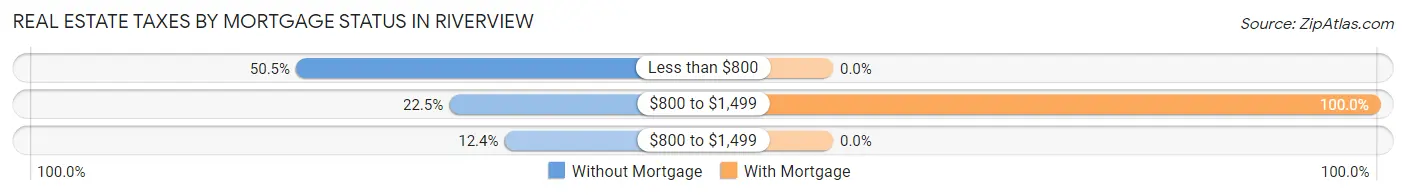
| Property Taxes | Without Mortgage | With Mortgage |
| Less than $800 | 110 (50.5%) | 0 (0.0%) |
| $800 to $1,499 | 49 (22.5%) | 25 (100.0%) |
| $800 to $1,499 | 27 (12.4%) | 0 (0.0%) |
| Total | 218 (100.0%) | 25 (100.0%) |
Health & Disability in Riverview
Health Insurance Coverage by Age in Riverview
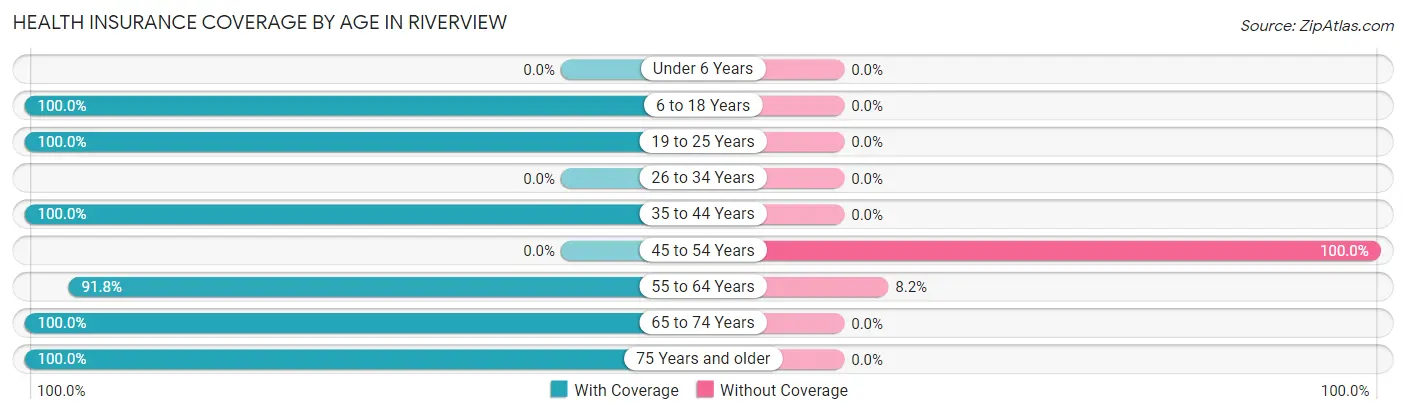
| Age Bracket | With Coverage | Without Coverage |
| Under 6 Years | 0 (0.0%) | 0 (0.0%) |
| 6 to 18 Years | 60 (100.0%) | 0 (0.0%) |
| 19 to 25 Years | 13 (100.0%) | 0 (0.0%) |
| 26 to 34 Years | 0 (0.0%) | 0 (0.0%) |
| 35 to 44 Years | 74 (100.0%) | 0 (0.0%) |
| 45 to 54 Years | 0 (0.0%) | 43 (100.0%) |
| 55 to 64 Years | 67 (91.8%) | 6 (8.2%) |
| 65 to 74 Years | 144 (100.0%) | 0 (0.0%) |
| 75 Years and older | 72 (100.0%) | 0 (0.0%) |
| Total | 430 (89.8%) | 49 (10.2%) |
Health Insurance Coverage by Citizenship Status in Riverview
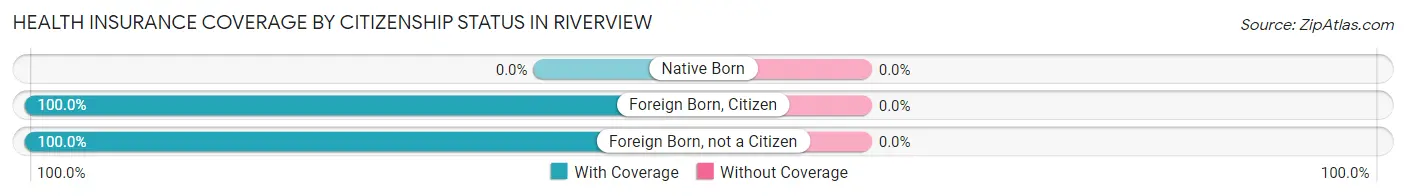
| Citizenship Status | With Coverage | Without Coverage |
| Native Born | 0 (0.0%) | 0 (0.0%) |
| Foreign Born, Citizen | 60 (100.0%) | 0 (0.0%) |
| Foreign Born, not a Citizen | 13 (100.0%) | 0 (0.0%) |
Health Insurance Coverage by Household Income in Riverview
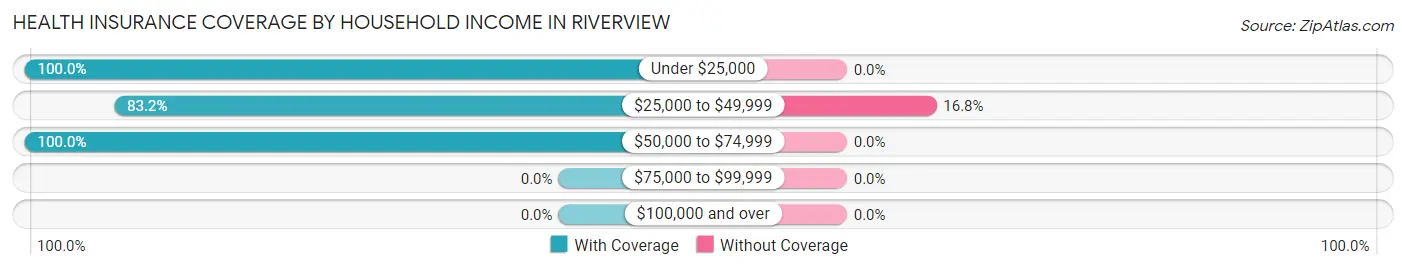
| Household Income | With Coverage | Without Coverage |
| Under $25,000 | 43 (100.0%) | 0 (0.0%) |
| $25,000 to $49,999 | 243 (83.2%) | 49 (16.8%) |
| $50,000 to $74,999 | 144 (100.0%) | 0 (0.0%) |
| $75,000 to $99,999 | 0 (0.0%) | 0 (0.0%) |
| $100,000 and over | 0 (0.0%) | 0 (0.0%) |
Public vs Private Health Insurance Coverage by Age in Riverview
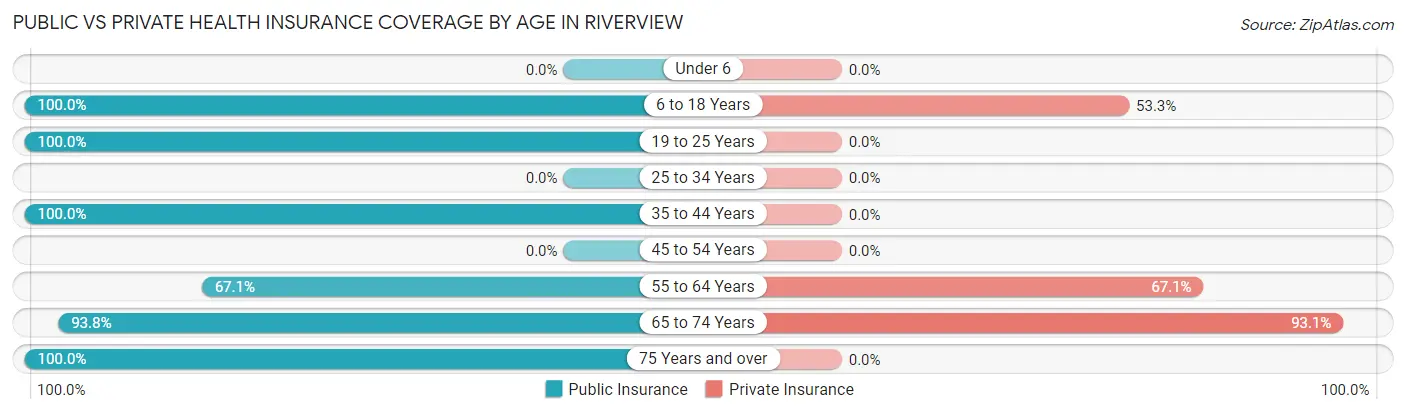
| Age Bracket | Public Insurance | Private Insurance |
| Under 6 | 0 (0.0%) | 0 (0.0%) |
| 6 to 18 Years | 60 (100.0%) | 32 (53.3%) |
| 19 to 25 Years | 13 (100.0%) | 0 (0.0%) |
| 25 to 34 Years | 0 (0.0%) | 0 (0.0%) |
| 35 to 44 Years | 74 (100.0%) | 0 (0.0%) |
| 45 to 54 Years | 0 (0.0%) | 0 (0.0%) |
| 55 to 64 Years | 49 (67.1%) | 49 (67.1%) |
| 65 to 74 Years | 135 (93.8%) | 134 (93.1%) |
| 75 Years and over | 72 (100.0%) | 0 (0.0%) |
| Total | 403 (84.1%) | 215 (44.9%) |
Disability Status by Sex by Age in Riverview
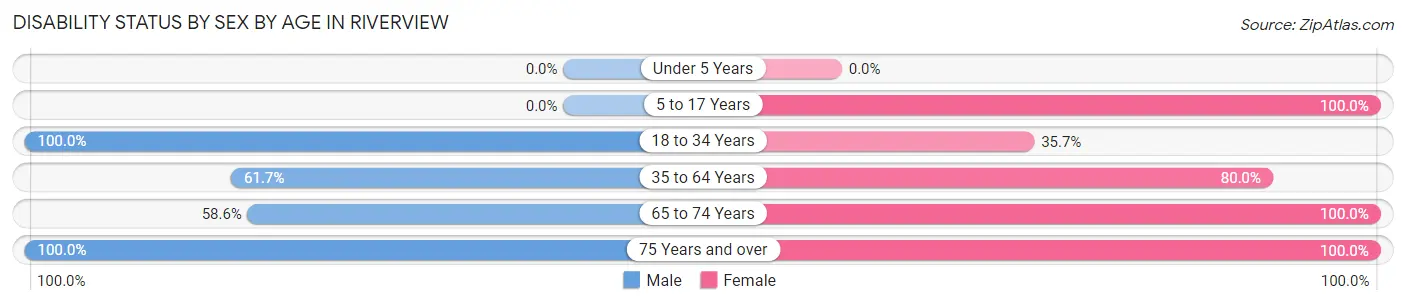
| Age Bracket | Male | Female |
| Under 5 Years | 0 (0.0%) | 0 (0.0%) |
| 5 to 17 Years | 0 (0.0%) | 32 (100.0%) |
| 18 to 34 Years | 8 (100.0%) | 5 (35.7%) |
| 35 to 64 Years | 74 (61.7%) | 56 (80.0%) |
| 65 to 74 Years | 58 (58.6%) | 45 (100.0%) |
| 75 Years and over | 13 (100.0%) | 59 (100.0%) |
Disability Class by Sex by Age in Riverview
Disability Class: Hearing Difficulty
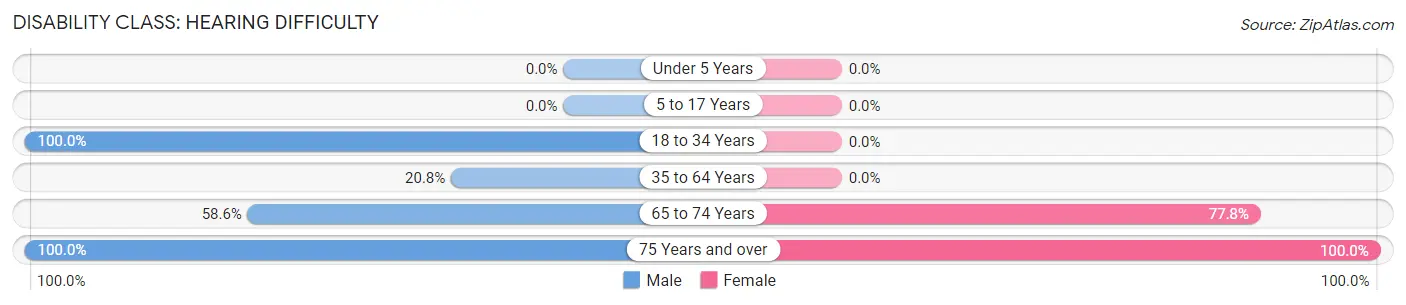
| Age Bracket | Male | Female |
| Under 5 Years | 0 (0.0%) | 0 (0.0%) |
| 5 to 17 Years | 0 (0.0%) | 0 (0.0%) |
| 18 to 34 Years | 8 (100.0%) | 0 (0.0%) |
| 35 to 64 Years | 25 (20.8%) | 0 (0.0%) |
| 65 to 74 Years | 58 (58.6%) | 35 (77.8%) |
| 75 Years and over | 13 (100.0%) | 59 (100.0%) |
Disability Class: Vision Difficulty
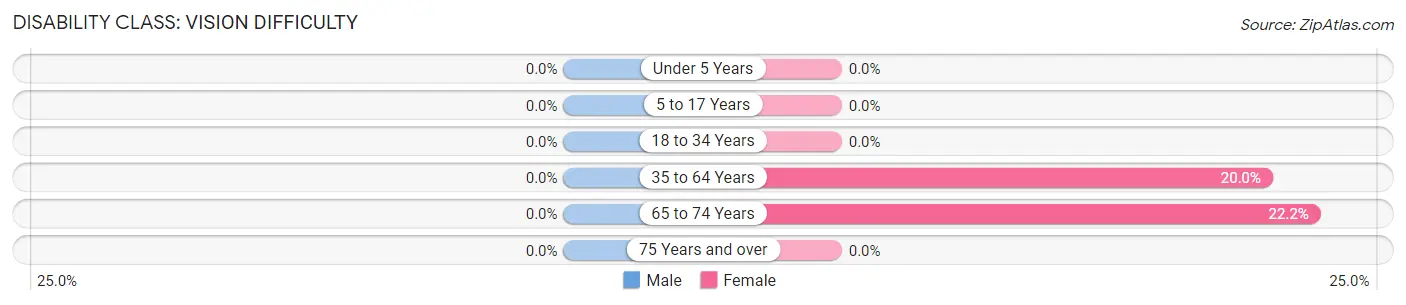
| Age Bracket | Male | Female |
| Under 5 Years | 0 (0.0%) | 0 (0.0%) |
| 5 to 17 Years | 0 (0.0%) | 0 (0.0%) |
| 18 to 34 Years | 0 (0.0%) | 0 (0.0%) |
| 35 to 64 Years | 0 (0.0%) | 14 (20.0%) |
| 65 to 74 Years | 0 (0.0%) | 10 (22.2%) |
| 75 Years and over | 0 (0.0%) | 0 (0.0%) |
Disability Class: Cognitive Difficulty
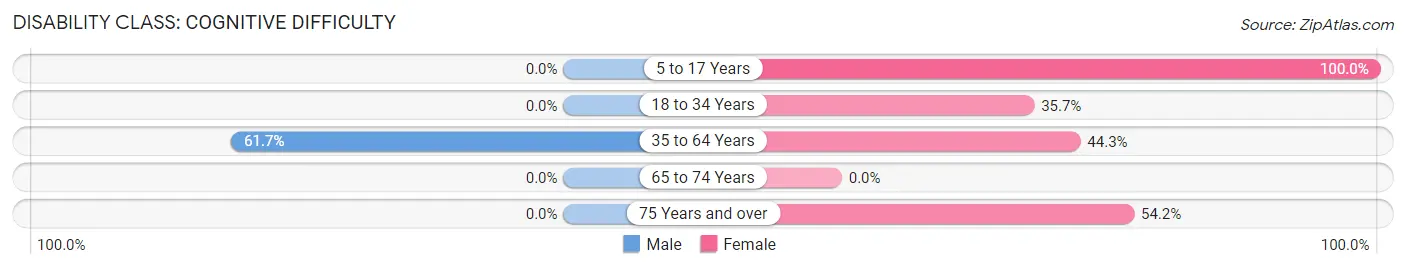
| Age Bracket | Male | Female |
| 5 to 17 Years | 0 (0.0%) | 32 (100.0%) |
| 18 to 34 Years | 0 (0.0%) | 5 (35.7%) |
| 35 to 64 Years | 74 (61.7%) | 31 (44.3%) |
| 65 to 74 Years | 0 (0.0%) | 0 (0.0%) |
| 75 Years and over | 0 (0.0%) | 32 (54.2%) |
Disability Class: Ambulatory Difficulty
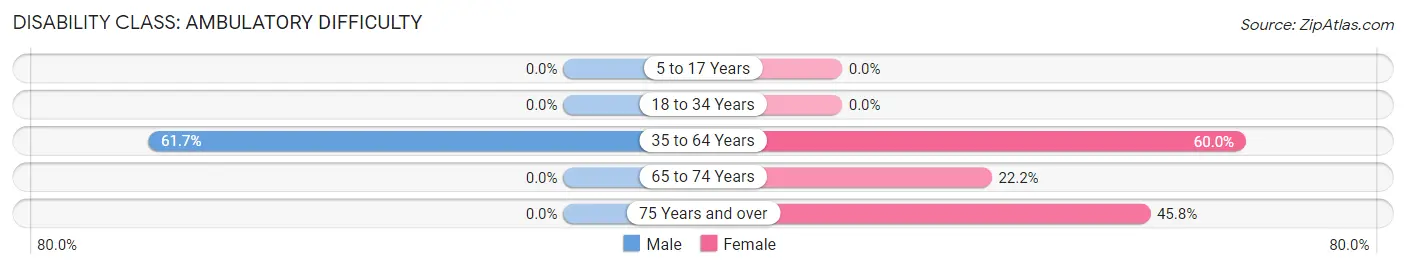
| Age Bracket | Male | Female |
| 5 to 17 Years | 0 (0.0%) | 0 (0.0%) |
| 18 to 34 Years | 0 (0.0%) | 0 (0.0%) |
| 35 to 64 Years | 74 (61.7%) | 42 (60.0%) |
| 65 to 74 Years | 0 (0.0%) | 10 (22.2%) |
| 75 Years and over | 0 (0.0%) | 27 (45.8%) |
Disability Class: Self-Care Difficulty
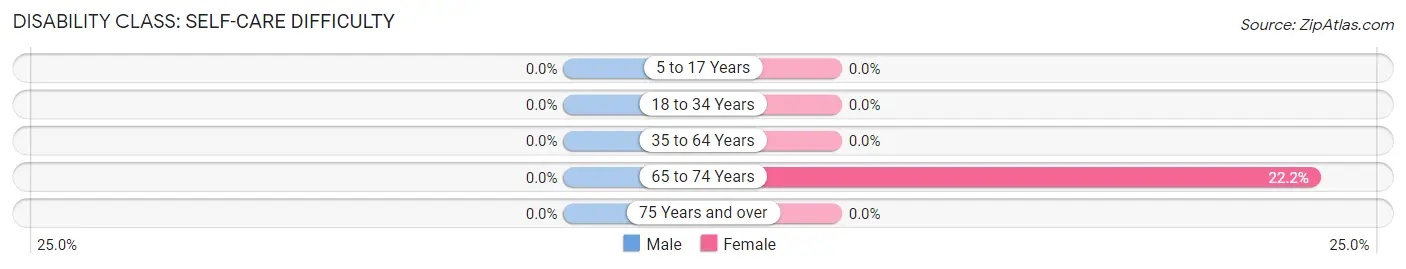
| Age Bracket | Male | Female |
| 5 to 17 Years | 0 (0.0%) | 0 (0.0%) |
| 18 to 34 Years | 0 (0.0%) | 0 (0.0%) |
| 35 to 64 Years | 0 (0.0%) | 0 (0.0%) |
| 65 to 74 Years | 0 (0.0%) | 10 (22.2%) |
| 75 Years and over | 0 (0.0%) | 0 (0.0%) |
Technology Access in Riverview
Computing Device Access in Riverview
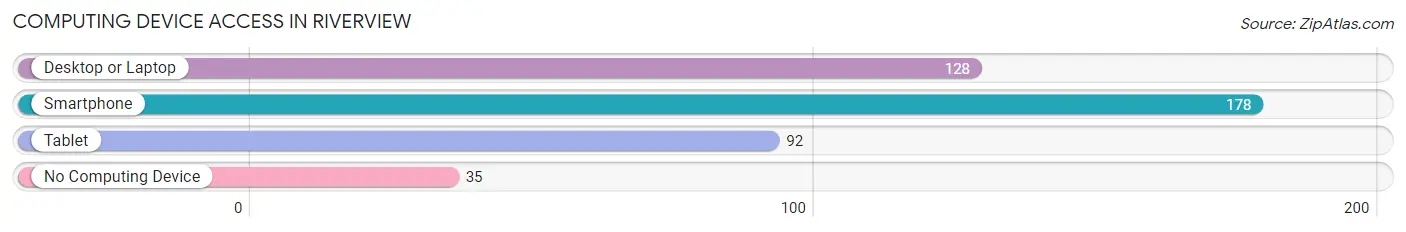
| Device Type | # Households | % Households |
| Desktop or Laptop | 128 | 50.4% |
| Smartphone | 178 | 70.1% |
| Tablet | 92 | 36.2% |
| No Computing Device | 35 | 13.8% |
| Total | 254 | 100.0% |
Internet Access in Riverview
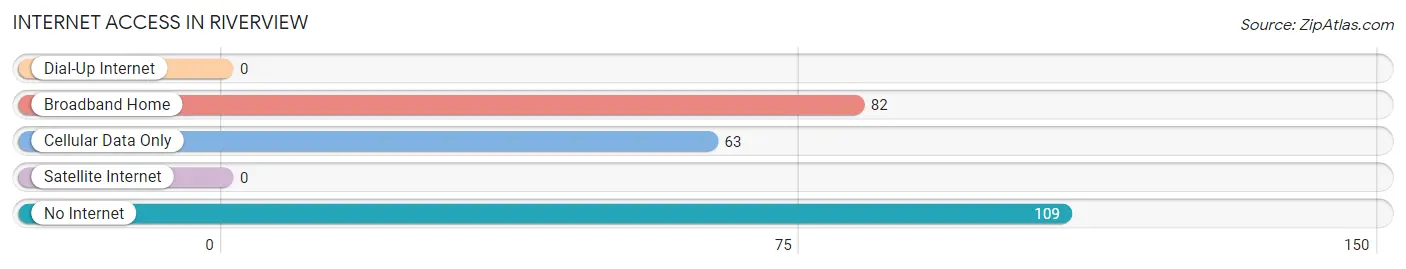
| Internet Type | # Households | % Households |
| Dial-Up Internet | 0 | 0.0% |
| Broadband Home | 82 | 32.3% |
| Cellular Data Only | 63 | 24.8% |
| Satellite Internet | 0 | 0.0% |
| No Internet | 109 | 42.9% |
| Total | 254 | 100.0% |
Riverview Summary
Riverview is a small town located in the state of Virginia, in the United States. It is situated in the Shenandoah Valley, in the northern part of the state. The town is located in the county of Rockingham, and is part of the Harrisonburg Metropolitan Statistical Area. The population of Riverview was estimated to be 1,845 in 2019.
History
The area that is now Riverview was first settled in the late 1700s by German immigrants. The town was originally known as “Riverside”, and was officially incorporated in 1891. The town was named after the nearby Shenandoah River, which runs through the area.
In the early 1900s, Riverview was a thriving agricultural community. The town was home to several farms, as well as a number of small businesses. The town also had a railroad station, which was used to transport goods and passengers.
In the 1950s, the town began to experience a decline in population. This was due to the decline of the agricultural industry, as well as the increasing popularity of suburban living. By the 1970s, the town had become a bedroom community for the nearby cities of Harrisonburg and Staunton.
Geography
Riverview is located in the northern part of the state of Virginia, in the Shenandoah Valley. The town is situated in the county of Rockingham, and is part of the Harrisonburg Metropolitan Statistical Area. The town is located at the intersection of US Route 11 and US Route 33.
The town is situated on the banks of the Shenandoah River, and is surrounded by rolling hills and mountains. The town is located approximately 30 miles south of the city of Harrisonburg, and approximately 50 miles north of the city of Staunton.
Economy
The economy of Riverview is largely based on agriculture and tourism. The town is home to several farms, which produce a variety of crops, including corn, soybeans, and hay. The town is also home to several wineries, which produce a variety of wines.
The town is also home to several small businesses, including restaurants, retail stores, and service providers. The town is also home to a number of bed and breakfasts, which attract tourists from all over the world.
Demographics
The population of Riverview was estimated to be 1,845 in 2019. The town has a population that is predominantly white (94.2%), with a small percentage of African Americans (2.2%), Hispanics (1.7%), and Asians (1.1%). The median household income in the town is $50,945, and the median home value is $179,400.
The town has a high rate of homeownership (77.2%), and a low rate of poverty (7.2%). The town also has a high rate of educational attainment, with 91.2% of the population having at least a high school diploma.
Conclusion
Riverview is a small town located in the state of Virginia, in the United States. The town is situated in the Shenandoah Valley, in the northern part of the state. The town is home to several farms, as well as a number of small businesses. The town is also home to several wineries, which produce a variety of wines. The population of Riverview was estimated to be 1,845 in 2019. The town has a population that is predominantly white, with a small percentage of African Americans, Hispanics, and Asians. The town has a high rate of homeownership, and a low rate of poverty. The town also has a high rate of educational attainment, with 91.2% of the population having at least a high school diploma.
Common Questions
What is Per Capita Income in Riverview?
Per Capita income in Riverview is $21,936.
What is the Median Household income in Riverview?
Median Household Income in Riverview is $41,818.
What is Inequality or Gini Index in Riverview?
Inequality or Gini Index in Riverview is 0.27.
What is the Total Population of Riverview?
Total Population of Riverview is 479.
What is the Total Male Population of Riverview?
Total Male Population of Riverview is 259.
What is the Total Female Population of Riverview?
Total Female Population of Riverview is 220.
What is the Ratio of Males per 100 Females in Riverview?
There are 117.73 Males per 100 Females in Riverview.
What is the Ratio of Females per 100 Males in Riverview?
There are 84.94 Females per 100 Males in Riverview.
What is the Median Population Age in Riverview?
Median Population Age in Riverview is 59.8 Years.
What is the Average Family Size in Riverview
Average Family Size in Riverview is 2.3 People.
What is the Average Household Size in Riverview
Average Household Size in Riverview is 1.9 People.
How Large is the Labor Force in Riverview?
There are 86 People in the Labor Forcein in Riverview.
What is the Percentage of People in the Labor Force in Riverview?
19.7% of People are in the Labor Force in Riverview.
What is the Unemployment Rate in Riverview?
Unemployment Rate in Riverview is 16.3%.