Zip Codes with the Highest Percentage of Population Employed in Security & Protection in Winchester, VA
RELATED REPORTS & OPTIONS
Security & Protection
Winchester
Compare Zip Codes
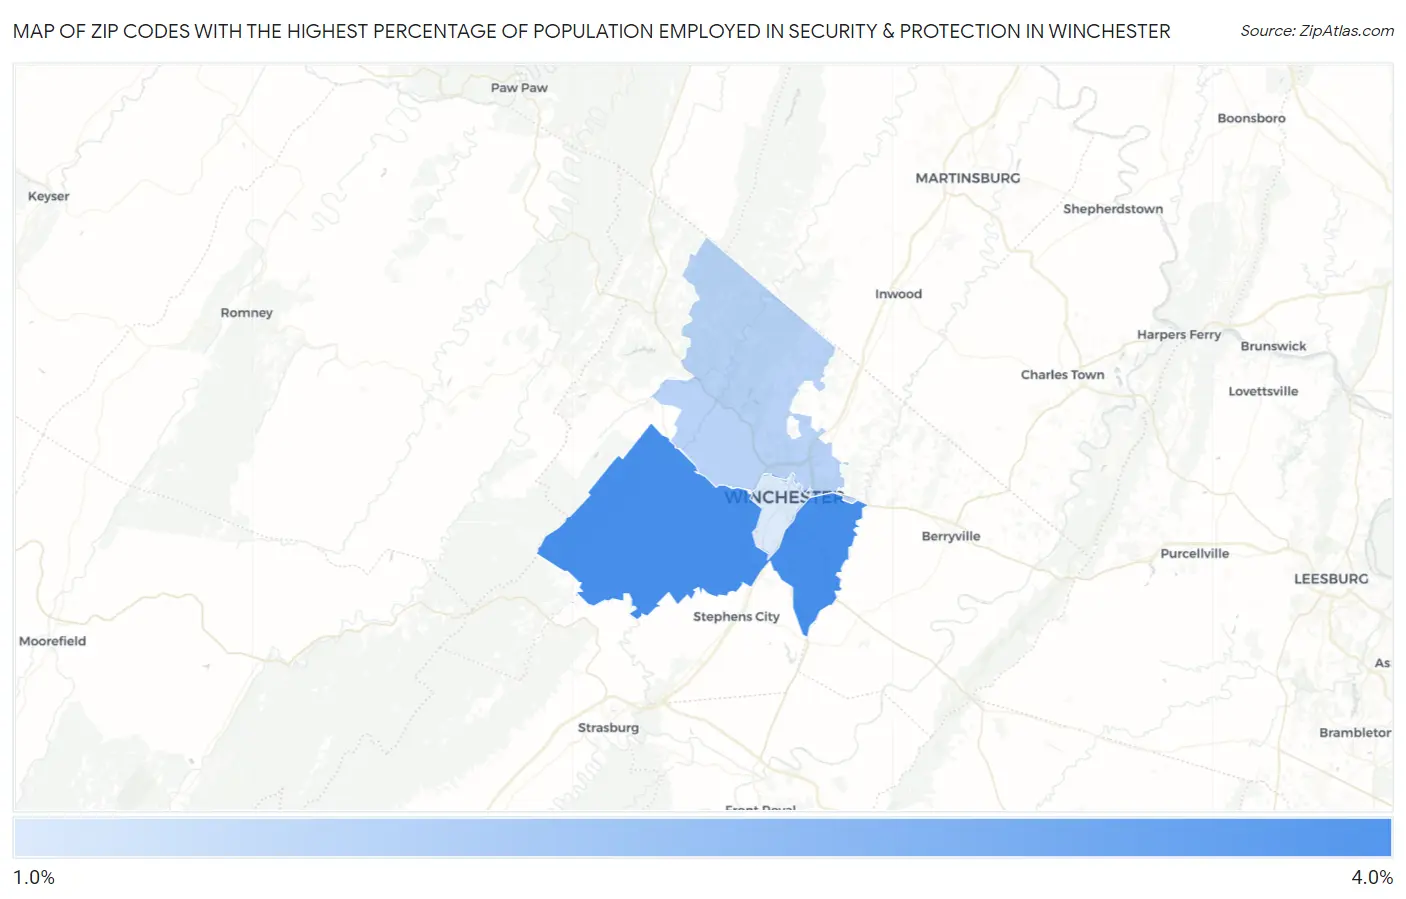
Map of Zip Codes with the Highest Percentage of Population Employed in Security & Protection in Winchester
1.2%
3.3%
Zip Codes with the Highest Percentage of Population Employed in Security & Protection in Winchester, VA
| Zip Code | % Employed | vs State | vs National | |
| 1. | 22602 | 3.3% | 2.7%(+0.604)#257 | 2.1%(+1.14)#6,287 |
| 2. | 22603 | 1.7% | 2.7%(-0.950)#489 | 2.1%(-0.416)#14,438 |
| 3. | 22601 | 1.2% | 2.7%(-1.47)#565 | 2.1%(-0.938)#18,427 |
1
Common Questions
What are the Top Zip Codes with the Highest Percentage of Population Employed in Security & Protection in Winchester, VA?
Top Zip Codes with the Highest Percentage of Population Employed in Security & Protection in Winchester, VA are:
What zip code has the Highest Percentage of Population Employed in Security & Protection in Winchester, VA?
22602 has the Highest Percentage of Population Employed in Security & Protection in Winchester, VA with 3.3%.
What is the Percentage of Population Employed in Security & Protection in Winchester, VA?
Percentage of Population Employed in Security & Protection in Winchester is 1.3%.
What is the Percentage of Population Employed in Security & Protection in Virginia?
Percentage of Population Employed in Security & Protection in Virginia is 2.7%.
What is the Percentage of Population Employed in Security & Protection in the United States?
Percentage of Population Employed in Security & Protection in the United States is 2.1%.