Max Meadows, VA Map & Demographics
Max Meadows Map
Max Meadows Overview
$32,791
PER CAPITA INCOME
$92,768
AVG FAMILY INCOME
$73,683
AVG HOUSEHOLD INCOME
0.25
INEQUALITY / GINI INDEX
580
TOTAL POPULATION
302
MALE POPULATION
278
FEMALE POPULATION
108.63
MALES / 100 FEMALES
92.05
FEMALES / 100 MALES
47.2
MEDIAN AGE
3.4
AVG FAMILY SIZE
2.8
AVG HOUSEHOLD SIZE
444
LABOR FORCE [ PEOPLE ]
83.8%
PERCENT IN LABOR FORCE
Max Meadows Zip Codes
Max Meadows Area Codes
Income in Max Meadows
Income Overview in Max Meadows
Per Capita Income in Max Meadows is $32,791, while median incomes of families and households are $92,768 and $73,683 respectively.
| Characteristic | Number | Measure |
| Per Capita Income | 580 | $32,791 |
| Median Family Income | 123 | $92,768 |
| Mean Family Income | 123 | $85,996 |
| Median Household Income | 205 | $73,683 |
| Mean Household Income | 205 | $80,947 |
| Income Deficit | 123 | $0 |
| Wage / Income Gap (%) | 580 | 0.00% |
| Wage / Income Gap ($) | 580 | 100.00¢ per $1 |
| Gini / Inequality Index | 580 | 0.25 |
Earnings by Sex in Max Meadows
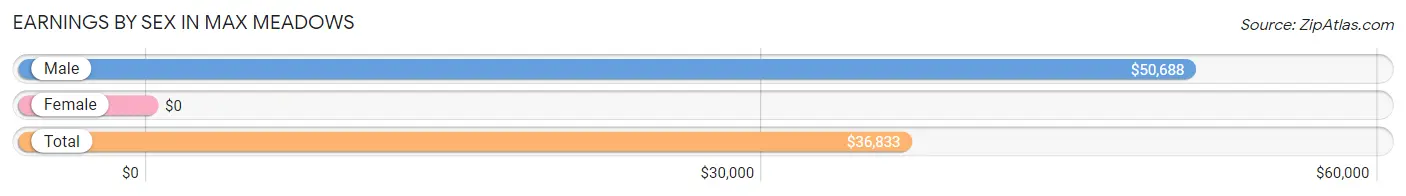
| Sex | Number | Average Earnings |
| Male | 216 (48.6%) | $50,688 |
| Female | 228 (51.3%) | $0 |
| Total | 444 (100.0%) | $36,833 |
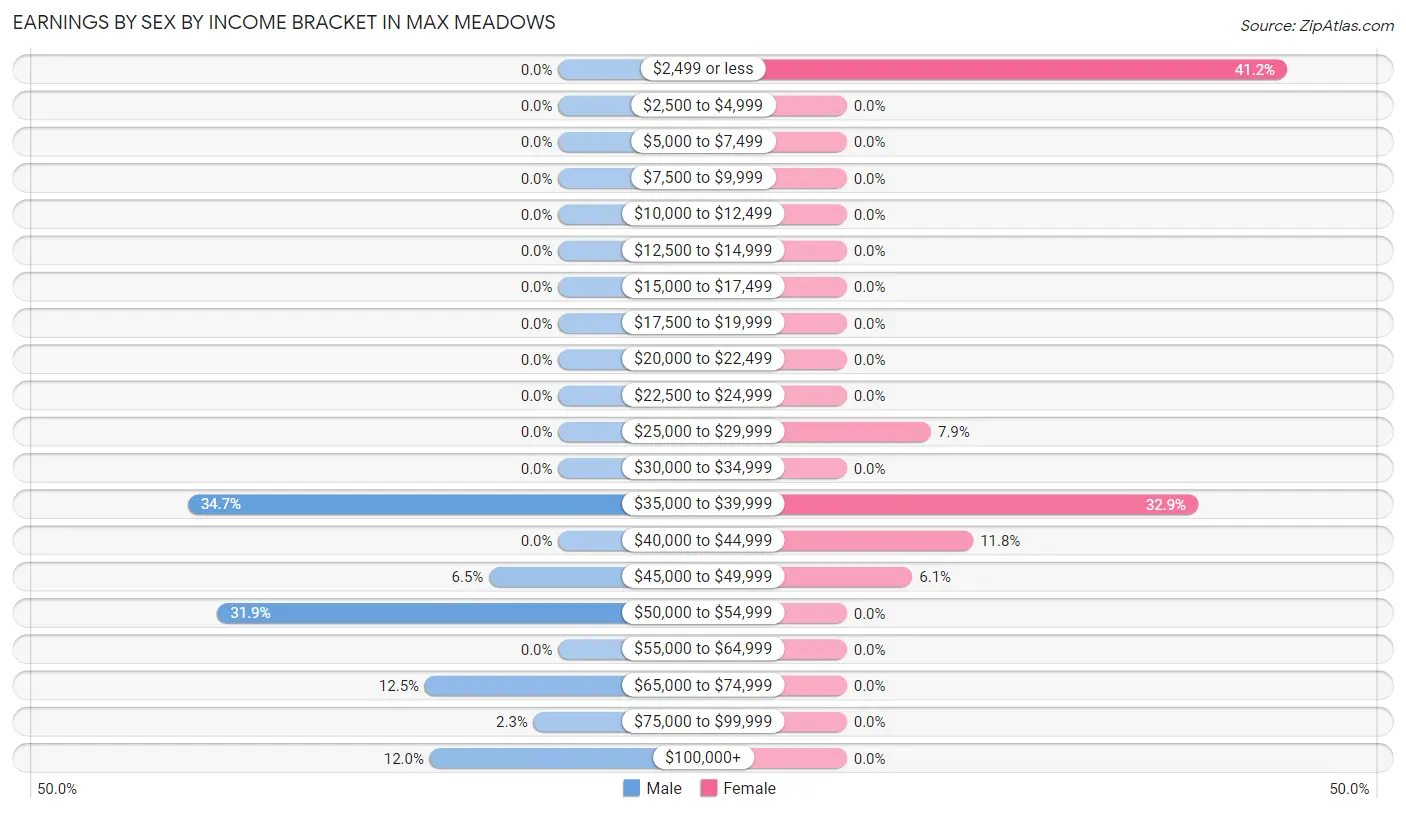
Earnings by Sex by Income Bracket in Max Meadows
The most common earnings brackets in Max Meadows are $35,000 to $39,999 for men (75 | 34.7%) and $2,499 or less for women (94 | 41.2%).
| Income | Male | Female |
| $2,499 or less | 0 (0.0%) | 94 (41.2%) |
| $2,500 to $4,999 | 0 (0.0%) | 0 (0.0%) |
| $5,000 to $7,499 | 0 (0.0%) | 0 (0.0%) |
| $7,500 to $9,999 | 0 (0.0%) | 0 (0.0%) |
| $10,000 to $12,499 | 0 (0.0%) | 0 (0.0%) |
| $12,500 to $14,999 | 0 (0.0%) | 0 (0.0%) |
| $15,000 to $17,499 | 0 (0.0%) | 0 (0.0%) |
| $17,500 to $19,999 | 0 (0.0%) | 0 (0.0%) |
| $20,000 to $22,499 | 0 (0.0%) | 0 (0.0%) |
| $22,500 to $24,999 | 0 (0.0%) | 0 (0.0%) |
| $25,000 to $29,999 | 0 (0.0%) | 18 (7.9%) |
| $30,000 to $34,999 | 0 (0.0%) | 0 (0.0%) |
| $35,000 to $39,999 | 75 (34.7%) | 75 (32.9%) |
| $40,000 to $44,999 | 0 (0.0%) | 27 (11.8%) |
| $45,000 to $49,999 | 14 (6.5%) | 14 (6.1%) |
| $50,000 to $54,999 | 69 (31.9%) | 0 (0.0%) |
| $55,000 to $64,999 | 0 (0.0%) | 0 (0.0%) |
| $65,000 to $74,999 | 27 (12.5%) | 0 (0.0%) |
| $75,000 to $99,999 | 5 (2.3%) | 0 (0.0%) |
| $100,000+ | 26 (12.0%) | 0 (0.0%) |
| Total | 216 (100.0%) | 228 (100.0%) |
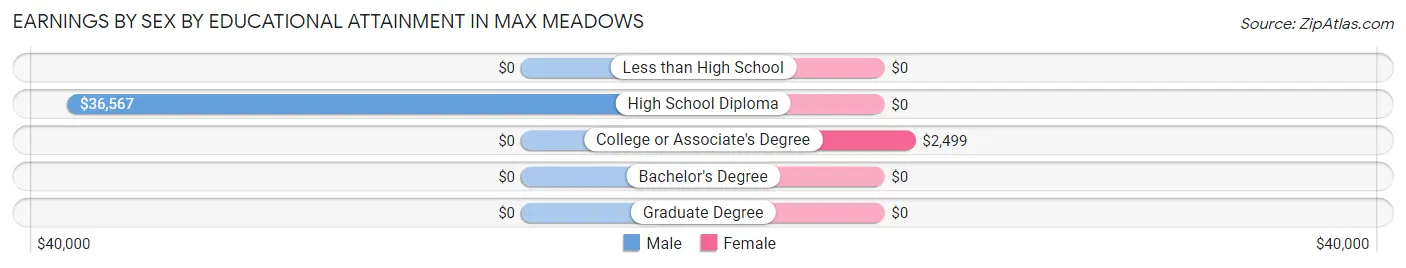
Earnings by Sex by Educational Attainment in Max Meadows
Average earnings in Max Meadows are $50,688 for men and $36,017 for women, a difference of 28.9%. Men with an educational attainment of high school diploma enjoy the highest average annual earnings of $36,567, while those with high school diploma education earn the least with $36,567. Women with an educational attainment of college or associate's degree earn the most with the average annual earnings of $2,499, while those with college or associate's degree education have the smallest earnings of $2,499.
| Educational Attainment | Male Income | Female Income |
| Less than High School | - | - |
| High School Diploma | $36,567 | $0 |
| College or Associate's Degree | - | - |
| Bachelor's Degree | - | - |
| Graduate Degree | - | - |
| Total | $50,688 | $36,017 |
Family Income in Max Meadows
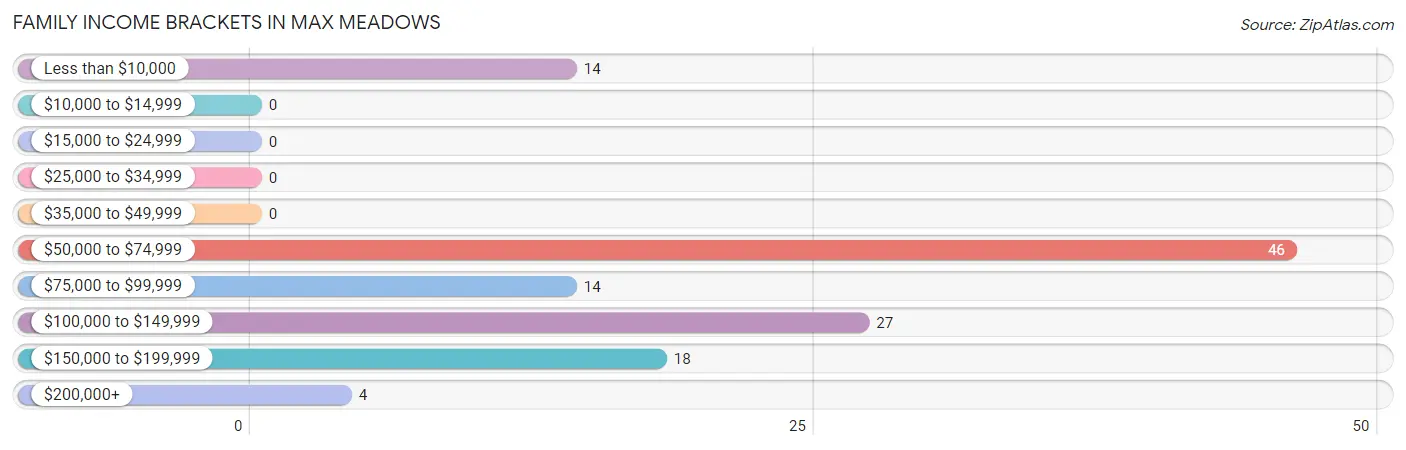
Family Income Brackets in Max Meadows
According to the Max Meadows family income data, there are 46 families falling into the $50,000 to $74,999 income range, which is the most common income bracket and makes up 37.4% of all families.
| Income Bracket | # Families | % Families |
| Less than $10,000 | 14 | 11.4% |
| $10,000 to $14,999 | 0 | 0.0% |
| $15,000 to $24,999 | 0 | 0.0% |
| $25,000 to $34,999 | 0 | 0.0% |
| $35,000 to $49,999 | 0 | 0.0% |
| $50,000 to $74,999 | 46 | 37.4% |
| $75,000 to $99,999 | 14 | 11.4% |
| $100,000 to $149,999 | 27 | 22.0% |
| $150,000 to $199,999 | 18 | 14.6% |
| $200,000+ | 4 | 3.3% |
Family Income by Famaliy Size in Max Meadows
| Income Bracket | # Families | Median Income |
| 2-Person Families | 32 (26.0%) | $0 |
| 3-Person Families | 45 (36.6%) | $0 |
| 4-Person Families | 46 (37.4%) | $0 |
| 5-Person Families | 0 (0.0%) | $0 |
| 6-Person Families | 0 (0.0%) | $0 |
| 7+ Person Families | 0 (0.0%) | $0 |
| Total | 123 (100.0%) | $92,768 |
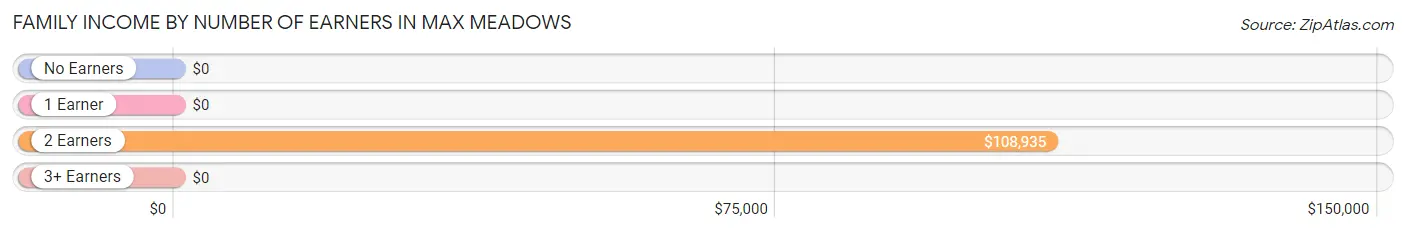
Family Income by Number of Earners in Max Meadows
| Number of Earners | # Families | Median Income |
| No Earners | 14 (11.4%) | $0 |
| 1 Earner | 4 (3.3%) | $0 |
| 2 Earners | 59 (48.0%) | $108,935 |
| 3+ Earners | 46 (37.4%) | $0 |
| Total | 123 (100.0%) | $92,768 |
Household Income in Max Meadows
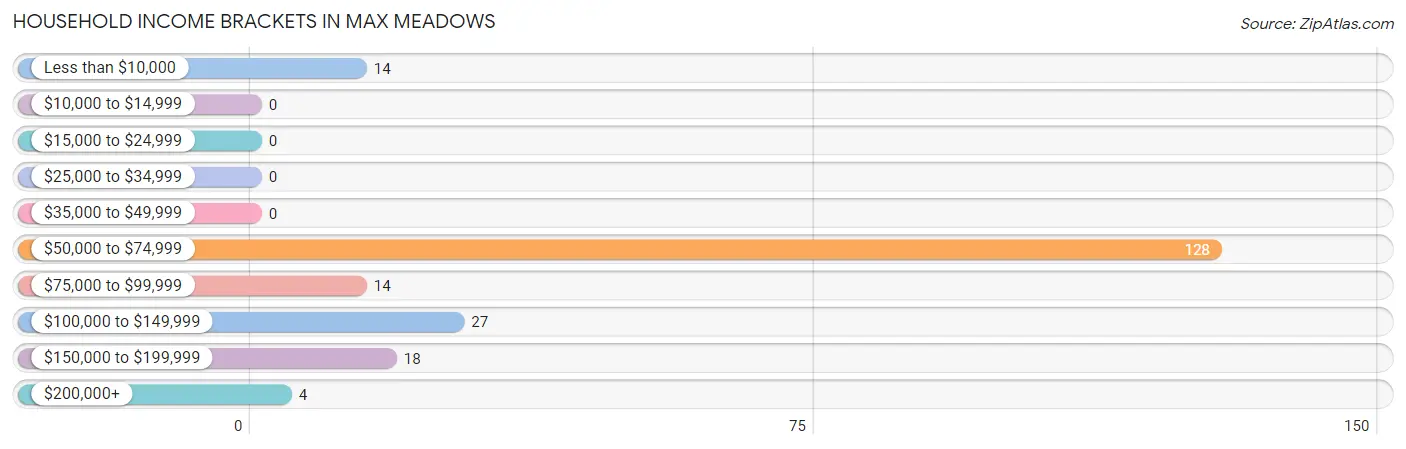
Household Income Brackets in Max Meadows
With 128 households falling in the category, the $50,000 to $74,999 income range is the most frequent in Max Meadows, accounting for 62.4% of all households.
| Income Bracket | # Households | % Households |
| Less than $10,000 | 14 | 6.8% |
| $10,000 to $14,999 | 0 | 0.0% |
| $15,000 to $24,999 | 0 | 0.0% |
| $25,000 to $34,999 | 0 | 0.0% |
| $35,000 to $49,999 | 0 | 0.0% |
| $50,000 to $74,999 | 128 | 62.4% |
| $75,000 to $99,999 | 14 | 6.8% |
| $100,000 to $149,999 | 27 | 13.2% |
| $150,000 to $199,999 | 18 | 8.8% |
| $200,000+ | 4 | 2.0% |
Household Income by Householder Age in Max Meadows
The median household income in Max Meadows is $73,683, with the highest median household income of $73,283 found in the 45 to 64 years age bracket for the primary householder. A total of 139 households (67.8%) fall into this category.
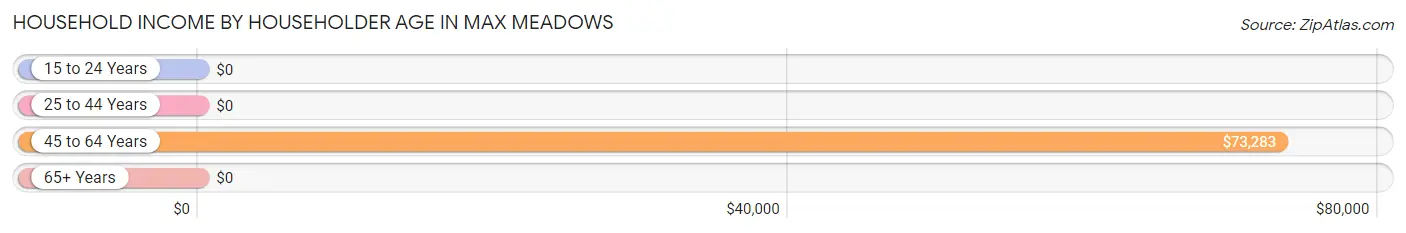
| Income Bracket | # Households | Median Income |
| 15 to 24 Years | 0 (0.0%) | $0 |
| 25 to 44 Years | 45 (22.0%) | $0 |
| 45 to 64 Years | 139 (67.8%) | $73,283 |
| 65+ Years | 21 (10.2%) | $0 |
| Total | 205 (100.0%) | $73,683 |
Poverty in Max Meadows
Income Below Poverty by Sex and Age in Max Meadows
With 4.6% poverty level for males and 5.4% for females among the residents of Max Meadows, 65 to 74 year old males and 55 to 64 year old females are the most vulnerable to poverty, with 14 males (100.0%) and 15 females (78.9%) in their respective age groups living below the poverty level.
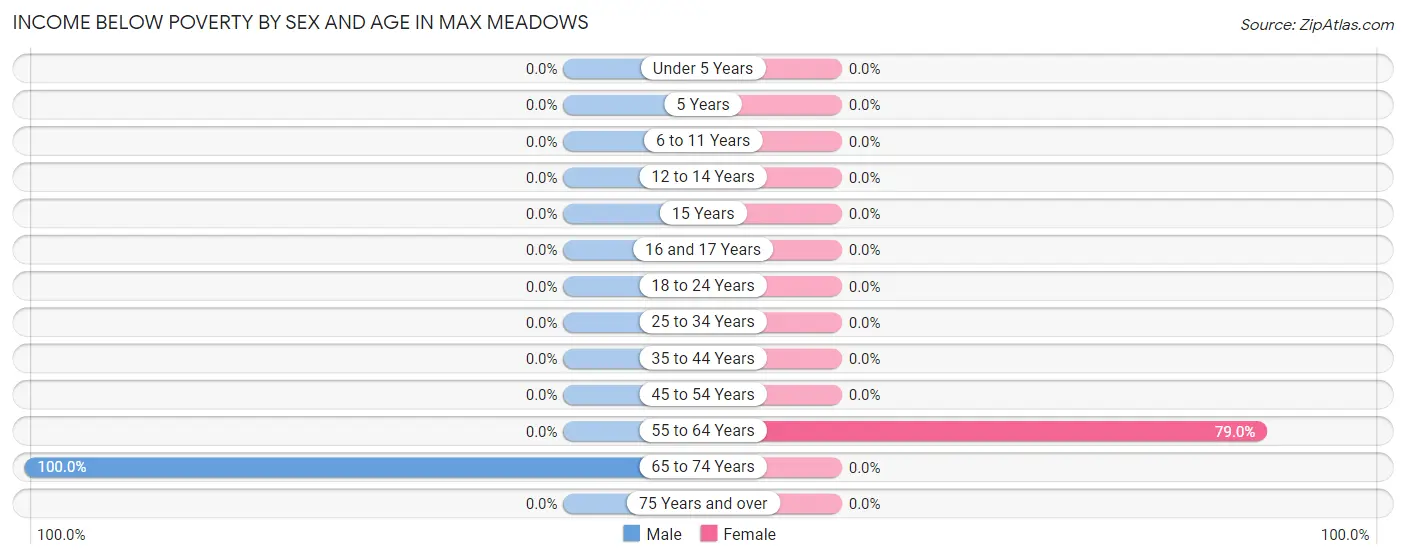
| Age Bracket | Male | Female |
| Under 5 Years | 0 (0.0%) | 0 (0.0%) |
| 5 Years | 0 (0.0%) | 0 (0.0%) |
| 6 to 11 Years | 0 (0.0%) | 0 (0.0%) |
| 12 to 14 Years | 0 (0.0%) | 0 (0.0%) |
| 15 Years | 0 (0.0%) | 0 (0.0%) |
| 16 and 17 Years | 0 (0.0%) | 0 (0.0%) |
| 18 to 24 Years | 0 (0.0%) | 0 (0.0%) |
| 25 to 34 Years | 0 (0.0%) | 0 (0.0%) |
| 35 to 44 Years | 0 (0.0%) | 0 (0.0%) |
| 45 to 54 Years | 0 (0.0%) | 0 (0.0%) |
| 55 to 64 Years | 0 (0.0%) | 15 (78.9%) |
| 65 to 74 Years | 14 (100.0%) | 0 (0.0%) |
| 75 Years and over | 0 (0.0%) | 0 (0.0%) |
| Total | 14 (4.6%) | 15 (5.4%) |
Income Above Poverty by Sex and Age in Max Meadows
According to the poverty statistics in Max Meadows, males aged under 5 years and females aged under 5 years are the age groups that are most secure financially, with 100.0% of males and 100.0% of females in these age groups living above the poverty line.
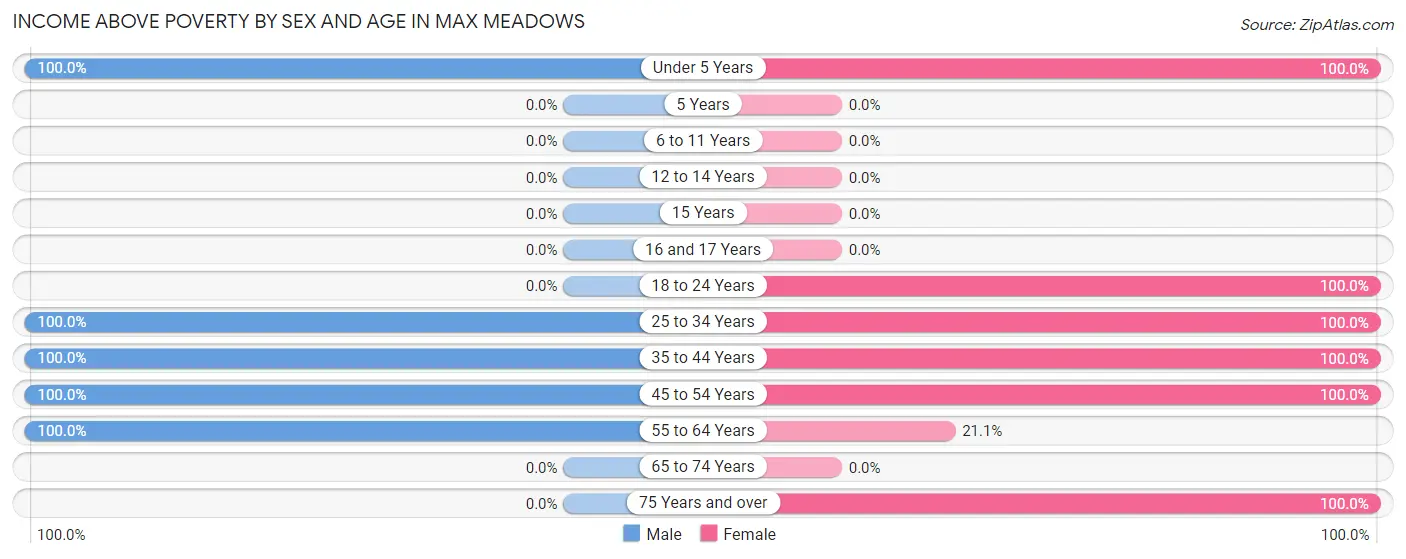
| Age Bracket | Male | Female |
| Under 5 Years | 26 (100.0%) | 24 (100.0%) |
| 5 Years | 0 (0.0%) | 0 (0.0%) |
| 6 to 11 Years | 0 (0.0%) | 0 (0.0%) |
| 12 to 14 Years | 0 (0.0%) | 0 (0.0%) |
| 15 Years | 0 (0.0%) | 0 (0.0%) |
| 16 and 17 Years | 0 (0.0%) | 0 (0.0%) |
| 18 to 24 Years | 0 (0.0%) | 57 (100.0%) |
| 25 to 34 Years | 69 (100.0%) | 18 (100.0%) |
| 35 to 44 Years | 53 (100.0%) | 27 (100.0%) |
| 45 to 54 Years | 135 (100.0%) | 126 (100.0%) |
| 55 to 64 Years | 5 (100.0%) | 4 (21.0%) |
| 65 to 74 Years | 0 (0.0%) | 0 (0.0%) |
| 75 Years and over | 0 (0.0%) | 7 (100.0%) |
| Total | 288 (95.4%) | 263 (94.6%) |
Income Below Poverty Among Married-Couple Families in Max Meadows
The poverty statistics for married-couple families in Max Meadows show that 11.4% or 14 of the total 123 families live below the poverty line. Families with no children have the highest poverty rate of 17.9%, comprising of 14 families. On the other hand, families with 1 or 2 children have the lowest poverty rate of 0.0%, which includes 0 families.
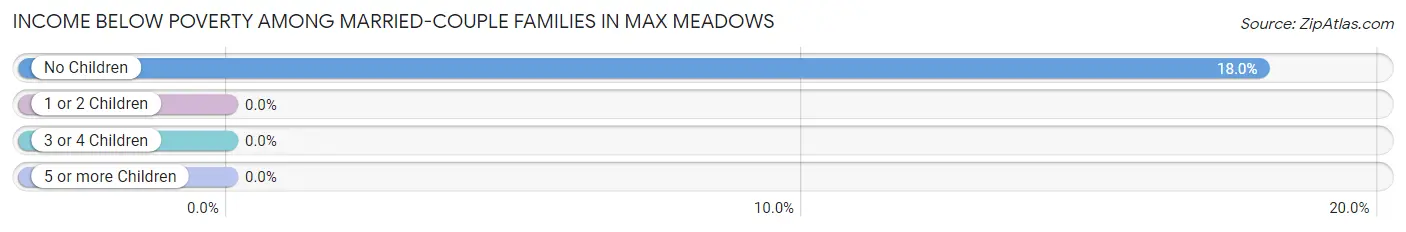
| Children | Above Poverty | Below Poverty |
| No Children | 64 (82.1%) | 14 (17.9%) |
| 1 or 2 Children | 45 (100.0%) | 0 (0.0%) |
| 3 or 4 Children | 0 (0.0%) | 0 (0.0%) |
| 5 or more Children | 0 (0.0%) | 0 (0.0%) |
| Total | 109 (88.6%) | 14 (11.4%) |
Income Below Poverty Among Single-Parent Households in Max Meadows
| Children | Single Father | Single Mother |
| No Children | 0 (0.0%) | 0 (0.0%) |
| 1 or 2 Children | 0 (0.0%) | 0 (0.0%) |
| 3 or 4 Children | 0 (0.0%) | 0 (0.0%) |
| 5 or more Children | 0 (0.0%) | 0 (0.0%) |
| Total | 0 (0.0%) | 0 (0.0%) |
Income Below Poverty Among Married-Couple vs Single-Parent Households in Max Meadows
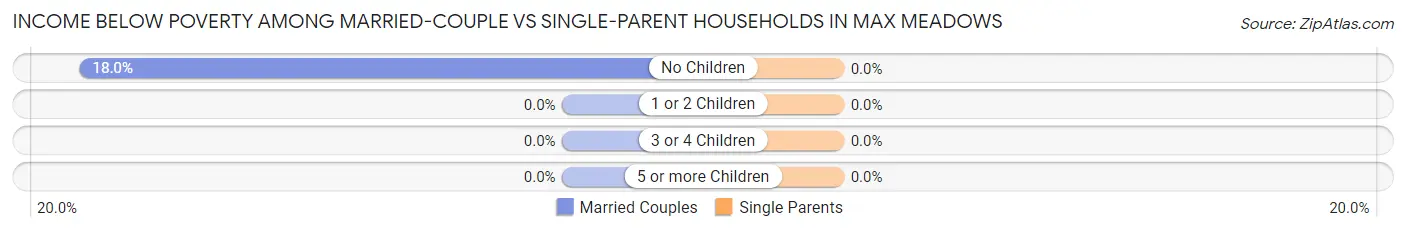
| Children | Married-Couple Families | Single-Parent Households |
| No Children | 14 (17.9%) | 0 (0.0%) |
| 1 or 2 Children | 0 (0.0%) | 0 (0.0%) |
| 3 or 4 Children | 0 (0.0%) | 0 (0.0%) |
| 5 or more Children | 0 (0.0%) | 0 (0.0%) |
| Total | 14 (11.4%) | 0 (0.0%) |
Race in Max Meadows
The most populous races in Max Meadows are White / Caucasian (571 | 98.5%), and Two or more Races (9 | 1.5%).
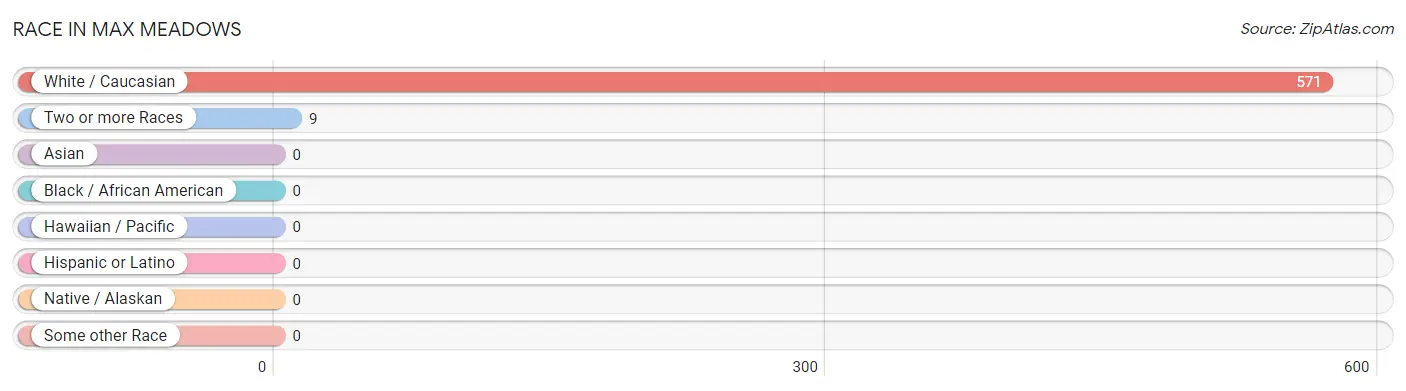
| Race | # Population | % Population |
| Asian | 0 | 0.0% |
| Black / African American | 0 | 0.0% |
| Hawaiian / Pacific | 0 | 0.0% |
| Hispanic or Latino | 0 | 0.0% |
| Native / Alaskan | 0 | 0.0% |
| White / Caucasian | 571 | 98.5% |
| Two or more Races | 9 | 1.5% |
| Some other Race | 0 | 0.0% |
| Total | 580 | 100.0% |
Ancestry in Max Meadows
The most populous ancestries reported in Max Meadows are American (209 | 36.0%), English (29 | 5.0%), German (7 | 1.2%), and Irish (7 | 1.2%), together accounting for 43.4% of all Max Meadows residents.
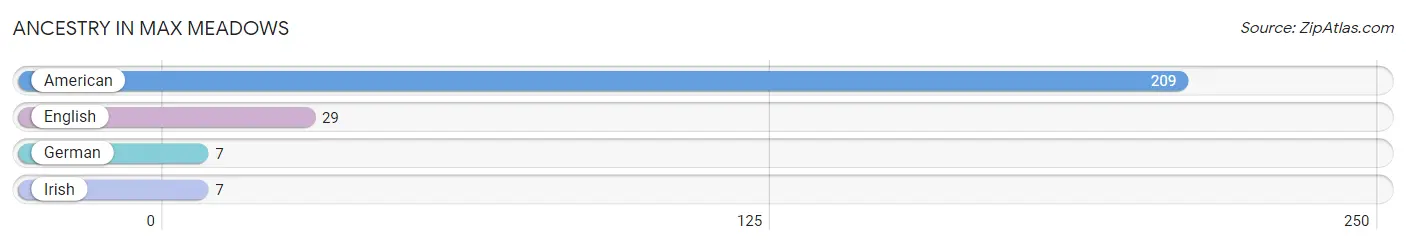
| Ancestry | # Population | % Population |
| American | 209 | 36.0% |
| English | 29 | 5.0% |
| German | 7 | 1.2% |
| Irish | 7 | 1.2% | View All 4 Rows |
Immigrants in Max Meadows

| Immigration Origin | # Population | % Population | View All 0 Rows |
Sex and Age in Max Meadows
Sex and Age in Max Meadows
The most populous age groups in Max Meadows are 45 to 49 Years (89 | 29.5%) for men and 50 to 54 Years (126 | 45.3%) for women.
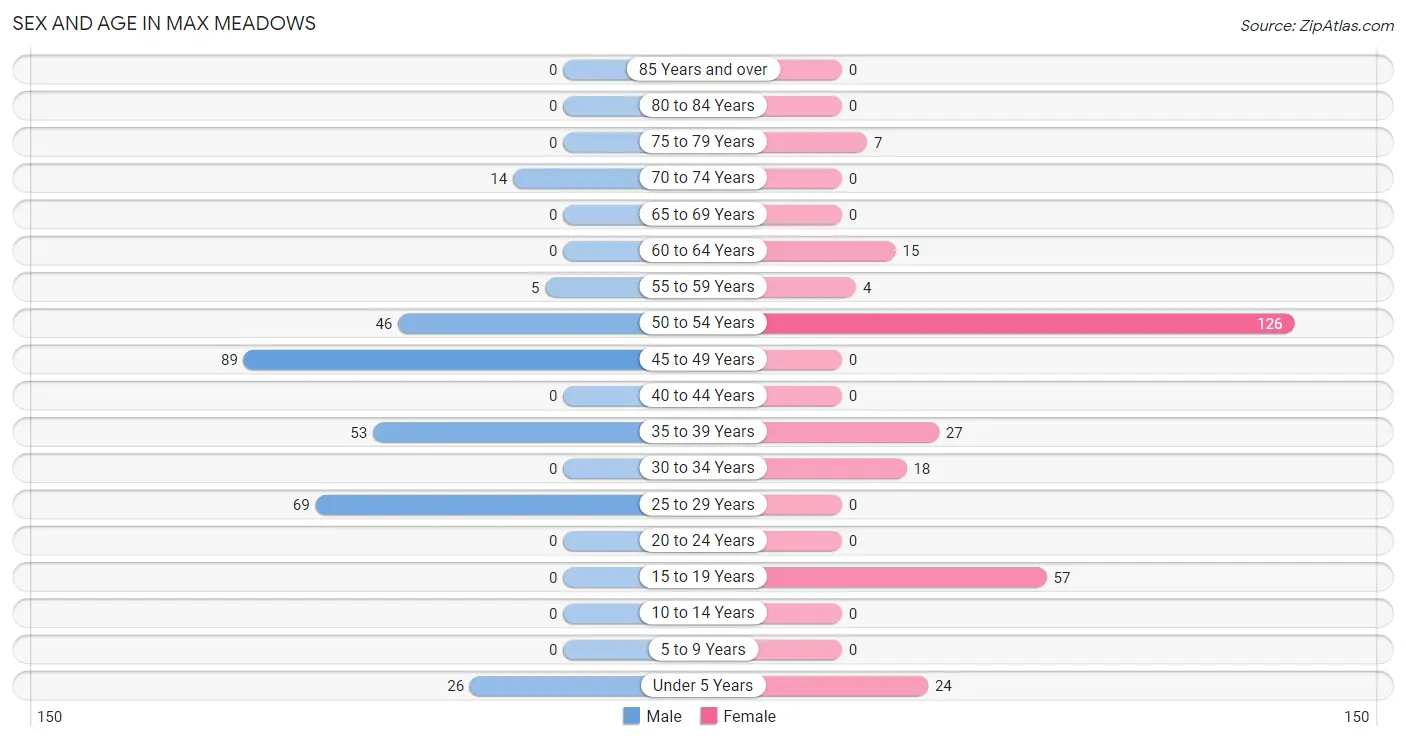
| Age Bracket | Male | Female |
| Under 5 Years | 26 (8.6%) | 24 (8.6%) |
| 5 to 9 Years | 0 (0.0%) | 0 (0.0%) |
| 10 to 14 Years | 0 (0.0%) | 0 (0.0%) |
| 15 to 19 Years | 0 (0.0%) | 57 (20.5%) |
| 20 to 24 Years | 0 (0.0%) | 0 (0.0%) |
| 25 to 29 Years | 69 (22.9%) | 0 (0.0%) |
| 30 to 34 Years | 0 (0.0%) | 18 (6.5%) |
| 35 to 39 Years | 53 (17.5%) | 27 (9.7%) |
| 40 to 44 Years | 0 (0.0%) | 0 (0.0%) |
| 45 to 49 Years | 89 (29.5%) | 0 (0.0%) |
| 50 to 54 Years | 46 (15.2%) | 126 (45.3%) |
| 55 to 59 Years | 5 (1.7%) | 4 (1.4%) |
| 60 to 64 Years | 0 (0.0%) | 15 (5.4%) |
| 65 to 69 Years | 0 (0.0%) | 0 (0.0%) |
| 70 to 74 Years | 14 (4.6%) | 0 (0.0%) |
| 75 to 79 Years | 0 (0.0%) | 7 (2.5%) |
| 80 to 84 Years | 0 (0.0%) | 0 (0.0%) |
| 85 Years and over | 0 (0.0%) | 0 (0.0%) |
| Total | 302 (100.0%) | 278 (100.0%) |
Families and Households in Max Meadows
Median Family Size in Max Meadows
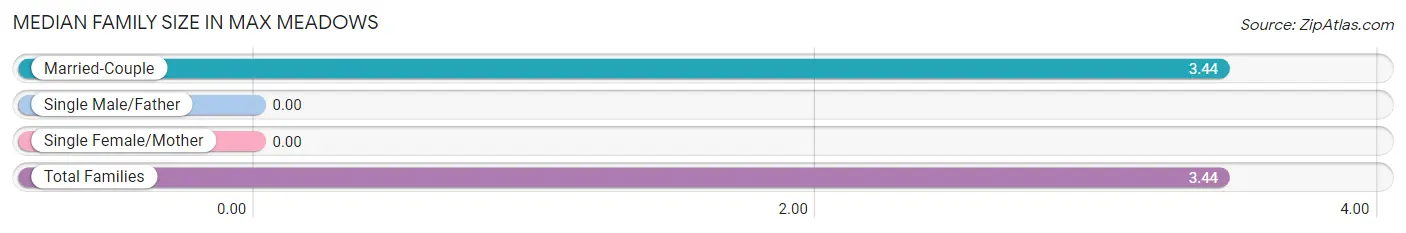
| Family Type | # Families | Family Size |
| Married-Couple | 123 (100.0%) | 3.44 |
| Single Male/Father | 0 (0.0%) | - |
| Single Female/Mother | 0 (0.0%) | - |
| Total Families | 123 (100.0%) | 3.44 |
Median Household Size in Max Meadows
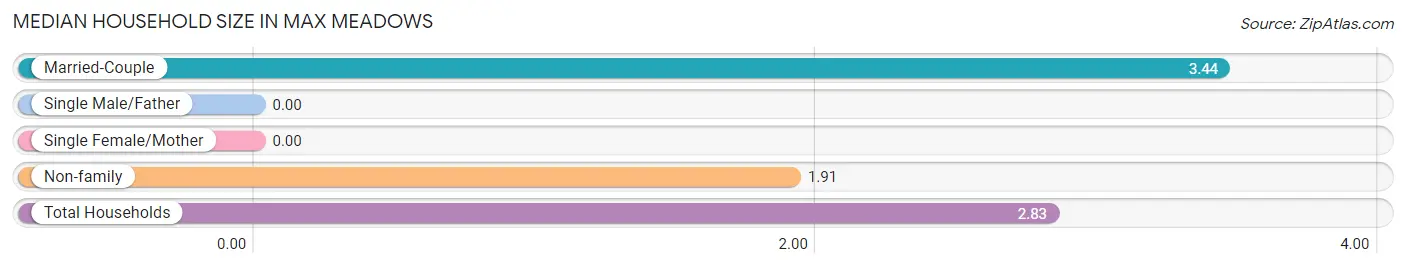
| Household Type | # Households | Household Size |
| Married-Couple | 123 (60.0%) | 3.44 |
| Single Male/Father | 0 (0.0%) | - |
| Single Female/Mother | 0 (0.0%) | - |
| Non-family | 82 (40.0%) | 1.91 |
| Total Households | 205 (100.0%) | 2.83 |
Household Size by Marriage Status in Max Meadows
Out of a total of 205 households in Max Meadows, 123 (60.0%) are family households, while 82 (40.0%) are nonfamily households. The most numerous type of family households are 4-person households, comprising 46, and the most common type of nonfamily households are 2-person households, comprising 75.
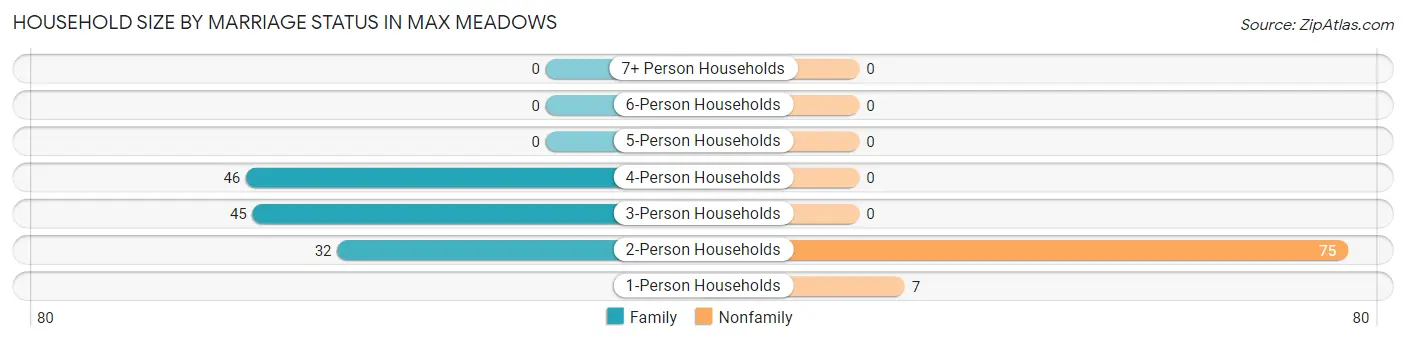
| Household Size | Family Households | Nonfamily Households |
| 1-Person Households | - | 7 (3.4%) |
| 2-Person Households | 32 (15.6%) | 75 (36.6%) |
| 3-Person Households | 45 (22.0%) | 0 (0.0%) |
| 4-Person Households | 46 (22.4%) | 0 (0.0%) |
| 5-Person Households | 0 (0.0%) | 0 (0.0%) |
| 6-Person Households | 0 (0.0%) | 0 (0.0%) |
| 7+ Person Households | 0 (0.0%) | 0 (0.0%) |
| Total | 123 (60.0%) | 82 (40.0%) |
Female Fertility in Max Meadows
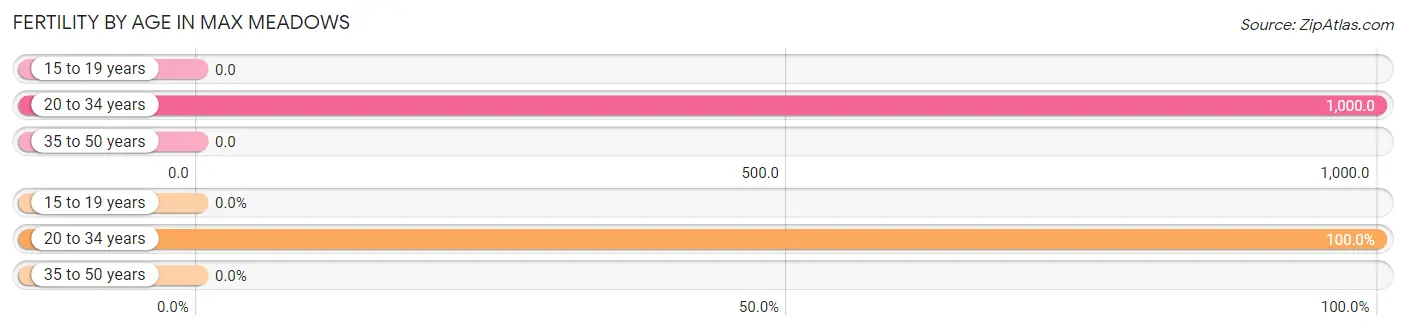
Fertility by Age in Max Meadows
Average fertility rate in Max Meadows is 155.0 births per 1,000 women. Women in the age bracket of 20 to 34 years have the highest fertility rate with 1,000.0 births per 1,000 women. Women in the age bracket of 20 to 34 years acount for 100.0% of all women with births.
| Age Bracket | Women with Births | Births / 1,000 Women |
| 15 to 19 years | 0 (0.0%) | 0.0 |
| 20 to 34 years | 18 (100.0%) | 1,000.0 |
| 35 to 50 years | 0 (0.0%) | 0.0 |
| Total | 18 (100.0%) | 155.0 |
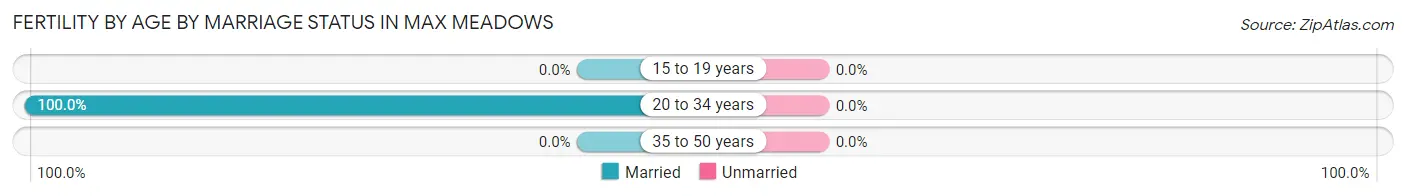
Fertility by Age by Marriage Status in Max Meadows
| Age Bracket | Married | Unmarried |
| 15 to 19 years | 0 (0.0%) | 0 (0.0%) |
| 20 to 34 years | 18 (100.0%) | 0 (0.0%) |
| 35 to 50 years | 0 (0.0%) | 0 (0.0%) |
| Total | 18 (100.0%) | 0 (0.0%) |
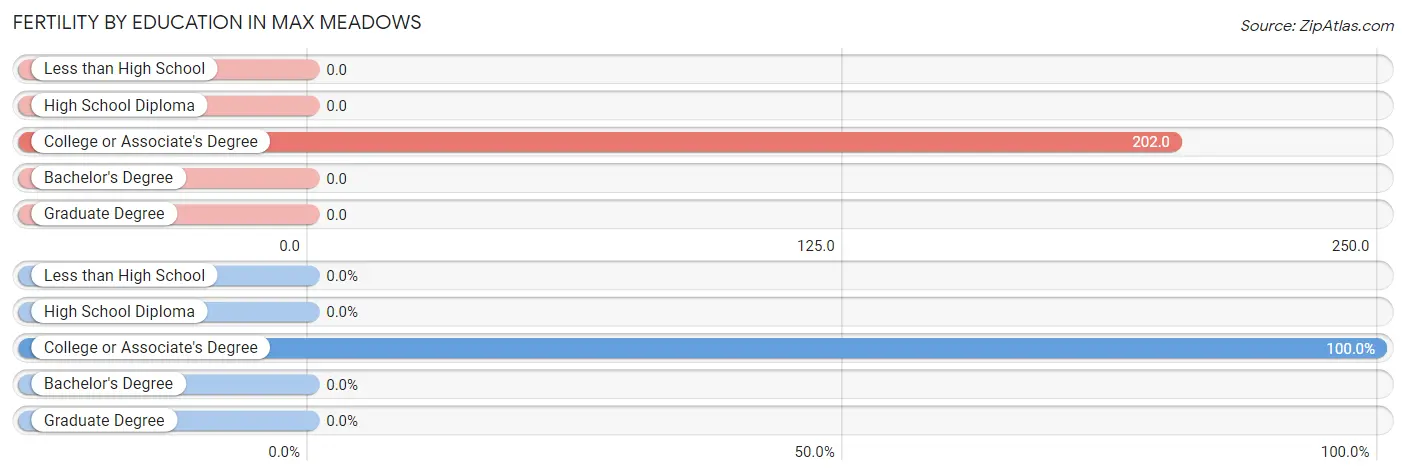
Fertility by Education in Max Meadows
| Educational Attainment | Women with Births | Births / 1,000 Women |
| Less than High School | 0 (0.0%) | 0.0 |
| High School Diploma | 0 (0.0%) | 0.0 |
| College or Associate's Degree | 18 (100.0%) | 202.0 |
| Bachelor's Degree | 0 (0.0%) | 0.0 |
| Graduate Degree | 0 (0.0%) | 0.0 |
| Total | 18 (100.0%) | 155.0 |
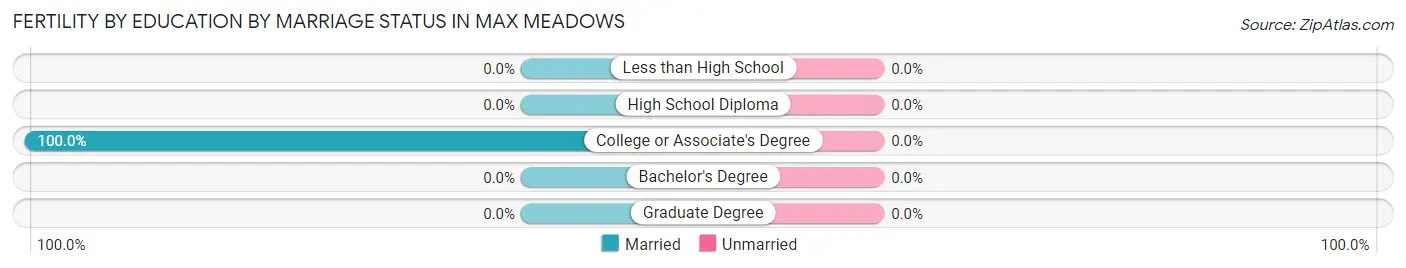
Fertility by Education by Marriage Status in Max Meadows
| Educational Attainment | Married | Unmarried |
| Less than High School | 0 (0.0%) | 0 (0.0%) |
| High School Diploma | 0 (0.0%) | 0 (0.0%) |
| College or Associate's Degree | 18 (100.0%) | 0 (0.0%) |
| Bachelor's Degree | 0 (0.0%) | 0 (0.0%) |
| Graduate Degree | 0 (0.0%) | 0 (0.0%) |
| Total | 18 (100.0%) | 0 (0.0%) |
Employment Characteristics in Max Meadows
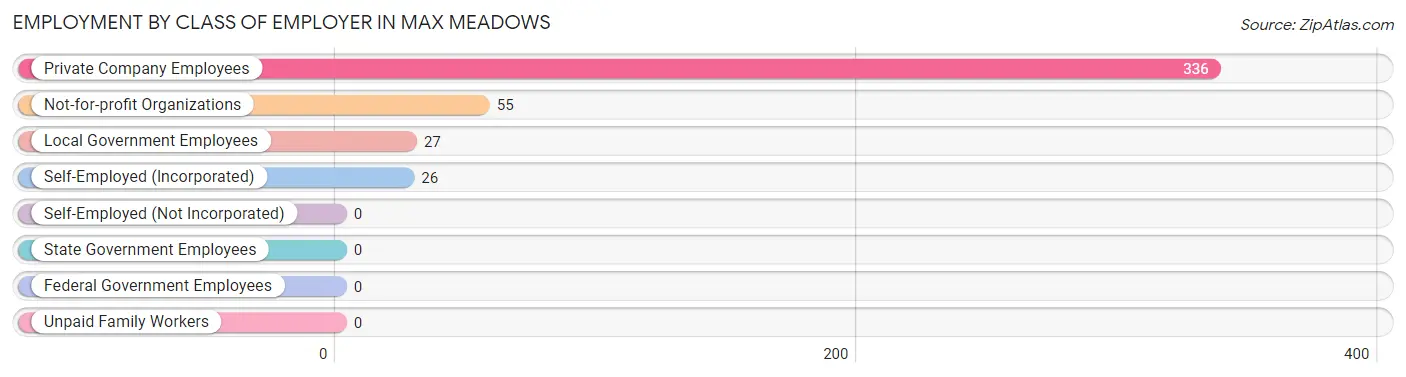
Employment by Class of Employer in Max Meadows
Among the 444 employed individuals in Max Meadows, private company employees (336 | 75.7%), not-for-profit organizations (55 | 12.4%), and local government employees (27 | 6.1%) make up the most common classes of employment.
| Employer Class | # Employees | % Employees |
| Private Company Employees | 336 | 75.7% |
| Self-Employed (Incorporated) | 26 | 5.9% |
| Self-Employed (Not Incorporated) | 0 | 0.0% |
| Not-for-profit Organizations | 55 | 12.4% |
| Local Government Employees | 27 | 6.1% |
| State Government Employees | 0 | 0.0% |
| Federal Government Employees | 0 | 0.0% |
| Unpaid Family Workers | 0 | 0.0% |
| Total | 444 | 100.0% |
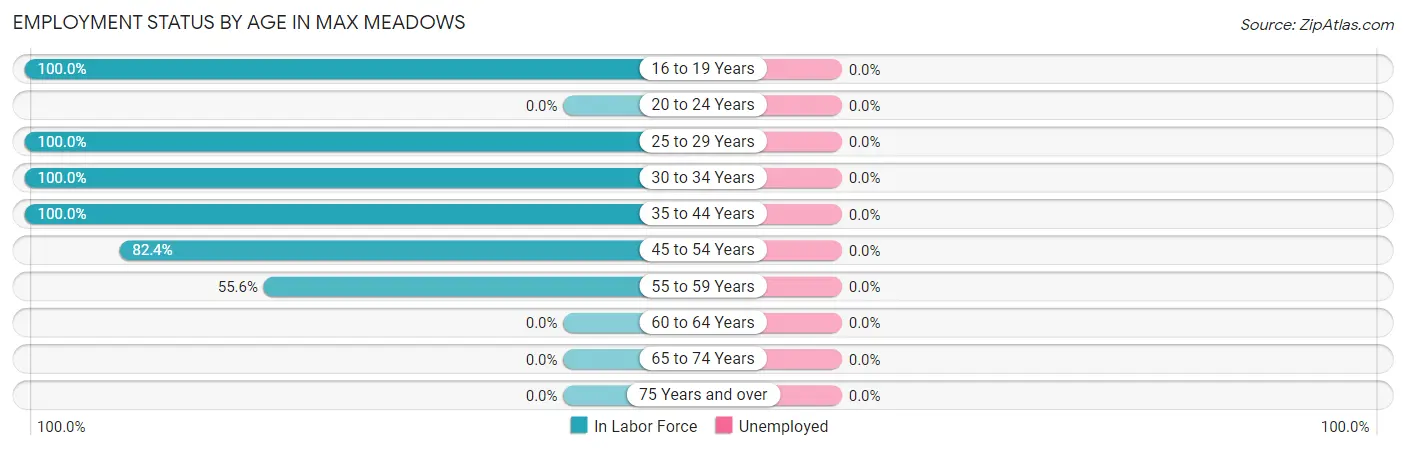
Employment Status by Age in Max Meadows
| Age Bracket | In Labor Force | Unemployed |
| 16 to 19 Years | 57 (100.0%) | 0 (0.0%) |
| 20 to 24 Years | 0 (0.0%) | 0 (0.0%) |
| 25 to 29 Years | 69 (100.0%) | 0 (0.0%) |
| 30 to 34 Years | 18 (100.0%) | 0 (0.0%) |
| 35 to 44 Years | 80 (100.0%) | 0 (0.0%) |
| 45 to 54 Years | 215 (82.4%) | 0 (0.0%) |
| 55 to 59 Years | 5 (55.6%) | 0 (0.0%) |
| 60 to 64 Years | 0 (0.0%) | 0 (0.0%) |
| 65 to 74 Years | 0 (0.0%) | 0 (0.0%) |
| 75 Years and over | 0 (0.0%) | 0 (0.0%) |
| Total | 444 (83.8%) | 0 (0.0%) |
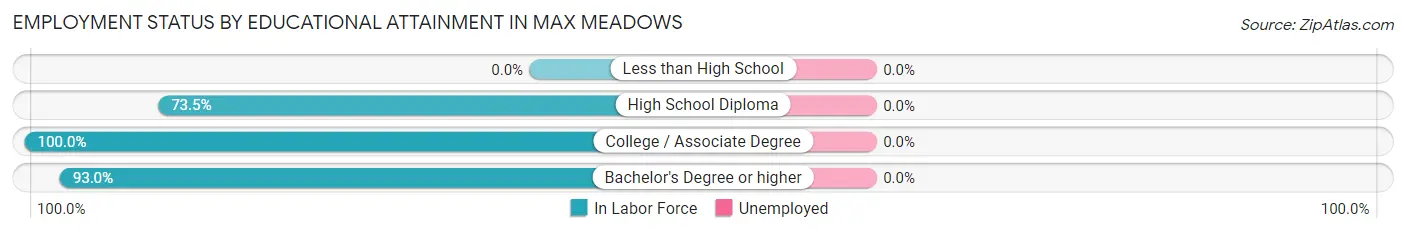
Employment Status by Educational Attainment in Max Meadows
| Educational Attainment | In Labor Force | Unemployed |
| Less than High School | 0 (0.0%) | 0 (0.0%) |
| High School Diploma | 169 (73.5%) | 0 (0.0%) |
| College / Associate Degree | 165 (100.0%) | 0 (0.0%) |
| Bachelor's Degree or higher | 53 (93.0%) | 0 (0.0%) |
| Total | 387 (85.6%) | 0 (0.0%) |
Employment Occupations by Sex in Max Meadows
Management, Business, Science and Arts Occupations
The most common Management, Business, Science and Arts occupations in Max Meadows are Community & Social Service (27 | 6.1%), Education Instruction & Library (27 | 6.1%), and Management (26 | 5.9%).
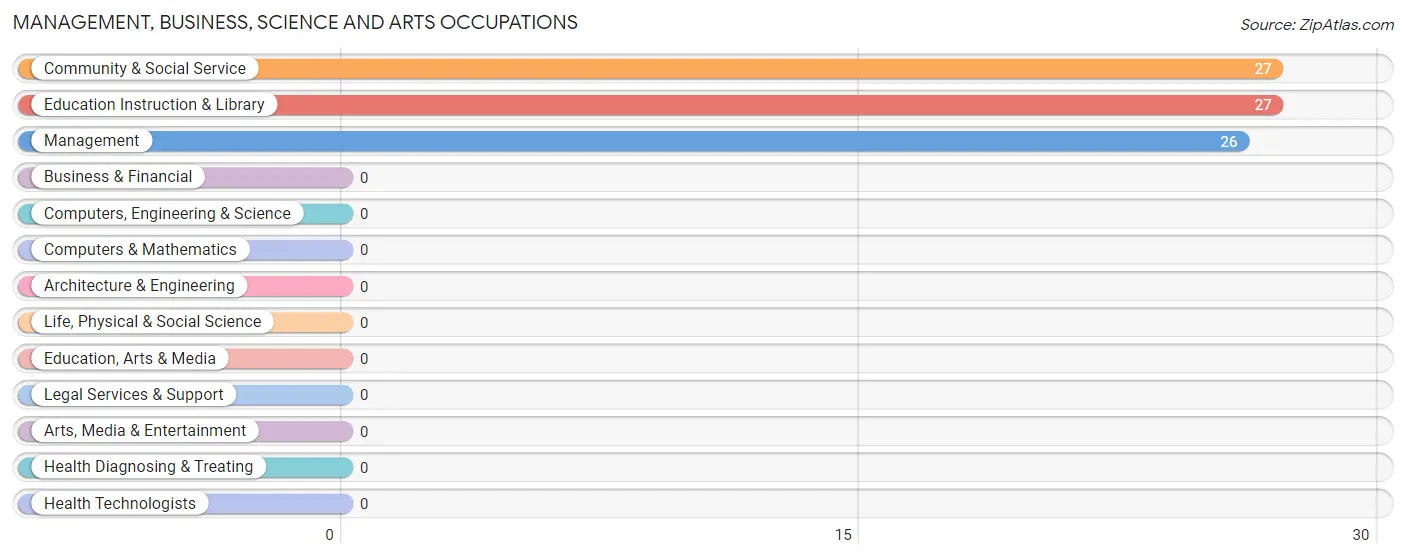
Management, Business, Science and Arts Occupations by Sex
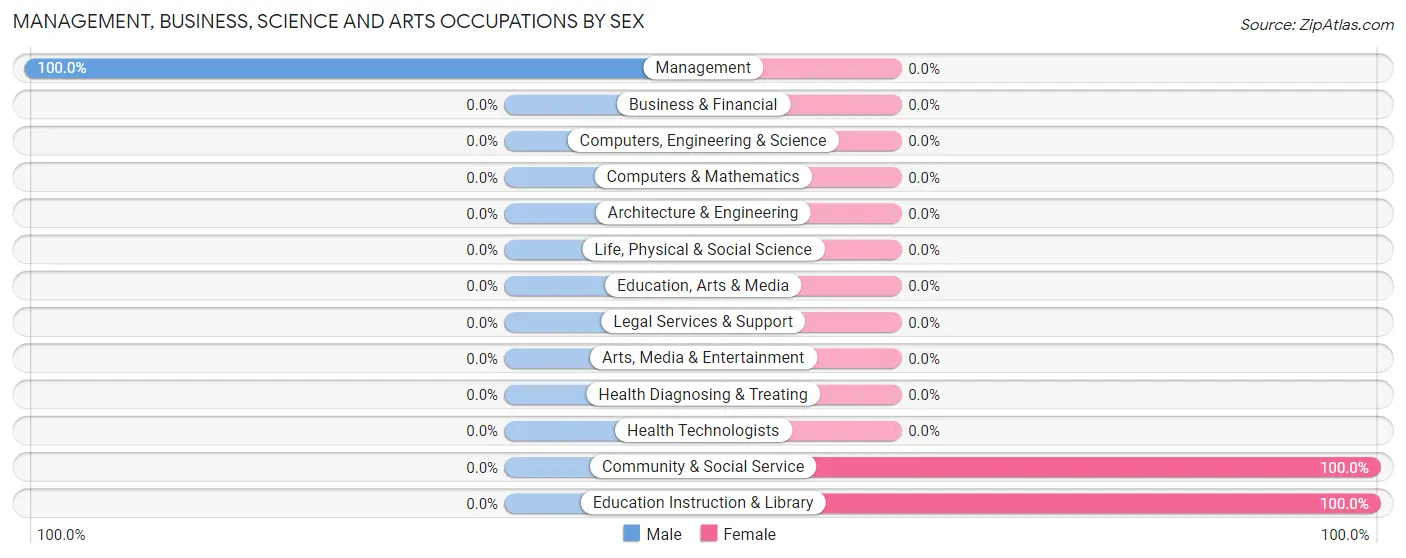
| Occupation | Male | Female |
| Management | 26 (100.0%) | 0 (0.0%) |
| Business & Financial | 0 (0.0%) | 0 (0.0%) |
| Computers, Engineering & Science | 0 (0.0%) | 0 (0.0%) |
| Computers & Mathematics | 0 (0.0%) | 0 (0.0%) |
| Architecture & Engineering | 0 (0.0%) | 0 (0.0%) |
| Life, Physical & Social Science | 0 (0.0%) | 0 (0.0%) |
| Community & Social Service | 0 (0.0%) | 27 (100.0%) |
| Education, Arts & Media | 0 (0.0%) | 0 (0.0%) |
| Legal Services & Support | 0 (0.0%) | 0 (0.0%) |
| Education Instruction & Library | 0 (0.0%) | 27 (100.0%) |
| Arts, Media & Entertainment | 0 (0.0%) | 0 (0.0%) |
| Health Diagnosing & Treating | 0 (0.0%) | 0 (0.0%) |
| Health Technologists | 0 (0.0%) | 0 (0.0%) |
| Total (Category) | 26 (49.1%) | 27 (50.9%) |
| Total (Overall) | 216 (48.6%) | 228 (51.3%) |
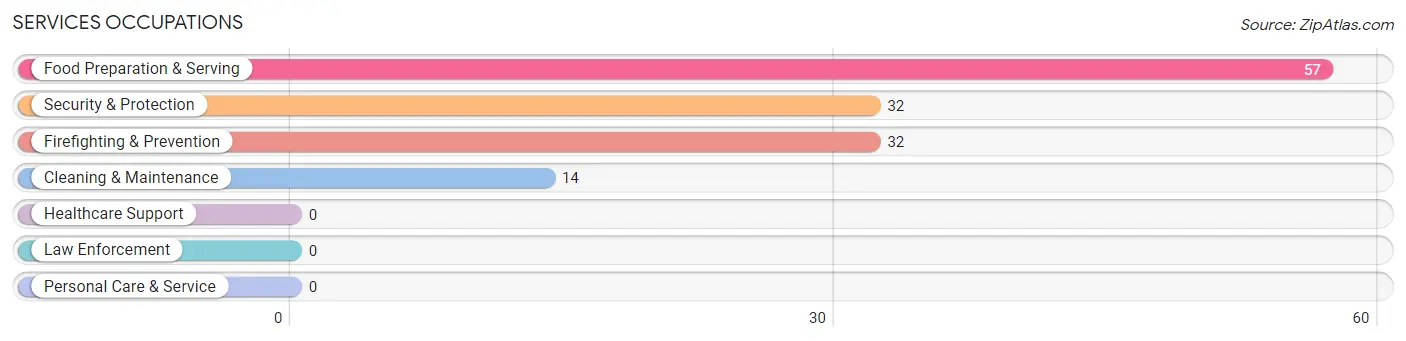
Services Occupations
The most common Services occupations in Max Meadows are Food Preparation & Serving (57 | 12.8%), Security & Protection (32 | 7.2%), Firefighting & Prevention (32 | 7.2%), and Cleaning & Maintenance (14 | 3.2%).
Services Occupations by Sex
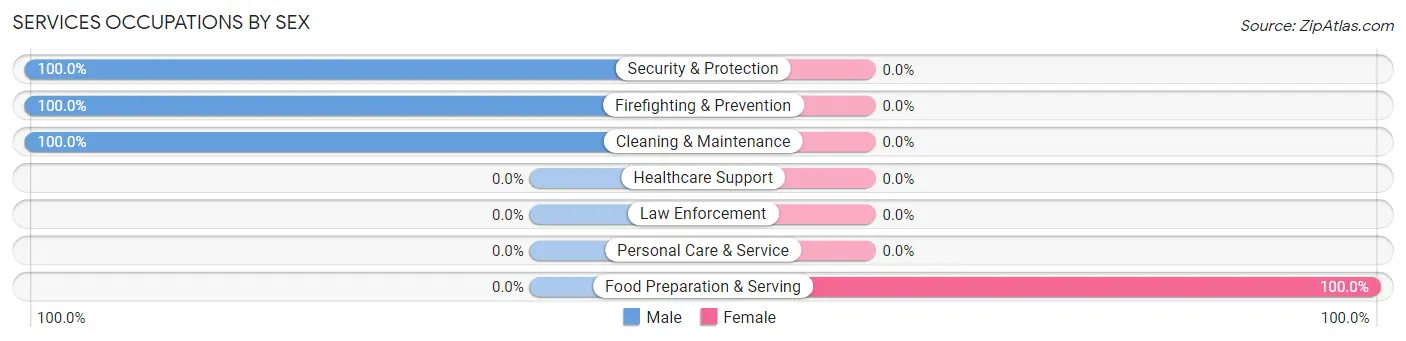
| Occupation | Male | Female |
| Healthcare Support | 0 (0.0%) | 0 (0.0%) |
| Security & Protection | 32 (100.0%) | 0 (0.0%) |
| Firefighting & Prevention | 32 (100.0%) | 0 (0.0%) |
| Law Enforcement | 0 (0.0%) | 0 (0.0%) |
| Food Preparation & Serving | 0 (0.0%) | 57 (100.0%) |
| Cleaning & Maintenance | 14 (100.0%) | 0 (0.0%) |
| Personal Care & Service | 0 (0.0%) | 0 (0.0%) |
| Total (Category) | 46 (44.7%) | 57 (55.3%) |
| Total (Overall) | 216 (48.6%) | 228 (51.3%) |
Sales and Office Occupations
The most common Sales and Office occupations in Max Meadows are , and Office & Administration (69 | 15.5%).
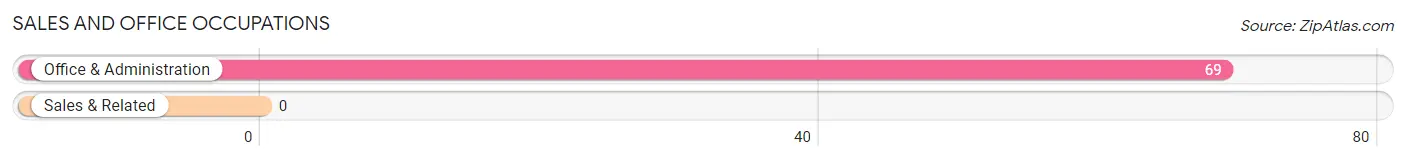
Sales and Office Occupations by Sex
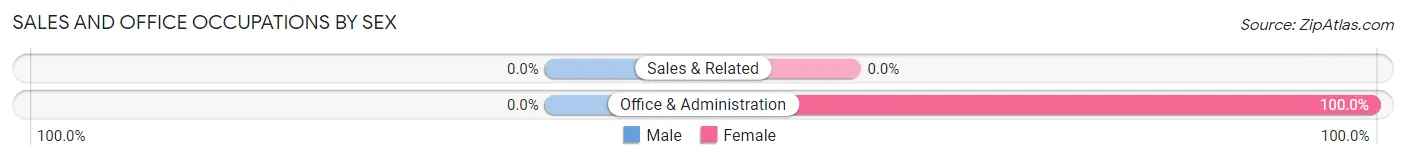
| Occupation | Male | Female |
| Sales & Related | 0 (0.0%) | 0 (0.0%) |
| Office & Administration | 0 (0.0%) | 69 (100.0%) |
| Total (Category) | 0 (0.0%) | 69 (100.0%) |
| Total (Overall) | 216 (48.6%) | 228 (51.3%) |
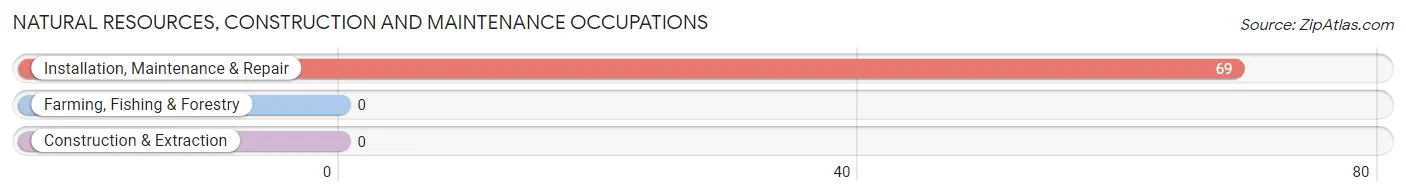
Natural Resources, Construction and Maintenance Occupations
The most common Natural Resources, Construction and Maintenance occupations in Max Meadows are , and Installation, Maintenance & Repair (69 | 15.5%).
Natural Resources, Construction and Maintenance Occupations by Sex
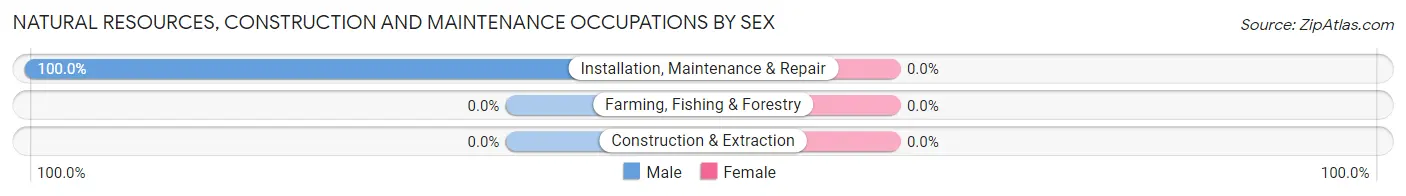
| Occupation | Male | Female |
| Farming, Fishing & Forestry | 0 (0.0%) | 0 (0.0%) |
| Construction & Extraction | 0 (0.0%) | 0 (0.0%) |
| Installation, Maintenance & Repair | 69 (100.0%) | 0 (0.0%) |
| Total (Category) | 69 (100.0%) | 0 (0.0%) |
| Total (Overall) | 216 (48.6%) | 228 (51.3%) |
Production, Transportation and Moving Occupations
The most common Production, Transportation and Moving occupations in Max Meadows are , and Production (150 | 33.8%).
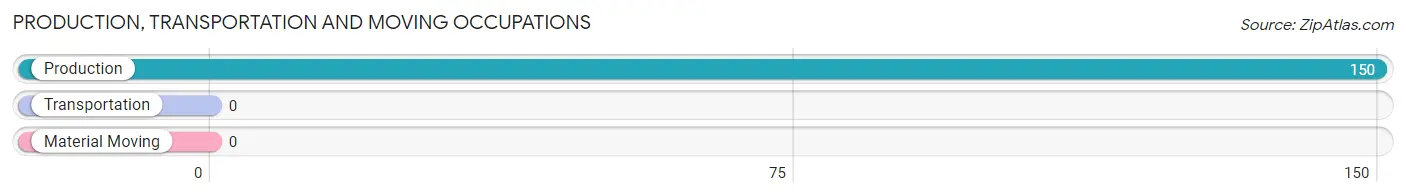
Production, Transportation and Moving Occupations by Sex
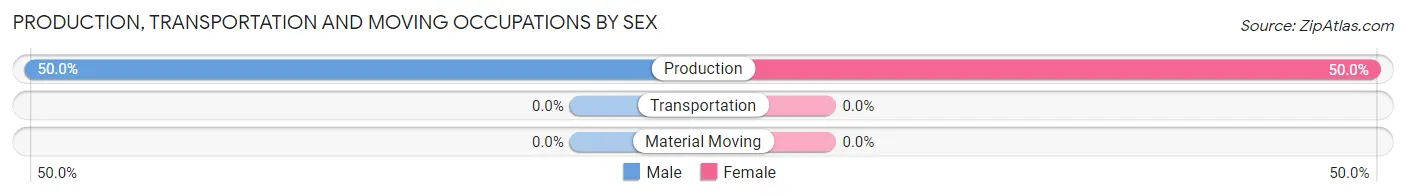
| Occupation | Male | Female |
| Production | 75 (50.0%) | 75 (50.0%) |
| Transportation | 0 (0.0%) | 0 (0.0%) |
| Material Moving | 0 (0.0%) | 0 (0.0%) |
| Total (Category) | 75 (50.0%) | 75 (50.0%) |
| Total (Overall) | 216 (48.6%) | 228 (51.3%) |
Employment Industries by Sex in Max Meadows
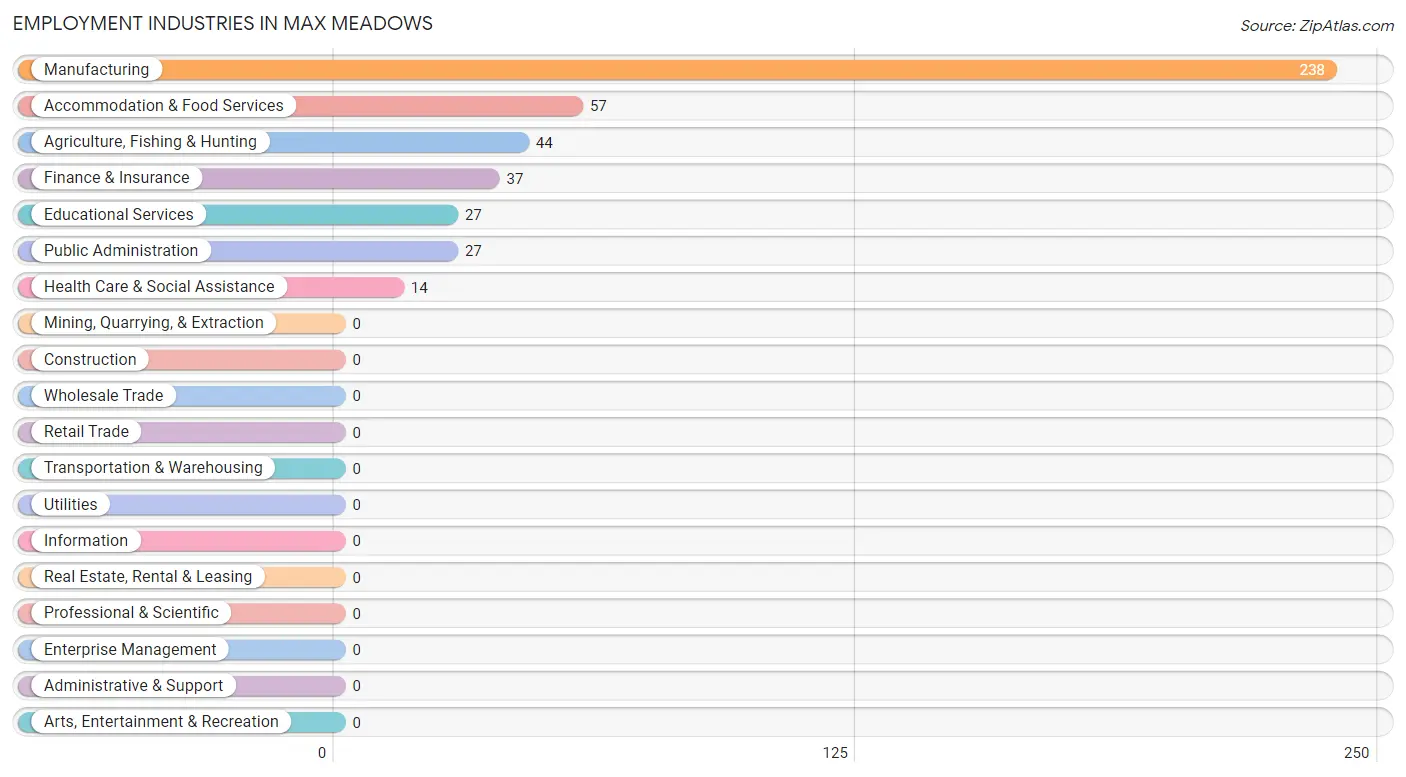
Employment Industries in Max Meadows
The major employment industries in Max Meadows include Manufacturing (238 | 53.6%), Accommodation & Food Services (57 | 12.8%), Agriculture, Fishing & Hunting (44 | 9.9%), Finance & Insurance (37 | 8.3%), and Educational Services (27 | 6.1%).
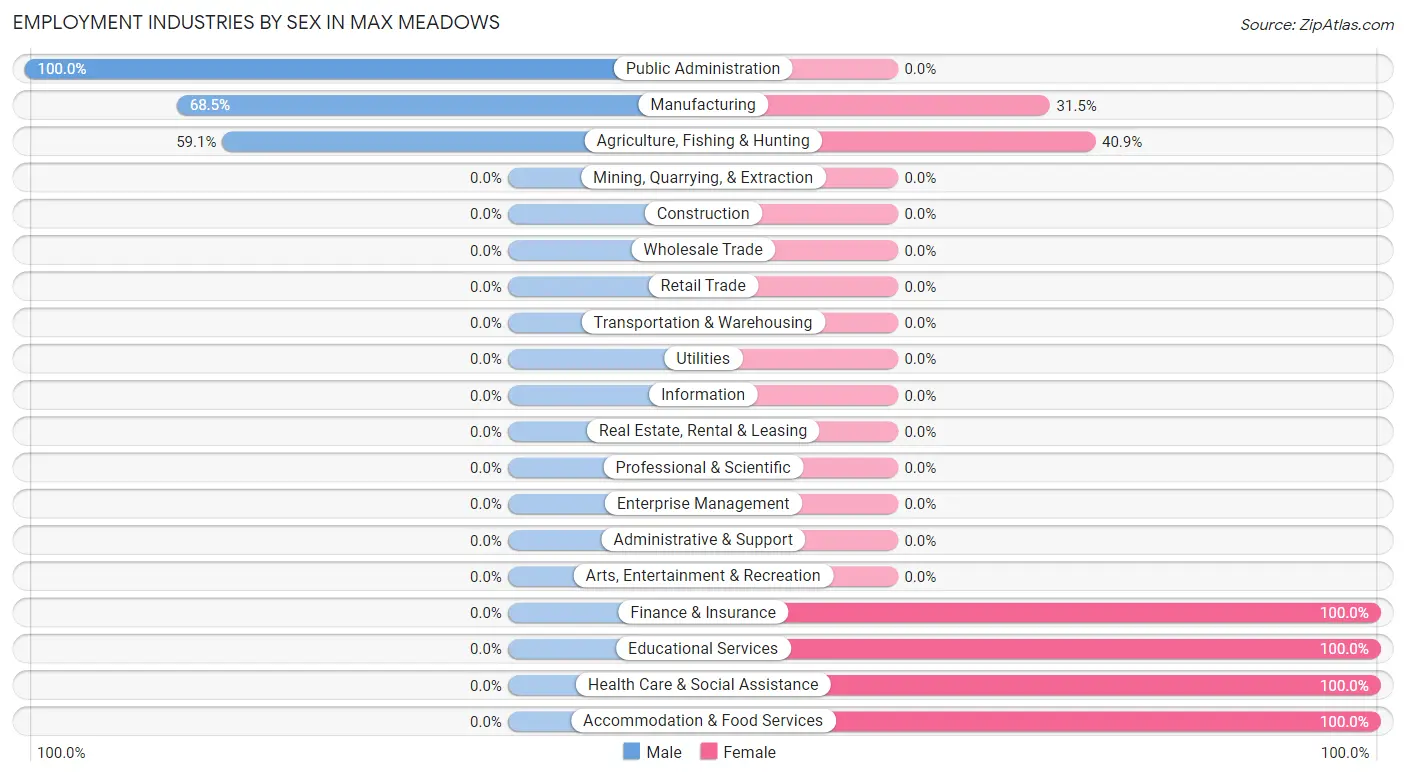
Employment Industries by Sex in Max Meadows
The Max Meadows industries that see more men than women are Public Administration (100.0%), Manufacturing (68.5%), and Agriculture, Fishing & Hunting (59.1%), whereas the industries that tend to have a higher number of women are Finance & Insurance (100.0%), Educational Services (100.0%), and Health Care & Social Assistance (100.0%).
| Industry | Male | Female |
| Agriculture, Fishing & Hunting | 26 (59.1%) | 18 (40.9%) |
| Mining, Quarrying, & Extraction | 0 (0.0%) | 0 (0.0%) |
| Construction | 0 (0.0%) | 0 (0.0%) |
| Manufacturing | 163 (68.5%) | 75 (31.5%) |
| Wholesale Trade | 0 (0.0%) | 0 (0.0%) |
| Retail Trade | 0 (0.0%) | 0 (0.0%) |
| Transportation & Warehousing | 0 (0.0%) | 0 (0.0%) |
| Utilities | 0 (0.0%) | 0 (0.0%) |
| Information | 0 (0.0%) | 0 (0.0%) |
| Finance & Insurance | 0 (0.0%) | 37 (100.0%) |
| Real Estate, Rental & Leasing | 0 (0.0%) | 0 (0.0%) |
| Professional & Scientific | 0 (0.0%) | 0 (0.0%) |
| Enterprise Management | 0 (0.0%) | 0 (0.0%) |
| Administrative & Support | 0 (0.0%) | 0 (0.0%) |
| Educational Services | 0 (0.0%) | 27 (100.0%) |
| Health Care & Social Assistance | 0 (0.0%) | 14 (100.0%) |
| Arts, Entertainment & Recreation | 0 (0.0%) | 0 (0.0%) |
| Accommodation & Food Services | 0 (0.0%) | 57 (100.0%) |
| Public Administration | 27 (100.0%) | 0 (0.0%) |
| Total | 216 (48.6%) | 228 (51.3%) |
Education in Max Meadows
School Enrollment in Max Meadows
| School Level | # Students | % Students |
| Nursery / Preschool | 0 | 0.0% |
| Kindergarten | 0 | 0.0% |
| Elementary School | 0 | 0.0% |
| Middle School | 0 | 0.0% |
| High School | 0 | 0.0% |
| College / Undergraduate | 0 | 0.0% |
| Graduate / Professional | 0 | 0.0% |
| Total | 0 | 0.0% |
School Enrollment by Age by Funding Source in Max Meadows
| Age Bracket | Public School | Private School |
| 3 to 4 Year Olds | 0 (0.0%) | 0 (0.0%) |
| 5 to 9 Year Old | 0 (0.0%) | 0 (0.0%) |
| 10 to 14 Year Olds | 0 (0.0%) | 0 (0.0%) |
| 15 to 17 Year Olds | 0 (0.0%) | 0 (0.0%) |
| 18 to 19 Year Olds | 0 (0.0%) | 0 (0.0%) |
| 20 to 24 Year Olds | 0 (0.0%) | 0 (0.0%) |
| 25 to 34 Year Olds | 0 (0.0%) | 0 (0.0%) |
| 35 Years and over | 0 (0.0%) | 0 (0.0%) |
| Total | 0 (0.0%) | 0 (0.0%) |
Educational Attainment by Field of Study in Max Meadows
Business (53 | 93.0%), and science & technology (4 | 7.0%) are the most common fields of study among 57 individuals in Max Meadows who have obtained a bachelor's degree or higher.
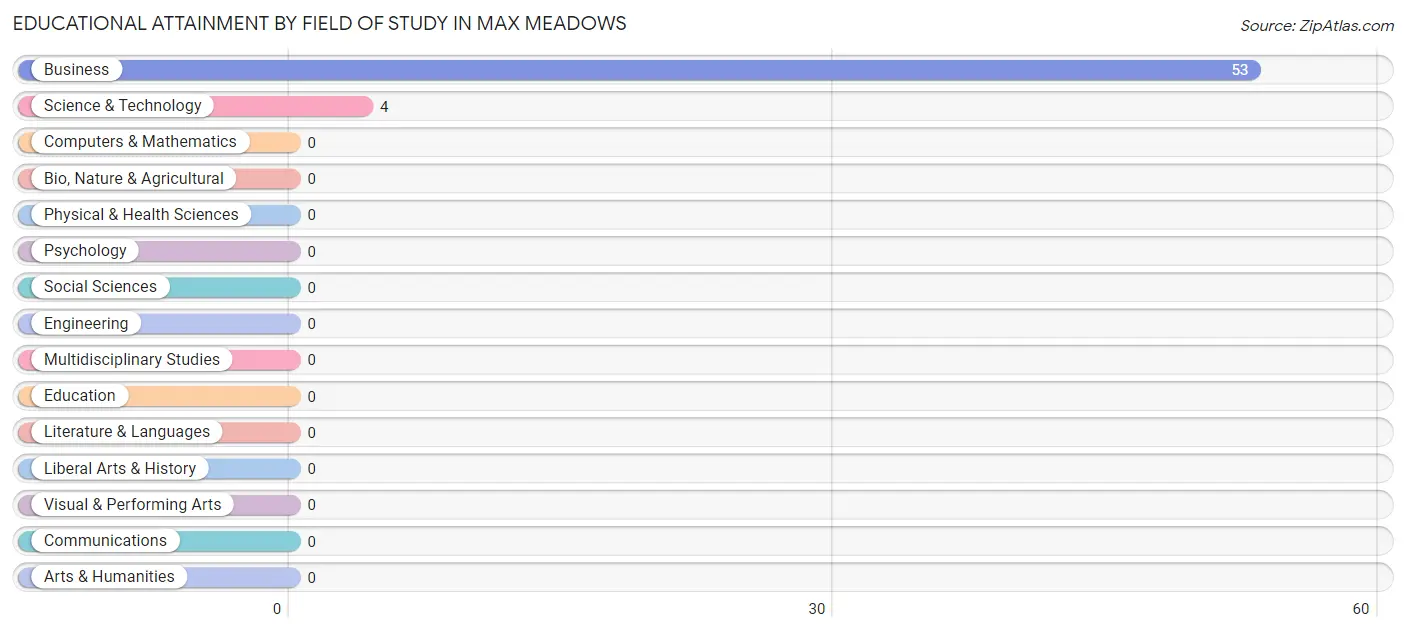
| Field of Study | # Graduates | % Graduates |
| Computers & Mathematics | 0 | 0.0% |
| Bio, Nature & Agricultural | 0 | 0.0% |
| Physical & Health Sciences | 0 | 0.0% |
| Psychology | 0 | 0.0% |
| Social Sciences | 0 | 0.0% |
| Engineering | 0 | 0.0% |
| Multidisciplinary Studies | 0 | 0.0% |
| Science & Technology | 4 | 7.0% |
| Business | 53 | 93.0% |
| Education | 0 | 0.0% |
| Literature & Languages | 0 | 0.0% |
| Liberal Arts & History | 0 | 0.0% |
| Visual & Performing Arts | 0 | 0.0% |
| Communications | 0 | 0.0% |
| Arts & Humanities | 0 | 0.0% |
| Total | 57 | 100.0% |
Transportation & Commute in Max Meadows
Vehicle Availability by Sex in Max Meadows
The most prevalent vehicle ownership categories in Max Meadows are males with 3 vehicles (80, accounting for 37.0%) and females with 3 vehicles (75, making up 35.1%).
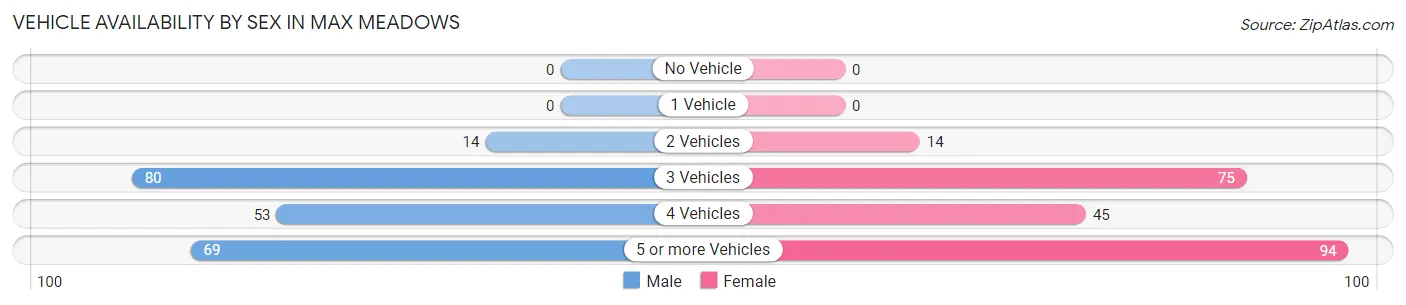
| Vehicles Available | Male | Female |
| No Vehicle | 0 (0.0%) | 0 (0.0%) |
| 1 Vehicle | 0 (0.0%) | 0 (0.0%) |
| 2 Vehicles | 14 (6.5%) | 14 (6.1%) |
| 3 Vehicles | 80 (37.0%) | 75 (32.9%) |
| 4 Vehicles | 53 (24.5%) | 45 (19.7%) |
| 5 or more Vehicles | 69 (31.9%) | 94 (41.2%) |
| Total | 216 (100.0%) | 228 (100.0%) |
Commute Time in Max Meadows
The most frequently occuring commute durations in Max Meadows are 45 to 59 minutes (150 commuters, 33.8%), 25 to 29 minutes (69 commuters, 15.5%), and 20 to 24 minutes (57 commuters, 12.8%).
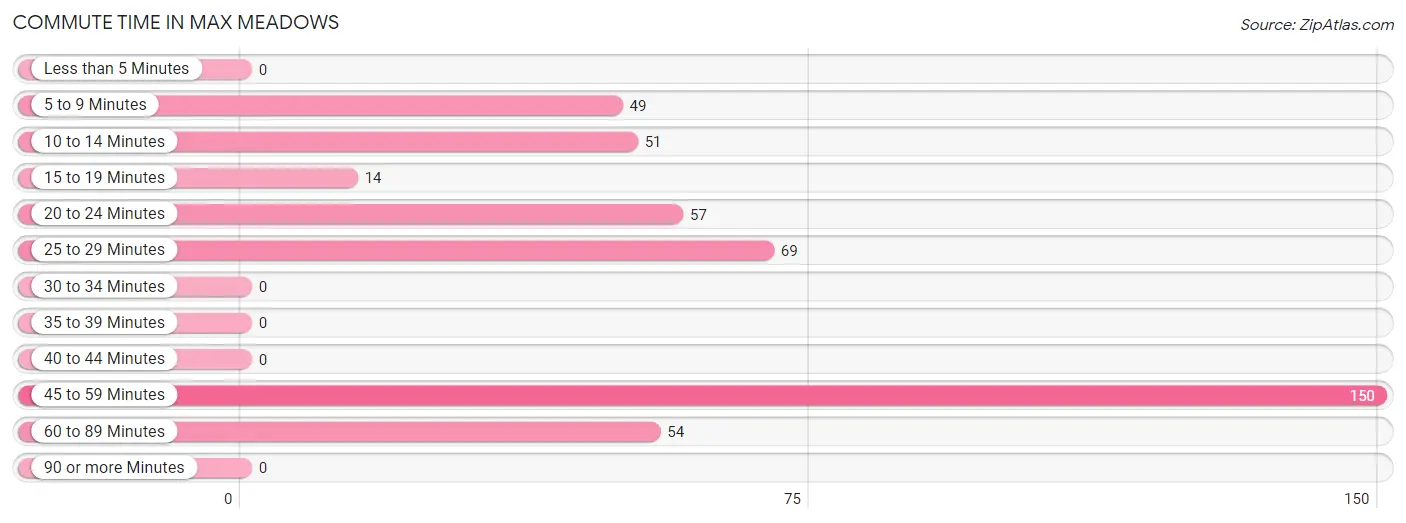
| Commute Time | # Commuters | % Commuters |
| Less than 5 Minutes | 0 | 0.0% |
| 5 to 9 Minutes | 49 | 11.0% |
| 10 to 14 Minutes | 51 | 11.5% |
| 15 to 19 Minutes | 14 | 3.2% |
| 20 to 24 Minutes | 57 | 12.8% |
| 25 to 29 Minutes | 69 | 15.5% |
| 30 to 34 Minutes | 0 | 0.0% |
| 35 to 39 Minutes | 0 | 0.0% |
| 40 to 44 Minutes | 0 | 0.0% |
| 45 to 59 Minutes | 150 | 33.8% |
| 60 to 89 Minutes | 54 | 12.2% |
| 90 or more Minutes | 0 | 0.0% |
Commute Time by Sex in Max Meadows
The most common commute times in Max Meadows are 45 to 59 minutes (75 commuters, 34.7%) for males and 45 to 59 minutes (75 commuters, 32.9%) for females.
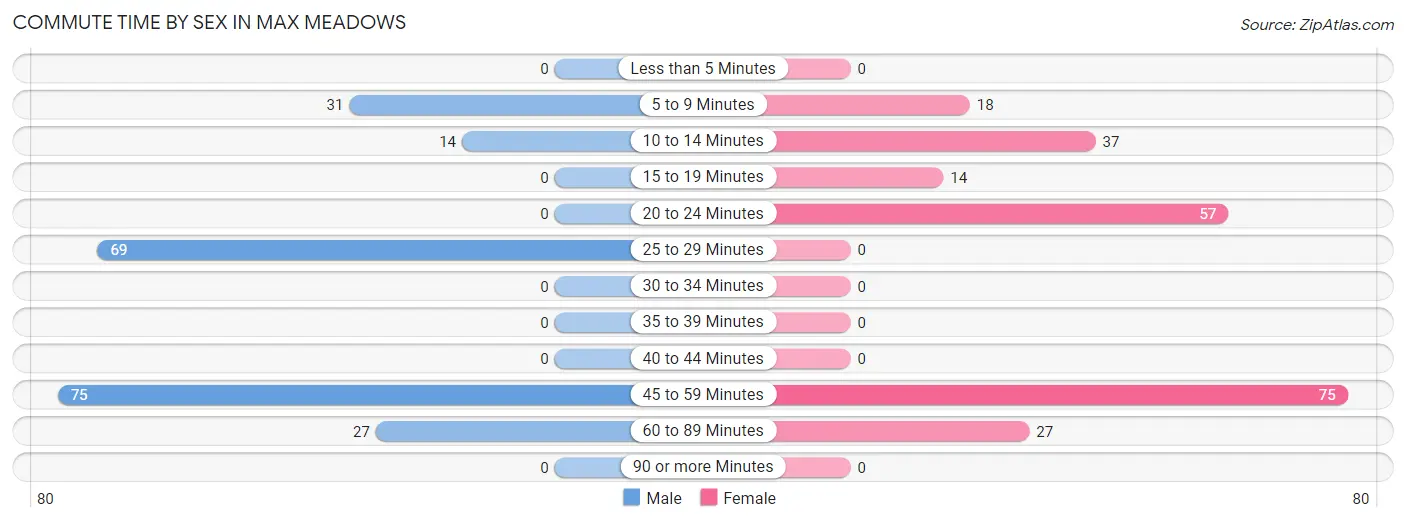
| Commute Time | Male | Female |
| Less than 5 Minutes | 0 (0.0%) | 0 (0.0%) |
| 5 to 9 Minutes | 31 (14.3%) | 18 (7.9%) |
| 10 to 14 Minutes | 14 (6.5%) | 37 (16.2%) |
| 15 to 19 Minutes | 0 (0.0%) | 14 (6.1%) |
| 20 to 24 Minutes | 0 (0.0%) | 57 (25.0%) |
| 25 to 29 Minutes | 69 (31.9%) | 0 (0.0%) |
| 30 to 34 Minutes | 0 (0.0%) | 0 (0.0%) |
| 35 to 39 Minutes | 0 (0.0%) | 0 (0.0%) |
| 40 to 44 Minutes | 0 (0.0%) | 0 (0.0%) |
| 45 to 59 Minutes | 75 (34.7%) | 75 (32.9%) |
| 60 to 89 Minutes | 27 (12.5%) | 27 (11.8%) |
| 90 or more Minutes | 0 (0.0%) | 0 (0.0%) |
Time of Departure to Work by Sex in Max Meadows
The most frequent times of departure to work in Max Meadows are 12:00 AM to 4:59 AM (75, 34.7%) for males and 12:00 AM to 4:59 AM (75, 32.9%) for females.
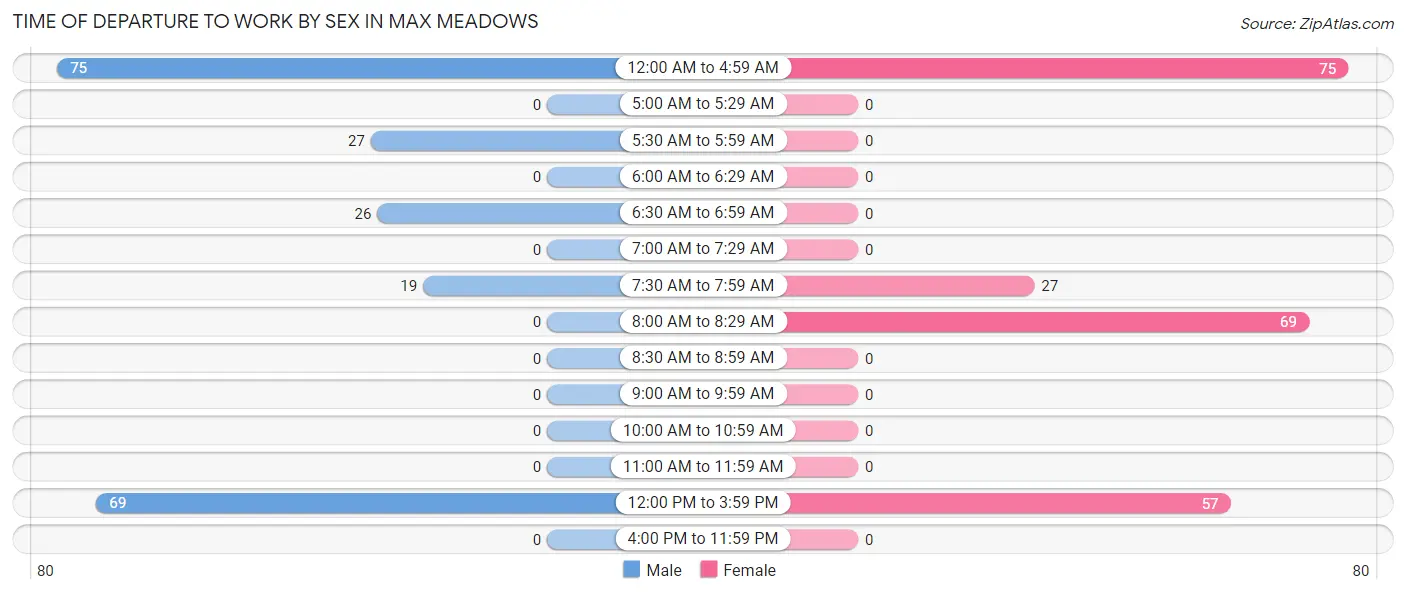
| Time of Departure | Male | Female |
| 12:00 AM to 4:59 AM | 75 (34.7%) | 75 (32.9%) |
| 5:00 AM to 5:29 AM | 0 (0.0%) | 0 (0.0%) |
| 5:30 AM to 5:59 AM | 27 (12.5%) | 0 (0.0%) |
| 6:00 AM to 6:29 AM | 0 (0.0%) | 0 (0.0%) |
| 6:30 AM to 6:59 AM | 26 (12.0%) | 0 (0.0%) |
| 7:00 AM to 7:29 AM | 0 (0.0%) | 0 (0.0%) |
| 7:30 AM to 7:59 AM | 19 (8.8%) | 27 (11.8%) |
| 8:00 AM to 8:29 AM | 0 (0.0%) | 69 (30.3%) |
| 8:30 AM to 8:59 AM | 0 (0.0%) | 0 (0.0%) |
| 9:00 AM to 9:59 AM | 0 (0.0%) | 0 (0.0%) |
| 10:00 AM to 10:59 AM | 0 (0.0%) | 0 (0.0%) |
| 11:00 AM to 11:59 AM | 0 (0.0%) | 0 (0.0%) |
| 12:00 PM to 3:59 PM | 69 (31.9%) | 57 (25.0%) |
| 4:00 PM to 11:59 PM | 0 (0.0%) | 0 (0.0%) |
| Total | 216 (100.0%) | 228 (100.0%) |
Housing Occupancy in Max Meadows
Occupancy by Ownership in Max Meadows
Of the total 205 dwellings in Max Meadows, owner-occupied units account for 205 (100.0%), while renter-occupied units make up 0 (0.0%).
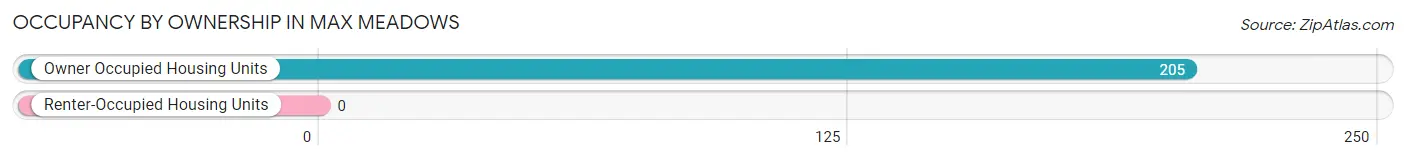
| Occupancy | # Housing Units | % Housing Units |
| Owner Occupied Housing Units | 205 | 100.0% |
| Renter-Occupied Housing Units | 0 | 0.0% |
| Total Occupied Housing Units | 205 | 100.0% |
Occupancy by Household Size in Max Meadows
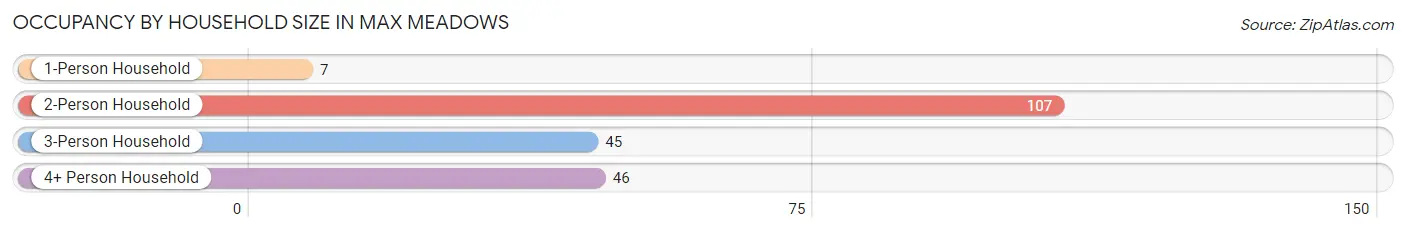
| Household Size | # Housing Units | % Housing Units |
| 1-Person Household | 7 | 3.4% |
| 2-Person Household | 107 | 52.2% |
| 3-Person Household | 45 | 22.0% |
| 4+ Person Household | 46 | 22.4% |
| Total Housing Units | 205 | 100.0% |
Occupancy by Ownership by Household Size in Max Meadows
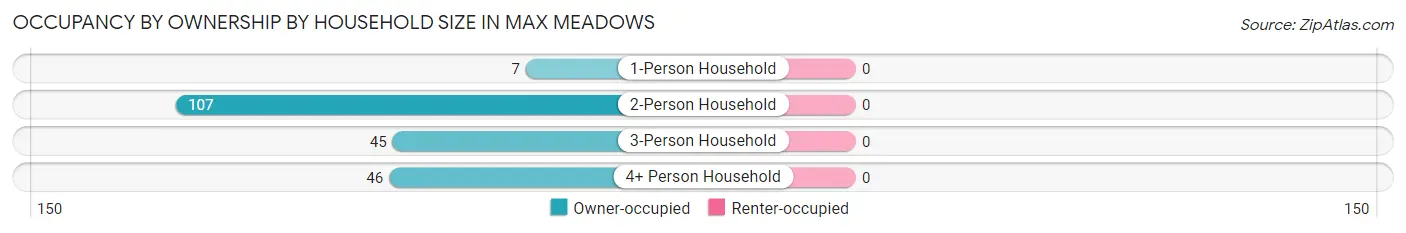
| Household Size | Owner-occupied | Renter-occupied |
| 1-Person Household | 7 (100.0%) | 0 (0.0%) |
| 2-Person Household | 107 (100.0%) | 0 (0.0%) |
| 3-Person Household | 45 (100.0%) | 0 (0.0%) |
| 4+ Person Household | 46 (100.0%) | 0 (0.0%) |
| Total Housing Units | 205 (100.0%) | 0 (0.0%) |
Occupancy by Educational Attainment in Max Meadows
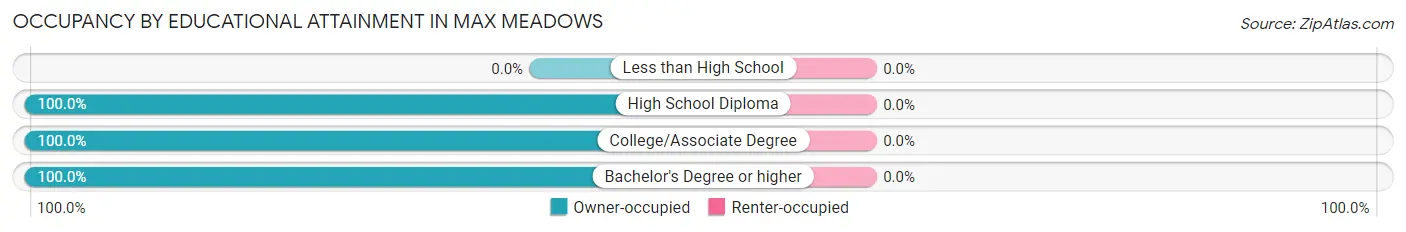
| Household Size | Owner-occupied | Renter-occupied |
| Less than High School | 0 (0.0%) | 0 (0.0%) |
| High School Diploma | 135 (100.0%) | 0 (0.0%) |
| College/Associate Degree | 39 (100.0%) | 0 (0.0%) |
| Bachelor's Degree or higher | 31 (100.0%) | 0 (0.0%) |
Occupancy by Age of Householder in Max Meadows
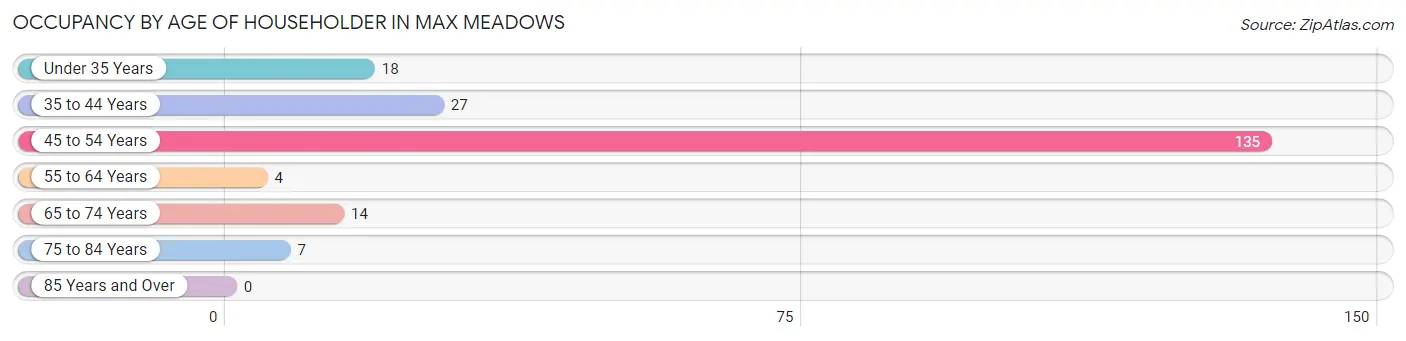
| Age Bracket | # Households | % Households |
| Under 35 Years | 18 | 8.8% |
| 35 to 44 Years | 27 | 13.2% |
| 45 to 54 Years | 135 | 65.8% |
| 55 to 64 Years | 4 | 1.9% |
| 65 to 74 Years | 14 | 6.8% |
| 75 to 84 Years | 7 | 3.4% |
| 85 Years and Over | 0 | 0.0% |
| Total | 205 | 100.0% |
Housing Finances in Max Meadows
Median Income by Occupancy in Max Meadows
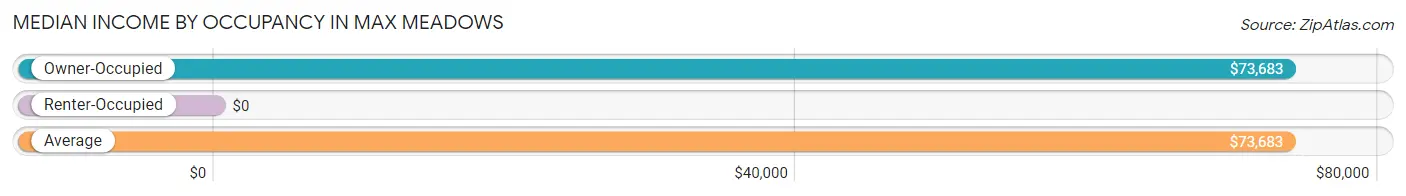
| Occupancy Type | # Households | Median Income |
| Owner-Occupied | 205 (100.0%) | $73,683 |
| Renter-Occupied | 0 (0.0%) | $0 |
| Average | 205 (100.0%) | $73,683 |
Occupancy by Householder Income Bracket in Max Meadows
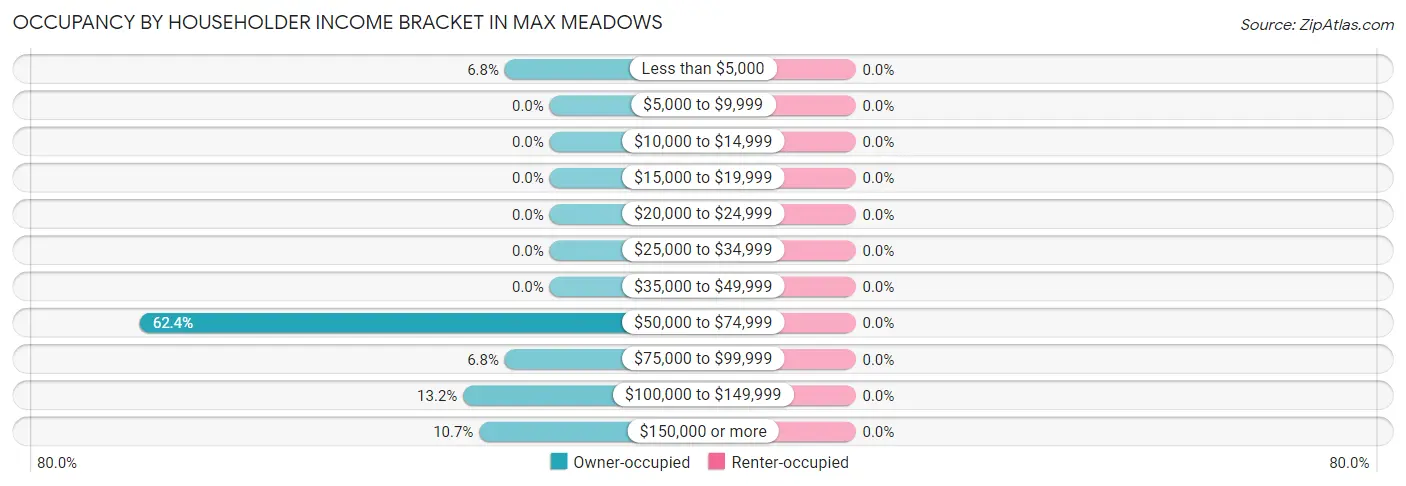
| Income Bracket | Owner-occupied | Renter-occupied |
| Less than $5,000 | 14 (6.8%) | 0 (0.0%) |
| $5,000 to $9,999 | 0 (0.0%) | 0 (0.0%) |
| $10,000 to $14,999 | 0 (0.0%) | 0 (0.0%) |
| $15,000 to $19,999 | 0 (0.0%) | 0 (0.0%) |
| $20,000 to $24,999 | 0 (0.0%) | 0 (0.0%) |
| $25,000 to $34,999 | 0 (0.0%) | 0 (0.0%) |
| $35,000 to $49,999 | 0 (0.0%) | 0 (0.0%) |
| $50,000 to $74,999 | 128 (62.4%) | 0 (0.0%) |
| $75,000 to $99,999 | 14 (6.8%) | 0 (0.0%) |
| $100,000 to $149,999 | 27 (13.2%) | 0 (0.0%) |
| $150,000 or more | 22 (10.7%) | 0 (0.0%) |
| Total | 205 (100.0%) | 0 (0.0%) |
Monthly Housing Cost Tiers in Max Meadows
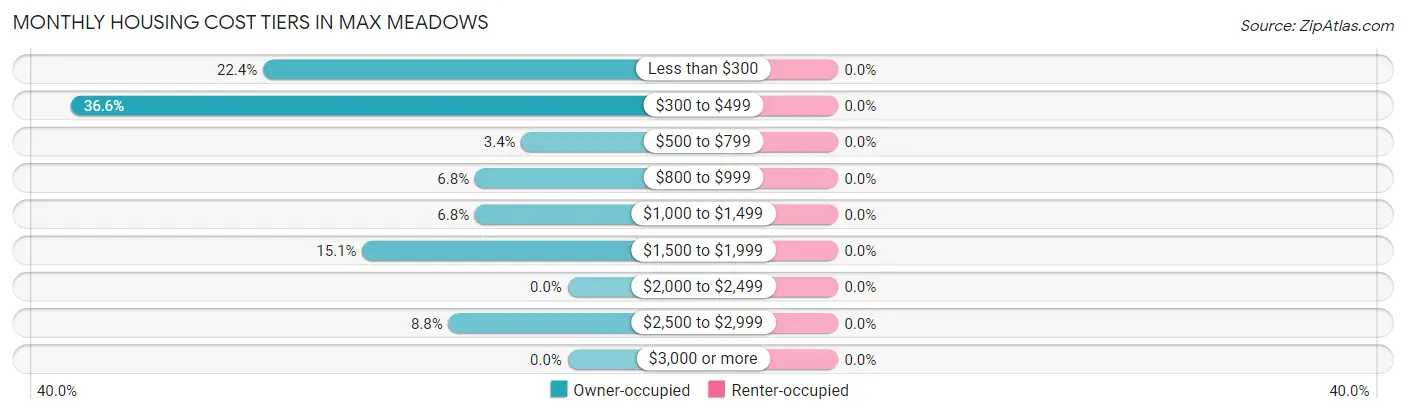
| Monthly Cost | Owner-occupied | Renter-occupied |
| Less than $300 | 46 (22.4%) | 0 (0.0%) |
| $300 to $499 | 75 (36.6%) | 0 (0.0%) |
| $500 to $799 | 7 (3.4%) | 0 (0.0%) |
| $800 to $999 | 14 (6.8%) | 0 (0.0%) |
| $1,000 to $1,499 | 14 (6.8%) | 0 (0.0%) |
| $1,500 to $1,999 | 31 (15.1%) | 0 (0.0%) |
| $2,000 to $2,499 | 0 (0.0%) | 0 (0.0%) |
| $2,500 to $2,999 | 18 (8.8%) | 0 (0.0%) |
| $3,000 or more | 0 (0.0%) | 0 (0.0%) |
| Total | 205 (100.0%) | 0 (0.0%) |
Physical Housing Characteristics in Max Meadows
Housing Structures in Max Meadows
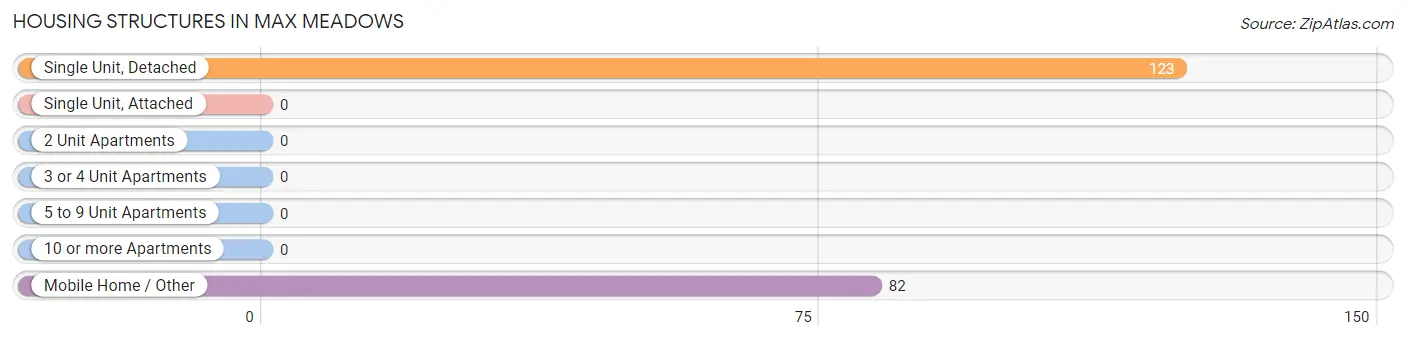
| Structure Type | # Housing Units | % Housing Units |
| Single Unit, Detached | 123 | 60.0% |
| Single Unit, Attached | 0 | 0.0% |
| 2 Unit Apartments | 0 | 0.0% |
| 3 or 4 Unit Apartments | 0 | 0.0% |
| 5 to 9 Unit Apartments | 0 | 0.0% |
| 10 or more Apartments | 0 | 0.0% |
| Mobile Home / Other | 82 | 40.0% |
| Total | 205 | 100.0% |
Housing Structures by Occupancy in Max Meadows
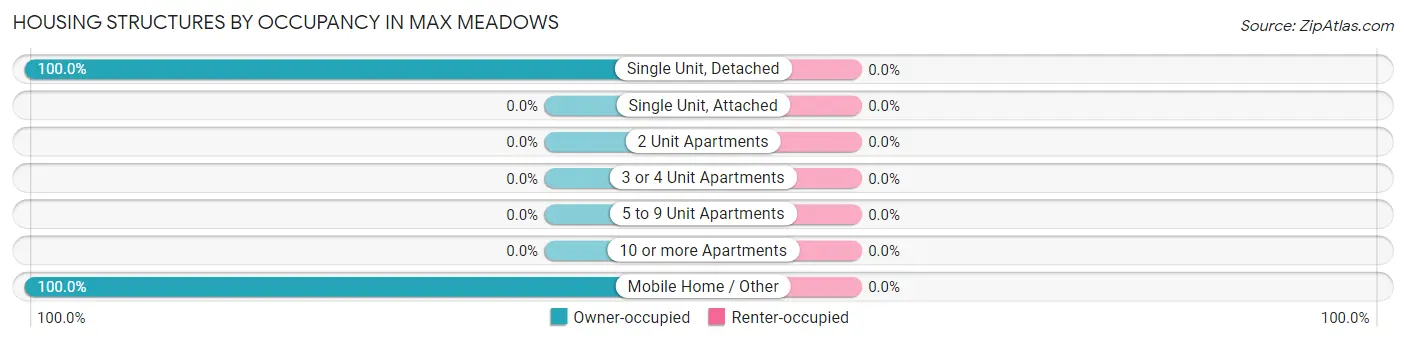
| Structure Type | Owner-occupied | Renter-occupied |
| Single Unit, Detached | 123 (100.0%) | 0 (0.0%) |
| Single Unit, Attached | 0 (0.0%) | 0 (0.0%) |
| 2 Unit Apartments | 0 (0.0%) | 0 (0.0%) |
| 3 or 4 Unit Apartments | 0 (0.0%) | 0 (0.0%) |
| 5 to 9 Unit Apartments | 0 (0.0%) | 0 (0.0%) |
| 10 or more Apartments | 0 (0.0%) | 0 (0.0%) |
| Mobile Home / Other | 82 (100.0%) | 0 (0.0%) |
| Total | 205 (100.0%) | 0 (0.0%) |
Housing Structures by Number of Rooms in Max Meadows
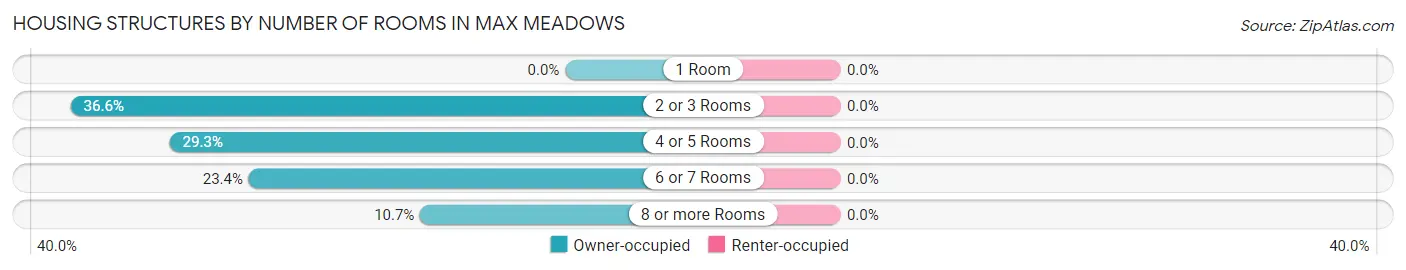
| Number of Rooms | Owner-occupied | Renter-occupied |
| 1 Room | 0 (0.0%) | 0 (0.0%) |
| 2 or 3 Rooms | 75 (36.6%) | 0 (0.0%) |
| 4 or 5 Rooms | 60 (29.3%) | 0 (0.0%) |
| 6 or 7 Rooms | 48 (23.4%) | 0 (0.0%) |
| 8 or more Rooms | 22 (10.7%) | 0 (0.0%) |
| Total | 205 (100.0%) | 0 (0.0%) |
Housing Structure by Heating Type in Max Meadows
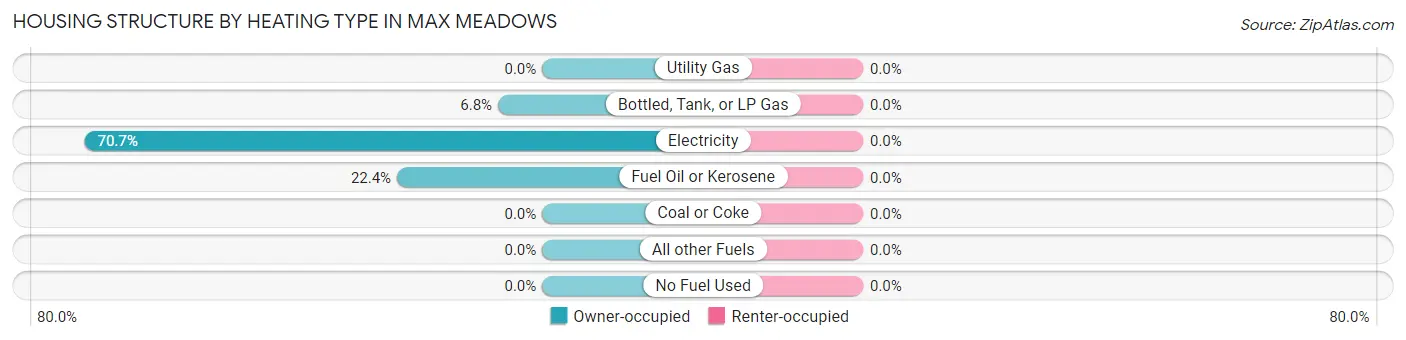
| Heating Type | Owner-occupied | Renter-occupied |
| Utility Gas | 0 (0.0%) | 0 (0.0%) |
| Bottled, Tank, or LP Gas | 14 (6.8%) | 0 (0.0%) |
| Electricity | 145 (70.7%) | 0 (0.0%) |
| Fuel Oil or Kerosene | 46 (22.4%) | 0 (0.0%) |
| Coal or Coke | 0 (0.0%) | 0 (0.0%) |
| All other Fuels | 0 (0.0%) | 0 (0.0%) |
| No Fuel Used | 0 (0.0%) | 0 (0.0%) |
| Total | 205 (100.0%) | 0 (0.0%) |
Household Vehicle Usage in Max Meadows
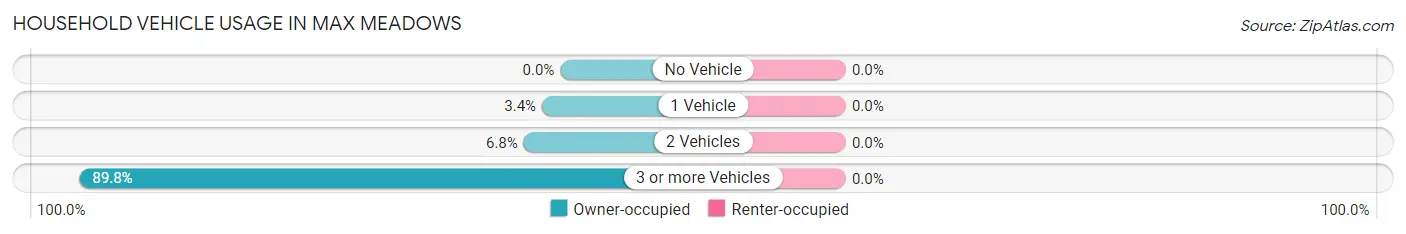
| Vehicles per Household | Owner-occupied | Renter-occupied |
| No Vehicle | 0 (0.0%) | 0 (0.0%) |
| 1 Vehicle | 7 (3.4%) | 0 (0.0%) |
| 2 Vehicles | 14 (6.8%) | 0 (0.0%) |
| 3 or more Vehicles | 184 (89.8%) | 0 (0.0%) |
| Total | 205 (100.0%) | 0 (0.0%) |
Real Estate & Mortgages in Max Meadows
Real Estate and Mortgage Overview in Max Meadows
| Characteristic | Without Mortgage | With Mortgage |
| Housing Units | 121 | 84 |
| Median Property Value | - | - |
| Median Household Income | - | - |
| Monthly Housing Costs | - | - |
| Real Estate Taxes | - | - |
Property Value by Mortgage Status in Max Meadows
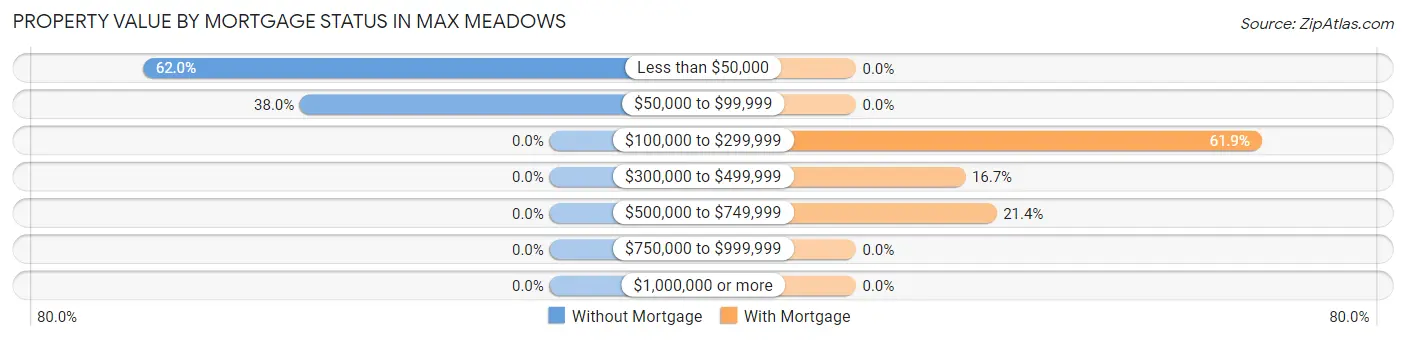
| Property Value | Without Mortgage | With Mortgage |
| Less than $50,000 | 75 (62.0%) | 0 (0.0%) |
| $50,000 to $99,999 | 46 (38.0%) | 0 (0.0%) |
| $100,000 to $299,999 | 0 (0.0%) | 52 (61.9%) |
| $300,000 to $499,999 | 0 (0.0%) | 14 (16.7%) |
| $500,000 to $749,999 | 0 (0.0%) | 18 (21.4%) |
| $750,000 to $999,999 | 0 (0.0%) | 0 (0.0%) |
| $1,000,000 or more | 0 (0.0%) | 0 (0.0%) |
| Total | 121 (100.0%) | 84 (100.0%) |
Household Income by Mortgage Status in Max Meadows
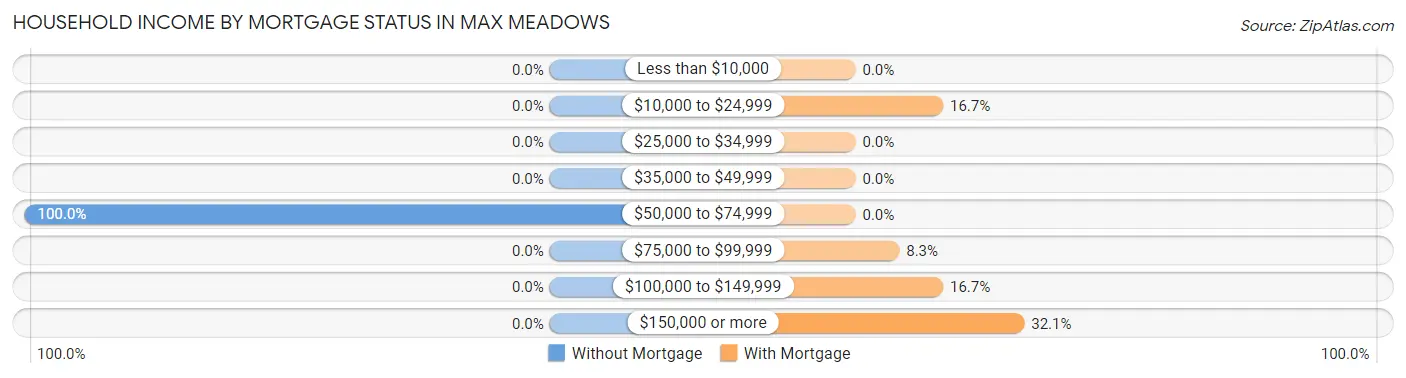
| Household Income | Without Mortgage | With Mortgage |
| Less than $10,000 | 0 (0.0%) | 0 (0.0%) |
| $10,000 to $24,999 | 0 (0.0%) | 14 (16.7%) |
| $25,000 to $34,999 | 0 (0.0%) | 0 (0.0%) |
| $35,000 to $49,999 | 0 (0.0%) | 0 (0.0%) |
| $50,000 to $74,999 | 121 (100.0%) | 0 (0.0%) |
| $75,000 to $99,999 | 0 (0.0%) | 7 (8.3%) |
| $100,000 to $149,999 | 0 (0.0%) | 14 (16.7%) |
| $150,000 or more | 0 (0.0%) | 27 (32.1%) |
| Total | 121 (100.0%) | 84 (100.0%) |
Property Value to Household Income Ratio in Max Meadows
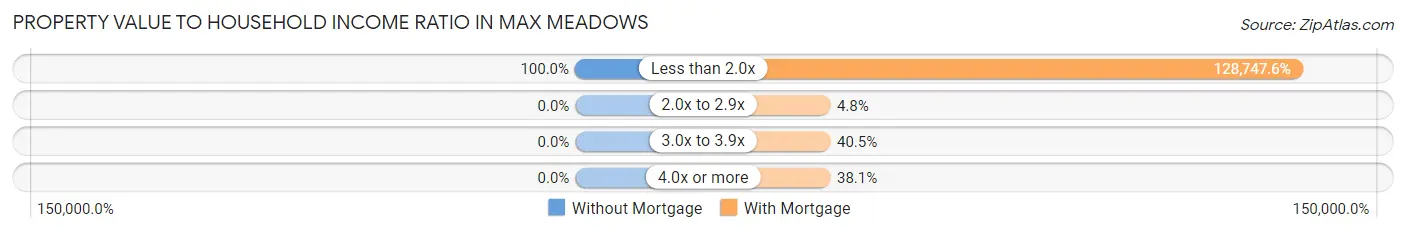
| Value-to-Income Ratio | Without Mortgage | With Mortgage |
| Less than 2.0x | 121 (100.0%) | 108,148 (128,747.6%) |
| 2.0x to 2.9x | 0 (0.0%) | 4 (4.8%) |
| 3.0x to 3.9x | 0 (0.0%) | 34 (40.5%) |
| 4.0x or more | 0 (0.0%) | 32 (38.1%) |
| Total | 121 (100.0%) | 84 (100.0%) |
Real Estate Taxes by Mortgage Status in Max Meadows
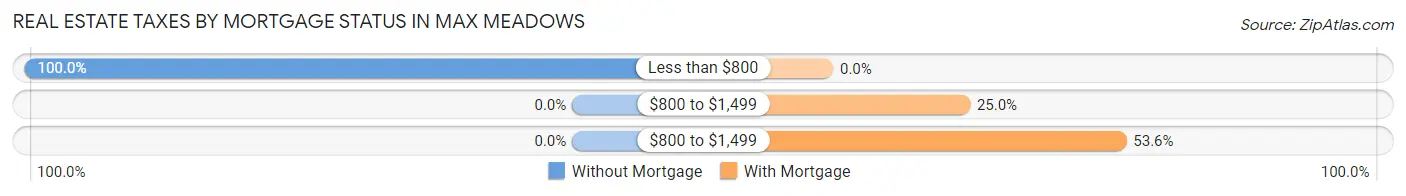
| Property Taxes | Without Mortgage | With Mortgage |
| Less than $800 | 121 (100.0%) | 0 (0.0%) |
| $800 to $1,499 | 0 (0.0%) | 21 (25.0%) |
| $800 to $1,499 | 0 (0.0%) | 45 (53.6%) |
| Total | 121 (100.0%) | 84 (100.0%) |
Health & Disability in Max Meadows
Health Insurance Coverage by Age in Max Meadows
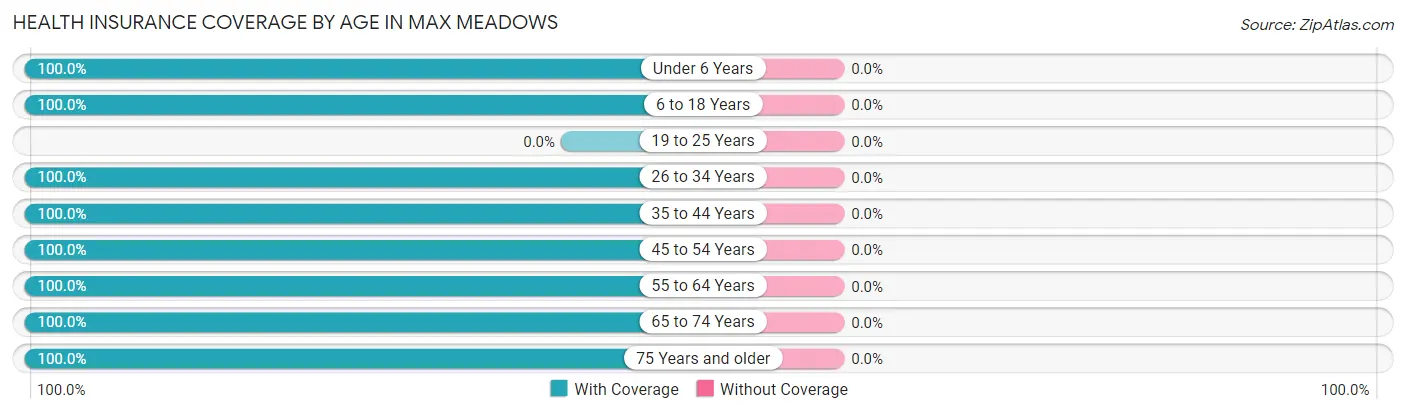
| Age Bracket | With Coverage | Without Coverage |
| Under 6 Years | 50 (100.0%) | 0 (0.0%) |
| 6 to 18 Years | 57 (100.0%) | 0 (0.0%) |
| 19 to 25 Years | 0 (0.0%) | 0 (0.0%) |
| 26 to 34 Years | 87 (100.0%) | 0 (0.0%) |
| 35 to 44 Years | 80 (100.0%) | 0 (0.0%) |
| 45 to 54 Years | 261 (100.0%) | 0 (0.0%) |
| 55 to 64 Years | 24 (100.0%) | 0 (0.0%) |
| 65 to 74 Years | 14 (100.0%) | 0 (0.0%) |
| 75 Years and older | 7 (100.0%) | 0 (0.0%) |
| Total | 580 (100.0%) | 0 (0.0%) |
Health Insurance Coverage by Citizenship Status in Max Meadows
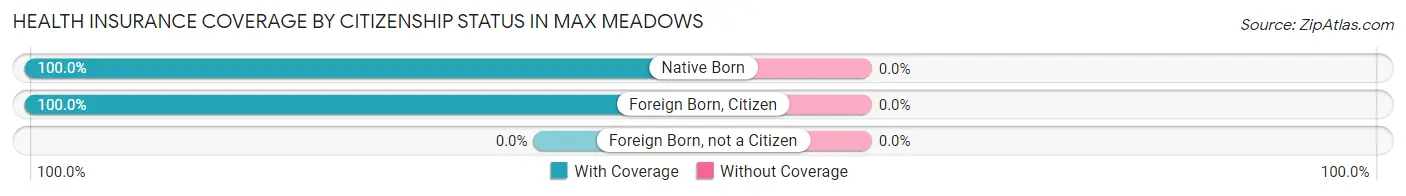
| Citizenship Status | With Coverage | Without Coverage |
| Native Born | 50 (100.0%) | 0 (0.0%) |
| Foreign Born, Citizen | 57 (100.0%) | 0 (0.0%) |
| Foreign Born, not a Citizen | 0 (0.0%) | 0 (0.0%) |
Health Insurance Coverage by Household Income in Max Meadows
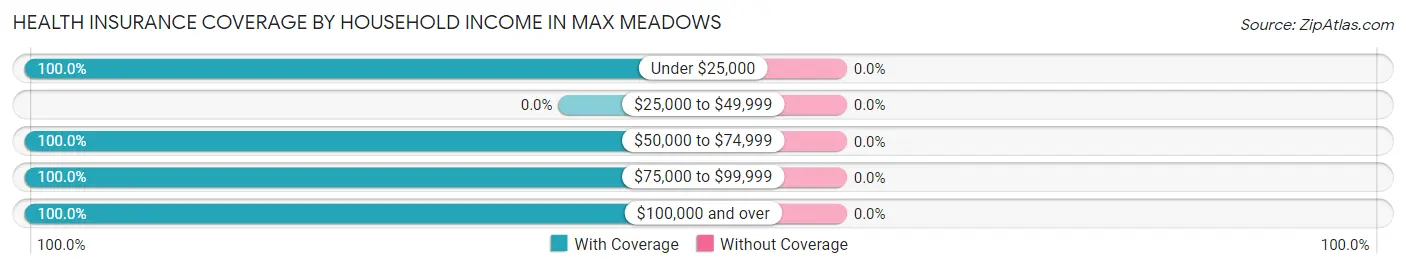
| Household Income | With Coverage | Without Coverage |
| Under $25,000 | 29 (100.0%) | 0 (0.0%) |
| $25,000 to $49,999 | 0 (0.0%) | 0 (0.0%) |
| $50,000 to $74,999 | 366 (100.0%) | 0 (0.0%) |
| $75,000 to $99,999 | 28 (100.0%) | 0 (0.0%) |
| $100,000 and over | 157 (100.0%) | 0 (0.0%) |
Public vs Private Health Insurance Coverage by Age in Max Meadows
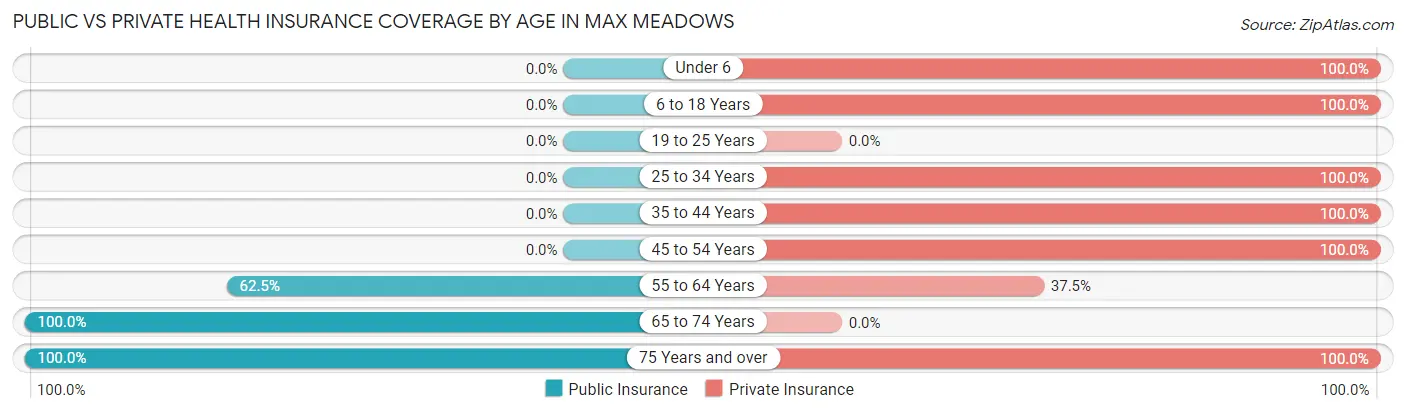
| Age Bracket | Public Insurance | Private Insurance |
| Under 6 | 0 (0.0%) | 50 (100.0%) |
| 6 to 18 Years | 0 (0.0%) | 57 (100.0%) |
| 19 to 25 Years | 0 (0.0%) | 0 (0.0%) |
| 25 to 34 Years | 0 (0.0%) | 87 (100.0%) |
| 35 to 44 Years | 0 (0.0%) | 80 (100.0%) |
| 45 to 54 Years | 0 (0.0%) | 261 (100.0%) |
| 55 to 64 Years | 15 (62.5%) | 9 (37.5%) |
| 65 to 74 Years | 14 (100.0%) | 0 (0.0%) |
| 75 Years and over | 7 (100.0%) | 7 (100.0%) |
| Total | 36 (6.2%) | 551 (95.0%) |
Disability Status by Sex by Age in Max Meadows
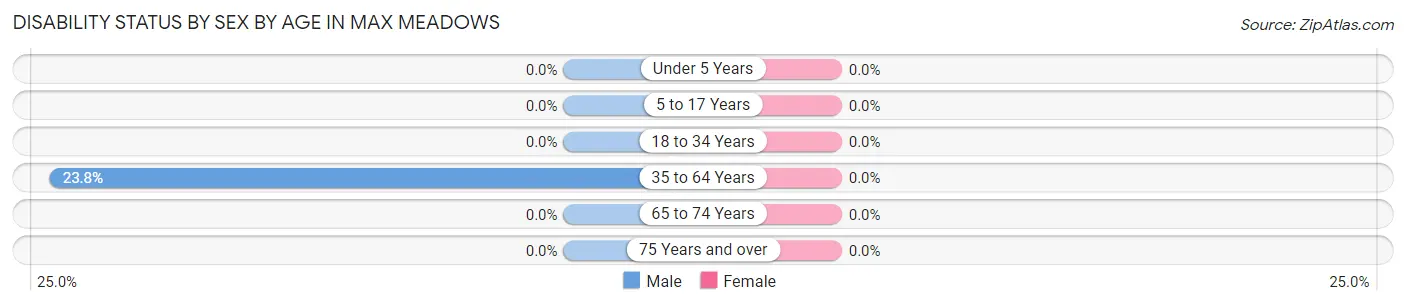
| Age Bracket | Male | Female |
| Under 5 Years | 0 (0.0%) | 0 (0.0%) |
| 5 to 17 Years | 0 (0.0%) | 0 (0.0%) |
| 18 to 34 Years | 0 (0.0%) | 0 (0.0%) |
| 35 to 64 Years | 46 (23.8%) | 0 (0.0%) |
| 65 to 74 Years | 0 (0.0%) | 0 (0.0%) |
| 75 Years and over | 0 (0.0%) | 0 (0.0%) |
Disability Class by Sex by Age in Max Meadows
Disability Class: Hearing Difficulty
| Age Bracket | Male | Female |
| Under 5 Years | 0 (0.0%) | 0 (0.0%) |
| 5 to 17 Years | 0 (0.0%) | 0 (0.0%) |
| 18 to 34 Years | 0 (0.0%) | 0 (0.0%) |
| 35 to 64 Years | 0 (0.0%) | 0 (0.0%) |
| 65 to 74 Years | 0 (0.0%) | 0 (0.0%) |
| 75 Years and over | 0 (0.0%) | 0 (0.0%) |
Disability Class: Vision Difficulty
| Age Bracket | Male | Female |
| Under 5 Years | 0 (0.0%) | 0 (0.0%) |
| 5 to 17 Years | 0 (0.0%) | 0 (0.0%) |
| 18 to 34 Years | 0 (0.0%) | 0 (0.0%) |
| 35 to 64 Years | 0 (0.0%) | 0 (0.0%) |
| 65 to 74 Years | 0 (0.0%) | 0 (0.0%) |
| 75 Years and over | 0 (0.0%) | 0 (0.0%) |
Disability Class: Cognitive Difficulty
| Age Bracket | Male | Female |
| 5 to 17 Years | 0 (0.0%) | 0 (0.0%) |
| 18 to 34 Years | 0 (0.0%) | 0 (0.0%) |
| 35 to 64 Years | 0 (0.0%) | 0 (0.0%) |
| 65 to 74 Years | 0 (0.0%) | 0 (0.0%) |
| 75 Years and over | 0 (0.0%) | 0 (0.0%) |
Disability Class: Ambulatory Difficulty
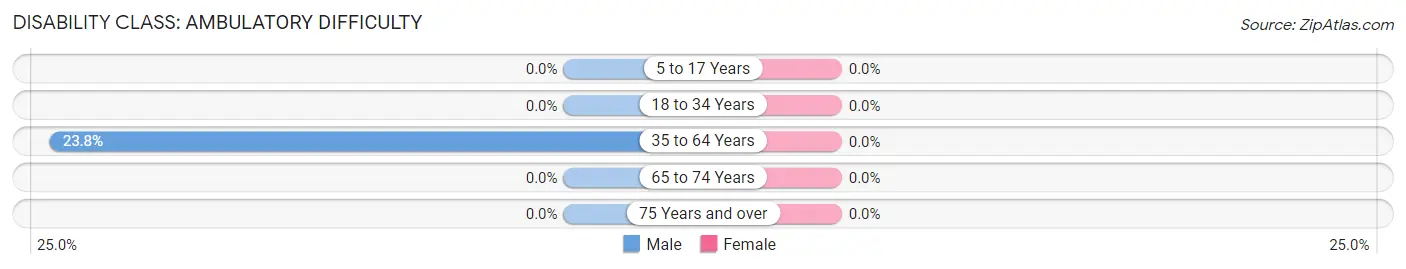
| Age Bracket | Male | Female |
| 5 to 17 Years | 0 (0.0%) | 0 (0.0%) |
| 18 to 34 Years | 0 (0.0%) | 0 (0.0%) |
| 35 to 64 Years | 46 (23.8%) | 0 (0.0%) |
| 65 to 74 Years | 0 (0.0%) | 0 (0.0%) |
| 75 Years and over | 0 (0.0%) | 0 (0.0%) |
Disability Class: Self-Care Difficulty

| Age Bracket | Male | Female |
| 5 to 17 Years | 0 (0.0%) | 0 (0.0%) |
| 18 to 34 Years | 0 (0.0%) | 0 (0.0%) |
| 35 to 64 Years | 0 (0.0%) | 0 (0.0%) |
| 65 to 74 Years | 0 (0.0%) | 0 (0.0%) |
| 75 Years and over | 0 (0.0%) | 0 (0.0%) |
Technology Access in Max Meadows
Computing Device Access in Max Meadows
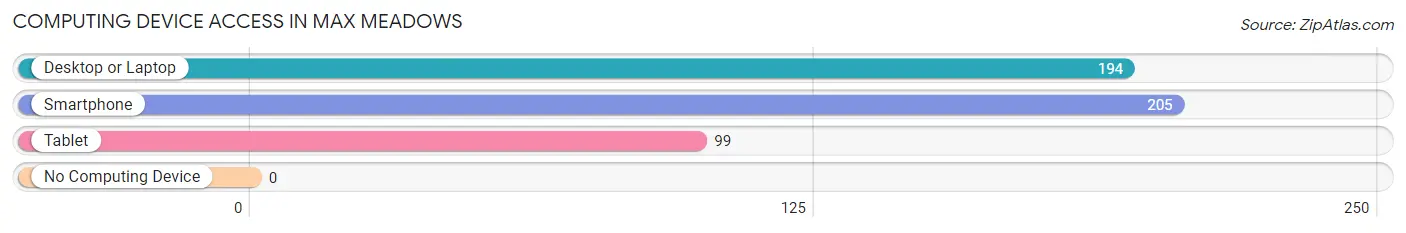
| Device Type | # Households | % Households |
| Desktop or Laptop | 194 | 94.6% |
| Smartphone | 205 | 100.0% |
| Tablet | 99 | 48.3% |
| No Computing Device | 0 | 0.0% |
| Total | 205 | 100.0% |
Internet Access in Max Meadows
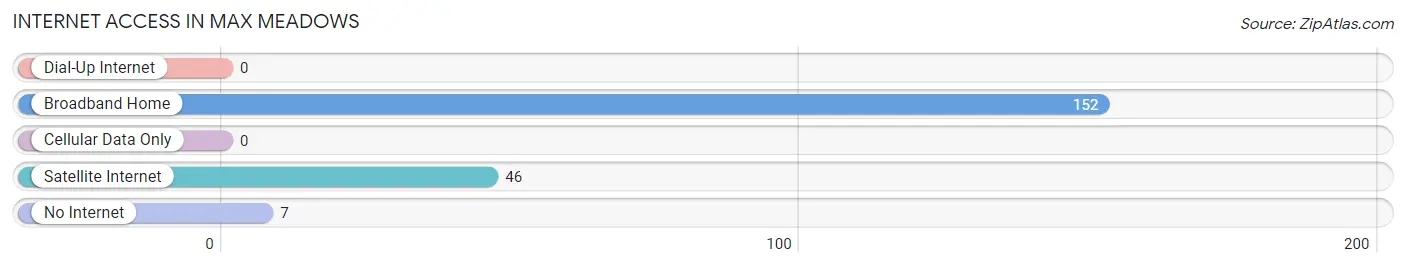
| Internet Type | # Households | % Households |
| Dial-Up Internet | 0 | 0.0% |
| Broadband Home | 152 | 74.2% |
| Cellular Data Only | 0 | 0.0% |
| Satellite Internet | 46 | 22.4% |
| No Internet | 7 | 3.4% |
| Total | 205 | 100.0% |
Max Meadows Summary
Meadows, Virginia is a small town located in the southwestern part of the state, in Wythe County. It is situated along the New River, and is surrounded by the Blue Ridge Mountains. The town has a population of approximately 1,000 people, and is known for its rural charm and small-town atmosphere.
History
Meadows, Virginia was first settled in the late 1700s by a group of settlers from Pennsylvania. The town was originally known as “Meadow’s Bottom”, and was named after the meadows that were located in the area. The town was officially incorporated in 1837, and was named after the original settlers.
In the late 1800s, Meadows became a popular destination for tourists, due to its scenic beauty and proximity to the New River. The town was also home to a number of businesses, including a hotel, a general store, and a sawmill.
Geography
Meadows, Virginia is located in the southwestern part of the state, in Wythe County. The town is situated along the New River, and is surrounded by the Blue Ridge Mountains. The town has a total area of 1.2 square miles, and is located at an elevation of 1,890 feet.
Economy
Meadows, Virginia has a small, but diverse economy. The town is home to a number of businesses, including a hotel, a general store, and a sawmill. The town is also home to a number of small farms, which produce a variety of crops, including corn, soybeans, and hay.
The town is also home to a number of manufacturing companies, which produce a variety of products, including furniture, clothing, and textiles. The town is also home to a number of service-based businesses, including restaurants, banks, and insurance companies.
Demographics
Meadows, Virginia has a population of approximately 1,000 people, as of the 2010 census. The town is predominantly white, with approximately 95% of the population being white. The town also has a small Hispanic population, with approximately 4% of the population being Hispanic. The town also has a small African American population, with approximately 1% of the population being African American.
The median household income in Meadows, Virginia is approximately $35,000, and the median home value is approximately $90,000. The town has a low unemployment rate, with approximately 4% of the population being unemployed. The town also has a low poverty rate, with approximately 8% of the population living below the poverty line.
Common Questions
What is Per Capita Income in Max Meadows?
Per Capita income in Max Meadows is $32,791.
What is the Median Family Income in Max Meadows?
Median Family Income in Max Meadows is $92,768.
What is the Median Household income in Max Meadows?
Median Household Income in Max Meadows is $73,683.
What is Inequality or Gini Index in Max Meadows?
Inequality or Gini Index in Max Meadows is 0.25.
What is the Total Population of Max Meadows?
Total Population of Max Meadows is 580.
What is the Total Male Population of Max Meadows?
Total Male Population of Max Meadows is 302.
What is the Total Female Population of Max Meadows?
Total Female Population of Max Meadows is 278.
What is the Ratio of Males per 100 Females in Max Meadows?
There are 108.63 Males per 100 Females in Max Meadows.
What is the Ratio of Females per 100 Males in Max Meadows?
There are 92.05 Females per 100 Males in Max Meadows.
What is the Median Population Age in Max Meadows?
Median Population Age in Max Meadows is 47.2 Years.
What is the Average Family Size in Max Meadows
Average Family Size in Max Meadows is 3.4 People.
What is the Average Household Size in Max Meadows
Average Household Size in Max Meadows is 2.8 People.
How Large is the Labor Force in Max Meadows?
There are 444 People in the Labor Forcein in Max Meadows.
What is the Percentage of People in the Labor Force in Max Meadows?
83.8% of People are in the Labor Force in Max Meadows.