Cherry Hill, VA Map & Demographics
Cherry Hill Map
Cherry Hill Overview
$44,281
PER CAPITA INCOME
$135,323
AVG FAMILY INCOME
$114,140
AVG HOUSEHOLD INCOME
34.8%
WAGE / INCOME GAP [ % ]
65.2¢/ $1
WAGE / INCOME GAP [ $ ]
$18,404
FAMILY INCOME DEFICIT
0.37
INEQUALITY / GINI INDEX
22,505
TOTAL POPULATION
10,176
MALE POPULATION
12,329
FEMALE POPULATION
82.54
MALES / 100 FEMALES
121.16
FEMALES / 100 MALES
32.4
MEDIAN AGE
3.8
AVG FAMILY SIZE
3.1
AVG HOUSEHOLD SIZE
13,065
LABOR FORCE [ PEOPLE ]
81.7%
PERCENT IN LABOR FORCE
5.5%
UNEMPLOYMENT RATE
Income in Cherry Hill
Income Overview in Cherry Hill
Per Capita Income in Cherry Hill is $44,281, while median incomes of families and households are $135,323 and $114,140 respectively.
| Characteristic | Number | Measure |
| Per Capita Income | 22,505 | $44,281 |
| Median Family Income | 5,067 | $135,323 |
| Mean Family Income | 5,067 | $149,408 |
| Median Household Income | 7,272 | $114,140 |
| Mean Household Income | 7,272 | $132,908 |
| Income Deficit | 5,067 | $18,404 |
| Wage / Income Gap (%) | 22,505 | 34.82% |
| Wage / Income Gap ($) | 22,505 | 65.18¢ per $1 |
| Gini / Inequality Index | 22,505 | 0.37 |
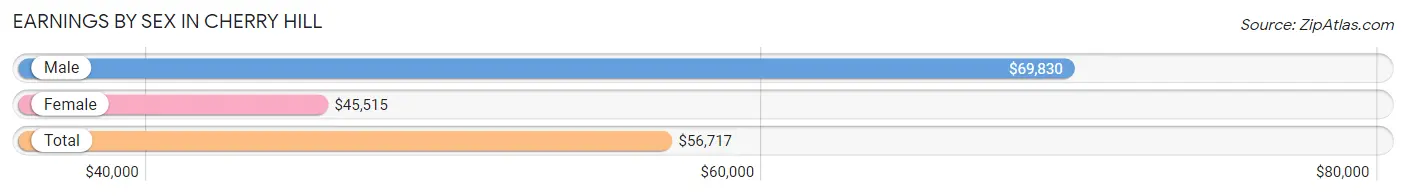
Earnings by Sex in Cherry Hill
Average Earnings in Cherry Hill are $56,717, $69,830 for men and $45,515 for women, a difference of 34.8%.
| Sex | Number | Average Earnings |
| Male | 6,368 (48.6%) | $69,830 |
| Female | 6,726 (51.4%) | $45,515 |
| Total | 13,094 (100.0%) | $56,717 |
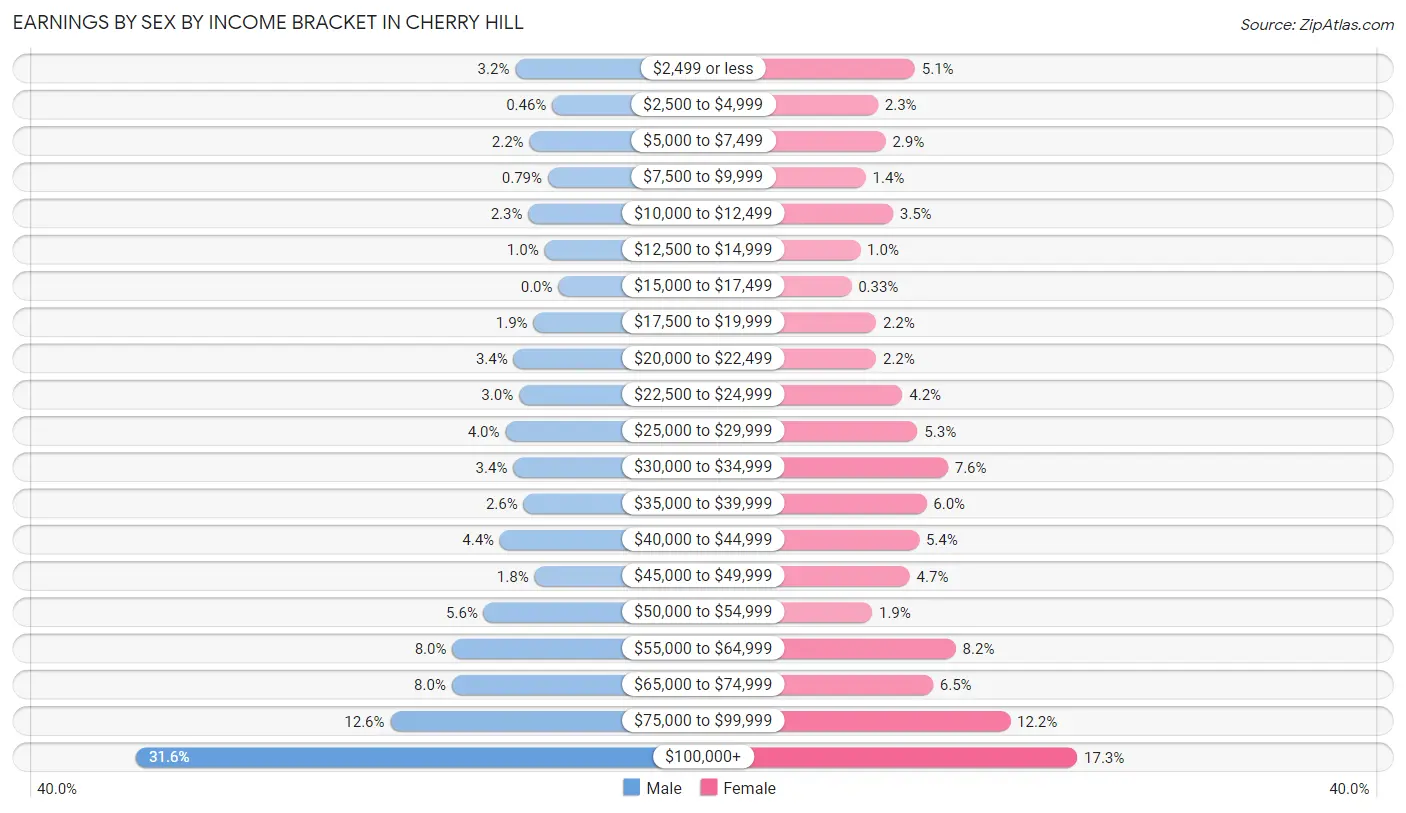
Earnings by Sex by Income Bracket in Cherry Hill
The most common earnings brackets in Cherry Hill are $100,000+ for men (2,015 | 31.6%) and $100,000+ for women (1,161 | 17.3%).
| Income | Male | Female |
| $2,499 or less | 206 (3.2%) | 343 (5.1%) |
| $2,500 to $4,999 | 29 (0.5%) | 157 (2.3%) |
| $5,000 to $7,499 | 138 (2.2%) | 195 (2.9%) |
| $7,500 to $9,999 | 50 (0.8%) | 95 (1.4%) |
| $10,000 to $12,499 | 143 (2.2%) | 232 (3.5%) |
| $12,500 to $14,999 | 66 (1.0%) | 67 (1.0%) |
| $15,000 to $17,499 | 0 (0.0%) | 22 (0.3%) |
| $17,500 to $19,999 | 119 (1.9%) | 147 (2.2%) |
| $20,000 to $22,499 | 214 (3.4%) | 147 (2.2%) |
| $22,500 to $24,999 | 188 (2.9%) | 280 (4.2%) |
| $25,000 to $29,999 | 253 (4.0%) | 356 (5.3%) |
| $30,000 to $34,999 | 215 (3.4%) | 509 (7.6%) |
| $35,000 to $39,999 | 166 (2.6%) | 401 (6.0%) |
| $40,000 to $44,999 | 279 (4.4%) | 364 (5.4%) |
| $45,000 to $49,999 | 114 (1.8%) | 317 (4.7%) |
| $50,000 to $54,999 | 356 (5.6%) | 127 (1.9%) |
| $55,000 to $64,999 | 506 (8.0%) | 549 (8.2%) |
| $65,000 to $74,999 | 509 (8.0%) | 434 (6.5%) |
| $75,000 to $99,999 | 802 (12.6%) | 823 (12.2%) |
| $100,000+ | 2,015 (31.6%) | 1,161 (17.3%) |
| Total | 6,368 (100.0%) | 6,726 (100.0%) |
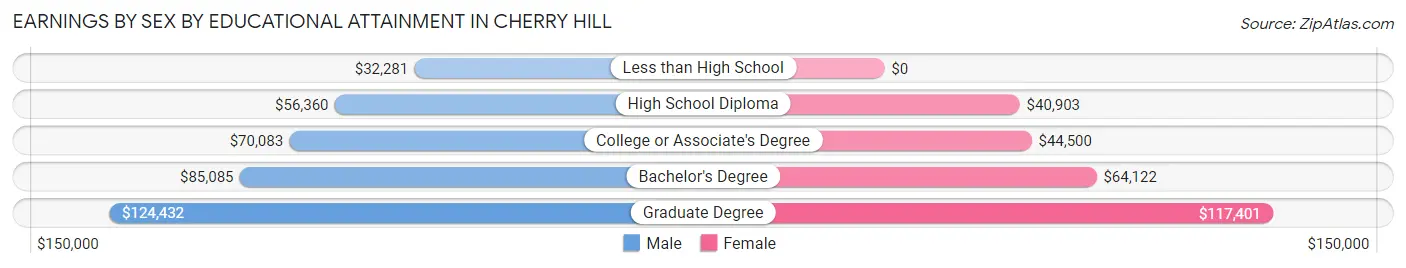
Earnings by Sex by Educational Attainment in Cherry Hill
Average earnings in Cherry Hill are $74,267 for men and $51,466 for women, a difference of 30.7%. Men with an educational attainment of graduate degree enjoy the highest average annual earnings of $124,432, while those with less than high school education earn the least with $32,281. Women with an educational attainment of graduate degree earn the most with the average annual earnings of $117,401, while those with high school diploma education have the smallest earnings of $40,903.
| Educational Attainment | Male Income | Female Income |
| Less than High School | $32,281 | $0 |
| High School Diploma | $56,360 | $40,903 |
| College or Associate's Degree | $70,083 | $44,500 |
| Bachelor's Degree | $85,085 | $64,122 |
| Graduate Degree | $124,432 | $117,401 |
| Total | $74,267 | $51,466 |
Family Income in Cherry Hill
Family Income Brackets in Cherry Hill
According to the Cherry Hill family income data, there are 1,388 families falling into the $200,000+ income range, which is the most common income bracket and makes up 27.4% of all families. Conversely, the $15,000 to $24,999 income bracket is the least frequent group with only 30 families (0.6%) belonging to this category.
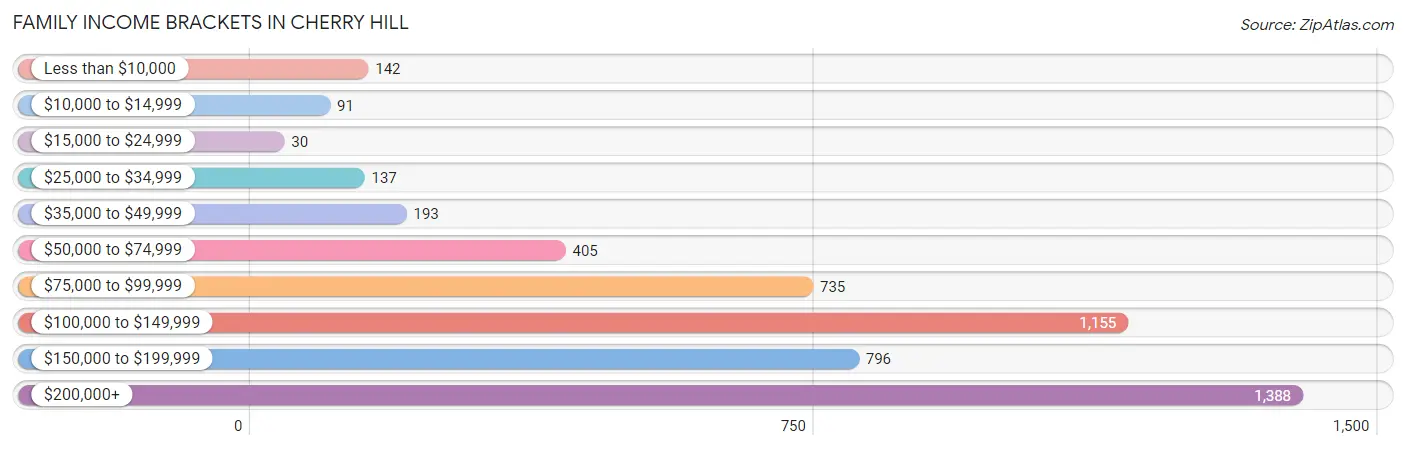
| Income Bracket | # Families | % Families |
| Less than $10,000 | 142 | 2.8% |
| $10,000 to $14,999 | 91 | 1.8% |
| $15,000 to $24,999 | 30 | 0.6% |
| $25,000 to $34,999 | 137 | 2.7% |
| $35,000 to $49,999 | 193 | 3.8% |
| $50,000 to $74,999 | 405 | 8.0% |
| $75,000 to $99,999 | 735 | 14.5% |
| $100,000 to $149,999 | 1,155 | 22.8% |
| $150,000 to $199,999 | 796 | 15.7% |
| $200,000+ | 1,388 | 27.4% |
Family Income by Famaliy Size in Cherry Hill
2-person families (1,070 | 21.1%) account for the highest median family income in Cherry Hill with $142,045 per family, while 2-person families (1,070 | 21.1%) have the highest median income of $71,022 per family member.
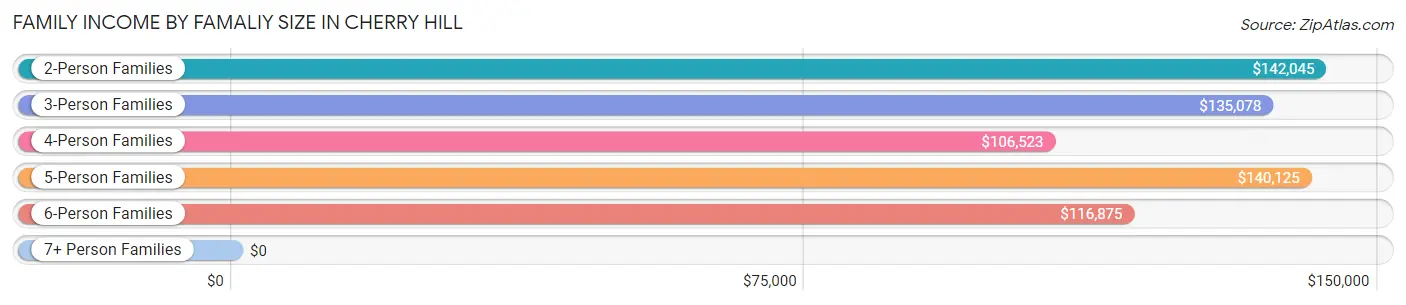
| Income Bracket | # Families | Median Income |
| 2-Person Families | 1,070 (21.1%) | $142,045 |
| 3-Person Families | 1,579 (31.2%) | $135,078 |
| 4-Person Families | 1,357 (26.8%) | $106,523 |
| 5-Person Families | 690 (13.6%) | $140,125 |
| 6-Person Families | 309 (6.1%) | $116,875 |
| 7+ Person Families | 62 (1.2%) | $0 |
| Total | 5,067 (100.0%) | $135,323 |
Family Income by Number of Earners in Cherry Hill
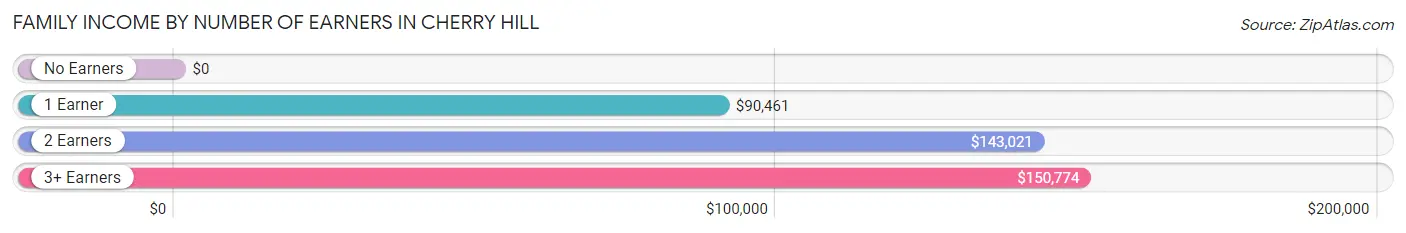
| Number of Earners | # Families | Median Income |
| No Earners | 124 (2.5%) | $0 |
| 1 Earner | 1,179 (23.3%) | $90,461 |
| 2 Earners | 2,804 (55.3%) | $143,021 |
| 3+ Earners | 960 (19.0%) | $150,774 |
| Total | 5,067 (100.0%) | $135,323 |
Household Income in Cherry Hill
Household Income Brackets in Cherry Hill
With 1,651 households falling in the category, the $200,000+ income range is the most frequent in Cherry Hill, accounting for 22.7% of all households. In contrast, only 153 households (2.1%) fall into the $10,000 to $14,999 income bracket, making it the least populous group.
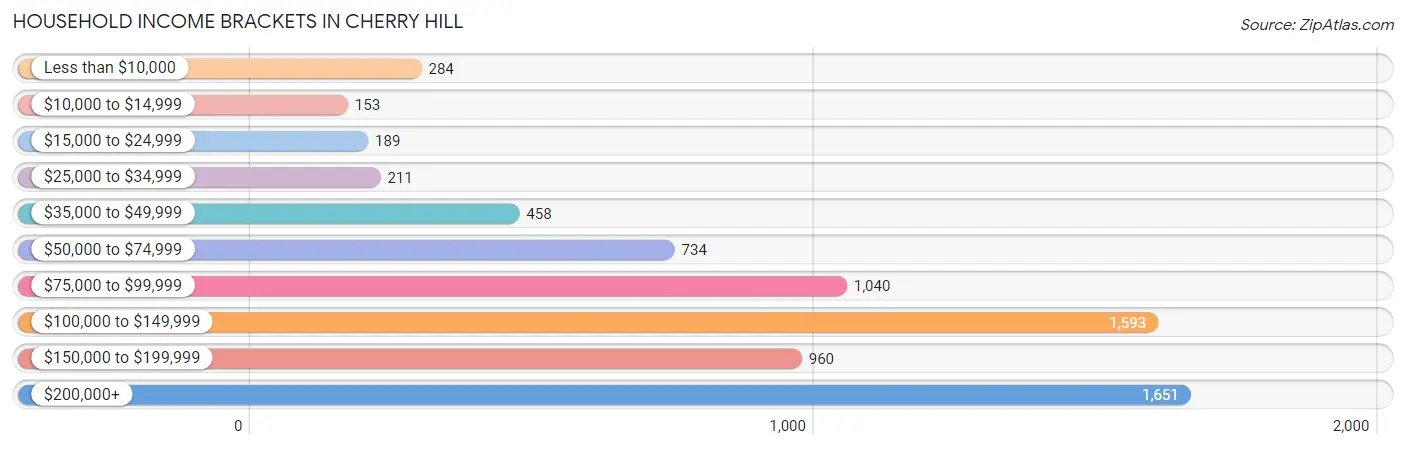
| Income Bracket | # Households | % Households |
| Less than $10,000 | 284 | 3.9% |
| $10,000 to $14,999 | 153 | 2.1% |
| $15,000 to $24,999 | 189 | 2.6% |
| $25,000 to $34,999 | 211 | 2.9% |
| $35,000 to $49,999 | 458 | 6.3% |
| $50,000 to $74,999 | 734 | 10.1% |
| $75,000 to $99,999 | 1,040 | 14.3% |
| $100,000 to $149,999 | 1,593 | 21.9% |
| $150,000 to $199,999 | 960 | 13.2% |
| $200,000+ | 1,651 | 22.7% |
Household Income by Householder Age in Cherry Hill
The median household income in Cherry Hill is $114,140, with the highest median household income of $143,611 found in the 45 to 64 years age bracket for the primary householder. A total of 3,118 households (42.9%) fall into this category. Meanwhile, the 15 to 24 years age bracket for the primary householder has the lowest median household income of $37,804, with 262 households (3.6%) in this group.
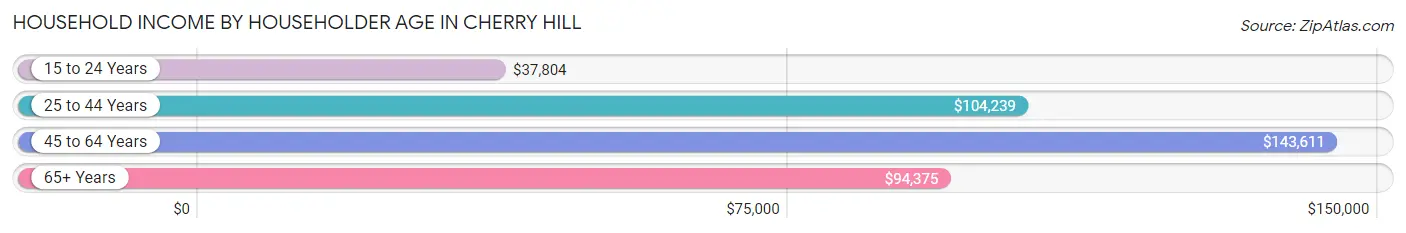
| Income Bracket | # Households | Median Income |
| 15 to 24 Years | 262 (3.6%) | $37,804 |
| 25 to 44 Years | 3,419 (47.0%) | $104,239 |
| 45 to 64 Years | 3,118 (42.9%) | $143,611 |
| 65+ Years | 473 (6.5%) | $94,375 |
| Total | 7,272 (100.0%) | $114,140 |
Poverty in Cherry Hill
Income Below Poverty by Sex and Age in Cherry Hill
With 7.4% poverty level for males and 8.1% for females among the residents of Cherry Hill, 75 year old and over males and 16 and 17 year old females are the most vulnerable to poverty, with 19 males (26.0%) and 86 females (32.1%) in their respective age groups living below the poverty level.
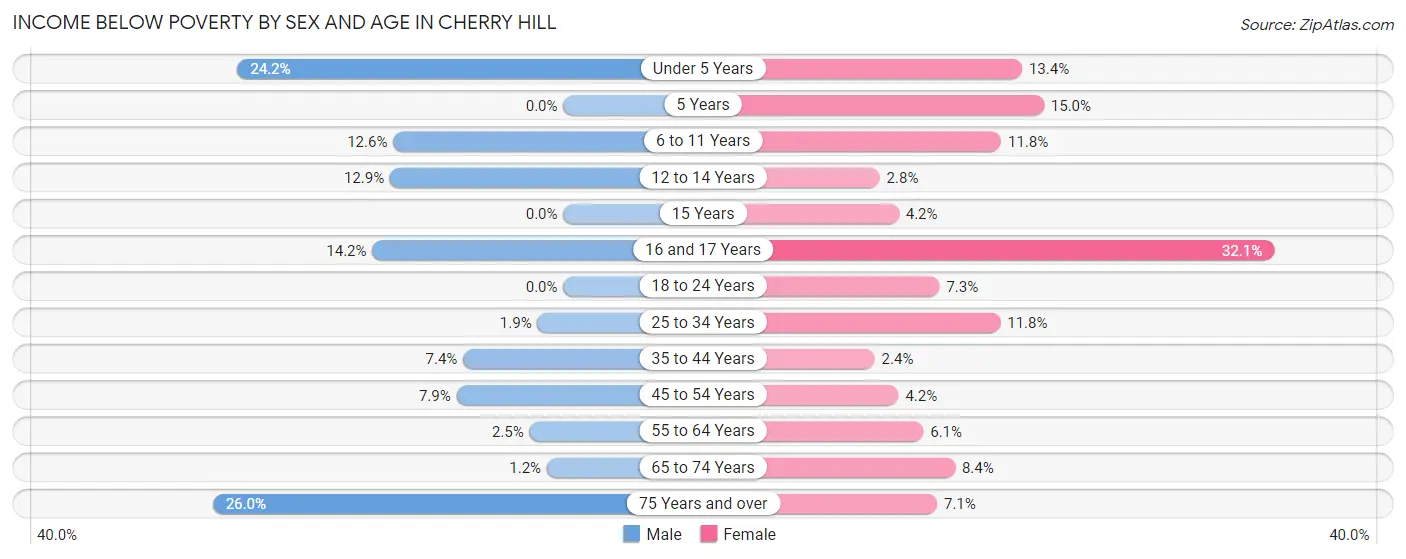
| Age Bracket | Male | Female |
| Under 5 Years | 166 (24.2%) | 139 (13.4%) |
| 5 Years | 0 (0.0%) | 9 (15.0%) |
| 6 to 11 Years | 176 (12.6%) | 197 (11.8%) |
| 12 to 14 Years | 57 (12.9%) | 15 (2.8%) |
| 15 Years | 0 (0.0%) | 11 (4.2%) |
| 16 and 17 Years | 37 (14.2%) | 86 (32.1%) |
| 18 to 24 Years | 0 (0.0%) | 70 (7.2%) |
| 25 to 34 Years | 36 (1.9%) | 215 (11.8%) |
| 35 to 44 Years | 129 (7.4%) | 50 (2.4%) |
| 45 to 54 Years | 105 (7.9%) | 68 (4.2%) |
| 55 to 64 Years | 27 (2.5%) | 74 (6.0%) |
| 65 to 74 Years | 4 (1.2%) | 49 (8.4%) |
| 75 Years and over | 19 (26.0%) | 13 (7.1%) |
| Total | 756 (7.4%) | 996 (8.1%) |
Income Above Poverty by Sex and Age in Cherry Hill
According to the poverty statistics in Cherry Hill, males aged 5 years and females aged 35 to 44 years are the age groups that are most secure financially, with 100.0% of males and 97.6% of females in these age groups living above the poverty line.
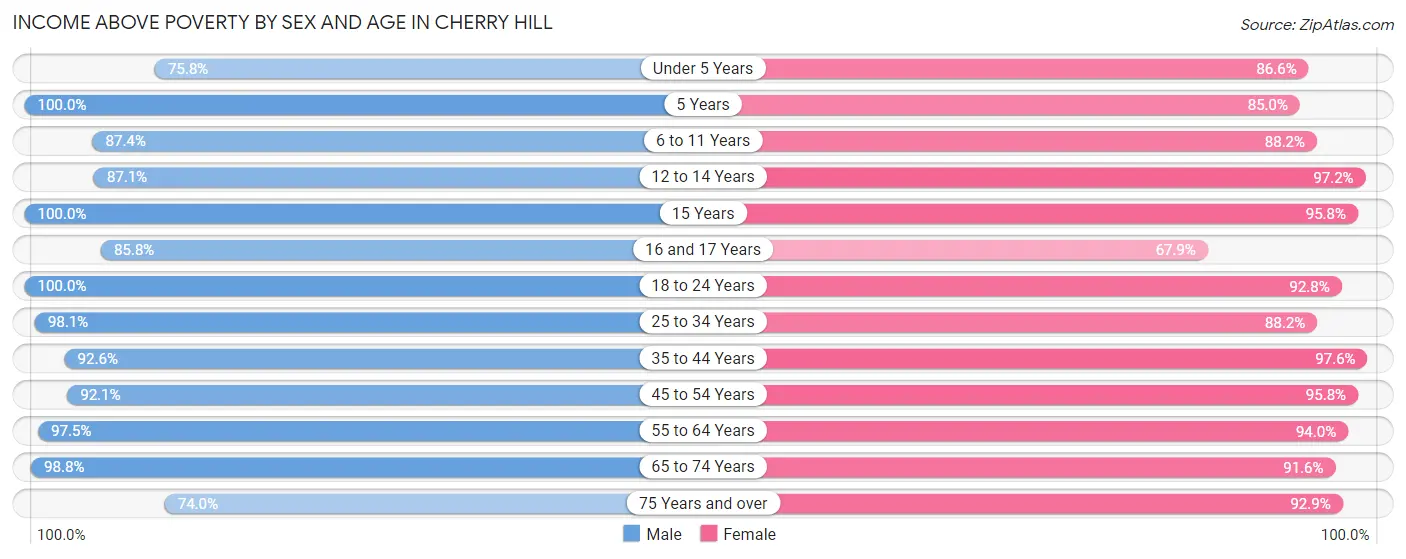
| Age Bracket | Male | Female |
| Under 5 Years | 520 (75.8%) | 900 (86.6%) |
| 5 Years | 164 (100.0%) | 51 (85.0%) |
| 6 to 11 Years | 1,217 (87.4%) | 1,468 (88.2%) |
| 12 to 14 Years | 386 (87.1%) | 519 (97.2%) |
| 15 Years | 216 (100.0%) | 249 (95.8%) |
| 16 and 17 Years | 224 (85.8%) | 182 (67.9%) |
| 18 to 24 Years | 602 (100.0%) | 895 (92.7%) |
| 25 to 34 Years | 1,840 (98.1%) | 1,612 (88.2%) |
| 35 to 44 Years | 1,606 (92.6%) | 2,003 (97.6%) |
| 45 to 54 Years | 1,219 (92.1%) | 1,547 (95.8%) |
| 55 to 64 Years | 1,049 (97.5%) | 1,149 (94.0%) |
| 65 to 74 Years | 323 (98.8%) | 534 (91.6%) |
| 75 Years and over | 54 (74.0%) | 171 (92.9%) |
| Total | 9,420 (92.6%) | 11,280 (91.9%) |
Income Below Poverty Among Married-Couple Families in Cherry Hill
The poverty statistics for married-couple families in Cherry Hill show that 4.8% or 163 of the total 3,389 families live below the poverty line. Families with 3 or 4 children have the highest poverty rate of 27.3%, comprising of 123 families. On the other hand, families with 5 or more children have the lowest poverty rate of 0.0%, which includes 0 families.
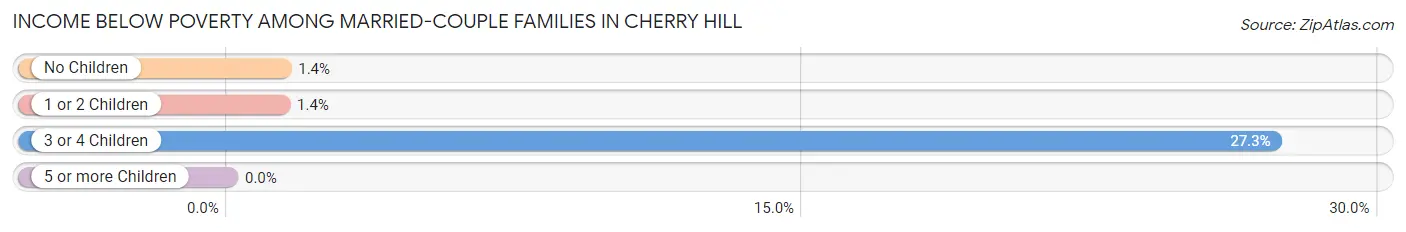
| Children | Above Poverty | Below Poverty |
| No Children | 1,137 (98.6%) | 16 (1.4%) |
| 1 or 2 Children | 1,744 (98.6%) | 24 (1.4%) |
| 3 or 4 Children | 328 (72.7%) | 123 (27.3%) |
| 5 or more Children | 17 (100.0%) | 0 (0.0%) |
| Total | 3,226 (95.2%) | 163 (4.8%) |
Income Below Poverty Among Single-Parent Households in Cherry Hill
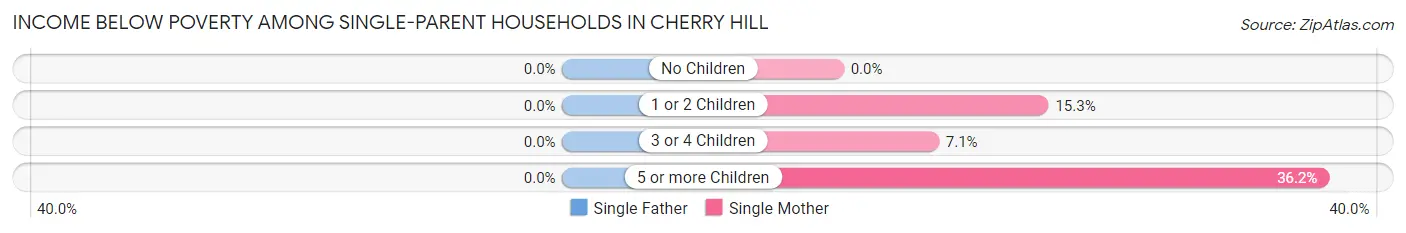
| Children | Single Father | Single Mother |
| No Children | 0 (0.0%) | 0 (0.0%) |
| 1 or 2 Children | 0 (0.0%) | 123 (15.3%) |
| 3 or 4 Children | 0 (0.0%) | 9 (7.1%) |
| 5 or more Children | 0 (0.0%) | 17 (36.2%) |
| Total | 0 (0.0%) | 149 (12.4%) |
Income Below Poverty Among Married-Couple vs Single-Parent Households in Cherry Hill
The poverty data for Cherry Hill shows that 163 of the married-couple family households (4.8%) and 149 of the single-parent households (8.9%) are living below the poverty level. Within the married-couple family households, those with 3 or 4 children have the highest poverty rate, with 123 households (27.3%) falling below the poverty line. Among the single-parent households, those with 5 or more children have the highest poverty rate, with 17 household (36.2%) living below poverty.
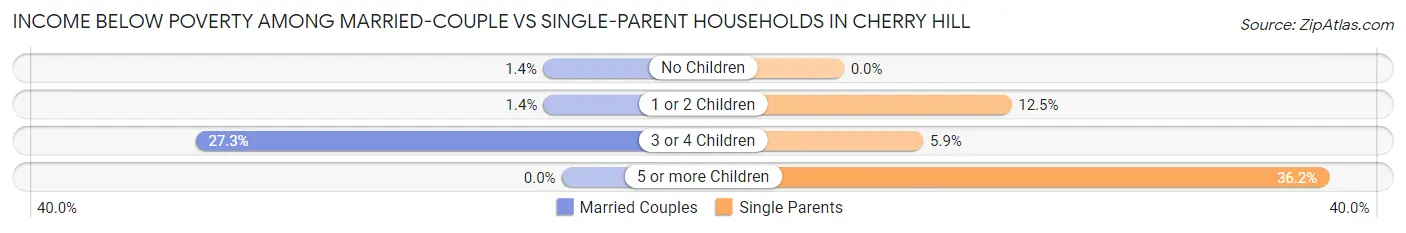
| Children | Married-Couple Families | Single-Parent Households |
| No Children | 16 (1.4%) | 0 (0.0%) |
| 1 or 2 Children | 24 (1.4%) | 123 (12.5%) |
| 3 or 4 Children | 123 (27.3%) | 9 (5.9%) |
| 5 or more Children | 0 (0.0%) | 17 (36.2%) |
| Total | 163 (4.8%) | 149 (8.9%) |
Race in Cherry Hill
The most populous races in Cherry Hill are Black / African American (11,544 | 51.3%), White / Caucasian (5,583 | 24.8%), and Hispanic or Latino (3,308 | 14.7%).
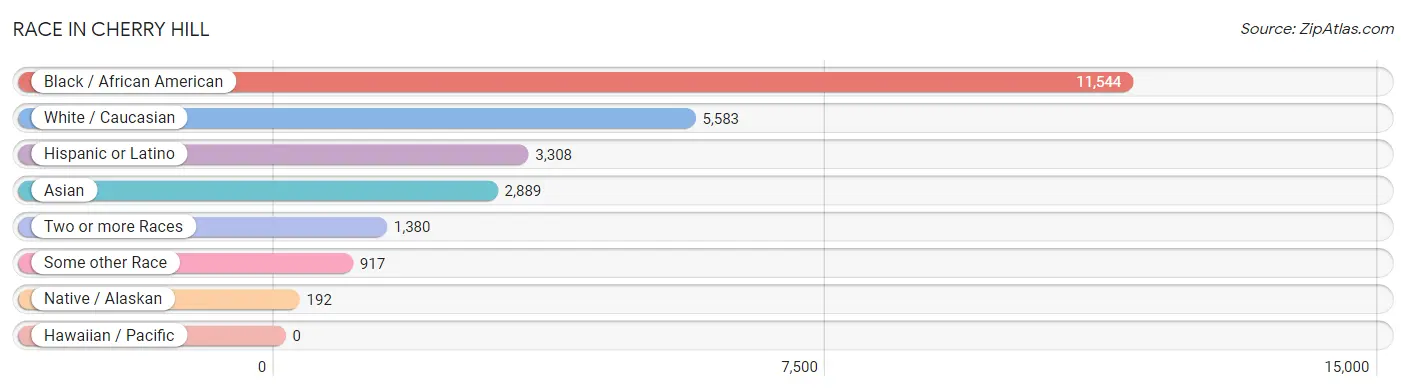
| Race | # Population | % Population |
| Asian | 2,889 | 12.8% |
| Black / African American | 11,544 | 51.3% |
| Hawaiian / Pacific | 0 | 0.0% |
| Hispanic or Latino | 3,308 | 14.7% |
| Native / Alaskan | 192 | 0.9% |
| White / Caucasian | 5,583 | 24.8% |
| Two or more Races | 1,380 | 6.1% |
| Some other Race | 917 | 4.1% |
| Total | 22,505 | 100.0% |
Ancestry in Cherry Hill
The most populous ancestries reported in Cherry Hill are Subsaharan African (2,819 | 12.5%), Ghanaian (1,351 | 6.0%), American (1,013 | 4.5%), South American (945 | 4.2%), and Central American (877 | 3.9%), together accounting for 31.1% of all Cherry Hill residents.
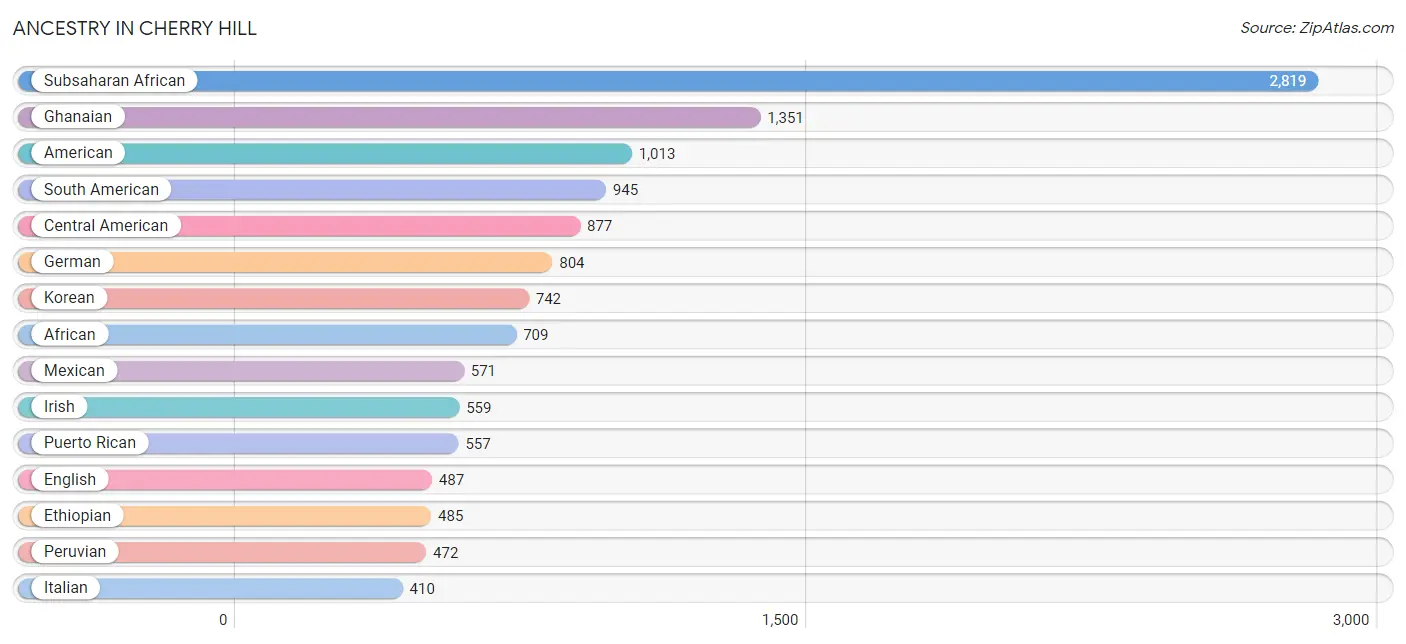
| Ancestry | # Population | % Population |
| Afghan | 104 | 0.5% |
| African | 709 | 3.2% |
| American | 1,013 | 4.5% |
| Arab | 298 | 1.3% |
| Assyrian / Chaldean / Syriac | 19 | 0.1% |
| Bhutanese | 40 | 0.2% |
| Blackfeet | 60 | 0.3% |
| Bolivian | 57 | 0.3% |
| British | 108 | 0.5% |
| British West Indian | 11 | 0.1% |
| Burmese | 145 | 0.6% |
| Central American | 877 | 3.9% |
| Central American Indian | 77 | 0.3% |
| Cherokee | 101 | 0.4% |
| Chilean | 76 | 0.3% |
| Colombian | 311 | 1.4% |
| Costa Rican | 5 | 0.0% |
| Cuban | 15 | 0.1% |
| Danish | 28 | 0.1% |
| Dominican | 260 | 1.2% |
| Dutch | 11 | 0.1% |
| Eastern European | 10 | 0.0% |
| Egyptian | 6 | 0.0% |
| English | 487 | 2.2% |
| Ethiopian | 485 | 2.2% |
| European | 110 | 0.5% |
| French | 96 | 0.4% |
| French Canadian | 27 | 0.1% |
| German | 804 | 3.6% |
| Ghanaian | 1,351 | 6.0% |
| Guatemalan | 83 | 0.4% |
| Haitian | 34 | 0.2% |
| Honduran | 178 | 0.8% |
| Hungarian | 68 | 0.3% |
| Indian (Asian) | 22 | 0.1% |
| Irish | 559 | 2.5% |
| Italian | 410 | 1.8% |
| Jamaican | 389 | 1.7% |
| Jordanian | 32 | 0.1% |
| Korean | 742 | 3.3% |
| Liberian | 61 | 0.3% |
| Lumbee | 27 | 0.1% |
| Maltese | 35 | 0.2% |
| Mexican | 571 | 2.5% |
| Moroccan | 169 | 0.7% |
| Native Hawaiian | 5 | 0.0% |
| Nicaraguan | 121 | 0.5% |
| Nigerian | 129 | 0.6% |
| Norwegian | 25 | 0.1% |
| Osage | 15 | 0.1% |
| Pakistani | 172 | 0.8% |
| Panamanian | 154 | 0.7% |
| Peruvian | 472 | 2.1% |
| Polish | 146 | 0.6% |
| Portuguese | 63 | 0.3% |
| Puerto Rican | 557 | 2.5% |
| Russian | 33 | 0.2% |
| Salvadoran | 336 | 1.5% |
| Scotch-Irish | 8 | 0.0% |
| Scottish | 113 | 0.5% |
| Sierra Leonean | 88 | 0.4% |
| Slovak | 37 | 0.2% |
| South American | 945 | 4.2% |
| South American Indian | 37 | 0.2% |
| Spaniard | 46 | 0.2% |
| Sri Lankan | 315 | 1.4% |
| Subsaharan African | 2,819 | 12.5% |
| Swedish | 90 | 0.4% |
| Swiss | 3 | 0.0% |
| Syrian | 10 | 0.0% |
| Thai | 115 | 0.5% |
| Turkish | 45 | 0.2% |
| U.S. Virgin Islander | 77 | 0.3% |
| Venezuelan | 29 | 0.1% |
| Vietnamese | 116 | 0.5% |
| Welsh | 6 | 0.0% |
| West Indian | 38 | 0.2% |
| Yugoslavian | 19 | 0.1% | View All 78 Rows |
Immigrants in Cherry Hill
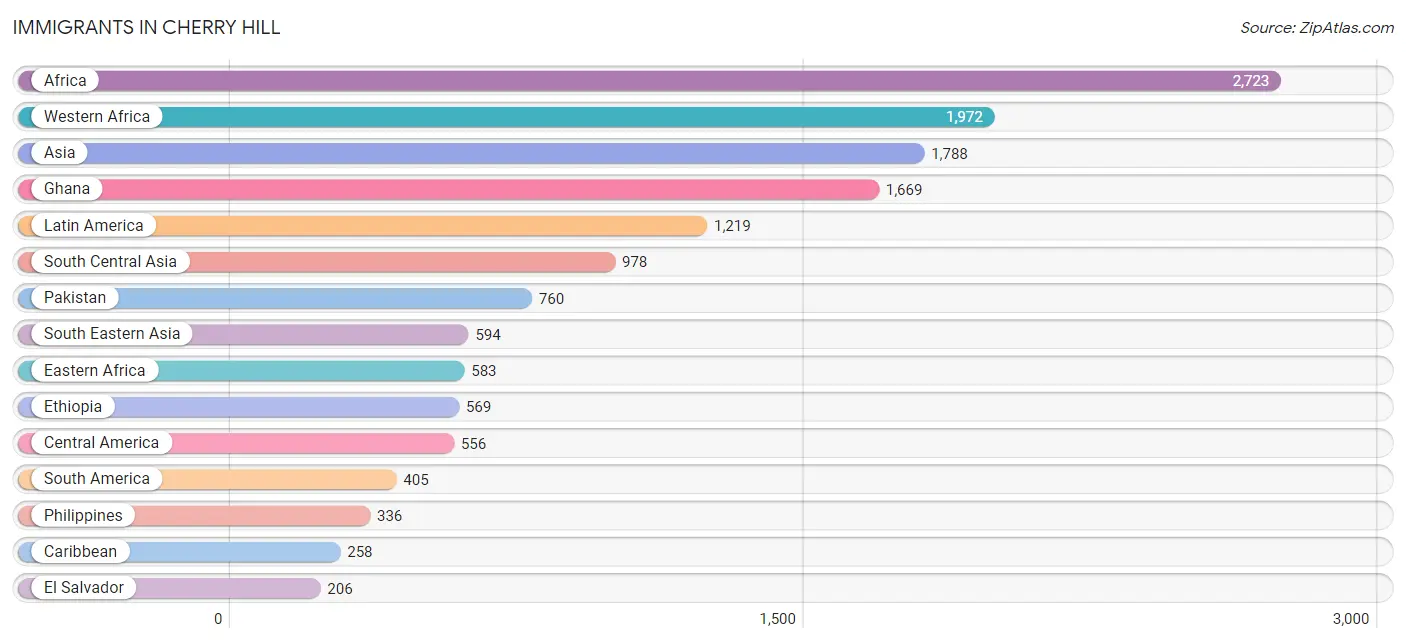
The most numerous immigrant groups reported in Cherry Hill came from Africa (2,723 | 12.1%), Western Africa (1,972 | 8.8%), Asia (1,788 | 7.9%), Ghana (1,669 | 7.4%), and Latin America (1,219 | 5.4%), together accounting for 41.6% of all Cherry Hill residents.
| Immigration Origin | # Population | % Population |
| Afghanistan | 84 | 0.4% |
| Africa | 2,723 | 12.1% |
| Albania | 19 | 0.1% |
| Asia | 1,788 | 7.9% |
| Bangladesh | 123 | 0.5% |
| Bolivia | 57 | 0.3% |
| Bosnia and Herzegovina | 19 | 0.1% |
| Brazil | 25 | 0.1% |
| Cameroon | 29 | 0.1% |
| Canada | 12 | 0.1% |
| Caribbean | 258 | 1.1% |
| Central America | 556 | 2.5% |
| Chile | 14 | 0.1% |
| China | 7 | 0.0% |
| Colombia | 89 | 0.4% |
| Dominican Republic | 29 | 0.1% |
| Eastern Africa | 583 | 2.6% |
| Eastern Asia | 177 | 0.8% |
| Eastern Europe | 70 | 0.3% |
| Egypt | 6 | 0.0% |
| El Salvador | 206 | 0.9% |
| Ethiopia | 569 | 2.5% |
| Europe | 162 | 0.7% |
| Germany | 21 | 0.1% |
| Ghana | 1,669 | 7.4% |
| Honduras | 107 | 0.5% |
| India | 11 | 0.1% |
| Italy | 15 | 0.1% |
| Jamaica | 205 | 0.9% |
| Jordan | 10 | 0.0% |
| Korea | 170 | 0.8% |
| Latin America | 1,219 | 5.4% |
| Liberia | 131 | 0.6% |
| Mexico | 171 | 0.8% |
| Middle Africa | 29 | 0.1% |
| Morocco | 107 | 0.5% |
| Nicaragua | 47 | 0.2% |
| Nigeria | 81 | 0.4% |
| Northern Africa | 139 | 0.6% |
| Northern Europe | 39 | 0.2% |
| Pakistan | 760 | 3.4% |
| Panama | 25 | 0.1% |
| Peru | 191 | 0.9% |
| Philippines | 336 | 1.5% |
| Sierra Leone | 91 | 0.4% |
| South America | 405 | 1.8% |
| South Central Asia | 978 | 4.3% |
| South Eastern Asia | 594 | 2.6% |
| Southern Europe | 32 | 0.1% |
| Syria | 10 | 0.0% |
| Thailand | 70 | 0.3% |
| Trinidad and Tobago | 24 | 0.1% |
| Turkey | 8 | 0.0% |
| Ukraine | 32 | 0.1% |
| Venezuela | 29 | 0.1% |
| Vietnam | 188 | 0.8% |
| Western Africa | 1,972 | 8.8% |
| Western Asia | 39 | 0.2% |
| Western Europe | 21 | 0.1% | View All 59 Rows |
Sex and Age in Cherry Hill
Sex and Age in Cherry Hill
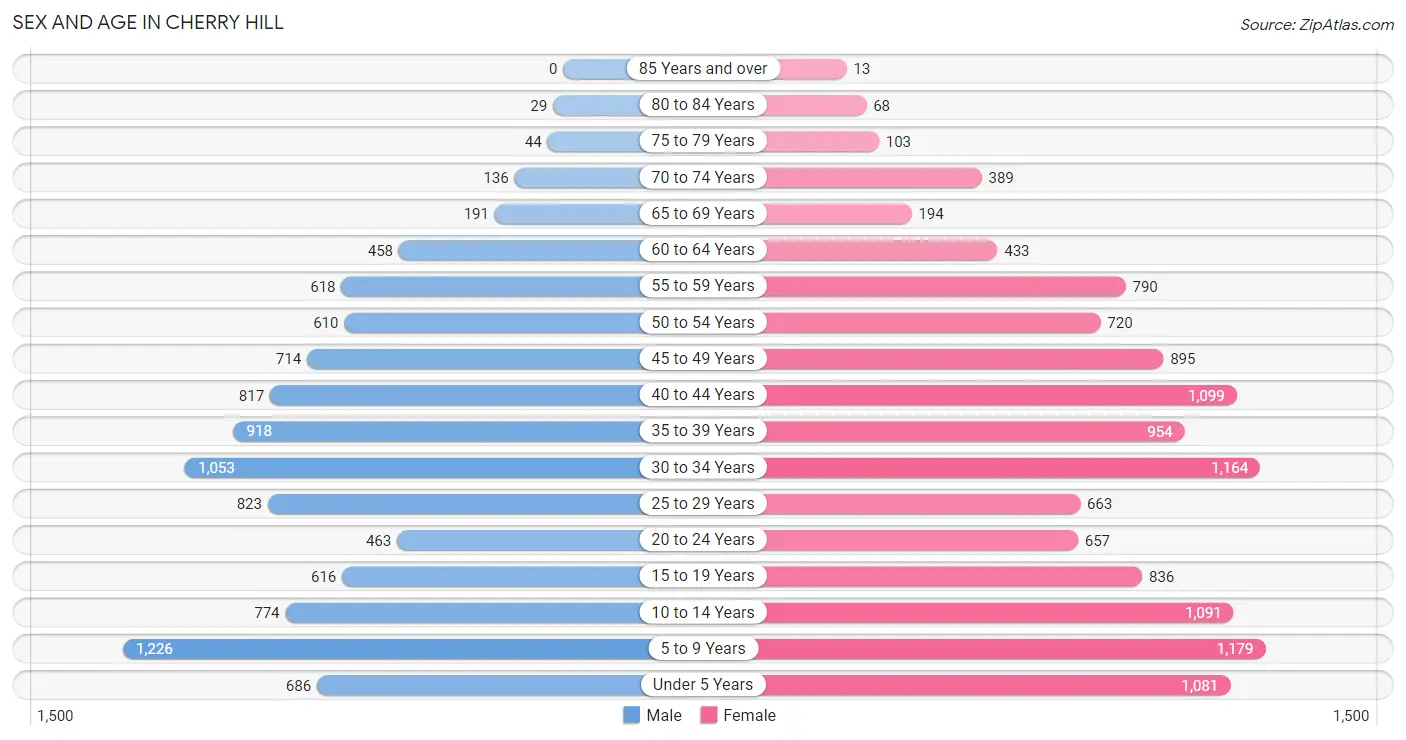
The most populous age groups in Cherry Hill are 5 to 9 Years (1,226 | 12.0%) for men and 5 to 9 Years (1,179 | 9.6%) for women.
| Age Bracket | Male | Female |
| Under 5 Years | 686 (6.7%) | 1,081 (8.8%) |
| 5 to 9 Years | 1,226 (12.0%) | 1,179 (9.6%) |
| 10 to 14 Years | 774 (7.6%) | 1,091 (8.8%) |
| 15 to 19 Years | 616 (6.0%) | 836 (6.8%) |
| 20 to 24 Years | 463 (4.5%) | 657 (5.3%) |
| 25 to 29 Years | 823 (8.1%) | 663 (5.4%) |
| 30 to 34 Years | 1,053 (10.3%) | 1,164 (9.4%) |
| 35 to 39 Years | 918 (9.0%) | 954 (7.7%) |
| 40 to 44 Years | 817 (8.0%) | 1,099 (8.9%) |
| 45 to 49 Years | 714 (7.0%) | 895 (7.3%) |
| 50 to 54 Years | 610 (6.0%) | 720 (5.8%) |
| 55 to 59 Years | 618 (6.1%) | 790 (6.4%) |
| 60 to 64 Years | 458 (4.5%) | 433 (3.5%) |
| 65 to 69 Years | 191 (1.9%) | 194 (1.6%) |
| 70 to 74 Years | 136 (1.3%) | 389 (3.2%) |
| 75 to 79 Years | 44 (0.4%) | 103 (0.8%) |
| 80 to 84 Years | 29 (0.3%) | 68 (0.5%) |
| 85 Years and over | 0 (0.0%) | 13 (0.1%) |
| Total | 10,176 (100.0%) | 12,329 (100.0%) |
Families and Households in Cherry Hill
Median Family Size in Cherry Hill
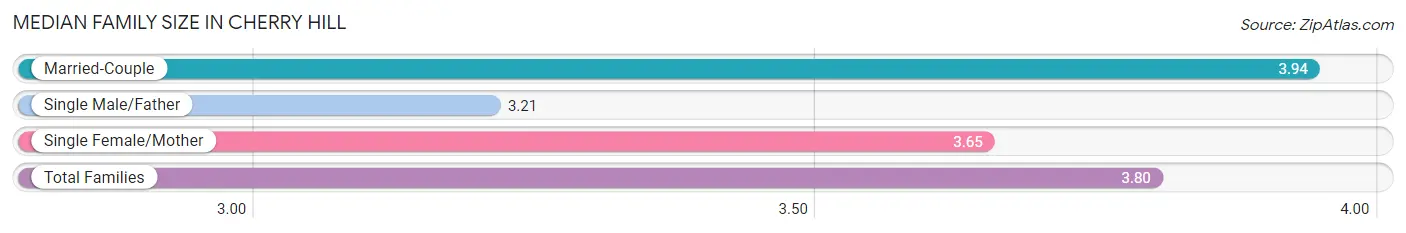
The median family size in Cherry Hill is 3.80 persons per family, with married-couple families (3,389 | 66.9%) accounting for the largest median family size of 3.94 persons per family. On the other hand, single male/father families (475 | 9.4%) represent the smallest median family size with 3.21 persons per family.
| Family Type | # Families | Family Size |
| Married-Couple | 3,389 (66.9%) | 3.94 |
| Single Male/Father | 475 (9.4%) | 3.21 |
| Single Female/Mother | 1,203 (23.7%) | 3.65 |
| Total Families | 5,067 (100.0%) | 3.80 |
Median Household Size in Cherry Hill
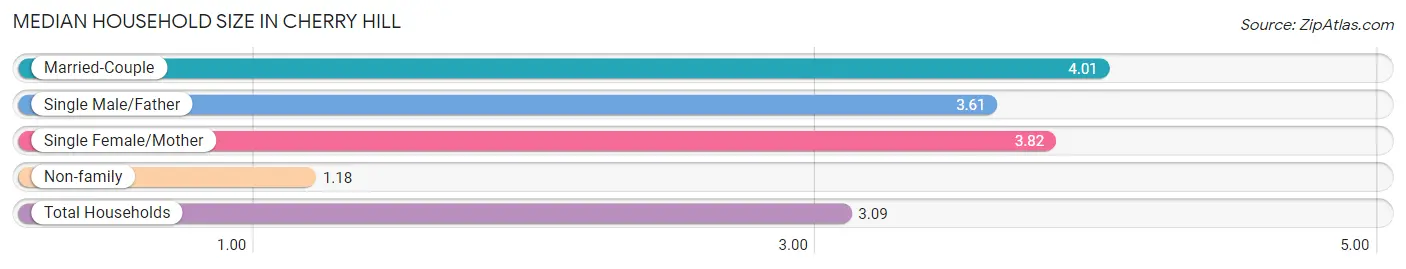
The median household size in Cherry Hill is 3.09 persons per household, with married-couple households (3,389 | 46.6%) accounting for the largest median household size of 4.01 persons per household. non-family households (2,205 | 30.3%) represent the smallest median household size with 1.18 persons per household.
| Household Type | # Households | Household Size |
| Married-Couple | 3,389 (46.6%) | 4.01 |
| Single Male/Father | 475 (6.5%) | 3.61 |
| Single Female/Mother | 1,203 (16.5%) | 3.82 |
| Non-family | 2,205 (30.3%) | 1.18 |
| Total Households | 7,272 (100.0%) | 3.09 |
Household Size by Marriage Status in Cherry Hill
Out of a total of 7,272 households in Cherry Hill, 5,067 (69.7%) are family households, while 2,205 (30.3%) are nonfamily households. The most numerous type of family households are 4-person households, comprising 1,574, and the most common type of nonfamily households are 1-person households, comprising 1,927.
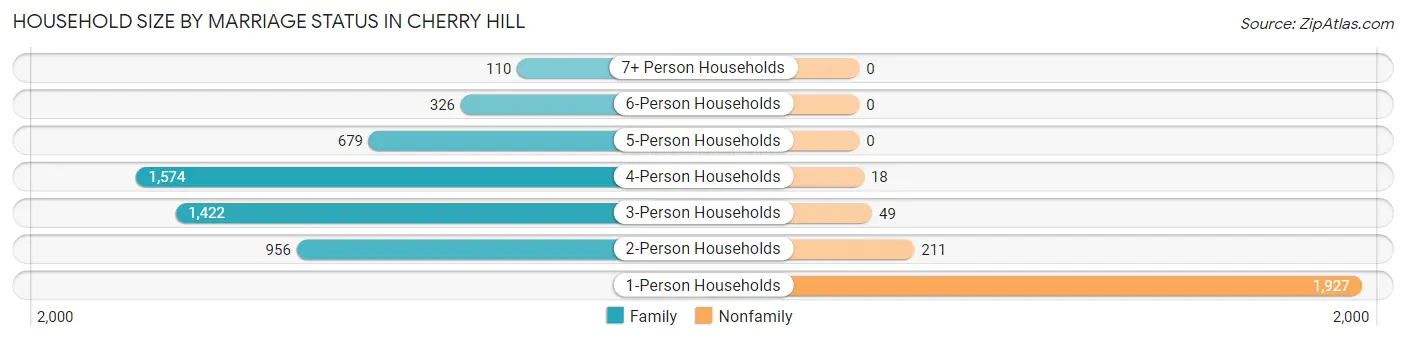
| Household Size | Family Households | Nonfamily Households |
| 1-Person Households | - | 1,927 (26.5%) |
| 2-Person Households | 956 (13.2%) | 211 (2.9%) |
| 3-Person Households | 1,422 (19.6%) | 49 (0.7%) |
| 4-Person Households | 1,574 (21.6%) | 18 (0.3%) |
| 5-Person Households | 679 (9.3%) | 0 (0.0%) |
| 6-Person Households | 326 (4.5%) | 0 (0.0%) |
| 7+ Person Households | 110 (1.5%) | 0 (0.0%) |
| Total | 5,067 (69.7%) | 2,205 (30.3%) |
Female Fertility in Cherry Hill
Fertility by Age in Cherry Hill
Average fertility rate in Cherry Hill is 54.0 births per 1,000 women. Women in the age bracket of 20 to 34 years have the highest fertility rate with 91.0 births per 1,000 women. Women in the age bracket of 20 to 34 years acount for 64.8% of all women with births.
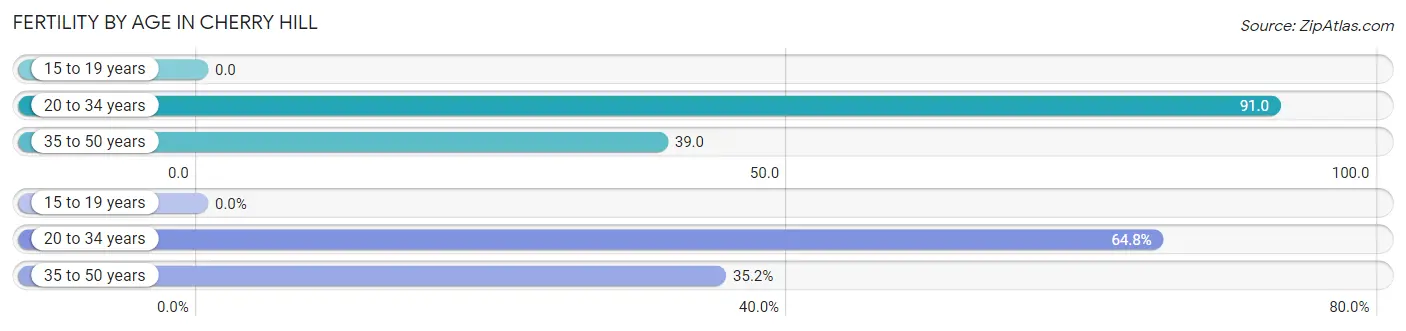
| Age Bracket | Women with Births | Births / 1,000 Women |
| 15 to 19 years | 0 (0.0%) | 0.0 |
| 20 to 34 years | 225 (64.8%) | 91.0 |
| 35 to 50 years | 122 (35.2%) | 39.0 |
| Total | 347 (100.0%) | 54.0 |
Fertility by Age by Marriage Status in Cherry Hill
95.1% of women with births (347) in Cherry Hill are married. The highest percentage of unmarried women with births falls into 20 to 34 years age bracket with 7.6% of them unmarried at the time of birth, while the lowest percentage of unmarried women with births belong to 35 to 50 years age bracket with 0.0% of them unmarried.
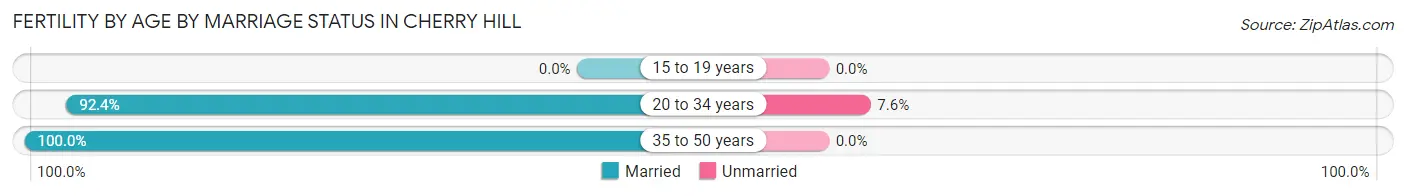
| Age Bracket | Married | Unmarried |
| 15 to 19 years | 0 (0.0%) | 0 (0.0%) |
| 20 to 34 years | 208 (92.4%) | 17 (7.6%) |
| 35 to 50 years | 122 (100.0%) | 0 (0.0%) |
| Total | 330 (95.1%) | 17 (4.9%) |
Fertility by Education in Cherry Hill
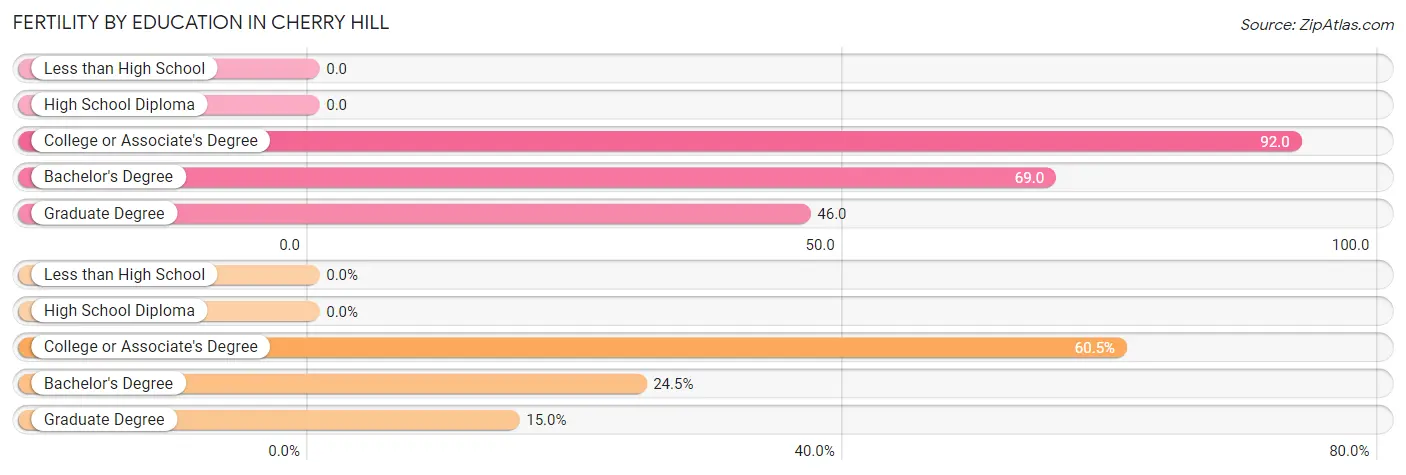
| Educational Attainment | Women with Births | Births / 1,000 Women |
| Less than High School | 0 (0.0%) | 0.0 |
| High School Diploma | 0 (0.0%) | 0.0 |
| College or Associate's Degree | 210 (60.5%) | 92.0 |
| Bachelor's Degree | 85 (24.5%) | 69.0 |
| Graduate Degree | 52 (15.0%) | 46.0 |
| Total | 347 (100.0%) | 54.0 |
Fertility by Education by Marriage Status in Cherry Hill
4.9% of women with births in Cherry Hill are unmarried. Women with the educational attainment of bachelor's degree are most likely to be married with 100.0% of them married at childbirth, while women with the educational attainment of college or associate's degree are least likely to be married with 8.1% of them unmarried at childbirth.
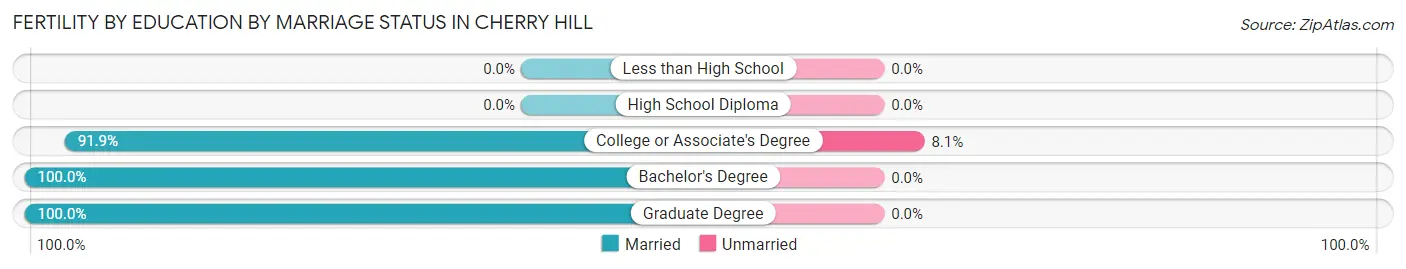
| Educational Attainment | Married | Unmarried |
| Less than High School | 0 (0.0%) | 0 (0.0%) |
| High School Diploma | 0 (0.0%) | 0 (0.0%) |
| College or Associate's Degree | 193 (91.9%) | 17 (8.1%) |
| Bachelor's Degree | 85 (100.0%) | 0 (0.0%) |
| Graduate Degree | 52 (100.0%) | 0 (0.0%) |
| Total | 330 (95.1%) | 17 (4.9%) |
Employment Characteristics in Cherry Hill
Employment by Class of Employer in Cherry Hill
Among the 12,269 employed individuals in Cherry Hill, private company employees (7,085 | 57.8%), federal government employees (2,687 | 21.9%), and not-for-profit organizations (873 | 7.1%) make up the most common classes of employment.
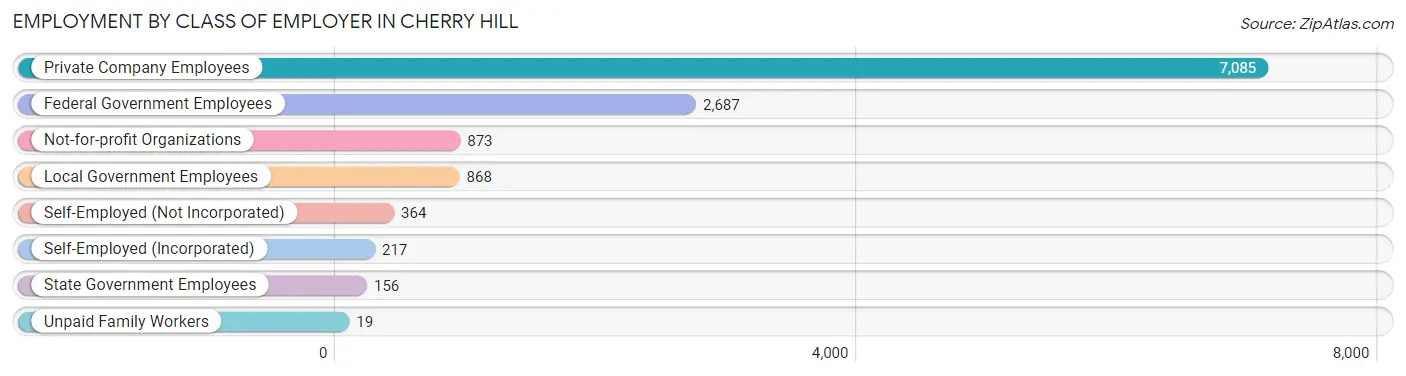
| Employer Class | # Employees | % Employees |
| Private Company Employees | 7,085 | 57.8% |
| Self-Employed (Incorporated) | 217 | 1.8% |
| Self-Employed (Not Incorporated) | 364 | 3.0% |
| Not-for-profit Organizations | 873 | 7.1% |
| Local Government Employees | 868 | 7.1% |
| State Government Employees | 156 | 1.3% |
| Federal Government Employees | 2,687 | 21.9% |
| Unpaid Family Workers | 19 | 0.2% |
| Total | 12,269 | 100.0% |
Employment Status by Age in Cherry Hill
According to the labor force statistics for Cherry Hill, out of the total population over 16 years of age (15,992), 81.7% or 13,065 individuals are in the labor force, with 5.5% or 719 of them unemployed. The age group with the highest labor force participation rate is 45 to 54 years, with 93.0% or 2,733 individuals in the labor force. Within the labor force, the 20 to 24 years age range has the highest percentage of unemployed individuals, with 12.7% or 123 of them being unemployed.
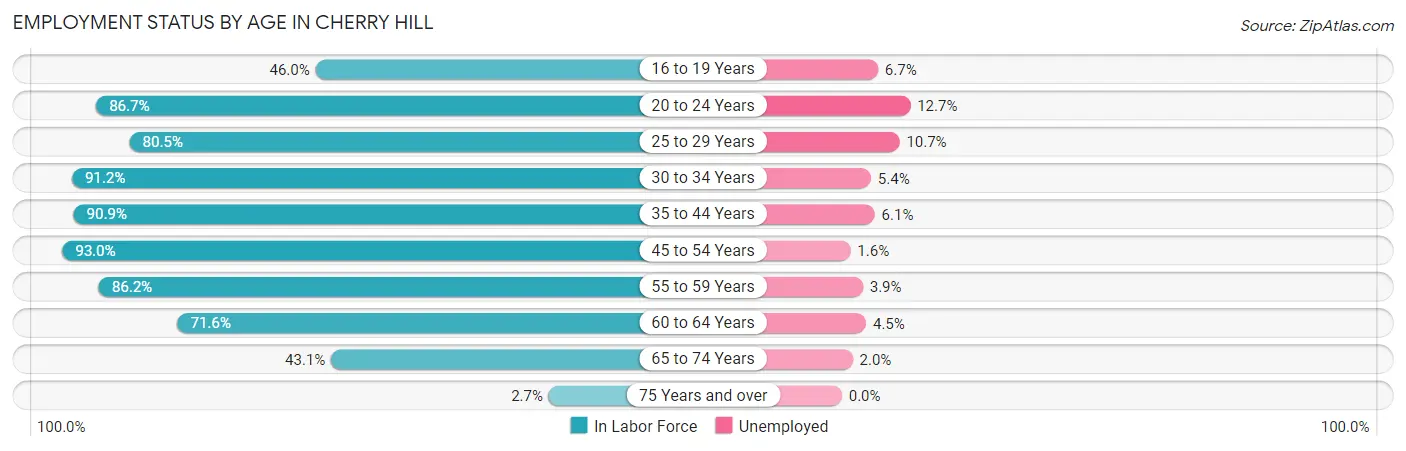
| Age Bracket | In Labor Force | Unemployed |
| 16 to 19 Years | 449 (46.0%) | 30 (6.7%) |
| 20 to 24 Years | 971 (86.7%) | 123 (12.7%) |
| 25 to 29 Years | 1,196 (80.5%) | 128 (10.7%) |
| 30 to 34 Years | 2,022 (91.2%) | 109 (5.4%) |
| 35 to 44 Years | 3,443 (90.9%) | 210 (6.1%) |
| 45 to 54 Years | 2,733 (93.0%) | 44 (1.6%) |
| 55 to 59 Years | 1,214 (86.2%) | 47 (3.9%) |
| 60 to 64 Years | 638 (71.6%) | 29 (4.5%) |
| 65 to 74 Years | 392 (43.1%) | 8 (2.0%) |
| 75 Years and over | 7 (2.7%) | 0 (0.0%) |
| Total | 13,065 (81.7%) | 719 (5.5%) |
Employment Status by Educational Attainment in Cherry Hill
According to labor force statistics for Cherry Hill, 88.3% of individuals (11,240) out of the total population between 25 and 64 years of age (12,729) are in the labor force, with 5.0% or 562 of them being unemployed. The group with the highest labor force participation rate are those with the educational attainment of bachelor's degree or higher, with 95.9% or 5,052 individuals in the labor force. Within the labor force, individuals with college / associate degree education have the highest percentage of unemployment, with 8.2% or 303 of them being unemployed.
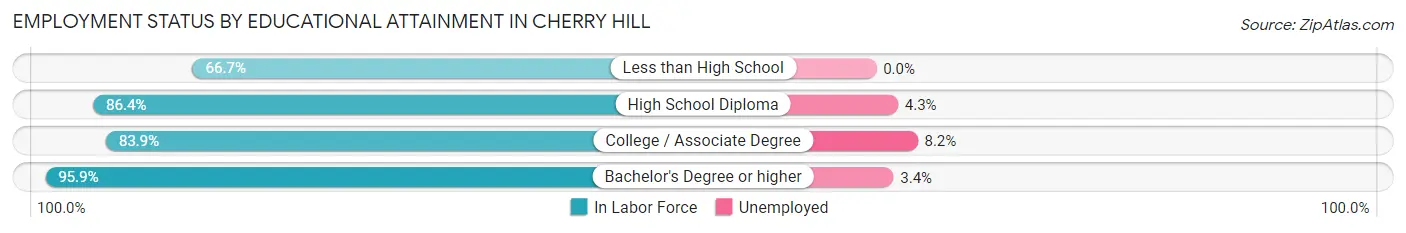
| Educational Attainment | In Labor Force | Unemployed |
| Less than High School | 483 (66.7%) | 0 (0.0%) |
| High School Diploma | 2,011 (86.4%) | 100 (4.3%) |
| College / Associate Degree | 3,700 (83.9%) | 362 (8.2%) |
| Bachelor's Degree or higher | 5,052 (95.9%) | 179 (3.4%) |
| Total | 11,240 (88.3%) | 636 (5.0%) |
Employment Occupations by Sex in Cherry Hill
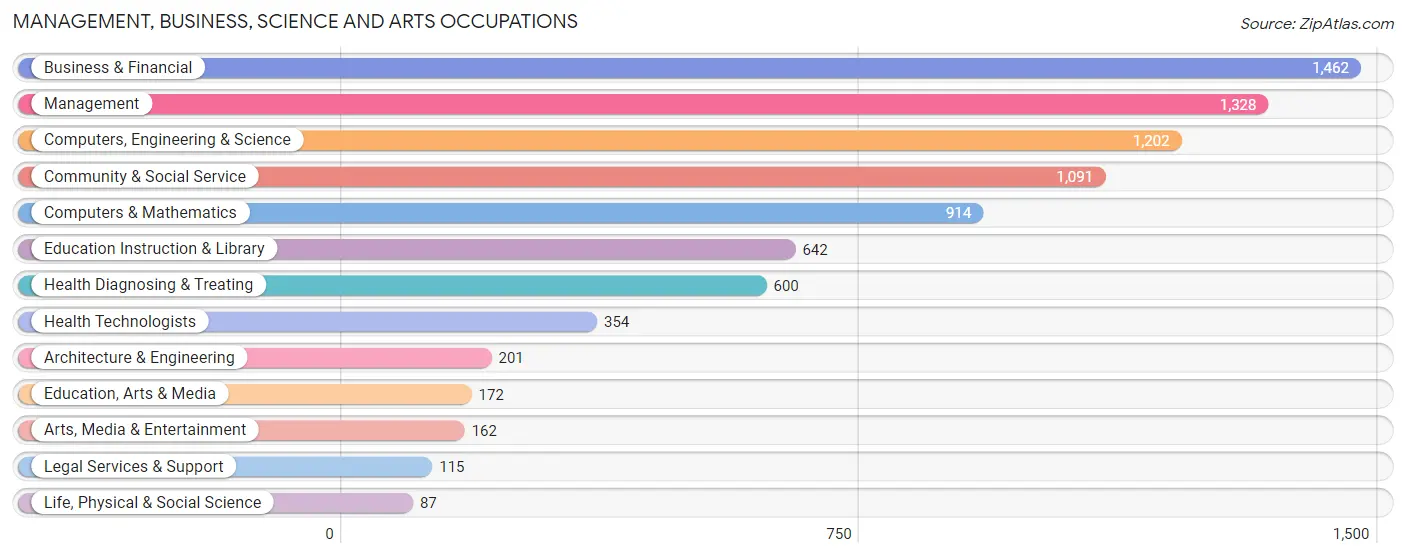
Management, Business, Science and Arts Occupations
The most common Management, Business, Science and Arts occupations in Cherry Hill are Business & Financial (1,462 | 12.1%), Management (1,328 | 11.0%), Computers, Engineering & Science (1,202 | 9.9%), Community & Social Service (1,091 | 9.0%), and Computers & Mathematics (914 | 7.6%).
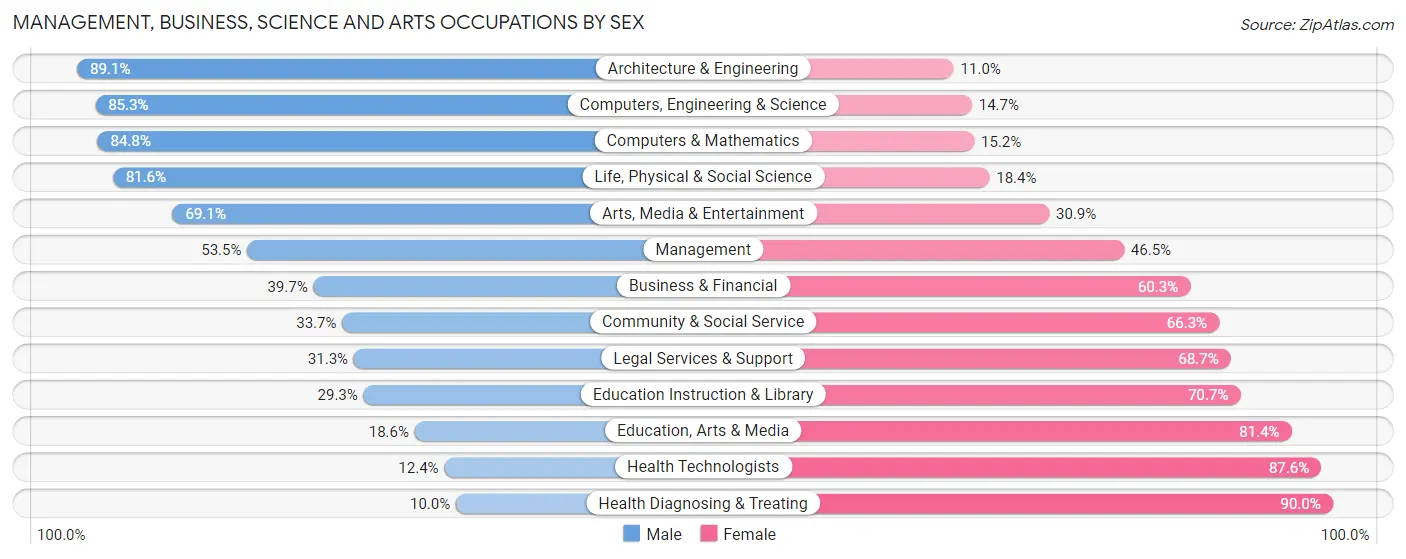
Management, Business, Science and Arts Occupations by Sex
Within the Management, Business, Science and Arts occupations in Cherry Hill, the most male-oriented occupations are Architecture & Engineering (89.0%), Computers, Engineering & Science (85.3%), and Computers & Mathematics (84.8%), while the most female-oriented occupations are Health Diagnosing & Treating (90.0%), Health Technologists (87.6%), and Education, Arts & Media (81.4%).
| Occupation | Male | Female |
| Management | 711 (53.5%) | 617 (46.5%) |
| Business & Financial | 581 (39.7%) | 881 (60.3%) |
| Computers, Engineering & Science | 1,025 (85.3%) | 177 (14.7%) |
| Computers & Mathematics | 775 (84.8%) | 139 (15.2%) |
| Architecture & Engineering | 179 (89.0%) | 22 (11.0%) |
| Life, Physical & Social Science | 71 (81.6%) | 16 (18.4%) |
| Community & Social Service | 368 (33.7%) | 723 (66.3%) |
| Education, Arts & Media | 32 (18.6%) | 140 (81.4%) |
| Legal Services & Support | 36 (31.3%) | 79 (68.7%) |
| Education Instruction & Library | 188 (29.3%) | 454 (70.7%) |
| Arts, Media & Entertainment | 112 (69.1%) | 50 (30.9%) |
| Health Diagnosing & Treating | 60 (10.0%) | 540 (90.0%) |
| Health Technologists | 44 (12.4%) | 310 (87.6%) |
| Total (Category) | 2,745 (48.3%) | 2,938 (51.7%) |
| Total (Overall) | 5,808 (48.0%) | 6,284 (52.0%) |
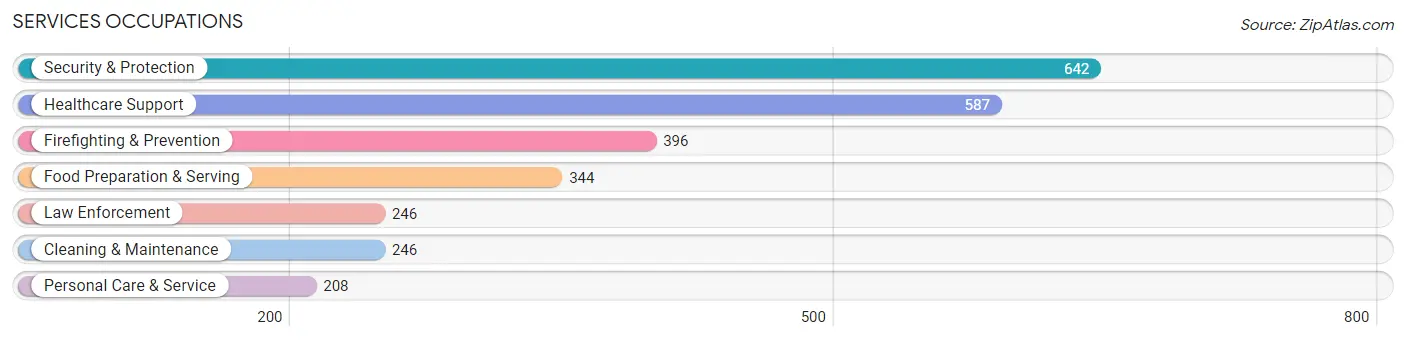
Services Occupations
The most common Services occupations in Cherry Hill are Security & Protection (642 | 5.3%), Healthcare Support (587 | 4.9%), Firefighting & Prevention (396 | 3.3%), Food Preparation & Serving (344 | 2.8%), and Law Enforcement (246 | 2.0%).
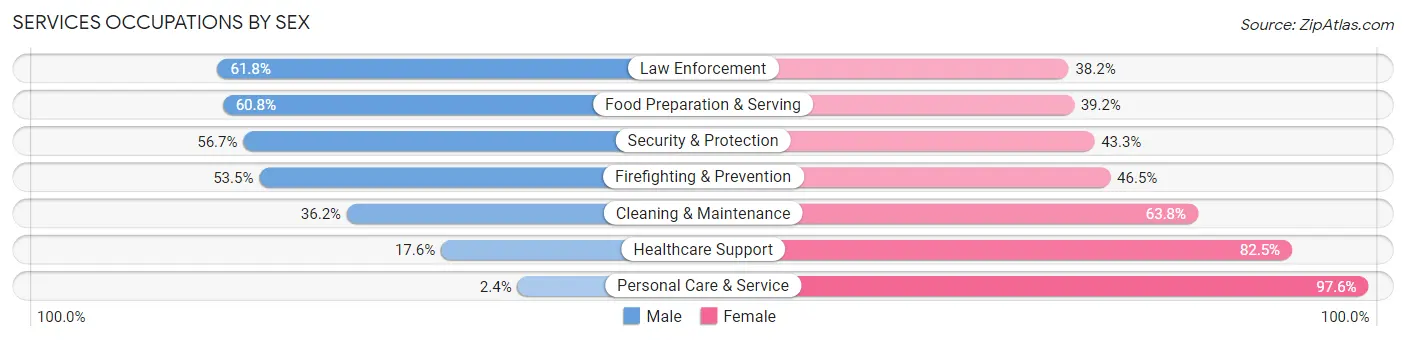
Services Occupations by Sex
Within the Services occupations in Cherry Hill, the most male-oriented occupations are Law Enforcement (61.8%), Food Preparation & Serving (60.8%), and Security & Protection (56.7%), while the most female-oriented occupations are Personal Care & Service (97.6%), Healthcare Support (82.5%), and Cleaning & Maintenance (63.8%).
| Occupation | Male | Female |
| Healthcare Support | 103 (17.5%) | 484 (82.5%) |
| Security & Protection | 364 (56.7%) | 278 (43.3%) |
| Firefighting & Prevention | 212 (53.5%) | 184 (46.5%) |
| Law Enforcement | 152 (61.8%) | 94 (38.2%) |
| Food Preparation & Serving | 209 (60.8%) | 135 (39.2%) |
| Cleaning & Maintenance | 89 (36.2%) | 157 (63.8%) |
| Personal Care & Service | 5 (2.4%) | 203 (97.6%) |
| Total (Category) | 770 (38.0%) | 1,257 (62.0%) |
| Total (Overall) | 5,808 (48.0%) | 6,284 (52.0%) |
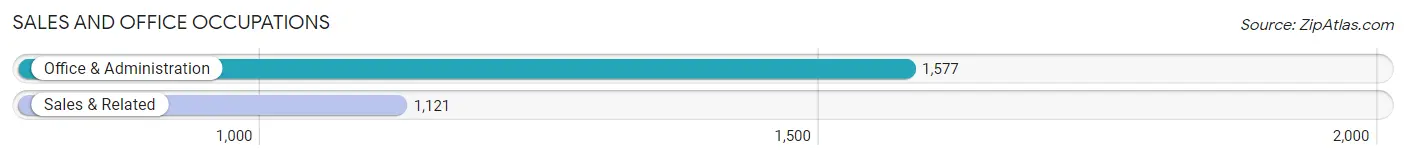
Sales and Office Occupations
The most common Sales and Office occupations in Cherry Hill are Office & Administration (1,577 | 13.0%), and Sales & Related (1,121 | 9.3%).
Sales and Office Occupations by Sex
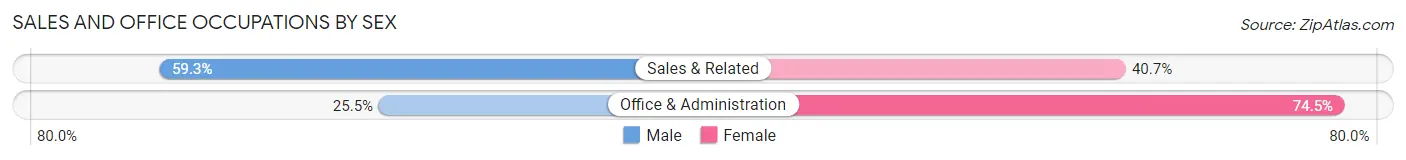
| Occupation | Male | Female |
| Sales & Related | 665 (59.3%) | 456 (40.7%) |
| Office & Administration | 402 (25.5%) | 1,175 (74.5%) |
| Total (Category) | 1,067 (39.6%) | 1,631 (60.5%) |
| Total (Overall) | 5,808 (48.0%) | 6,284 (52.0%) |
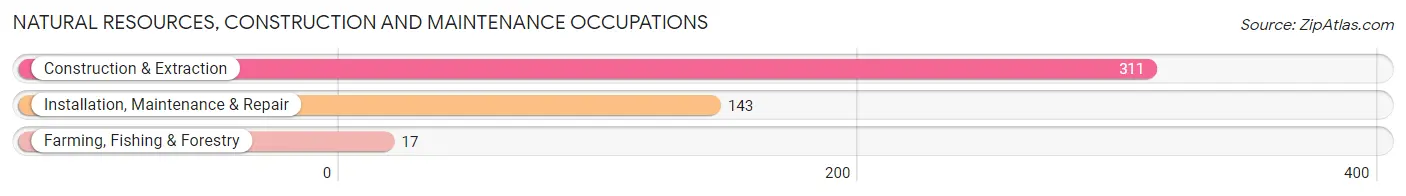
Natural Resources, Construction and Maintenance Occupations
The most common Natural Resources, Construction and Maintenance occupations in Cherry Hill are Construction & Extraction (311 | 2.6%), Installation, Maintenance & Repair (143 | 1.2%), and Farming, Fishing & Forestry (17 | 0.1%).
Natural Resources, Construction and Maintenance Occupations by Sex
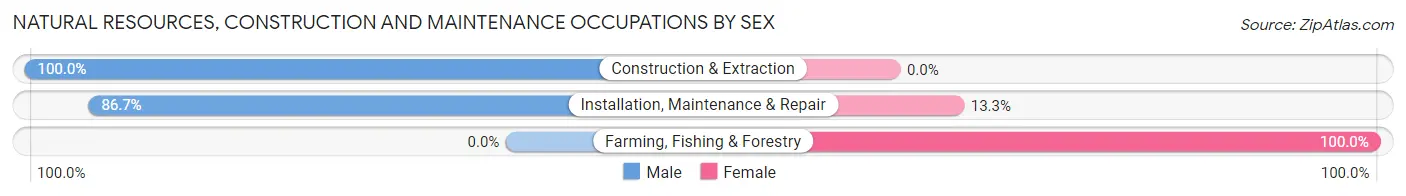
| Occupation | Male | Female |
| Farming, Fishing & Forestry | 0 (0.0%) | 17 (100.0%) |
| Construction & Extraction | 311 (100.0%) | 0 (0.0%) |
| Installation, Maintenance & Repair | 124 (86.7%) | 19 (13.3%) |
| Total (Category) | 435 (92.4%) | 36 (7.6%) |
| Total (Overall) | 5,808 (48.0%) | 6,284 (52.0%) |
Production, Transportation and Moving Occupations
The most common Production, Transportation and Moving occupations in Cherry Hill are Transportation (427 | 3.5%), Material Moving (401 | 3.3%), and Production (385 | 3.2%).
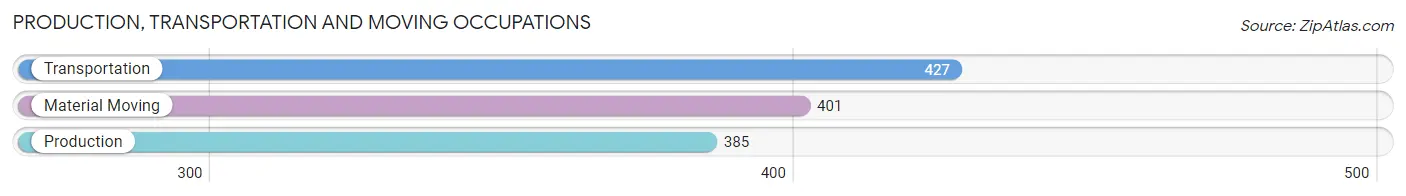
Production, Transportation and Moving Occupations by Sex
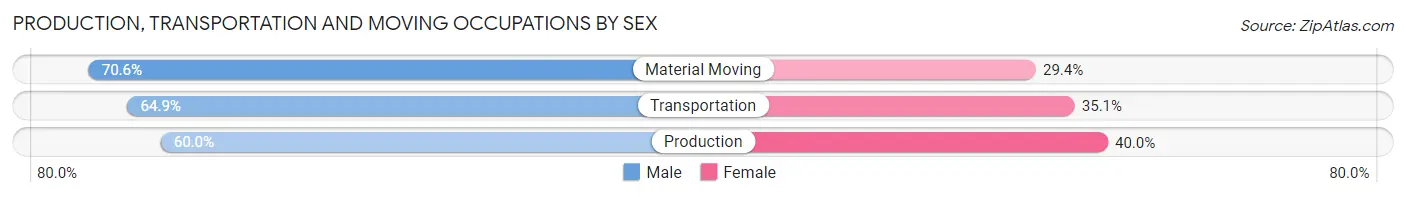
| Occupation | Male | Female |
| Production | 231 (60.0%) | 154 (40.0%) |
| Transportation | 277 (64.9%) | 150 (35.1%) |
| Material Moving | 283 (70.6%) | 118 (29.4%) |
| Total (Category) | 791 (65.2%) | 422 (34.8%) |
| Total (Overall) | 5,808 (48.0%) | 6,284 (52.0%) |
Employment Industries by Sex in Cherry Hill
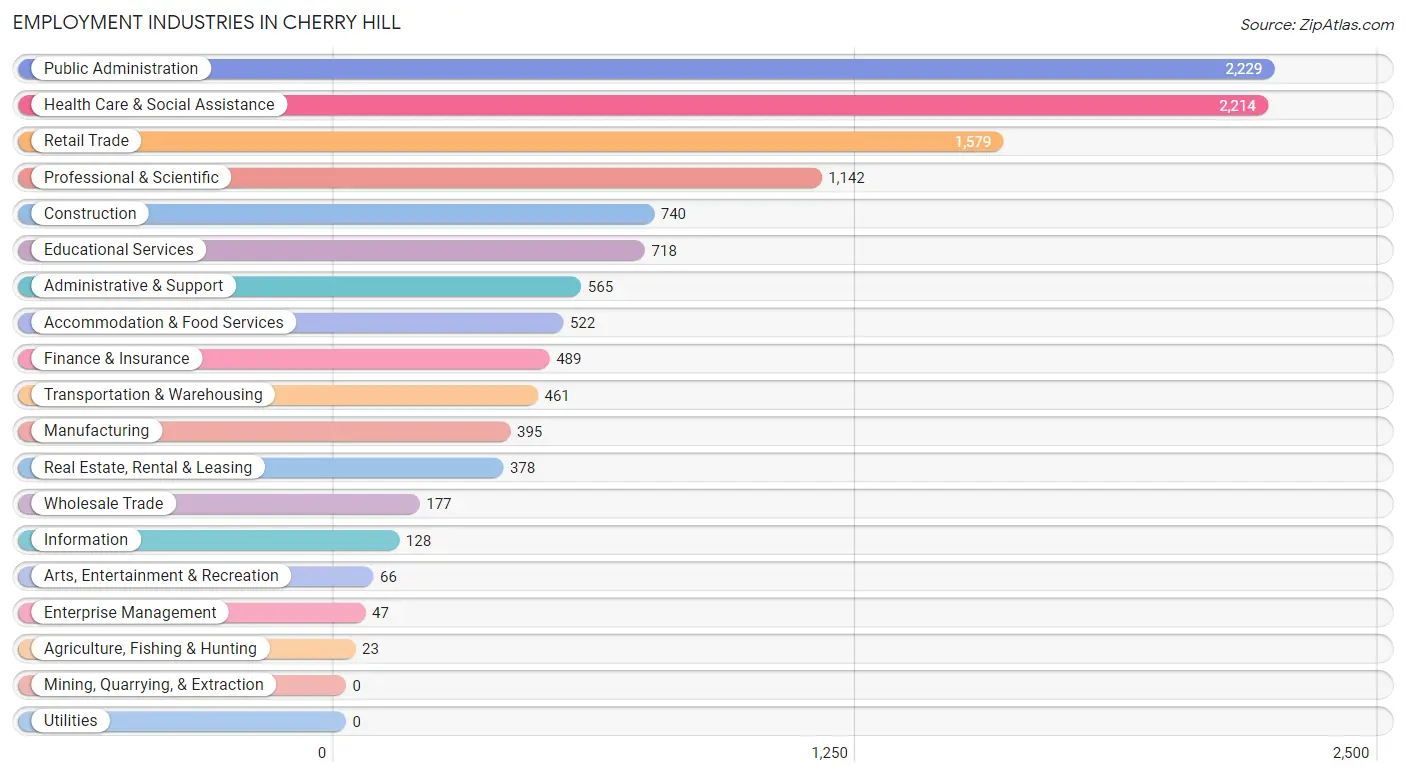
Employment Industries in Cherry Hill
The major employment industries in Cherry Hill include Public Administration (2,229 | 18.4%), Health Care & Social Assistance (2,214 | 18.3%), Retail Trade (1,579 | 13.1%), Professional & Scientific (1,142 | 9.4%), and Construction (740 | 6.1%).
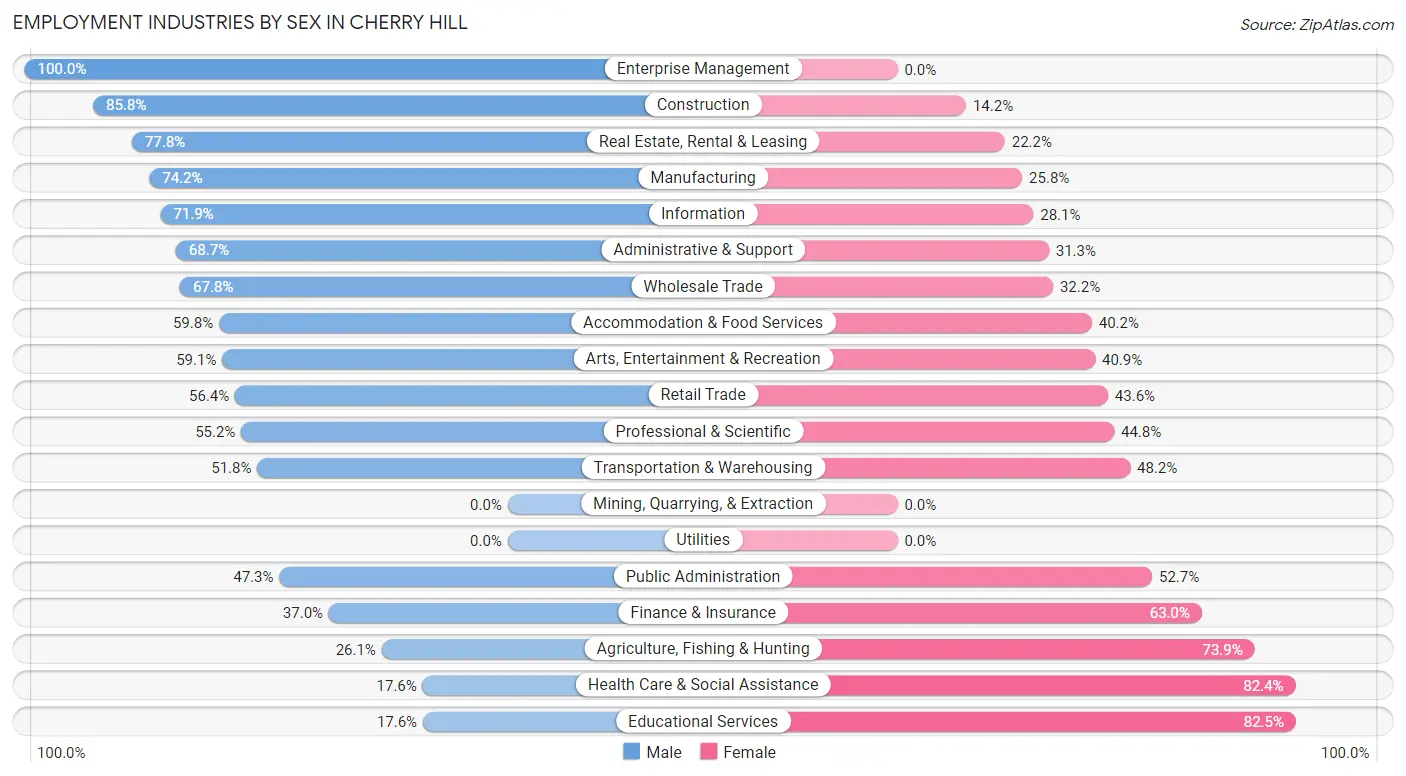
Employment Industries by Sex in Cherry Hill
The Cherry Hill industries that see more men than women are Enterprise Management (100.0%), Construction (85.8%), and Real Estate, Rental & Leasing (77.8%), whereas the industries that tend to have a higher number of women are Educational Services (82.5%), Health Care & Social Assistance (82.4%), and Agriculture, Fishing & Hunting (73.9%).
| Industry | Male | Female |
| Agriculture, Fishing & Hunting | 6 (26.1%) | 17 (73.9%) |
| Mining, Quarrying, & Extraction | 0 (0.0%) | 0 (0.0%) |
| Construction | 635 (85.8%) | 105 (14.2%) |
| Manufacturing | 293 (74.2%) | 102 (25.8%) |
| Wholesale Trade | 120 (67.8%) | 57 (32.2%) |
| Retail Trade | 891 (56.4%) | 688 (43.6%) |
| Transportation & Warehousing | 239 (51.8%) | 222 (48.2%) |
| Utilities | 0 (0.0%) | 0 (0.0%) |
| Information | 92 (71.9%) | 36 (28.1%) |
| Finance & Insurance | 181 (37.0%) | 308 (63.0%) |
| Real Estate, Rental & Leasing | 294 (77.8%) | 84 (22.2%) |
| Professional & Scientific | 630 (55.2%) | 512 (44.8%) |
| Enterprise Management | 47 (100.0%) | 0 (0.0%) |
| Administrative & Support | 388 (68.7%) | 177 (31.3%) |
| Educational Services | 126 (17.5%) | 592 (82.5%) |
| Health Care & Social Assistance | 390 (17.6%) | 1,824 (82.4%) |
| Arts, Entertainment & Recreation | 39 (59.1%) | 27 (40.9%) |
| Accommodation & Food Services | 312 (59.8%) | 210 (40.2%) |
| Public Administration | 1,054 (47.3%) | 1,175 (52.7%) |
| Total | 5,808 (48.0%) | 6,284 (52.0%) |
Education in Cherry Hill
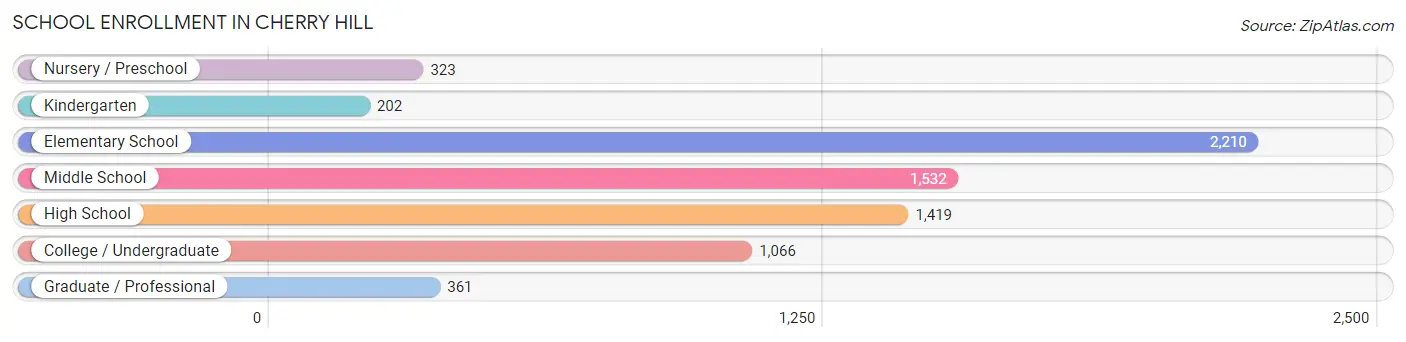
School Enrollment in Cherry Hill
The most common levels of schooling among the 7,113 students in Cherry Hill are elementary school (2,210 | 31.1%), middle school (1,532 | 21.5%), and high school (1,419 | 20.0%).
| School Level | # Students | % Students |
| Nursery / Preschool | 323 | 4.5% |
| Kindergarten | 202 | 2.8% |
| Elementary School | 2,210 | 31.1% |
| Middle School | 1,532 | 21.5% |
| High School | 1,419 | 20.0% |
| College / Undergraduate | 1,066 | 15.0% |
| Graduate / Professional | 361 | 5.1% |
| Total | 7,113 | 100.0% |
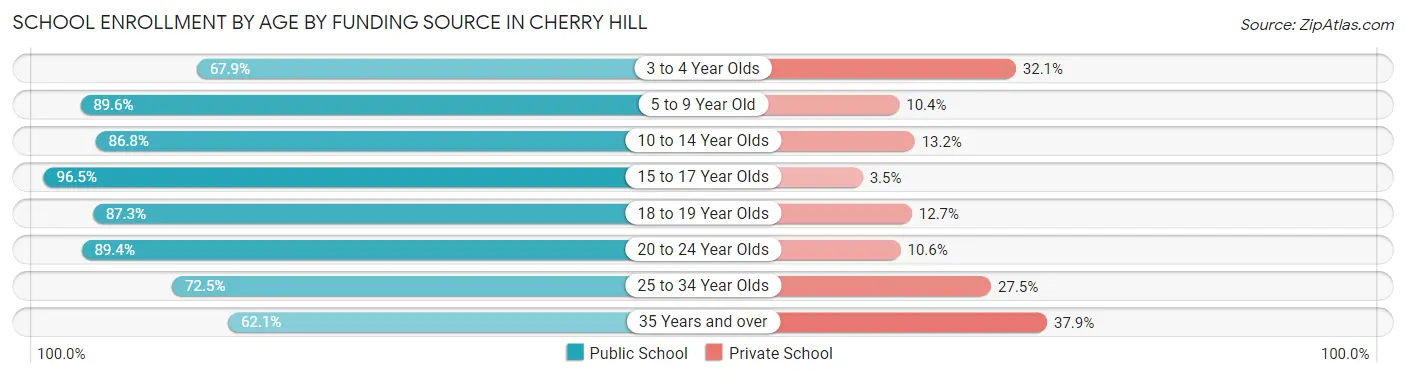
School Enrollment by Age by Funding Source in Cherry Hill
Out of a total of 7,113 students who are enrolled in schools in Cherry Hill, 1,003 (14.1%) attend a private institution, while the remaining 6,110 (85.9%) are enrolled in public schools. The age group of 35 years and over has the highest likelihood of being enrolled in private schools, with 214 (37.9% in the age bracket) enrolled. Conversely, the age group of 15 to 17 year olds has the lowest likelihood of being enrolled in a private school, with 954 (96.5% in the age bracket) attending a public institution.
| Age Bracket | Public School | Private School |
| 3 to 4 Year Olds | 197 (67.9%) | 93 (32.1%) |
| 5 to 9 Year Old | 2,095 (89.6%) | 242 (10.4%) |
| 10 to 14 Year Olds | 1,607 (86.8%) | 245 (13.2%) |
| 15 to 17 Year Olds | 954 (96.5%) | 35 (3.5%) |
| 18 to 19 Year Olds | 323 (87.3%) | 47 (12.7%) |
| 20 to 24 Year Olds | 371 (89.4%) | 44 (10.6%) |
| 25 to 34 Year Olds | 214 (72.5%) | 81 (27.5%) |
| 35 Years and over | 351 (62.1%) | 214 (37.9%) |
| Total | 6,110 (85.9%) | 1,003 (14.1%) |
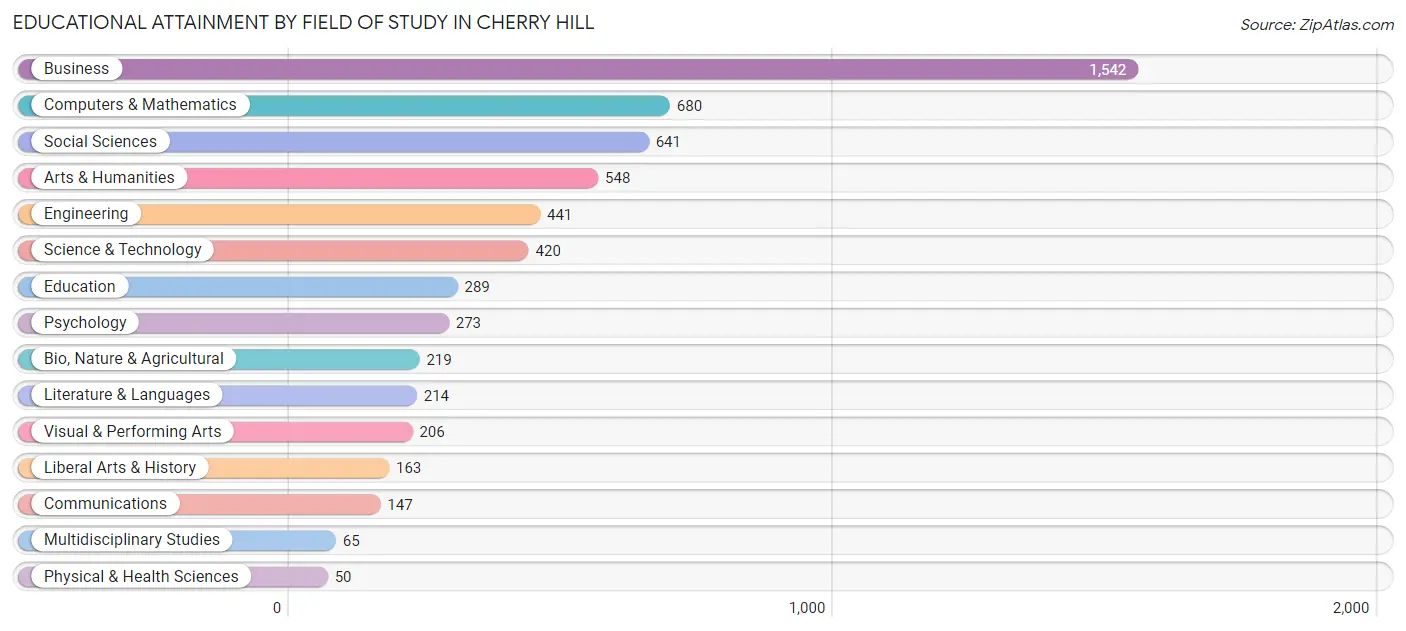
Educational Attainment by Field of Study in Cherry Hill
Business (1,542 | 26.1%), computers & mathematics (680 | 11.5%), social sciences (641 | 10.9%), arts & humanities (548 | 9.3%), and engineering (441 | 7.5%) are the most common fields of study among 5,898 individuals in Cherry Hill who have obtained a bachelor's degree or higher.
| Field of Study | # Graduates | % Graduates |
| Computers & Mathematics | 680 | 11.5% |
| Bio, Nature & Agricultural | 219 | 3.7% |
| Physical & Health Sciences | 50 | 0.9% |
| Psychology | 273 | 4.6% |
| Social Sciences | 641 | 10.9% |
| Engineering | 441 | 7.5% |
| Multidisciplinary Studies | 65 | 1.1% |
| Science & Technology | 420 | 7.1% |
| Business | 1,542 | 26.1% |
| Education | 289 | 4.9% |
| Literature & Languages | 214 | 3.6% |
| Liberal Arts & History | 163 | 2.8% |
| Visual & Performing Arts | 206 | 3.5% |
| Communications | 147 | 2.5% |
| Arts & Humanities | 548 | 9.3% |
| Total | 5,898 | 100.0% |
Transportation & Commute in Cherry Hill
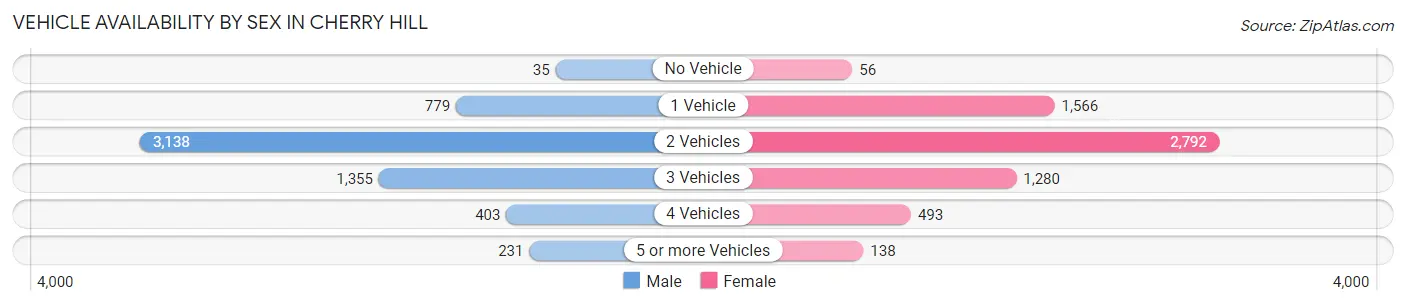
Vehicle Availability by Sex in Cherry Hill
The most prevalent vehicle ownership categories in Cherry Hill are males with 2 vehicles (3,138, accounting for 52.8%) and females with 2 vehicles (2,792, making up 49.6%).
| Vehicles Available | Male | Female |
| No Vehicle | 35 (0.6%) | 56 (0.9%) |
| 1 Vehicle | 779 (13.1%) | 1,566 (24.8%) |
| 2 Vehicles | 3,138 (52.8%) | 2,792 (44.1%) |
| 3 Vehicles | 1,355 (22.8%) | 1,280 (20.2%) |
| 4 Vehicles | 403 (6.8%) | 493 (7.8%) |
| 5 or more Vehicles | 231 (3.9%) | 138 (2.2%) |
| Total | 5,941 (100.0%) | 6,325 (100.0%) |
Commute Time in Cherry Hill
The most frequently occuring commute durations in Cherry Hill are 45 to 59 minutes (2,353 commuters, 22.3%), 60 to 89 minutes (1,851 commuters, 17.5%), and 30 to 34 minutes (1,376 commuters, 13.0%).
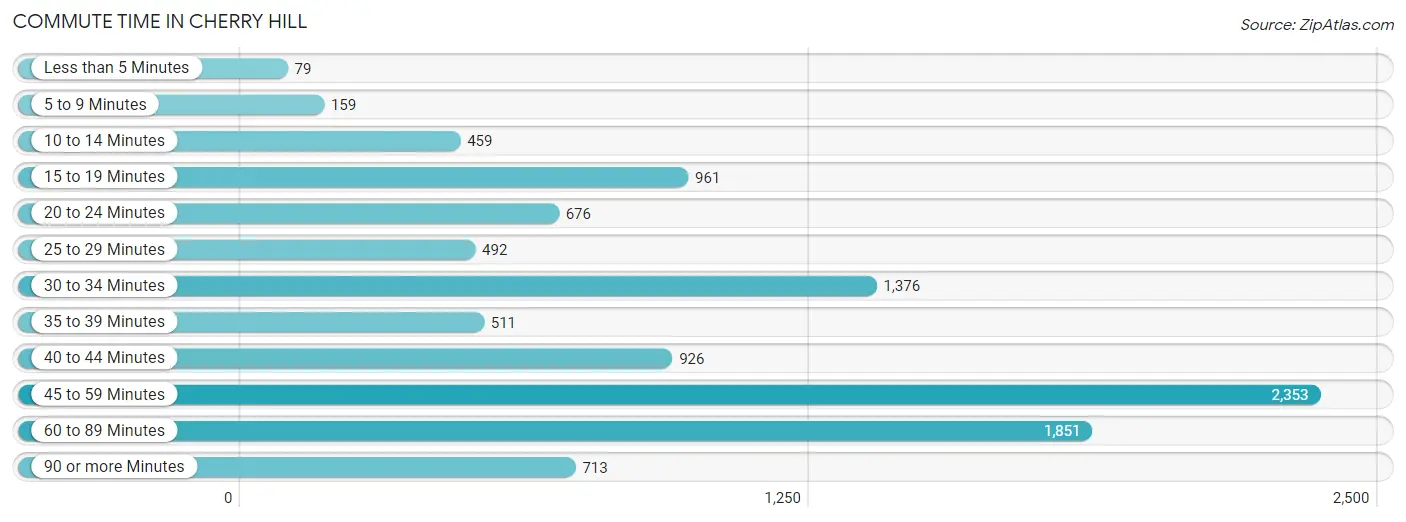
| Commute Time | # Commuters | % Commuters |
| Less than 5 Minutes | 79 | 0.7% |
| 5 to 9 Minutes | 159 | 1.5% |
| 10 to 14 Minutes | 459 | 4.3% |
| 15 to 19 Minutes | 961 | 9.1% |
| 20 to 24 Minutes | 676 | 6.4% |
| 25 to 29 Minutes | 492 | 4.7% |
| 30 to 34 Minutes | 1,376 | 13.0% |
| 35 to 39 Minutes | 511 | 4.8% |
| 40 to 44 Minutes | 926 | 8.8% |
| 45 to 59 Minutes | 2,353 | 22.3% |
| 60 to 89 Minutes | 1,851 | 17.5% |
| 90 or more Minutes | 713 | 6.8% |
Commute Time by Sex in Cherry Hill
The most common commute times in Cherry Hill are 45 to 59 minutes (1,377 commuters, 25.5%) for males and 45 to 59 minutes (976 commuters, 18.9%) for females.
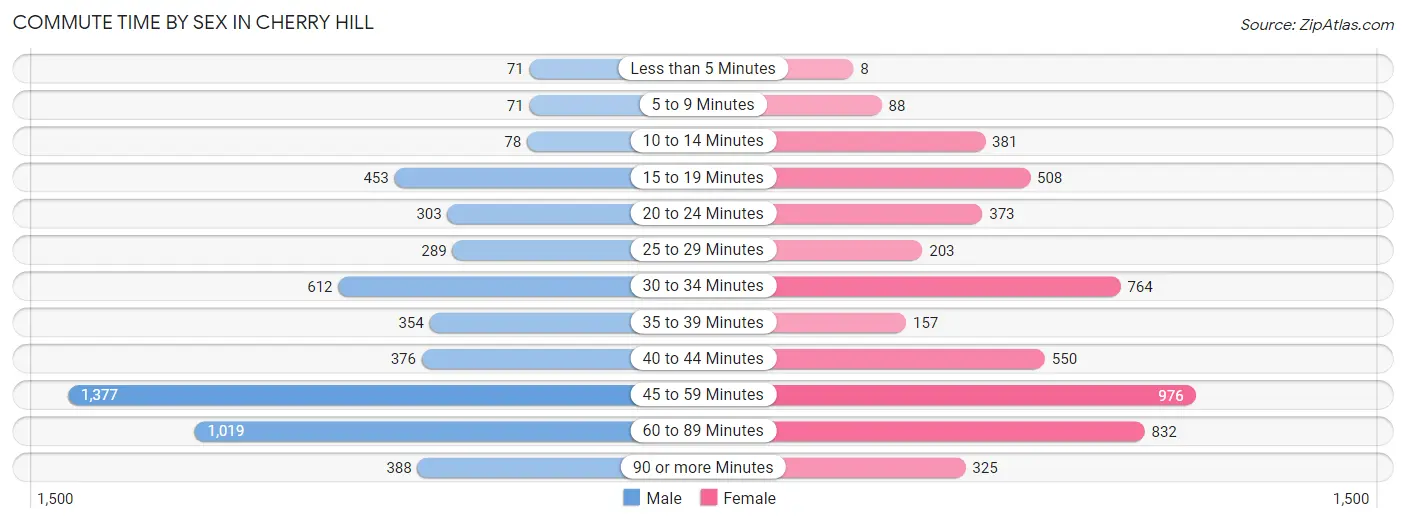
| Commute Time | Male | Female |
| Less than 5 Minutes | 71 (1.3%) | 8 (0.2%) |
| 5 to 9 Minutes | 71 (1.3%) | 88 (1.7%) |
| 10 to 14 Minutes | 78 (1.5%) | 381 (7.4%) |
| 15 to 19 Minutes | 453 (8.4%) | 508 (9.8%) |
| 20 to 24 Minutes | 303 (5.6%) | 373 (7.2%) |
| 25 to 29 Minutes | 289 (5.4%) | 203 (3.9%) |
| 30 to 34 Minutes | 612 (11.4%) | 764 (14.8%) |
| 35 to 39 Minutes | 354 (6.6%) | 157 (3.0%) |
| 40 to 44 Minutes | 376 (7.0%) | 550 (10.6%) |
| 45 to 59 Minutes | 1,377 (25.5%) | 976 (18.9%) |
| 60 to 89 Minutes | 1,019 (18.9%) | 832 (16.1%) |
| 90 or more Minutes | 388 (7.2%) | 325 (6.3%) |
Time of Departure to Work by Sex in Cherry Hill
The most frequent times of departure to work in Cherry Hill are 7:00 AM to 7:29 AM (711, 13.2%) for males and 6:00 AM to 6:29 AM (738, 14.3%) for females.
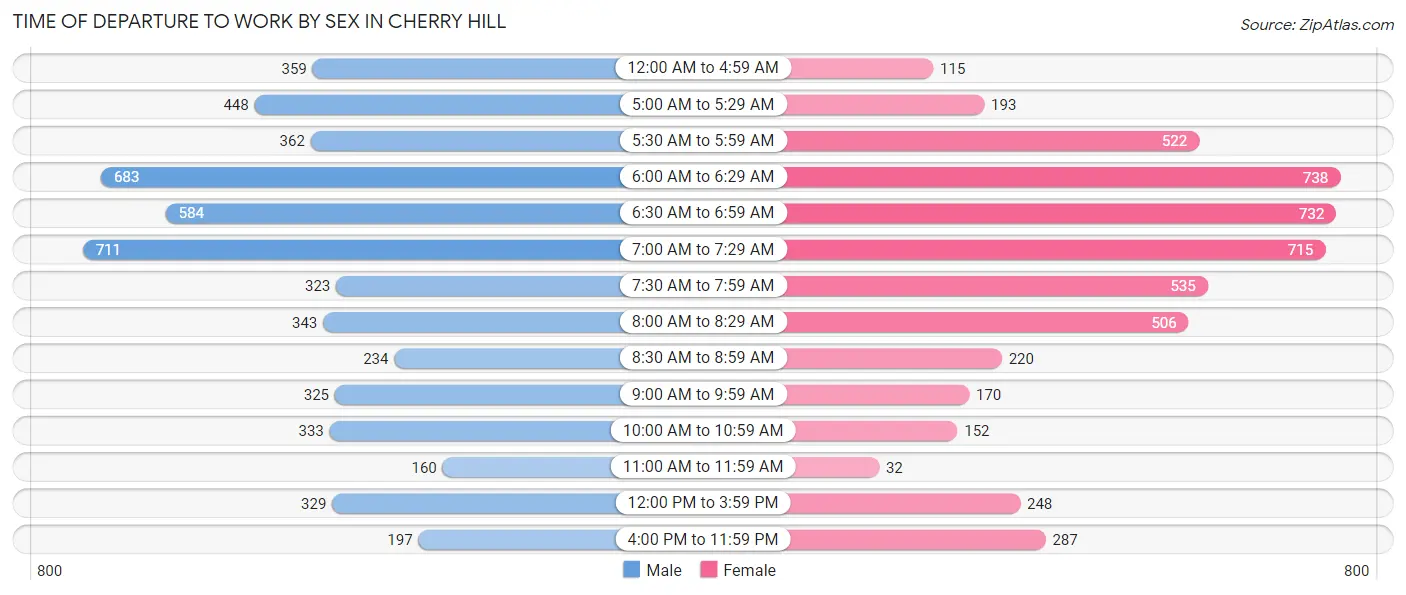
| Time of Departure | Male | Female |
| 12:00 AM to 4:59 AM | 359 (6.7%) | 115 (2.2%) |
| 5:00 AM to 5:29 AM | 448 (8.3%) | 193 (3.7%) |
| 5:30 AM to 5:59 AM | 362 (6.7%) | 522 (10.1%) |
| 6:00 AM to 6:29 AM | 683 (12.7%) | 738 (14.3%) |
| 6:30 AM to 6:59 AM | 584 (10.8%) | 732 (14.2%) |
| 7:00 AM to 7:29 AM | 711 (13.2%) | 715 (13.8%) |
| 7:30 AM to 7:59 AM | 323 (6.0%) | 535 (10.4%) |
| 8:00 AM to 8:29 AM | 343 (6.4%) | 506 (9.8%) |
| 8:30 AM to 8:59 AM | 234 (4.3%) | 220 (4.3%) |
| 9:00 AM to 9:59 AM | 325 (6.0%) | 170 (3.3%) |
| 10:00 AM to 10:59 AM | 333 (6.2%) | 152 (2.9%) |
| 11:00 AM to 11:59 AM | 160 (3.0%) | 32 (0.6%) |
| 12:00 PM to 3:59 PM | 329 (6.1%) | 248 (4.8%) |
| 4:00 PM to 11:59 PM | 197 (3.6%) | 287 (5.6%) |
| Total | 5,391 (100.0%) | 5,165 (100.0%) |
Housing Occupancy in Cherry Hill
Occupancy by Ownership in Cherry Hill
Of the total 7,272 dwellings in Cherry Hill, owner-occupied units account for 4,356 (59.9%), while renter-occupied units make up 2,916 (40.1%).
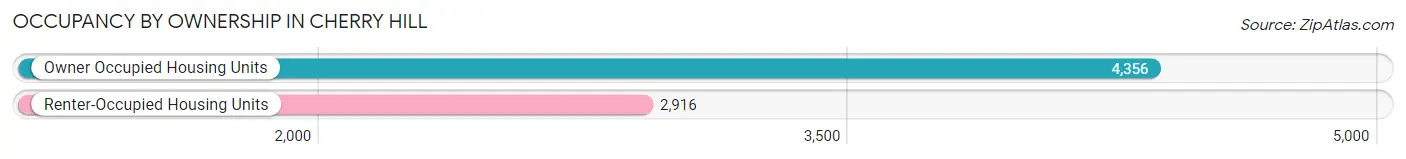
| Occupancy | # Housing Units | % Housing Units |
| Owner Occupied Housing Units | 4,356 | 59.9% |
| Renter-Occupied Housing Units | 2,916 | 40.1% |
| Total Occupied Housing Units | 7,272 | 100.0% |
Occupancy by Household Size in Cherry Hill
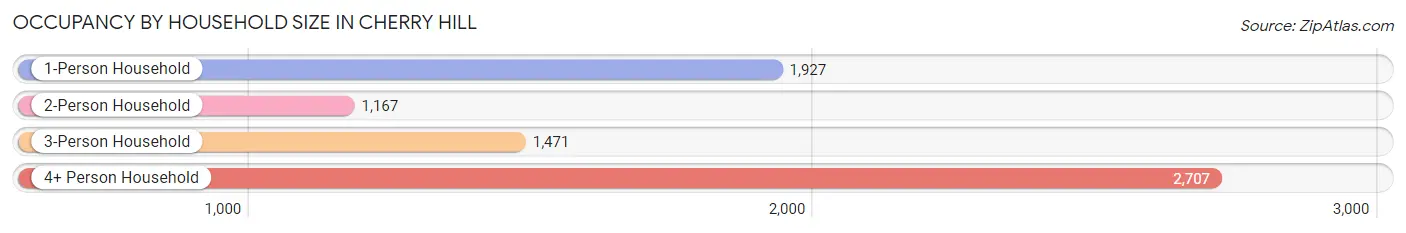
| Household Size | # Housing Units | % Housing Units |
| 1-Person Household | 1,927 | 26.5% |
| 2-Person Household | 1,167 | 16.1% |
| 3-Person Household | 1,471 | 20.2% |
| 4+ Person Household | 2,707 | 37.2% |
| Total Housing Units | 7,272 | 100.0% |
Occupancy by Ownership by Household Size in Cherry Hill
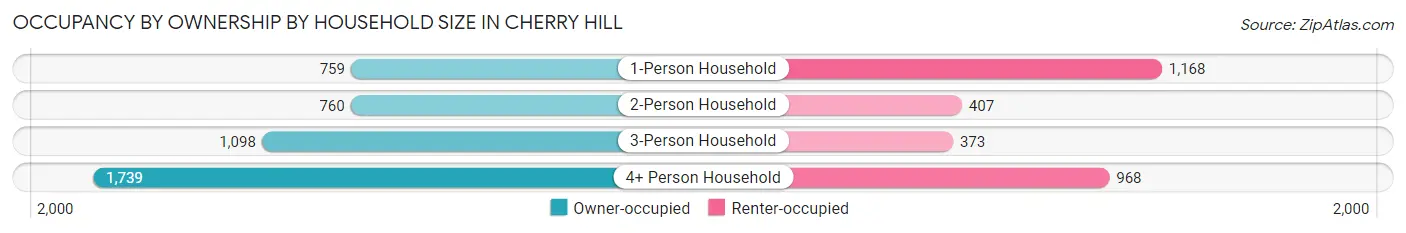
| Household Size | Owner-occupied | Renter-occupied |
| 1-Person Household | 759 (39.4%) | 1,168 (60.6%) |
| 2-Person Household | 760 (65.1%) | 407 (34.9%) |
| 3-Person Household | 1,098 (74.6%) | 373 (25.4%) |
| 4+ Person Household | 1,739 (64.2%) | 968 (35.8%) |
| Total Housing Units | 4,356 (59.9%) | 2,916 (40.1%) |
Occupancy by Educational Attainment in Cherry Hill
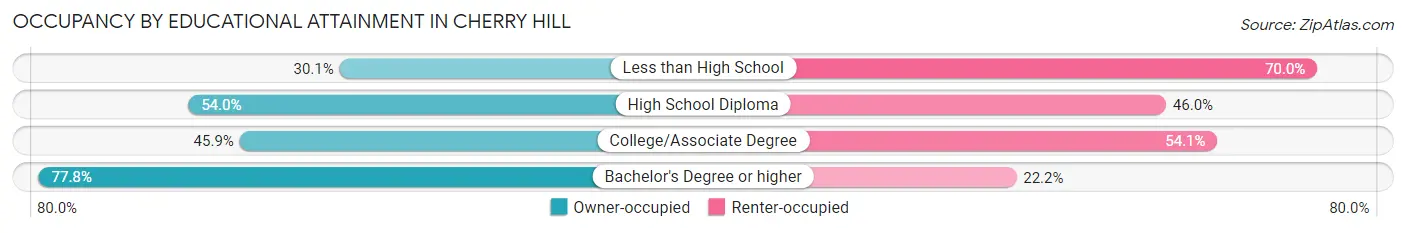
| Household Size | Owner-occupied | Renter-occupied |
| Less than High School | 122 (30.0%) | 284 (70.0%) |
| High School Diploma | 582 (54.0%) | 495 (46.0%) |
| College/Associate Degree | 1,224 (45.9%) | 1,443 (54.1%) |
| Bachelor's Degree or higher | 2,428 (77.8%) | 694 (22.2%) |
Occupancy by Age of Householder in Cherry Hill
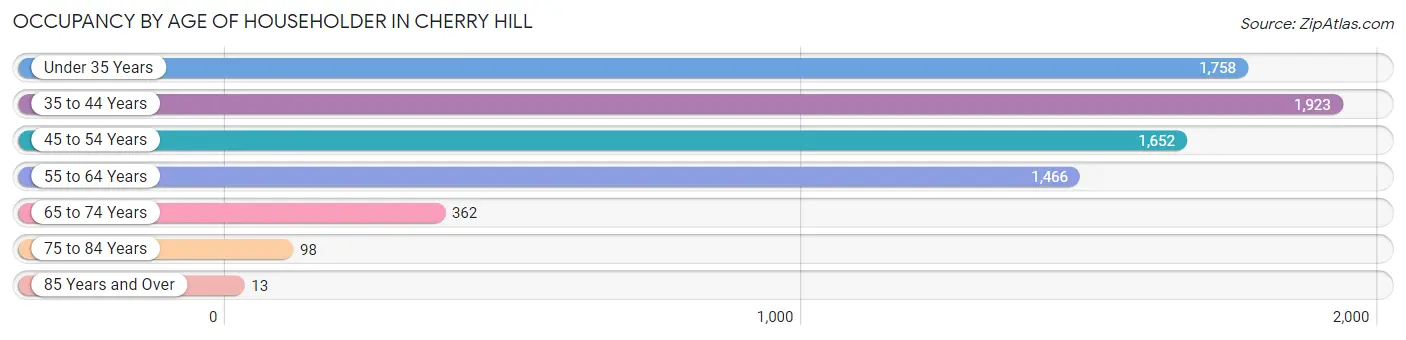
| Age Bracket | # Households | % Households |
| Under 35 Years | 1,758 | 24.2% |
| 35 to 44 Years | 1,923 | 26.4% |
| 45 to 54 Years | 1,652 | 22.7% |
| 55 to 64 Years | 1,466 | 20.2% |
| 65 to 74 Years | 362 | 5.0% |
| 75 to 84 Years | 98 | 1.3% |
| 85 Years and Over | 13 | 0.2% |
| Total | 7,272 | 100.0% |
Housing Finances in Cherry Hill
Median Income by Occupancy in Cherry Hill
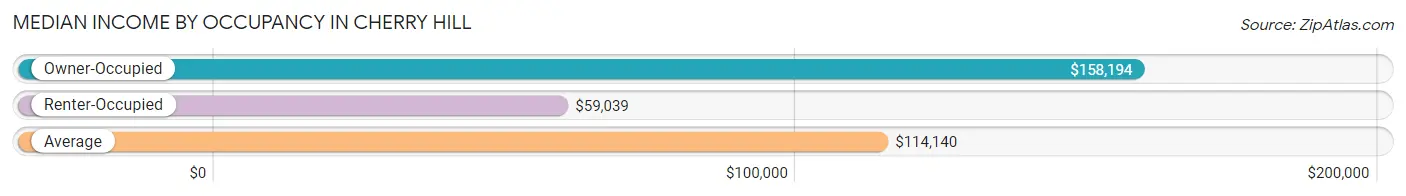
| Occupancy Type | # Households | Median Income |
| Owner-Occupied | 4,356 (59.9%) | $158,194 |
| Renter-Occupied | 2,916 (40.1%) | $59,039 |
| Average | 7,272 (100.0%) | $114,140 |
Occupancy by Householder Income Bracket in Cherry Hill
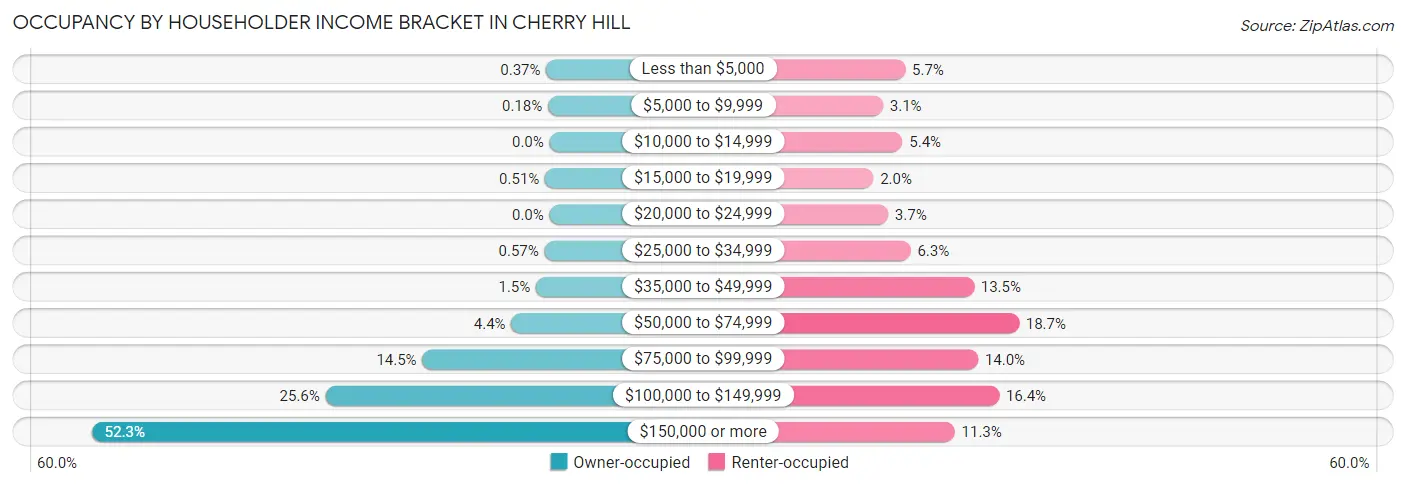
| Income Bracket | Owner-occupied | Renter-occupied |
| Less than $5,000 | 16 (0.4%) | 165 (5.7%) |
| $5,000 to $9,999 | 8 (0.2%) | 91 (3.1%) |
| $10,000 to $14,999 | 0 (0.0%) | 156 (5.3%) |
| $15,000 to $19,999 | 22 (0.5%) | 59 (2.0%) |
| $20,000 to $24,999 | 0 (0.0%) | 108 (3.7%) |
| $25,000 to $34,999 | 25 (0.6%) | 183 (6.3%) |
| $35,000 to $49,999 | 67 (1.5%) | 394 (13.5%) |
| $50,000 to $74,999 | 190 (4.4%) | 544 (18.7%) |
| $75,000 to $99,999 | 633 (14.5%) | 408 (14.0%) |
| $100,000 to $149,999 | 1,115 (25.6%) | 478 (16.4%) |
| $150,000 or more | 2,280 (52.3%) | 330 (11.3%) |
| Total | 4,356 (100.0%) | 2,916 (100.0%) |
Monthly Housing Cost Tiers in Cherry Hill
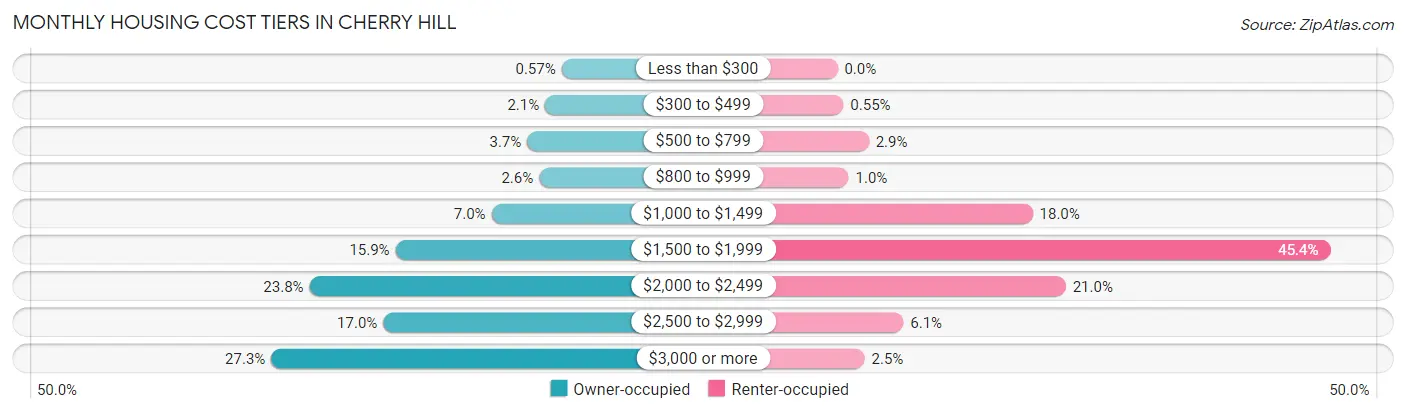
| Monthly Cost | Owner-occupied | Renter-occupied |
| Less than $300 | 25 (0.6%) | 0 (0.0%) |
| $300 to $499 | 91 (2.1%) | 16 (0.5%) |
| $500 to $799 | 163 (3.7%) | 84 (2.9%) |
| $800 to $999 | 115 (2.6%) | 30 (1.0%) |
| $1,000 to $1,499 | 306 (7.0%) | 524 (18.0%) |
| $1,500 to $1,999 | 691 (15.9%) | 1,323 (45.4%) |
| $2,000 to $2,499 | 1,036 (23.8%) | 613 (21.0%) |
| $2,500 to $2,999 | 740 (17.0%) | 177 (6.1%) |
| $3,000 or more | 1,189 (27.3%) | 73 (2.5%) |
| Total | 4,356 (100.0%) | 2,916 (100.0%) |
Physical Housing Characteristics in Cherry Hill
Housing Structures in Cherry Hill
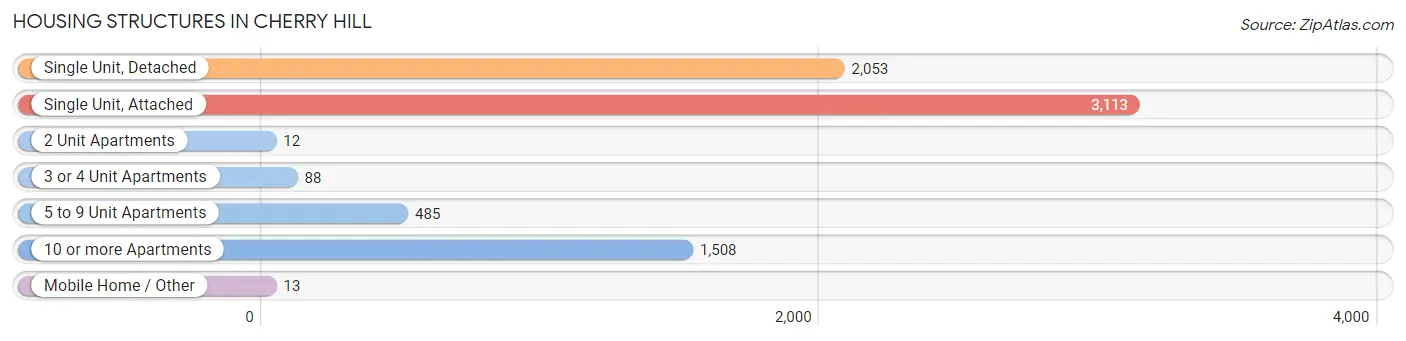
| Structure Type | # Housing Units | % Housing Units |
| Single Unit, Detached | 2,053 | 28.2% |
| Single Unit, Attached | 3,113 | 42.8% |
| 2 Unit Apartments | 12 | 0.2% |
| 3 or 4 Unit Apartments | 88 | 1.2% |
| 5 to 9 Unit Apartments | 485 | 6.7% |
| 10 or more Apartments | 1,508 | 20.7% |
| Mobile Home / Other | 13 | 0.2% |
| Total | 7,272 | 100.0% |
Housing Structures by Occupancy in Cherry Hill
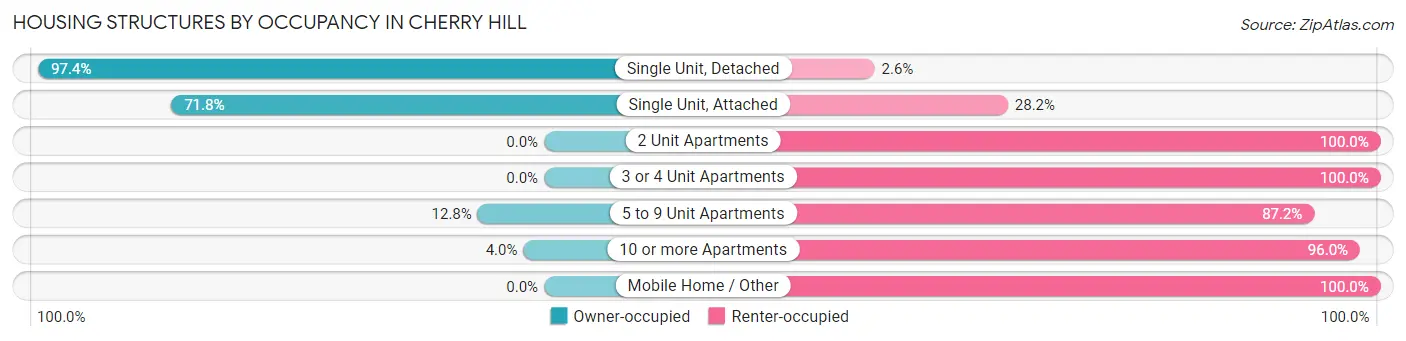
| Structure Type | Owner-occupied | Renter-occupied |
| Single Unit, Detached | 2,000 (97.4%) | 53 (2.6%) |
| Single Unit, Attached | 2,234 (71.8%) | 879 (28.2%) |
| 2 Unit Apartments | 0 (0.0%) | 12 (100.0%) |
| 3 or 4 Unit Apartments | 0 (0.0%) | 88 (100.0%) |
| 5 to 9 Unit Apartments | 62 (12.8%) | 423 (87.2%) |
| 10 or more Apartments | 60 (4.0%) | 1,448 (96.0%) |
| Mobile Home / Other | 0 (0.0%) | 13 (100.0%) |
| Total | 4,356 (59.9%) | 2,916 (40.1%) |
Housing Structures by Number of Rooms in Cherry Hill
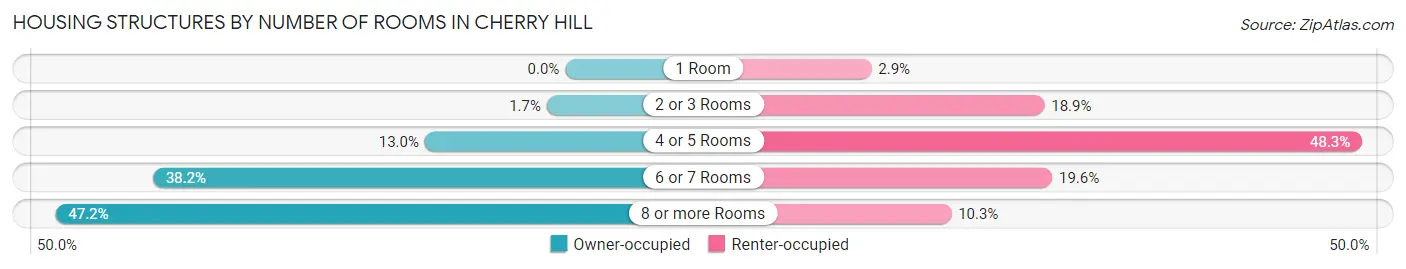
| Number of Rooms | Owner-occupied | Renter-occupied |
| 1 Room | 0 (0.0%) | 85 (2.9%) |
| 2 or 3 Rooms | 74 (1.7%) | 551 (18.9%) |
| 4 or 5 Rooms | 566 (13.0%) | 1,408 (48.3%) |
| 6 or 7 Rooms | 1,662 (38.2%) | 572 (19.6%) |
| 8 or more Rooms | 2,054 (47.1%) | 300 (10.3%) |
| Total | 4,356 (100.0%) | 2,916 (100.0%) |
Housing Structure by Heating Type in Cherry Hill
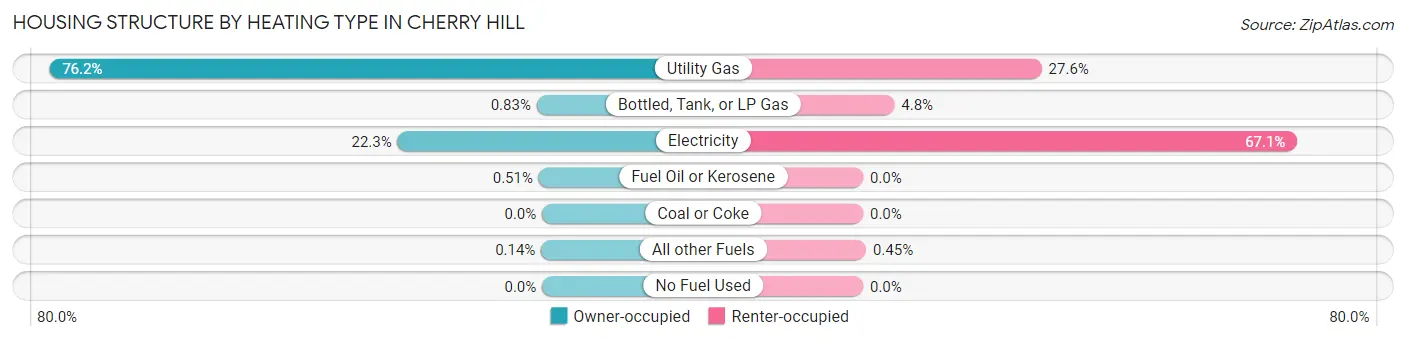
| Heating Type | Owner-occupied | Renter-occupied |
| Utility Gas | 3,319 (76.2%) | 805 (27.6%) |
| Bottled, Tank, or LP Gas | 36 (0.8%) | 141 (4.8%) |
| Electricity | 973 (22.3%) | 1,957 (67.1%) |
| Fuel Oil or Kerosene | 22 (0.5%) | 0 (0.0%) |
| Coal or Coke | 0 (0.0%) | 0 (0.0%) |
| All other Fuels | 6 (0.1%) | 13 (0.4%) |
| No Fuel Used | 0 (0.0%) | 0 (0.0%) |
| Total | 4,356 (100.0%) | 2,916 (100.0%) |
Household Vehicle Usage in Cherry Hill
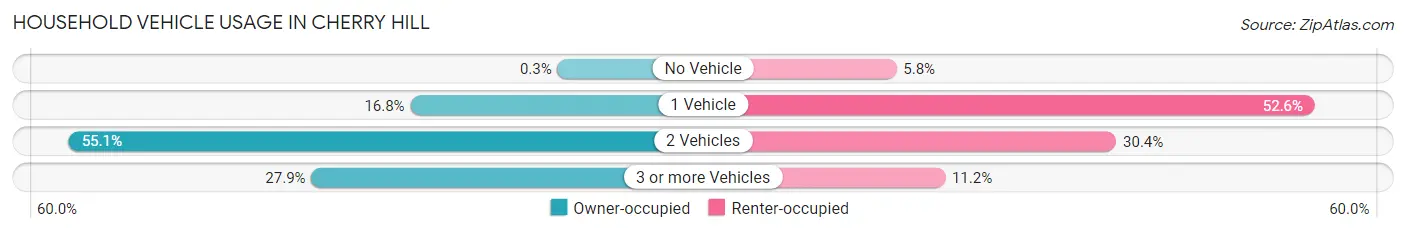
| Vehicles per Household | Owner-occupied | Renter-occupied |
| No Vehicle | 13 (0.3%) | 168 (5.8%) |
| 1 Vehicle | 731 (16.8%) | 1,535 (52.6%) |
| 2 Vehicles | 2,398 (55.0%) | 886 (30.4%) |
| 3 or more Vehicles | 1,214 (27.9%) | 327 (11.2%) |
| Total | 4,356 (100.0%) | 2,916 (100.0%) |
Real Estate & Mortgages in Cherry Hill
Real Estate and Mortgage Overview in Cherry Hill
| Characteristic | Without Mortgage | With Mortgage |
| Housing Units | 397 | 3,959 |
| Median Property Value | $459,200 | $396,600 |
| Median Household Income | $148,536 | $2,102 |
| Monthly Housing Costs | $699 | $1,189 |
| Real Estate Taxes | $4,360 | $195 |
Property Value by Mortgage Status in Cherry Hill
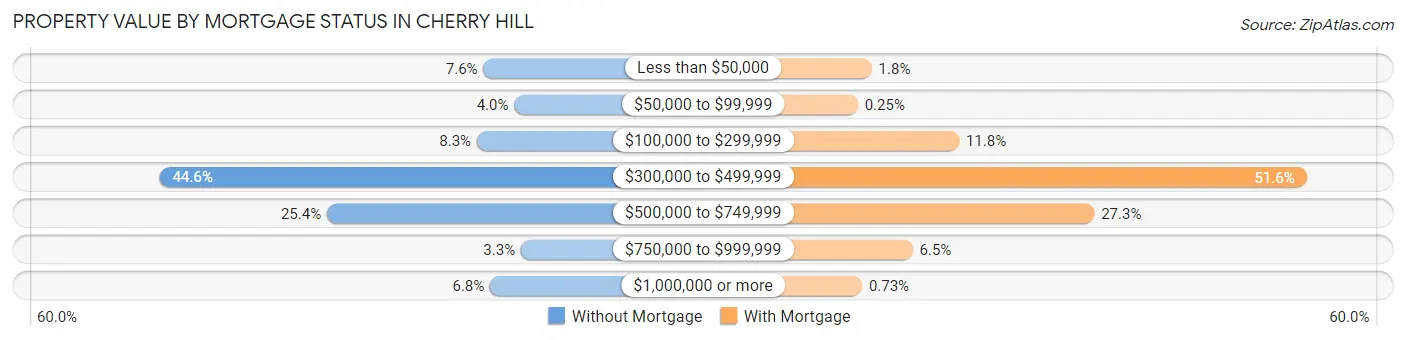
| Property Value | Without Mortgage | With Mortgage |
| Less than $50,000 | 30 (7.6%) | 73 (1.8%) |
| $50,000 to $99,999 | 16 (4.0%) | 10 (0.3%) |
| $100,000 to $299,999 | 33 (8.3%) | 468 (11.8%) |
| $300,000 to $499,999 | 177 (44.6%) | 2,041 (51.5%) |
| $500,000 to $749,999 | 101 (25.4%) | 1,080 (27.3%) |
| $750,000 to $999,999 | 13 (3.3%) | 258 (6.5%) |
| $1,000,000 or more | 27 (6.8%) | 29 (0.7%) |
| Total | 397 (100.0%) | 3,959 (100.0%) |
Household Income by Mortgage Status in Cherry Hill
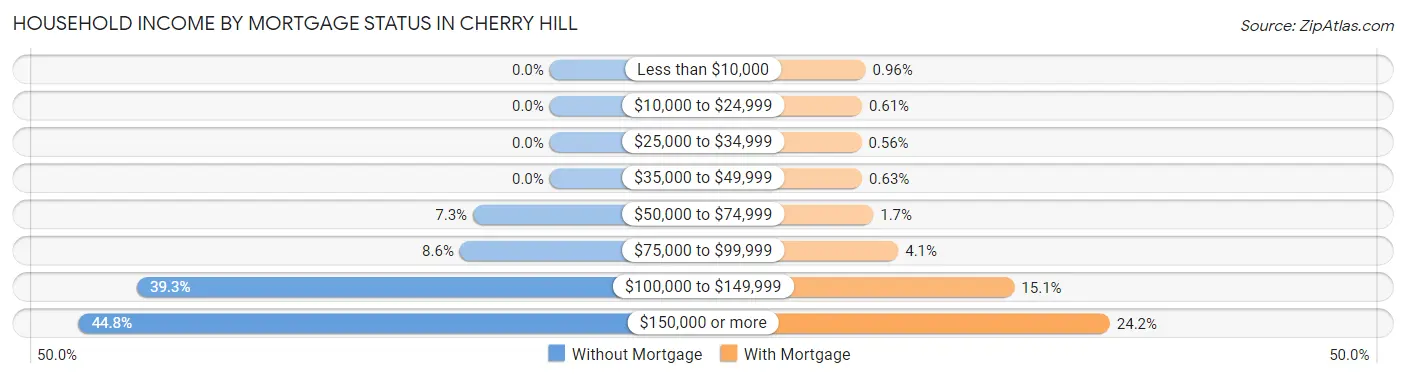
| Household Income | Without Mortgage | With Mortgage |
| Less than $10,000 | 0 (0.0%) | 38 (1.0%) |
| $10,000 to $24,999 | 0 (0.0%) | 24 (0.6%) |
| $25,000 to $34,999 | 0 (0.0%) | 22 (0.6%) |
| $35,000 to $49,999 | 0 (0.0%) | 25 (0.6%) |
| $50,000 to $74,999 | 29 (7.3%) | 67 (1.7%) |
| $75,000 to $99,999 | 34 (8.6%) | 161 (4.1%) |
| $100,000 to $149,999 | 156 (39.3%) | 599 (15.1%) |
| $150,000 or more | 178 (44.8%) | 959 (24.2%) |
| Total | 397 (100.0%) | 3,959 (100.0%) |
Property Value to Household Income Ratio in Cherry Hill
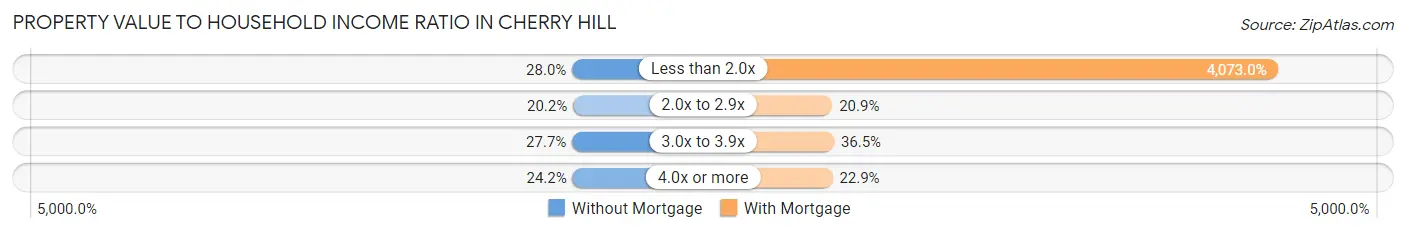
| Value-to-Income Ratio | Without Mortgage | With Mortgage |
| Less than 2.0x | 111 (28.0%) | 161,250 (4,073.0%) |
| 2.0x to 2.9x | 80 (20.2%) | 829 (20.9%) |
| 3.0x to 3.9x | 110 (27.7%) | 1,445 (36.5%) |
| 4.0x or more | 96 (24.2%) | 906 (22.9%) |
| Total | 397 (100.0%) | 3,959 (100.0%) |
Real Estate Taxes by Mortgage Status in Cherry Hill
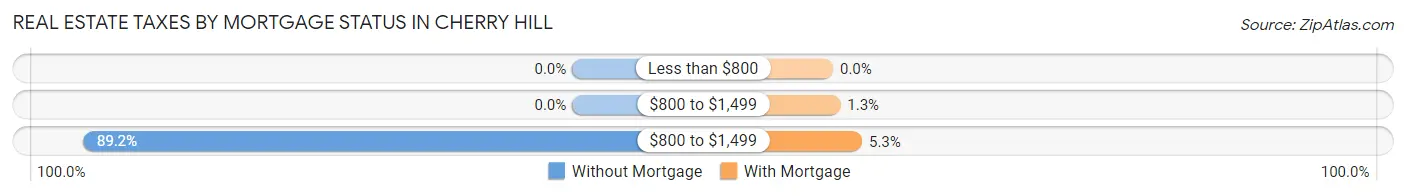
| Property Taxes | Without Mortgage | With Mortgage |
| Less than $800 | 0 (0.0%) | 0 (0.0%) |
| $800 to $1,499 | 0 (0.0%) | 53 (1.3%) |
| $800 to $1,499 | 354 (89.2%) | 210 (5.3%) |
| Total | 397 (100.0%) | 3,959 (100.0%) |
Health & Disability in Cherry Hill
Health Insurance Coverage by Age in Cherry Hill
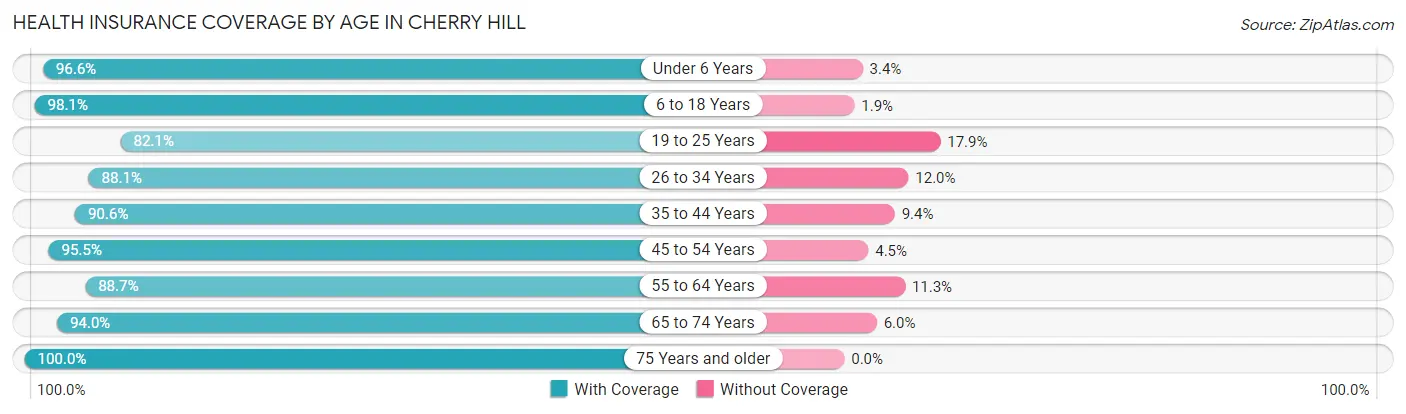
| Age Bracket | With Coverage | Without Coverage |
| Under 6 Years | 1,923 (96.6%) | 68 (3.4%) |
| 6 to 18 Years | 5,244 (98.1%) | 100 (1.9%) |
| 19 to 25 Years | 1,229 (82.1%) | 268 (17.9%) |
| 26 to 34 Years | 2,911 (88.0%) | 395 (11.9%) |
| 35 to 44 Years | 3,355 (90.6%) | 348 (9.4%) |
| 45 to 54 Years | 2,802 (95.5%) | 131 (4.5%) |
| 55 to 64 Years | 2,039 (88.7%) | 260 (11.3%) |
| 65 to 74 Years | 855 (94.0%) | 55 (6.0%) |
| 75 Years and older | 257 (100.0%) | 0 (0.0%) |
| Total | 20,615 (92.7%) | 1,625 (7.3%) |
Health Insurance Coverage by Citizenship Status in Cherry Hill
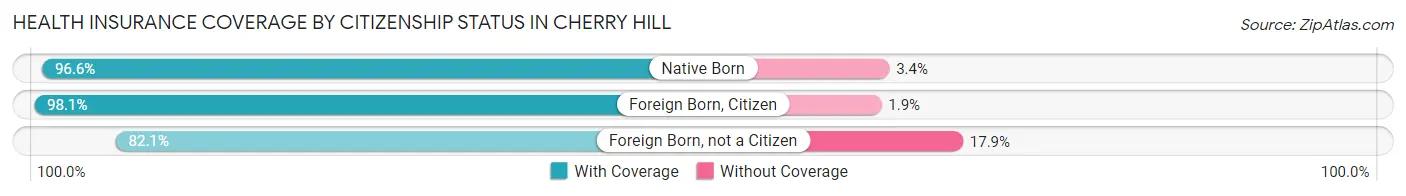
| Citizenship Status | With Coverage | Without Coverage |
| Native Born | 1,923 (96.6%) | 68 (3.4%) |
| Foreign Born, Citizen | 5,244 (98.1%) | 100 (1.9%) |
| Foreign Born, not a Citizen | 1,229 (82.1%) | 268 (17.9%) |
Health Insurance Coverage by Household Income in Cherry Hill
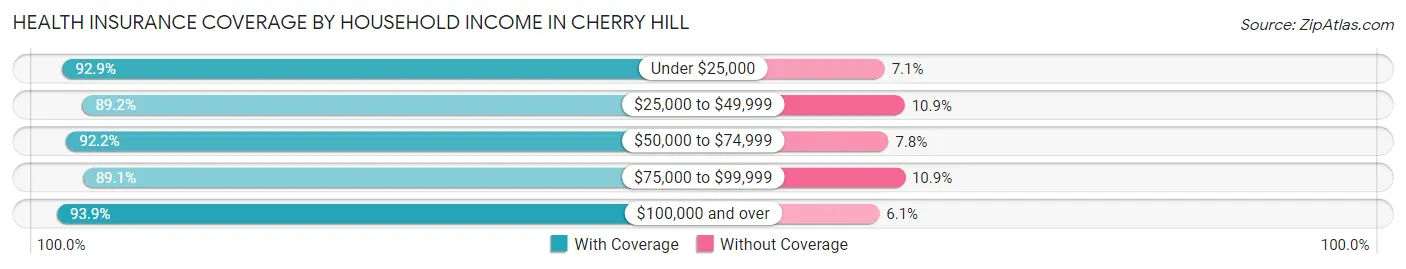
| Household Income | With Coverage | Without Coverage |
| Under $25,000 | 1,215 (92.9%) | 93 (7.1%) |
| $25,000 to $49,999 | 1,454 (89.1%) | 177 (10.8%) |
| $50,000 to $74,999 | 1,498 (92.2%) | 127 (7.8%) |
| $75,000 to $99,999 | 2,780 (89.1%) | 340 (10.9%) |
| $100,000 and over | 13,657 (93.9%) | 887 (6.1%) |
Public vs Private Health Insurance Coverage by Age in Cherry Hill
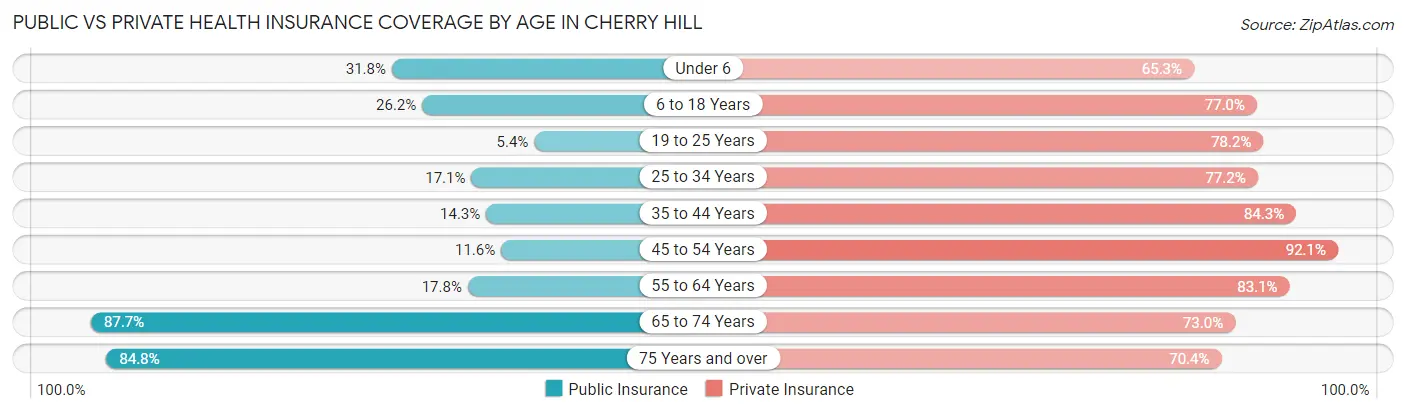
| Age Bracket | Public Insurance | Private Insurance |
| Under 6 | 634 (31.8%) | 1,301 (65.3%) |
| 6 to 18 Years | 1,401 (26.2%) | 4,117 (77.0%) |
| 19 to 25 Years | 81 (5.4%) | 1,171 (78.2%) |
| 25 to 34 Years | 565 (17.1%) | 2,551 (77.2%) |
| 35 to 44 Years | 531 (14.3%) | 3,122 (84.3%) |
| 45 to 54 Years | 339 (11.6%) | 2,700 (92.1%) |
| 55 to 64 Years | 408 (17.7%) | 1,910 (83.1%) |
| 65 to 74 Years | 798 (87.7%) | 664 (73.0%) |
| 75 Years and over | 218 (84.8%) | 181 (70.4%) |
| Total | 4,975 (22.4%) | 17,717 (79.7%) |
Disability Status by Sex by Age in Cherry Hill
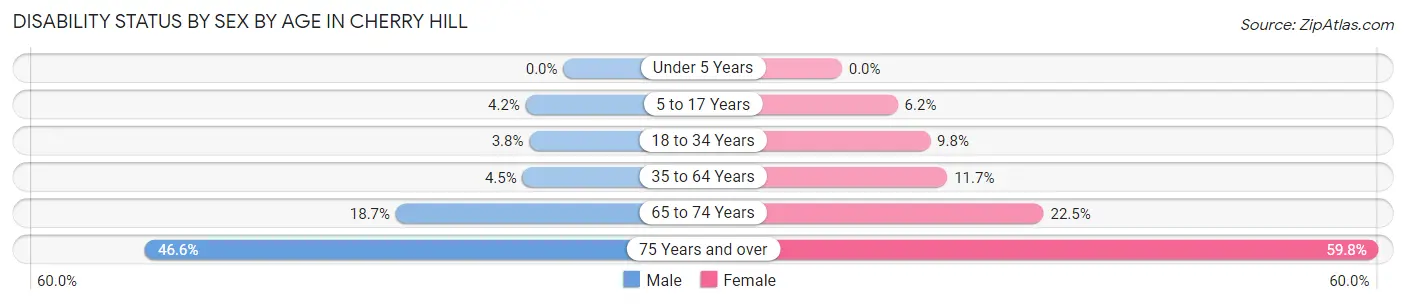
| Age Bracket | Male | Female |
| Under 5 Years | 0 (0.0%) | 0 (0.0%) |
| 5 to 17 Years | 104 (4.2%) | 174 (6.2%) |
| 18 to 34 Years | 90 (3.8%) | 268 (9.8%) |
| 35 to 64 Years | 184 (4.5%) | 573 (11.7%) |
| 65 to 74 Years | 61 (18.6%) | 131 (22.5%) |
| 75 Years and over | 34 (46.6%) | 110 (59.8%) |
Disability Class by Sex by Age in Cherry Hill
Disability Class: Hearing Difficulty
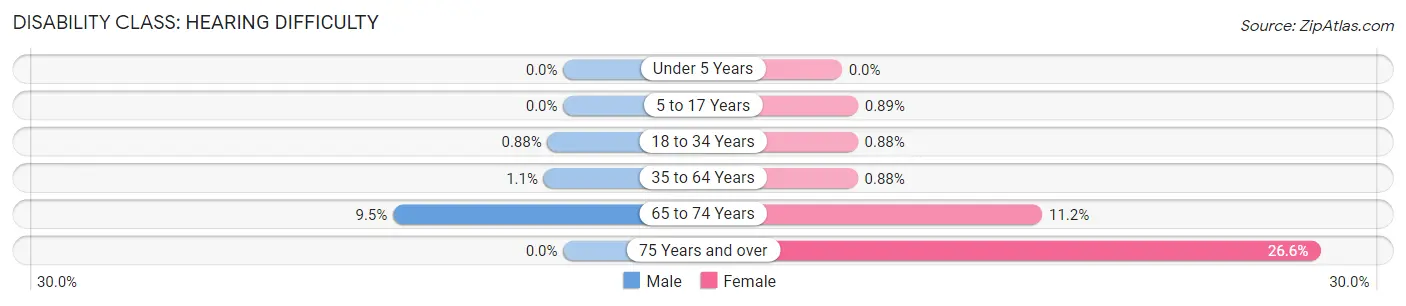
| Age Bracket | Male | Female |
| Under 5 Years | 0 (0.0%) | 0 (0.0%) |
| 5 to 17 Years | 0 (0.0%) | 25 (0.9%) |
| 18 to 34 Years | 21 (0.9%) | 24 (0.9%) |
| 35 to 64 Years | 44 (1.1%) | 43 (0.9%) |
| 65 to 74 Years | 31 (9.5%) | 65 (11.2%) |
| 75 Years and over | 0 (0.0%) | 49 (26.6%) |
Disability Class: Vision Difficulty
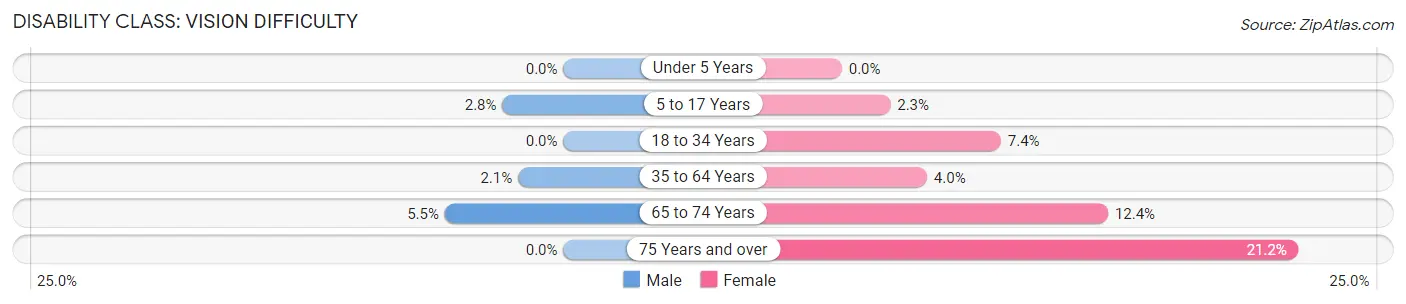
| Age Bracket | Male | Female |
| Under 5 Years | 0 (0.0%) | 0 (0.0%) |
| 5 to 17 Years | 70 (2.8%) | 63 (2.2%) |
| 18 to 34 Years | 0 (0.0%) | 201 (7.4%) |
| 35 to 64 Years | 85 (2.1%) | 193 (4.0%) |
| 65 to 74 Years | 18 (5.5%) | 72 (12.3%) |
| 75 Years and over | 0 (0.0%) | 39 (21.2%) |
Disability Class: Cognitive Difficulty
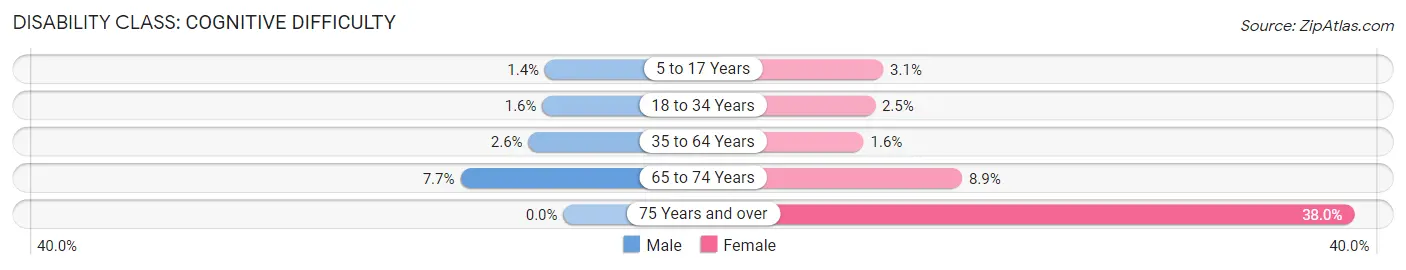
| Age Bracket | Male | Female |
| 5 to 17 Years | 34 (1.4%) | 86 (3.1%) |
| 18 to 34 Years | 37 (1.6%) | 67 (2.5%) |
| 35 to 64 Years | 105 (2.6%) | 79 (1.6%) |
| 65 to 74 Years | 25 (7.6%) | 52 (8.9%) |
| 75 Years and over | 0 (0.0%) | 70 (38.0%) |
Disability Class: Ambulatory Difficulty
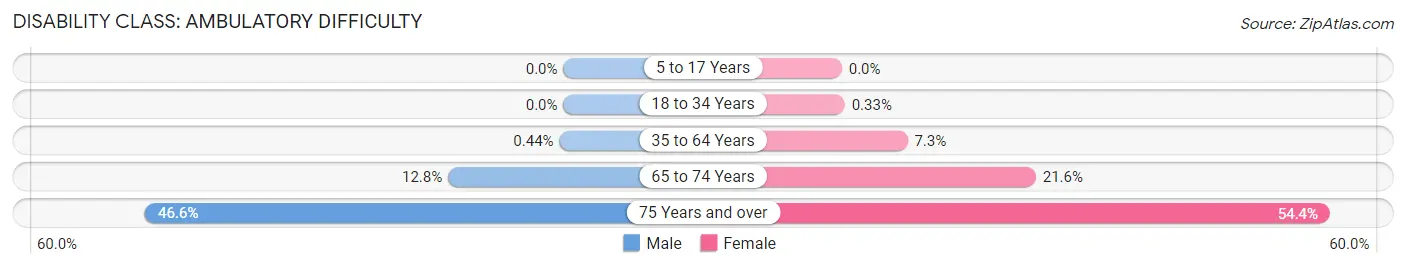
| Age Bracket | Male | Female |
| 5 to 17 Years | 0 (0.0%) | 0 (0.0%) |
| 18 to 34 Years | 0 (0.0%) | 9 (0.3%) |
| 35 to 64 Years | 18 (0.4%) | 357 (7.3%) |
| 65 to 74 Years | 42 (12.8%) | 126 (21.6%) |
| 75 Years and over | 34 (46.6%) | 100 (54.3%) |
Disability Class: Self-Care Difficulty
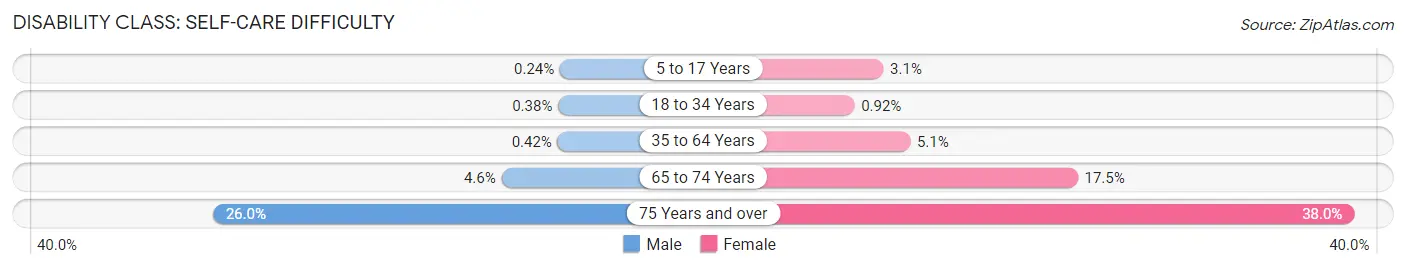
| Age Bracket | Male | Female |
| 5 to 17 Years | 6 (0.2%) | 86 (3.1%) |
| 18 to 34 Years | 9 (0.4%) | 25 (0.9%) |
| 35 to 64 Years | 17 (0.4%) | 247 (5.1%) |
| 65 to 74 Years | 15 (4.6%) | 102 (17.5%) |
| 75 Years and over | 19 (26.0%) | 70 (38.0%) |
Technology Access in Cherry Hill
Computing Device Access in Cherry Hill
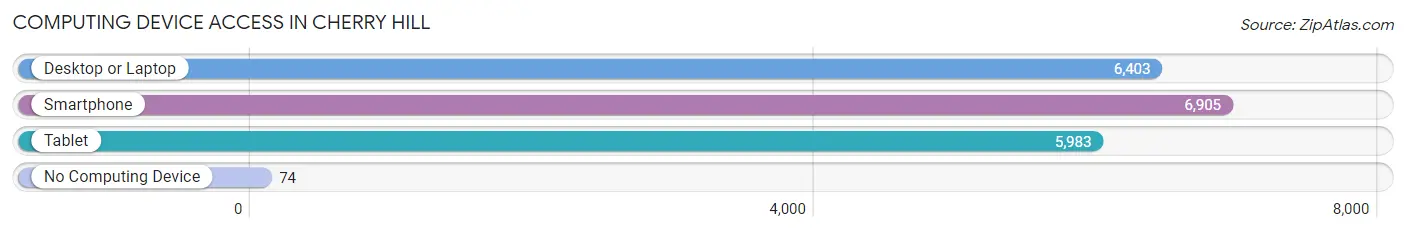
| Device Type | # Households | % Households |
| Desktop or Laptop | 6,403 | 88.0% |
| Smartphone | 6,905 | 95.0% |
| Tablet | 5,983 | 82.3% |
| No Computing Device | 74 | 1.0% |
| Total | 7,272 | 100.0% |
Internet Access in Cherry Hill
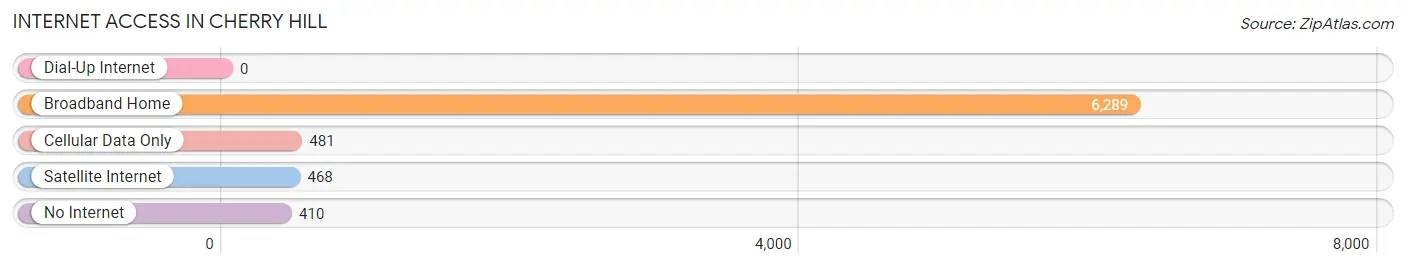
| Internet Type | # Households | % Households |
| Dial-Up Internet | 0 | 0.0% |
| Broadband Home | 6,289 | 86.5% |
| Cellular Data Only | 481 | 6.6% |
| Satellite Internet | 468 | 6.4% |
| No Internet | 410 | 5.6% |
| Total | 7,272 | 100.0% |
Cherry Hill Summary
Cherry Hill is a small unincorporated community located in the northern part of Caroline County, Virginia. It is situated on the south bank of the Rappahannock River, approximately 10 miles east of Fredericksburg. The community is bordered by the towns of Port Royal and Bowling Green to the north, and the town of Ladysmith to the south.
History
Cherry Hill was first settled in the early 1700s by a group of German immigrants. The community was named after the cherry trees that grew in abundance in the area. The first post office was established in 1845, and the town was officially incorporated in 1848.
The town was a major stop on the Richmond, Fredericksburg and Potomac Railroad, which ran through the area from 1836 to 1872. During the Civil War, Cherry Hill was the site of several battles, including the Battle of Port Royal and the Battle of Bowling Green.
Geography
Cherry Hill is located in the northern part of Caroline County, Virginia. It is situated on the south bank of the Rappahannock River, approximately 10 miles east of Fredericksburg. The community is bordered by the towns of Port Royal and Bowling Green to the north, and the town of Ladysmith to the south.
The town is located in a rural area, with rolling hills and forests. The climate is temperate, with hot summers and mild winters.
Economy
Cherry Hill is a small, rural community with a limited economy. The primary industries are agriculture and forestry. The town is home to several small businesses, including a general store, a gas station, and a few restaurants.
Demographics
As of the 2010 census, the population of Cherry Hill was 1,093. The racial makeup of the town was 94.3% White, 3.2% African American, 0.7% Native American, 0.2% Asian, and 1.6% from other races. The median household income was $41,250, and the median family income was $50,000.
Conclusion
Cherry Hill is a small, rural community located in the northern part of Caroline County, Virginia. It was first settled in the early 1700s by a group of German immigrants, and was named after the cherry trees that grew in abundance in the area. The town was a major stop on the Richmond, Fredericksburg and Potomac Railroad, and was the site of several battles during the Civil War. The primary industries in Cherry Hill are agriculture and forestry, and the town is home to several small businesses. As of the 2010 census, the population of Cherry Hill was 1,093.
Common Questions
What is Per Capita Income in Cherry Hill?
Per Capita income in Cherry Hill is $44,281.
What is the Median Family Income in Cherry Hill?
Median Family Income in Cherry Hill is $135,323.
What is the Median Household income in Cherry Hill?
Median Household Income in Cherry Hill is $114,140.
What is Income or Wage Gap in Cherry Hill?
Income or Wage Gap in Cherry Hill is 34.8%.
Women in Cherry Hill earn 65.2 cents for every dollar earned by a man.
What is Family Income Deficit in Cherry Hill?
Family Income Deficit in Cherry Hill is $18,404.
Families that are below poverty line in Cherry Hill earn $18,404 less on average than the poverty threshold level.
What is Inequality or Gini Index in Cherry Hill?
Inequality or Gini Index in Cherry Hill is 0.37.
What is the Total Population of Cherry Hill?
Total Population of Cherry Hill is 22,505.
What is the Total Male Population of Cherry Hill?
Total Male Population of Cherry Hill is 10,176.
What is the Total Female Population of Cherry Hill?
Total Female Population of Cherry Hill is 12,329.
What is the Ratio of Males per 100 Females in Cherry Hill?
There are 82.54 Males per 100 Females in Cherry Hill.
What is the Ratio of Females per 100 Males in Cherry Hill?
There are 121.16 Females per 100 Males in Cherry Hill.
What is the Median Population Age in Cherry Hill?
Median Population Age in Cherry Hill is 32.4 Years.
What is the Average Family Size in Cherry Hill
Average Family Size in Cherry Hill is 3.8 People.
What is the Average Household Size in Cherry Hill
Average Household Size in Cherry Hill is 3.1 People.
How Large is the Labor Force in Cherry Hill?
There are 13,065 People in the Labor Forcein in Cherry Hill.
What is the Percentage of People in the Labor Force in Cherry Hill?
81.7% of People are in the Labor Force in Cherry Hill.
What is the Unemployment Rate in Cherry Hill?
Unemployment Rate in Cherry Hill is 5.5%.