Zip Codes with the Highest Percentage of Population Employed in Security & Protection in Roanoke, VA
RELATED REPORTS & OPTIONS
Security & Protection
Roanoke
Compare Zip Codes
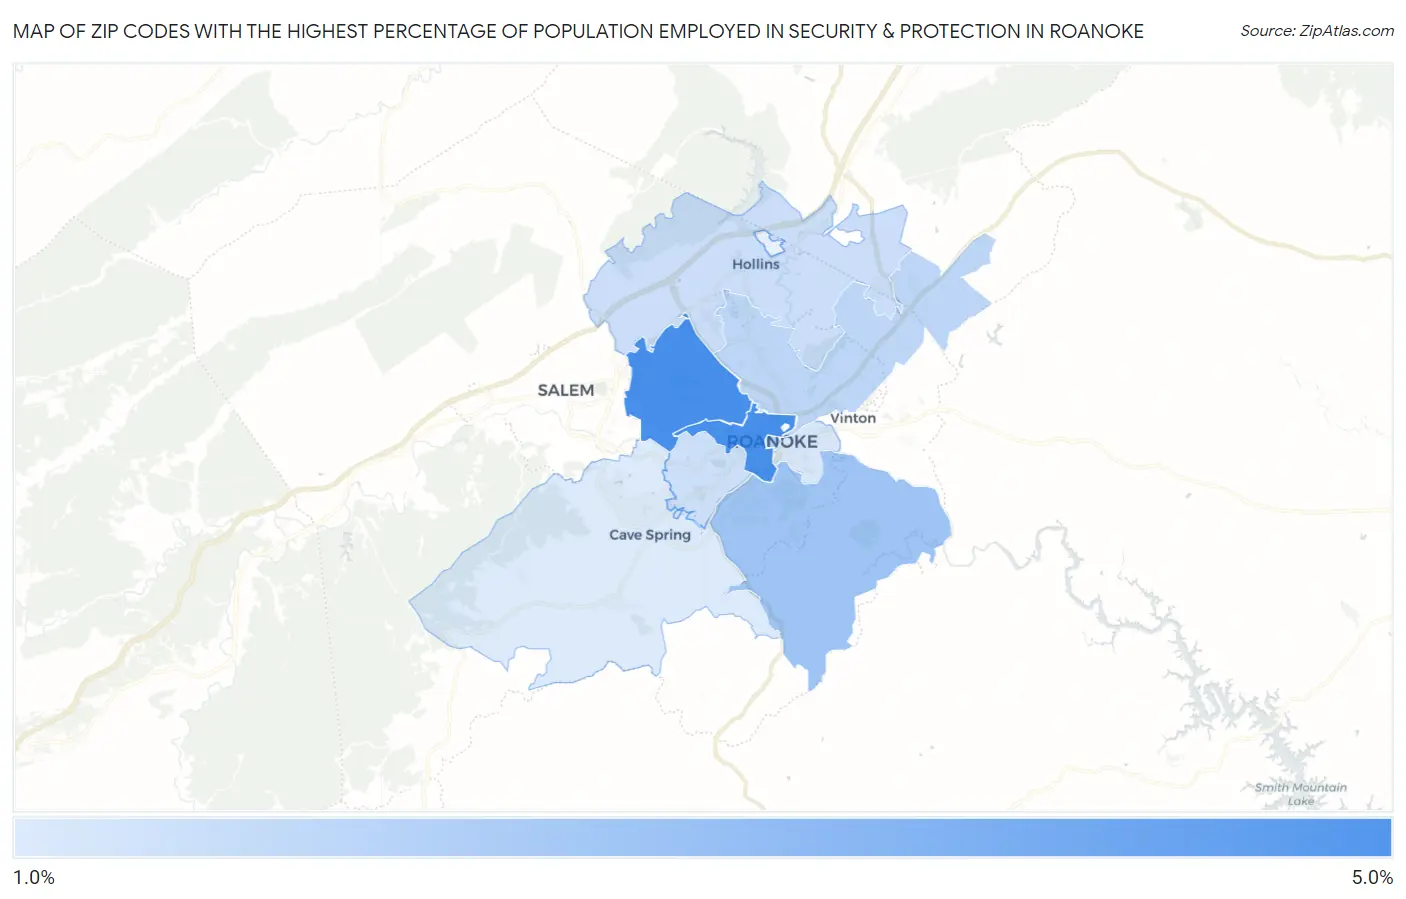
Map of Zip Codes with the Highest Percentage of Population Employed in Security & Protection in Roanoke
1.2%
4.5%
Zip Codes with the Highest Percentage of Population Employed in Security & Protection in Roanoke, VA
| Zip Code | % Employed | vs State | vs National | |
| 1. | 24016 | 4.5% | 2.7%(+1.83)#162 | 2.1%(+2.36)#3,598 |
| 2. | 24017 | 4.5% | 2.7%(+1.82)#164 | 2.1%(+2.36)#3,604 |
| 3. | 24014 | 2.6% | 2.7%(-0.095)#354 | 2.1%(+0.439)#9,065 |
| 4. | 24011 | 2.1% | 2.7%(-0.629)#431 | 2.1%(-0.095)#12,224 |
| 5. | 24012 | 1.9% | 2.7%(-0.758)#455 | 2.1%(-0.225)#13,058 |
| 6. | 24019 | 1.6% | 2.7%(-1.09)#511 | 2.1%(-0.557)#15,471 |
| 7. | 24015 | 1.6% | 2.7%(-1.12)#517 | 2.1%(-0.583)#15,679 |
| 8. | 24013 | 1.3% | 2.7%(-1.39)#555 | 2.1%(-0.861)#17,845 |
| 9. | 24018 | 1.2% | 2.7%(-1.47)#564 | 2.1%(-0.934)#18,388 |
1
Common Questions
What are the Top 5 Zip Codes with the Highest Percentage of Population Employed in Security & Protection in Roanoke, VA?
Top 5 Zip Codes with the Highest Percentage of Population Employed in Security & Protection in Roanoke, VA are:
What zip code has the Highest Percentage of Population Employed in Security & Protection in Roanoke, VA?
24016 has the Highest Percentage of Population Employed in Security & Protection in Roanoke, VA with 4.5%.
What is the Percentage of Population Employed in Security & Protection in Roanoke, VA?
Percentage of Population Employed in Security & Protection in Roanoke is 2.6%.
What is the Percentage of Population Employed in Security & Protection in Virginia?
Percentage of Population Employed in Security & Protection in Virginia is 2.7%.
What is the Percentage of Population Employed in Security & Protection in the United States?
Percentage of Population Employed in Security & Protection in the United States is 2.1%.