Massanutten, VA Map & Demographics
Massanutten Map
Massanutten Overview
$54,476
PER CAPITA INCOME
$102,981
AVG FAMILY INCOME
$102,102
AVG HOUSEHOLD INCOME
7.8%
WAGE / INCOME GAP [ % ]
92.2¢/ $1
WAGE / INCOME GAP [ $ ]
0.37
INEQUALITY / GINI INDEX
2,368
TOTAL POPULATION
1,140
MALE POPULATION
1,228
FEMALE POPULATION
92.83
MALES / 100 FEMALES
107.72
FEMALES / 100 MALES
54.1
MEDIAN AGE
2.8
AVG FAMILY SIZE
2.4
AVG HOUSEHOLD SIZE
1,320
LABOR FORCE [ PEOPLE ]
64.0%
PERCENT IN LABOR FORCE
2.4%
UNEMPLOYMENT RATE
Massanutten Area Codes
Income in Massanutten
Income Overview in Massanutten
Per Capita Income in Massanutten is $54,476, while median incomes of families and households are $102,981 and $102,102 respectively.
| Characteristic | Number | Measure |
| Per Capita Income | 2,368 | $54,476 |
| Median Family Income | 758 | $102,981 |
| Mean Family Income | 758 | $118,804 |
| Median Household Income | 977 | $102,102 |
| Mean Household Income | 977 | $128,294 |
| Income Deficit | 758 | $0 |
| Wage / Income Gap (%) | 2,368 | 7.78% |
| Wage / Income Gap ($) | 2,368 | 92.22¢ per $1 |
| Gini / Inequality Index | 2,368 | 0.37 |
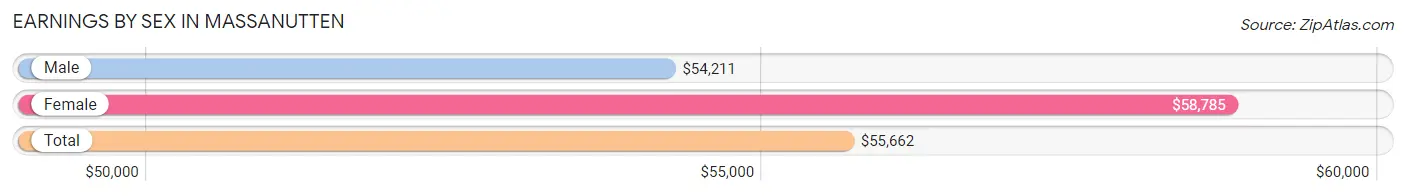
Earnings by Sex in Massanutten
Average Earnings in Massanutten are $55,662, $54,211 for men and $58,785 for women, a difference of 7.8%.
| Sex | Number | Average Earnings |
| Male | 750 (53.4%) | $54,211 |
| Female | 655 (46.6%) | $58,785 |
| Total | 1,405 (100.0%) | $55,662 |
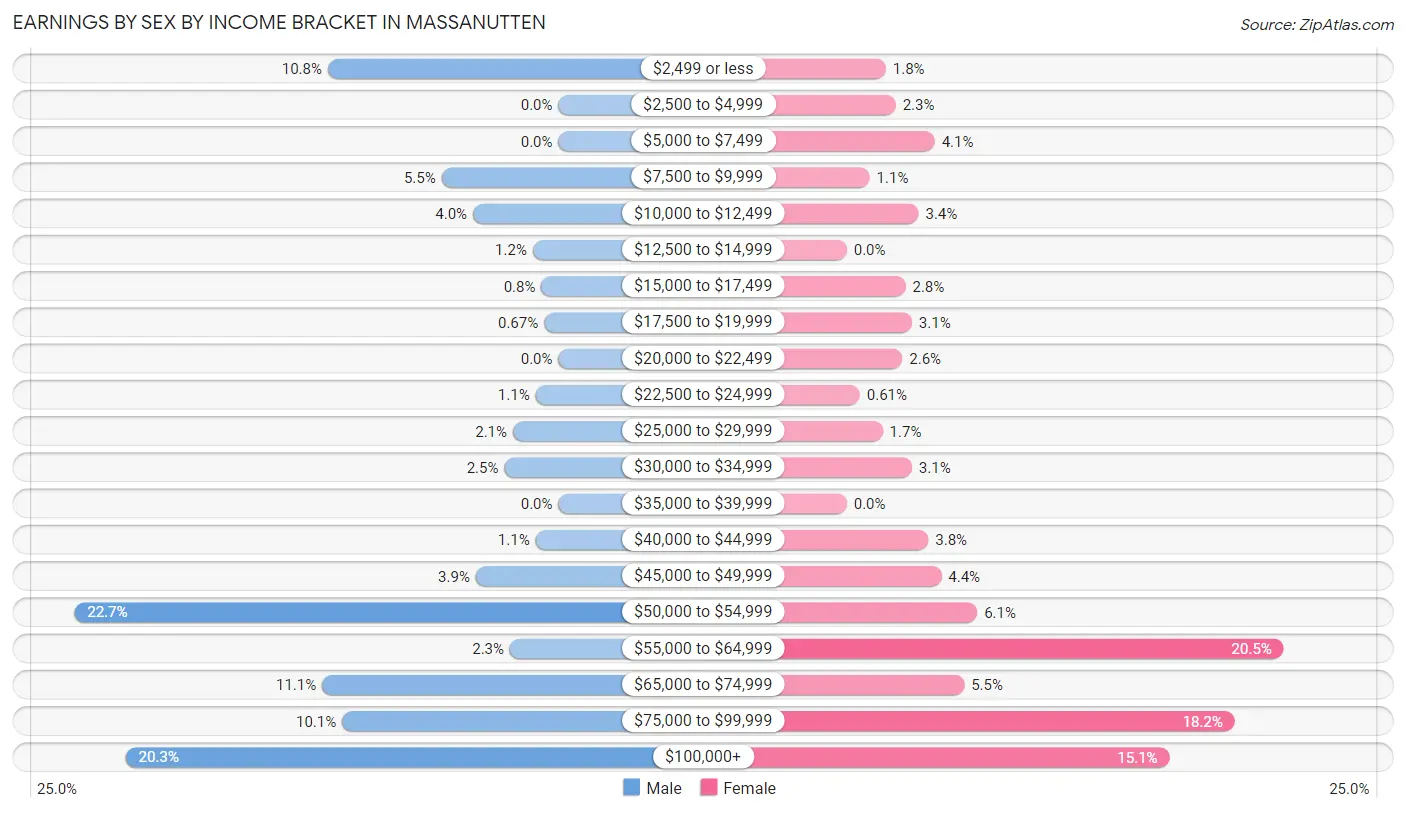
Earnings by Sex by Income Bracket in Massanutten
The most common earnings brackets in Massanutten are $50,000 to $54,999 for men (170 | 22.7%) and $55,000 to $64,999 for women (134 | 20.5%).
| Income | Male | Female |
| $2,499 or less | 81 (10.8%) | 12 (1.8%) |
| $2,500 to $4,999 | 0 (0.0%) | 15 (2.3%) |
| $5,000 to $7,499 | 0 (0.0%) | 27 (4.1%) |
| $7,500 to $9,999 | 41 (5.5%) | 7 (1.1%) |
| $10,000 to $12,499 | 30 (4.0%) | 22 (3.4%) |
| $12,500 to $14,999 | 9 (1.2%) | 0 (0.0%) |
| $15,000 to $17,499 | 6 (0.8%) | 18 (2.8%) |
| $17,500 to $19,999 | 5 (0.7%) | 20 (3.0%) |
| $20,000 to $22,499 | 0 (0.0%) | 17 (2.6%) |
| $22,500 to $24,999 | 8 (1.1%) | 4 (0.6%) |
| $25,000 to $29,999 | 16 (2.1%) | 11 (1.7%) |
| $30,000 to $34,999 | 19 (2.5%) | 20 (3.0%) |
| $35,000 to $39,999 | 0 (0.0%) | 0 (0.0%) |
| $40,000 to $44,999 | 8 (1.1%) | 25 (3.8%) |
| $45,000 to $49,999 | 29 (3.9%) | 29 (4.4%) |
| $50,000 to $54,999 | 170 (22.7%) | 40 (6.1%) |
| $55,000 to $64,999 | 17 (2.3%) | 134 (20.5%) |
| $65,000 to $74,999 | 83 (11.1%) | 36 (5.5%) |
| $75,000 to $99,999 | 76 (10.1%) | 119 (18.2%) |
| $100,000+ | 152 (20.3%) | 99 (15.1%) |
| Total | 750 (100.0%) | 655 (100.0%) |
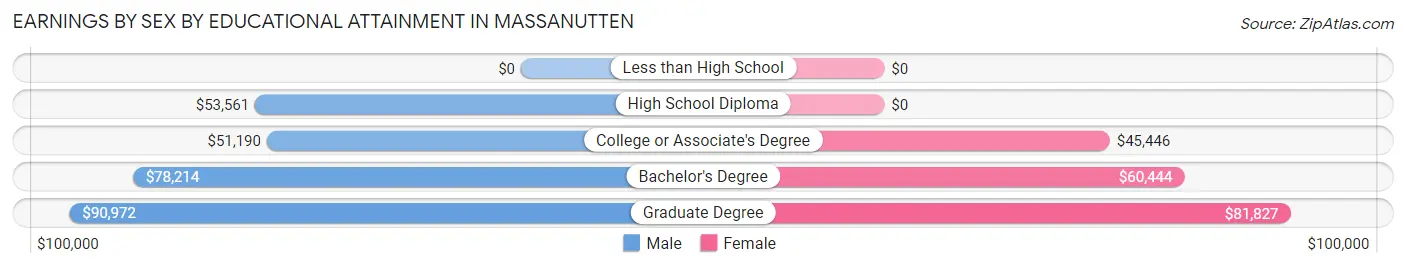
Earnings by Sex by Educational Attainment in Massanutten
Average earnings in Massanutten are $55,694 for men and $60,766 for women, a difference of 8.4%. Men with an educational attainment of graduate degree enjoy the highest average annual earnings of $90,972, while those with college or associate's degree education earn the least with $51,190. Women with an educational attainment of graduate degree earn the most with the average annual earnings of $81,827, while those with college or associate's degree education have the smallest earnings of $45,446.
| Educational Attainment | Male Income | Female Income |
| Less than High School | - | - |
| High School Diploma | $53,561 | $0 |
| College or Associate's Degree | $51,190 | $45,446 |
| Bachelor's Degree | $78,214 | $60,444 |
| Graduate Degree | $90,972 | $81,827 |
| Total | $55,694 | $60,766 |
Family Income in Massanutten
Family Income Brackets in Massanutten
According to the Massanutten family income data, there are 179 families falling into the $100,000 to $149,999 income range, which is the most common income bracket and makes up 23.6% of all families.
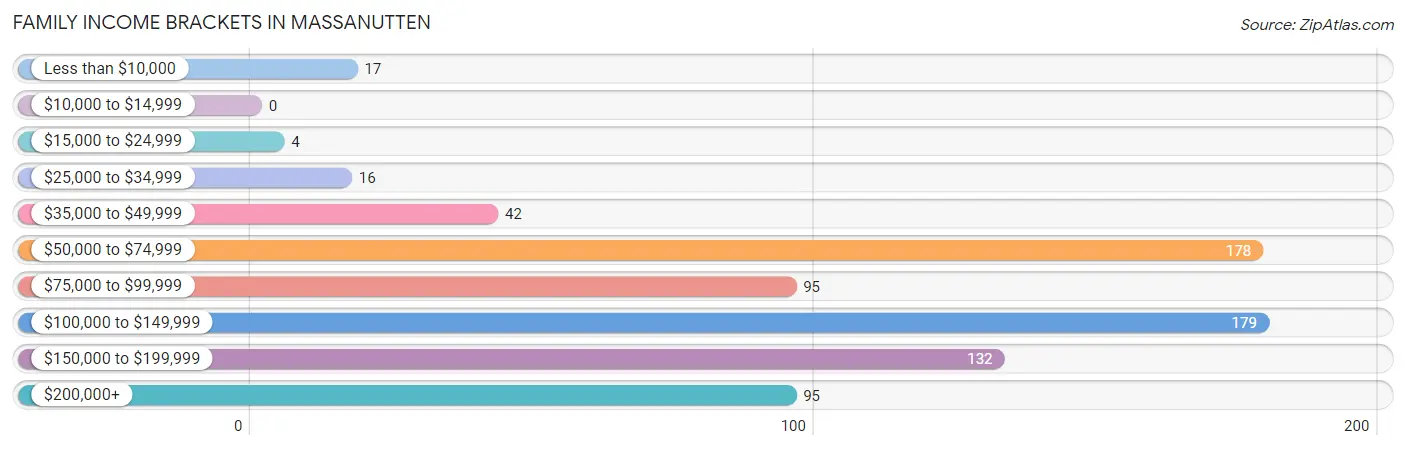
| Income Bracket | # Families | % Families |
| Less than $10,000 | 17 | 2.2% |
| $10,000 to $14,999 | 0 | 0.0% |
| $15,000 to $24,999 | 4 | 0.5% |
| $25,000 to $34,999 | 16 | 2.1% |
| $35,000 to $49,999 | 42 | 5.5% |
| $50,000 to $74,999 | 178 | 23.5% |
| $75,000 to $99,999 | 95 | 12.5% |
| $100,000 to $149,999 | 179 | 23.6% |
| $150,000 to $199,999 | 132 | 17.4% |
| $200,000+ | 95 | 12.5% |
Family Income by Famaliy Size in Massanutten
3-person families (194 | 25.6%) account for the highest median family income in Massanutten with $145,000 per family, while 3-person families (194 | 25.6%) have the highest median income of $48,333 per family member.
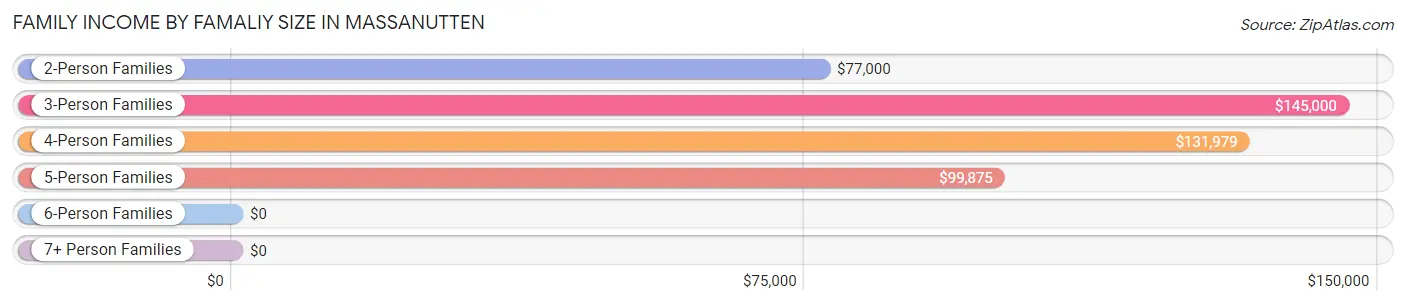
| Income Bracket | # Families | Median Income |
| 2-Person Families | 460 (60.7%) | $77,000 |
| 3-Person Families | 194 (25.6%) | $145,000 |
| 4-Person Families | 51 (6.7%) | $131,979 |
| 5-Person Families | 31 (4.1%) | $99,875 |
| 6-Person Families | 22 (2.9%) | $0 |
| 7+ Person Families | 0 (0.0%) | $0 |
| Total | 758 (100.0%) | $102,981 |
Family Income by Number of Earners in Massanutten
The median family income in Massanutten is $102,981, with families comprising 2 earners (321) having the highest median family income of $158,750, while families with 1 earner (222) have the lowest median family income of $64,733, accounting for 42.3% and 29.3% of families, respectively.
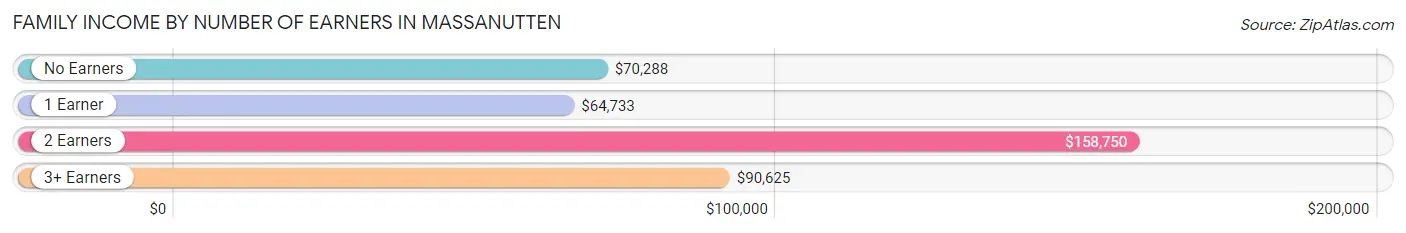
| Number of Earners | # Families | Median Income |
| No Earners | 142 (18.7%) | $70,288 |
| 1 Earner | 222 (29.3%) | $64,733 |
| 2 Earners | 321 (42.3%) | $158,750 |
| 3+ Earners | 73 (9.6%) | $90,625 |
| Total | 758 (100.0%) | $102,981 |
Household Income in Massanutten
Household Income Brackets in Massanutten
With 236 households falling in the category, the $50,000 to $74,999 income range is the most frequent in Massanutten, accounting for 24.2% of all households. In contrast, only 4 households (0.4%) fall into the $15,000 to $24,999 income bracket, making it the least populous group.
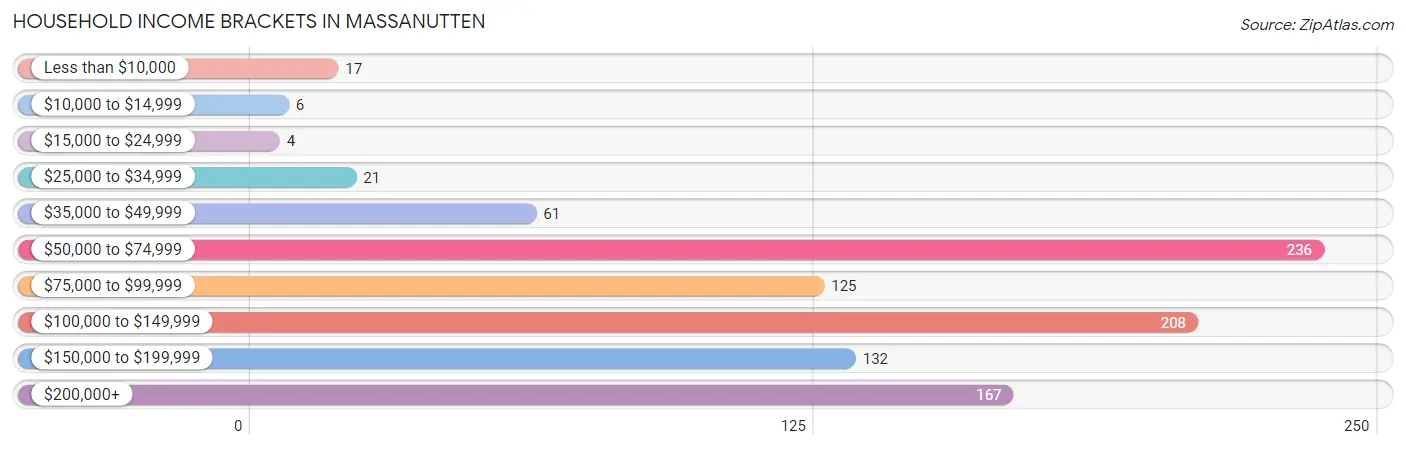
| Income Bracket | # Households | % Households |
| Less than $10,000 | 17 | 1.7% |
| $10,000 to $14,999 | 6 | 0.6% |
| $15,000 to $24,999 | 4 | 0.4% |
| $25,000 to $34,999 | 21 | 2.1% |
| $35,000 to $49,999 | 61 | 6.2% |
| $50,000 to $74,999 | 236 | 24.2% |
| $75,000 to $99,999 | 125 | 12.8% |
| $100,000 to $149,999 | 208 | 21.3% |
| $150,000 to $199,999 | 132 | 13.5% |
| $200,000+ | 167 | 17.1% |
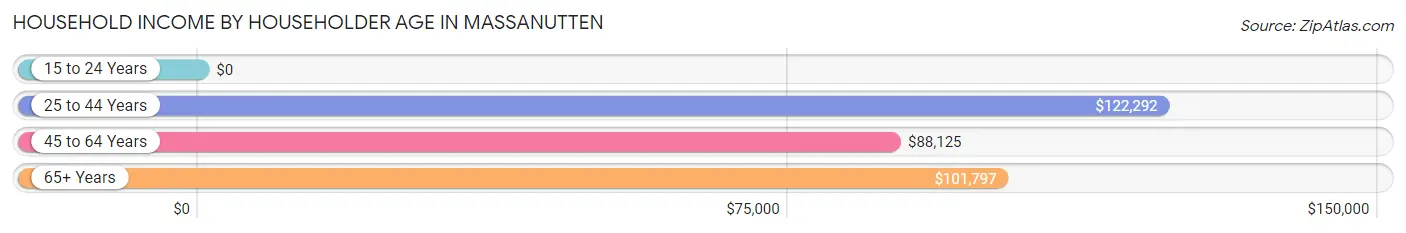
Household Income by Householder Age in Massanutten
The median household income in Massanutten is $102,102, with the highest median household income of $122,292 found in the 25 to 44 years age bracket for the primary householder. A total of 183 households (18.7%) fall into this category. Meanwhile, the 15 to 24 years age bracket for the primary householder has the lowest median household income of $0, with 7 households (0.7%) in this group.
| Income Bracket | # Households | Median Income |
| 15 to 24 Years | 7 (0.7%) | $0 |
| 25 to 44 Years | 183 (18.7%) | $122,292 |
| 45 to 64 Years | 456 (46.7%) | $88,125 |
| 65+ Years | 331 (33.9%) | $101,797 |
| Total | 977 (100.0%) | $102,102 |
Poverty in Massanutten
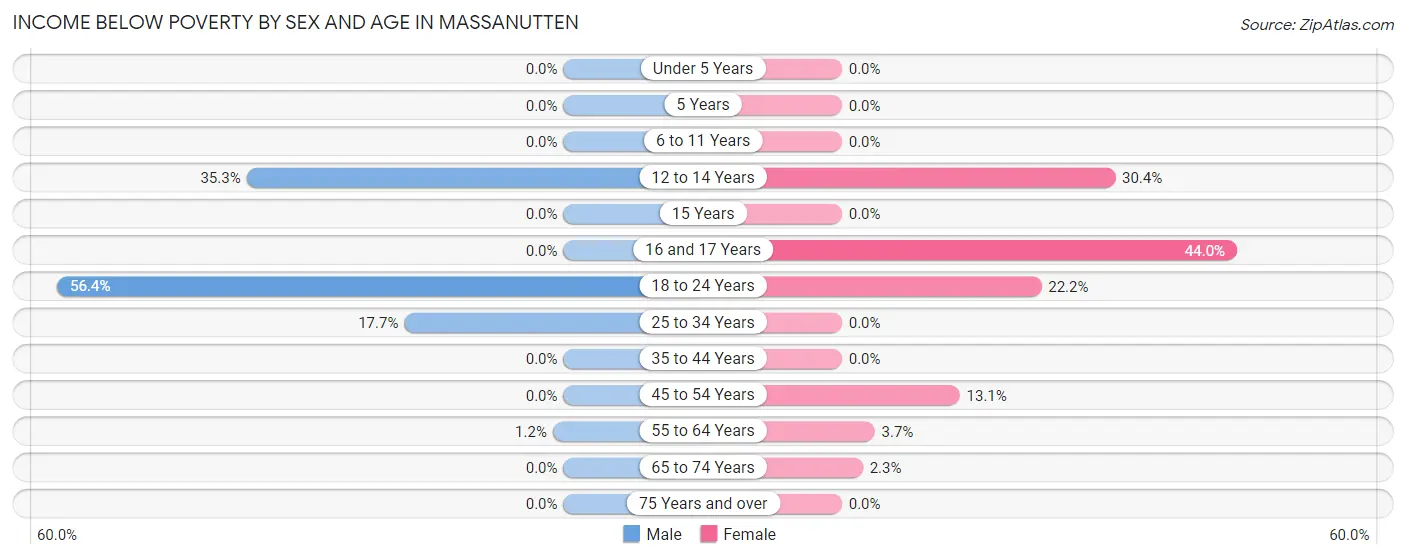
Income Below Poverty by Sex and Age in Massanutten
With 6.8% poverty level for males and 5.2% for females among the residents of Massanutten, 18 to 24 year old males and 16 and 17 year old females are the most vulnerable to poverty, with 53 males (56.4%) and 11 females (44.0%) in their respective age groups living below the poverty level.
| Age Bracket | Male | Female |
| Under 5 Years | 0 (0.0%) | 0 (0.0%) |
| 5 Years | 0 (0.0%) | 0 (0.0%) |
| 6 to 11 Years | 0 (0.0%) | 0 (0.0%) |
| 12 to 14 Years | 6 (35.3%) | 7 (30.4%) |
| 15 Years | 0 (0.0%) | 0 (0.0%) |
| 16 and 17 Years | 0 (0.0%) | 11 (44.0%) |
| 18 to 24 Years | 53 (56.4%) | 10 (22.2%) |
| 25 to 34 Years | 14 (17.7%) | 0 (0.0%) |
| 35 to 44 Years | 0 (0.0%) | 0 (0.0%) |
| 45 to 54 Years | 0 (0.0%) | 21 (13.1%) |
| 55 to 64 Years | 4 (1.2%) | 11 (3.6%) |
| 65 to 74 Years | 0 (0.0%) | 4 (2.3%) |
| 75 Years and over | 0 (0.0%) | 0 (0.0%) |
| Total | 77 (6.8%) | 64 (5.2%) |
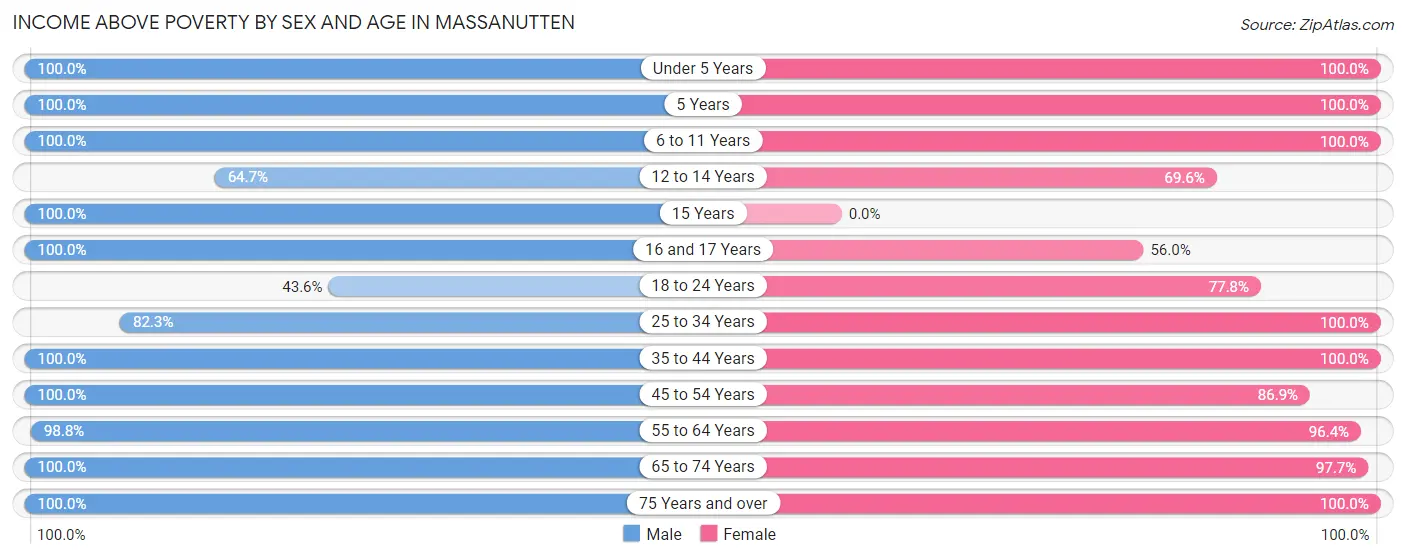
Income Above Poverty by Sex and Age in Massanutten
According to the poverty statistics in Massanutten, males aged under 5 years and females aged under 5 years are the age groups that are most secure financially, with 100.0% of males and 100.0% of females in these age groups living above the poverty line.
| Age Bracket | Male | Female |
| Under 5 Years | 36 (100.0%) | 69 (100.0%) |
| 5 Years | 10 (100.0%) | 23 (100.0%) |
| 6 to 11 Years | 23 (100.0%) | 53 (100.0%) |
| 12 to 14 Years | 11 (64.7%) | 16 (69.6%) |
| 15 Years | 51 (100.0%) | 0 (0.0%) |
| 16 and 17 Years | 24 (100.0%) | 14 (56.0%) |
| 18 to 24 Years | 41 (43.6%) | 35 (77.8%) |
| 25 to 34 Years | 65 (82.3%) | 99 (100.0%) |
| 35 to 44 Years | 95 (100.0%) | 153 (100.0%) |
| 45 to 54 Years | 123 (100.0%) | 139 (86.9%) |
| 55 to 64 Years | 336 (98.8%) | 290 (96.4%) |
| 65 to 74 Years | 182 (100.0%) | 168 (97.7%) |
| 75 Years and over | 66 (100.0%) | 105 (100.0%) |
| Total | 1,063 (93.2%) | 1,164 (94.8%) |
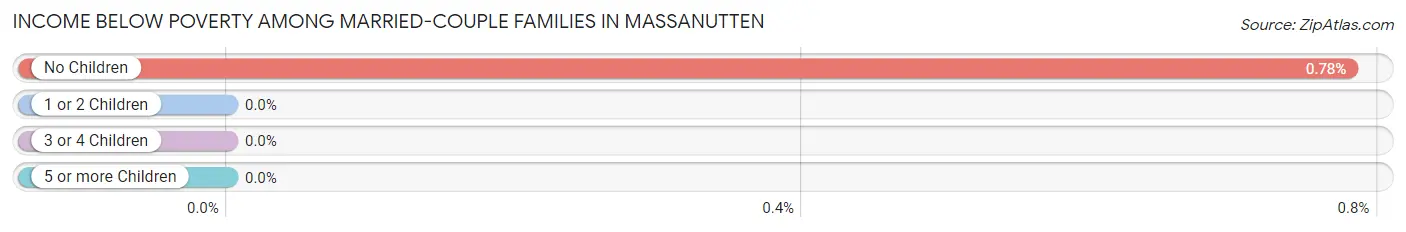
Income Below Poverty Among Married-Couple Families in Massanutten
The poverty statistics for married-couple families in Massanutten show that 0.6% or 4 of the total 691 families live below the poverty line. Families with no children have the highest poverty rate of 0.8%, comprising of 4 families. On the other hand, families with 1 or 2 children have the lowest poverty rate of 0.0%, which includes 0 families.
| Children | Above Poverty | Below Poverty |
| No Children | 509 (99.2%) | 4 (0.8%) |
| 1 or 2 Children | 151 (100.0%) | 0 (0.0%) |
| 3 or 4 Children | 27 (100.0%) | 0 (0.0%) |
| 5 or more Children | 0 (0.0%) | 0 (0.0%) |
| Total | 687 (99.4%) | 4 (0.6%) |
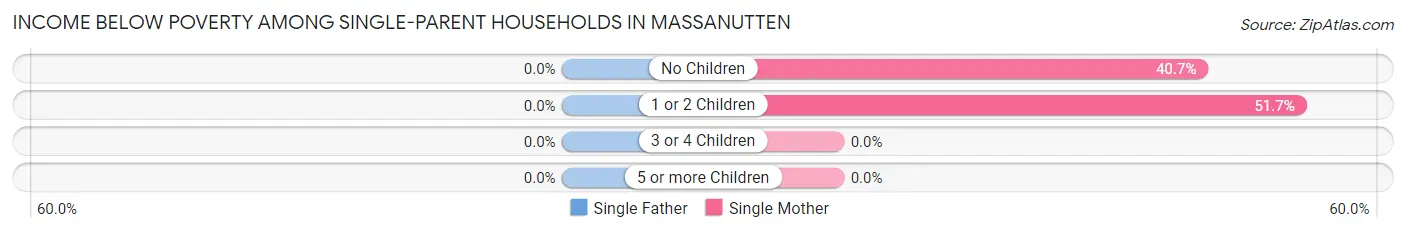
Income Below Poverty Among Single-Parent Households in Massanutten
| Children | Single Father | Single Mother |
| No Children | 0 (0.0%) | 11 (40.7%) |
| 1 or 2 Children | 0 (0.0%) | 15 (51.7%) |
| 3 or 4 Children | 0 (0.0%) | 0 (0.0%) |
| 5 or more Children | 0 (0.0%) | 0 (0.0%) |
| Total | 0 (0.0%) | 26 (46.4%) |
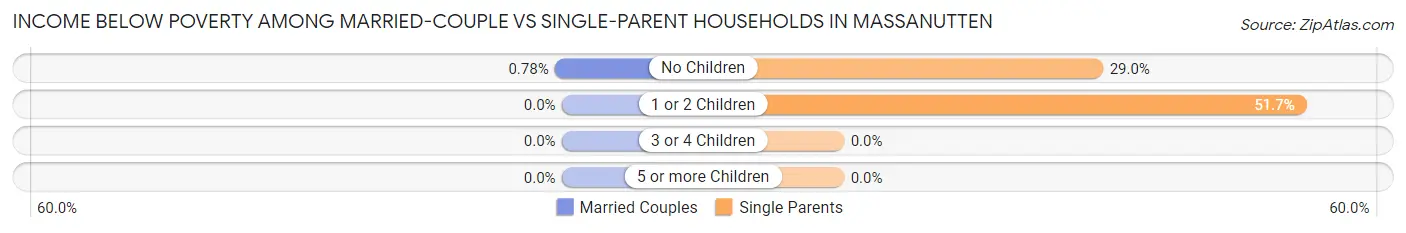
Income Below Poverty Among Married-Couple vs Single-Parent Households in Massanutten
The poverty data for Massanutten shows that 4 of the married-couple family households (0.6%) and 26 of the single-parent households (38.8%) are living below the poverty level. Within the married-couple family households, those with no children have the highest poverty rate, with 4 households (0.8%) falling below the poverty line. Among the single-parent households, those with 1 or 2 children have the highest poverty rate, with 15 household (51.7%) living below poverty.
| Children | Married-Couple Families | Single-Parent Households |
| No Children | 4 (0.8%) | 11 (28.9%) |
| 1 or 2 Children | 0 (0.0%) | 15 (51.7%) |
| 3 or 4 Children | 0 (0.0%) | 0 (0.0%) |
| 5 or more Children | 0 (0.0%) | 0 (0.0%) |
| Total | 4 (0.6%) | 26 (38.8%) |
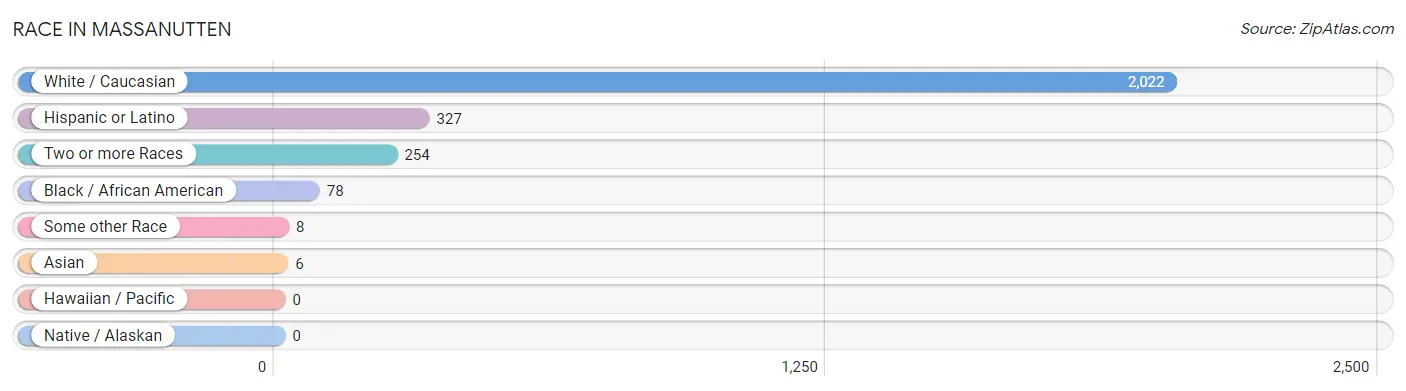
Race in Massanutten
The most populous races in Massanutten are White / Caucasian (2,022 | 85.4%), Hispanic or Latino (327 | 13.8%), and Two or more Races (254 | 10.7%).
| Race | # Population | % Population |
| Asian | 6 | 0.3% |
| Black / African American | 78 | 3.3% |
| Hawaiian / Pacific | 0 | 0.0% |
| Hispanic or Latino | 327 | 13.8% |
| Native / Alaskan | 0 | 0.0% |
| White / Caucasian | 2,022 | 85.4% |
| Two or more Races | 254 | 10.7% |
| Some other Race | 8 | 0.3% |
| Total | 2,368 | 100.0% |
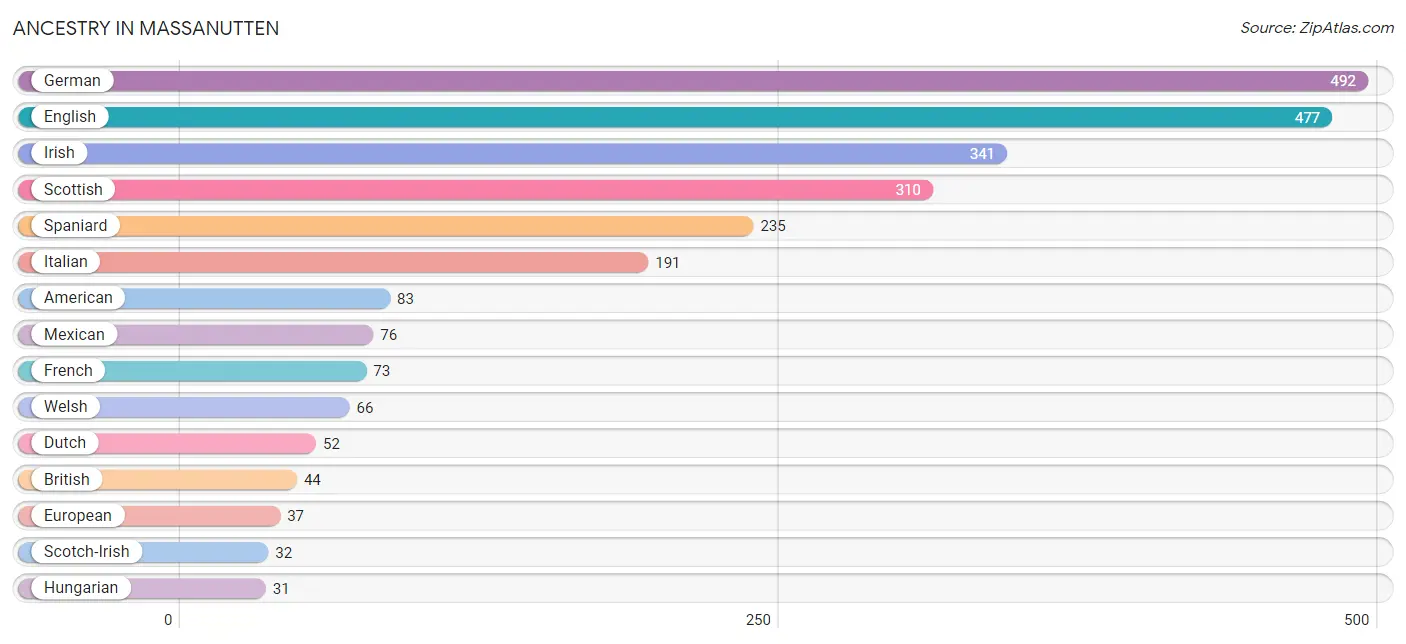
Ancestry in Massanutten
The most populous ancestries reported in Massanutten are German (492 | 20.8%), English (477 | 20.1%), Irish (341 | 14.4%), Scottish (310 | 13.1%), and Spaniard (235 | 9.9%), together accounting for 78.3% of all Massanutten residents.
| Ancestry | # Population | % Population |
| American | 83 | 3.5% |
| Arab | 20 | 0.8% |
| Austrian | 9 | 0.4% |
| Belgian | 15 | 0.6% |
| British | 44 | 1.9% |
| Czech | 7 | 0.3% |
| Czechoslovakian | 11 | 0.5% |
| Danish | 15 | 0.6% |
| Dutch | 52 | 2.2% |
| Eastern European | 26 | 1.1% |
| English | 477 | 20.1% |
| European | 37 | 1.6% |
| French | 73 | 3.1% |
| French Canadian | 29 | 1.2% |
| German | 492 | 20.8% |
| Greek | 8 | 0.3% |
| Hungarian | 31 | 1.3% |
| Iraqi | 20 | 0.8% |
| Irish | 341 | 14.4% |
| Israeli | 18 | 0.8% |
| Italian | 191 | 8.1% |
| Korean | 6 | 0.3% |
| Mexican | 76 | 3.2% |
| Mexican American Indian | 15 | 0.6% |
| Norwegian | 5 | 0.2% |
| Peruvian | 4 | 0.2% |
| Polish | 13 | 0.5% |
| Puerto Rican | 12 | 0.5% |
| Russian | 17 | 0.7% |
| Scotch-Irish | 32 | 1.3% |
| Scottish | 310 | 13.1% |
| Slavic | 8 | 0.3% |
| South American | 4 | 0.2% |
| Spaniard | 235 | 9.9% |
| Subsaharan African | 6 | 0.3% |
| Welsh | 66 | 2.8% | View All 36 Rows |
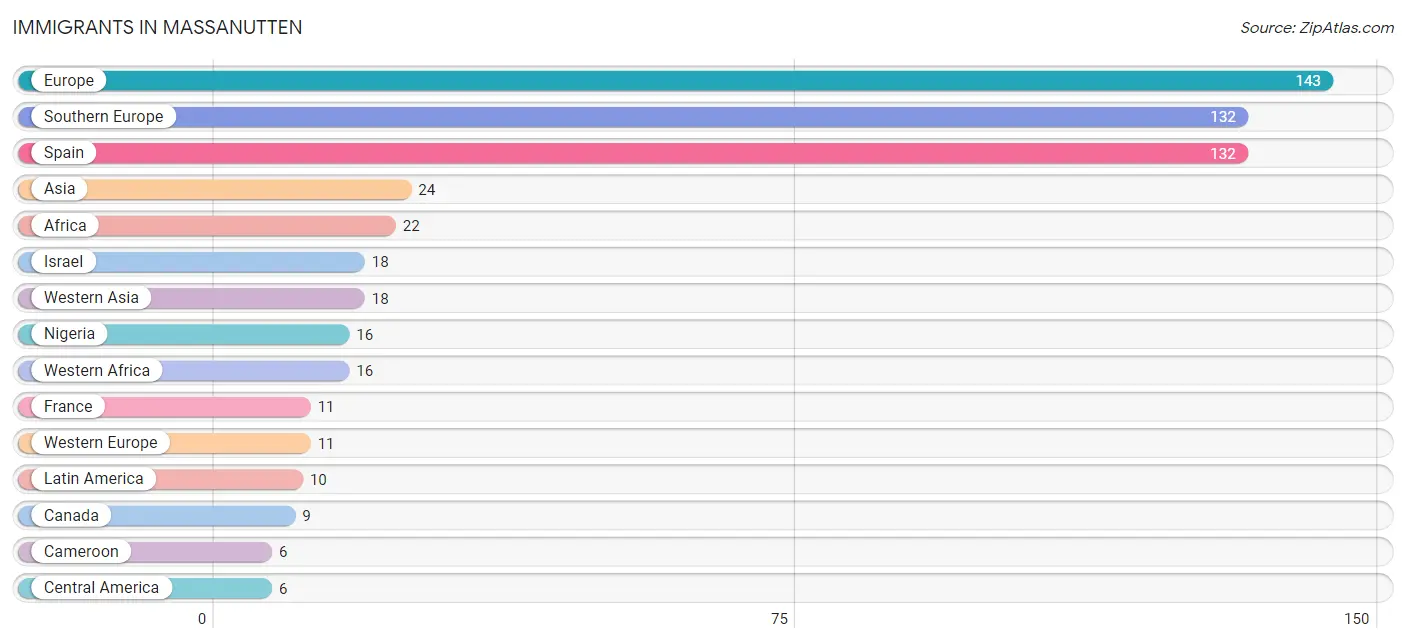
Immigrants in Massanutten
The most numerous immigrant groups reported in Massanutten came from Europe (143 | 6.0%), Southern Europe (132 | 5.6%), Spain (132 | 5.6%), Asia (24 | 1.0%), and Africa (22 | 0.9%), together accounting for 19.1% of all Massanutten residents.
| Immigration Origin | # Population | % Population |
| Africa | 22 | 0.9% |
| Asia | 24 | 1.0% |
| Cameroon | 6 | 0.3% |
| Canada | 9 | 0.4% |
| Central America | 6 | 0.3% |
| Europe | 143 | 6.0% |
| France | 11 | 0.5% |
| Israel | 18 | 0.8% |
| Latin America | 10 | 0.4% |
| Mexico | 6 | 0.3% |
| Middle Africa | 6 | 0.3% |
| Nigeria | 16 | 0.7% |
| Peru | 4 | 0.2% |
| Philippines | 6 | 0.3% |
| South America | 4 | 0.2% |
| South Eastern Asia | 6 | 0.3% |
| Southern Europe | 132 | 5.6% |
| Spain | 132 | 5.6% |
| Western Africa | 16 | 0.7% |
| Western Asia | 18 | 0.8% |
| Western Europe | 11 | 0.5% | View All 21 Rows |
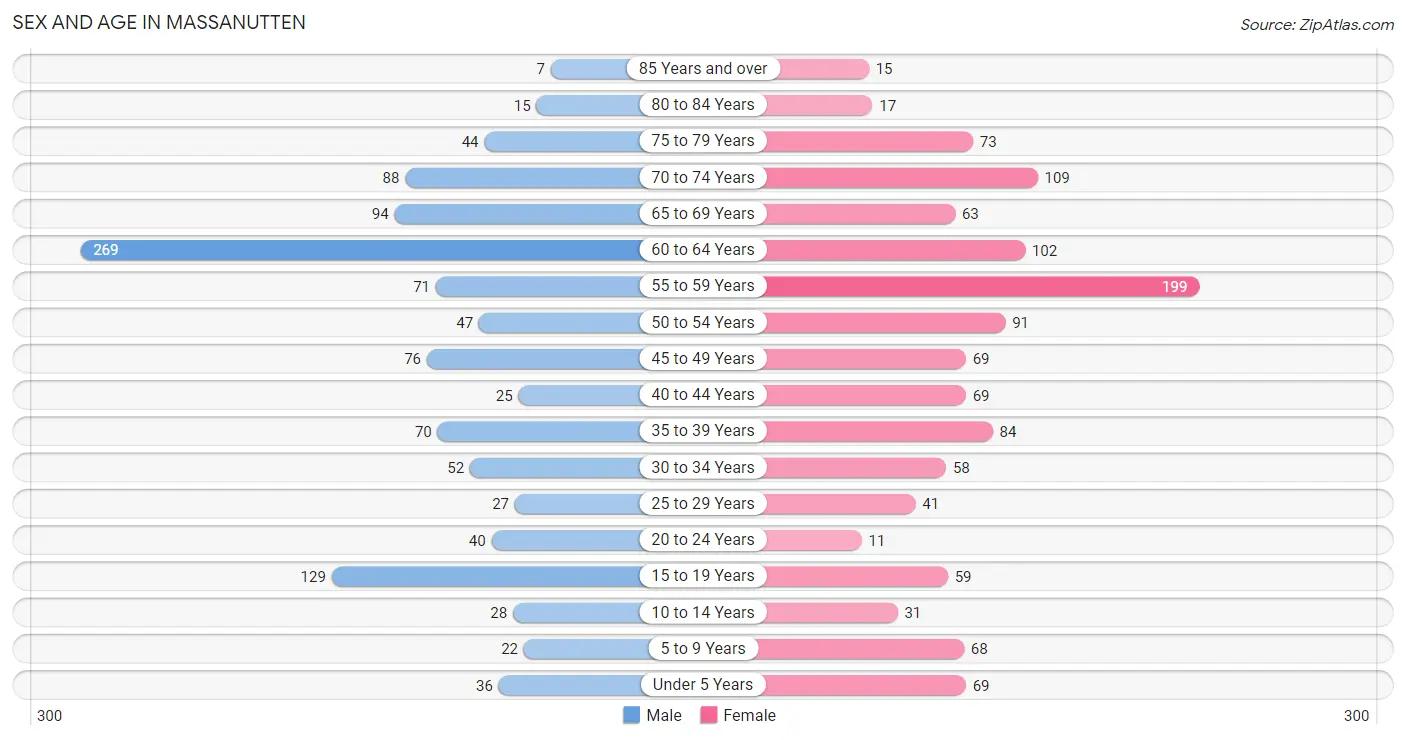
Sex and Age in Massanutten
Sex and Age in Massanutten
The most populous age groups in Massanutten are 60 to 64 Years (269 | 23.6%) for men and 55 to 59 Years (199 | 16.2%) for women.
| Age Bracket | Male | Female |
| Under 5 Years | 36 (3.2%) | 69 (5.6%) |
| 5 to 9 Years | 22 (1.9%) | 68 (5.5%) |
| 10 to 14 Years | 28 (2.5%) | 31 (2.5%) |
| 15 to 19 Years | 129 (11.3%) | 59 (4.8%) |
| 20 to 24 Years | 40 (3.5%) | 11 (0.9%) |
| 25 to 29 Years | 27 (2.4%) | 41 (3.3%) |
| 30 to 34 Years | 52 (4.6%) | 58 (4.7%) |
| 35 to 39 Years | 70 (6.1%) | 84 (6.8%) |
| 40 to 44 Years | 25 (2.2%) | 69 (5.6%) |
| 45 to 49 Years | 76 (6.7%) | 69 (5.6%) |
| 50 to 54 Years | 47 (4.1%) | 91 (7.4%) |
| 55 to 59 Years | 71 (6.2%) | 199 (16.2%) |
| 60 to 64 Years | 269 (23.6%) | 102 (8.3%) |
| 65 to 69 Years | 94 (8.3%) | 63 (5.1%) |
| 70 to 74 Years | 88 (7.7%) | 109 (8.9%) |
| 75 to 79 Years | 44 (3.9%) | 73 (5.9%) |
| 80 to 84 Years | 15 (1.3%) | 17 (1.4%) |
| 85 Years and over | 7 (0.6%) | 15 (1.2%) |
| Total | 1,140 (100.0%) | 1,228 (100.0%) |
Families and Households in Massanutten
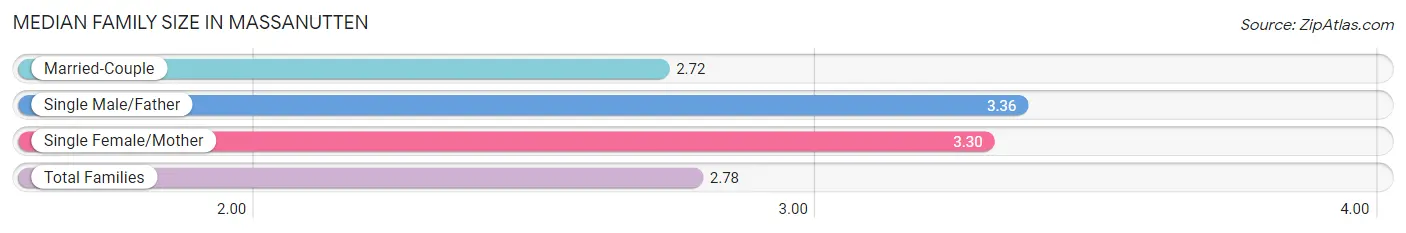
Median Family Size in Massanutten
The median family size in Massanutten is 2.78 persons per family, with single male/father families (11 | 1.5%) accounting for the largest median family size of 3.36 persons per family. On the other hand, married-couple families (691 | 91.2%) represent the smallest median family size with 2.72 persons per family.
| Family Type | # Families | Family Size |
| Married-Couple | 691 (91.2%) | 2.72 |
| Single Male/Father | 11 (1.5%) | 3.36 |
| Single Female/Mother | 56 (7.4%) | 3.30 |
| Total Families | 758 (100.0%) | 2.78 |
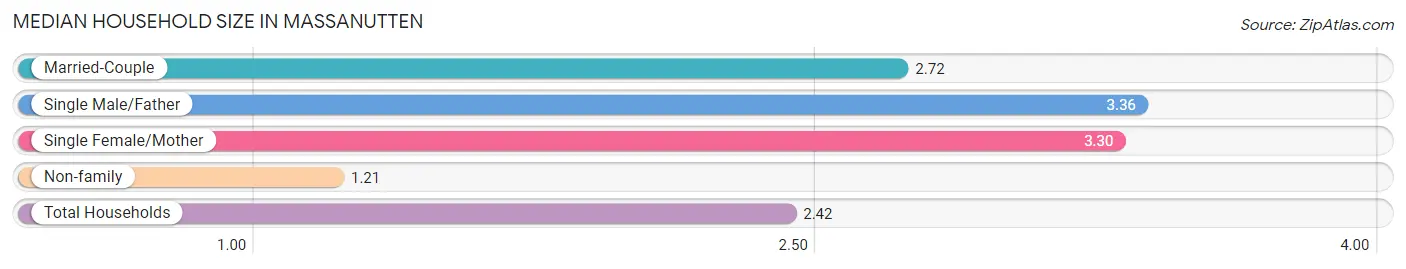
Median Household Size in Massanutten
The median household size in Massanutten is 2.42 persons per household, with single male/father households (11 | 1.1%) accounting for the largest median household size of 3.36 persons per household. non-family households (219 | 22.4%) represent the smallest median household size with 1.21 persons per household.
| Household Type | # Households | Household Size |
| Married-Couple | 691 (70.7%) | 2.72 |
| Single Male/Father | 11 (1.1%) | 3.36 |
| Single Female/Mother | 56 (5.7%) | 3.30 |
| Non-family | 219 (22.4%) | 1.21 |
| Total Households | 977 (100.0%) | 2.42 |
Household Size by Marriage Status in Massanutten
Out of a total of 977 households in Massanutten, 758 (77.6%) are family households, while 219 (22.4%) are nonfamily households. The most numerous type of family households are 2-person households, comprising 460, and the most common type of nonfamily households are 1-person households, comprising 188.
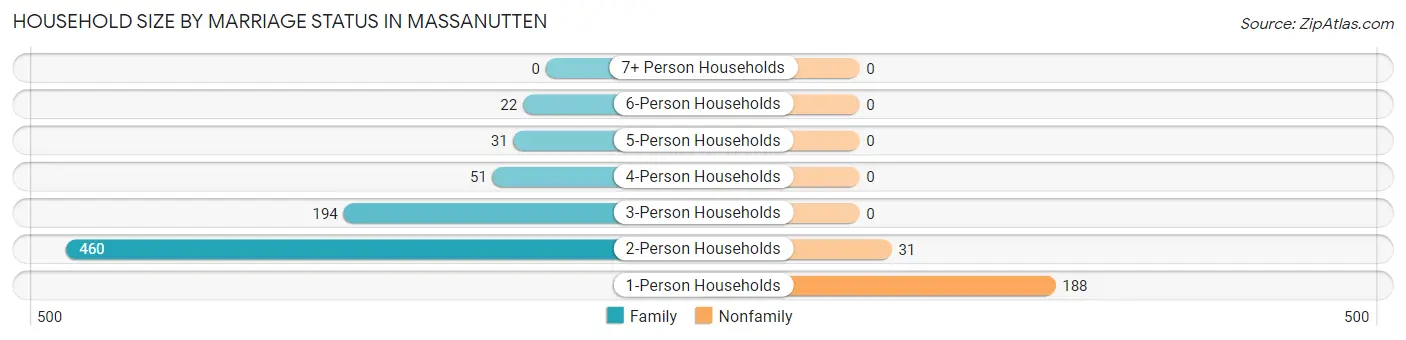
| Household Size | Family Households | Nonfamily Households |
| 1-Person Households | - | 188 (19.2%) |
| 2-Person Households | 460 (47.1%) | 31 (3.2%) |
| 3-Person Households | 194 (19.9%) | 0 (0.0%) |
| 4-Person Households | 51 (5.2%) | 0 (0.0%) |
| 5-Person Households | 31 (3.2%) | 0 (0.0%) |
| 6-Person Households | 22 (2.2%) | 0 (0.0%) |
| 7+ Person Households | 0 (0.0%) | 0 (0.0%) |
| Total | 758 (77.6%) | 219 (22.4%) |
Female Fertility in Massanutten
Fertility by Age in Massanutten
Average fertility rate in Massanutten is 101.0 births per 1,000 women. Women in the age bracket of 20 to 34 years have the highest fertility rate with 191.0 births per 1,000 women. Women in the age bracket of 20 to 34 years acount for 50.0% of all women with births.
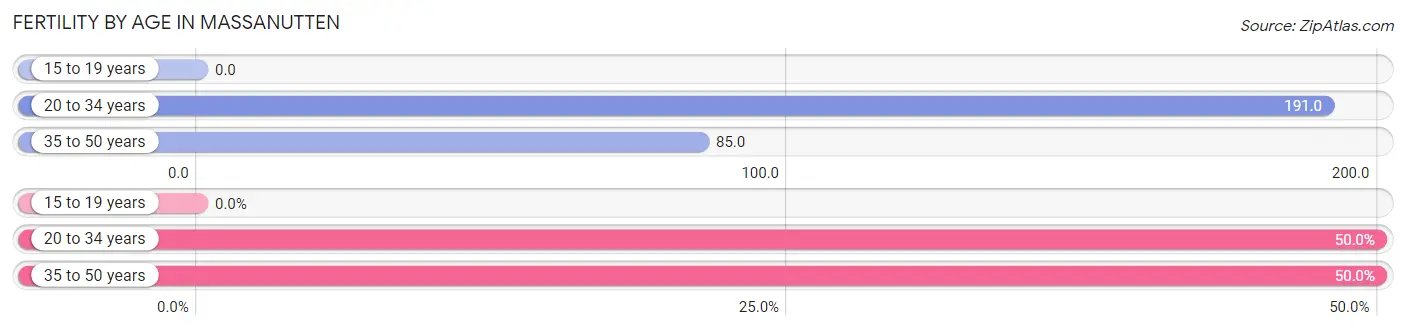
| Age Bracket | Women with Births | Births / 1,000 Women |
| 15 to 19 years | 0 (0.0%) | 0.0 |
| 20 to 34 years | 21 (50.0%) | 191.0 |
| 35 to 50 years | 21 (50.0%) | 85.0 |
| Total | 42 (100.0%) | 101.0 |
Fertility by Age by Marriage Status in Massanutten
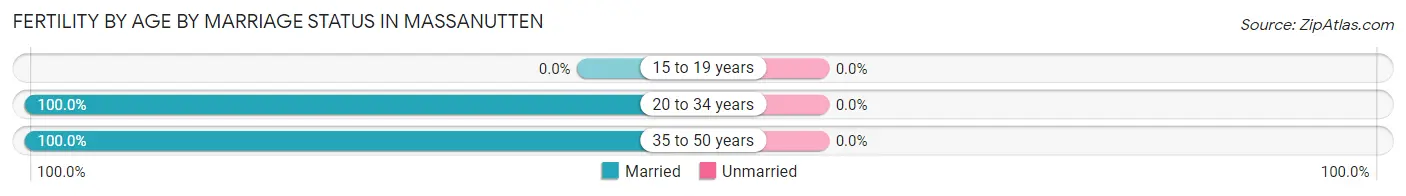
| Age Bracket | Married | Unmarried |
| 15 to 19 years | 0 (0.0%) | 0 (0.0%) |
| 20 to 34 years | 21 (100.0%) | 0 (0.0%) |
| 35 to 50 years | 21 (100.0%) | 0 (0.0%) |
| Total | 42 (100.0%) | 0 (0.0%) |
Fertility by Education in Massanutten
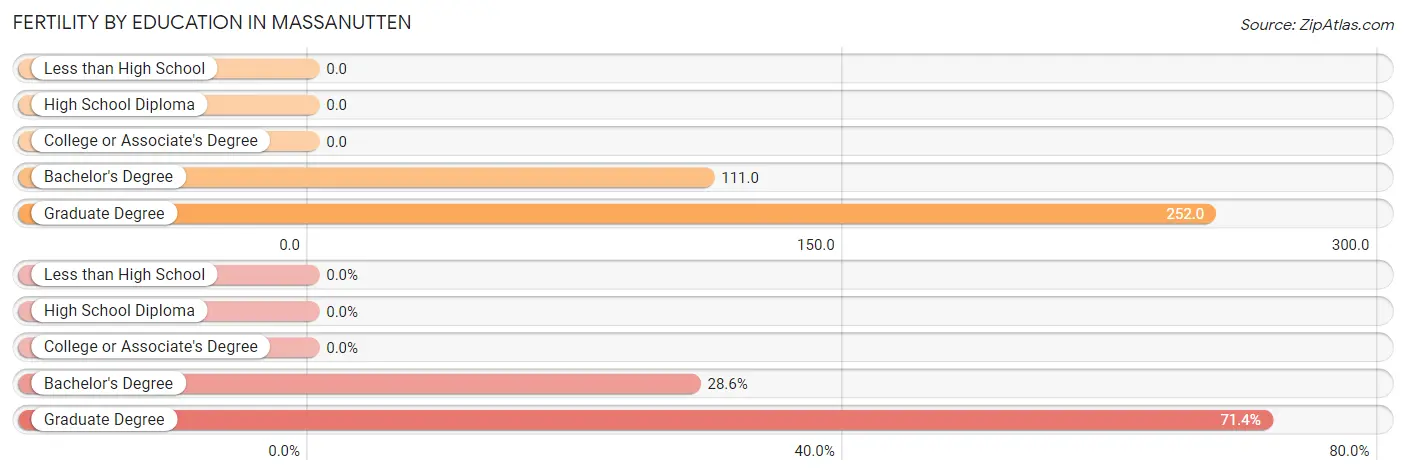
| Educational Attainment | Women with Births | Births / 1,000 Women |
| Less than High School | 0 (0.0%) | 0.0 |
| High School Diploma | 0 (0.0%) | 0.0 |
| College or Associate's Degree | 0 (0.0%) | 0.0 |
| Bachelor's Degree | 12 (28.6%) | 111.0 |
| Graduate Degree | 30 (71.4%) | 252.0 |
| Total | 42 (100.0%) | 101.0 |
Fertility by Education by Marriage Status in Massanutten
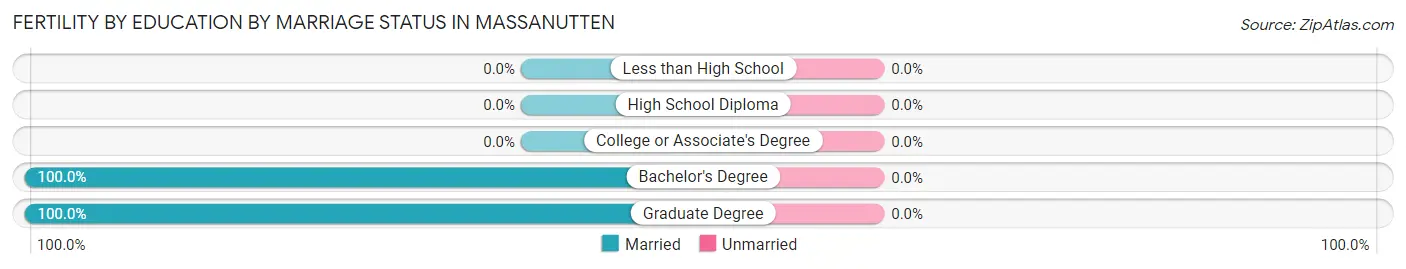
| Educational Attainment | Married | Unmarried |
| Less than High School | 0 (0.0%) | 0 (0.0%) |
| High School Diploma | 0 (0.0%) | 0 (0.0%) |
| College or Associate's Degree | 0 (0.0%) | 0 (0.0%) |
| Bachelor's Degree | 12 (100.0%) | 0 (0.0%) |
| Graduate Degree | 30 (100.0%) | 0 (0.0%) |
| Total | 42 (100.0%) | 0 (0.0%) |
Employment Characteristics in Massanutten
Employment by Class of Employer in Massanutten
Among the 1,283 employed individuals in Massanutten, private company employees (742 | 57.8%), local government employees (204 | 15.9%), and state government employees (197 | 15.3%) make up the most common classes of employment.
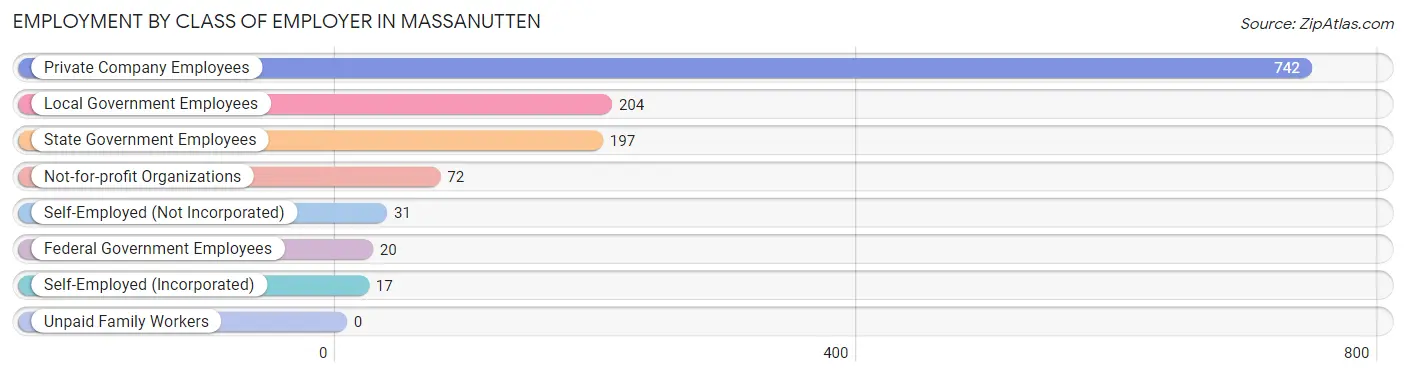
| Employer Class | # Employees | % Employees |
| Private Company Employees | 742 | 57.8% |
| Self-Employed (Incorporated) | 17 | 1.3% |
| Self-Employed (Not Incorporated) | 31 | 2.4% |
| Not-for-profit Organizations | 72 | 5.6% |
| Local Government Employees | 204 | 15.9% |
| State Government Employees | 197 | 15.3% |
| Federal Government Employees | 20 | 1.6% |
| Unpaid Family Workers | 0 | 0.0% |
| Total | 1,283 | 100.0% |
Employment Status by Age in Massanutten
According to the labor force statistics for Massanutten, out of the total population over 16 years of age (2,063), 64.0% or 1,320 individuals are in the labor force, with 2.4% or 32 of them unemployed. The age group with the highest labor force participation rate is 60 to 64 years, with 85.7% or 318 individuals in the labor force. Within the labor force, the 16 to 19 years age range has the highest percentage of unemployed individuals, with 11.5% or 12 of them being unemployed.
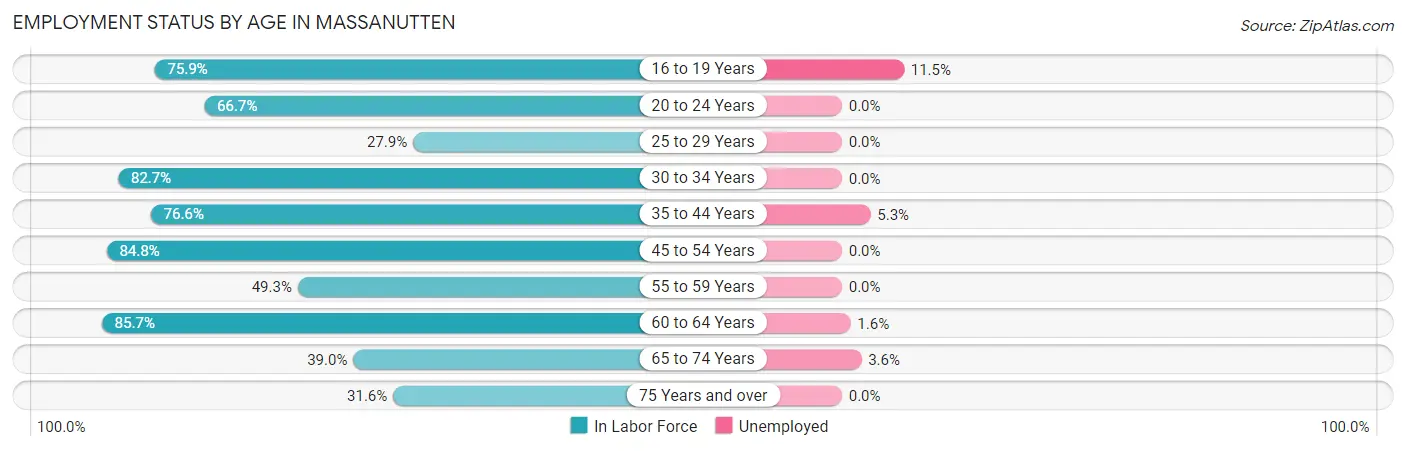
| Age Bracket | In Labor Force | Unemployed |
| 16 to 19 Years | 104 (75.9%) | 12 (11.5%) |
| 20 to 24 Years | 34 (66.7%) | 0 (0.0%) |
| 25 to 29 Years | 19 (27.9%) | 0 (0.0%) |
| 30 to 34 Years | 91 (82.7%) | 0 (0.0%) |
| 35 to 44 Years | 190 (76.6%) | 10 (5.3%) |
| 45 to 54 Years | 240 (84.8%) | 0 (0.0%) |
| 55 to 59 Years | 133 (49.3%) | 0 (0.0%) |
| 60 to 64 Years | 318 (85.7%) | 5 (1.6%) |
| 65 to 74 Years | 138 (39.0%) | 5 (3.6%) |
| 75 Years and over | 54 (31.6%) | 0 (0.0%) |
| Total | 1,320 (64.0%) | 32 (2.4%) |
Employment Status by Educational Attainment in Massanutten
According to labor force statistics for Massanutten, 73.4% of individuals (991) out of the total population between 25 and 64 years of age (1,350) are in the labor force, with 1.5% or 15 of them being unemployed. The group with the highest labor force participation rate are those with the educational attainment of bachelor's degree or higher, with 90.6% or 578 individuals in the labor force. Within the labor force, individuals with college / associate degree education have the highest percentage of unemployment, with 6.9% or 15 of them being unemployed.
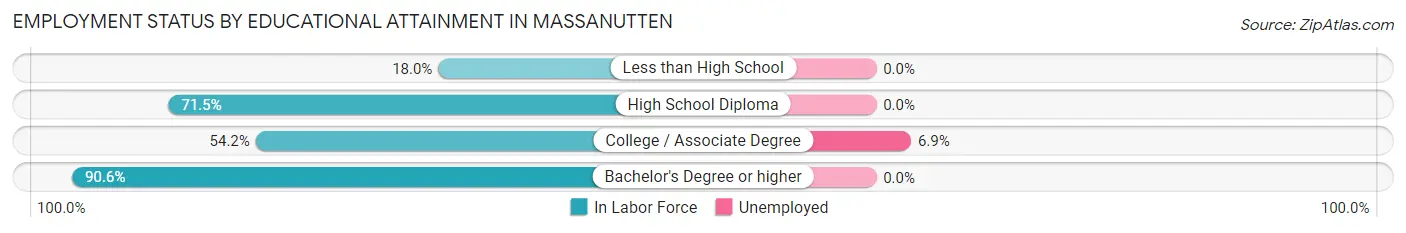
| Educational Attainment | In Labor Force | Unemployed |
| Less than High School | 9 (18.0%) | 0 (0.0%) |
| High School Diploma | 186 (71.5%) | 0 (0.0%) |
| College / Associate Degree | 218 (54.2%) | 28 (6.9%) |
| Bachelor's Degree or higher | 578 (90.6%) | 0 (0.0%) |
| Total | 991 (73.4%) | 20 (1.5%) |
Employment Occupations by Sex in Massanutten
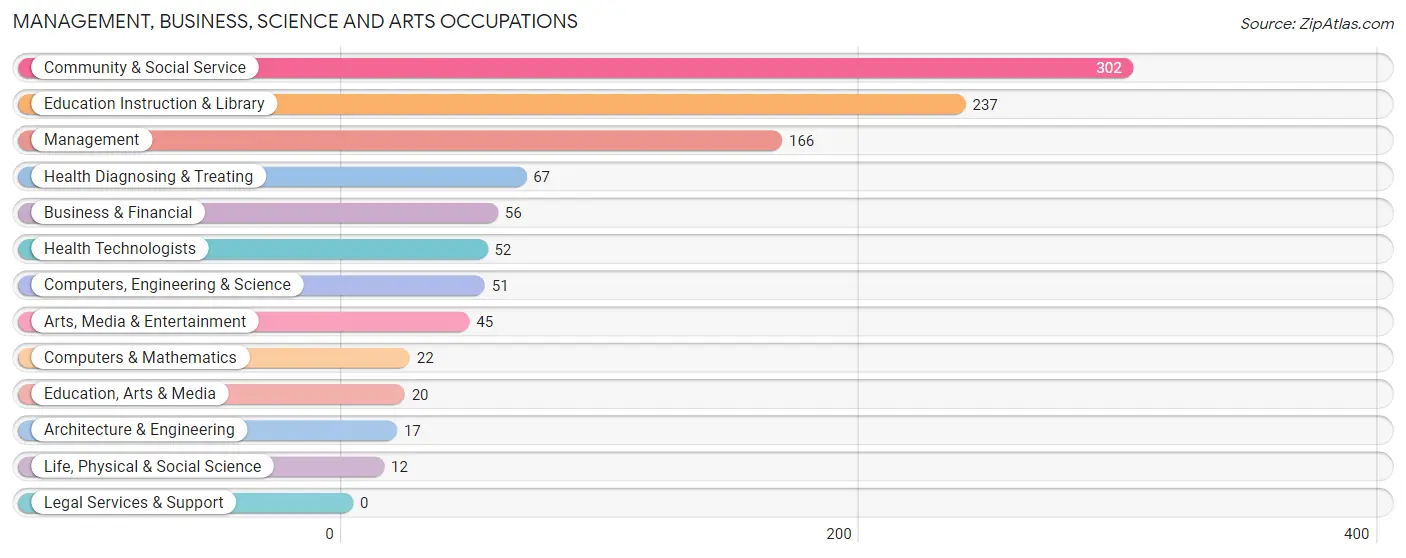
Management, Business, Science and Arts Occupations
The most common Management, Business, Science and Arts occupations in Massanutten are Community & Social Service (302 | 23.4%), Education Instruction & Library (237 | 18.4%), Management (166 | 12.9%), Health Diagnosing & Treating (67 | 5.2%), and Business & Financial (56 | 4.3%).
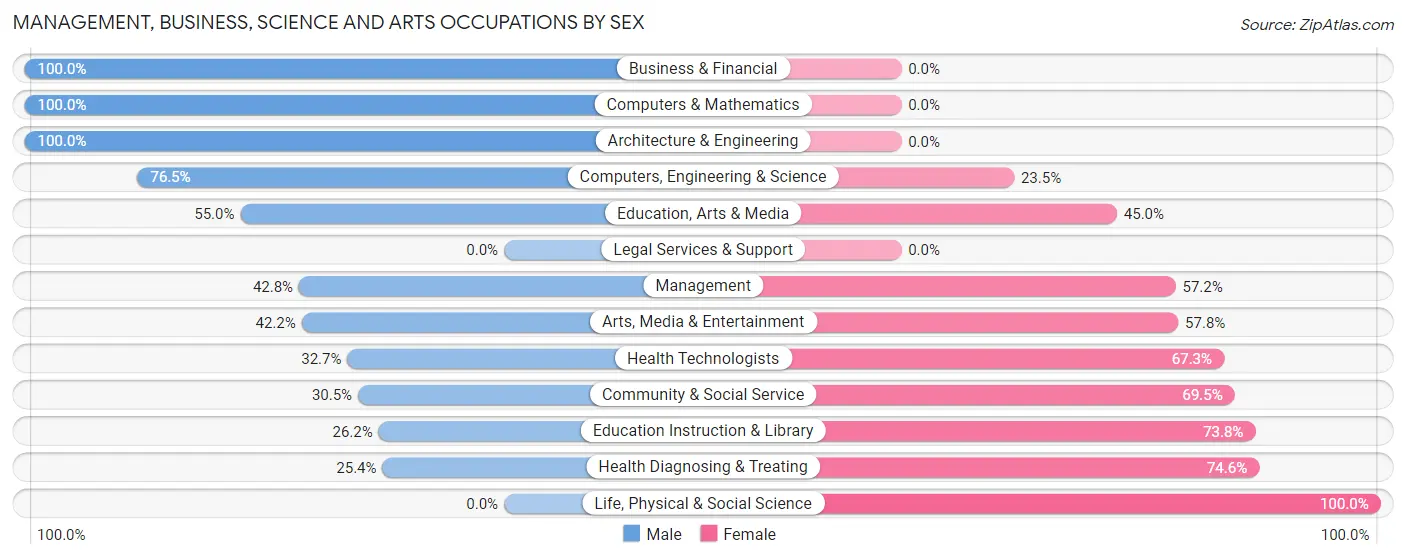
Management, Business, Science and Arts Occupations by Sex
Within the Management, Business, Science and Arts occupations in Massanutten, the most male-oriented occupations are Business & Financial (100.0%), Computers & Mathematics (100.0%), and Architecture & Engineering (100.0%), while the most female-oriented occupations are Life, Physical & Social Science (100.0%), Health Diagnosing & Treating (74.6%), and Education Instruction & Library (73.8%).
| Occupation | Male | Female |
| Management | 71 (42.8%) | 95 (57.2%) |
| Business & Financial | 56 (100.0%) | 0 (0.0%) |
| Computers, Engineering & Science | 39 (76.5%) | 12 (23.5%) |
| Computers & Mathematics | 22 (100.0%) | 0 (0.0%) |
| Architecture & Engineering | 17 (100.0%) | 0 (0.0%) |
| Life, Physical & Social Science | 0 (0.0%) | 12 (100.0%) |
| Community & Social Service | 92 (30.5%) | 210 (69.5%) |
| Education, Arts & Media | 11 (55.0%) | 9 (45.0%) |
| Legal Services & Support | 0 (0.0%) | 0 (0.0%) |
| Education Instruction & Library | 62 (26.2%) | 175 (73.8%) |
| Arts, Media & Entertainment | 19 (42.2%) | 26 (57.8%) |
| Health Diagnosing & Treating | 17 (25.4%) | 50 (74.6%) |
| Health Technologists | 17 (32.7%) | 35 (67.3%) |
| Total (Category) | 275 (42.8%) | 367 (57.2%) |
| Total (Overall) | 680 (52.7%) | 609 (47.2%) |
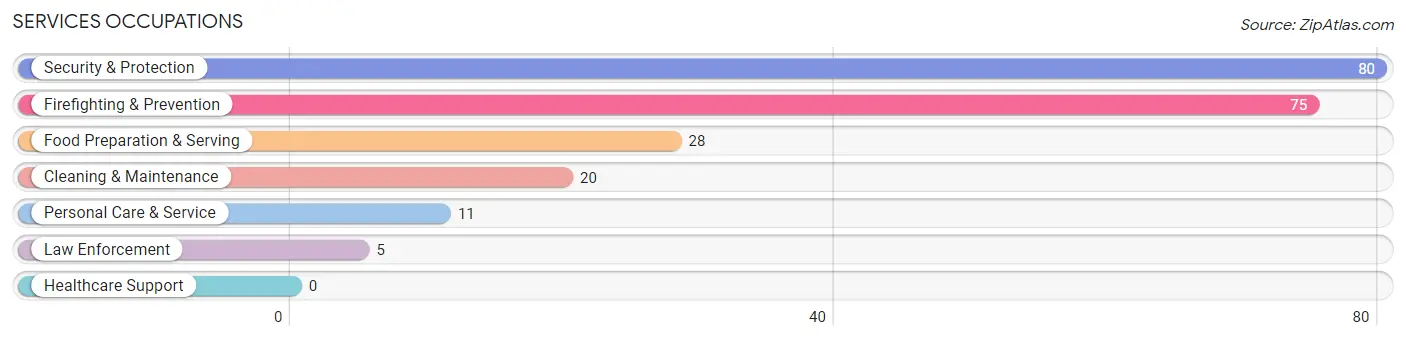
Services Occupations
The most common Services occupations in Massanutten are Security & Protection (80 | 6.2%), Firefighting & Prevention (75 | 5.8%), Food Preparation & Serving (28 | 2.2%), Cleaning & Maintenance (20 | 1.5%), and Personal Care & Service (11 | 0.9%).
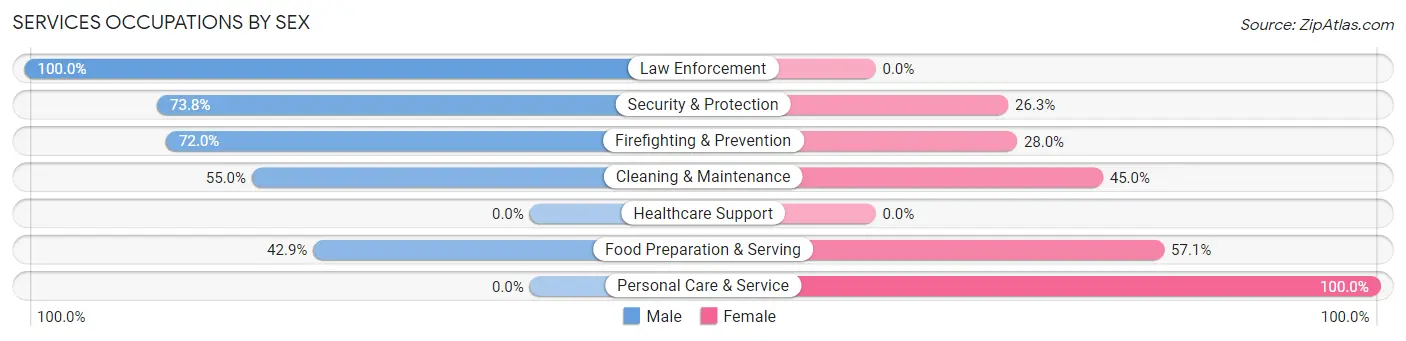
Services Occupations by Sex
Within the Services occupations in Massanutten, the most male-oriented occupations are Law Enforcement (100.0%), Security & Protection (73.8%), and Firefighting & Prevention (72.0%), while the most female-oriented occupations are Personal Care & Service (100.0%), Food Preparation & Serving (57.1%), and Cleaning & Maintenance (45.0%).
| Occupation | Male | Female |
| Healthcare Support | 0 (0.0%) | 0 (0.0%) |
| Security & Protection | 59 (73.8%) | 21 (26.3%) |
| Firefighting & Prevention | 54 (72.0%) | 21 (28.0%) |
| Law Enforcement | 5 (100.0%) | 0 (0.0%) |
| Food Preparation & Serving | 12 (42.9%) | 16 (57.1%) |
| Cleaning & Maintenance | 11 (55.0%) | 9 (45.0%) |
| Personal Care & Service | 0 (0.0%) | 11 (100.0%) |
| Total (Category) | 82 (59.0%) | 57 (41.0%) |
| Total (Overall) | 680 (52.7%) | 609 (47.2%) |
Sales and Office Occupations
The most common Sales and Office occupations in Massanutten are Sales & Related (123 | 9.5%), and Office & Administration (117 | 9.1%).
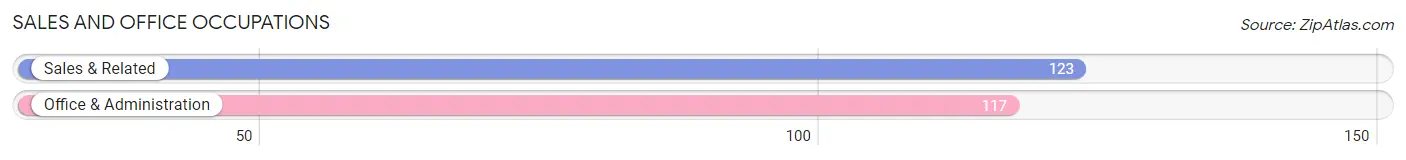
Sales and Office Occupations by Sex
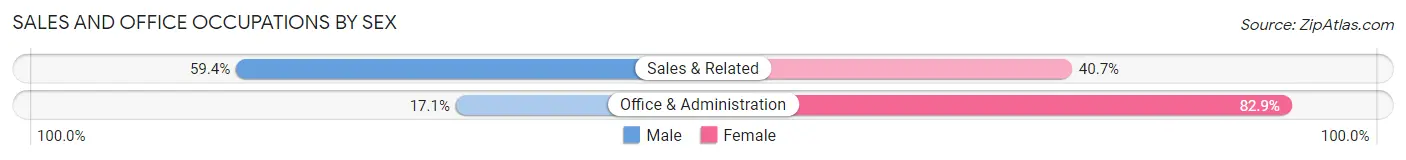
| Occupation | Male | Female |
| Sales & Related | 73 (59.4%) | 50 (40.6%) |
| Office & Administration | 20 (17.1%) | 97 (82.9%) |
| Total (Category) | 93 (38.8%) | 147 (61.3%) |
| Total (Overall) | 680 (52.7%) | 609 (47.2%) |
Natural Resources, Construction and Maintenance Occupations
The most common Natural Resources, Construction and Maintenance occupations in Massanutten are Installation, Maintenance & Repair (147 | 11.4%), and Construction & Extraction (6 | 0.5%).
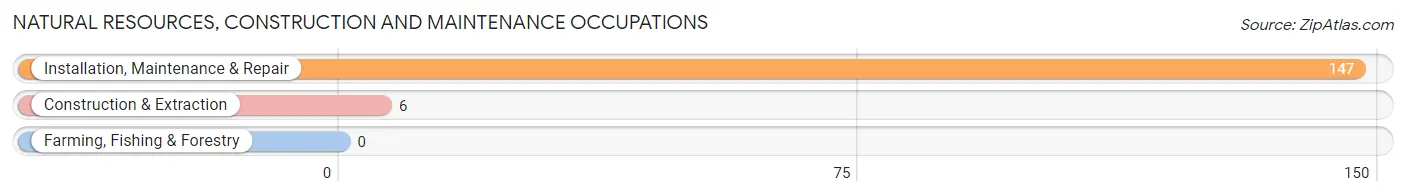
Natural Resources, Construction and Maintenance Occupations by Sex
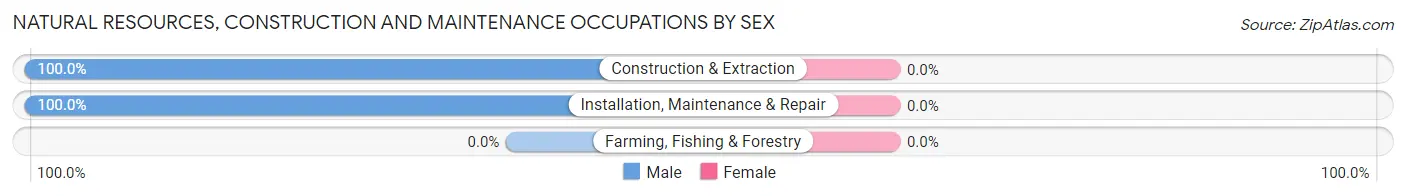
| Occupation | Male | Female |
| Farming, Fishing & Forestry | 0 (0.0%) | 0 (0.0%) |
| Construction & Extraction | 6 (100.0%) | 0 (0.0%) |
| Installation, Maintenance & Repair | 147 (100.0%) | 0 (0.0%) |
| Total (Category) | 153 (100.0%) | 0 (0.0%) |
| Total (Overall) | 680 (52.7%) | 609 (47.2%) |
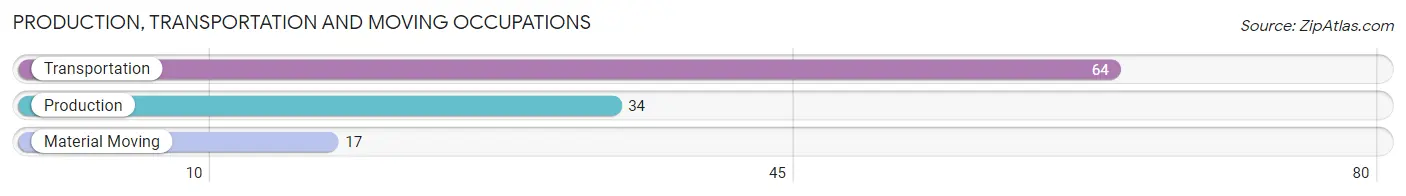
Production, Transportation and Moving Occupations
The most common Production, Transportation and Moving occupations in Massanutten are Transportation (64 | 5.0%), Production (34 | 2.6%), and Material Moving (17 | 1.3%).
Production, Transportation and Moving Occupations by Sex
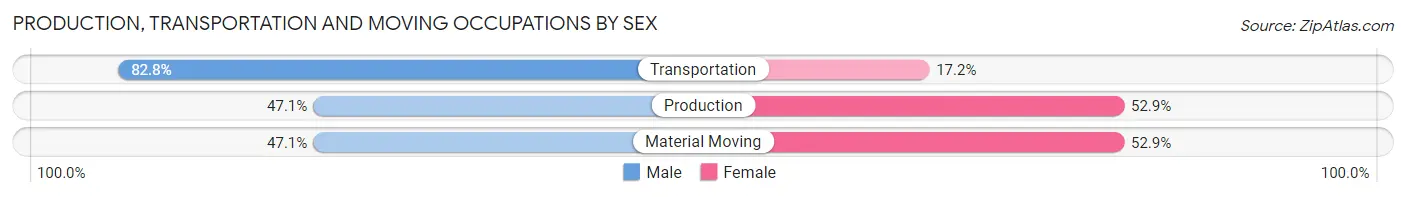
| Occupation | Male | Female |
| Production | 16 (47.1%) | 18 (52.9%) |
| Transportation | 53 (82.8%) | 11 (17.2%) |
| Material Moving | 8 (47.1%) | 9 (52.9%) |
| Total (Category) | 77 (67.0%) | 38 (33.0%) |
| Total (Overall) | 680 (52.7%) | 609 (47.2%) |
Employment Industries by Sex in Massanutten
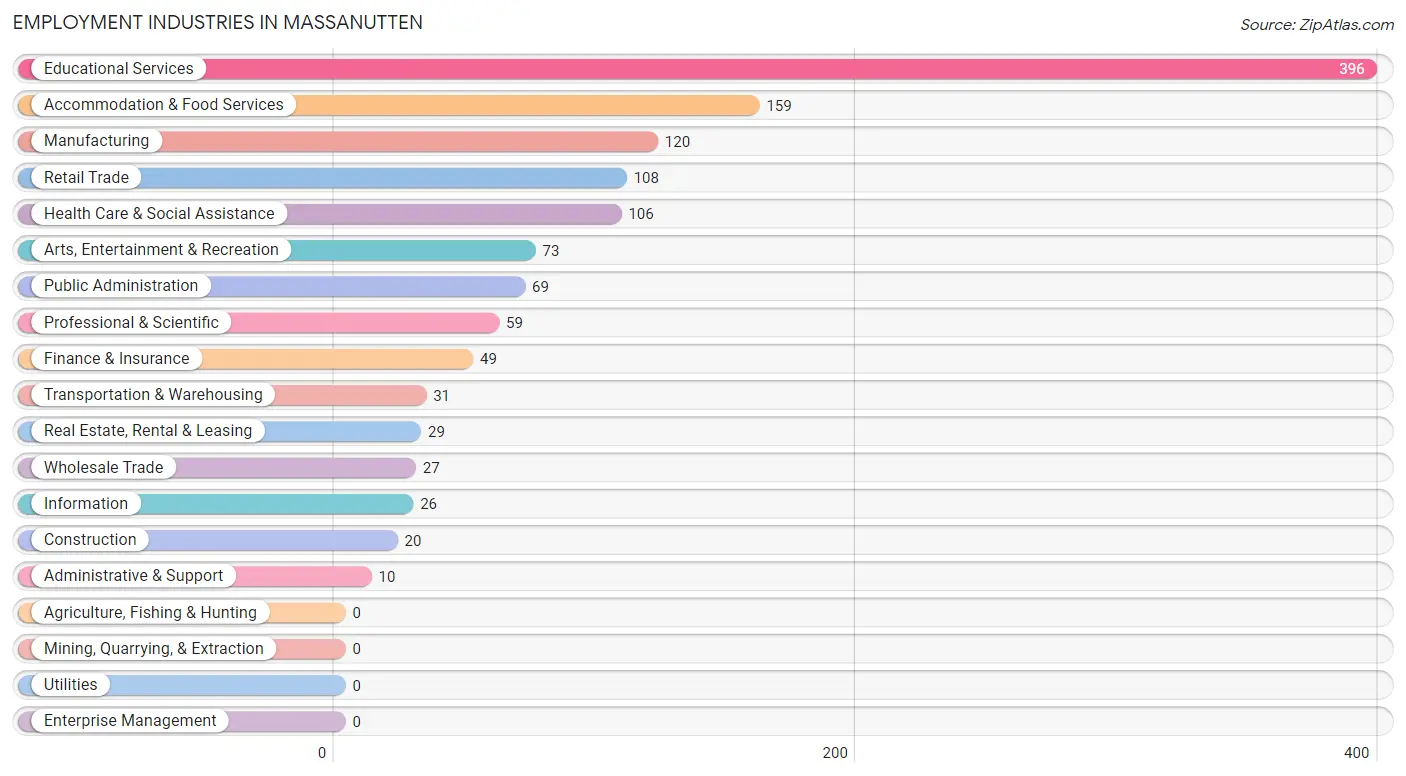
Employment Industries in Massanutten
The major employment industries in Massanutten include Educational Services (396 | 30.7%), Accommodation & Food Services (159 | 12.3%), Manufacturing (120 | 9.3%), Retail Trade (108 | 8.4%), and Health Care & Social Assistance (106 | 8.2%).
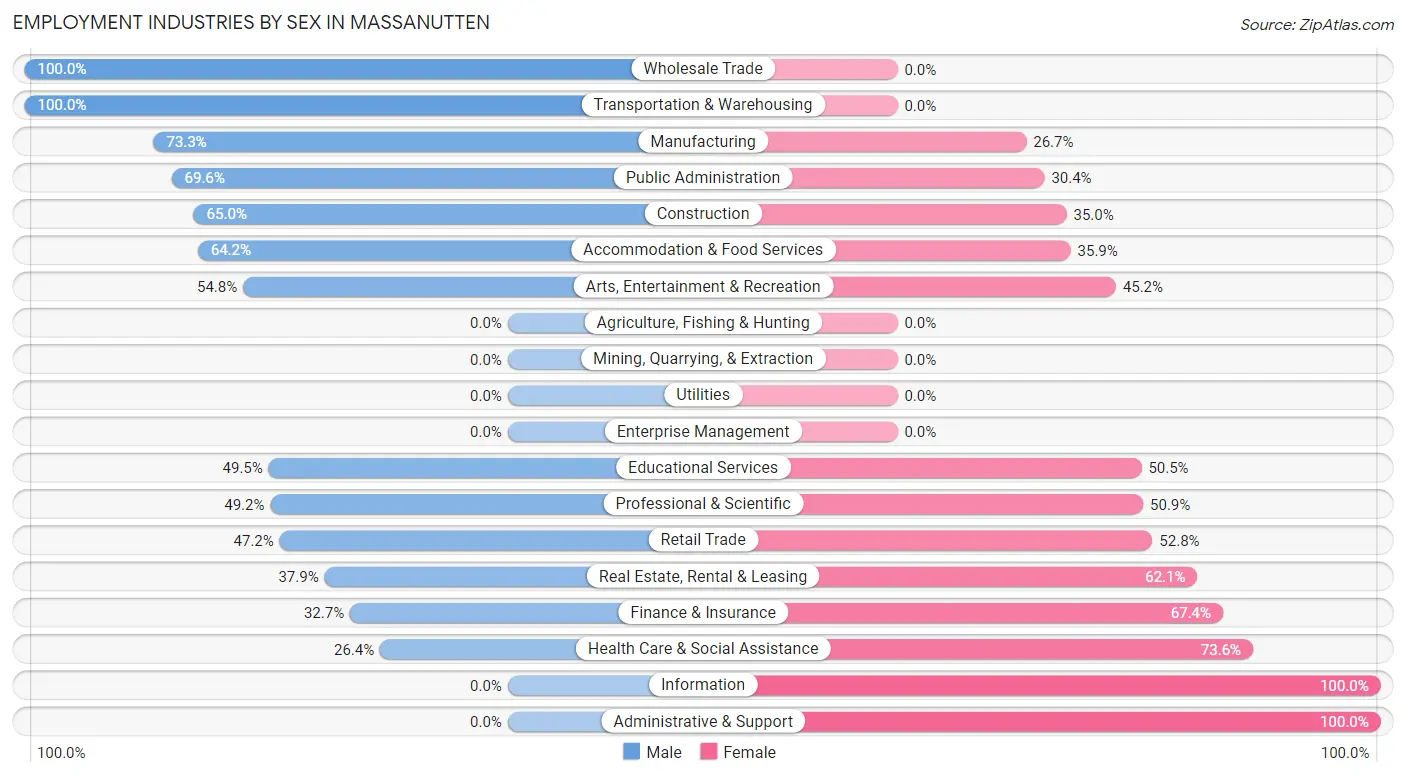
Employment Industries by Sex in Massanutten
The Massanutten industries that see more men than women are Wholesale Trade (100.0%), Transportation & Warehousing (100.0%), and Manufacturing (73.3%), whereas the industries that tend to have a higher number of women are Information (100.0%), Administrative & Support (100.0%), and Health Care & Social Assistance (73.6%).
| Industry | Male | Female |
| Agriculture, Fishing & Hunting | 0 (0.0%) | 0 (0.0%) |
| Mining, Quarrying, & Extraction | 0 (0.0%) | 0 (0.0%) |
| Construction | 13 (65.0%) | 7 (35.0%) |
| Manufacturing | 88 (73.3%) | 32 (26.7%) |
| Wholesale Trade | 27 (100.0%) | 0 (0.0%) |
| Retail Trade | 51 (47.2%) | 57 (52.8%) |
| Transportation & Warehousing | 31 (100.0%) | 0 (0.0%) |
| Utilities | 0 (0.0%) | 0 (0.0%) |
| Information | 0 (0.0%) | 26 (100.0%) |
| Finance & Insurance | 16 (32.7%) | 33 (67.3%) |
| Real Estate, Rental & Leasing | 11 (37.9%) | 18 (62.1%) |
| Professional & Scientific | 29 (49.1%) | 30 (50.8%) |
| Enterprise Management | 0 (0.0%) | 0 (0.0%) |
| Administrative & Support | 0 (0.0%) | 10 (100.0%) |
| Educational Services | 196 (49.5%) | 200 (50.5%) |
| Health Care & Social Assistance | 28 (26.4%) | 78 (73.6%) |
| Arts, Entertainment & Recreation | 40 (54.8%) | 33 (45.2%) |
| Accommodation & Food Services | 102 (64.1%) | 57 (35.8%) |
| Public Administration | 48 (69.6%) | 21 (30.4%) |
| Total | 680 (52.7%) | 609 (47.2%) |
Education in Massanutten
School Enrollment in Massanutten
The most common levels of schooling among the 425 students in Massanutten are high school (135 | 31.8%), college / undergraduate (116 | 27.3%), and middle school (59 | 13.9%).
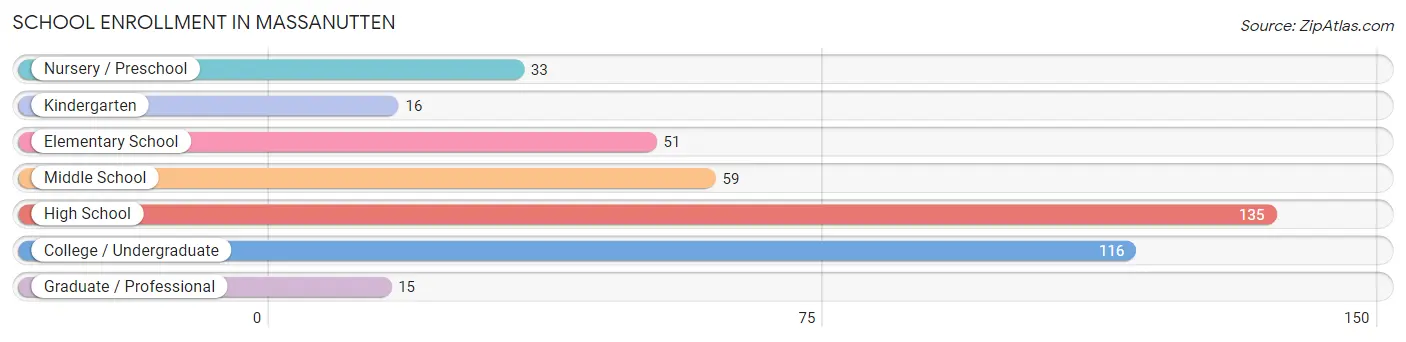
| School Level | # Students | % Students |
| Nursery / Preschool | 33 | 7.8% |
| Kindergarten | 16 | 3.8% |
| Elementary School | 51 | 12.0% |
| Middle School | 59 | 13.9% |
| High School | 135 | 31.8% |
| College / Undergraduate | 116 | 27.3% |
| Graduate / Professional | 15 | 3.5% |
| Total | 425 | 100.0% |
School Enrollment by Age by Funding Source in Massanutten
Out of a total of 425 students who are enrolled in schools in Massanutten, 93 (21.9%) attend a private institution, while the remaining 332 (78.1%) are enrolled in public schools. The age group of 3 to 4 year olds has the highest likelihood of being enrolled in private schools, with 10 (100.0% in the age bracket) enrolled. Conversely, the age group of 18 to 19 year olds has the lowest likelihood of being enrolled in a private school, with 76 (100.0% in the age bracket) attending a public institution.
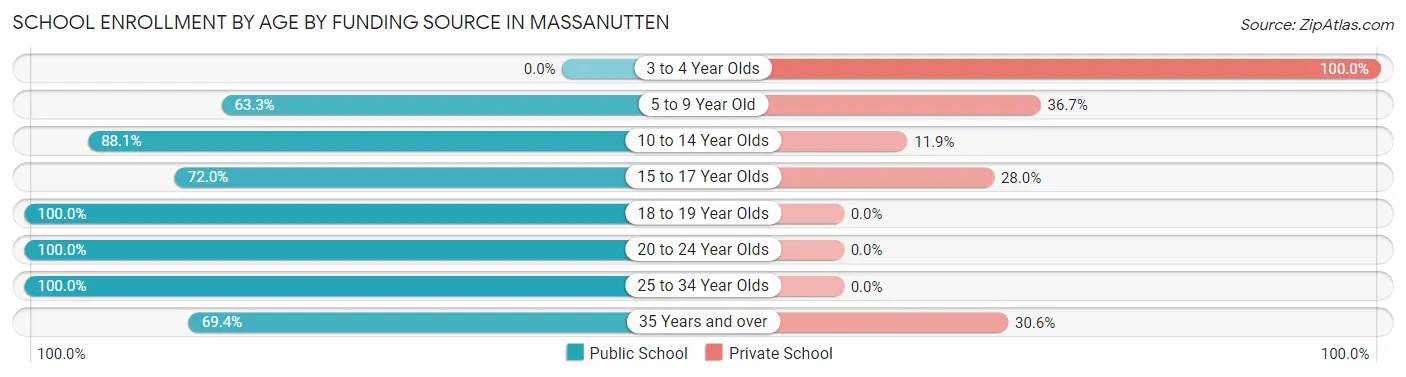
| Age Bracket | Public School | Private School |
| 3 to 4 Year Olds | 0 (0.0%) | 10 (100.0%) |
| 5 to 9 Year Old | 57 (63.3%) | 33 (36.7%) |
| 10 to 14 Year Olds | 52 (88.1%) | 7 (11.9%) |
| 15 to 17 Year Olds | 72 (72.0%) | 28 (28.0%) |
| 18 to 19 Year Olds | 76 (100.0%) | 0 (0.0%) |
| 20 to 24 Year Olds | 32 (100.0%) | 0 (0.0%) |
| 25 to 34 Year Olds | 9 (100.0%) | 0 (0.0%) |
| 35 Years and over | 34 (69.4%) | 15 (30.6%) |
| Total | 332 (78.1%) | 93 (21.9%) |
Educational Attainment by Field of Study in Massanutten
Education (159 | 15.1%), business (120 | 11.4%), social sciences (112 | 10.6%), physical & health sciences (95 | 9.0%), and literature & languages (86 | 8.2%) are the most common fields of study among 1,055 individuals in Massanutten who have obtained a bachelor's degree or higher.
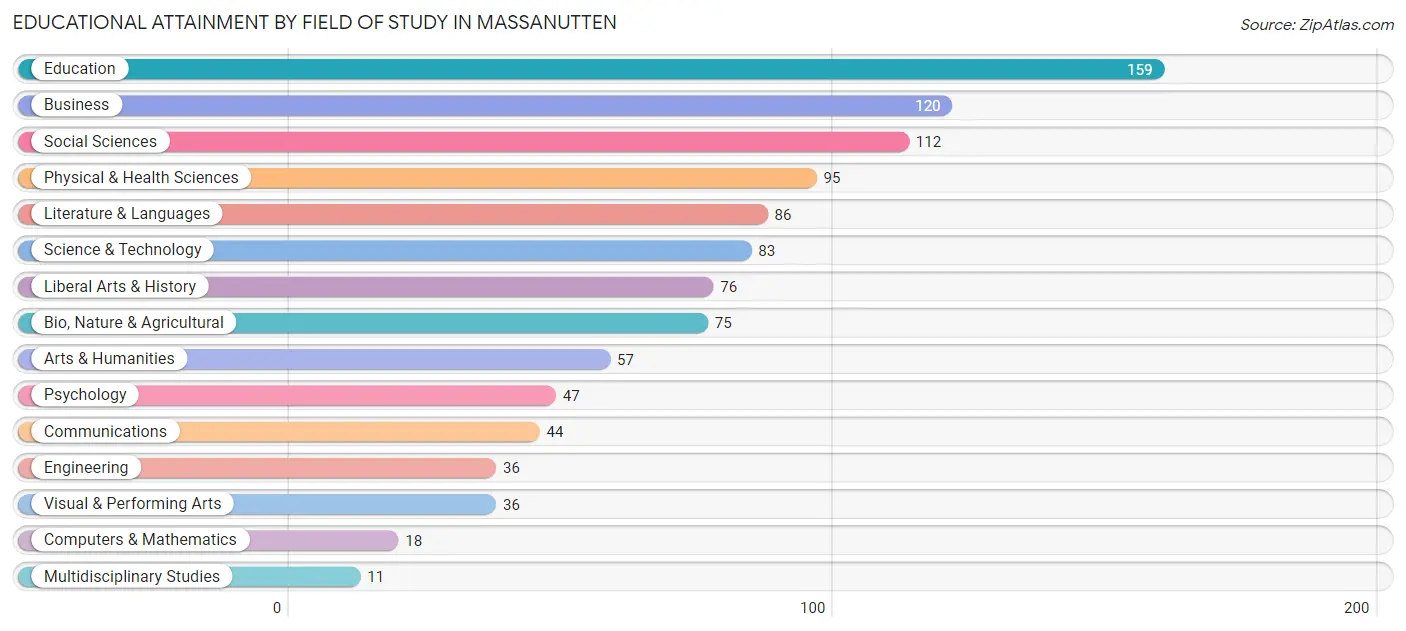
| Field of Study | # Graduates | % Graduates |
| Computers & Mathematics | 18 | 1.7% |
| Bio, Nature & Agricultural | 75 | 7.1% |
| Physical & Health Sciences | 95 | 9.0% |
| Psychology | 47 | 4.4% |
| Social Sciences | 112 | 10.6% |
| Engineering | 36 | 3.4% |
| Multidisciplinary Studies | 11 | 1.0% |
| Science & Technology | 83 | 7.9% |
| Business | 120 | 11.4% |
| Education | 159 | 15.1% |
| Literature & Languages | 86 | 8.2% |
| Liberal Arts & History | 76 | 7.2% |
| Visual & Performing Arts | 36 | 3.4% |
| Communications | 44 | 4.2% |
| Arts & Humanities | 57 | 5.4% |
| Total | 1,055 | 100.0% |
Transportation & Commute in Massanutten
Vehicle Availability by Sex in Massanutten
The most prevalent vehicle ownership categories in Massanutten are males with 2 vehicles (364, accounting for 54.0%) and females with 2 vehicles (294, making up 59.8%).
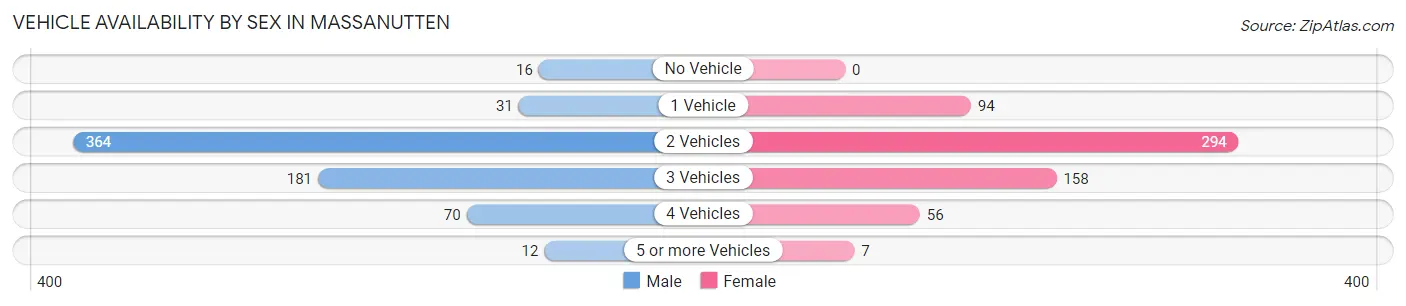
| Vehicles Available | Male | Female |
| No Vehicle | 16 (2.4%) | 0 (0.0%) |
| 1 Vehicle | 31 (4.6%) | 94 (15.4%) |
| 2 Vehicles | 364 (54.0%) | 294 (48.3%) |
| 3 Vehicles | 181 (26.9%) | 158 (25.9%) |
| 4 Vehicles | 70 (10.4%) | 56 (9.2%) |
| 5 or more Vehicles | 12 (1.8%) | 7 (1.1%) |
| Total | 674 (100.0%) | 609 (100.0%) |
Commute Time in Massanutten
The most frequently occuring commute durations in Massanutten are 10 to 14 minutes (237 commuters, 21.0%), 25 to 29 minutes (140 commuters, 12.4%), and 15 to 19 minutes (138 commuters, 12.2%).
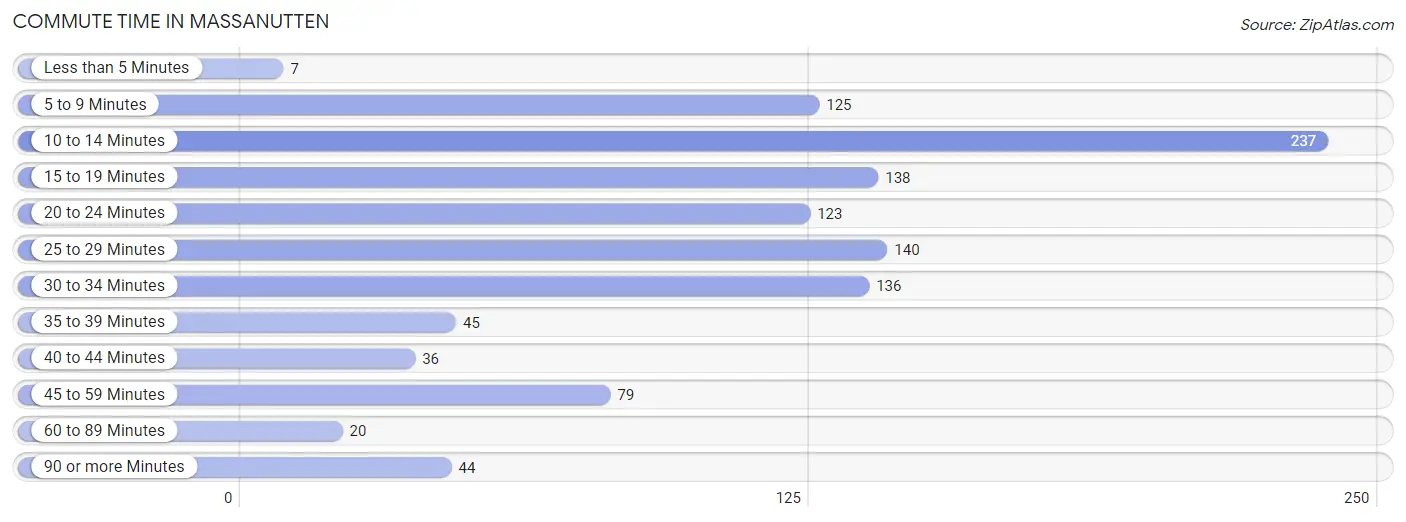
| Commute Time | # Commuters | % Commuters |
| Less than 5 Minutes | 7 | 0.6% |
| 5 to 9 Minutes | 125 | 11.1% |
| 10 to 14 Minutes | 237 | 21.0% |
| 15 to 19 Minutes | 138 | 12.2% |
| 20 to 24 Minutes | 123 | 10.9% |
| 25 to 29 Minutes | 140 | 12.4% |
| 30 to 34 Minutes | 136 | 12.0% |
| 35 to 39 Minutes | 45 | 4.0% |
| 40 to 44 Minutes | 36 | 3.2% |
| 45 to 59 Minutes | 79 | 7.0% |
| 60 to 89 Minutes | 20 | 1.8% |
| 90 or more Minutes | 44 | 3.9% |
Commute Time by Sex in Massanutten
The most common commute times in Massanutten are 10 to 14 minutes (172 commuters, 27.2%) for males and 25 to 29 minutes (78 commuters, 15.7%) for females.
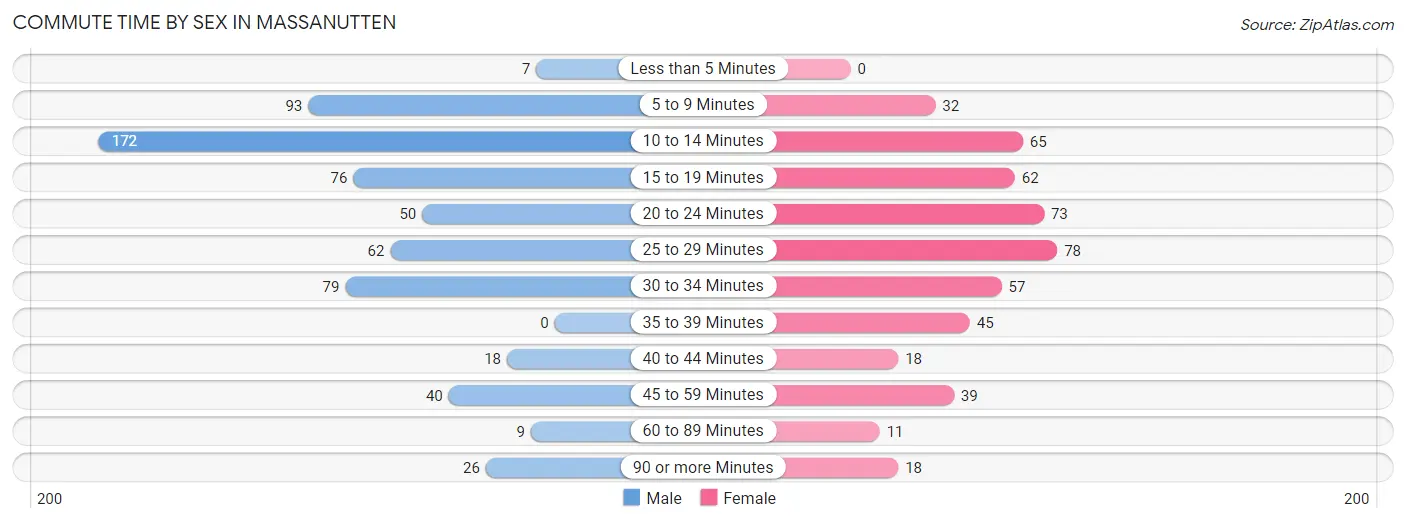
| Commute Time | Male | Female |
| Less than 5 Minutes | 7 (1.1%) | 0 (0.0%) |
| 5 to 9 Minutes | 93 (14.7%) | 32 (6.4%) |
| 10 to 14 Minutes | 172 (27.2%) | 65 (13.1%) |
| 15 to 19 Minutes | 76 (12.0%) | 62 (12.4%) |
| 20 to 24 Minutes | 50 (7.9%) | 73 (14.7%) |
| 25 to 29 Minutes | 62 (9.8%) | 78 (15.7%) |
| 30 to 34 Minutes | 79 (12.5%) | 57 (11.5%) |
| 35 to 39 Minutes | 0 (0.0%) | 45 (9.0%) |
| 40 to 44 Minutes | 18 (2.9%) | 18 (3.6%) |
| 45 to 59 Minutes | 40 (6.3%) | 39 (7.8%) |
| 60 to 89 Minutes | 9 (1.4%) | 11 (2.2%) |
| 90 or more Minutes | 26 (4.1%) | 18 (3.6%) |
Time of Departure to Work by Sex in Massanutten
The most frequent times of departure to work in Massanutten are 8:00 AM to 8:29 AM (167, 26.4%) for males and 7:00 AM to 7:29 AM (153, 30.7%) for females.
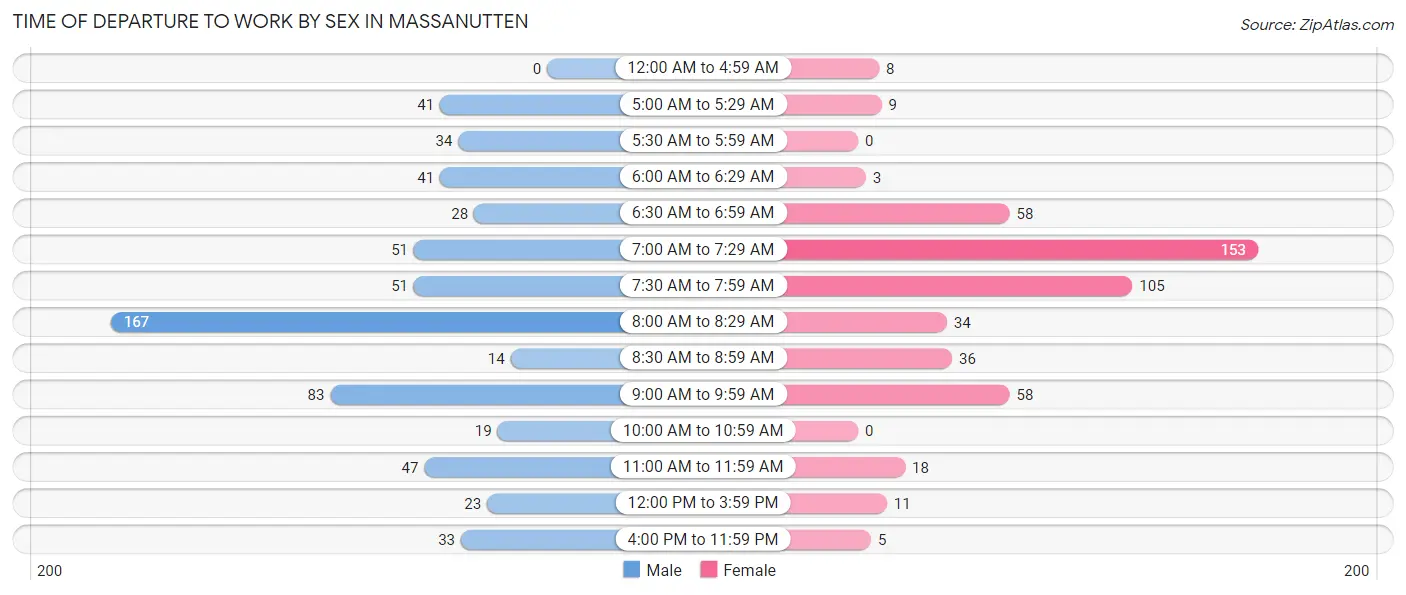
| Time of Departure | Male | Female |
| 12:00 AM to 4:59 AM | 0 (0.0%) | 8 (1.6%) |
| 5:00 AM to 5:29 AM | 41 (6.5%) | 9 (1.8%) |
| 5:30 AM to 5:59 AM | 34 (5.4%) | 0 (0.0%) |
| 6:00 AM to 6:29 AM | 41 (6.5%) | 3 (0.6%) |
| 6:30 AM to 6:59 AM | 28 (4.4%) | 58 (11.7%) |
| 7:00 AM to 7:29 AM | 51 (8.1%) | 153 (30.7%) |
| 7:30 AM to 7:59 AM | 51 (8.1%) | 105 (21.1%) |
| 8:00 AM to 8:29 AM | 167 (26.4%) | 34 (6.8%) |
| 8:30 AM to 8:59 AM | 14 (2.2%) | 36 (7.2%) |
| 9:00 AM to 9:59 AM | 83 (13.1%) | 58 (11.7%) |
| 10:00 AM to 10:59 AM | 19 (3.0%) | 0 (0.0%) |
| 11:00 AM to 11:59 AM | 47 (7.4%) | 18 (3.6%) |
| 12:00 PM to 3:59 PM | 23 (3.6%) | 11 (2.2%) |
| 4:00 PM to 11:59 PM | 33 (5.2%) | 5 (1.0%) |
| Total | 632 (100.0%) | 498 (100.0%) |
Housing Occupancy in Massanutten
Occupancy by Ownership in Massanutten
Of the total 977 dwellings in Massanutten, owner-occupied units account for 892 (91.3%), while renter-occupied units make up 85 (8.7%).
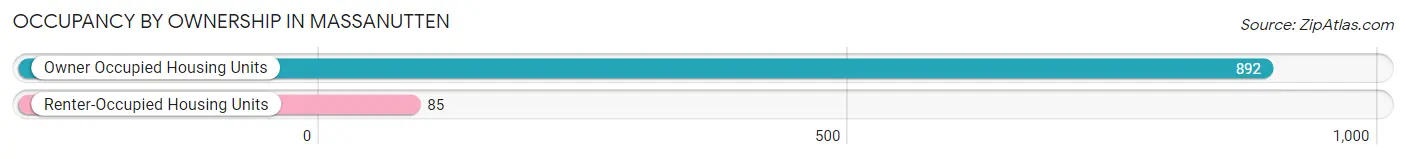
| Occupancy | # Housing Units | % Housing Units |
| Owner Occupied Housing Units | 892 | 91.3% |
| Renter-Occupied Housing Units | 85 | 8.7% |
| Total Occupied Housing Units | 977 | 100.0% |
Occupancy by Household Size in Massanutten
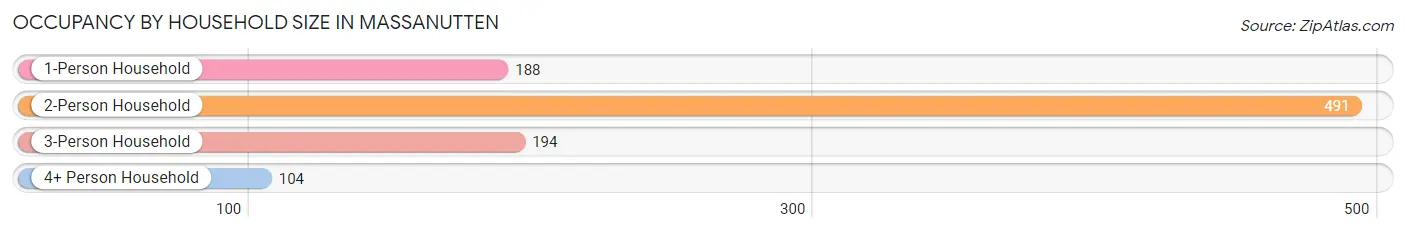
| Household Size | # Housing Units | % Housing Units |
| 1-Person Household | 188 | 19.2% |
| 2-Person Household | 491 | 50.3% |
| 3-Person Household | 194 | 19.9% |
| 4+ Person Household | 104 | 10.6% |
| Total Housing Units | 977 | 100.0% |
Occupancy by Ownership by Household Size in Massanutten
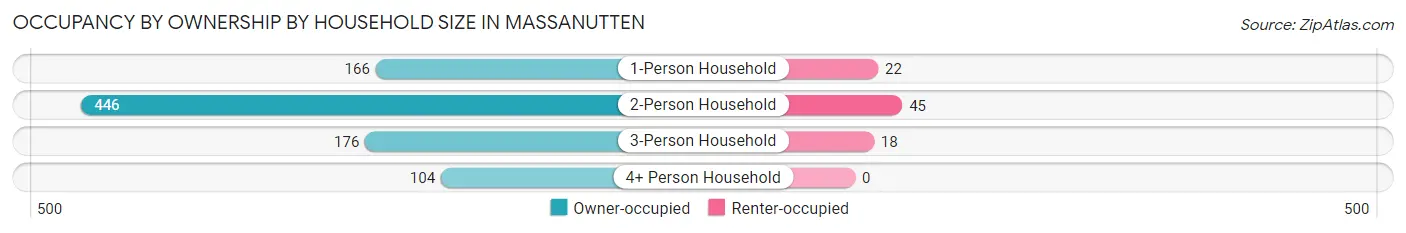
| Household Size | Owner-occupied | Renter-occupied |
| 1-Person Household | 166 (88.3%) | 22 (11.7%) |
| 2-Person Household | 446 (90.8%) | 45 (9.2%) |
| 3-Person Household | 176 (90.7%) | 18 (9.3%) |
| 4+ Person Household | 104 (100.0%) | 0 (0.0%) |
| Total Housing Units | 892 (91.3%) | 85 (8.7%) |
Occupancy by Educational Attainment in Massanutten
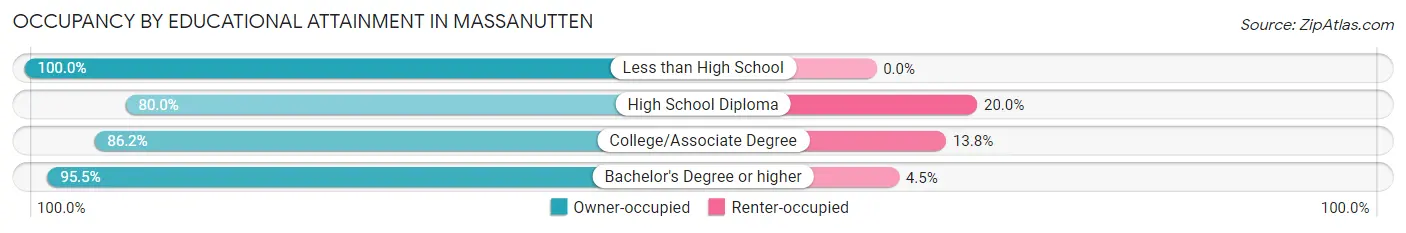
| Household Size | Owner-occupied | Renter-occupied |
| Less than High School | 14 (100.0%) | 0 (0.0%) |
| High School Diploma | 44 (80.0%) | 11 (20.0%) |
| College/Associate Degree | 305 (86.2%) | 49 (13.8%) |
| Bachelor's Degree or higher | 529 (95.5%) | 25 (4.5%) |
Occupancy by Age of Householder in Massanutten
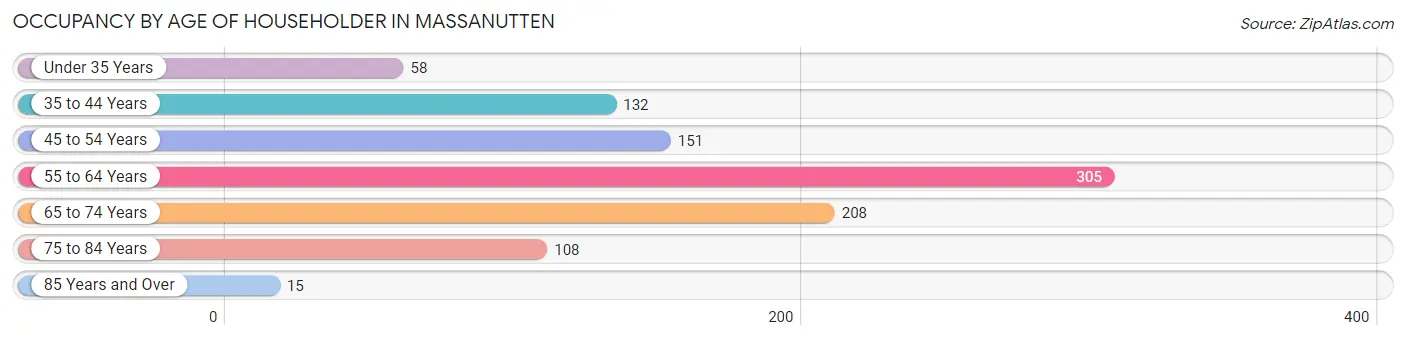
| Age Bracket | # Households | % Households |
| Under 35 Years | 58 | 5.9% |
| 35 to 44 Years | 132 | 13.5% |
| 45 to 54 Years | 151 | 15.5% |
| 55 to 64 Years | 305 | 31.2% |
| 65 to 74 Years | 208 | 21.3% |
| 75 to 84 Years | 108 | 11.1% |
| 85 Years and Over | 15 | 1.5% |
| Total | 977 | 100.0% |
Housing Finances in Massanutten
Median Income by Occupancy in Massanutten
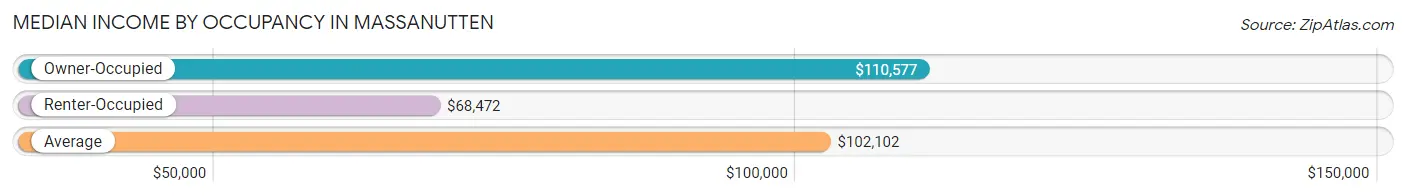
| Occupancy Type | # Households | Median Income |
| Owner-Occupied | 892 (91.3%) | $110,577 |
| Renter-Occupied | 85 (8.7%) | $68,472 |
| Average | 977 (100.0%) | $102,102 |
Occupancy by Householder Income Bracket in Massanutten
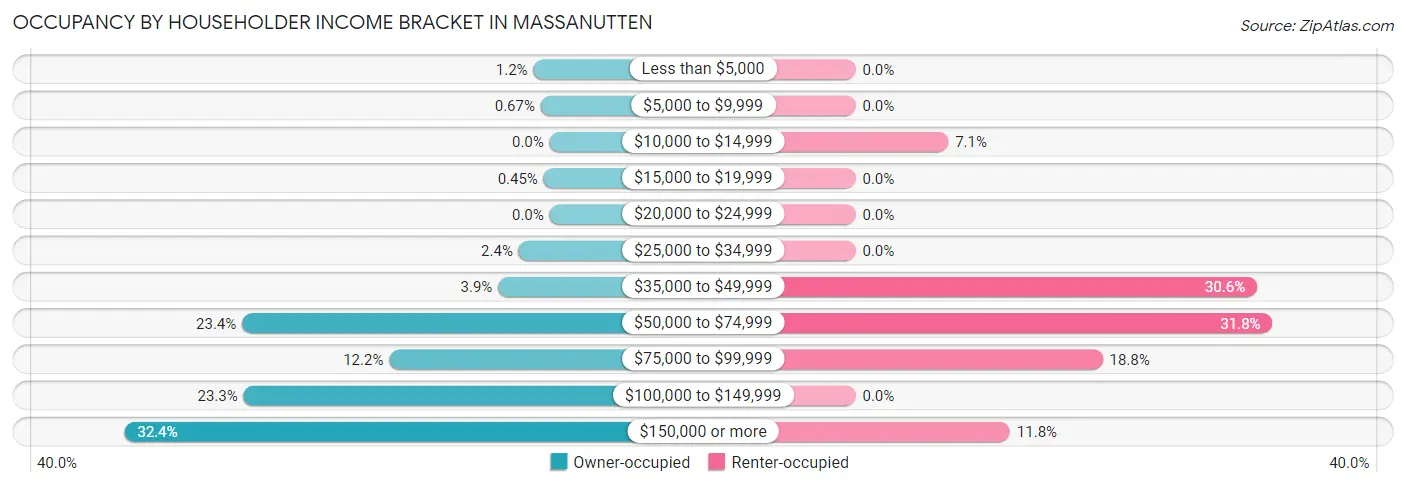
| Income Bracket | Owner-occupied | Renter-occupied |
| Less than $5,000 | 11 (1.2%) | 0 (0.0%) |
| $5,000 to $9,999 | 6 (0.7%) | 0 (0.0%) |
| $10,000 to $14,999 | 0 (0.0%) | 6 (7.1%) |
| $15,000 to $19,999 | 4 (0.4%) | 0 (0.0%) |
| $20,000 to $24,999 | 0 (0.0%) | 0 (0.0%) |
| $25,000 to $34,999 | 21 (2.4%) | 0 (0.0%) |
| $35,000 to $49,999 | 35 (3.9%) | 26 (30.6%) |
| $50,000 to $74,999 | 209 (23.4%) | 27 (31.8%) |
| $75,000 to $99,999 | 109 (12.2%) | 16 (18.8%) |
| $100,000 to $149,999 | 208 (23.3%) | 0 (0.0%) |
| $150,000 or more | 289 (32.4%) | 10 (11.8%) |
| Total | 892 (100.0%) | 85 (100.0%) |
Monthly Housing Cost Tiers in Massanutten
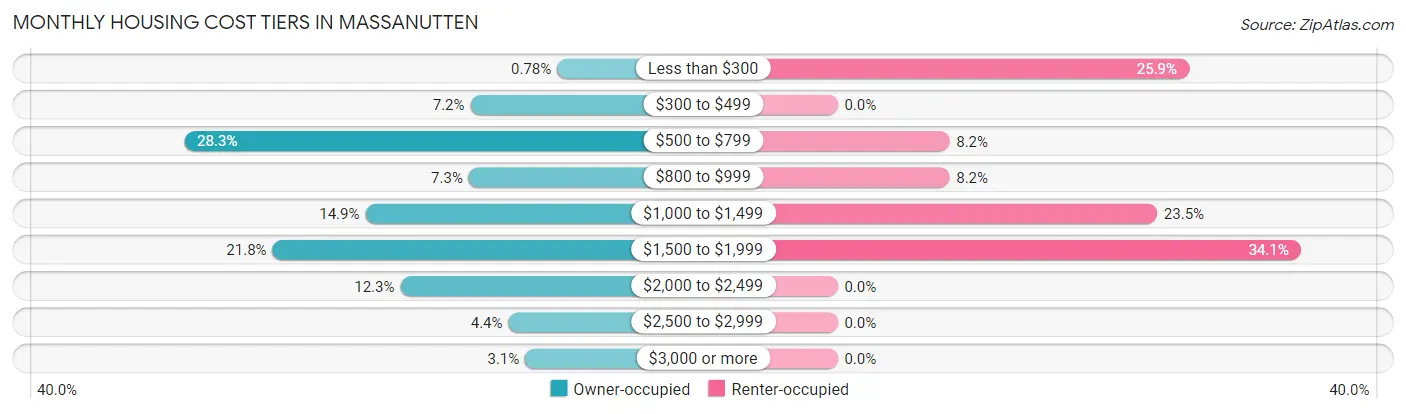
| Monthly Cost | Owner-occupied | Renter-occupied |
| Less than $300 | 7 (0.8%) | 22 (25.9%) |
| $300 to $499 | 64 (7.2%) | 0 (0.0%) |
| $500 to $799 | 252 (28.2%) | 7 (8.2%) |
| $800 to $999 | 65 (7.3%) | 7 (8.2%) |
| $1,000 to $1,499 | 133 (14.9%) | 20 (23.5%) |
| $1,500 to $1,999 | 194 (21.7%) | 29 (34.1%) |
| $2,000 to $2,499 | 110 (12.3%) | 0 (0.0%) |
| $2,500 to $2,999 | 39 (4.4%) | 0 (0.0%) |
| $3,000 or more | 28 (3.1%) | 0 (0.0%) |
| Total | 892 (100.0%) | 85 (100.0%) |
Physical Housing Characteristics in Massanutten
Housing Structures in Massanutten
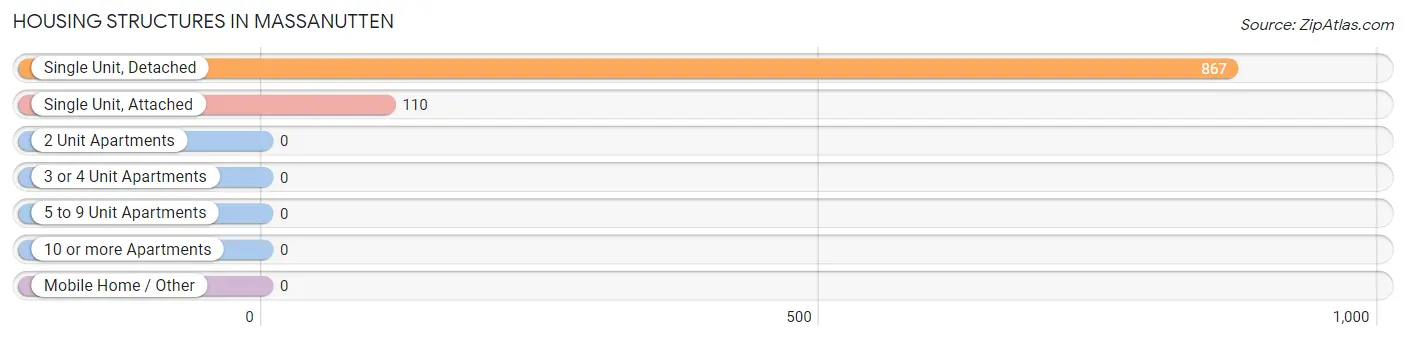
| Structure Type | # Housing Units | % Housing Units |
| Single Unit, Detached | 867 | 88.7% |
| Single Unit, Attached | 110 | 11.3% |
| 2 Unit Apartments | 0 | 0.0% |
| 3 or 4 Unit Apartments | 0 | 0.0% |
| 5 to 9 Unit Apartments | 0 | 0.0% |
| 10 or more Apartments | 0 | 0.0% |
| Mobile Home / Other | 0 | 0.0% |
| Total | 977 | 100.0% |
Housing Structures by Occupancy in Massanutten
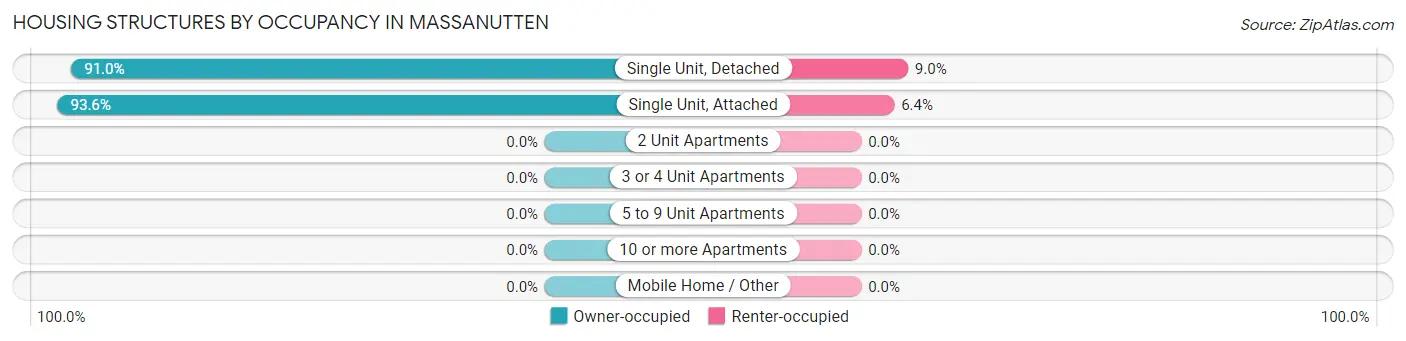
| Structure Type | Owner-occupied | Renter-occupied |
| Single Unit, Detached | 789 (91.0%) | 78 (9.0%) |
| Single Unit, Attached | 103 (93.6%) | 7 (6.4%) |
| 2 Unit Apartments | 0 (0.0%) | 0 (0.0%) |
| 3 or 4 Unit Apartments | 0 (0.0%) | 0 (0.0%) |
| 5 to 9 Unit Apartments | 0 (0.0%) | 0 (0.0%) |
| 10 or more Apartments | 0 (0.0%) | 0 (0.0%) |
| Mobile Home / Other | 0 (0.0%) | 0 (0.0%) |
| Total | 892 (91.3%) | 85 (8.7%) |
Housing Structures by Number of Rooms in Massanutten
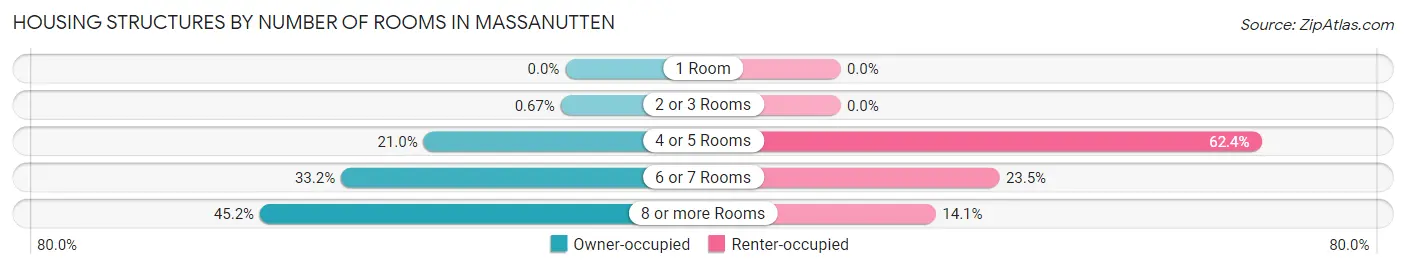
| Number of Rooms | Owner-occupied | Renter-occupied |
| 1 Room | 0 (0.0%) | 0 (0.0%) |
| 2 or 3 Rooms | 6 (0.7%) | 0 (0.0%) |
| 4 or 5 Rooms | 187 (21.0%) | 53 (62.4%) |
| 6 or 7 Rooms | 296 (33.2%) | 20 (23.5%) |
| 8 or more Rooms | 403 (45.2%) | 12 (14.1%) |
| Total | 892 (100.0%) | 85 (100.0%) |
Housing Structure by Heating Type in Massanutten
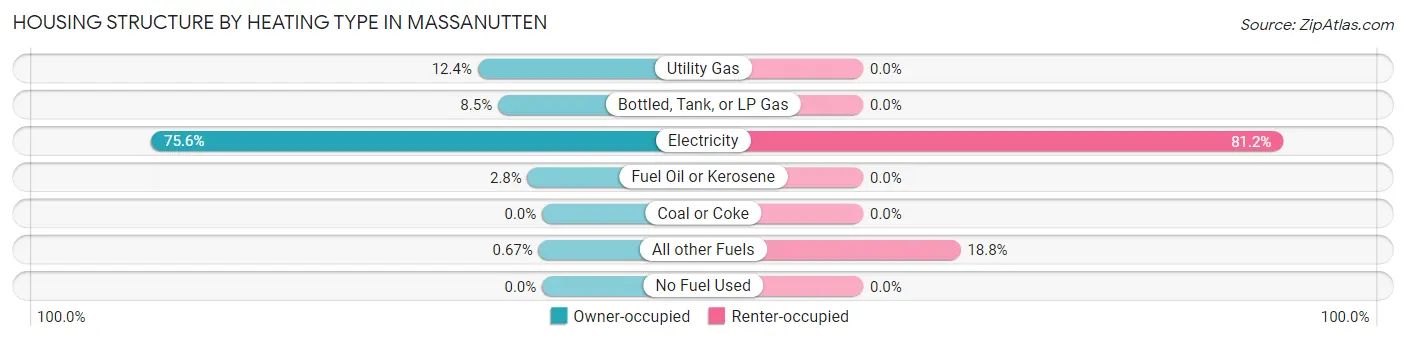
| Heating Type | Owner-occupied | Renter-occupied |
| Utility Gas | 111 (12.4%) | 0 (0.0%) |
| Bottled, Tank, or LP Gas | 76 (8.5%) | 0 (0.0%) |
| Electricity | 674 (75.6%) | 69 (81.2%) |
| Fuel Oil or Kerosene | 25 (2.8%) | 0 (0.0%) |
| Coal or Coke | 0 (0.0%) | 0 (0.0%) |
| All other Fuels | 6 (0.7%) | 16 (18.8%) |
| No Fuel Used | 0 (0.0%) | 0 (0.0%) |
| Total | 892 (100.0%) | 85 (100.0%) |
Household Vehicle Usage in Massanutten
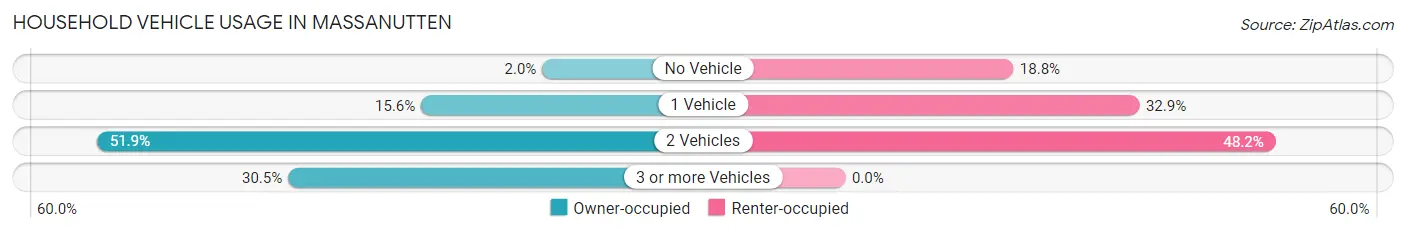
| Vehicles per Household | Owner-occupied | Renter-occupied |
| No Vehicle | 18 (2.0%) | 16 (18.8%) |
| 1 Vehicle | 139 (15.6%) | 28 (32.9%) |
| 2 Vehicles | 463 (51.9%) | 41 (48.2%) |
| 3 or more Vehicles | 272 (30.5%) | 0 (0.0%) |
| Total | 892 (100.0%) | 85 (100.0%) |
Real Estate & Mortgages in Massanutten
Real Estate and Mortgage Overview in Massanutten
| Characteristic | Without Mortgage | With Mortgage |
| Housing Units | 368 | 524 |
| Median Property Value | $394,300 | $320,100 |
| Median Household Income | $71,250 | $196 |
| Monthly Housing Costs | $675 | $28 |
| Real Estate Taxes | $2,589 | $0 |
Property Value by Mortgage Status in Massanutten
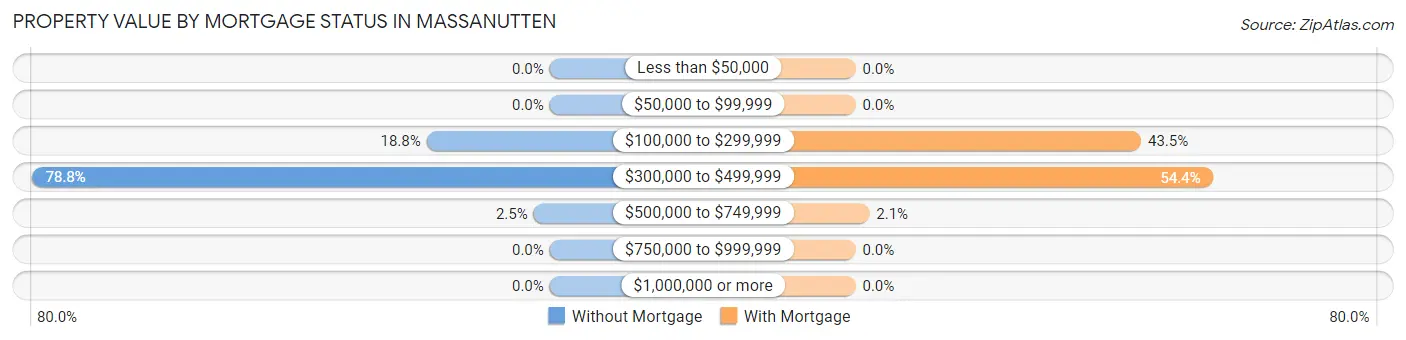
| Property Value | Without Mortgage | With Mortgage |
| Less than $50,000 | 0 (0.0%) | 0 (0.0%) |
| $50,000 to $99,999 | 0 (0.0%) | 0 (0.0%) |
| $100,000 to $299,999 | 69 (18.8%) | 228 (43.5%) |
| $300,000 to $499,999 | 290 (78.8%) | 285 (54.4%) |
| $500,000 to $749,999 | 9 (2.5%) | 11 (2.1%) |
| $750,000 to $999,999 | 0 (0.0%) | 0 (0.0%) |
| $1,000,000 or more | 0 (0.0%) | 0 (0.0%) |
| Total | 368 (100.0%) | 524 (100.0%) |
Household Income by Mortgage Status in Massanutten
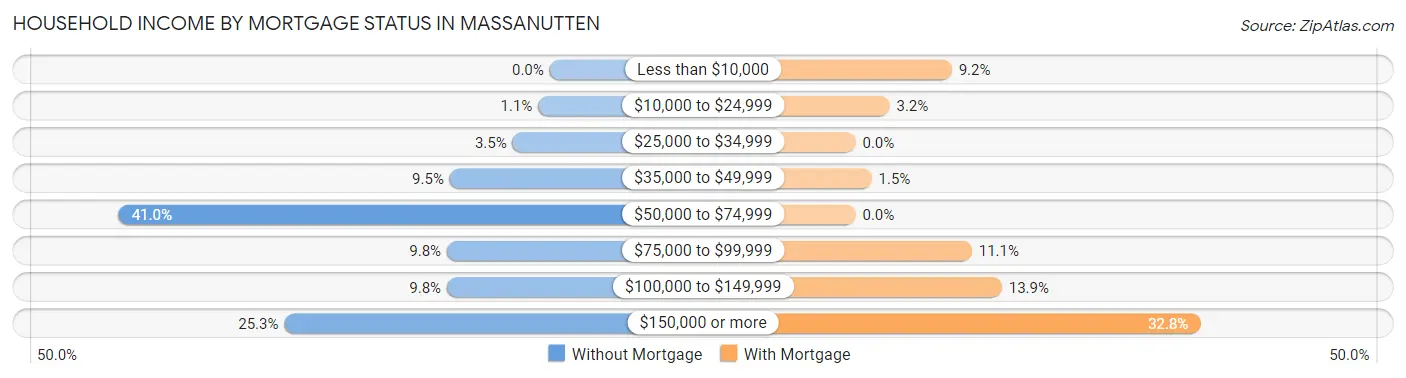
| Household Income | Without Mortgage | With Mortgage |
| Less than $10,000 | 0 (0.0%) | 48 (9.2%) |
| $10,000 to $24,999 | 4 (1.1%) | 17 (3.2%) |
| $25,000 to $34,999 | 13 (3.5%) | 0 (0.0%) |
| $35,000 to $49,999 | 35 (9.5%) | 8 (1.5%) |
| $50,000 to $74,999 | 151 (41.0%) | 0 (0.0%) |
| $75,000 to $99,999 | 36 (9.8%) | 58 (11.1%) |
| $100,000 to $149,999 | 36 (9.8%) | 73 (13.9%) |
| $150,000 or more | 93 (25.3%) | 172 (32.8%) |
| Total | 368 (100.0%) | 524 (100.0%) |
Property Value to Household Income Ratio in Massanutten
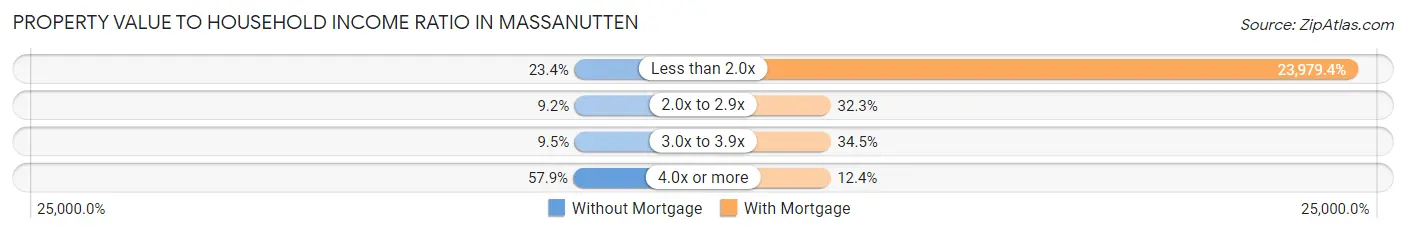
| Value-to-Income Ratio | Without Mortgage | With Mortgage |
| Less than 2.0x | 86 (23.4%) | 125,652 (23,979.4%) |
| 2.0x to 2.9x | 34 (9.2%) | 169 (32.3%) |
| 3.0x to 3.9x | 35 (9.5%) | 181 (34.5%) |
| 4.0x or more | 213 (57.9%) | 65 (12.4%) |
| Total | 368 (100.0%) | 524 (100.0%) |
Real Estate Taxes by Mortgage Status in Massanutten
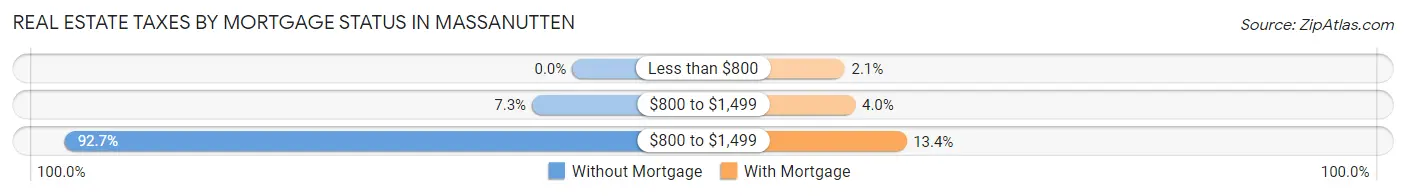
| Property Taxes | Without Mortgage | With Mortgage |
| Less than $800 | 0 (0.0%) | 11 (2.1%) |
| $800 to $1,499 | 27 (7.3%) | 21 (4.0%) |
| $800 to $1,499 | 341 (92.7%) | 70 (13.4%) |
| Total | 368 (100.0%) | 524 (100.0%) |
Health & Disability in Massanutten
Health Insurance Coverage by Age in Massanutten
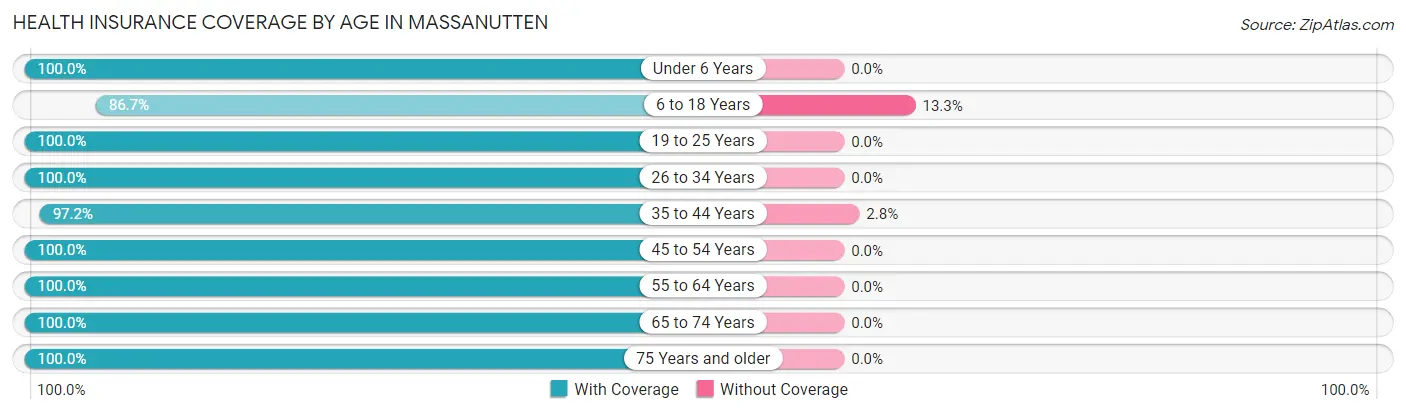
| Age Bracket | With Coverage | Without Coverage |
| Under 6 Years | 138 (100.0%) | 0 (0.0%) |
| 6 to 18 Years | 222 (86.7%) | 34 (13.3%) |
| 19 to 25 Years | 99 (100.0%) | 0 (0.0%) |
| 26 to 34 Years | 178 (100.0%) | 0 (0.0%) |
| 35 to 44 Years | 241 (97.2%) | 7 (2.8%) |
| 45 to 54 Years | 283 (100.0%) | 0 (0.0%) |
| 55 to 64 Years | 641 (100.0%) | 0 (0.0%) |
| 65 to 74 Years | 354 (100.0%) | 0 (0.0%) |
| 75 Years and older | 171 (100.0%) | 0 (0.0%) |
| Total | 2,327 (98.3%) | 41 (1.7%) |
Health Insurance Coverage by Citizenship Status in Massanutten
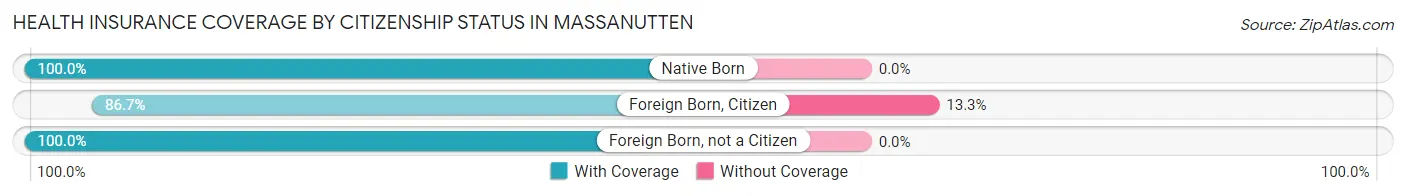
| Citizenship Status | With Coverage | Without Coverage |
| Native Born | 138 (100.0%) | 0 (0.0%) |
| Foreign Born, Citizen | 222 (86.7%) | 34 (13.3%) |
| Foreign Born, not a Citizen | 99 (100.0%) | 0 (0.0%) |
Health Insurance Coverage by Household Income in Massanutten
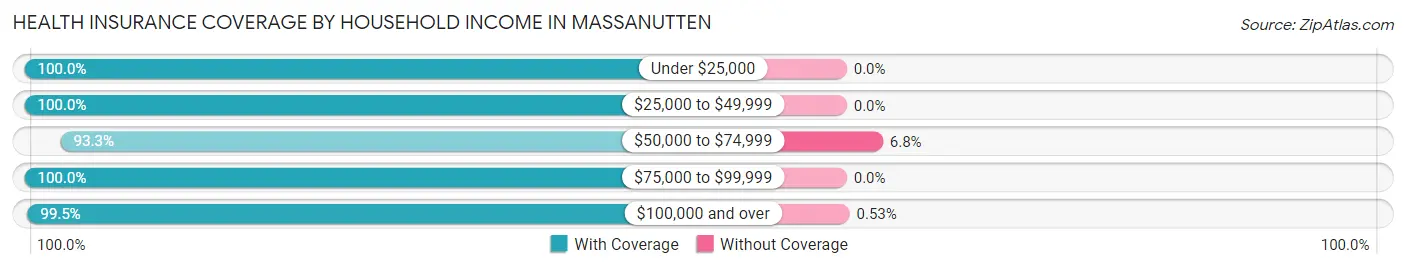
| Household Income | With Coverage | Without Coverage |
| Under $25,000 | 58 (100.0%) | 0 (0.0%) |
| $25,000 to $49,999 | 187 (100.0%) | 0 (0.0%) |
| $50,000 to $74,999 | 470 (93.2%) | 34 (6.8%) |
| $75,000 to $99,999 | 295 (100.0%) | 0 (0.0%) |
| $100,000 and over | 1,317 (99.5%) | 7 (0.5%) |
Public vs Private Health Insurance Coverage by Age in Massanutten
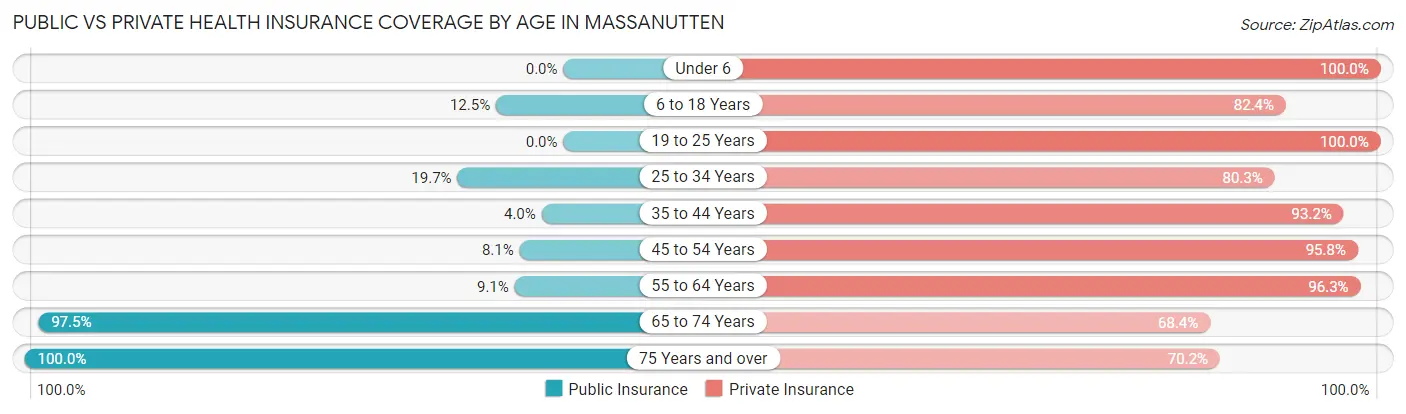
| Age Bracket | Public Insurance | Private Insurance |
| Under 6 | 0 (0.0%) | 138 (100.0%) |
| 6 to 18 Years | 32 (12.5%) | 211 (82.4%) |
| 19 to 25 Years | 0 (0.0%) | 99 (100.0%) |
| 25 to 34 Years | 35 (19.7%) | 143 (80.3%) |
| 35 to 44 Years | 10 (4.0%) | 231 (93.1%) |
| 45 to 54 Years | 23 (8.1%) | 271 (95.8%) |
| 55 to 64 Years | 58 (9.0%) | 617 (96.3%) |
| 65 to 74 Years | 345 (97.5%) | 242 (68.4%) |
| 75 Years and over | 171 (100.0%) | 120 (70.2%) |
| Total | 674 (28.5%) | 2,072 (87.5%) |
Disability Status by Sex by Age in Massanutten
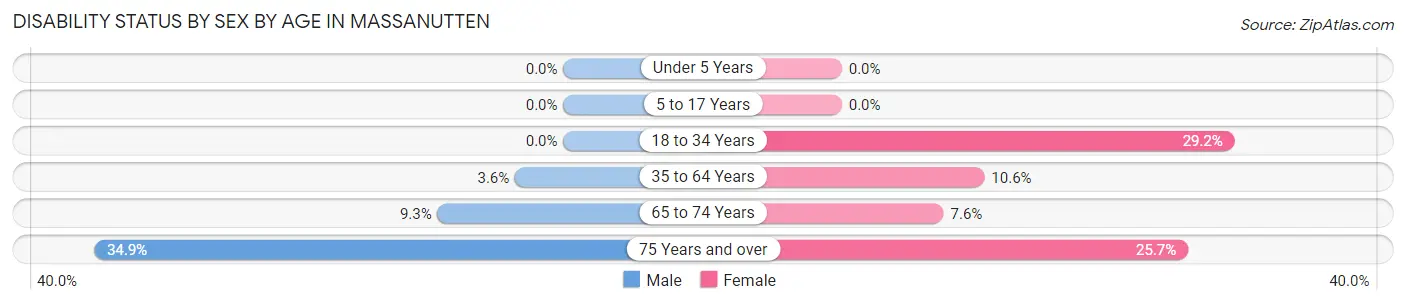
| Age Bracket | Male | Female |
| Under 5 Years | 0 (0.0%) | 0 (0.0%) |
| 5 to 17 Years | 0 (0.0%) | 0 (0.0%) |
| 18 to 34 Years | 0 (0.0%) | 42 (29.2%) |
| 35 to 64 Years | 20 (3.6%) | 65 (10.6%) |
| 65 to 74 Years | 17 (9.3%) | 13 (7.6%) |
| 75 Years and over | 23 (34.8%) | 27 (25.7%) |
Disability Class by Sex by Age in Massanutten
Disability Class: Hearing Difficulty
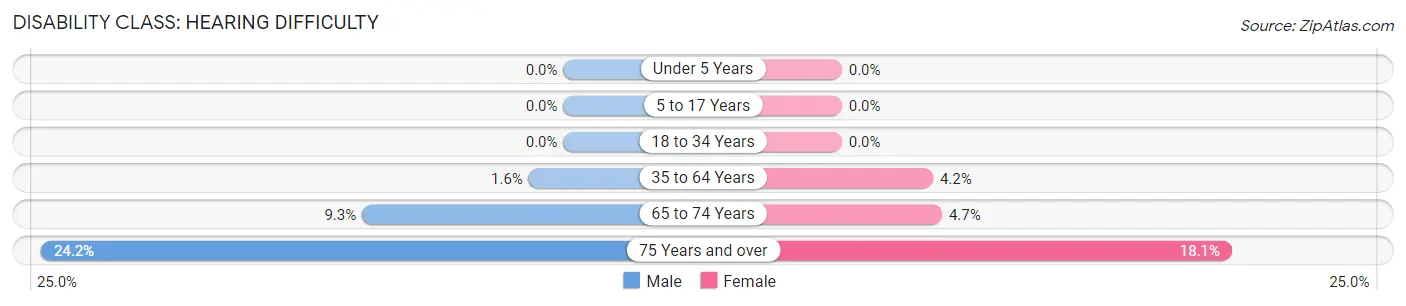
| Age Bracket | Male | Female |
| Under 5 Years | 0 (0.0%) | 0 (0.0%) |
| 5 to 17 Years | 0 (0.0%) | 0 (0.0%) |
| 18 to 34 Years | 0 (0.0%) | 0 (0.0%) |
| 35 to 64 Years | 9 (1.6%) | 26 (4.2%) |
| 65 to 74 Years | 17 (9.3%) | 8 (4.6%) |
| 75 Years and over | 16 (24.2%) | 19 (18.1%) |
Disability Class: Vision Difficulty
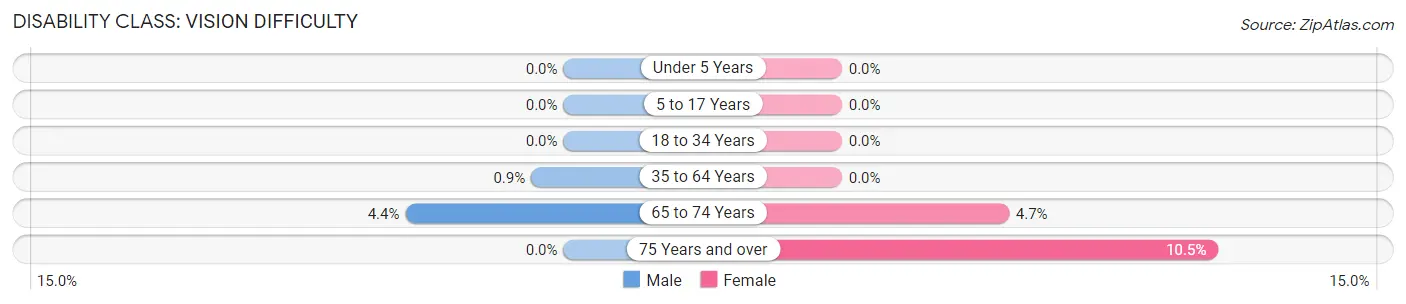
| Age Bracket | Male | Female |
| Under 5 Years | 0 (0.0%) | 0 (0.0%) |
| 5 to 17 Years | 0 (0.0%) | 0 (0.0%) |
| 18 to 34 Years | 0 (0.0%) | 0 (0.0%) |
| 35 to 64 Years | 5 (0.9%) | 0 (0.0%) |
| 65 to 74 Years | 8 (4.4%) | 8 (4.6%) |
| 75 Years and over | 0 (0.0%) | 11 (10.5%) |
Disability Class: Cognitive Difficulty
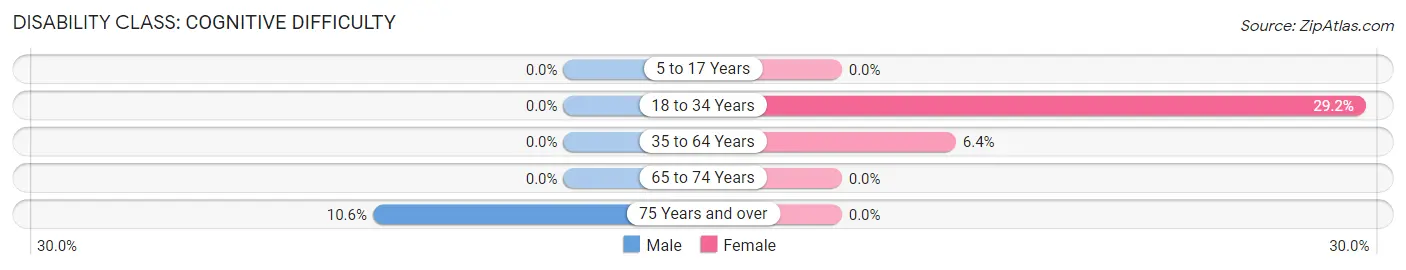
| Age Bracket | Male | Female |
| 5 to 17 Years | 0 (0.0%) | 0 (0.0%) |
| 18 to 34 Years | 0 (0.0%) | 42 (29.2%) |
| 35 to 64 Years | 0 (0.0%) | 39 (6.4%) |
| 65 to 74 Years | 0 (0.0%) | 0 (0.0%) |
| 75 Years and over | 7 (10.6%) | 0 (0.0%) |
Disability Class: Ambulatory Difficulty
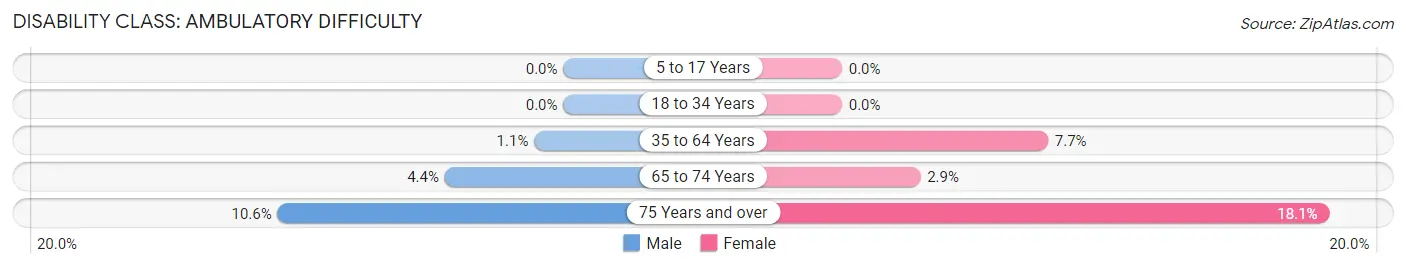
| Age Bracket | Male | Female |
| 5 to 17 Years | 0 (0.0%) | 0 (0.0%) |
| 18 to 34 Years | 0 (0.0%) | 0 (0.0%) |
| 35 to 64 Years | 6 (1.1%) | 47 (7.6%) |
| 65 to 74 Years | 8 (4.4%) | 5 (2.9%) |
| 75 Years and over | 7 (10.6%) | 19 (18.1%) |
Disability Class: Self-Care Difficulty
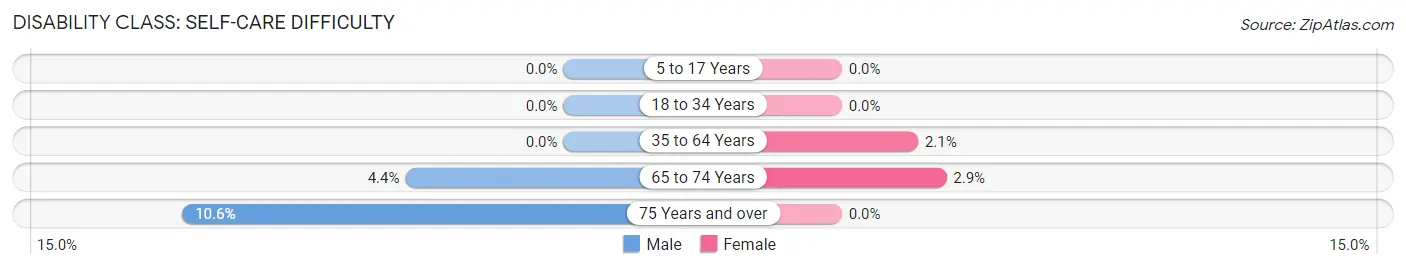
| Age Bracket | Male | Female |
| 5 to 17 Years | 0 (0.0%) | 0 (0.0%) |
| 18 to 34 Years | 0 (0.0%) | 0 (0.0%) |
| 35 to 64 Years | 0 (0.0%) | 13 (2.1%) |
| 65 to 74 Years | 8 (4.4%) | 5 (2.9%) |
| 75 Years and over | 7 (10.6%) | 0 (0.0%) |
Technology Access in Massanutten
Computing Device Access in Massanutten
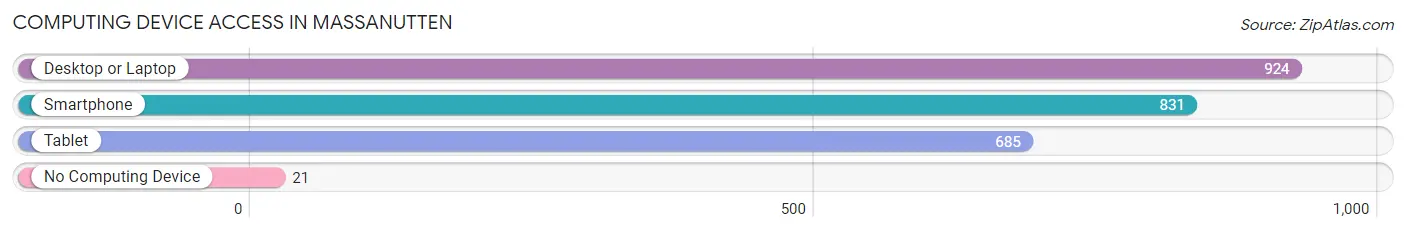
| Device Type | # Households | % Households |
| Desktop or Laptop | 924 | 94.6% |
| Smartphone | 831 | 85.1% |
| Tablet | 685 | 70.1% |
| No Computing Device | 21 | 2.1% |
| Total | 977 | 100.0% |
Internet Access in Massanutten
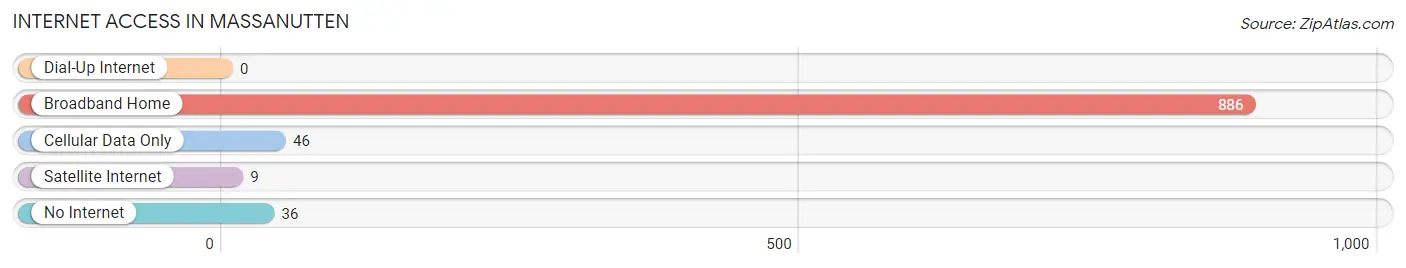
| Internet Type | # Households | % Households |
| Dial-Up Internet | 0 | 0.0% |
| Broadband Home | 886 | 90.7% |
| Cellular Data Only | 46 | 4.7% |
| Satellite Internet | 9 | 0.9% |
| No Internet | 36 | 3.7% |
| Total | 977 | 100.0% |
Massanutten Summary
History
The area now known as Massanutten, Virginia has a long and varied history. The area was first inhabited by Native Americans, including the Monacan, Iroquois, and Shawnee tribes. The first European settlers arrived in the area in the late 17th century, and the area was officially established as part of the Shenandoah Valley in 1738.
The area was initially used for farming and timber production, and the first settlers built log cabins and cleared the land for farming. The area was also home to a number of small villages, including Massanutten, which was established in 1750. The village was named after the nearby Massanutten Mountain, which was named after the Massanutten Indians, a tribe of the Iroquois Nation.
The area was also home to a number of forts, including Fort Massanutten, which was built in 1756 to protect the settlers from Native American attacks. The fort was destroyed during the Civil War, but the area remained largely rural until the late 19th century, when the railroad arrived and the area began to develop.
The area was also home to a number of resorts, including the Massanutten Resort, which was established in 1891. The resort was a popular destination for tourists, and it helped to spur the development of the area.
Geography
Massanutten, Virginia is located in the Shenandoah Valley in the western part of the state. The area is bordered by the Blue Ridge Mountains to the east and the Allegheny Mountains to the west. The area is also home to the Massanutten Mountain, which is the highest peak in the area at 4,039 feet.
The area is home to a number of rivers, including the Shenandoah River, which flows through the area. The area is also home to a number of lakes, including Lake Massanutten, which is the largest lake in the area.
The area is also home to a number of parks, including the George Washington National Forest, which is the largest national forest in the state. The area is also home to a number of state parks, including the Shenandoah National Park, which is the largest national park in the state.
Economy
The economy of Massanutten, Virginia is largely based on tourism. The area is home to a number of resorts, including the Massanutten Resort, which is the largest resort in the area. The resort is a popular destination for tourists, and it helps to drive the local economy.
The area is also home to a number of wineries, including the Massanutten Winery, which produces a variety of wines. The area is also home to a number of craft breweries, including the Massanutten Brewing Company, which produces a variety of craft beers.
The area is also home to a number of manufacturing companies, including the Massanutten Manufacturing Company, which produces a variety of products, including furniture and cabinetry. The area is also home to a number of technology companies, including the Massanutten Technology Park, which is home to a number of technology companies.
Demographics
As of the 2010 census, the population of Massanutten, Virginia was 8,845. The population is largely white (93.3%), with a small percentage of African Americans (3.2%) and Hispanics (2.2%). The median household income in the area is $50,945, and the median age is 41.
The area is home to a number of religious denominations, including Baptist (25.2%), Methodist (17.2%), and Catholic (14.2%). The area is also home to a number of educational institutions, including the Massanutten Technical Institute, which offers a variety of technical and vocational programs.
Common Questions
What is Per Capita Income in Massanutten?
Per Capita income in Massanutten is $54,476.
What is the Median Family Income in Massanutten?
Median Family Income in Massanutten is $102,981.
What is the Median Household income in Massanutten?
Median Household Income in Massanutten is $102,102.
What is Income or Wage Gap in Massanutten?
Income or Wage Gap in Massanutten is 7.8%.
Women in Massanutten earn 92.2 cents for every dollar earned by a man.
What is Inequality or Gini Index in Massanutten?
Inequality or Gini Index in Massanutten is 0.37.
What is the Total Population of Massanutten?
Total Population of Massanutten is 2,368.
What is the Total Male Population of Massanutten?
Total Male Population of Massanutten is 1,140.
What is the Total Female Population of Massanutten?
Total Female Population of Massanutten is 1,228.
What is the Ratio of Males per 100 Females in Massanutten?
There are 92.83 Males per 100 Females in Massanutten.
What is the Ratio of Females per 100 Males in Massanutten?
There are 107.72 Females per 100 Males in Massanutten.
What is the Median Population Age in Massanutten?
Median Population Age in Massanutten is 54.1 Years.
What is the Average Family Size in Massanutten
Average Family Size in Massanutten is 2.8 People.
What is the Average Household Size in Massanutten
Average Household Size in Massanutten is 2.4 People.
How Large is the Labor Force in Massanutten?
There are 1,320 People in the Labor Forcein in Massanutten.
What is the Percentage of People in the Labor Force in Massanutten?
64.0% of People are in the Labor Force in Massanutten.
What is the Unemployment Rate in Massanutten?
Unemployment Rate in Massanutten is 2.4%.