Jarratt, VA Map & Demographics
Jarratt Map
Jarratt Overview
$32,636
PER CAPITA INCOME
$81,250
AVG FAMILY INCOME
$66,458
AVG HOUSEHOLD INCOME
8.3%
WAGE / INCOME GAP [ % ]
91.7¢/ $1
WAGE / INCOME GAP [ $ ]
0.35
INEQUALITY / GINI INDEX
935
TOTAL POPULATION
461
MALE POPULATION
474
FEMALE POPULATION
97.26
MALES / 100 FEMALES
102.82
FEMALES / 100 MALES
37.1
MEDIAN AGE
2.7
AVG FAMILY SIZE
2.4
AVG HOUSEHOLD SIZE
574
LABOR FORCE [ PEOPLE ]
79.1%
PERCENT IN LABOR FORCE
3.7%
UNEMPLOYMENT RATE
Jarratt Zip Codes
Jarratt Area Codes
Income in Jarratt
Income Overview in Jarratt
Per Capita Income in Jarratt is $32,636, while median incomes of families and households are $81,250 and $66,458 respectively.
| Characteristic | Number | Measure |
| Per Capita Income | 935 | $32,636 |
| Median Family Income | 304 | $81,250 |
| Mean Family Income | 304 | $83,010 |
| Median Household Income | 393 | $66,458 |
| Mean Household Income | 393 | $74,225 |
| Income Deficit | 304 | $0 |
| Wage / Income Gap (%) | 935 | 8.29% |
| Wage / Income Gap ($) | 935 | 91.71¢ per $1 |
| Gini / Inequality Index | 935 | 0.35 |
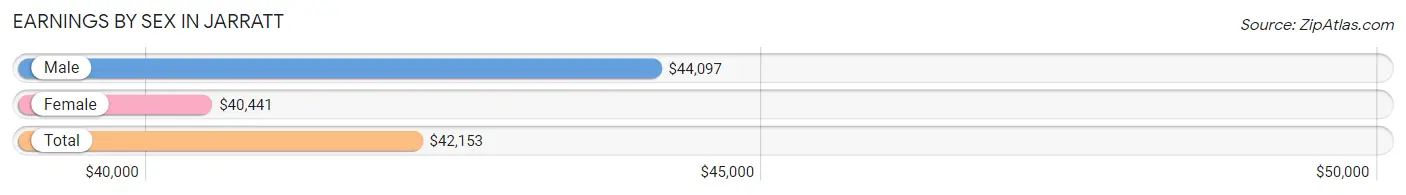
Earnings by Sex in Jarratt
Average Earnings in Jarratt are $42,153, $44,097 for men and $40,441 for women, a difference of 8.3%.
| Sex | Number | Average Earnings |
| Male | 319 (53.3%) | $44,097 |
| Female | 280 (46.7%) | $40,441 |
| Total | 599 (100.0%) | $42,153 |
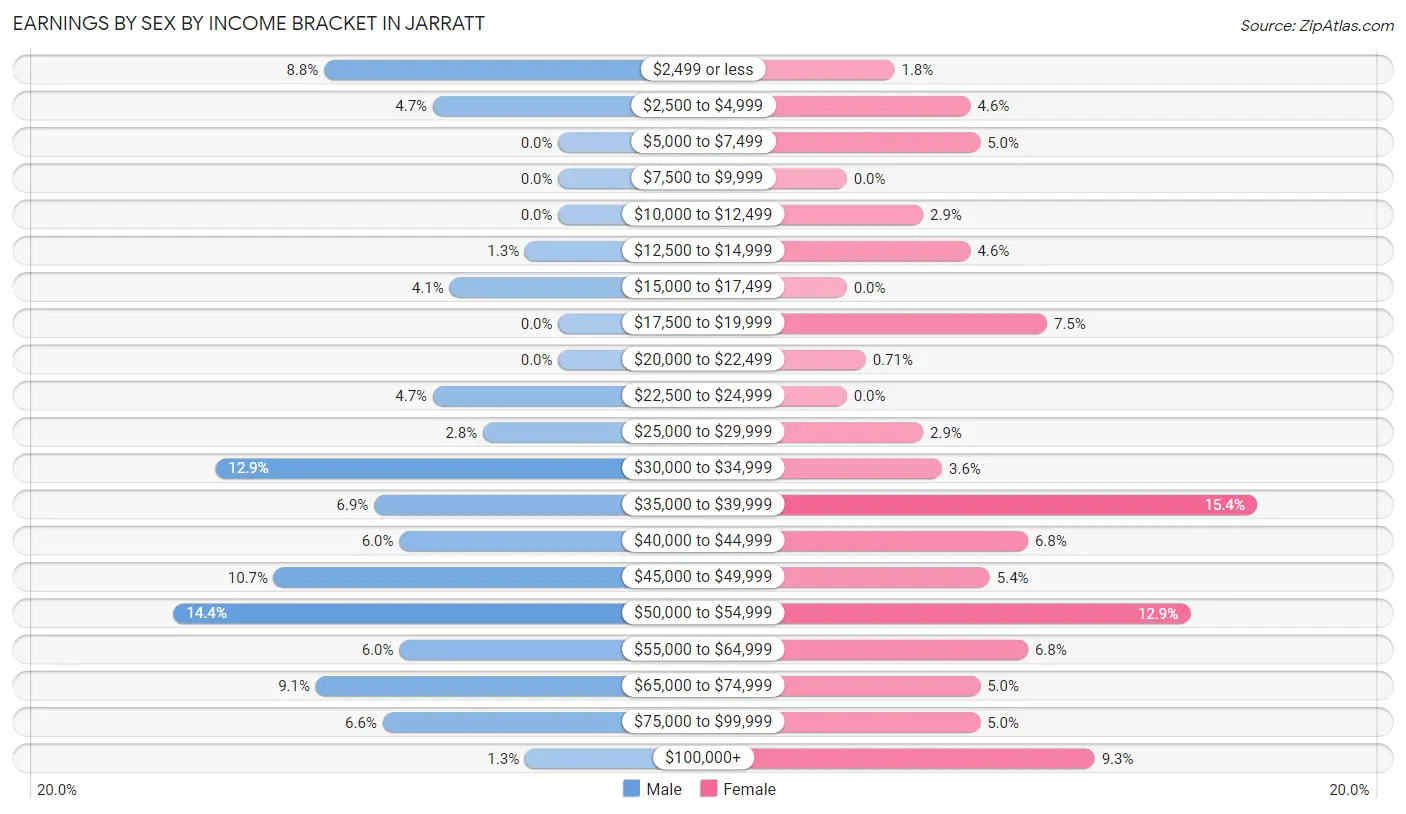
Earnings by Sex by Income Bracket in Jarratt
The most common earnings brackets in Jarratt are $50,000 to $54,999 for men (46 | 14.4%) and $35,000 to $39,999 for women (43 | 15.4%).
| Income | Male | Female |
| $2,499 or less | 28 (8.8%) | 5 (1.8%) |
| $2,500 to $4,999 | 15 (4.7%) | 13 (4.6%) |
| $5,000 to $7,499 | 0 (0.0%) | 14 (5.0%) |
| $7,500 to $9,999 | 0 (0.0%) | 0 (0.0%) |
| $10,000 to $12,499 | 0 (0.0%) | 8 (2.9%) |
| $12,500 to $14,999 | 4 (1.3%) | 13 (4.6%) |
| $15,000 to $17,499 | 13 (4.1%) | 0 (0.0%) |
| $17,500 to $19,999 | 0 (0.0%) | 21 (7.5%) |
| $20,000 to $22,499 | 0 (0.0%) | 2 (0.7%) |
| $22,500 to $24,999 | 15 (4.7%) | 0 (0.0%) |
| $25,000 to $29,999 | 9 (2.8%) | 8 (2.9%) |
| $30,000 to $34,999 | 41 (12.9%) | 10 (3.6%) |
| $35,000 to $39,999 | 22 (6.9%) | 43 (15.4%) |
| $40,000 to $44,999 | 19 (6.0%) | 19 (6.8%) |
| $45,000 to $49,999 | 34 (10.7%) | 15 (5.4%) |
| $50,000 to $54,999 | 46 (14.4%) | 36 (12.9%) |
| $55,000 to $64,999 | 19 (6.0%) | 19 (6.8%) |
| $65,000 to $74,999 | 29 (9.1%) | 14 (5.0%) |
| $75,000 to $99,999 | 21 (6.6%) | 14 (5.0%) |
| $100,000+ | 4 (1.3%) | 26 (9.3%) |
| Total | 319 (100.0%) | 280 (100.0%) |
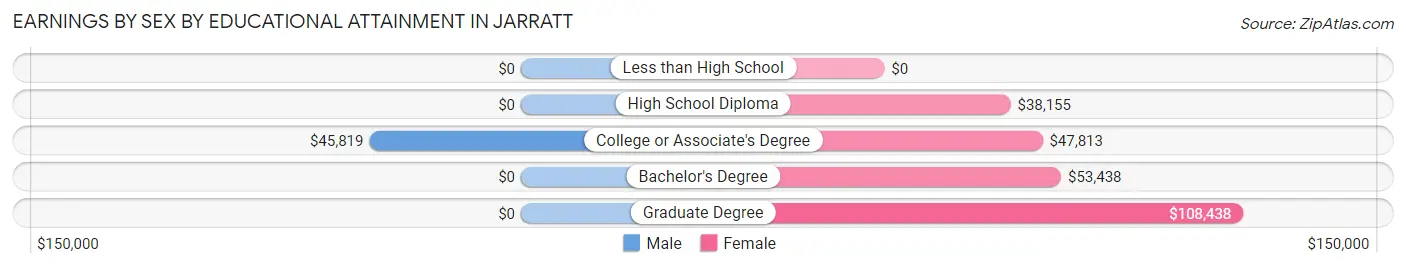
Earnings by Sex by Educational Attainment in Jarratt
Average earnings in Jarratt are $45,699 for men and $42,353 for women, a difference of 7.3%. Men with an educational attainment of college or associate's degree enjoy the highest average annual earnings of $45,819, while those with college or associate's degree education earn the least with $45,819. Women with an educational attainment of graduate degree earn the most with the average annual earnings of $108,438, while those with high school diploma education have the smallest earnings of $38,155.
| Educational Attainment | Male Income | Female Income |
| Less than High School | - | - |
| High School Diploma | - | - |
| College or Associate's Degree | $45,819 | $47,813 |
| Bachelor's Degree | - | - |
| Graduate Degree | - | - |
| Total | $45,699 | $42,353 |
Family Income in Jarratt
Family Income Brackets in Jarratt
According to the Jarratt family income data, there are 69 families falling into the $100,000 to $149,999 income range, which is the most common income bracket and makes up 22.7% of all families. Conversely, the $15,000 to $24,999 income bracket is the least frequent group with only 4 families (1.3%) belonging to this category.
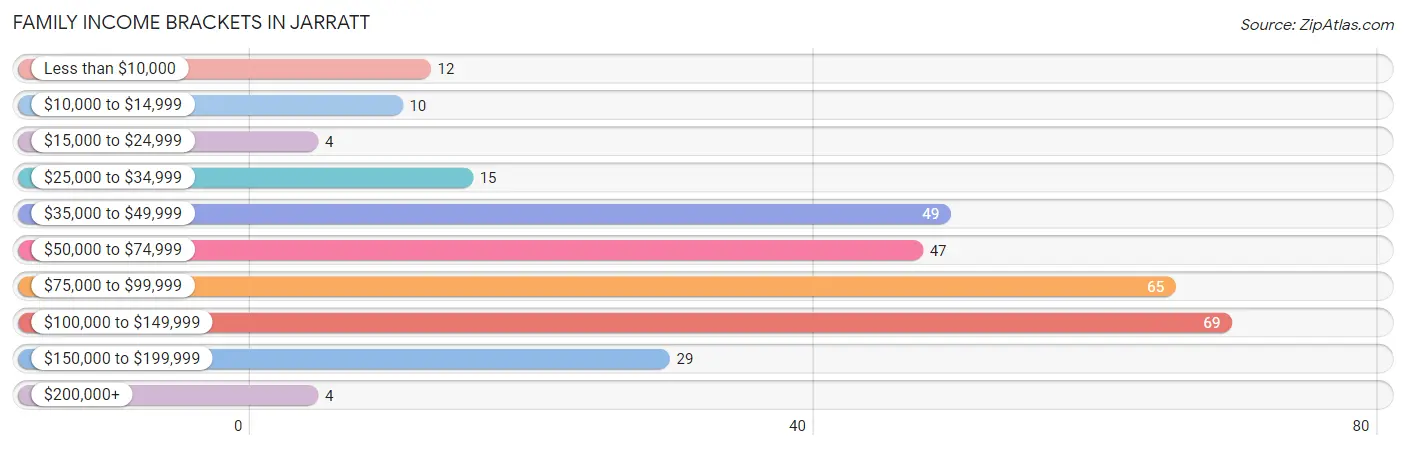
| Income Bracket | # Families | % Families |
| Less than $10,000 | 12 | 3.9% |
| $10,000 to $14,999 | 10 | 3.3% |
| $15,000 to $24,999 | 4 | 1.3% |
| $25,000 to $34,999 | 15 | 4.9% |
| $35,000 to $49,999 | 49 | 16.1% |
| $50,000 to $74,999 | 47 | 15.5% |
| $75,000 to $99,999 | 65 | 21.4% |
| $100,000 to $149,999 | 69 | 22.7% |
| $150,000 to $199,999 | 29 | 9.5% |
| $200,000+ | 4 | 1.3% |
Family Income by Famaliy Size in Jarratt
4-person families (59 | 19.4%) account for the highest median family income in Jarratt with $121,750 per family, while 2-person families (175 | 57.6%) have the highest median income of $42,519 per family member.
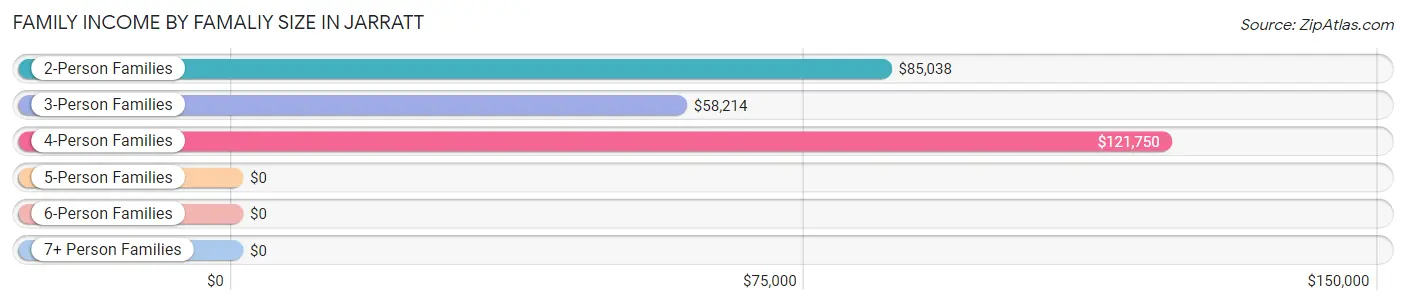
| Income Bracket | # Families | Median Income |
| 2-Person Families | 175 (57.6%) | $85,038 |
| 3-Person Families | 46 (15.1%) | $58,214 |
| 4-Person Families | 59 (19.4%) | $121,750 |
| 5-Person Families | 12 (4.0%) | $0 |
| 6-Person Families | 12 (4.0%) | $0 |
| 7+ Person Families | 0 (0.0%) | $0 |
| Total | 304 (100.0%) | $81,250 |
Family Income by Number of Earners in Jarratt
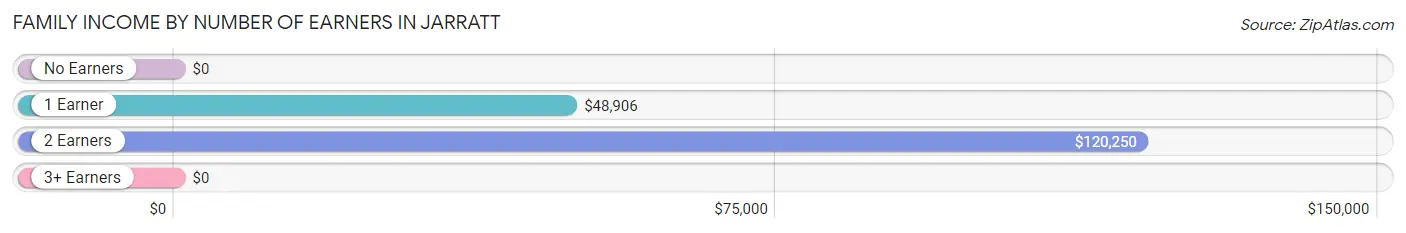
| Number of Earners | # Families | Median Income |
| No Earners | 17 (5.6%) | $0 |
| 1 Earner | 111 (36.5%) | $48,906 |
| 2 Earners | 141 (46.4%) | $120,250 |
| 3+ Earners | 35 (11.5%) | $0 |
| Total | 304 (100.0%) | $81,250 |
Household Income in Jarratt
Household Income Brackets in Jarratt
With 80 households falling in the category, the $50,000 to $74,999 income range is the most frequent in Jarratt, accounting for 20.4% of all households. In contrast, only 4 households (1.0%) fall into the $200,000+ income bracket, making it the least populous group.
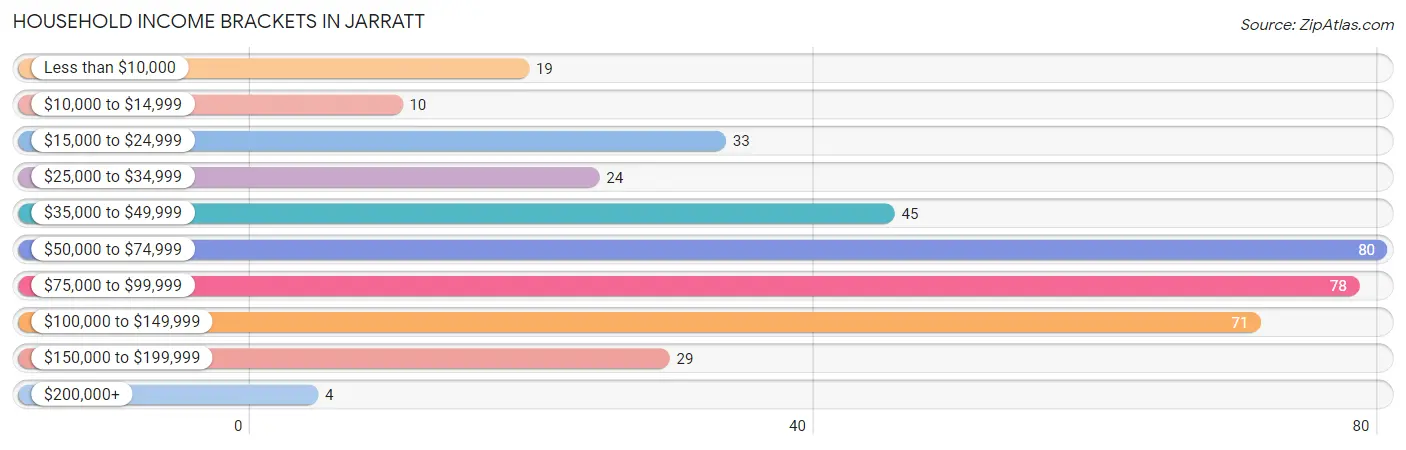
| Income Bracket | # Households | % Households |
| Less than $10,000 | 19 | 4.8% |
| $10,000 to $14,999 | 10 | 2.5% |
| $15,000 to $24,999 | 33 | 8.4% |
| $25,000 to $34,999 | 24 | 6.1% |
| $35,000 to $49,999 | 45 | 11.5% |
| $50,000 to $74,999 | 80 | 20.4% |
| $75,000 to $99,999 | 78 | 19.8% |
| $100,000 to $149,999 | 71 | 18.1% |
| $150,000 to $199,999 | 29 | 7.4% |
| $200,000+ | 4 | 1.0% |
Household Income by Householder Age in Jarratt
The median household income in Jarratt is $66,458, with the highest median household income of $81,042 found in the 45 to 64 years age bracket for the primary householder. A total of 129 households (32.8%) fall into this category. Meanwhile, the 15 to 24 years age bracket for the primary householder has the lowest median household income of $0, with 7 households (1.8%) in this group.
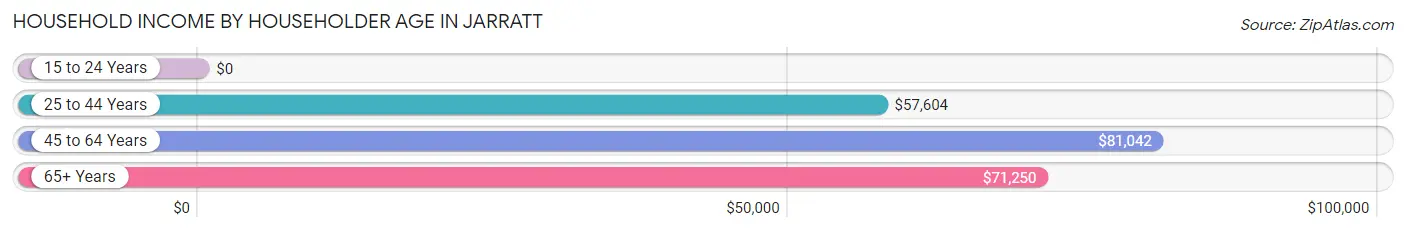
| Income Bracket | # Households | Median Income |
| 15 to 24 Years | 7 (1.8%) | $0 |
| 25 to 44 Years | 163 (41.5%) | $57,604 |
| 45 to 64 Years | 129 (32.8%) | $81,042 |
| 65+ Years | 94 (23.9%) | $71,250 |
| Total | 393 (100.0%) | $66,458 |
Poverty in Jarratt
Income Below Poverty by Sex and Age in Jarratt
With 8.0% poverty level for males and 12.7% for females among the residents of Jarratt, 5 year old males and under 5 year old females are the most vulnerable to poverty, with 1 males (100.0%) and 25 females (69.4%) in their respective age groups living below the poverty level.
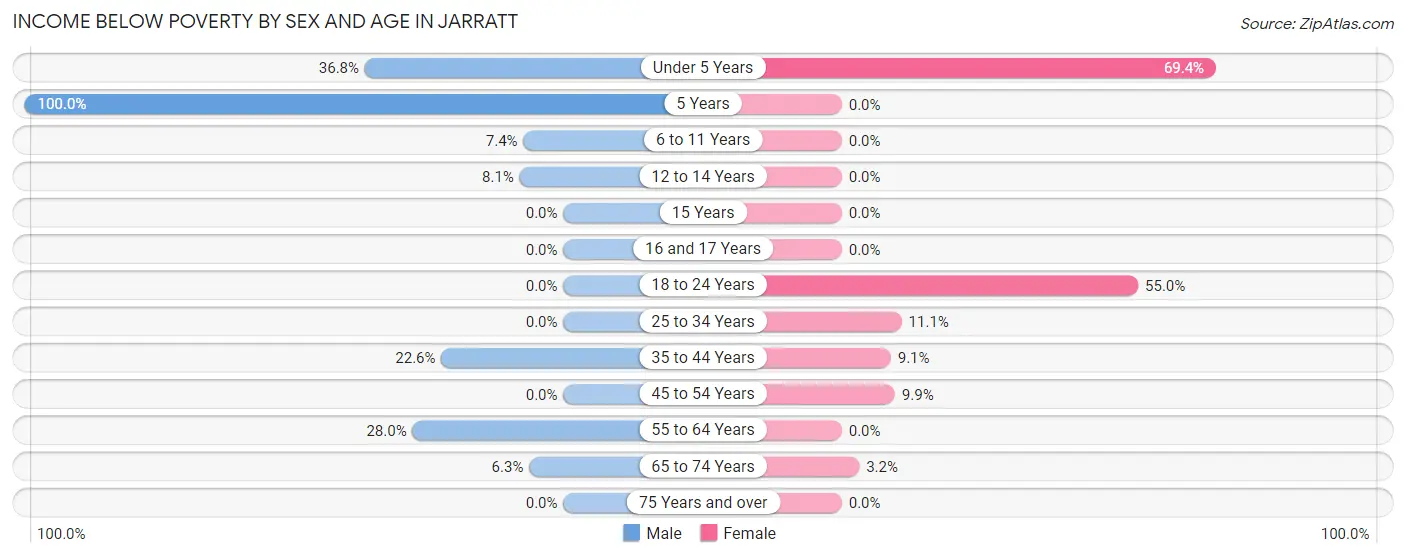
| Age Bracket | Male | Female |
| Under 5 Years | 7 (36.8%) | 25 (69.4%) |
| 5 Years | 1 (100.0%) | 0 (0.0%) |
| 6 to 11 Years | 2 (7.4%) | 0 (0.0%) |
| 12 to 14 Years | 3 (8.1%) | 0 (0.0%) |
| 15 Years | 0 (0.0%) | 0 (0.0%) |
| 16 and 17 Years | 0 (0.0%) | 0 (0.0%) |
| 18 to 24 Years | 0 (0.0%) | 11 (55.0%) |
| 25 to 34 Years | 0 (0.0%) | 6 (11.1%) |
| 35 to 44 Years | 12 (22.6%) | 9 (9.1%) |
| 45 to 54 Years | 0 (0.0%) | 7 (9.9%) |
| 55 to 64 Years | 7 (28.0%) | 0 (0.0%) |
| 65 to 74 Years | 5 (6.3%) | 2 (3.2%) |
| 75 Years and over | 0 (0.0%) | 0 (0.0%) |
| Total | 37 (8.0%) | 60 (12.7%) |
Income Above Poverty by Sex and Age in Jarratt
According to the poverty statistics in Jarratt, males aged 15 years and females aged 6 to 11 years are the age groups that are most secure financially, with 100.0% of males and 100.0% of females in these age groups living above the poverty line.
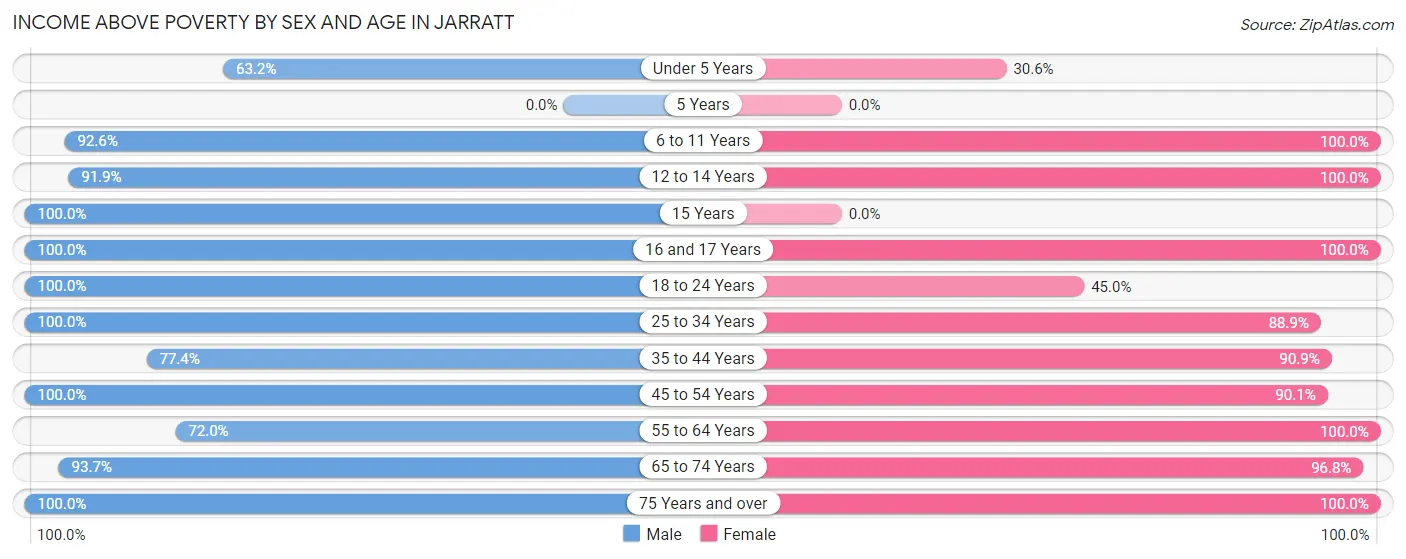
| Age Bracket | Male | Female |
| Under 5 Years | 12 (63.2%) | 11 (30.6%) |
| 5 Years | 0 (0.0%) | 0 (0.0%) |
| 6 to 11 Years | 25 (92.6%) | 44 (100.0%) |
| 12 to 14 Years | 34 (91.9%) | 34 (100.0%) |
| 15 Years | 11 (100.0%) | 0 (0.0%) |
| 16 and 17 Years | 2 (100.0%) | 6 (100.0%) |
| 18 to 24 Years | 36 (100.0%) | 9 (45.0%) |
| 25 to 34 Years | 111 (100.0%) | 48 (88.9%) |
| 35 to 44 Years | 41 (77.4%) | 90 (90.9%) |
| 45 to 54 Years | 47 (100.0%) | 64 (90.1%) |
| 55 to 64 Years | 18 (72.0%) | 36 (100.0%) |
| 65 to 74 Years | 74 (93.7%) | 60 (96.8%) |
| 75 Years and over | 13 (100.0%) | 12 (100.0%) |
| Total | 424 (92.0%) | 414 (87.3%) |
Income Below Poverty Among Married-Couple Families in Jarratt
The poverty statistics for married-couple families in Jarratt show that 4.0% or 8 of the total 199 families live below the poverty line. Families with 1 or 2 children have the highest poverty rate of 7.1%, comprising of 5 families. On the other hand, families with 3 or 4 children have the lowest poverty rate of 0.0%, which includes 0 families.
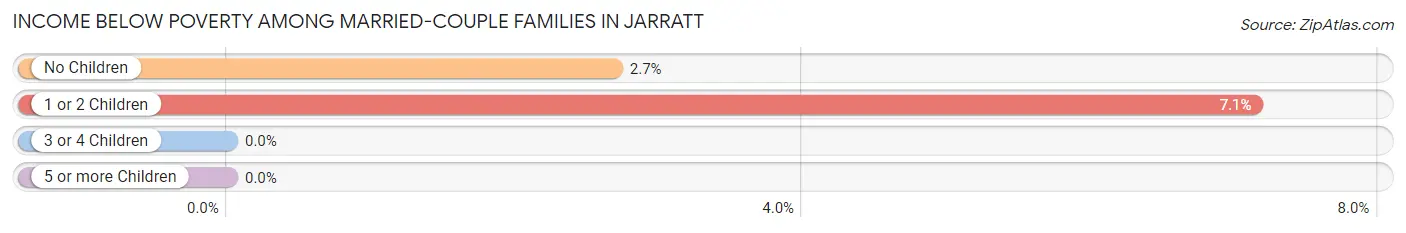
| Children | Above Poverty | Below Poverty |
| No Children | 109 (97.3%) | 3 (2.7%) |
| 1 or 2 Children | 65 (92.9%) | 5 (7.1%) |
| 3 or 4 Children | 17 (100.0%) | 0 (0.0%) |
| 5 or more Children | 0 (0.0%) | 0 (0.0%) |
| Total | 191 (96.0%) | 8 (4.0%) |
Income Below Poverty Among Single-Parent Households in Jarratt
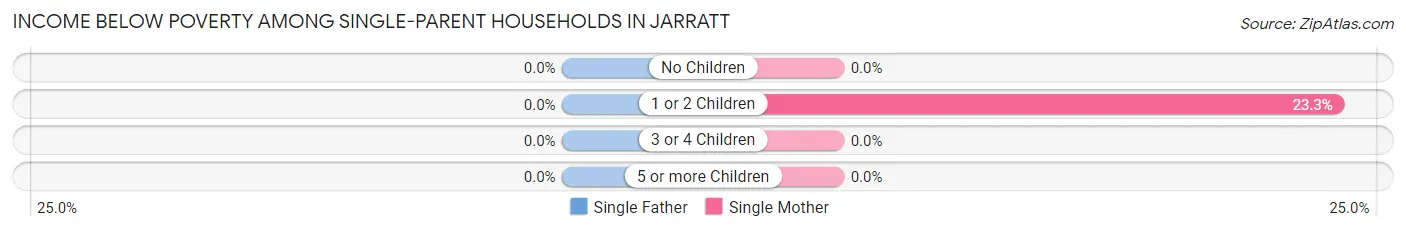
| Children | Single Father | Single Mother |
| No Children | 0 (0.0%) | 0 (0.0%) |
| 1 or 2 Children | 0 (0.0%) | 14 (23.3%) |
| 3 or 4 Children | 0 (0.0%) | 0 (0.0%) |
| 5 or more Children | 0 (0.0%) | 0 (0.0%) |
| Total | 0 (0.0%) | 14 (15.7%) |
Income Below Poverty Among Married-Couple vs Single-Parent Households in Jarratt
The poverty data for Jarratt shows that 8 of the married-couple family households (4.0%) and 14 of the single-parent households (13.3%) are living below the poverty level. Within the married-couple family households, those with 1 or 2 children have the highest poverty rate, with 5 households (7.1%) falling below the poverty line. Among the single-parent households, those with 1 or 2 children have the highest poverty rate, with 14 household (20.0%) living below poverty.
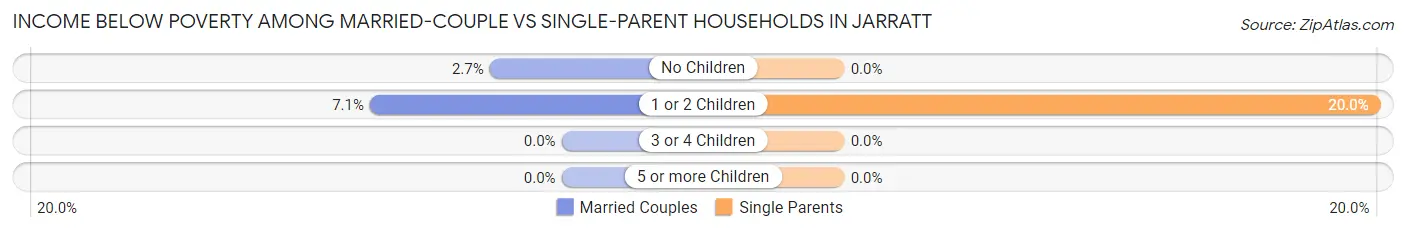
| Children | Married-Couple Families | Single-Parent Households |
| No Children | 3 (2.7%) | 0 (0.0%) |
| 1 or 2 Children | 5 (7.1%) | 14 (20.0%) |
| 3 or 4 Children | 0 (0.0%) | 0 (0.0%) |
| 5 or more Children | 0 (0.0%) | 0 (0.0%) |
| Total | 8 (4.0%) | 14 (13.3%) |
Race in Jarratt
The most populous races in Jarratt are White / Caucasian (477 | 51.0%), Black / African American (438 | 46.8%), and Hispanic or Latino (24 | 2.6%).
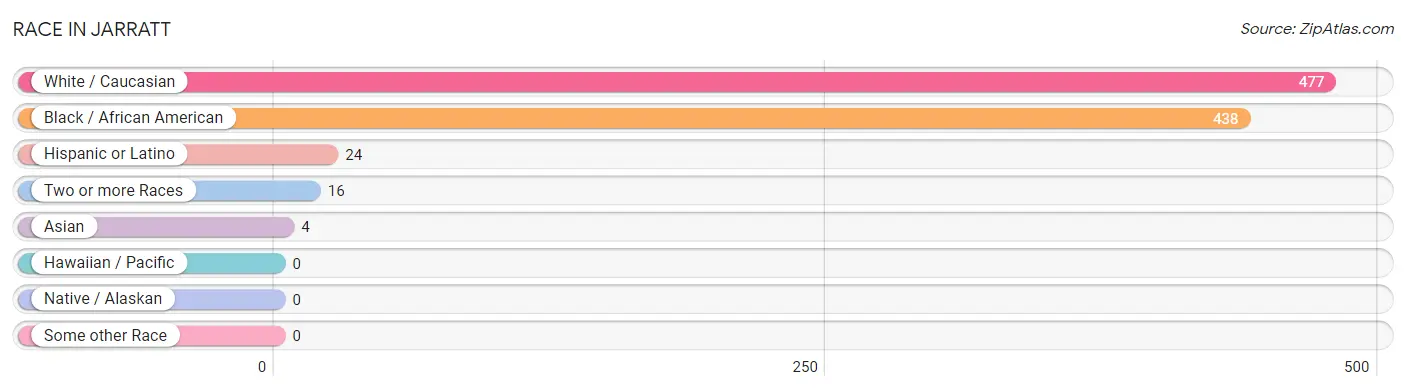
| Race | # Population | % Population |
| Asian | 4 | 0.4% |
| Black / African American | 438 | 46.8% |
| Hawaiian / Pacific | 0 | 0.0% |
| Hispanic or Latino | 24 | 2.6% |
| Native / Alaskan | 0 | 0.0% |
| White / Caucasian | 477 | 51.0% |
| Two or more Races | 16 | 1.7% |
| Some other Race | 0 | 0.0% |
| Total | 935 | 100.0% |
Ancestry in Jarratt
The most populous ancestries reported in Jarratt are African (184 | 19.7%), Subsaharan African (184 | 19.7%), Irish (68 | 7.3%), English (64 | 6.8%), and American (62 | 6.6%), together accounting for 60.1% of all Jarratt residents.
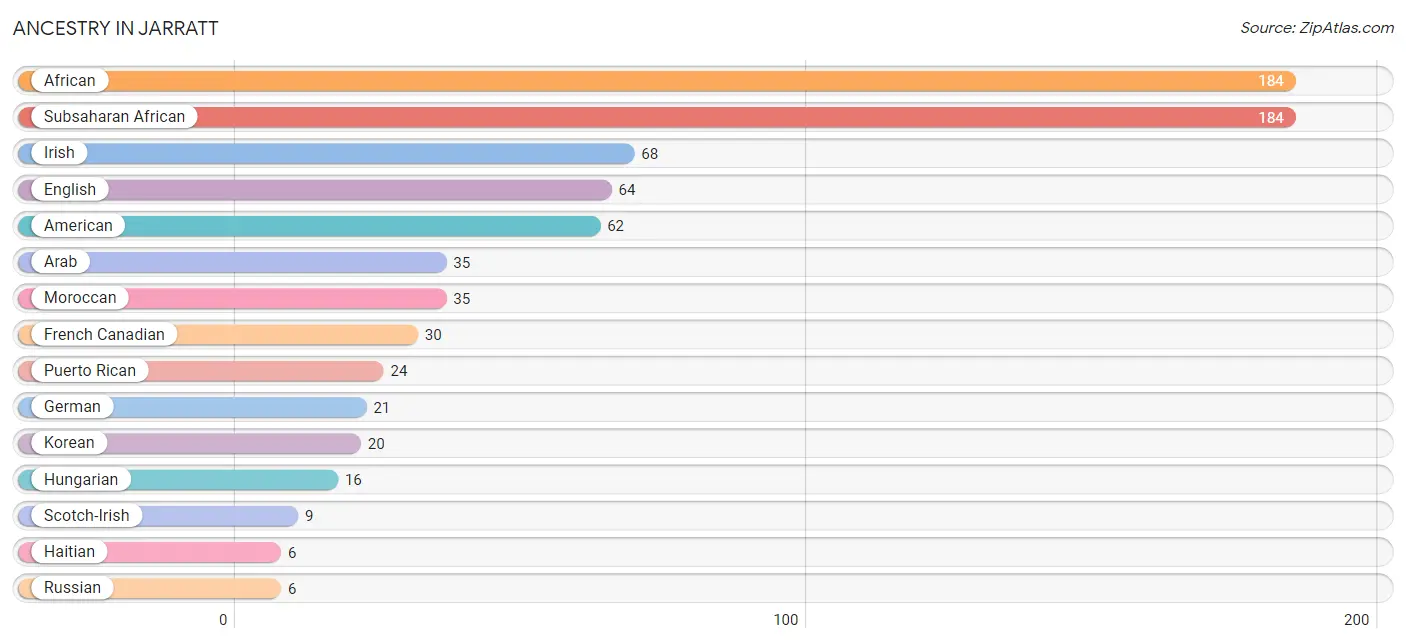
| Ancestry | # Population | % Population |
| African | 184 | 19.7% |
| American | 62 | 6.6% |
| Arab | 35 | 3.7% |
| English | 64 | 6.8% |
| European | 4 | 0.4% |
| French Canadian | 30 | 3.2% |
| German | 21 | 2.2% |
| Haitian | 6 | 0.6% |
| Hungarian | 16 | 1.7% |
| Irish | 68 | 7.3% |
| Italian | 3 | 0.3% |
| Jamaican | 4 | 0.4% |
| Korean | 20 | 2.1% |
| Moroccan | 35 | 3.7% |
| Polish | 5 | 0.5% |
| Puerto Rican | 24 | 2.6% |
| Russian | 6 | 0.6% |
| Scotch-Irish | 9 | 1.0% |
| Scottish | 6 | 0.6% |
| Subsaharan African | 184 | 19.7% | View All 20 Rows |
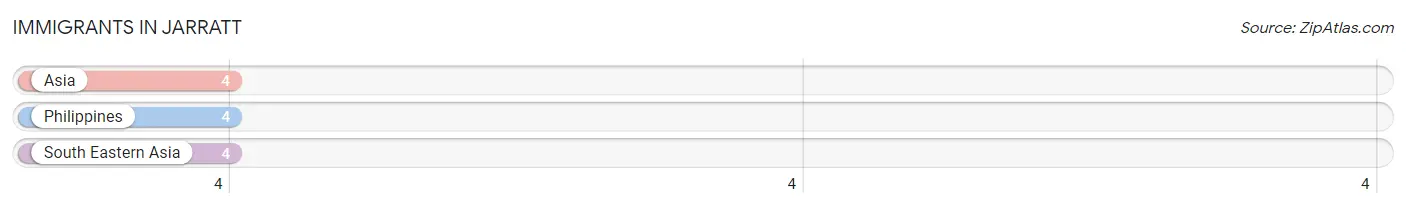
Immigrants in Jarratt
The most numerous immigrant groups reported in Jarratt came from Asia (4 | 0.4%), Philippines (4 | 0.4%), and South Eastern Asia (4 | 0.4%), together accounting for 1.3% of all Jarratt residents.
| Immigration Origin | # Population | % Population |
| Asia | 4 | 0.4% |
| Philippines | 4 | 0.4% |
| South Eastern Asia | 4 | 0.4% | View All 3 Rows |
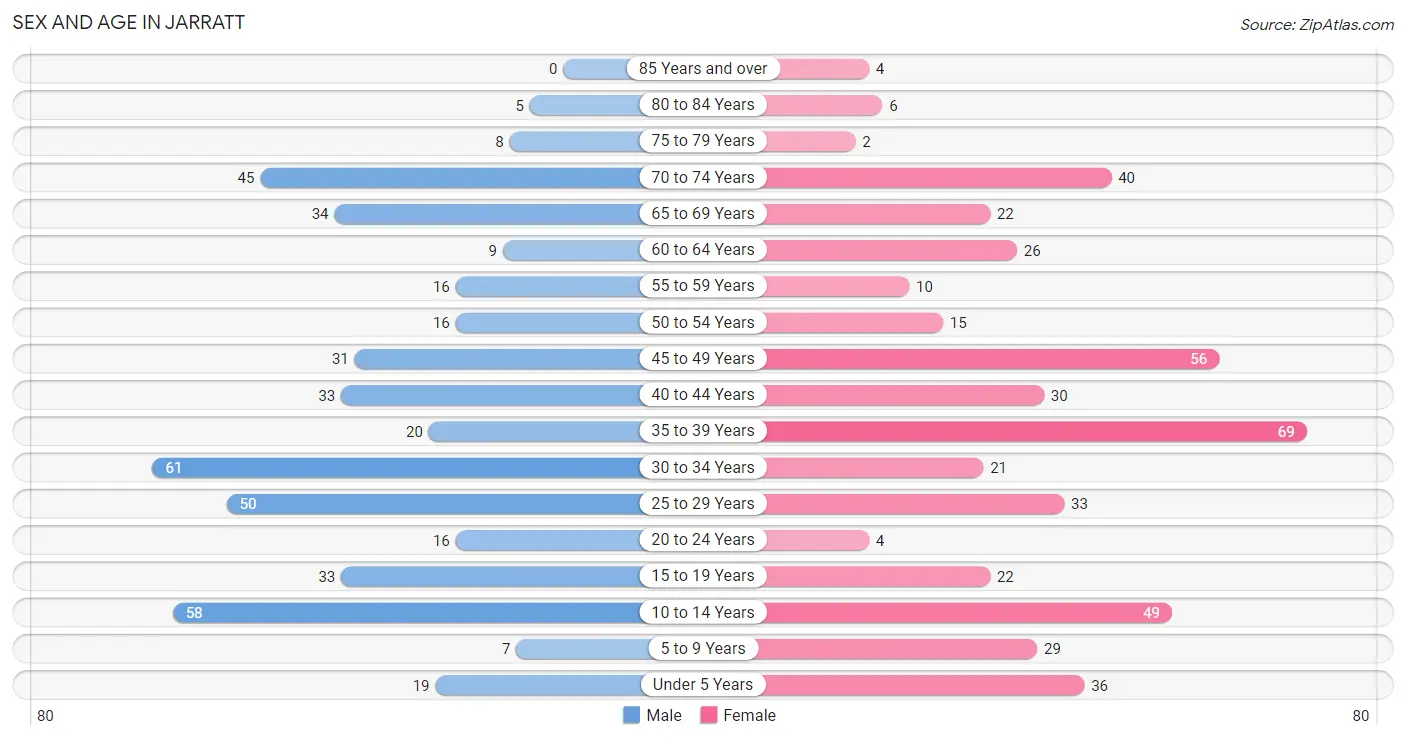
Sex and Age in Jarratt
Sex and Age in Jarratt
The most populous age groups in Jarratt are 30 to 34 Years (61 | 13.2%) for men and 35 to 39 Years (69 | 14.6%) for women.
| Age Bracket | Male | Female |
| Under 5 Years | 19 (4.1%) | 36 (7.6%) |
| 5 to 9 Years | 7 (1.5%) | 29 (6.1%) |
| 10 to 14 Years | 58 (12.6%) | 49 (10.3%) |
| 15 to 19 Years | 33 (7.2%) | 22 (4.6%) |
| 20 to 24 Years | 16 (3.5%) | 4 (0.8%) |
| 25 to 29 Years | 50 (10.8%) | 33 (7.0%) |
| 30 to 34 Years | 61 (13.2%) | 21 (4.4%) |
| 35 to 39 Years | 20 (4.3%) | 69 (14.6%) |
| 40 to 44 Years | 33 (7.2%) | 30 (6.3%) |
| 45 to 49 Years | 31 (6.7%) | 56 (11.8%) |
| 50 to 54 Years | 16 (3.5%) | 15 (3.2%) |
| 55 to 59 Years | 16 (3.5%) | 10 (2.1%) |
| 60 to 64 Years | 9 (1.9%) | 26 (5.5%) |
| 65 to 69 Years | 34 (7.4%) | 22 (4.6%) |
| 70 to 74 Years | 45 (9.8%) | 40 (8.4%) |
| 75 to 79 Years | 8 (1.7%) | 2 (0.4%) |
| 80 to 84 Years | 5 (1.1%) | 6 (1.3%) |
| 85 Years and over | 0 (0.0%) | 4 (0.8%) |
| Total | 461 (100.0%) | 474 (100.0%) |
Families and Households in Jarratt
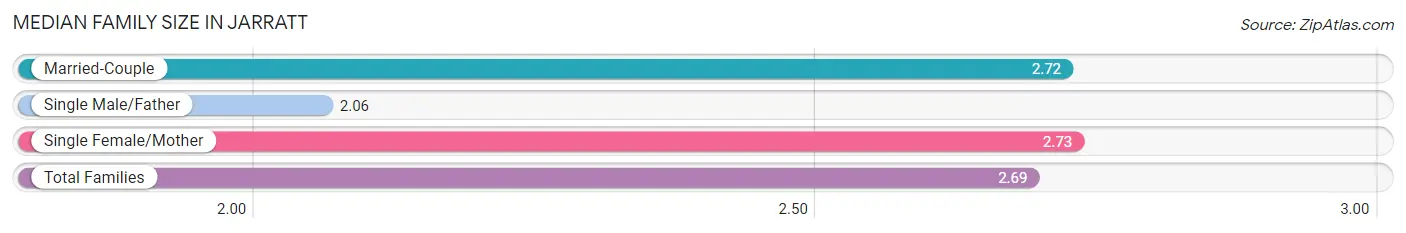
Median Family Size in Jarratt
The median family size in Jarratt is 2.69 persons per family, with single female/mother families (89 | 29.3%) accounting for the largest median family size of 2.73 persons per family. On the other hand, single male/father families (16 | 5.3%) represent the smallest median family size with 2.06 persons per family.
| Family Type | # Families | Family Size |
| Married-Couple | 199 (65.5%) | 2.72 |
| Single Male/Father | 16 (5.3%) | 2.06 |
| Single Female/Mother | 89 (29.3%) | 2.73 |
| Total Families | 304 (100.0%) | 2.69 |
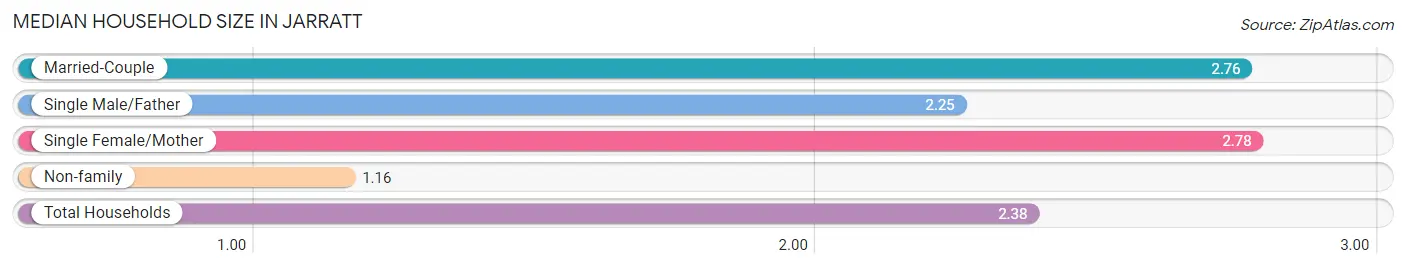
Median Household Size in Jarratt
The median household size in Jarratt is 2.38 persons per household, with single female/mother households (89 | 22.7%) accounting for the largest median household size of 2.78 persons per household. non-family households (89 | 22.7%) represent the smallest median household size with 1.16 persons per household.
| Household Type | # Households | Household Size |
| Married-Couple | 199 (50.6%) | 2.76 |
| Single Male/Father | 16 (4.1%) | 2.25 |
| Single Female/Mother | 89 (22.7%) | 2.78 |
| Non-family | 89 (22.7%) | 1.16 |
| Total Households | 393 (100.0%) | 2.38 |
Household Size by Marriage Status in Jarratt
Out of a total of 393 households in Jarratt, 304 (77.3%) are family households, while 89 (22.7%) are nonfamily households. The most numerous type of family households are 2-person households, comprising 175, and the most common type of nonfamily households are 1-person households, comprising 75.
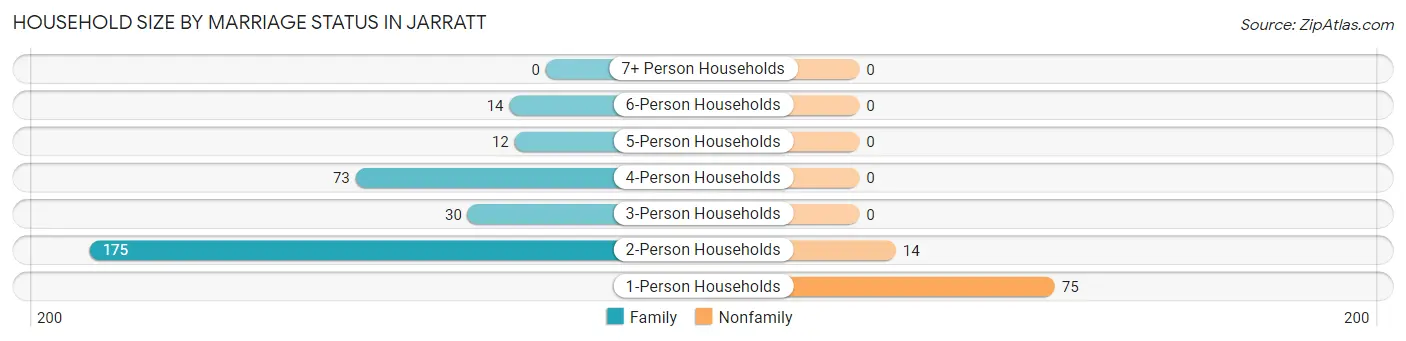
| Household Size | Family Households | Nonfamily Households |
| 1-Person Households | - | 75 (19.1%) |
| 2-Person Households | 175 (44.5%) | 14 (3.6%) |
| 3-Person Households | 30 (7.6%) | 0 (0.0%) |
| 4-Person Households | 73 (18.6%) | 0 (0.0%) |
| 5-Person Households | 12 (3.0%) | 0 (0.0%) |
| 6-Person Households | 14 (3.6%) | 0 (0.0%) |
| 7+ Person Households | 0 (0.0%) | 0 (0.0%) |
| Total | 304 (77.3%) | 89 (22.7%) |
Female Fertility in Jarratt
Fertility by Age in Jarratt
Average fertility rate in Jarratt is 29.0 births per 1,000 women. Women in the age bracket of 35 to 50 years have the highest fertility rate with 37.0 births per 1,000 women. Women in the age bracket of 35 to 50 years acount for 85.7% of all women with births.
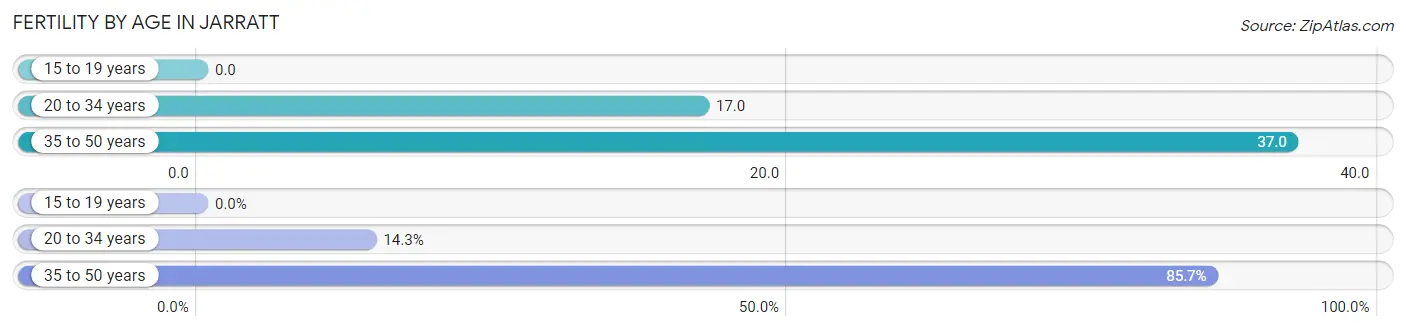
| Age Bracket | Women with Births | Births / 1,000 Women |
| 15 to 19 years | 0 (0.0%) | 0.0 |
| 20 to 34 years | 1 (14.3%) | 17.0 |
| 35 to 50 years | 6 (85.7%) | 37.0 |
| Total | 7 (100.0%) | 29.0 |
Fertility by Age by Marriage Status in Jarratt
14.3% of women with births (7) in Jarratt are married. The highest percentage of unmarried women with births falls into 35 to 50 years age bracket with 100.0% of them unmarried at the time of birth, while the lowest percentage of unmarried women with births belong to 20 to 34 years age bracket with 0.0% of them unmarried.
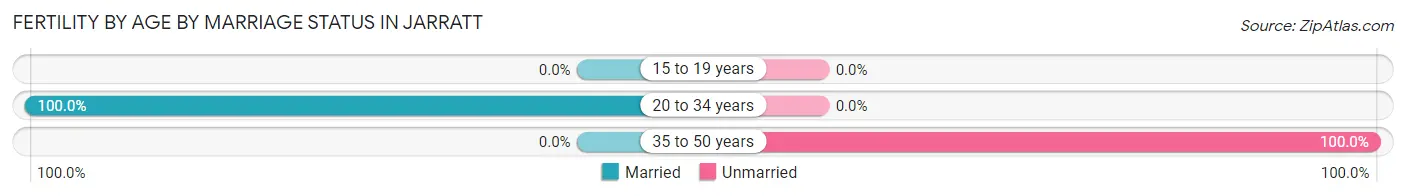
| Age Bracket | Married | Unmarried |
| 15 to 19 years | 0 (0.0%) | 0 (0.0%) |
| 20 to 34 years | 1 (100.0%) | 0 (0.0%) |
| 35 to 50 years | 0 (0.0%) | 6 (100.0%) |
| Total | 1 (14.3%) | 6 (85.7%) |
Fertility by Education in Jarratt
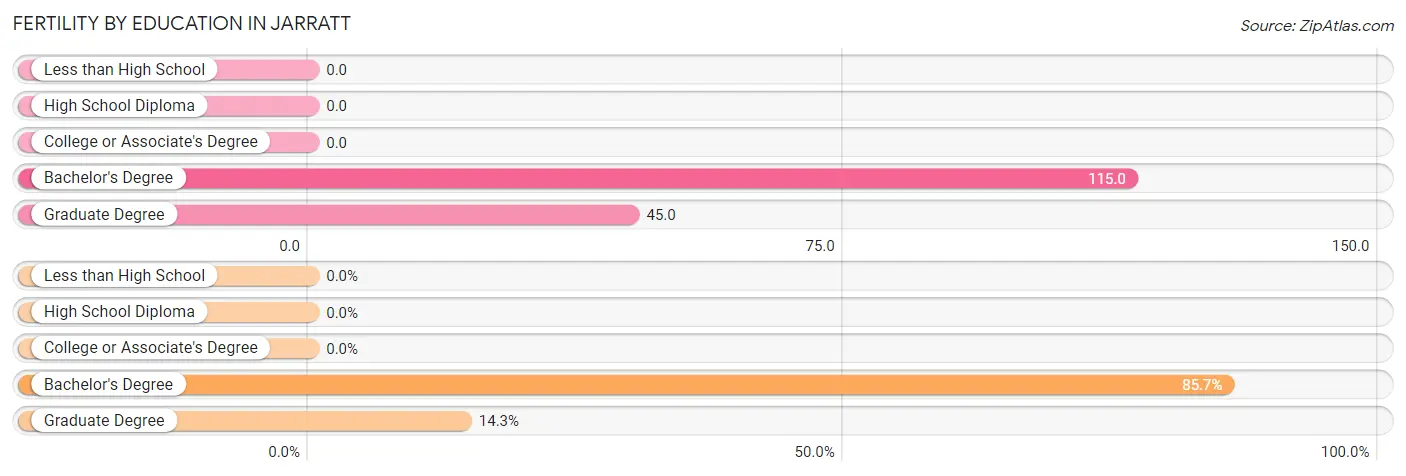
| Educational Attainment | Women with Births | Births / 1,000 Women |
| Less than High School | 0 (0.0%) | 0.0 |
| High School Diploma | 0 (0.0%) | 0.0 |
| College or Associate's Degree | 0 (0.0%) | 0.0 |
| Bachelor's Degree | 6 (85.7%) | 115.0 |
| Graduate Degree | 1 (14.3%) | 45.0 |
| Total | 7 (100.0%) | 29.0 |
Fertility by Education by Marriage Status in Jarratt
85.7% of women with births in Jarratt are unmarried. Women with the educational attainment of graduate degree are most likely to be married with 100.0% of them married at childbirth, while women with the educational attainment of bachelor's degree are least likely to be married with 100.0% of them unmarried at childbirth.
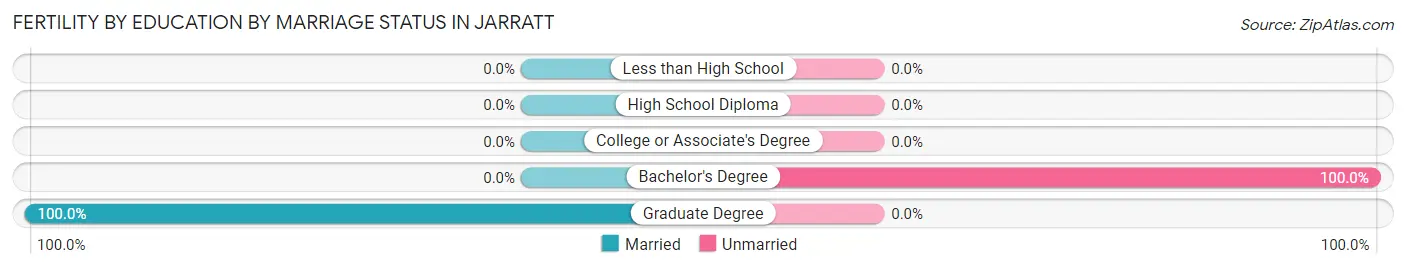
| Educational Attainment | Married | Unmarried |
| Less than High School | 0 (0.0%) | 0 (0.0%) |
| High School Diploma | 0 (0.0%) | 0 (0.0%) |
| College or Associate's Degree | 0 (0.0%) | 0 (0.0%) |
| Bachelor's Degree | 0 (0.0%) | 6 (100.0%) |
| Graduate Degree | 1 (100.0%) | 0 (0.0%) |
| Total | 1 (14.3%) | 6 (85.7%) |
Employment Characteristics in Jarratt
Employment by Class of Employer in Jarratt
Among the 551 employed individuals in Jarratt, private company employees (312 | 56.6%), local government employees (141 | 25.6%), and state government employees (53 | 9.6%) make up the most common classes of employment.
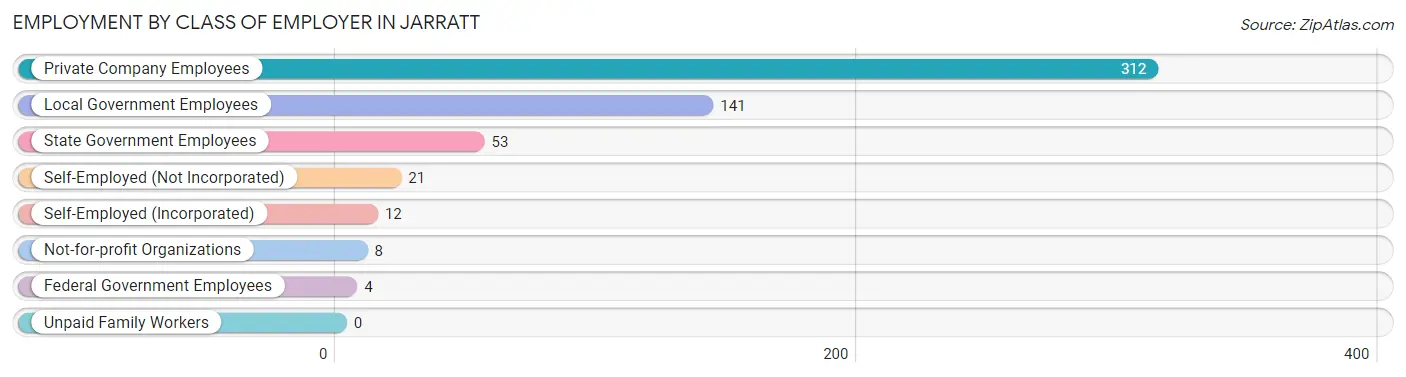
| Employer Class | # Employees | % Employees |
| Private Company Employees | 312 | 56.6% |
| Self-Employed (Incorporated) | 12 | 2.2% |
| Self-Employed (Not Incorporated) | 21 | 3.8% |
| Not-for-profit Organizations | 8 | 1.5% |
| Local Government Employees | 141 | 25.6% |
| State Government Employees | 53 | 9.6% |
| Federal Government Employees | 4 | 0.7% |
| Unpaid Family Workers | 0 | 0.0% |
| Total | 551 | 100.0% |
Employment Status by Age in Jarratt
According to the labor force statistics for Jarratt, out of the total population over 16 years of age (726), 79.1% or 574 individuals are in the labor force, with 3.7% or 21 of them unemployed. The age group with the highest labor force participation rate is 16 to 19 years, with 100.0% or 44 individuals in the labor force. Within the labor force, the 16 to 19 years age range has the highest percentage of unemployed individuals, with 25.0% or 11 of them being unemployed.
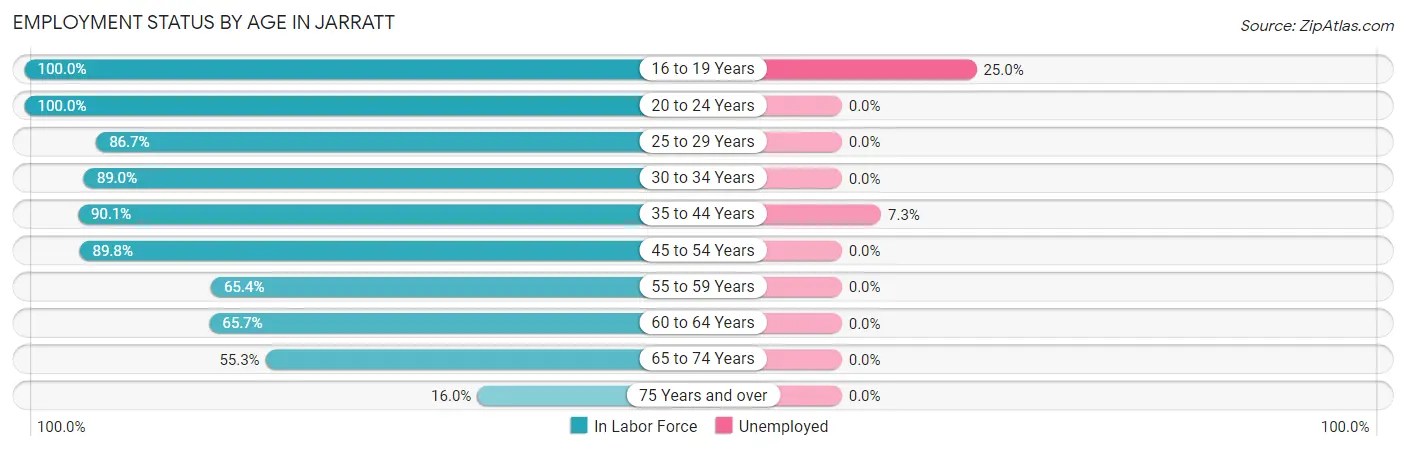
| Age Bracket | In Labor Force | Unemployed |
| 16 to 19 Years | 44 (100.0%) | 11 (25.0%) |
| 20 to 24 Years | 20 (100.0%) | 0 (0.0%) |
| 25 to 29 Years | 72 (86.7%) | 0 (0.0%) |
| 30 to 34 Years | 73 (89.0%) | 0 (0.0%) |
| 35 to 44 Years | 137 (90.1%) | 10 (7.3%) |
| 45 to 54 Years | 106 (89.8%) | 0 (0.0%) |
| 55 to 59 Years | 17 (65.4%) | 0 (0.0%) |
| 60 to 64 Years | 23 (65.7%) | 0 (0.0%) |
| 65 to 74 Years | 78 (55.3%) | 0 (0.0%) |
| 75 Years and over | 4 (16.0%) | 0 (0.0%) |
| Total | 574 (79.1%) | 21 (3.7%) |
Employment Status by Educational Attainment in Jarratt
According to labor force statistics for Jarratt, 86.3% of individuals (428) out of the total population between 25 and 64 years of age (496) are in the labor force, with 2.3% or 10 of them being unemployed. The group with the highest labor force participation rate are those with the educational attainment of bachelor's degree or higher, with 89.2% or 116 individuals in the labor force. Within the labor force, individuals with high school diploma education have the highest percentage of unemployment, with 6.3% or 4 of them being unemployed.
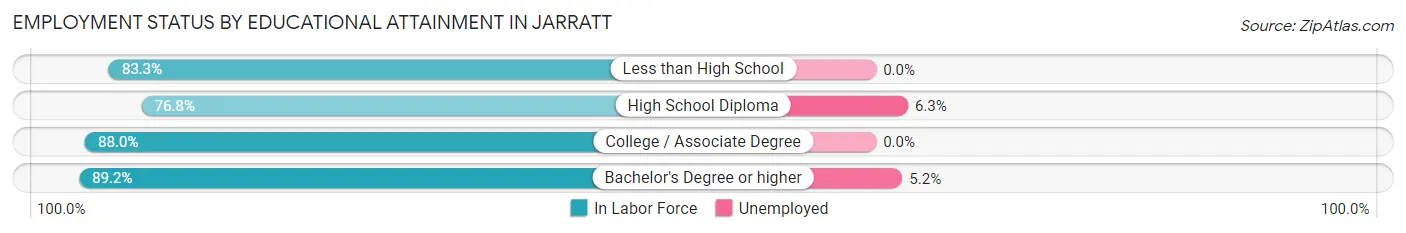
| Educational Attainment | In Labor Force | Unemployed |
| Less than High School | 15 (83.3%) | 0 (0.0%) |
| High School Diploma | 63 (76.8%) | 5 (6.3%) |
| College / Associate Degree | 234 (88.0%) | 0 (0.0%) |
| Bachelor's Degree or higher | 116 (89.2%) | 7 (5.2%) |
| Total | 428 (86.3%) | 11 (2.3%) |
Employment Occupations by Sex in Jarratt
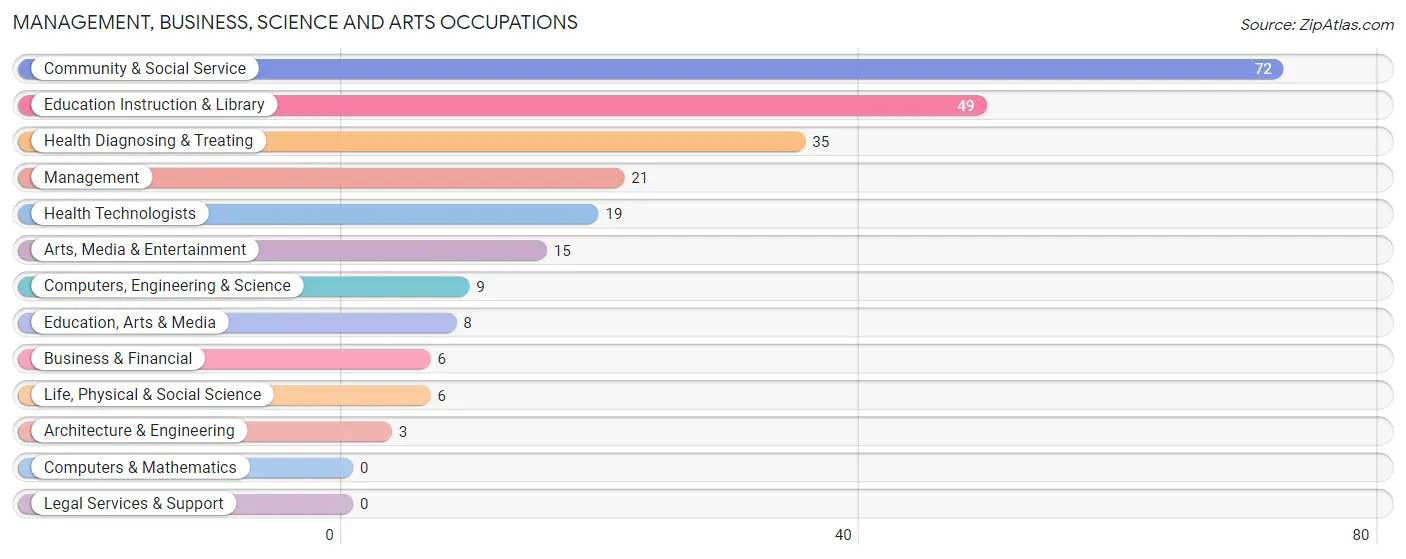
Management, Business, Science and Arts Occupations
The most common Management, Business, Science and Arts occupations in Jarratt are Community & Social Service (72 | 13.0%), Education Instruction & Library (49 | 8.9%), Health Diagnosing & Treating (35 | 6.3%), Management (21 | 3.8%), and Health Technologists (19 | 3.4%).
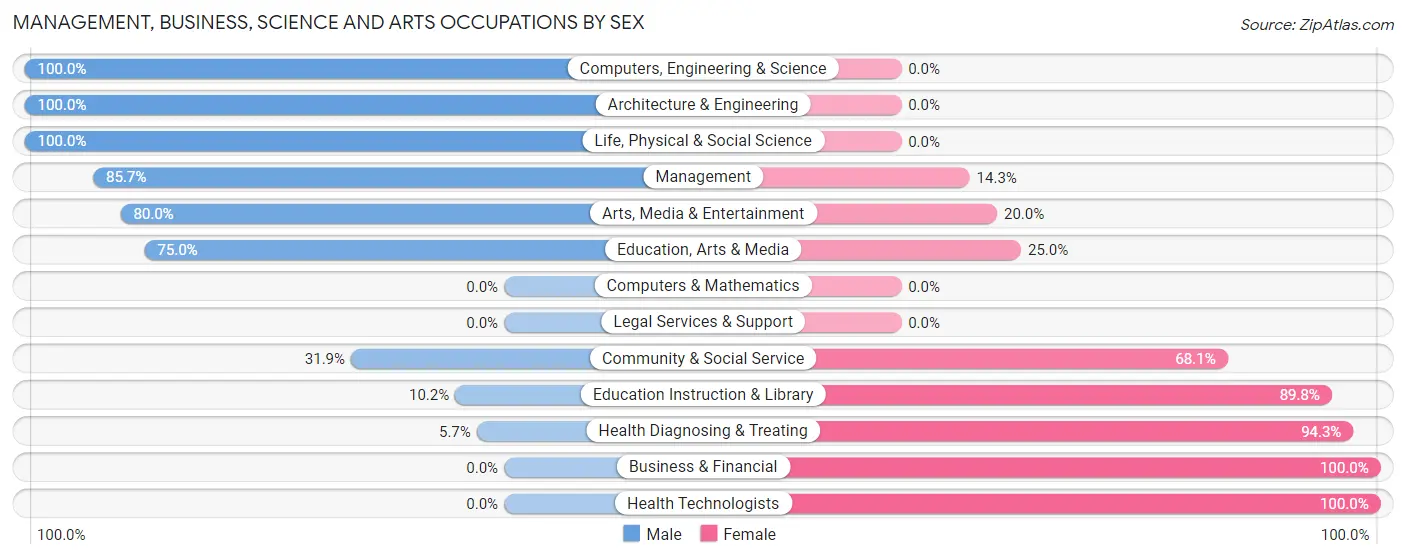
Management, Business, Science and Arts Occupations by Sex
Within the Management, Business, Science and Arts occupations in Jarratt, the most male-oriented occupations are Computers, Engineering & Science (100.0%), Architecture & Engineering (100.0%), and Life, Physical & Social Science (100.0%), while the most female-oriented occupations are Business & Financial (100.0%), Health Technologists (100.0%), and Health Diagnosing & Treating (94.3%).
| Occupation | Male | Female |
| Management | 18 (85.7%) | 3 (14.3%) |
| Business & Financial | 0 (0.0%) | 6 (100.0%) |
| Computers, Engineering & Science | 9 (100.0%) | 0 (0.0%) |
| Computers & Mathematics | 0 (0.0%) | 0 (0.0%) |
| Architecture & Engineering | 3 (100.0%) | 0 (0.0%) |
| Life, Physical & Social Science | 6 (100.0%) | 0 (0.0%) |
| Community & Social Service | 23 (31.9%) | 49 (68.1%) |
| Education, Arts & Media | 6 (75.0%) | 2 (25.0%) |
| Legal Services & Support | 0 (0.0%) | 0 (0.0%) |
| Education Instruction & Library | 5 (10.2%) | 44 (89.8%) |
| Arts, Media & Entertainment | 12 (80.0%) | 3 (20.0%) |
| Health Diagnosing & Treating | 2 (5.7%) | 33 (94.3%) |
| Health Technologists | 0 (0.0%) | 19 (100.0%) |
| Total (Category) | 52 (36.4%) | 91 (63.6%) |
| Total (Overall) | 291 (52.7%) | 261 (47.3%) |
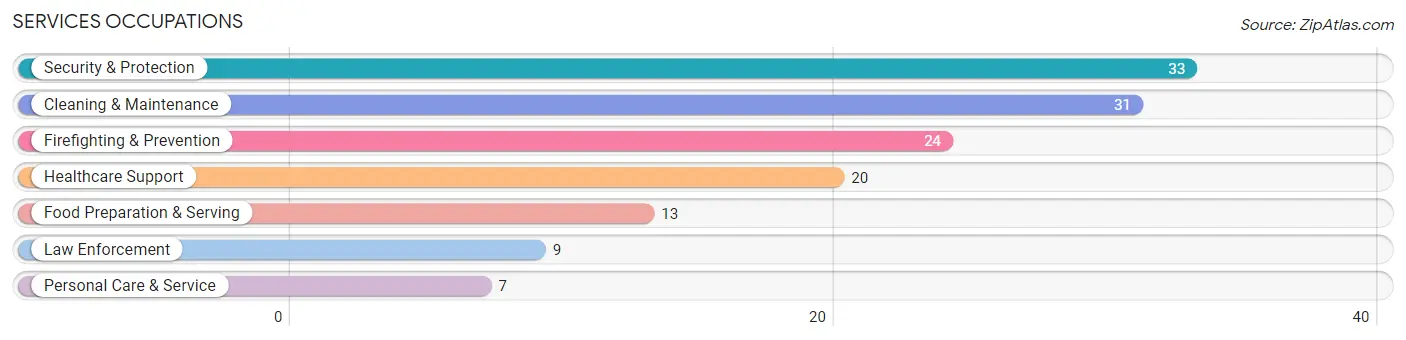
Services Occupations
The most common Services occupations in Jarratt are Security & Protection (33 | 6.0%), Cleaning & Maintenance (31 | 5.6%), Firefighting & Prevention (24 | 4.3%), Healthcare Support (20 | 3.6%), and Food Preparation & Serving (13 | 2.4%).
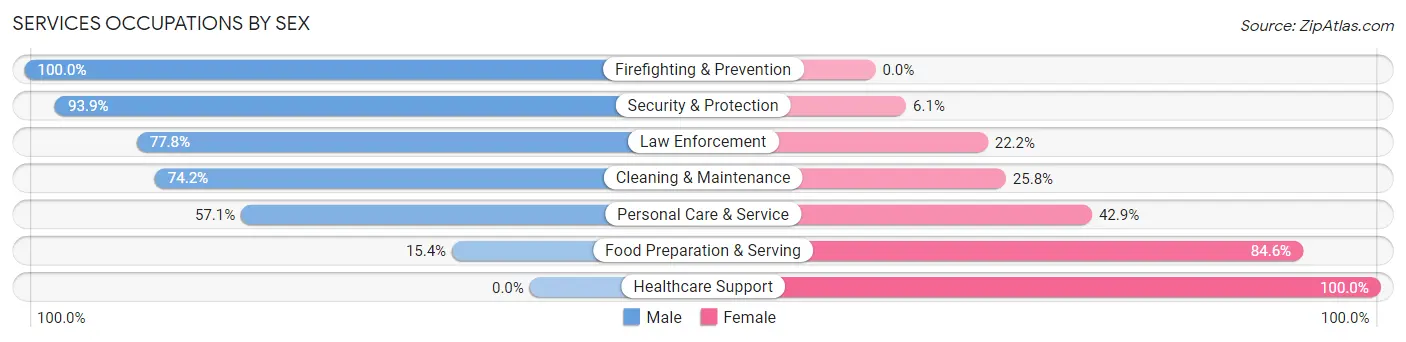
Services Occupations by Sex
Within the Services occupations in Jarratt, the most male-oriented occupations are Firefighting & Prevention (100.0%), Security & Protection (93.9%), and Law Enforcement (77.8%), while the most female-oriented occupations are Healthcare Support (100.0%), Food Preparation & Serving (84.6%), and Personal Care & Service (42.9%).
| Occupation | Male | Female |
| Healthcare Support | 0 (0.0%) | 20 (100.0%) |
| Security & Protection | 31 (93.9%) | 2 (6.1%) |
| Firefighting & Prevention | 24 (100.0%) | 0 (0.0%) |
| Law Enforcement | 7 (77.8%) | 2 (22.2%) |
| Food Preparation & Serving | 2 (15.4%) | 11 (84.6%) |
| Cleaning & Maintenance | 23 (74.2%) | 8 (25.8%) |
| Personal Care & Service | 4 (57.1%) | 3 (42.9%) |
| Total (Category) | 60 (57.7%) | 44 (42.3%) |
| Total (Overall) | 291 (52.7%) | 261 (47.3%) |
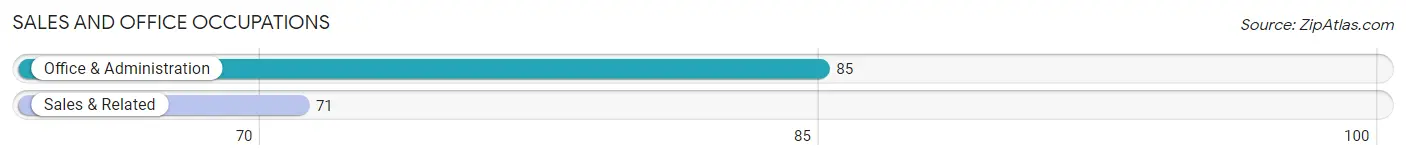
Sales and Office Occupations
The most common Sales and Office occupations in Jarratt are Office & Administration (85 | 15.4%), and Sales & Related (71 | 12.9%).
Sales and Office Occupations by Sex
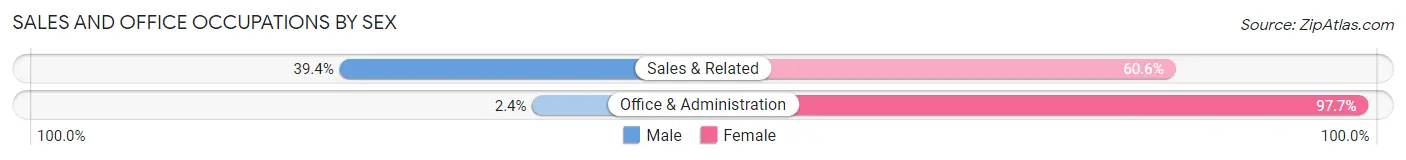
| Occupation | Male | Female |
| Sales & Related | 28 (39.4%) | 43 (60.6%) |
| Office & Administration | 2 (2.4%) | 83 (97.7%) |
| Total (Category) | 30 (19.2%) | 126 (80.8%) |
| Total (Overall) | 291 (52.7%) | 261 (47.3%) |
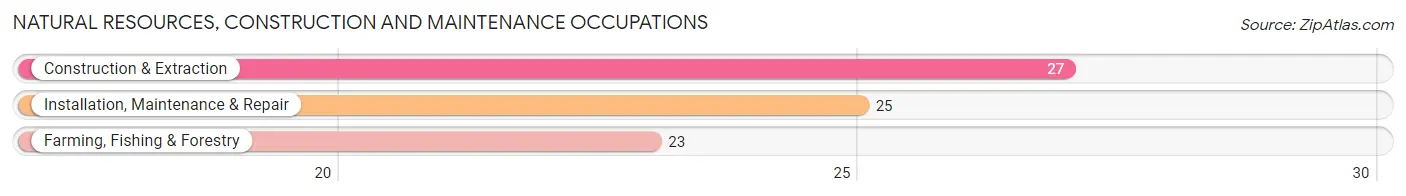
Natural Resources, Construction and Maintenance Occupations
The most common Natural Resources, Construction and Maintenance occupations in Jarratt are Construction & Extraction (27 | 4.9%), Installation, Maintenance & Repair (25 | 4.5%), and Farming, Fishing & Forestry (23 | 4.2%).
Natural Resources, Construction and Maintenance Occupations by Sex
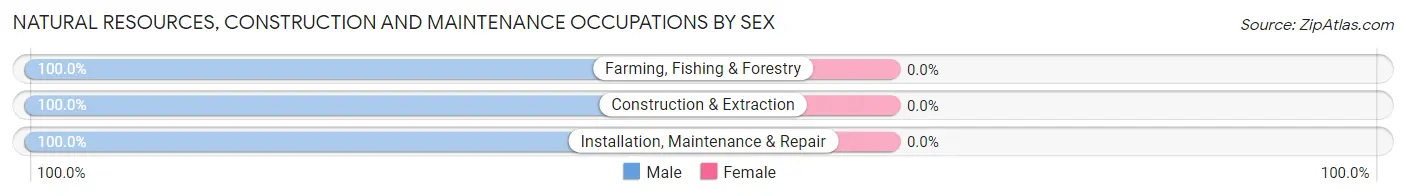
| Occupation | Male | Female |
| Farming, Fishing & Forestry | 23 (100.0%) | 0 (0.0%) |
| Construction & Extraction | 27 (100.0%) | 0 (0.0%) |
| Installation, Maintenance & Repair | 25 (100.0%) | 0 (0.0%) |
| Total (Category) | 75 (100.0%) | 0 (0.0%) |
| Total (Overall) | 291 (52.7%) | 261 (47.3%) |
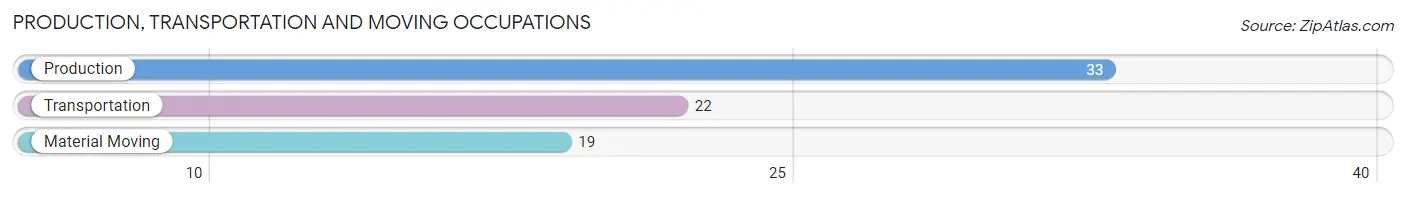
Production, Transportation and Moving Occupations
The most common Production, Transportation and Moving occupations in Jarratt are Production (33 | 6.0%), Transportation (22 | 4.0%), and Material Moving (19 | 3.4%).
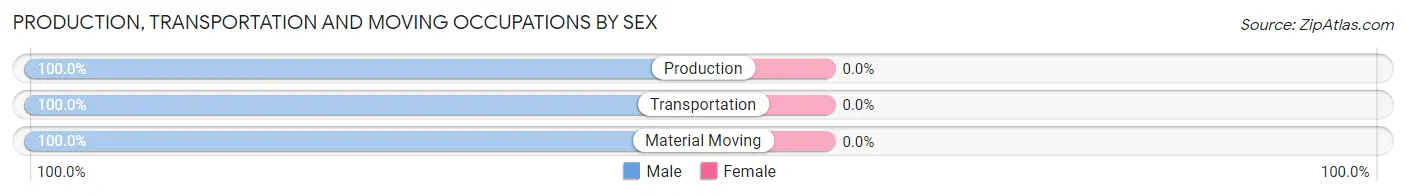
Production, Transportation and Moving Occupations by Sex
| Occupation | Male | Female |
| Production | 33 (100.0%) | 0 (0.0%) |
| Transportation | 22 (100.0%) | 0 (0.0%) |
| Material Moving | 19 (100.0%) | 0 (0.0%) |
| Total (Category) | 74 (100.0%) | 0 (0.0%) |
| Total (Overall) | 291 (52.7%) | 261 (47.3%) |
Employment Industries by Sex in Jarratt
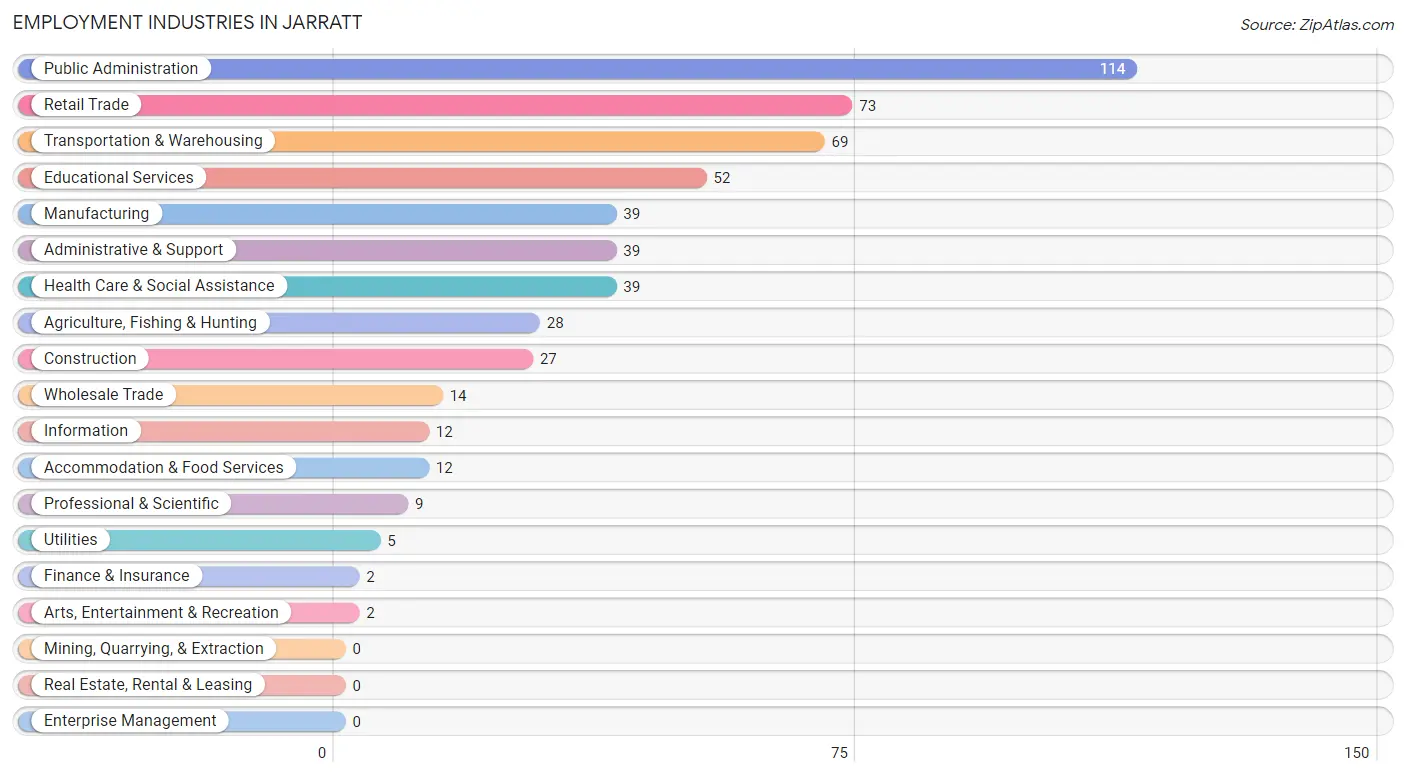
Employment Industries in Jarratt
The major employment industries in Jarratt include Public Administration (114 | 20.6%), Retail Trade (73 | 13.2%), Transportation & Warehousing (69 | 12.5%), Educational Services (52 | 9.4%), and Manufacturing (39 | 7.1%).
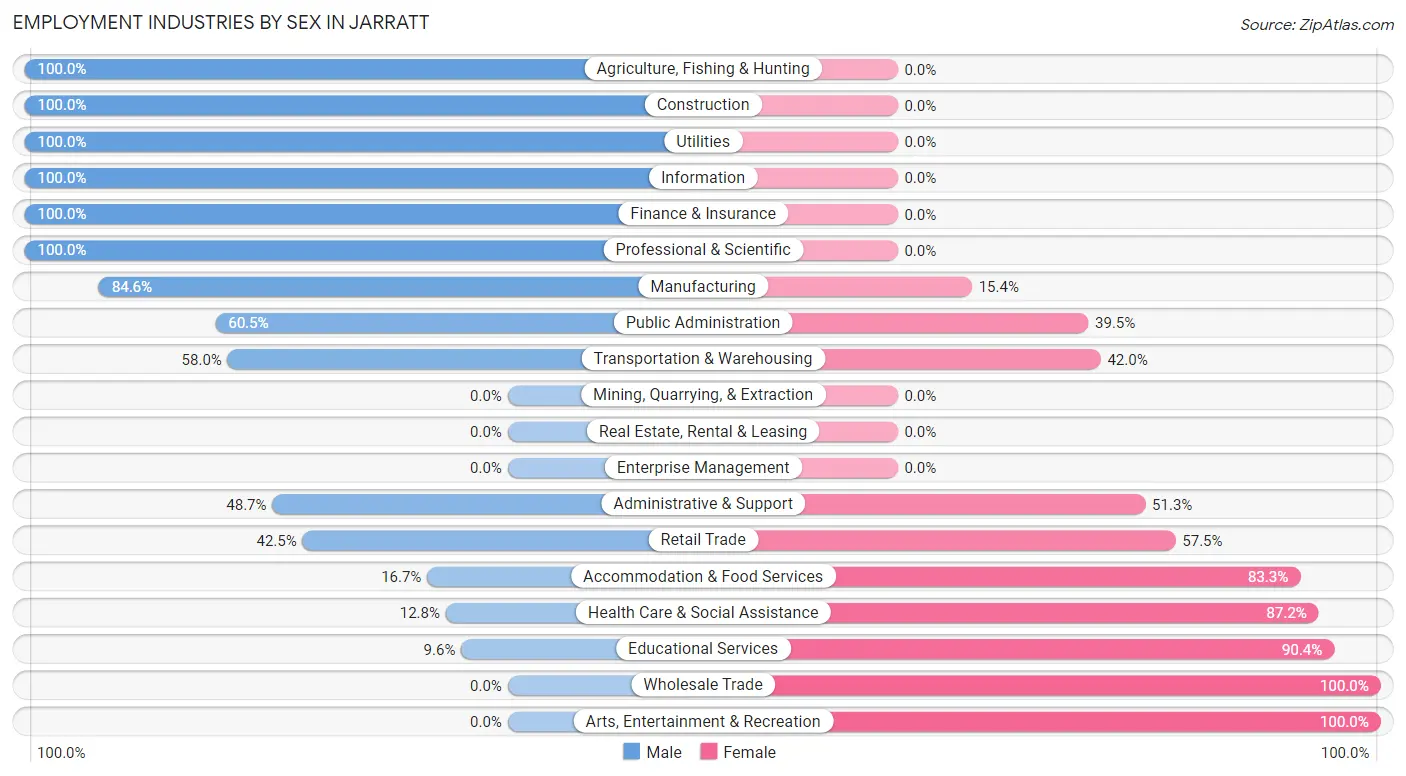
Employment Industries by Sex in Jarratt
The Jarratt industries that see more men than women are Agriculture, Fishing & Hunting (100.0%), Construction (100.0%), and Utilities (100.0%), whereas the industries that tend to have a higher number of women are Wholesale Trade (100.0%), Arts, Entertainment & Recreation (100.0%), and Educational Services (90.4%).
| Industry | Male | Female |
| Agriculture, Fishing & Hunting | 28 (100.0%) | 0 (0.0%) |
| Mining, Quarrying, & Extraction | 0 (0.0%) | 0 (0.0%) |
| Construction | 27 (100.0%) | 0 (0.0%) |
| Manufacturing | 33 (84.6%) | 6 (15.4%) |
| Wholesale Trade | 0 (0.0%) | 14 (100.0%) |
| Retail Trade | 31 (42.5%) | 42 (57.5%) |
| Transportation & Warehousing | 40 (58.0%) | 29 (42.0%) |
| Utilities | 5 (100.0%) | 0 (0.0%) |
| Information | 12 (100.0%) | 0 (0.0%) |
| Finance & Insurance | 2 (100.0%) | 0 (0.0%) |
| Real Estate, Rental & Leasing | 0 (0.0%) | 0 (0.0%) |
| Professional & Scientific | 9 (100.0%) | 0 (0.0%) |
| Enterprise Management | 0 (0.0%) | 0 (0.0%) |
| Administrative & Support | 19 (48.7%) | 20 (51.3%) |
| Educational Services | 5 (9.6%) | 47 (90.4%) |
| Health Care & Social Assistance | 5 (12.8%) | 34 (87.2%) |
| Arts, Entertainment & Recreation | 0 (0.0%) | 2 (100.0%) |
| Accommodation & Food Services | 2 (16.7%) | 10 (83.3%) |
| Public Administration | 69 (60.5%) | 45 (39.5%) |
| Total | 291 (52.7%) | 261 (47.3%) |
Education in Jarratt
School Enrollment in Jarratt
The most common levels of schooling among the 233 students in Jarratt are middle school (88 | 37.8%), high school (52 | 22.3%), and college / undergraduate (42 | 18.0%).
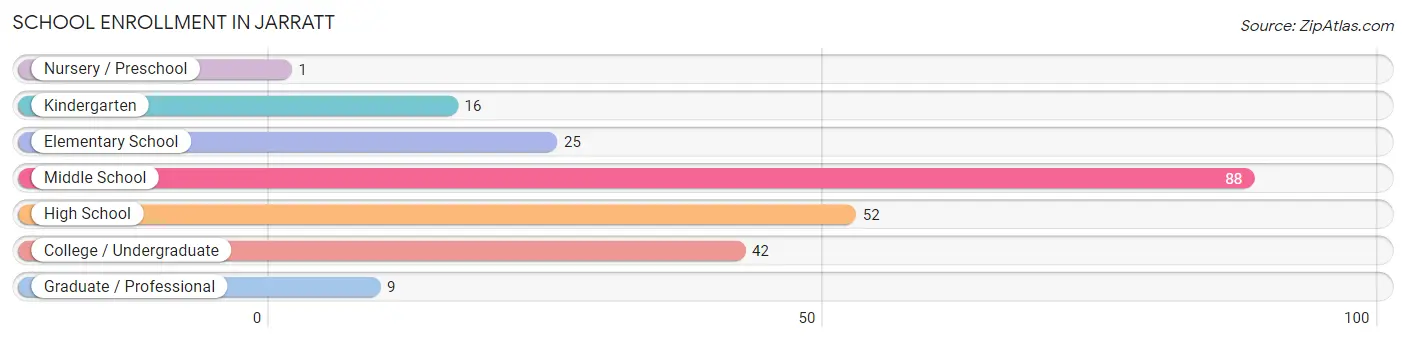
| School Level | # Students | % Students |
| Nursery / Preschool | 1 | 0.4% |
| Kindergarten | 16 | 6.9% |
| Elementary School | 25 | 10.7% |
| Middle School | 88 | 37.8% |
| High School | 52 | 22.3% |
| College / Undergraduate | 42 | 18.0% |
| Graduate / Professional | 9 | 3.9% |
| Total | 233 | 100.0% |
School Enrollment by Age by Funding Source in Jarratt
Out of a total of 233 students who are enrolled in schools in Jarratt, 24 (10.3%) attend a private institution, while the remaining 209 (89.7%) are enrolled in public schools. The age group of 35 years and over has the highest likelihood of being enrolled in private schools, with 8 (57.1% in the age bracket) enrolled. Conversely, the age group of 15 to 17 year olds has the lowest likelihood of being enrolled in a private school, with 19 (100.0% in the age bracket) attending a public institution.
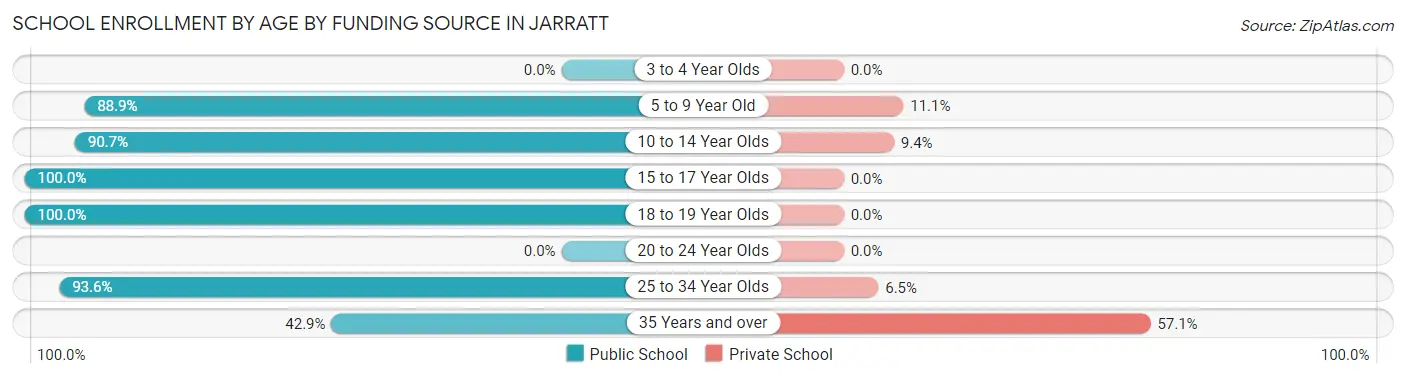
| Age Bracket | Public School | Private School |
| 3 to 4 Year Olds | 0 (0.0%) | 0 (0.0%) |
| 5 to 9 Year Old | 32 (88.9%) | 4 (11.1%) |
| 10 to 14 Year Olds | 97 (90.6%) | 10 (9.3%) |
| 15 to 17 Year Olds | 19 (100.0%) | 0 (0.0%) |
| 18 to 19 Year Olds | 26 (100.0%) | 0 (0.0%) |
| 20 to 24 Year Olds | 0 (0.0%) | 0 (0.0%) |
| 25 to 34 Year Olds | 29 (93.5%) | 2 (6.5%) |
| 35 Years and over | 6 (42.9%) | 8 (57.1%) |
| Total | 209 (89.7%) | 24 (10.3%) |
Educational Attainment by Field of Study in Jarratt
Arts & humanities (34 | 23.0%), science & technology (30 | 20.3%), liberal arts & history (22 | 14.9%), education (21 | 14.2%), and psychology (20 | 13.5%) are the most common fields of study among 148 individuals in Jarratt who have obtained a bachelor's degree or higher.
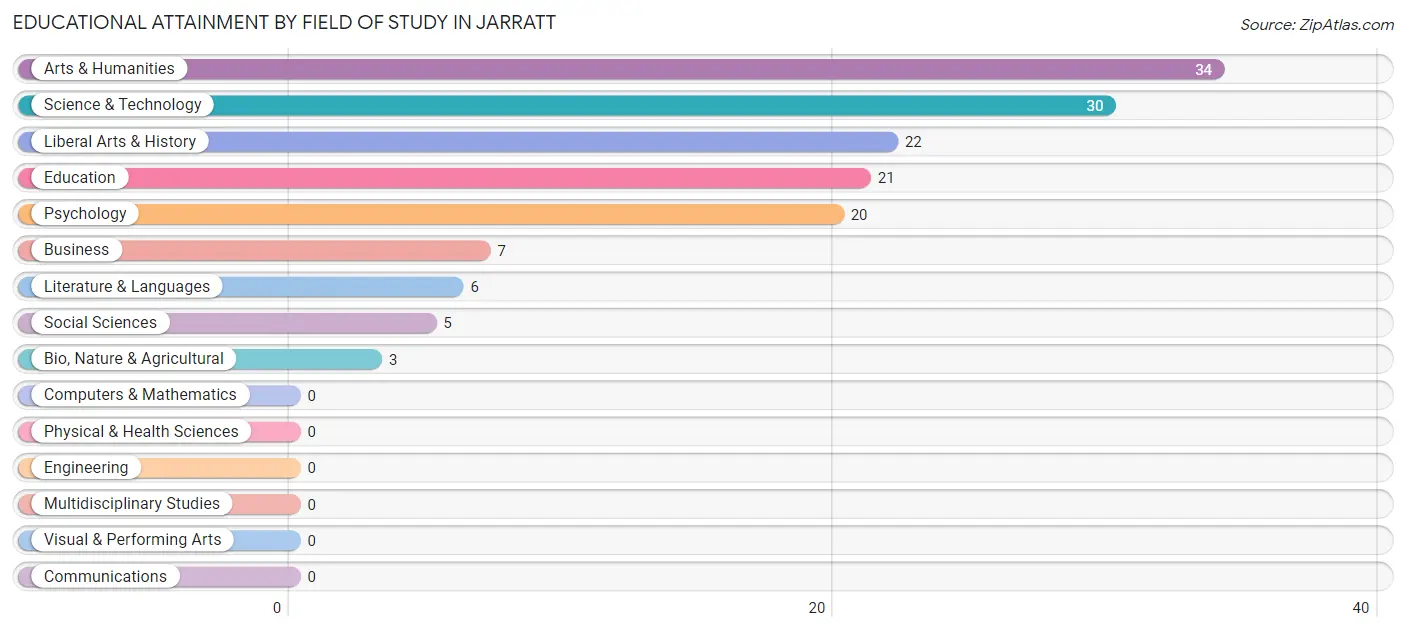
| Field of Study | # Graduates | % Graduates |
| Computers & Mathematics | 0 | 0.0% |
| Bio, Nature & Agricultural | 3 | 2.0% |
| Physical & Health Sciences | 0 | 0.0% |
| Psychology | 20 | 13.5% |
| Social Sciences | 5 | 3.4% |
| Engineering | 0 | 0.0% |
| Multidisciplinary Studies | 0 | 0.0% |
| Science & Technology | 30 | 20.3% |
| Business | 7 | 4.7% |
| Education | 21 | 14.2% |
| Literature & Languages | 6 | 4.1% |
| Liberal Arts & History | 22 | 14.9% |
| Visual & Performing Arts | 0 | 0.0% |
| Communications | 0 | 0.0% |
| Arts & Humanities | 34 | 23.0% |
| Total | 148 | 100.0% |
Transportation & Commute in Jarratt
Vehicle Availability by Sex in Jarratt
The most prevalent vehicle ownership categories in Jarratt are males with 2 vehicles (79, accounting for 27.2%) and females with 2 vehicles (67, making up 30.4%).
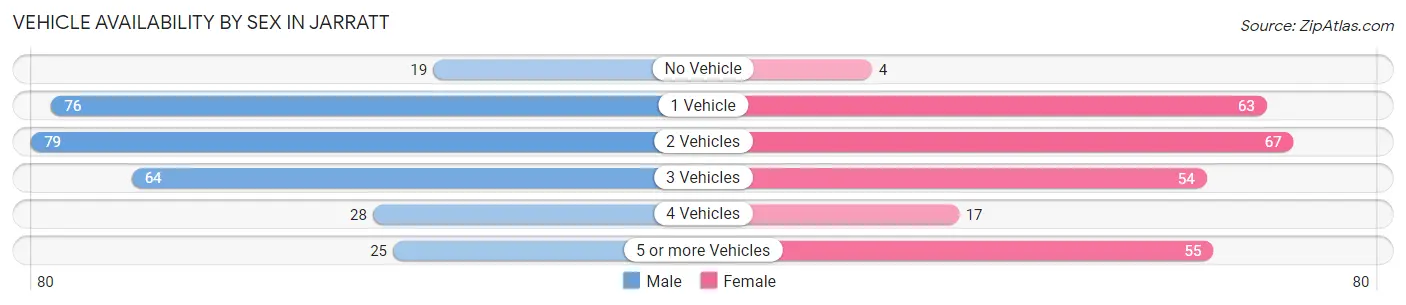
| Vehicles Available | Male | Female |
| No Vehicle | 19 (6.5%) | 4 (1.5%) |
| 1 Vehicle | 76 (26.1%) | 63 (24.2%) |
| 2 Vehicles | 79 (27.2%) | 67 (25.8%) |
| 3 Vehicles | 64 (22.0%) | 54 (20.8%) |
| 4 Vehicles | 28 (9.6%) | 17 (6.5%) |
| 5 or more Vehicles | 25 (8.6%) | 55 (21.1%) |
| Total | 291 (100.0%) | 260 (100.0%) |
Commute Time in Jarratt
The most frequently occuring commute durations in Jarratt are 5 to 9 minutes (113 commuters, 20.9%), 40 to 44 minutes (99 commuters, 18.3%), and 15 to 19 minutes (59 commuters, 10.9%).
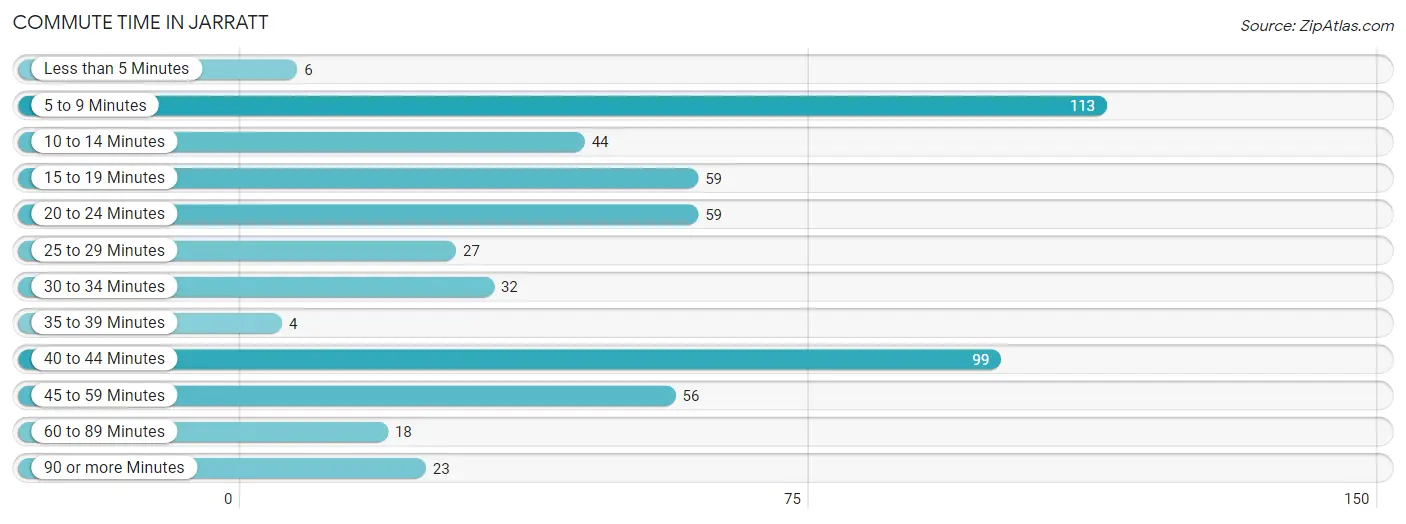
| Commute Time | # Commuters | % Commuters |
| Less than 5 Minutes | 6 | 1.1% |
| 5 to 9 Minutes | 113 | 20.9% |
| 10 to 14 Minutes | 44 | 8.2% |
| 15 to 19 Minutes | 59 | 10.9% |
| 20 to 24 Minutes | 59 | 10.9% |
| 25 to 29 Minutes | 27 | 5.0% |
| 30 to 34 Minutes | 32 | 5.9% |
| 35 to 39 Minutes | 4 | 0.7% |
| 40 to 44 Minutes | 99 | 18.3% |
| 45 to 59 Minutes | 56 | 10.4% |
| 60 to 89 Minutes | 18 | 3.3% |
| 90 or more Minutes | 23 | 4.3% |
Commute Time by Sex in Jarratt
The most common commute times in Jarratt are 5 to 9 minutes (69 commuters, 24.0%) for males and 15 to 19 minutes (51 commuters, 20.2%) for females.
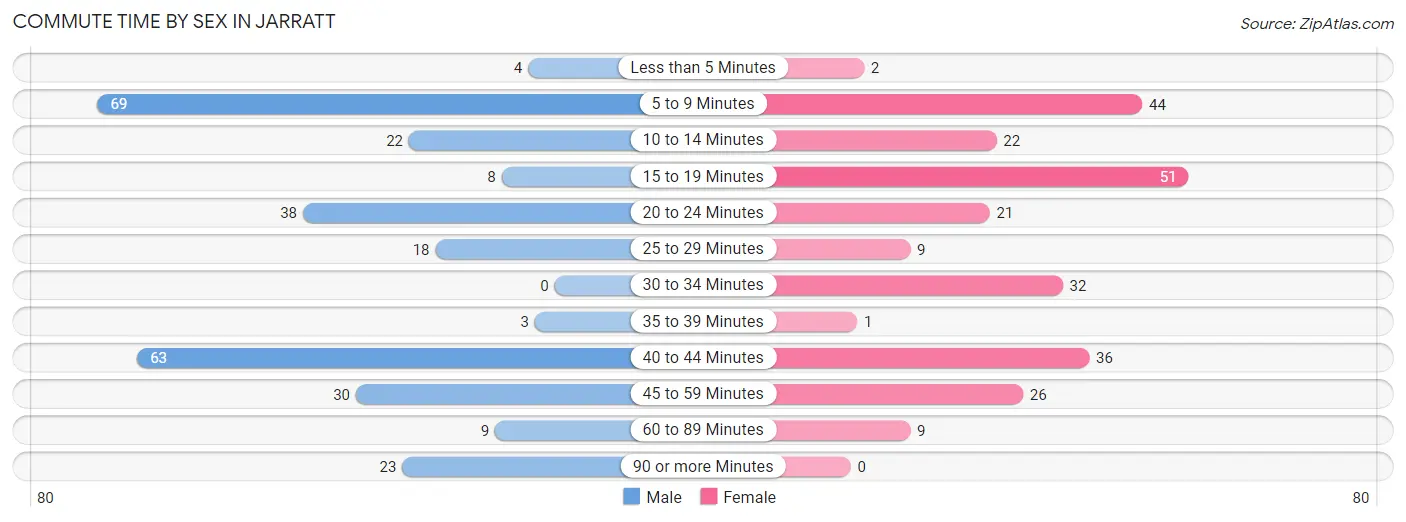
| Commute Time | Male | Female |
| Less than 5 Minutes | 4 (1.4%) | 2 (0.8%) |
| 5 to 9 Minutes | 69 (24.0%) | 44 (17.4%) |
| 10 to 14 Minutes | 22 (7.7%) | 22 (8.7%) |
| 15 to 19 Minutes | 8 (2.8%) | 51 (20.2%) |
| 20 to 24 Minutes | 38 (13.2%) | 21 (8.3%) |
| 25 to 29 Minutes | 18 (6.3%) | 9 (3.6%) |
| 30 to 34 Minutes | 0 (0.0%) | 32 (12.7%) |
| 35 to 39 Minutes | 3 (1.1%) | 1 (0.4%) |
| 40 to 44 Minutes | 63 (22.0%) | 36 (14.2%) |
| 45 to 59 Minutes | 30 (10.4%) | 26 (10.3%) |
| 60 to 89 Minutes | 9 (3.1%) | 9 (3.6%) |
| 90 or more Minutes | 23 (8.0%) | 0 (0.0%) |
Time of Departure to Work by Sex in Jarratt
The most frequent times of departure to work in Jarratt are 6:30 AM to 6:59 AM (57, 19.9%) for males and 7:30 AM to 7:59 AM (62, 24.5%) for females.
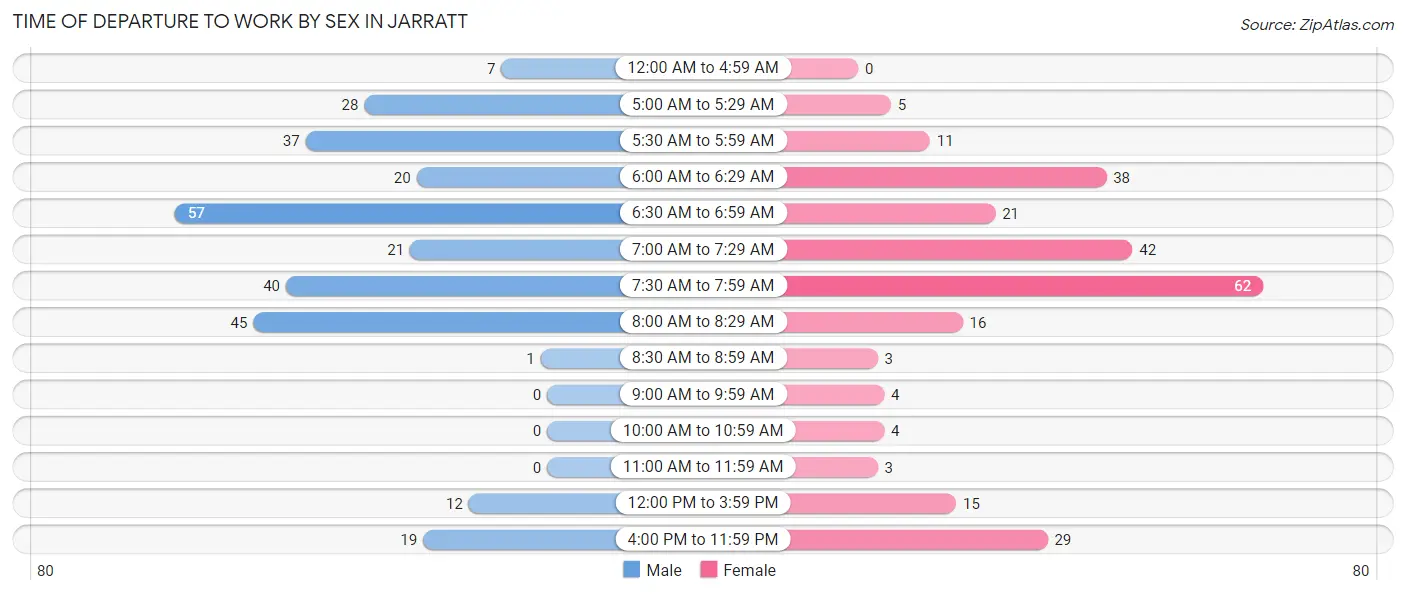
| Time of Departure | Male | Female |
| 12:00 AM to 4:59 AM | 7 (2.4%) | 0 (0.0%) |
| 5:00 AM to 5:29 AM | 28 (9.8%) | 5 (2.0%) |
| 5:30 AM to 5:59 AM | 37 (12.9%) | 11 (4.3%) |
| 6:00 AM to 6:29 AM | 20 (7.0%) | 38 (15.0%) |
| 6:30 AM to 6:59 AM | 57 (19.9%) | 21 (8.3%) |
| 7:00 AM to 7:29 AM | 21 (7.3%) | 42 (16.6%) |
| 7:30 AM to 7:59 AM | 40 (13.9%) | 62 (24.5%) |
| 8:00 AM to 8:29 AM | 45 (15.7%) | 16 (6.3%) |
| 8:30 AM to 8:59 AM | 1 (0.4%) | 3 (1.2%) |
| 9:00 AM to 9:59 AM | 0 (0.0%) | 4 (1.6%) |
| 10:00 AM to 10:59 AM | 0 (0.0%) | 4 (1.6%) |
| 11:00 AM to 11:59 AM | 0 (0.0%) | 3 (1.2%) |
| 12:00 PM to 3:59 PM | 12 (4.2%) | 15 (5.9%) |
| 4:00 PM to 11:59 PM | 19 (6.6%) | 29 (11.5%) |
| Total | 287 (100.0%) | 253 (100.0%) |
Housing Occupancy in Jarratt
Occupancy by Ownership in Jarratt
Of the total 393 dwellings in Jarratt, owner-occupied units account for 232 (59.0%), while renter-occupied units make up 161 (41.0%).
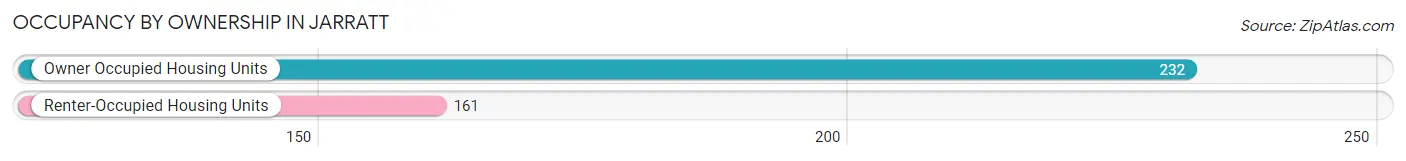
| Occupancy | # Housing Units | % Housing Units |
| Owner Occupied Housing Units | 232 | 59.0% |
| Renter-Occupied Housing Units | 161 | 41.0% |
| Total Occupied Housing Units | 393 | 100.0% |
Occupancy by Household Size in Jarratt
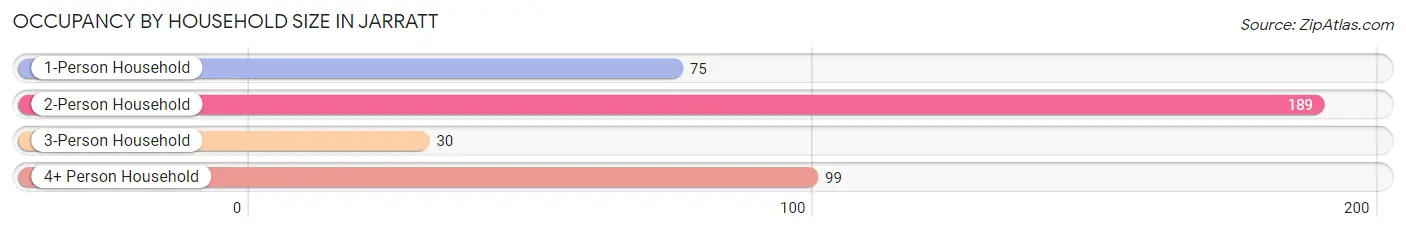
| Household Size | # Housing Units | % Housing Units |
| 1-Person Household | 75 | 19.1% |
| 2-Person Household | 189 | 48.1% |
| 3-Person Household | 30 | 7.6% |
| 4+ Person Household | 99 | 25.2% |
| Total Housing Units | 393 | 100.0% |
Occupancy by Ownership by Household Size in Jarratt
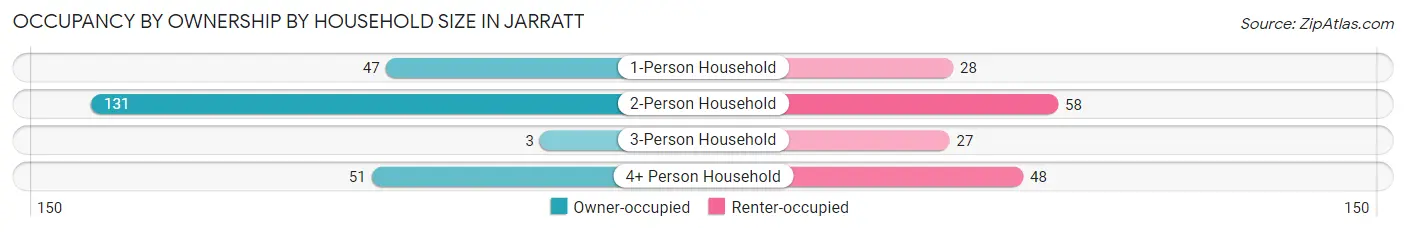
| Household Size | Owner-occupied | Renter-occupied |
| 1-Person Household | 47 (62.7%) | 28 (37.3%) |
| 2-Person Household | 131 (69.3%) | 58 (30.7%) |
| 3-Person Household | 3 (10.0%) | 27 (90.0%) |
| 4+ Person Household | 51 (51.5%) | 48 (48.5%) |
| Total Housing Units | 232 (59.0%) | 161 (41.0%) |
Occupancy by Educational Attainment in Jarratt
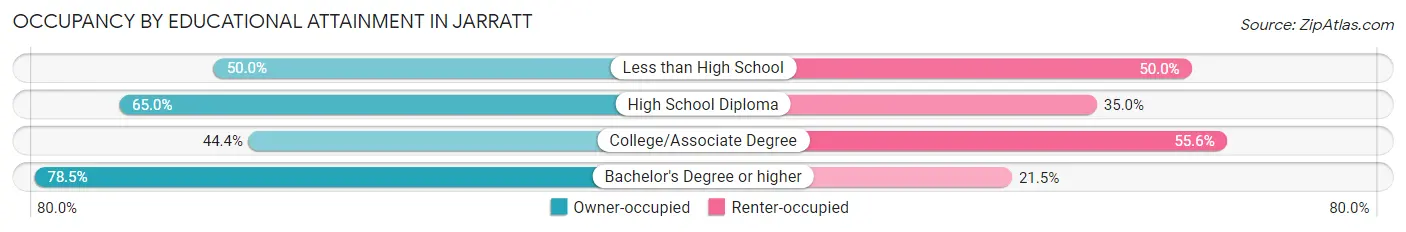
| Household Size | Owner-occupied | Renter-occupied |
| Less than High School | 7 (50.0%) | 7 (50.0%) |
| High School Diploma | 39 (65.0%) | 21 (35.0%) |
| College/Associate Degree | 84 (44.4%) | 105 (55.6%) |
| Bachelor's Degree or higher | 102 (78.5%) | 28 (21.5%) |
Occupancy by Age of Householder in Jarratt
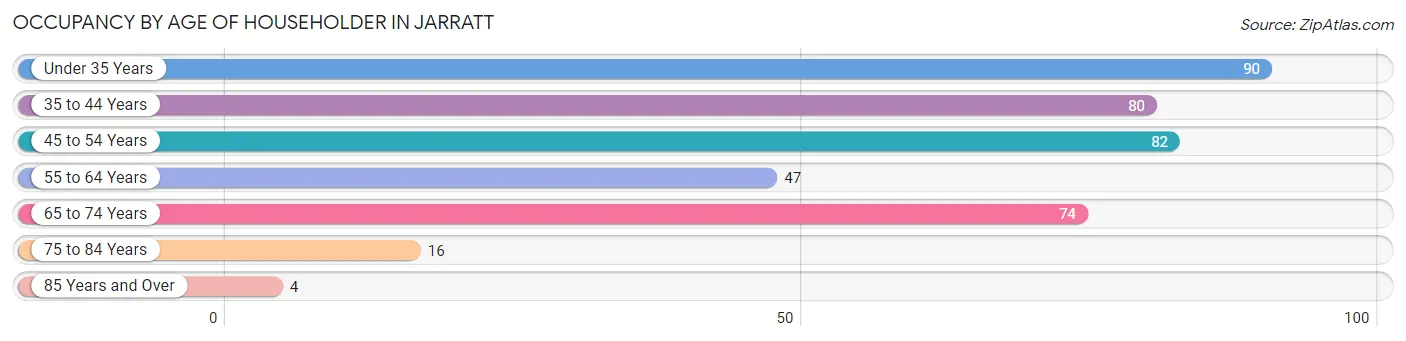
| Age Bracket | # Households | % Households |
| Under 35 Years | 90 | 22.9% |
| 35 to 44 Years | 80 | 20.4% |
| 45 to 54 Years | 82 | 20.9% |
| 55 to 64 Years | 47 | 12.0% |
| 65 to 74 Years | 74 | 18.8% |
| 75 to 84 Years | 16 | 4.1% |
| 85 Years and Over | 4 | 1.0% |
| Total | 393 | 100.0% |
Housing Finances in Jarratt
Median Income by Occupancy in Jarratt
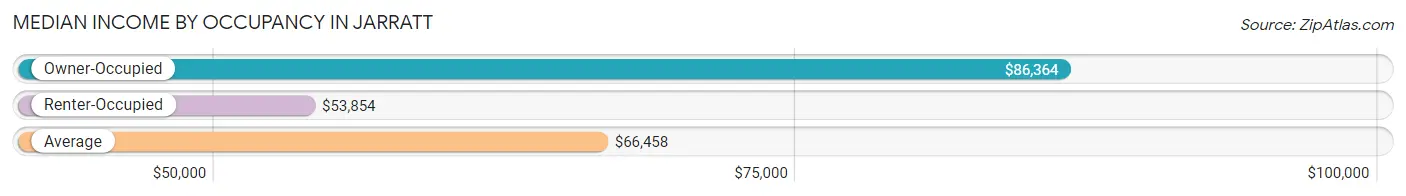
| Occupancy Type | # Households | Median Income |
| Owner-Occupied | 232 (59.0%) | $86,364 |
| Renter-Occupied | 161 (41.0%) | $53,854 |
| Average | 393 (100.0%) | $66,458 |
Occupancy by Householder Income Bracket in Jarratt
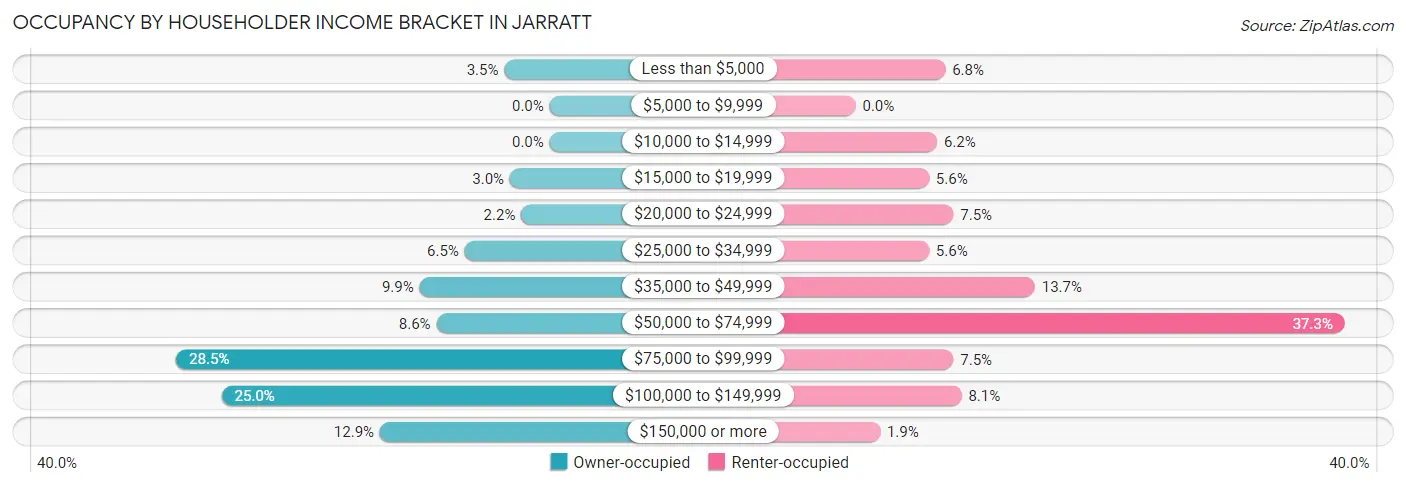
| Income Bracket | Owner-occupied | Renter-occupied |
| Less than $5,000 | 8 (3.5%) | 11 (6.8%) |
| $5,000 to $9,999 | 0 (0.0%) | 0 (0.0%) |
| $10,000 to $14,999 | 0 (0.0%) | 10 (6.2%) |
| $15,000 to $19,999 | 7 (3.0%) | 9 (5.6%) |
| $20,000 to $24,999 | 5 (2.2%) | 12 (7.4%) |
| $25,000 to $34,999 | 15 (6.5%) | 9 (5.6%) |
| $35,000 to $49,999 | 23 (9.9%) | 22 (13.7%) |
| $50,000 to $74,999 | 20 (8.6%) | 60 (37.3%) |
| $75,000 to $99,999 | 66 (28.4%) | 12 (7.4%) |
| $100,000 to $149,999 | 58 (25.0%) | 13 (8.1%) |
| $150,000 or more | 30 (12.9%) | 3 (1.9%) |
| Total | 232 (100.0%) | 161 (100.0%) |
Monthly Housing Cost Tiers in Jarratt
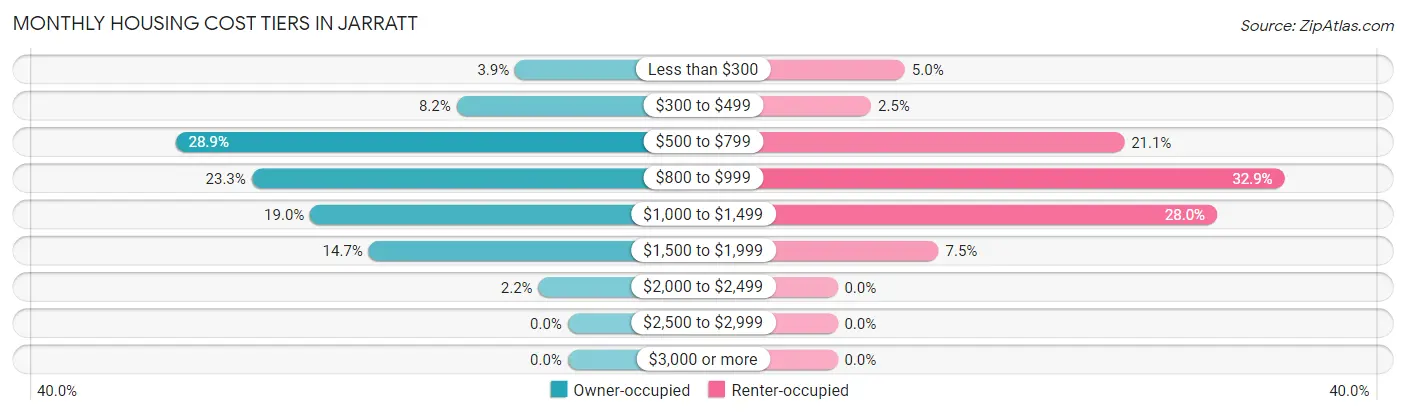
| Monthly Cost | Owner-occupied | Renter-occupied |
| Less than $300 | 9 (3.9%) | 8 (5.0%) |
| $300 to $499 | 19 (8.2%) | 4 (2.5%) |
| $500 to $799 | 67 (28.9%) | 34 (21.1%) |
| $800 to $999 | 54 (23.3%) | 53 (32.9%) |
| $1,000 to $1,499 | 44 (19.0%) | 45 (28.0%) |
| $1,500 to $1,999 | 34 (14.7%) | 12 (7.4%) |
| $2,000 to $2,499 | 5 (2.2%) | 0 (0.0%) |
| $2,500 to $2,999 | 0 (0.0%) | 0 (0.0%) |
| $3,000 or more | 0 (0.0%) | 0 (0.0%) |
| Total | 232 (100.0%) | 161 (100.0%) |
Physical Housing Characteristics in Jarratt
Housing Structures in Jarratt
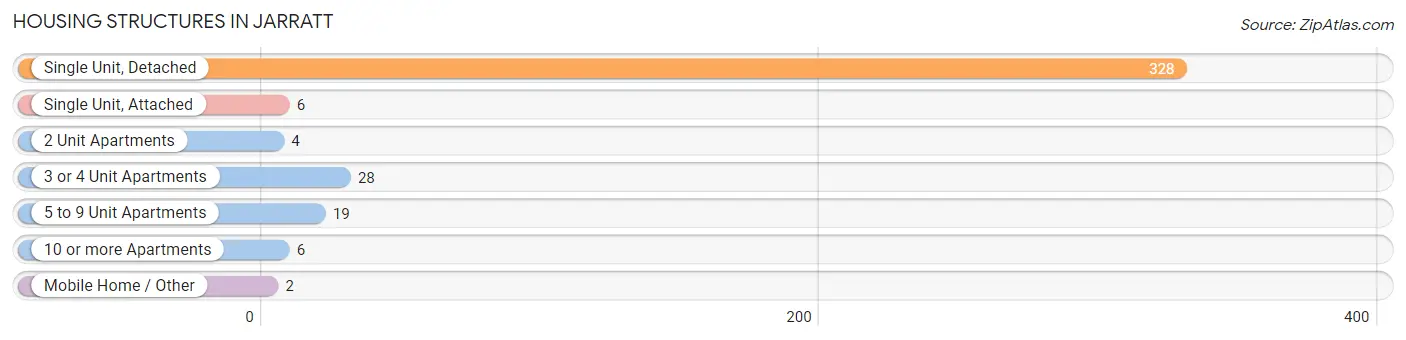
| Structure Type | # Housing Units | % Housing Units |
| Single Unit, Detached | 328 | 83.5% |
| Single Unit, Attached | 6 | 1.5% |
| 2 Unit Apartments | 4 | 1.0% |
| 3 or 4 Unit Apartments | 28 | 7.1% |
| 5 to 9 Unit Apartments | 19 | 4.8% |
| 10 or more Apartments | 6 | 1.5% |
| Mobile Home / Other | 2 | 0.5% |
| Total | 393 | 100.0% |
Housing Structures by Occupancy in Jarratt
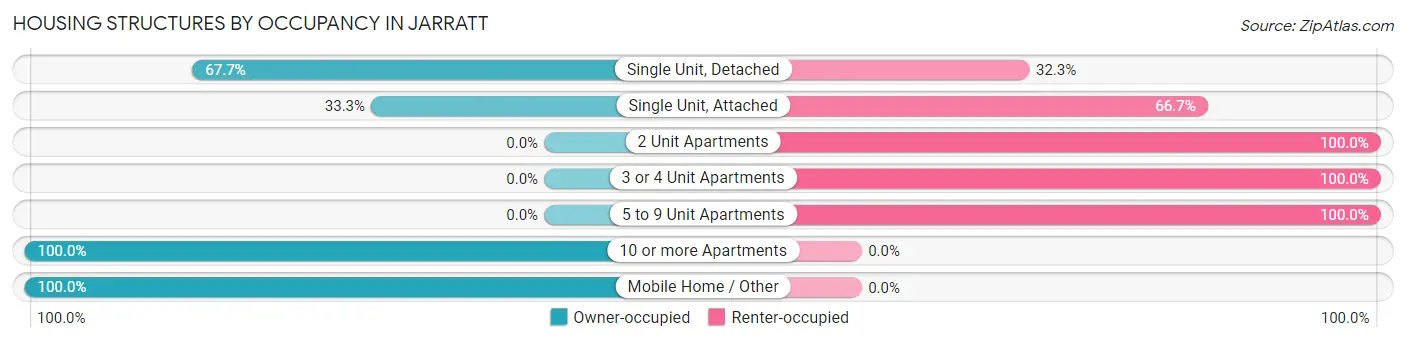
| Structure Type | Owner-occupied | Renter-occupied |
| Single Unit, Detached | 222 (67.7%) | 106 (32.3%) |
| Single Unit, Attached | 2 (33.3%) | 4 (66.7%) |
| 2 Unit Apartments | 0 (0.0%) | 4 (100.0%) |
| 3 or 4 Unit Apartments | 0 (0.0%) | 28 (100.0%) |
| 5 to 9 Unit Apartments | 0 (0.0%) | 19 (100.0%) |
| 10 or more Apartments | 6 (100.0%) | 0 (0.0%) |
| Mobile Home / Other | 2 (100.0%) | 0 (0.0%) |
| Total | 232 (59.0%) | 161 (41.0%) |
Housing Structures by Number of Rooms in Jarratt
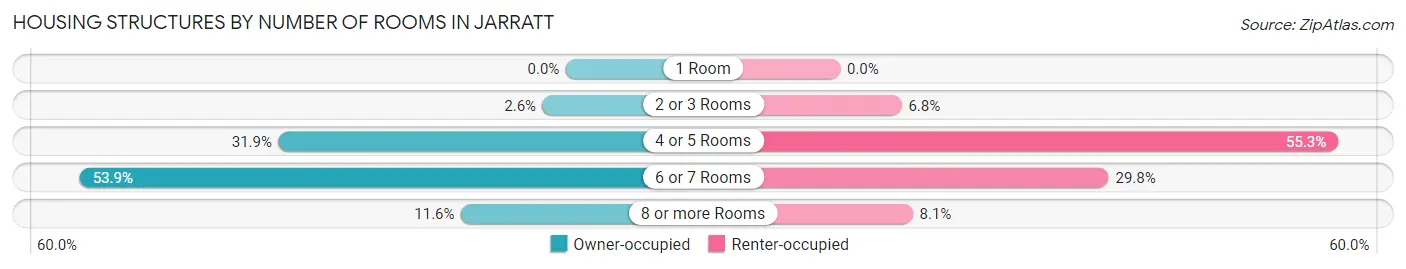
| Number of Rooms | Owner-occupied | Renter-occupied |
| 1 Room | 0 (0.0%) | 0 (0.0%) |
| 2 or 3 Rooms | 6 (2.6%) | 11 (6.8%) |
| 4 or 5 Rooms | 74 (31.9%) | 89 (55.3%) |
| 6 or 7 Rooms | 125 (53.9%) | 48 (29.8%) |
| 8 or more Rooms | 27 (11.6%) | 13 (8.1%) |
| Total | 232 (100.0%) | 161 (100.0%) |
Housing Structure by Heating Type in Jarratt
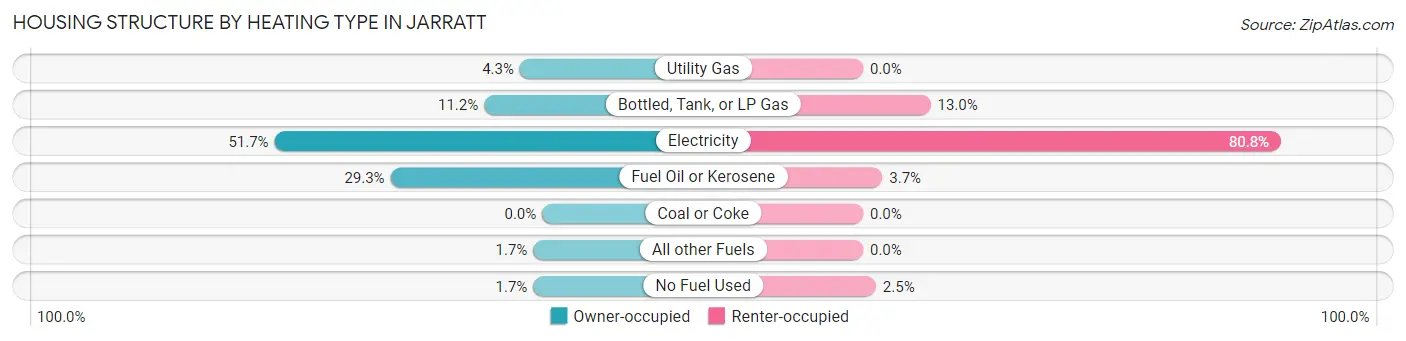
| Heating Type | Owner-occupied | Renter-occupied |
| Utility Gas | 10 (4.3%) | 0 (0.0%) |
| Bottled, Tank, or LP Gas | 26 (11.2%) | 21 (13.0%) |
| Electricity | 120 (51.7%) | 130 (80.7%) |
| Fuel Oil or Kerosene | 68 (29.3%) | 6 (3.7%) |
| Coal or Coke | 0 (0.0%) | 0 (0.0%) |
| All other Fuels | 4 (1.7%) | 0 (0.0%) |
| No Fuel Used | 4 (1.7%) | 4 (2.5%) |
| Total | 232 (100.0%) | 161 (100.0%) |
Household Vehicle Usage in Jarratt
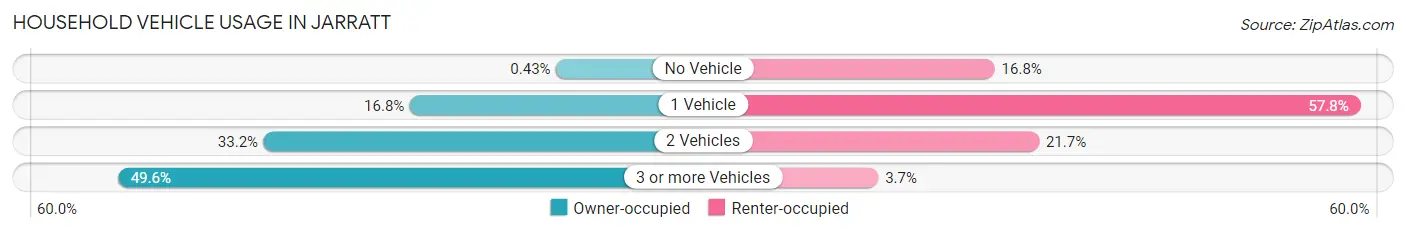
| Vehicles per Household | Owner-occupied | Renter-occupied |
| No Vehicle | 1 (0.4%) | 27 (16.8%) |
| 1 Vehicle | 39 (16.8%) | 93 (57.8%) |
| 2 Vehicles | 77 (33.2%) | 35 (21.7%) |
| 3 or more Vehicles | 115 (49.6%) | 6 (3.7%) |
| Total | 232 (100.0%) | 161 (100.0%) |
Real Estate & Mortgages in Jarratt
Real Estate and Mortgage Overview in Jarratt
| Characteristic | Without Mortgage | With Mortgage |
| Housing Units | 75 | 157 |
| Median Property Value | $170,300 | $147,900 |
| Median Household Income | $79,821 | $30 |
| Monthly Housing Costs | $615 | $0 |
| Real Estate Taxes | $1,319 | $4 |
Property Value by Mortgage Status in Jarratt
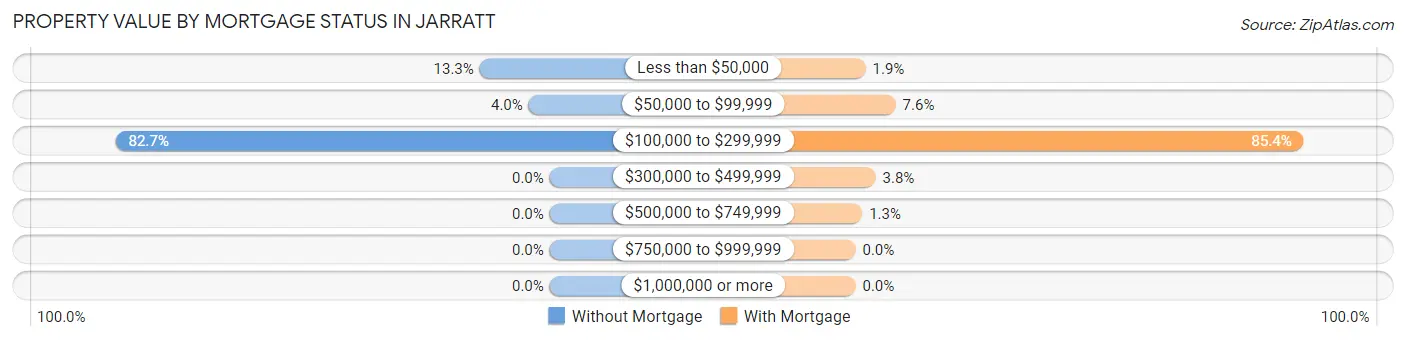
| Property Value | Without Mortgage | With Mortgage |
| Less than $50,000 | 10 (13.3%) | 3 (1.9%) |
| $50,000 to $99,999 | 3 (4.0%) | 12 (7.6%) |
| $100,000 to $299,999 | 62 (82.7%) | 134 (85.4%) |
| $300,000 to $499,999 | 0 (0.0%) | 6 (3.8%) |
| $500,000 to $749,999 | 0 (0.0%) | 2 (1.3%) |
| $750,000 to $999,999 | 0 (0.0%) | 0 (0.0%) |
| $1,000,000 or more | 0 (0.0%) | 0 (0.0%) |
| Total | 75 (100.0%) | 157 (100.0%) |
Household Income by Mortgage Status in Jarratt
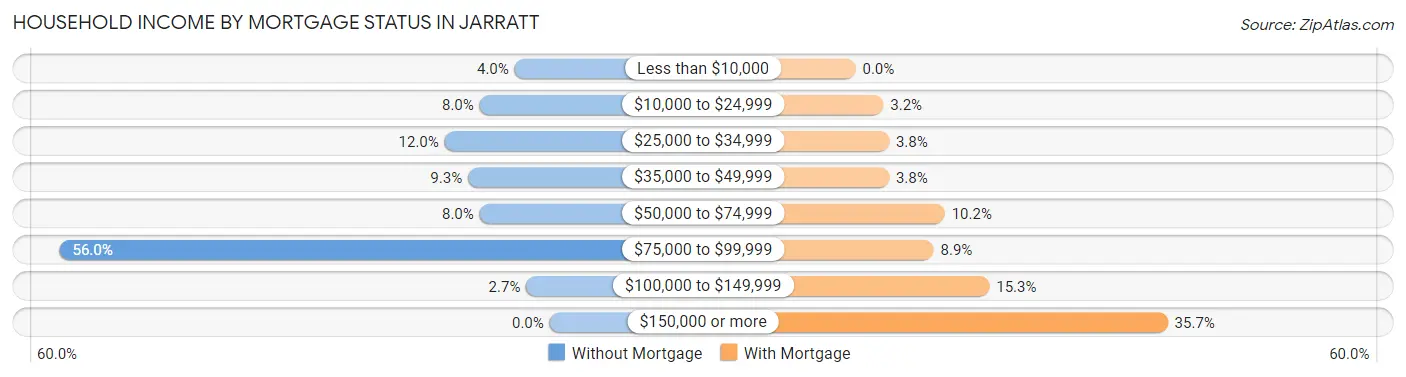
| Household Income | Without Mortgage | With Mortgage |
| Less than $10,000 | 3 (4.0%) | 0 (0.0%) |
| $10,000 to $24,999 | 6 (8.0%) | 5 (3.2%) |
| $25,000 to $34,999 | 9 (12.0%) | 6 (3.8%) |
| $35,000 to $49,999 | 7 (9.3%) | 6 (3.8%) |
| $50,000 to $74,999 | 6 (8.0%) | 16 (10.2%) |
| $75,000 to $99,999 | 42 (56.0%) | 14 (8.9%) |
| $100,000 to $149,999 | 2 (2.7%) | 24 (15.3%) |
| $150,000 or more | 0 (0.0%) | 56 (35.7%) |
| Total | 75 (100.0%) | 157 (100.0%) |
Property Value to Household Income Ratio in Jarratt
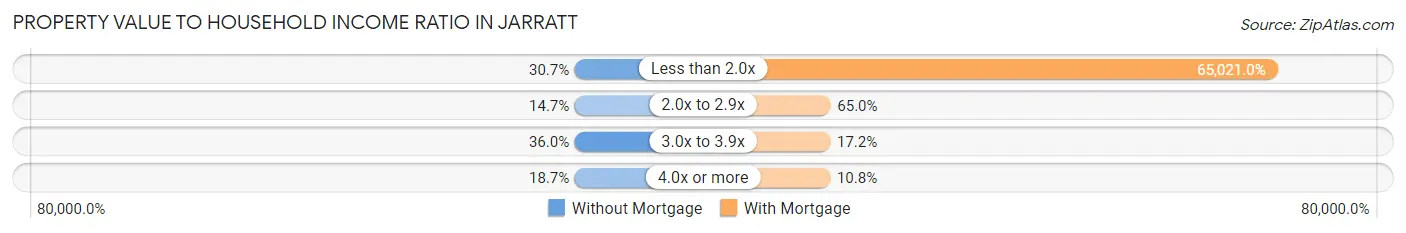
| Value-to-Income Ratio | Without Mortgage | With Mortgage |
| Less than 2.0x | 23 (30.7%) | 102,083 (65,021.0%) |
| 2.0x to 2.9x | 11 (14.7%) | 102 (65.0%) |
| 3.0x to 3.9x | 27 (36.0%) | 27 (17.2%) |
| 4.0x or more | 14 (18.7%) | 17 (10.8%) |
| Total | 75 (100.0%) | 157 (100.0%) |
Real Estate Taxes by Mortgage Status in Jarratt
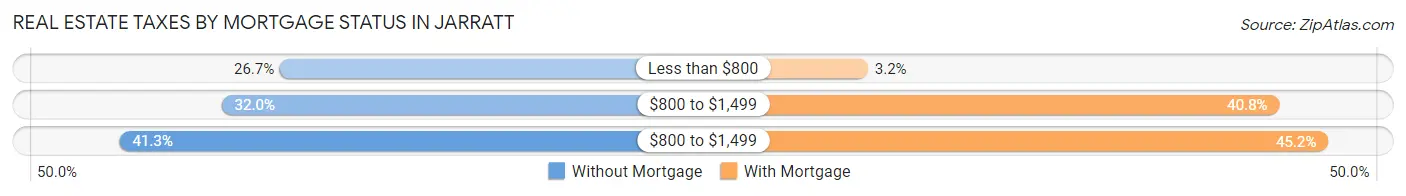
| Property Taxes | Without Mortgage | With Mortgage |
| Less than $800 | 20 (26.7%) | 5 (3.2%) |
| $800 to $1,499 | 24 (32.0%) | 64 (40.8%) |
| $800 to $1,499 | 31 (41.3%) | 71 (45.2%) |
| Total | 75 (100.0%) | 157 (100.0%) |
Health & Disability in Jarratt
Health Insurance Coverage by Age in Jarratt
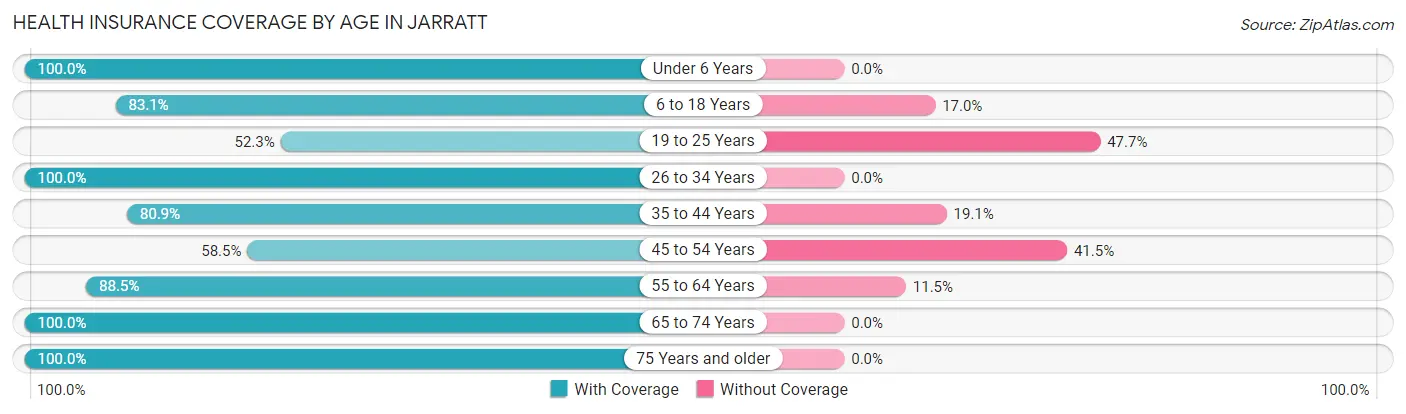
| Age Bracket | With Coverage | Without Coverage |
| Under 6 Years | 56 (100.0%) | 0 (0.0%) |
| 6 to 18 Years | 147 (83.1%) | 30 (17.0%) |
| 19 to 25 Years | 23 (52.3%) | 21 (47.7%) |
| 26 to 34 Years | 160 (100.0%) | 0 (0.0%) |
| 35 to 44 Years | 123 (80.9%) | 29 (19.1%) |
| 45 to 54 Years | 69 (58.5%) | 49 (41.5%) |
| 55 to 64 Years | 54 (88.5%) | 7 (11.5%) |
| 65 to 74 Years | 141 (100.0%) | 0 (0.0%) |
| 75 Years and older | 25 (100.0%) | 0 (0.0%) |
| Total | 798 (85.4%) | 136 (14.6%) |
Health Insurance Coverage by Citizenship Status in Jarratt
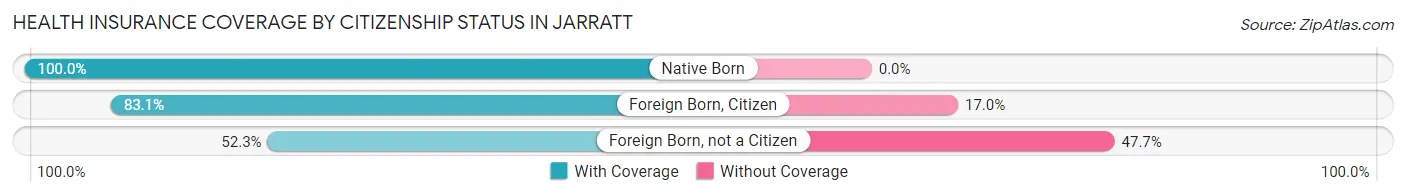
| Citizenship Status | With Coverage | Without Coverage |
| Native Born | 56 (100.0%) | 0 (0.0%) |
| Foreign Born, Citizen | 147 (83.1%) | 30 (17.0%) |
| Foreign Born, not a Citizen | 23 (52.3%) | 21 (47.7%) |
Health Insurance Coverage by Household Income in Jarratt
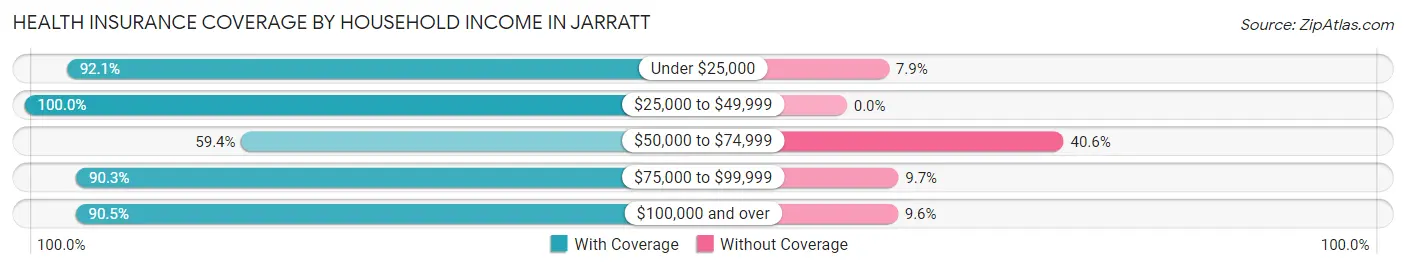
| Household Income | With Coverage | Without Coverage |
| Under $25,000 | 105 (92.1%) | 9 (7.9%) |
| $25,000 to $49,999 | 133 (100.0%) | 0 (0.0%) |
| $50,000 to $74,999 | 117 (59.4%) | 80 (40.6%) |
| $75,000 to $99,999 | 159 (90.3%) | 17 (9.7%) |
| $100,000 and over | 284 (90.4%) | 30 (9.6%) |
Public vs Private Health Insurance Coverage by Age in Jarratt
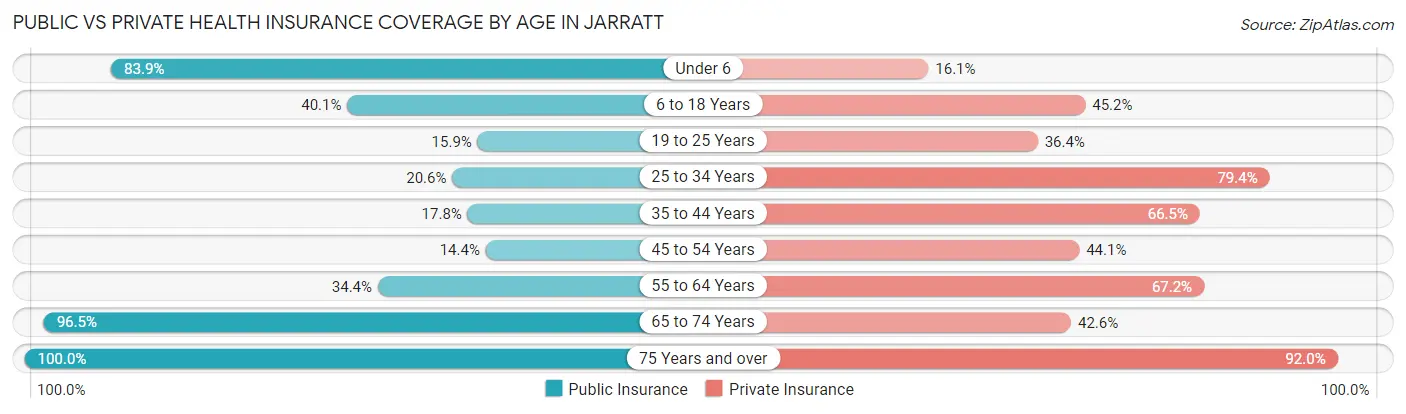
| Age Bracket | Public Insurance | Private Insurance |
| Under 6 | 47 (83.9%) | 9 (16.1%) |
| 6 to 18 Years | 71 (40.1%) | 80 (45.2%) |
| 19 to 25 Years | 7 (15.9%) | 16 (36.4%) |
| 25 to 34 Years | 33 (20.6%) | 127 (79.4%) |
| 35 to 44 Years | 27 (17.8%) | 101 (66.4%) |
| 45 to 54 Years | 17 (14.4%) | 52 (44.1%) |
| 55 to 64 Years | 21 (34.4%) | 41 (67.2%) |
| 65 to 74 Years | 136 (96.5%) | 60 (42.5%) |
| 75 Years and over | 25 (100.0%) | 23 (92.0%) |
| Total | 384 (41.1%) | 509 (54.5%) |
Disability Status by Sex by Age in Jarratt
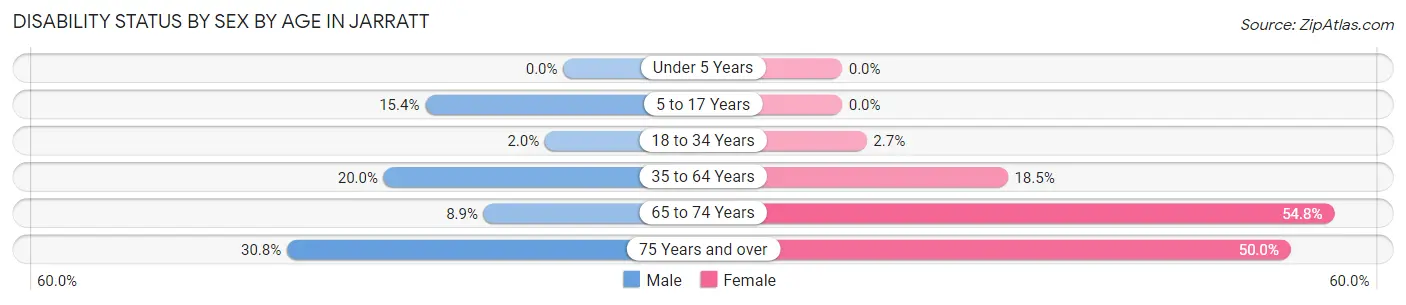
| Age Bracket | Male | Female |
| Under 5 Years | 0 (0.0%) | 0 (0.0%) |
| 5 to 17 Years | 12 (15.4%) | 0 (0.0%) |
| 18 to 34 Years | 3 (2.0%) | 2 (2.7%) |
| 35 to 64 Years | 25 (20.0%) | 38 (18.4%) |
| 65 to 74 Years | 7 (8.9%) | 34 (54.8%) |
| 75 Years and over | 4 (30.8%) | 6 (50.0%) |
Disability Class by Sex by Age in Jarratt
Disability Class: Hearing Difficulty
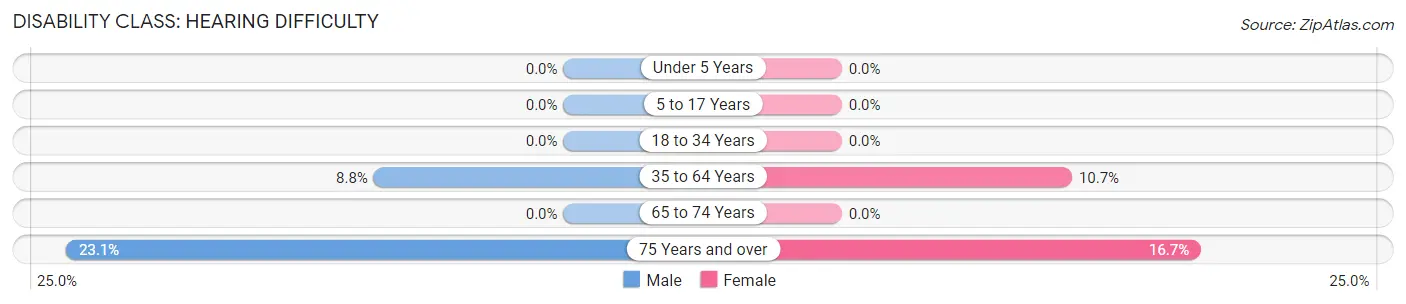
| Age Bracket | Male | Female |
| Under 5 Years | 0 (0.0%) | 0 (0.0%) |
| 5 to 17 Years | 0 (0.0%) | 0 (0.0%) |
| 18 to 34 Years | 0 (0.0%) | 0 (0.0%) |
| 35 to 64 Years | 11 (8.8%) | 22 (10.7%) |
| 65 to 74 Years | 0 (0.0%) | 0 (0.0%) |
| 75 Years and over | 3 (23.1%) | 2 (16.7%) |
Disability Class: Vision Difficulty
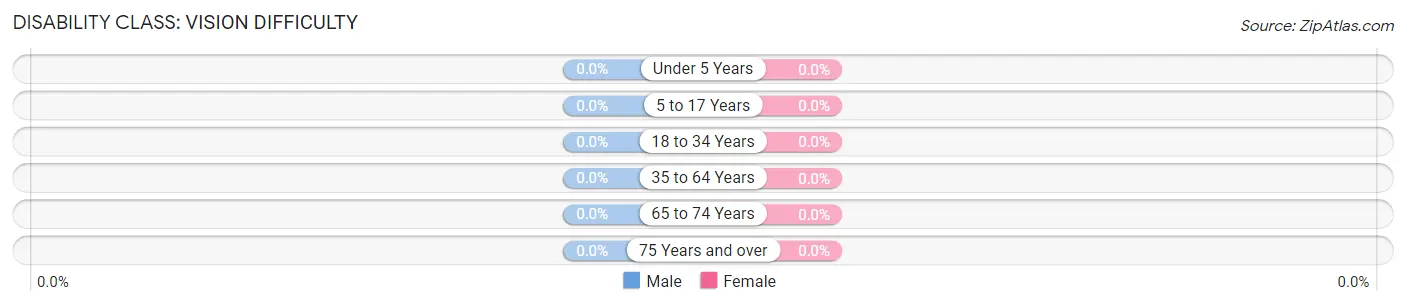
| Age Bracket | Male | Female |
| Under 5 Years | 0 (0.0%) | 0 (0.0%) |
| 5 to 17 Years | 0 (0.0%) | 0 (0.0%) |
| 18 to 34 Years | 0 (0.0%) | 0 (0.0%) |
| 35 to 64 Years | 0 (0.0%) | 0 (0.0%) |
| 65 to 74 Years | 0 (0.0%) | 0 (0.0%) |
| 75 Years and over | 0 (0.0%) | 0 (0.0%) |
Disability Class: Cognitive Difficulty
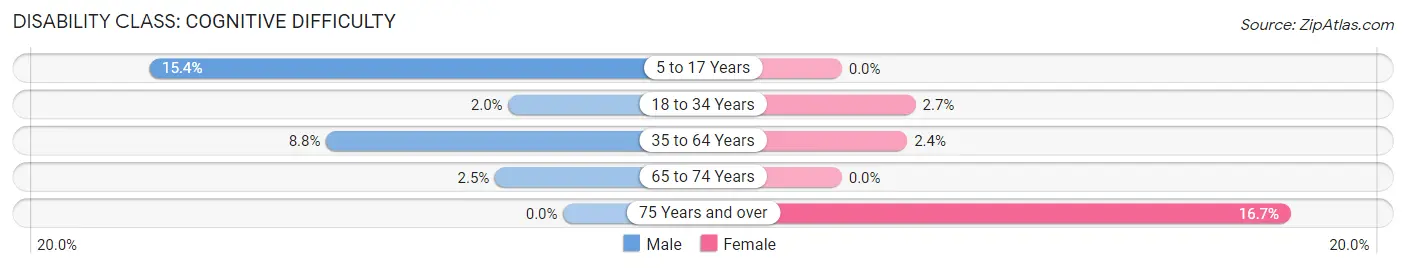
| Age Bracket | Male | Female |
| 5 to 17 Years | 12 (15.4%) | 0 (0.0%) |
| 18 to 34 Years | 3 (2.0%) | 2 (2.7%) |
| 35 to 64 Years | 11 (8.8%) | 5 (2.4%) |
| 65 to 74 Years | 2 (2.5%) | 0 (0.0%) |
| 75 Years and over | 0 (0.0%) | 2 (16.7%) |
Disability Class: Ambulatory Difficulty
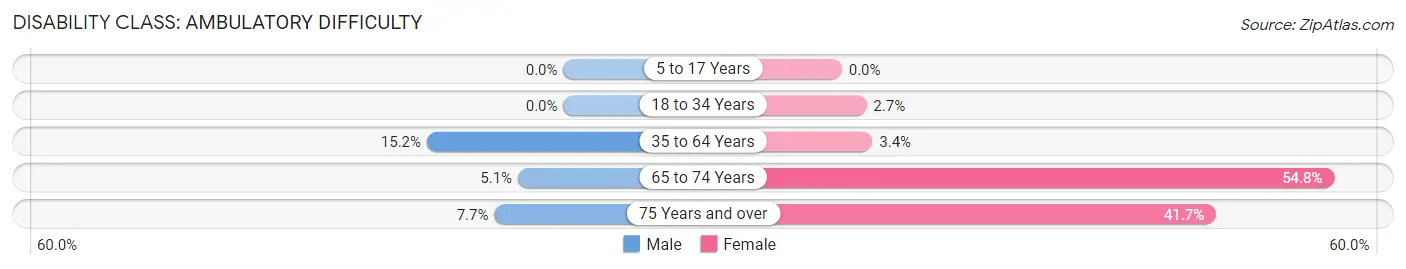
| Age Bracket | Male | Female |
| 5 to 17 Years | 0 (0.0%) | 0 (0.0%) |
| 18 to 34 Years | 0 (0.0%) | 2 (2.7%) |
| 35 to 64 Years | 19 (15.2%) | 7 (3.4%) |
| 65 to 74 Years | 4 (5.1%) | 34 (54.8%) |
| 75 Years and over | 1 (7.7%) | 5 (41.7%) |
Disability Class: Self-Care Difficulty
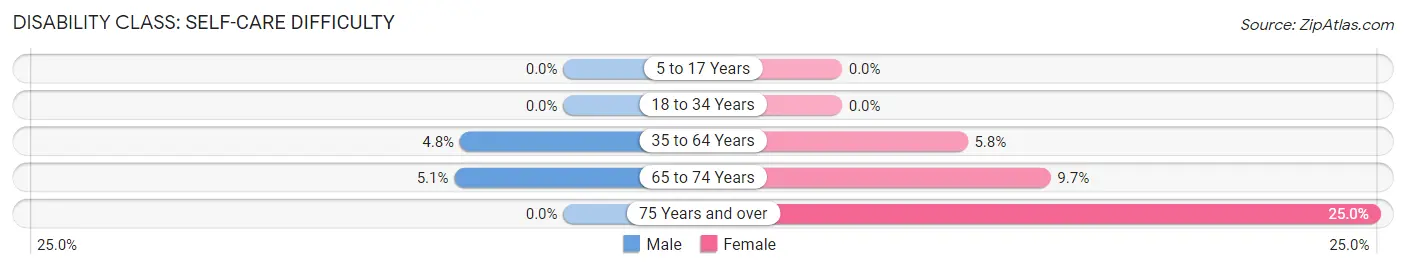
| Age Bracket | Male | Female |
| 5 to 17 Years | 0 (0.0%) | 0 (0.0%) |
| 18 to 34 Years | 0 (0.0%) | 0 (0.0%) |
| 35 to 64 Years | 6 (4.8%) | 12 (5.8%) |
| 65 to 74 Years | 4 (5.1%) | 6 (9.7%) |
| 75 Years and over | 0 (0.0%) | 3 (25.0%) |
Technology Access in Jarratt
Computing Device Access in Jarratt
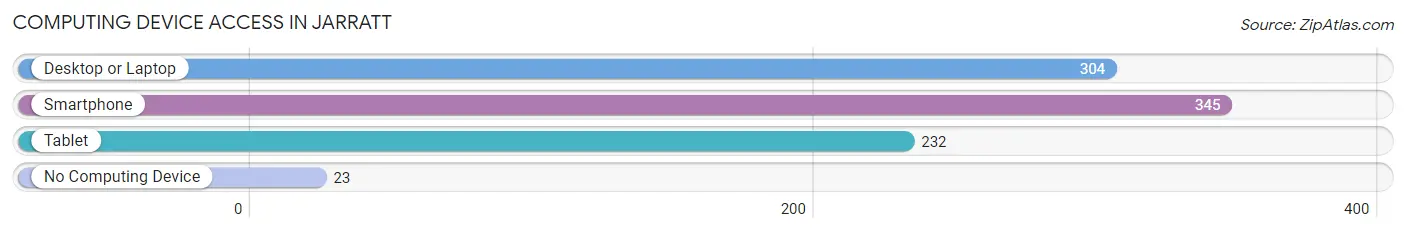
| Device Type | # Households | % Households |
| Desktop or Laptop | 304 | 77.3% |
| Smartphone | 345 | 87.8% |
| Tablet | 232 | 59.0% |
| No Computing Device | 23 | 5.9% |
| Total | 393 | 100.0% |
Internet Access in Jarratt
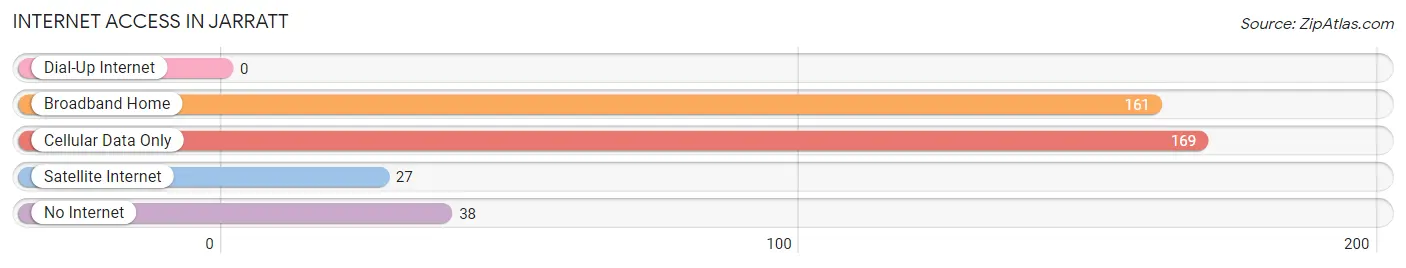
| Internet Type | # Households | % Households |
| Dial-Up Internet | 0 | 0.0% |
| Broadband Home | 161 | 41.0% |
| Cellular Data Only | 169 | 43.0% |
| Satellite Internet | 27 | 6.9% |
| No Internet | 38 | 9.7% |
| Total | 393 | 100.0% |
Jarratt Summary
Jarratt is a small town located in the southeastern part of Virginia, in the United States. It is situated in Sussex County, and is part of the larger Hampton Roads metropolitan area. The town has a population of approximately 1,000 people, and is located about 30 miles south of the state capital, Richmond.
History
Jarratt was first settled in the early 1700s by English colonists. The town was named after the Jarratt family, who were among the first settlers in the area. The town was officially incorporated in 1872.
In the late 1800s, Jarratt was a major stop on the Southside Railroad, which connected Richmond to the Outer Banks of North Carolina. The railroad was a major economic driver for the town, and helped to spur growth in the area.
In the early 1900s, Jarratt was a major hub for the tobacco industry. The town was home to several tobacco warehouses, and was a major center for the sale and distribution of tobacco products.
Geography
Jarratt is located in southeastern Virginia, in Sussex County. The town is situated on the Nottoway River, and is about 30 miles south of the state capital, Richmond. The town is located in a rural area, and is surrounded by farmland and forests.
The climate in Jarratt is humid subtropical, with hot, humid summers and mild winters. The average annual temperature is around 68 degrees Fahrenheit, and the average annual precipitation is around 45 inches.
Economy
The economy of Jarratt is largely based on agriculture and manufacturing. The town is home to several farms, and is a major producer of tobacco, corn, soybeans, and other crops. The town is also home to several manufacturing companies, including a furniture factory and a paper mill.
The town is also home to several small businesses, including restaurants, shops, and other services. The town is also home to a small airport, which serves the surrounding area.
Demographics
As of the 2010 census, the population of Jarratt was 1,000 people. The racial makeup of the town was 79.2% White, 17.2% African American, 0.7% Native American, 0.3% Asian, and 2.6% from other races.
The median household income in Jarratt was $37,500, and the median family income was $41,250. The per capita income in the town was $17,500. The poverty rate in Jarratt was 22.2%.
Conclusion
Jarratt is a small town located in southeastern Virginia, in the United States. The town has a population of approximately 1,000 people, and is located about 30 miles south of the state capital, Richmond. The town has a long history, and was once a major hub for the tobacco industry. The economy of Jarratt is largely based on agriculture and manufacturing, and the town is home to several small businesses. The population of Jarratt is mostly White, with a small African American population. The median household income in Jarratt is $37,500, and the poverty rate is 22.2%.
Common Questions
What is Per Capita Income in Jarratt?
Per Capita income in Jarratt is $32,636.
What is the Median Family Income in Jarratt?
Median Family Income in Jarratt is $81,250.
What is the Median Household income in Jarratt?
Median Household Income in Jarratt is $66,458.
What is Income or Wage Gap in Jarratt?
Income or Wage Gap in Jarratt is 8.3%.
Women in Jarratt earn 91.7 cents for every dollar earned by a man.
What is Inequality or Gini Index in Jarratt?
Inequality or Gini Index in Jarratt is 0.35.
What is the Total Population of Jarratt?
Total Population of Jarratt is 935.
What is the Total Male Population of Jarratt?
Total Male Population of Jarratt is 461.
What is the Total Female Population of Jarratt?
Total Female Population of Jarratt is 474.
What is the Ratio of Males per 100 Females in Jarratt?
There are 97.26 Males per 100 Females in Jarratt.
What is the Ratio of Females per 100 Males in Jarratt?
There are 102.82 Females per 100 Males in Jarratt.
What is the Median Population Age in Jarratt?
Median Population Age in Jarratt is 37.1 Years.
What is the Average Family Size in Jarratt
Average Family Size in Jarratt is 2.7 People.
What is the Average Household Size in Jarratt
Average Household Size in Jarratt is 2.4 People.
How Large is the Labor Force in Jarratt?
There are 574 People in the Labor Forcein in Jarratt.
What is the Percentage of People in the Labor Force in Jarratt?
79.1% of People are in the Labor Force in Jarratt.
What is the Unemployment Rate in Jarratt?
Unemployment Rate in Jarratt is 3.7%.