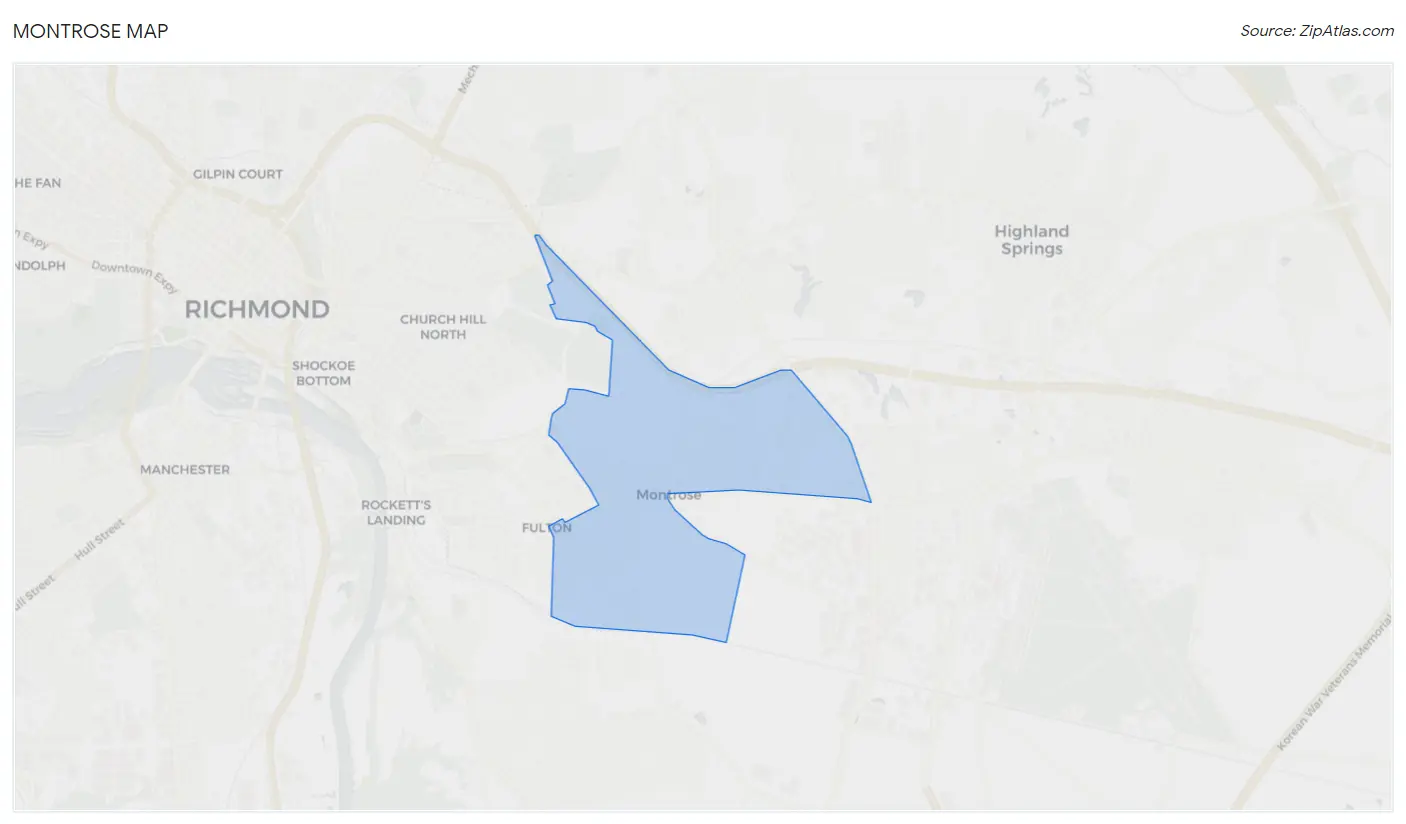
Montrose, VA Map & Demographics
Montrose Map
Montrose Overview
$23,625
PER CAPITA INCOME
$52,960
AVG FAMILY INCOME
$39,023
AVG HOUSEHOLD INCOME
31.9%
WAGE / INCOME GAP [ % ]
68.1¢/ $1
WAGE / INCOME GAP [ $ ]
0.42
INEQUALITY / GINI INDEX
8,363
TOTAL POPULATION
2,894
MALE POPULATION
5,469
FEMALE POPULATION
52.92
MALES / 100 FEMALES
188.98
FEMALES / 100 MALES
39.7
MEDIAN AGE
3.2
AVG FAMILY SIZE
2.3
AVG HOUSEHOLD SIZE
4,065
LABOR FORCE [ PEOPLE ]
59.6%
PERCENT IN LABOR FORCE
4.3%
UNEMPLOYMENT RATE
Income in Montrose
Income Overview in Montrose
Per Capita Income in Montrose is $23,625, while median incomes of families and households are $52,960 and $39,023 respectively.
| Characteristic | Number | Measure |
| Per Capita Income | 8,363 | $23,625 |
| Median Family Income | 2,039 | $52,960 |
| Mean Family Income | 2,039 | $59,772 |
| Median Household Income | 3,589 | $39,023 |
| Mean Household Income | 3,589 | $51,115 |
| Income Deficit | 2,039 | $0 |
| Wage / Income Gap (%) | 8,363 | 31.92% |
| Wage / Income Gap ($) | 8,363 | 68.08¢ per $1 |
| Gini / Inequality Index | 8,363 | 0.42 |
Earnings by Sex in Montrose
Average Earnings in Montrose are $32,790, $43,049 for men and $29,307 for women, a difference of 31.9%.
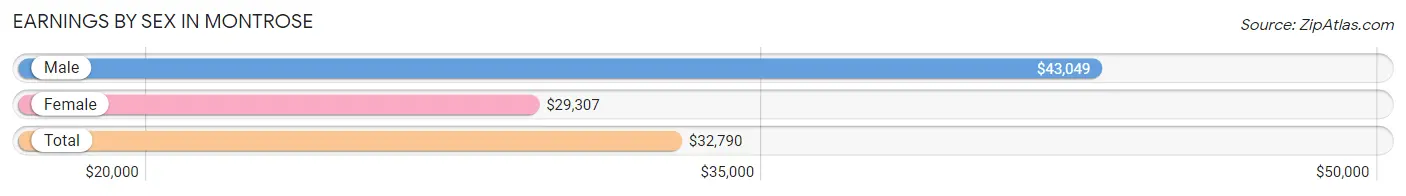
| Sex | Number | Average Earnings |
| Male | 1,525 (37.1%) | $43,049 |
| Female | 2,587 (62.9%) | $29,307 |
| Total | 4,112 (100.0%) | $32,790 |
Earnings by Sex by Income Bracket in Montrose
The most common earnings brackets in Montrose are $75,000 to $99,999 for men (177 | 11.6%) and $30,000 to $34,999 for women (398 | 15.4%).
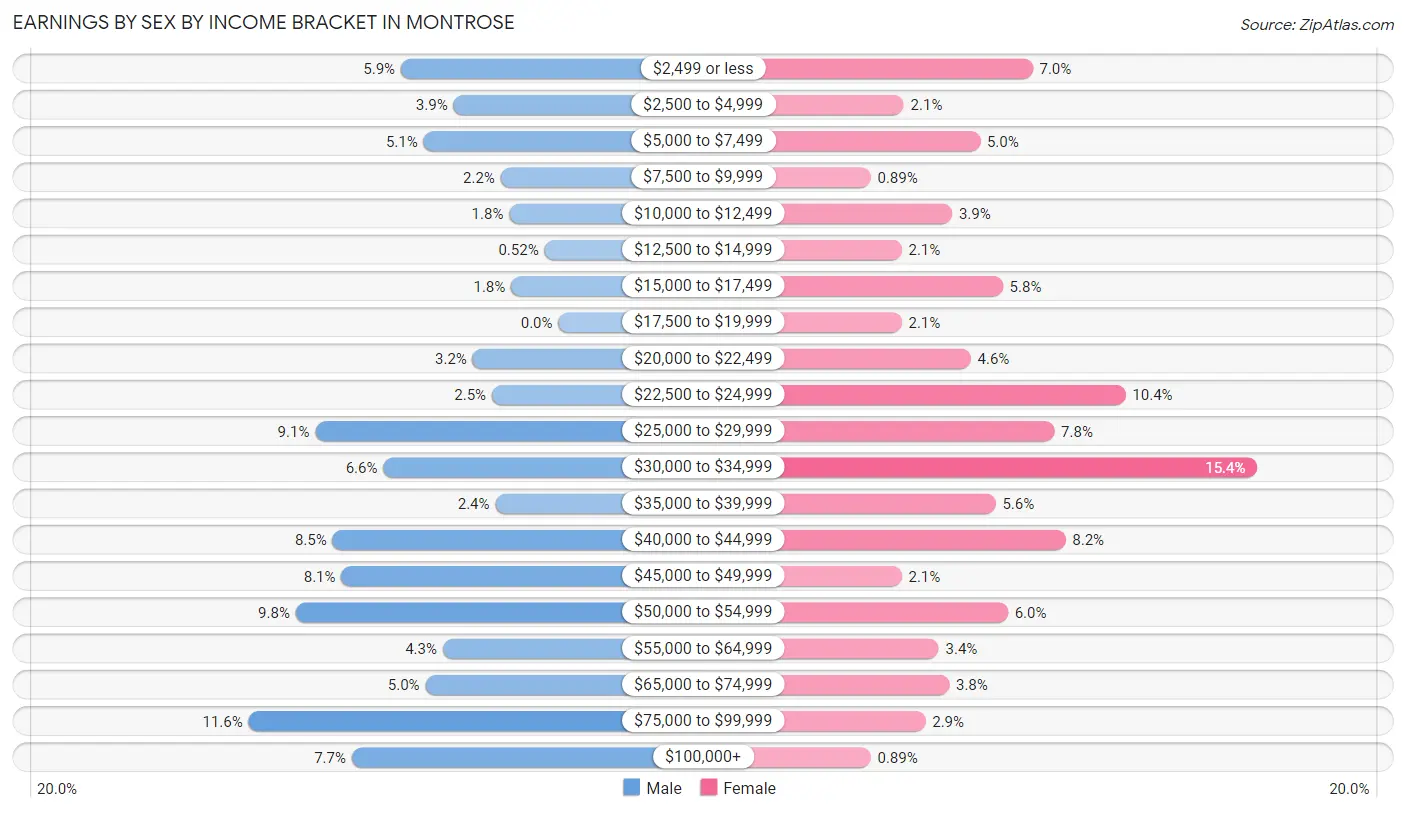
| Income | Male | Female |
| $2,499 or less | 90 (5.9%) | 180 (7.0%) |
| $2,500 to $4,999 | 60 (3.9%) | 55 (2.1%) |
| $5,000 to $7,499 | 77 (5.1%) | 129 (5.0%) |
| $7,500 to $9,999 | 33 (2.2%) | 23 (0.9%) |
| $10,000 to $12,499 | 28 (1.8%) | 102 (3.9%) |
| $12,500 to $14,999 | 8 (0.5%) | 53 (2.1%) |
| $15,000 to $17,499 | 27 (1.8%) | 151 (5.8%) |
| $17,500 to $19,999 | 0 (0.0%) | 53 (2.1%) |
| $20,000 to $22,499 | 49 (3.2%) | 120 (4.6%) |
| $22,500 to $24,999 | 38 (2.5%) | 270 (10.4%) |
| $25,000 to $29,999 | 139 (9.1%) | 201 (7.8%) |
| $30,000 to $34,999 | 100 (6.6%) | 398 (15.4%) |
| $35,000 to $39,999 | 36 (2.4%) | 144 (5.6%) |
| $40,000 to $44,999 | 129 (8.5%) | 212 (8.2%) |
| $45,000 to $49,999 | 124 (8.1%) | 53 (2.1%) |
| $50,000 to $54,999 | 150 (9.8%) | 156 (6.0%) |
| $55,000 to $64,999 | 66 (4.3%) | 89 (3.4%) |
| $65,000 to $74,999 | 76 (5.0%) | 99 (3.8%) |
| $75,000 to $99,999 | 177 (11.6%) | 76 (2.9%) |
| $100,000+ | 118 (7.7%) | 23 (0.9%) |
| Total | 1,525 (100.0%) | 2,587 (100.0%) |
Earnings by Sex by Educational Attainment in Montrose
Average earnings in Montrose are $47,674 for men and $32,807 for women, a difference of 31.2%. Men with an educational attainment of bachelor's degree enjoy the highest average annual earnings of $77,769, while those with less than high school education earn the least with $38,594. Women with an educational attainment of graduate degree earn the most with the average annual earnings of $68,542, while those with high school diploma education have the smallest earnings of $29,523.
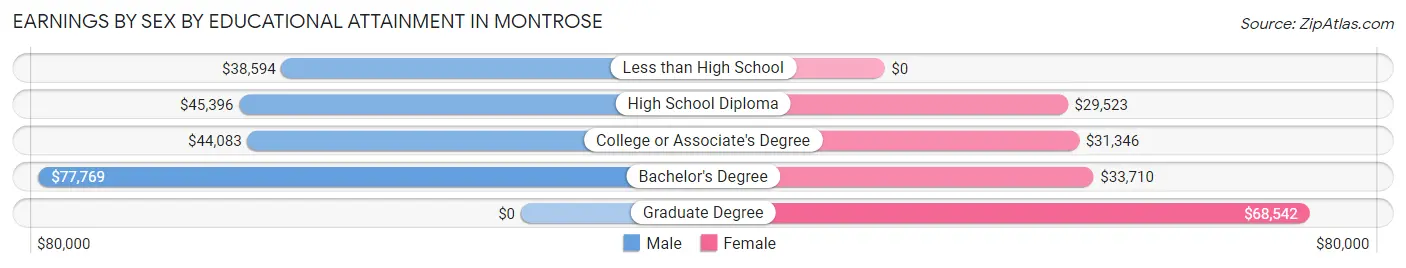
| Educational Attainment | Male Income | Female Income |
| Less than High School | $38,594 | $0 |
| High School Diploma | $45,396 | $29,523 |
| College or Associate's Degree | $44,083 | $31,346 |
| Bachelor's Degree | $77,769 | $33,710 |
| Graduate Degree | - | - |
| Total | $47,674 | $32,807 |
Family Income in Montrose
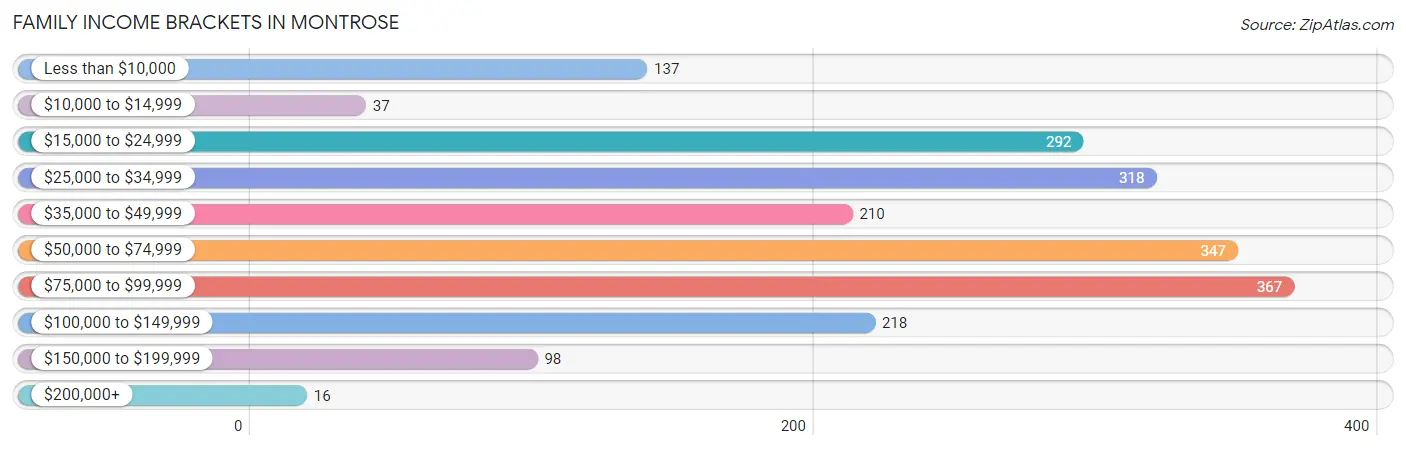
Family Income Brackets in Montrose
According to the Montrose family income data, there are 367 families falling into the $75,000 to $99,999 income range, which is the most common income bracket and makes up 18.0% of all families. Conversely, the $200,000+ income bracket is the least frequent group with only 16 families (0.8%) belonging to this category.
| Income Bracket | # Families | % Families |
| Less than $10,000 | 137 | 6.7% |
| $10,000 to $14,999 | 37 | 1.8% |
| $15,000 to $24,999 | 292 | 14.3% |
| $25,000 to $34,999 | 318 | 15.6% |
| $35,000 to $49,999 | 210 | 10.3% |
| $50,000 to $74,999 | 347 | 17.0% |
| $75,000 to $99,999 | 367 | 18.0% |
| $100,000 to $149,999 | 218 | 10.7% |
| $150,000 to $199,999 | 98 | 4.8% |
| $200,000+ | 16 | 0.8% |
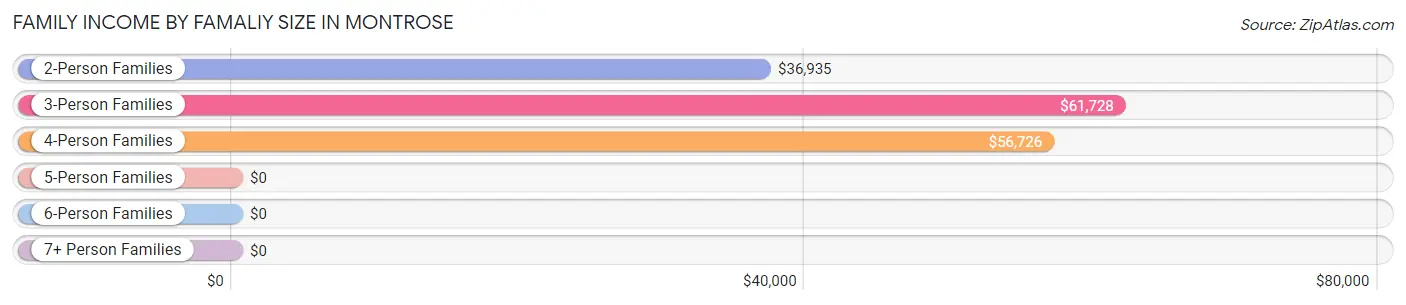
Family Income by Famaliy Size in Montrose
3-person families (523 | 25.7%) account for the highest median family income in Montrose with $61,728 per family, while 3-person families (523 | 25.7%) have the highest median income of $20,576 per family member.
| Income Bracket | # Families | Median Income |
| 2-Person Families | 1,078 (52.9%) | $36,935 |
| 3-Person Families | 523 (25.7%) | $61,728 |
| 4-Person Families | 184 (9.0%) | $56,726 |
| 5-Person Families | 166 (8.1%) | $0 |
| 6-Person Families | 52 (2.5%) | $0 |
| 7+ Person Families | 36 (1.8%) | $0 |
| Total | 2,039 (100.0%) | $52,960 |
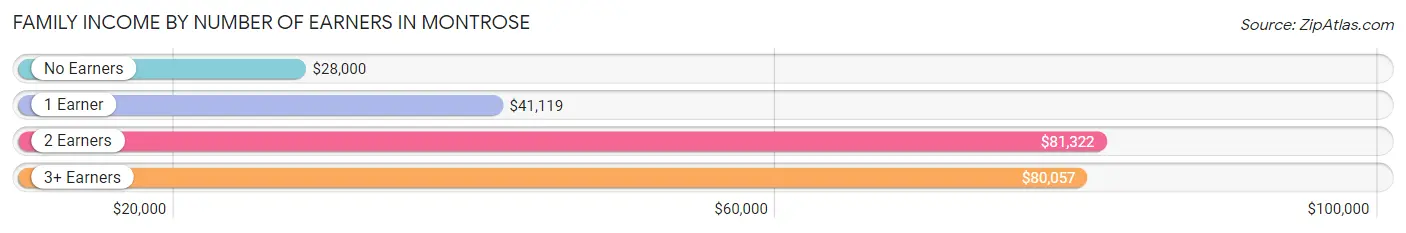
Family Income by Number of Earners in Montrose
The median family income in Montrose is $52,960, with families comprising 2 earners (380) having the highest median family income of $81,322, while families with no earners (404) have the lowest median family income of $28,000, accounting for 18.6% and 19.8% of families, respectively.
| Number of Earners | # Families | Median Income |
| No Earners | 404 (19.8%) | $28,000 |
| 1 Earner | 1,000 (49.0%) | $41,119 |
| 2 Earners | 380 (18.6%) | $81,322 |
| 3+ Earners | 255 (12.5%) | $80,057 |
| Total | 2,039 (100.0%) | $52,960 |
Household Income in Montrose
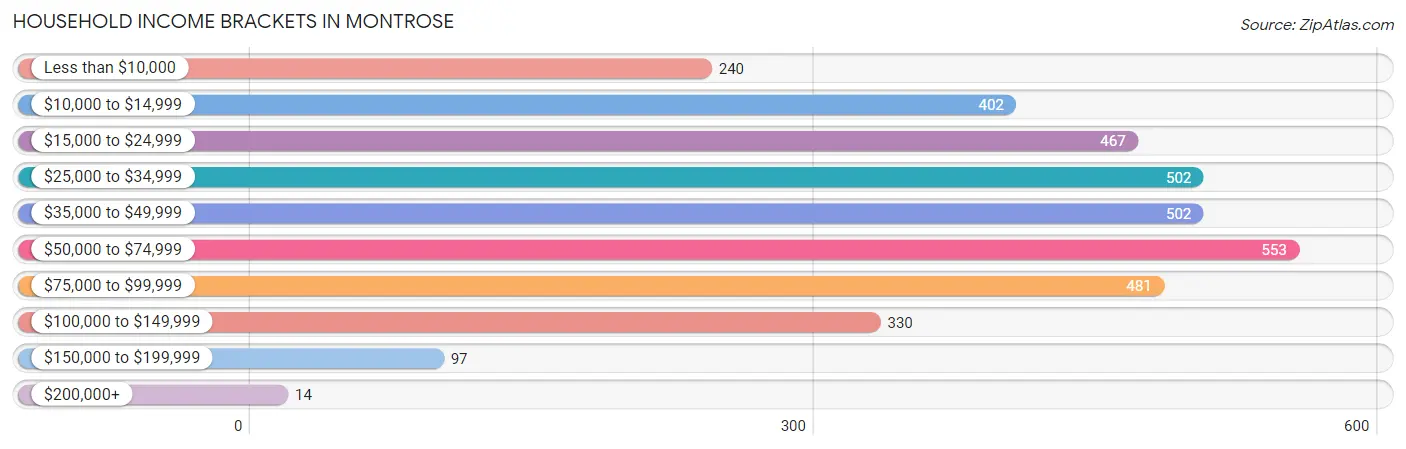
Household Income Brackets in Montrose
With 553 households falling in the category, the $50,000 to $74,999 income range is the most frequent in Montrose, accounting for 15.4% of all households. In contrast, only 14 households (0.4%) fall into the $200,000+ income bracket, making it the least populous group.
| Income Bracket | # Households | % Households |
| Less than $10,000 | 240 | 6.7% |
| $10,000 to $14,999 | 402 | 11.2% |
| $15,000 to $24,999 | 467 | 13.0% |
| $25,000 to $34,999 | 502 | 14.0% |
| $35,000 to $49,999 | 502 | 14.0% |
| $50,000 to $74,999 | 553 | 15.4% |
| $75,000 to $99,999 | 481 | 13.4% |
| $100,000 to $149,999 | 330 | 9.2% |
| $150,000 to $199,999 | 97 | 2.7% |
| $200,000+ | 14 | 0.4% |
Household Income by Householder Age in Montrose
The median household income in Montrose is $39,023, with the highest median household income of $52,736 found in the 25 to 44 years age bracket for the primary householder. A total of 1,297 households (36.1%) fall into this category. Meanwhile, the 15 to 24 years age bracket for the primary householder has the lowest median household income of $0, with 88 households (2.5%) in this group.
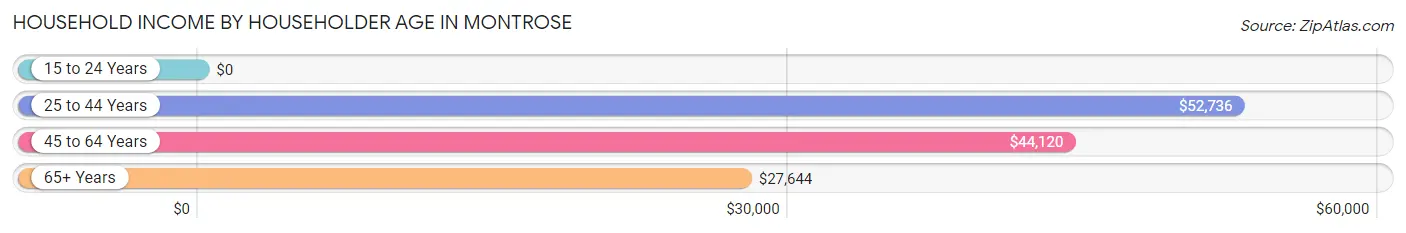
| Income Bracket | # Households | Median Income |
| 15 to 24 Years | 88 (2.5%) | $0 |
| 25 to 44 Years | 1,297 (36.1%) | $52,736 |
| 45 to 64 Years | 1,155 (32.2%) | $44,120 |
| 65+ Years | 1,049 (29.2%) | $27,644 |
| Total | 3,589 (100.0%) | $39,023 |
Poverty in Montrose
Income Below Poverty by Sex and Age in Montrose
With 19.8% poverty level for males and 27.1% for females among the residents of Montrose, 16 and 17 year old males and 15 year old females are the most vulnerable to poverty, with 80 males (64.0%) and 62 females (100.0%) in their respective age groups living below the poverty level.
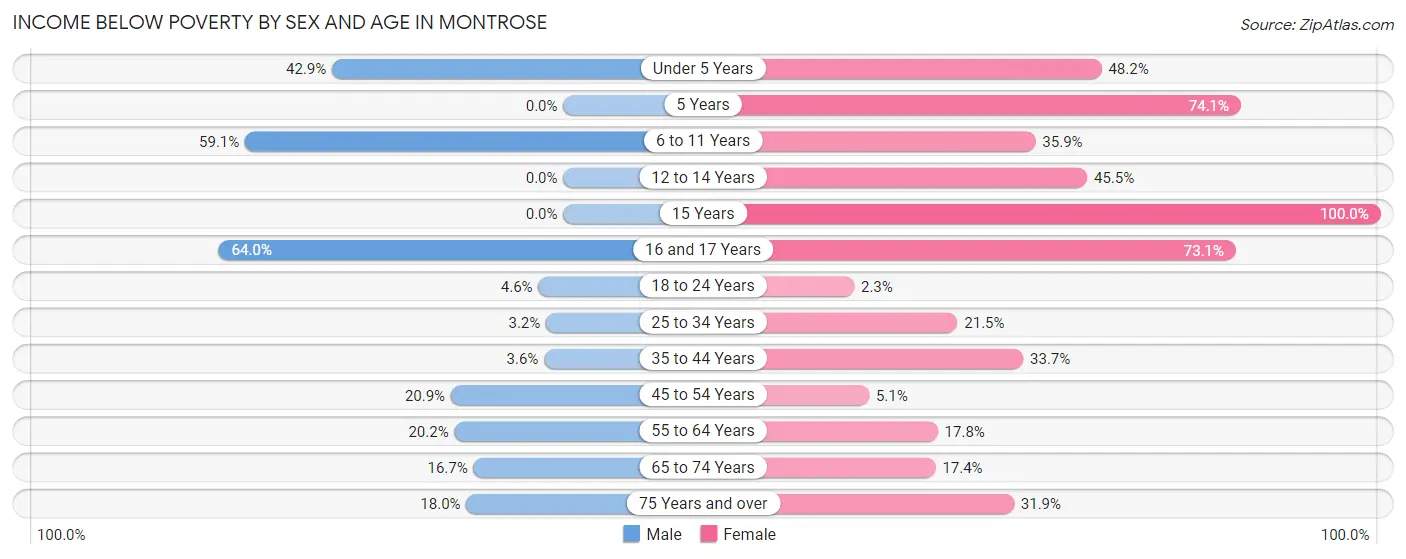
| Age Bracket | Male | Female |
| Under 5 Years | 70 (42.9%) | 161 (48.2%) |
| 5 Years | 0 (0.0%) | 80 (74.1%) |
| 6 to 11 Years | 153 (59.1%) | 78 (35.9%) |
| 12 to 14 Years | 0 (0.0%) | 117 (45.5%) |
| 15 Years | 0 (0.0%) | 62 (100.0%) |
| 16 and 17 Years | 80 (64.0%) | 128 (73.1%) |
| 18 to 24 Years | 13 (4.6%) | 12 (2.3%) |
| 25 to 34 Years | 9 (3.2%) | 127 (21.4%) |
| 35 to 44 Years | 16 (3.6%) | 308 (33.7%) |
| 45 to 54 Years | 107 (20.9%) | 25 (5.1%) |
| 55 to 64 Years | 58 (20.2%) | 124 (17.8%) |
| 65 to 74 Years | 34 (16.7%) | 102 (17.4%) |
| 75 Years and over | 34 (18.0%) | 160 (31.9%) |
| Total | 574 (19.8%) | 1,484 (27.1%) |
Income Above Poverty by Sex and Age in Montrose
According to the poverty statistics in Montrose, males aged 5 years and females aged 18 to 24 years are the age groups that are most secure financially, with 100.0% of males and 97.7% of females in these age groups living above the poverty line.
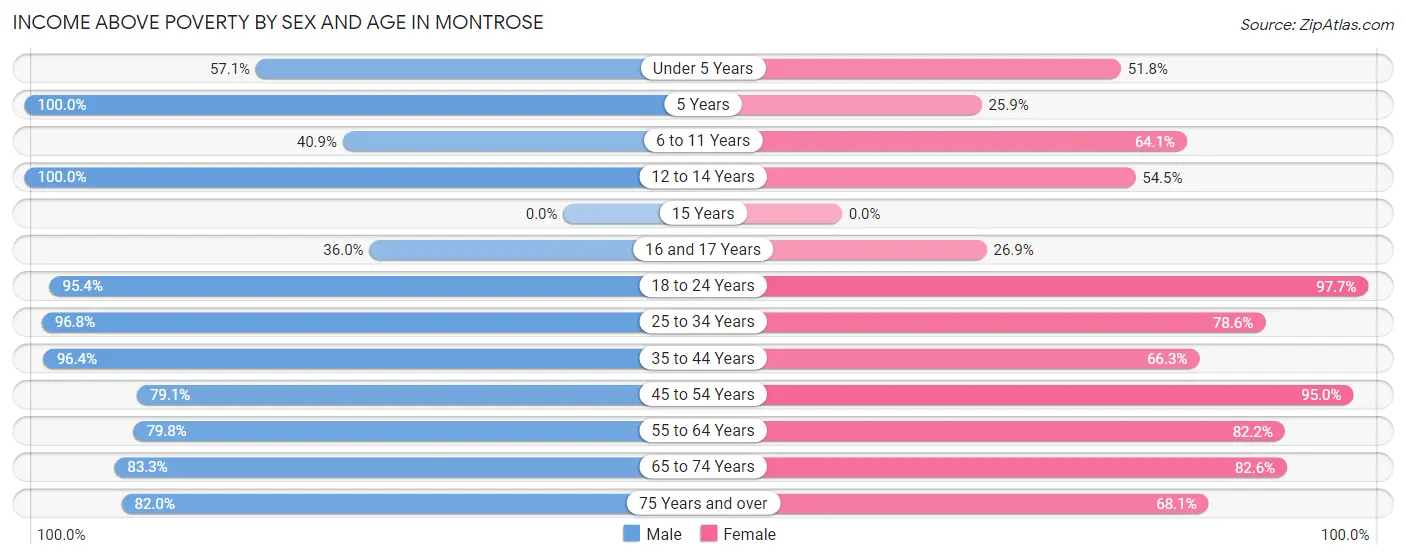
| Age Bracket | Male | Female |
| Under 5 Years | 93 (57.1%) | 173 (51.8%) |
| 5 Years | 27 (100.0%) | 28 (25.9%) |
| 6 to 11 Years | 106 (40.9%) | 139 (64.1%) |
| 12 to 14 Years | 116 (100.0%) | 140 (54.5%) |
| 15 Years | 0 (0.0%) | 0 (0.0%) |
| 16 and 17 Years | 45 (36.0%) | 47 (26.9%) |
| 18 to 24 Years | 268 (95.4%) | 517 (97.7%) |
| 25 to 34 Years | 272 (96.8%) | 465 (78.5%) |
| 35 to 44 Years | 433 (96.4%) | 607 (66.3%) |
| 45 to 54 Years | 406 (79.1%) | 470 (95.0%) |
| 55 to 64 Years | 229 (79.8%) | 573 (82.2%) |
| 65 to 74 Years | 170 (83.3%) | 485 (82.6%) |
| 75 Years and over | 155 (82.0%) | 341 (68.1%) |
| Total | 2,320 (80.2%) | 3,985 (72.9%) |
Income Below Poverty Among Married-Couple Families in Montrose
The poverty statistics for married-couple families in Montrose show that 3.1% or 22 of the total 720 families live below the poverty line. Families with 1 or 2 children have the highest poverty rate of 21.6%, comprising of 16 families. On the other hand, families with 3 or 4 children have the lowest poverty rate of 0.0%, which includes 0 families.
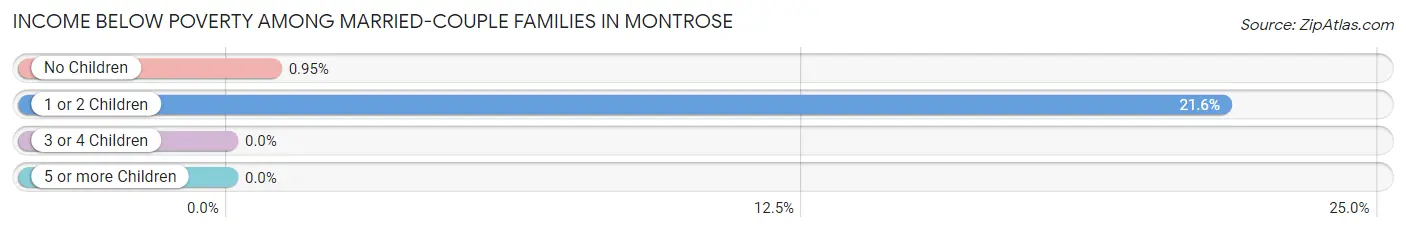
| Children | Above Poverty | Below Poverty |
| No Children | 623 (99.1%) | 6 (0.9%) |
| 1 or 2 Children | 58 (78.4%) | 16 (21.6%) |
| 3 or 4 Children | 17 (100.0%) | 0 (0.0%) |
| 5 or more Children | 0 (0.0%) | 0 (0.0%) |
| Total | 698 (96.9%) | 22 (3.1%) |
Income Below Poverty Among Single-Parent Households in Montrose
According to the poverty data in Montrose, 12.0% or 36 single-father households and 34.8% or 355 single-mother households are living below the poverty line. Among single-father households, those with no children have the highest poverty rate, with 28 households (14.1%) experiencing poverty. Likewise, among single-mother households, those with 3 or 4 children have the highest poverty rate, with 144 households (62.6%) falling below the poverty line.
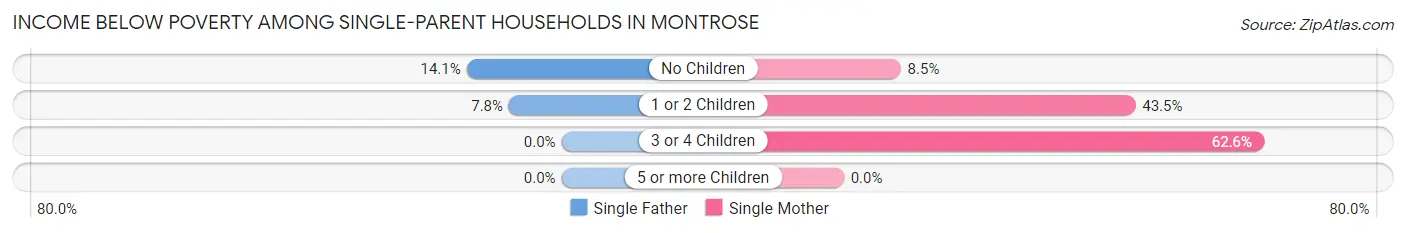
| Children | Single Father | Single Mother |
| No Children | 28 (14.1%) | 32 (8.5%) |
| 1 or 2 Children | 8 (7.8%) | 179 (43.4%) |
| 3 or 4 Children | 0 (0.0%) | 144 (62.6%) |
| 5 or more Children | 0 (0.0%) | 0 (0.0%) |
| Total | 36 (12.0%) | 355 (34.8%) |
Income Below Poverty Among Married-Couple vs Single-Parent Households in Montrose
The poverty data for Montrose shows that 22 of the married-couple family households (3.1%) and 391 of the single-parent households (29.6%) are living below the poverty level. Within the married-couple family households, those with 1 or 2 children have the highest poverty rate, with 16 households (21.6%) falling below the poverty line. Among the single-parent households, those with 3 or 4 children have the highest poverty rate, with 144 household (62.6%) living below poverty.
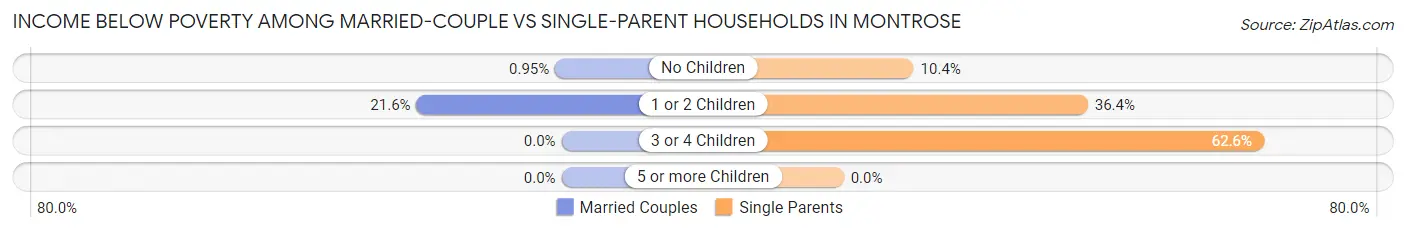
| Children | Married-Couple Families | Single-Parent Households |
| No Children | 6 (0.9%) | 60 (10.4%) |
| 1 or 2 Children | 16 (21.6%) | 187 (36.4%) |
| 3 or 4 Children | 0 (0.0%) | 144 (62.6%) |
| 5 or more Children | 0 (0.0%) | 0 (0.0%) |
| Total | 22 (3.1%) | 391 (29.6%) |
Race in Montrose
The most populous races in Montrose are Black / African American (6,176 | 73.9%), White / Caucasian (1,441 | 17.2%), and Two or more Races (413 | 4.9%).
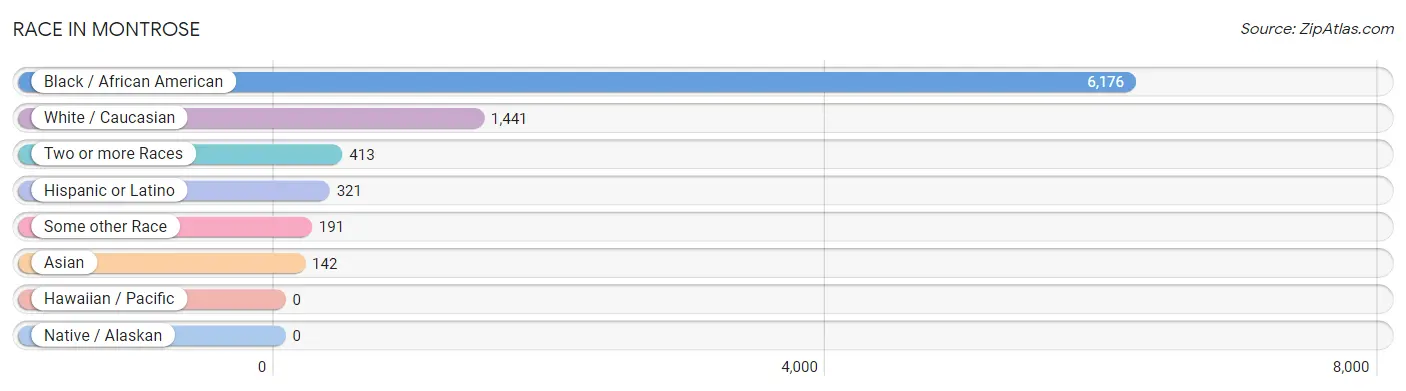
| Race | # Population | % Population |
| Asian | 142 | 1.7% |
| Black / African American | 6,176 | 73.9% |
| Hawaiian / Pacific | 0 | 0.0% |
| Hispanic or Latino | 321 | 3.8% |
| Native / Alaskan | 0 | 0.0% |
| White / Caucasian | 1,441 | 17.2% |
| Two or more Races | 413 | 4.9% |
| Some other Race | 191 | 2.3% |
| Total | 8,363 | 100.0% |
Ancestry in Montrose
The most populous ancestries reported in Montrose are Subsaharan African (616 | 7.4%), African (512 | 6.1%), American (397 | 4.8%), Irish (259 | 3.1%), and Mexican (186 | 2.2%), together accounting for 23.6% of all Montrose residents.
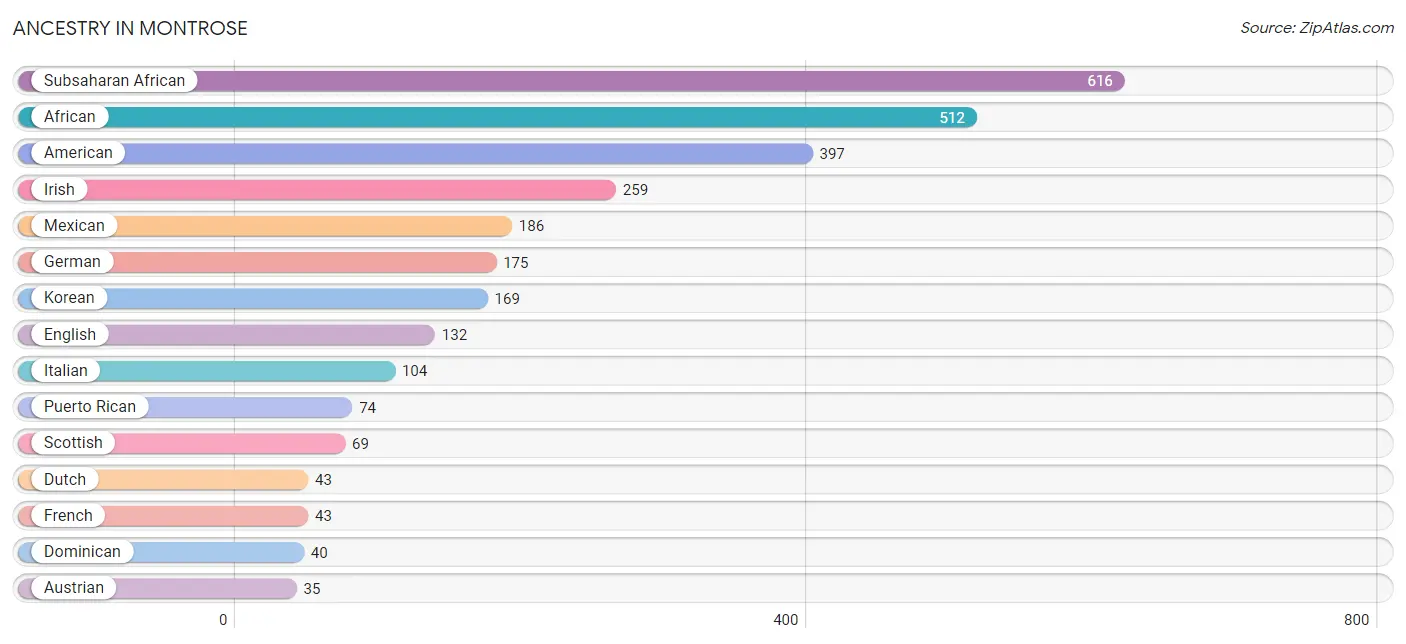
| Ancestry | # Population | % Population |
| African | 512 | 6.1% |
| American | 397 | 4.8% |
| Austrian | 35 | 0.4% |
| Burmese | 15 | 0.2% |
| Central American | 21 | 0.3% |
| Costa Rican | 21 | 0.3% |
| Dominican | 40 | 0.5% |
| Dutch | 43 | 0.5% |
| English | 132 | 1.6% |
| European | 32 | 0.4% |
| Filipino | 8 | 0.1% |
| Finnish | 10 | 0.1% |
| French | 43 | 0.5% |
| German | 175 | 2.1% |
| Greek | 11 | 0.1% |
| Irish | 259 | 3.1% |
| Italian | 104 | 1.2% |
| Japanese | 10 | 0.1% |
| Korean | 169 | 2.0% |
| Lithuanian | 9 | 0.1% |
| Mexican | 186 | 2.2% |
| Polish | 13 | 0.2% |
| Puerto Rican | 74 | 0.9% |
| Scotch-Irish | 25 | 0.3% |
| Scottish | 69 | 0.8% |
| Subsaharan African | 616 | 7.4% |
| Swedish | 7 | 0.1% |
| Trinidadian and Tobagonian | 25 | 0.3% |
| Ukrainian | 8 | 0.1% |
| Welsh | 10 | 0.1% | View All 30 Rows |
Immigrants in Montrose
The most numerous immigrant groups reported in Montrose came from Latin America (189 | 2.3%), Asia (145 | 1.7%), South Eastern Asia (138 | 1.7%), Philippines (128 | 1.5%), and Central America (124 | 1.5%), together accounting for 8.6% of all Montrose residents.
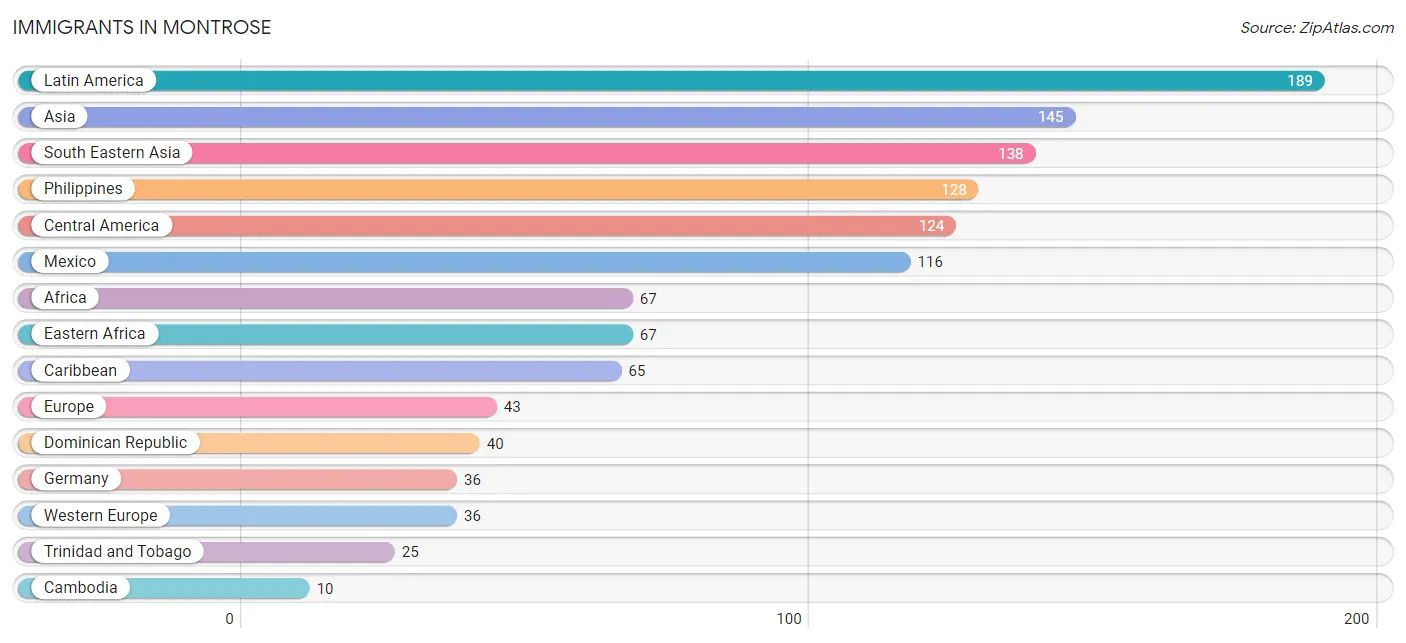
| Immigration Origin | # Population | % Population |
| Africa | 67 | 0.8% |
| Asia | 145 | 1.7% |
| Cambodia | 10 | 0.1% |
| Canada | 8 | 0.1% |
| Caribbean | 65 | 0.8% |
| Central America | 124 | 1.5% |
| Dominican Republic | 40 | 0.5% |
| Eastern Africa | 67 | 0.8% |
| Eastern Asia | 7 | 0.1% |
| El Salvador | 8 | 0.1% |
| Europe | 43 | 0.5% |
| Germany | 36 | 0.4% |
| Korea | 7 | 0.1% |
| Latin America | 189 | 2.3% |
| Mexico | 116 | 1.4% |
| Northern Europe | 7 | 0.1% |
| Philippines | 128 | 1.5% |
| South Eastern Asia | 138 | 1.7% |
| Trinidad and Tobago | 25 | 0.3% |
| Western Europe | 36 | 0.4% | View All 20 Rows |
Sex and Age in Montrose
Sex and Age in Montrose
The most populous age groups in Montrose are 50 to 54 Years (330 | 11.4%) for men and 40 to 44 Years (498 | 9.1%) for women.
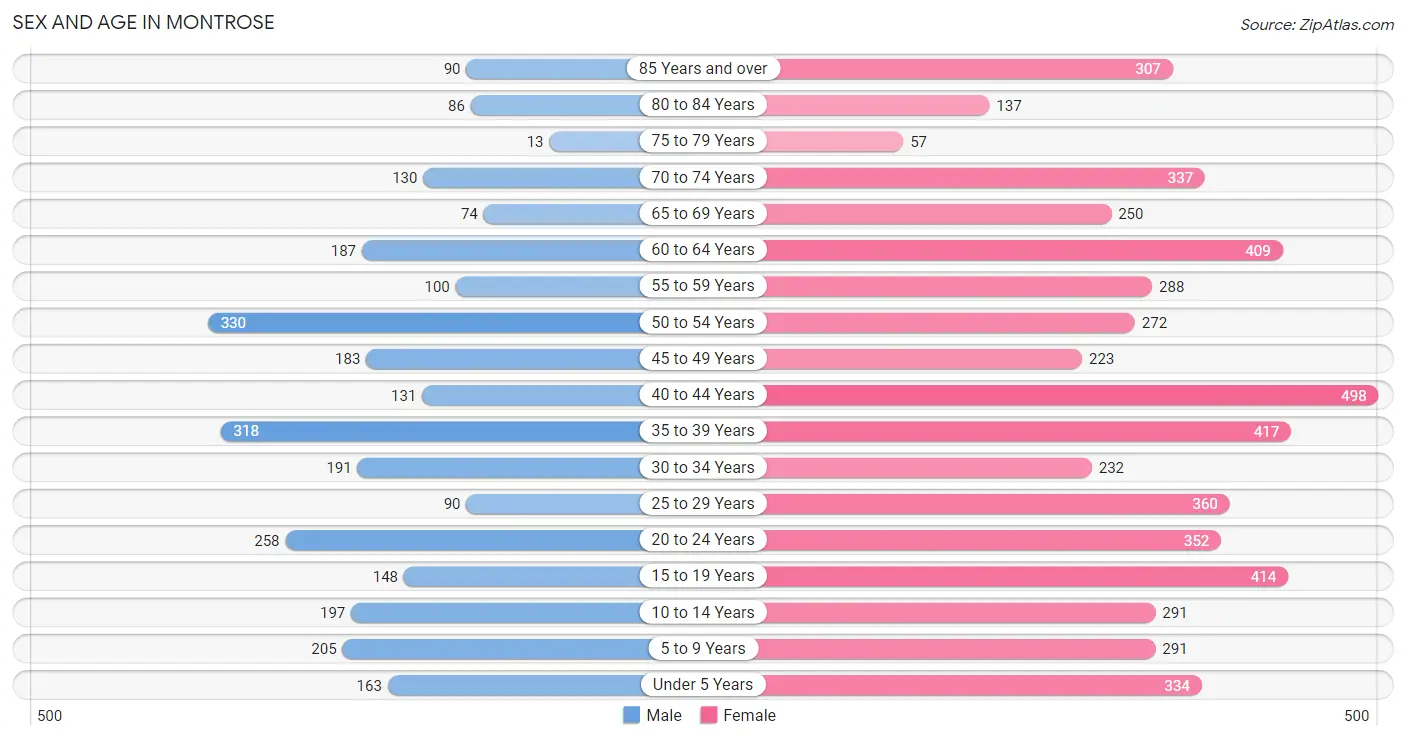
| Age Bracket | Male | Female |
| Under 5 Years | 163 (5.6%) | 334 (6.1%) |
| 5 to 9 Years | 205 (7.1%) | 291 (5.3%) |
| 10 to 14 Years | 197 (6.8%) | 291 (5.3%) |
| 15 to 19 Years | 148 (5.1%) | 414 (7.6%) |
| 20 to 24 Years | 258 (8.9%) | 352 (6.4%) |
| 25 to 29 Years | 90 (3.1%) | 360 (6.6%) |
| 30 to 34 Years | 191 (6.6%) | 232 (4.2%) |
| 35 to 39 Years | 318 (11.0%) | 417 (7.6%) |
| 40 to 44 Years | 131 (4.5%) | 498 (9.1%) |
| 45 to 49 Years | 183 (6.3%) | 223 (4.1%) |
| 50 to 54 Years | 330 (11.4%) | 272 (5.0%) |
| 55 to 59 Years | 100 (3.5%) | 288 (5.3%) |
| 60 to 64 Years | 187 (6.5%) | 409 (7.5%) |
| 65 to 69 Years | 74 (2.6%) | 250 (4.6%) |
| 70 to 74 Years | 130 (4.5%) | 337 (6.2%) |
| 75 to 79 Years | 13 (0.4%) | 57 (1.0%) |
| 80 to 84 Years | 86 (3.0%) | 137 (2.5%) |
| 85 Years and over | 90 (3.1%) | 307 (5.6%) |
| Total | 2,894 (100.0%) | 5,469 (100.0%) |
Families and Households in Montrose
Median Family Size in Montrose
The median family size in Montrose is 3.20 persons per family, with single female/mother families (1,019 | 50.0%) accounting for the largest median family size of 3.69 persons per family. On the other hand, married-couple families (720 | 35.3%) represent the smallest median family size with 2.63 persons per family.
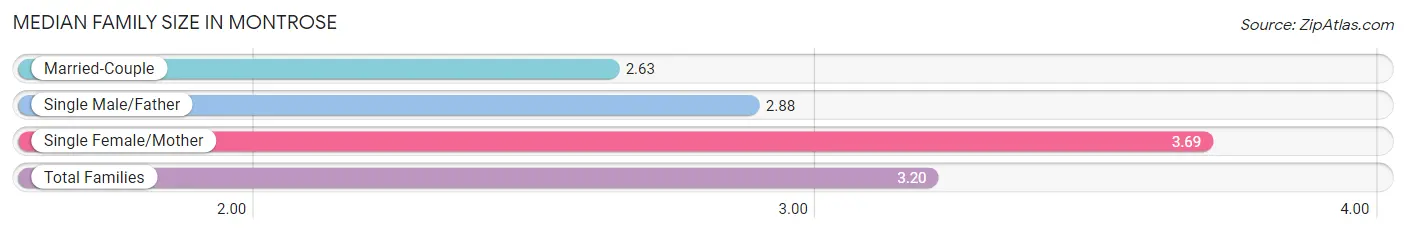
| Family Type | # Families | Family Size |
| Married-Couple | 720 (35.3%) | 2.63 |
| Single Male/Father | 300 (14.7%) | 2.88 |
| Single Female/Mother | 1,019 (50.0%) | 3.69 |
| Total Families | 2,039 (100.0%) | 3.20 |
Median Household Size in Montrose
The median household size in Montrose is 2.33 persons per household, with single female/mother households (1,019 | 28.4%) accounting for the largest median household size of 3.75 persons per household. non-family households (1,550 | 43.2%) represent the smallest median household size with 1.10 persons per household.
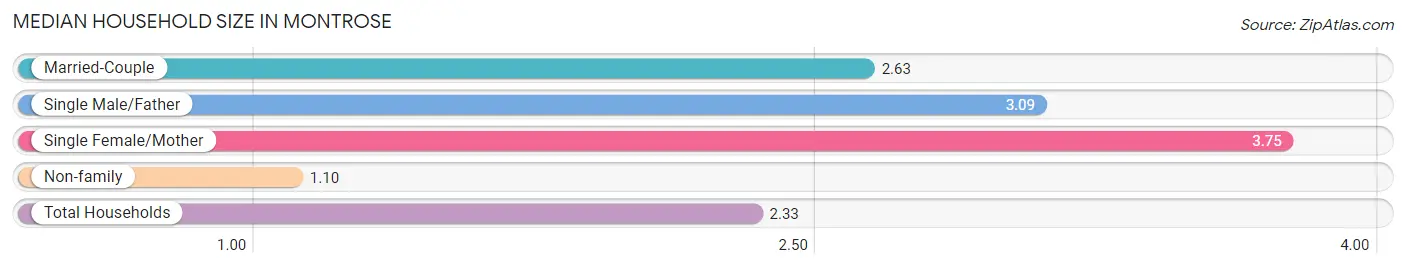
| Household Type | # Households | Household Size |
| Married-Couple | 720 (20.1%) | 2.63 |
| Single Male/Father | 300 (8.4%) | 3.09 |
| Single Female/Mother | 1,019 (28.4%) | 3.75 |
| Non-family | 1,550 (43.2%) | 1.10 |
| Total Households | 3,589 (100.0%) | 2.33 |
Household Size by Marriage Status in Montrose
Out of a total of 3,589 households in Montrose, 2,039 (56.8%) are family households, while 1,550 (43.2%) are nonfamily households. The most numerous type of family households are 2-person households, comprising 1,046, and the most common type of nonfamily households are 1-person households, comprising 1,402.
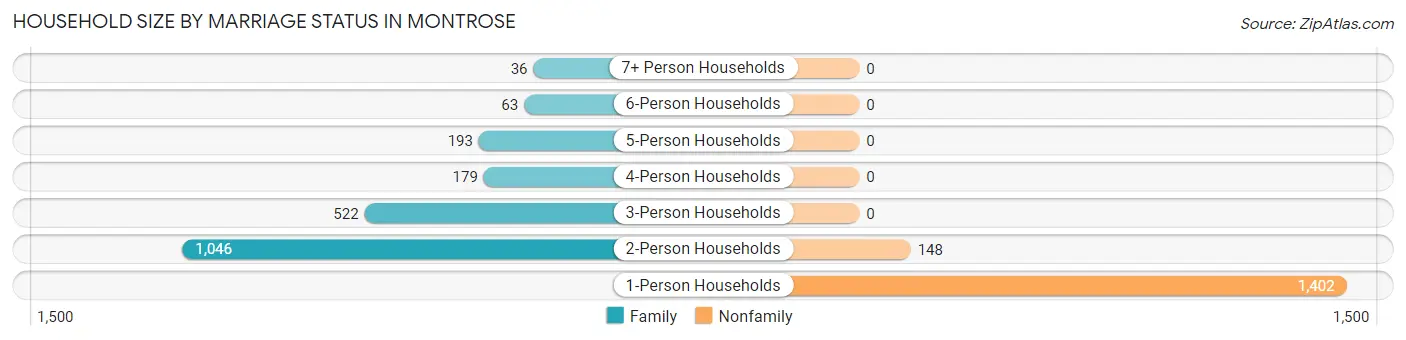
| Household Size | Family Households | Nonfamily Households |
| 1-Person Households | - | 1,402 (39.1%) |
| 2-Person Households | 1,046 (29.1%) | 148 (4.1%) |
| 3-Person Households | 522 (14.5%) | 0 (0.0%) |
| 4-Person Households | 179 (5.0%) | 0 (0.0%) |
| 5-Person Households | 193 (5.4%) | 0 (0.0%) |
| 6-Person Households | 63 (1.8%) | 0 (0.0%) |
| 7+ Person Households | 36 (1.0%) | 0 (0.0%) |
| Total | 2,039 (56.8%) | 1,550 (43.2%) |
Female Fertility in Montrose
Fertility by Age in Montrose
Average fertility rate in Montrose is 36.0 births per 1,000 women. Women in the age bracket of 35 to 50 years have the highest fertility rate with 61.0 births per 1,000 women. Women in the age bracket of 35 to 50 years acount for 80.4% of all women with births.
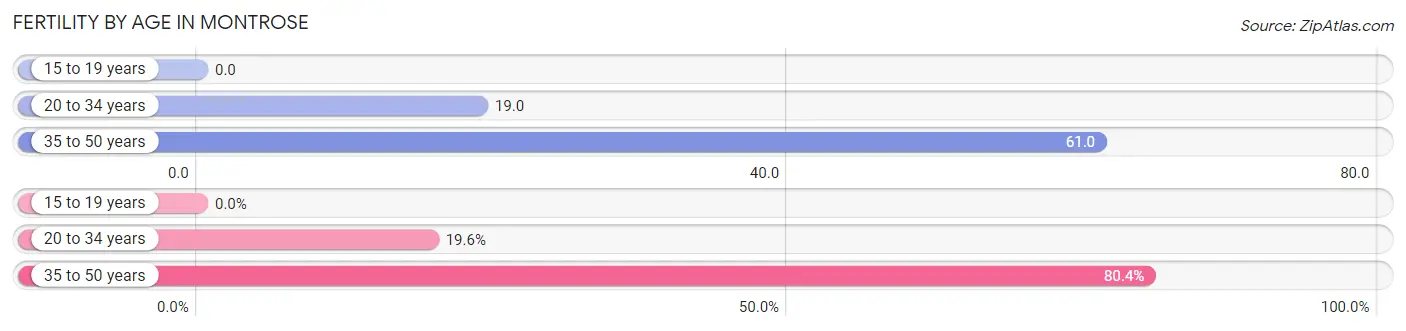
| Age Bracket | Women with Births | Births / 1,000 Women |
| 15 to 19 years | 0 (0.0%) | 0.0 |
| 20 to 34 years | 18 (19.6%) | 19.0 |
| 35 to 50 years | 74 (80.4%) | 61.0 |
| Total | 92 (100.0%) | 36.0 |
Fertility by Age by Marriage Status in Montrose
68.5% of women with births (92) in Montrose are married. The highest percentage of unmarried women with births falls into 35 to 50 years age bracket with 39.2% of them unmarried at the time of birth, while the lowest percentage of unmarried women with births belong to 20 to 34 years age bracket with 0.0% of them unmarried.
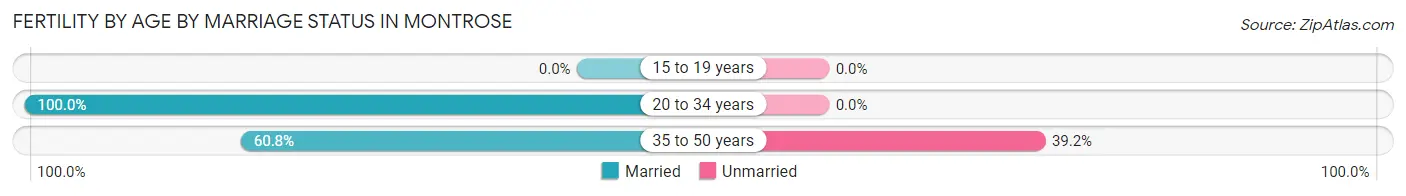
| Age Bracket | Married | Unmarried |
| 15 to 19 years | 0 (0.0%) | 0 (0.0%) |
| 20 to 34 years | 18 (100.0%) | 0 (0.0%) |
| 35 to 50 years | 45 (60.8%) | 29 (39.2%) |
| Total | 63 (68.5%) | 29 (31.5%) |
Fertility by Education in Montrose
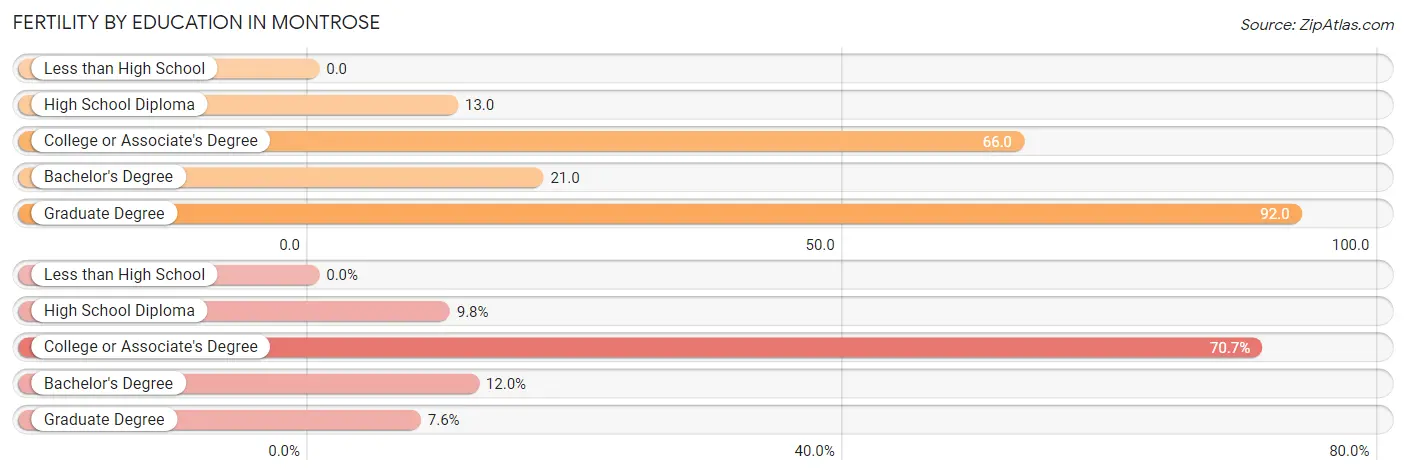
| Educational Attainment | Women with Births | Births / 1,000 Women |
| Less than High School | 0 (0.0%) | 0.0 |
| High School Diploma | 9 (9.8%) | 13.0 |
| College or Associate's Degree | 65 (70.7%) | 66.0 |
| Bachelor's Degree | 11 (12.0%) | 21.0 |
| Graduate Degree | 7 (7.6%) | 92.0 |
| Total | 92 (100.0%) | 36.0 |
Fertility by Education by Marriage Status in Montrose
31.5% of women with births in Montrose are unmarried. Women with the educational attainment of high school diploma are most likely to be married with 100.0% of them married at childbirth, while women with the educational attainment of college or associate's degree are least likely to be married with 44.6% of them unmarried at childbirth.
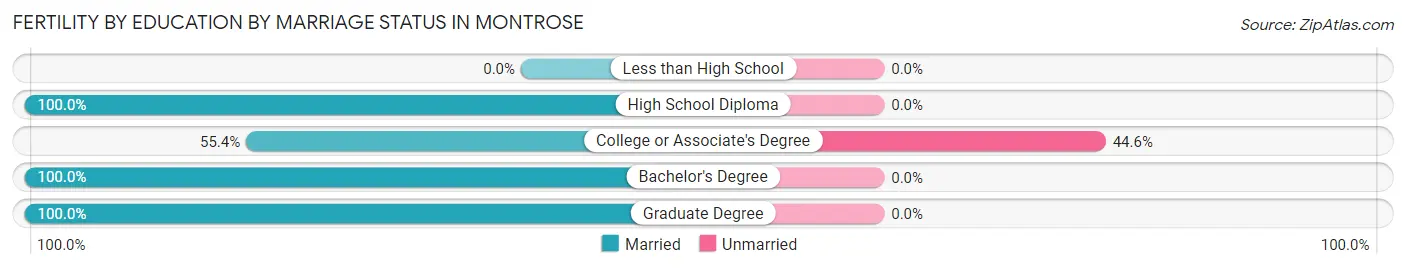
| Educational Attainment | Married | Unmarried |
| Less than High School | 0 (0.0%) | 0 (0.0%) |
| High School Diploma | 9 (100.0%) | 0 (0.0%) |
| College or Associate's Degree | 36 (55.4%) | 29 (44.6%) |
| Bachelor's Degree | 11 (100.0%) | 0 (0.0%) |
| Graduate Degree | 7 (100.0%) | 0 (0.0%) |
| Total | 63 (68.5%) | 29 (31.5%) |
Employment Characteristics in Montrose
Employment by Class of Employer in Montrose
Among the 3,841 employed individuals in Montrose, private company employees (2,727 | 71.0%), not-for-profit organizations (303 | 7.9%), and state government employees (237 | 6.2%) make up the most common classes of employment.
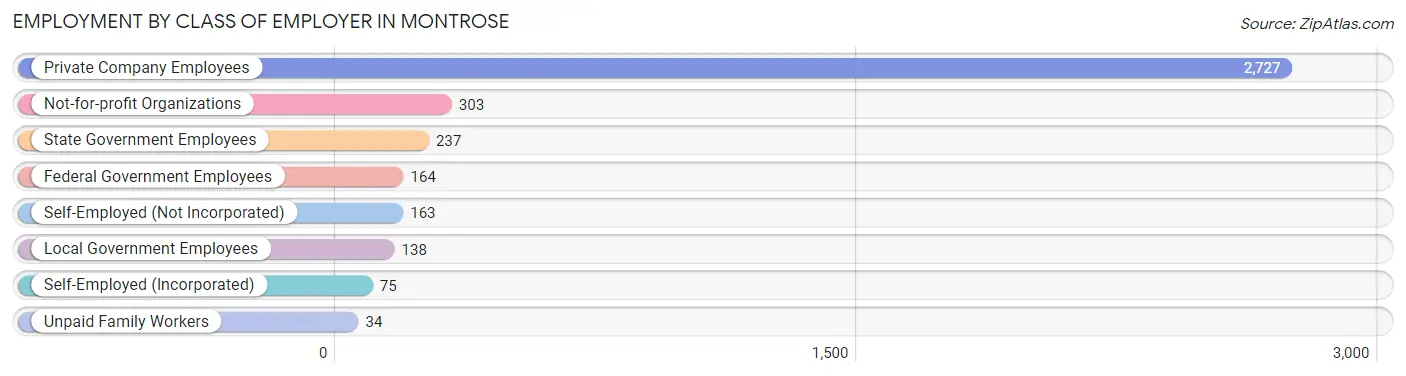
| Employer Class | # Employees | % Employees |
| Private Company Employees | 2,727 | 71.0% |
| Self-Employed (Incorporated) | 75 | 1.9% |
| Self-Employed (Not Incorporated) | 163 | 4.2% |
| Not-for-profit Organizations | 303 | 7.9% |
| Local Government Employees | 138 | 3.6% |
| State Government Employees | 237 | 6.2% |
| Federal Government Employees | 164 | 4.3% |
| Unpaid Family Workers | 34 | 0.9% |
| Total | 3,841 | 100.0% |
Employment Status by Age in Montrose
According to the labor force statistics for Montrose, out of the total population over 16 years of age (6,820), 59.6% or 4,065 individuals are in the labor force, with 4.3% or 175 of them unemployed. The age group with the highest labor force participation rate is 20 to 24 years, with 98.7% or 602 individuals in the labor force. Within the labor force, the 16 to 19 years age range has the highest percentage of unemployed individuals, with 8.4% or 14 of them being unemployed.
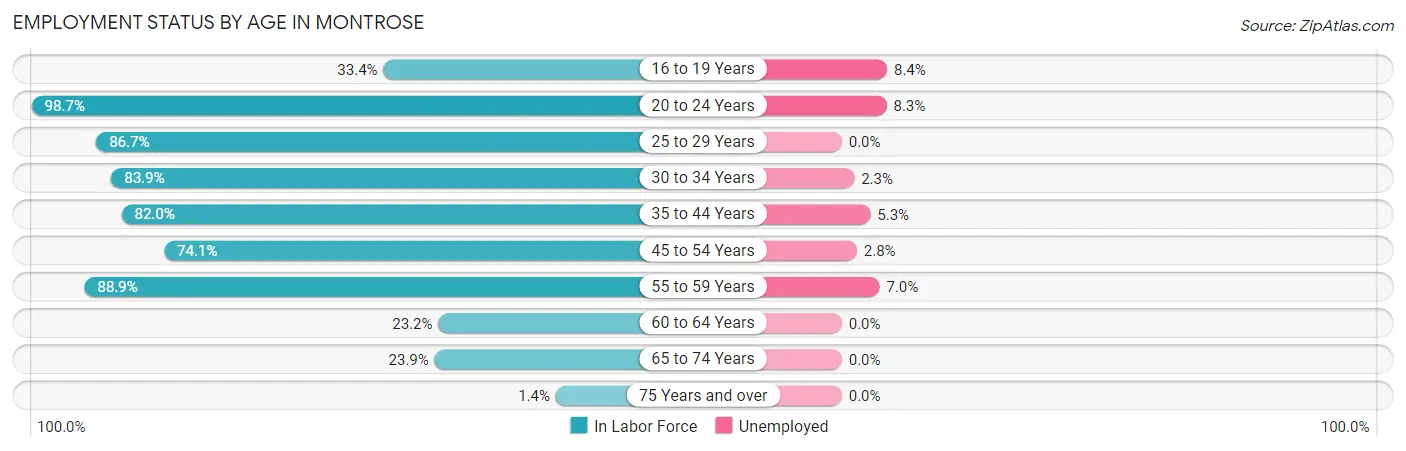
| Age Bracket | In Labor Force | Unemployed |
| 16 to 19 Years | 167 (33.4%) | 14 (8.4%) |
| 20 to 24 Years | 602 (98.7%) | 50 (8.3%) |
| 25 to 29 Years | 390 (86.7%) | 0 (0.0%) |
| 30 to 34 Years | 355 (83.9%) | 8 (2.3%) |
| 35 to 44 Years | 1,118 (82.0%) | 59 (5.3%) |
| 45 to 54 Years | 747 (74.1%) | 21 (2.8%) |
| 55 to 59 Years | 345 (88.9%) | 24 (7.0%) |
| 60 to 64 Years | 138 (23.2%) | 0 (0.0%) |
| 65 to 74 Years | 189 (23.9%) | 0 (0.0%) |
| 75 Years and over | 10 (1.4%) | 0 (0.0%) |
| Total | 4,065 (59.6%) | 175 (4.3%) |
Employment Status by Educational Attainment in Montrose
According to labor force statistics for Montrose, 73.2% of individuals (3,096) out of the total population between 25 and 64 years of age (4,229) are in the labor force, with 3.6% or 111 of them being unemployed. The group with the highest labor force participation rate are those with the educational attainment of bachelor's degree or higher, with 93.3% or 835 individuals in the labor force. Within the labor force, individuals with less than high school education have the highest percentage of unemployment, with 13.2% or 21 of them being unemployed.
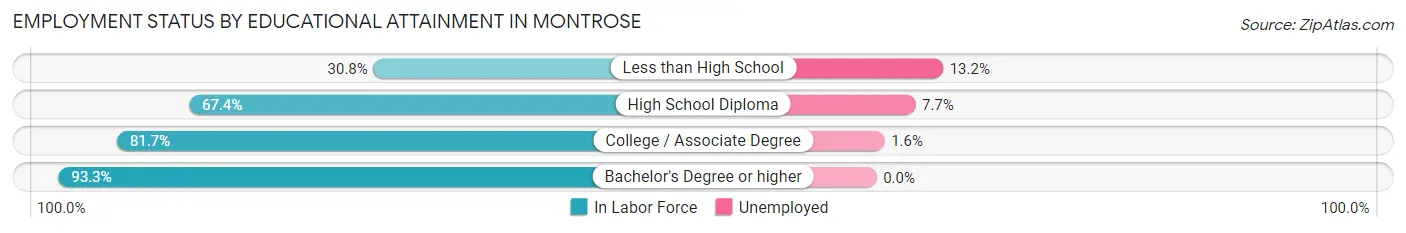
| Educational Attainment | In Labor Force | Unemployed |
| Less than High School | 159 (30.8%) | 68 (13.2%) |
| High School Diploma | 952 (67.4%) | 109 (7.7%) |
| College / Associate Degree | 1,149 (81.7%) | 22 (1.6%) |
| Bachelor's Degree or higher | 835 (93.3%) | 0 (0.0%) |
| Total | 3,096 (73.2%) | 152 (3.6%) |
Employment Occupations by Sex in Montrose
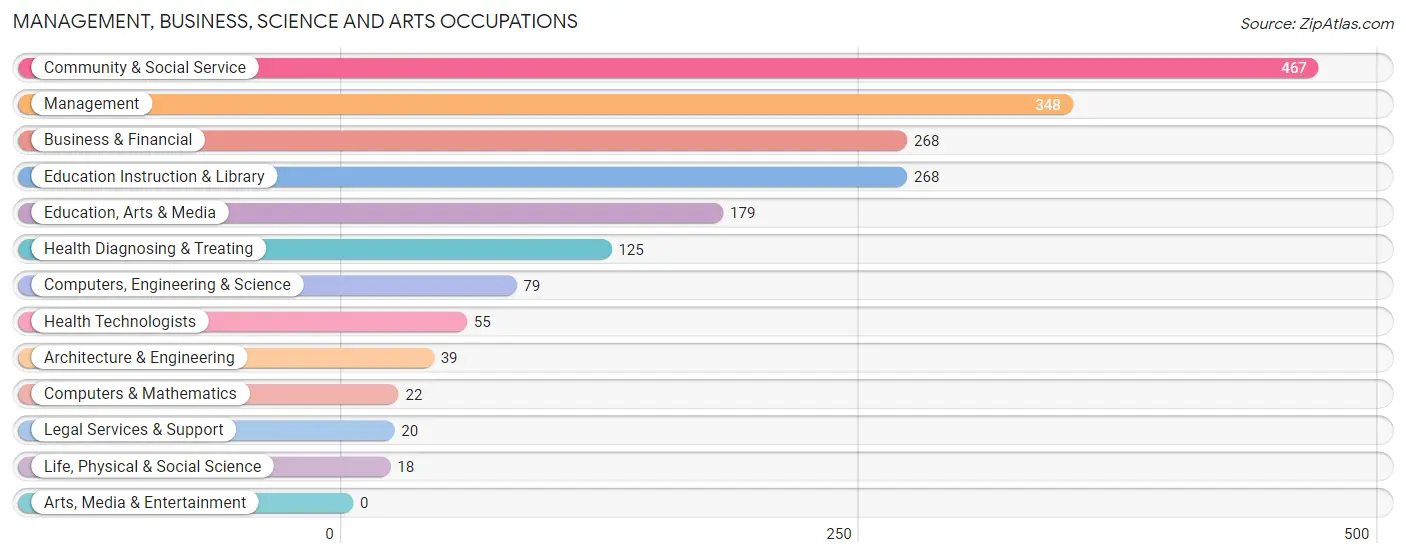
Management, Business, Science and Arts Occupations
The most common Management, Business, Science and Arts occupations in Montrose are Community & Social Service (467 | 12.0%), Management (348 | 9.0%), Business & Financial (268 | 6.9%), Education Instruction & Library (268 | 6.9%), and Education, Arts & Media (179 | 4.6%).
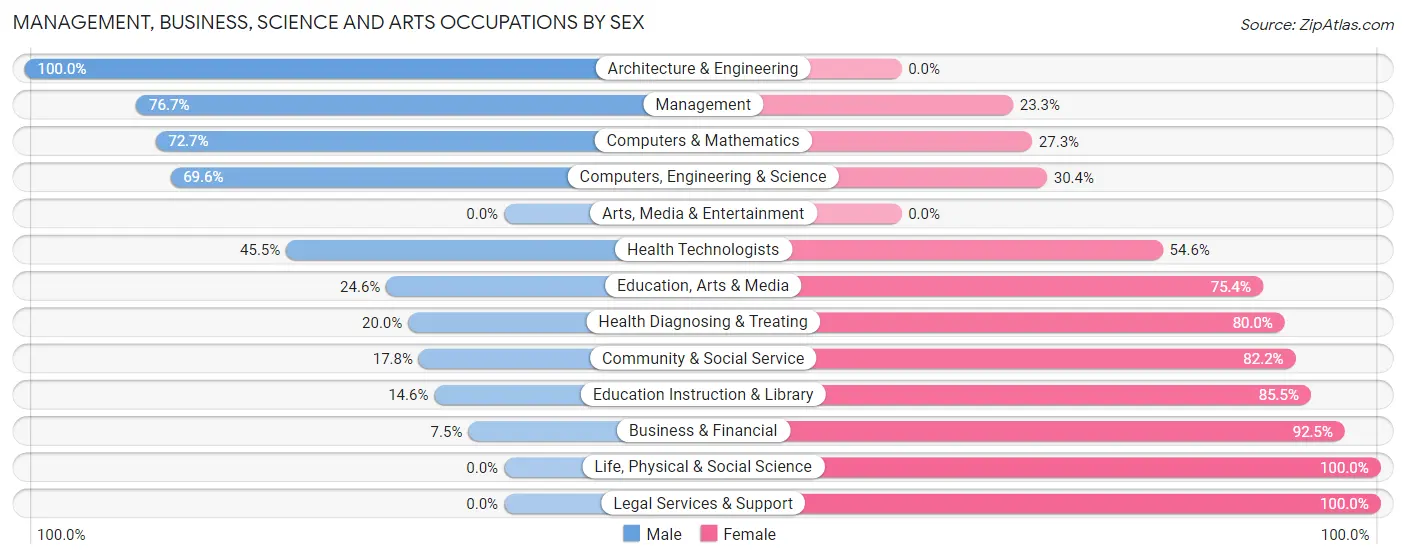
Management, Business, Science and Arts Occupations by Sex
Within the Management, Business, Science and Arts occupations in Montrose, the most male-oriented occupations are Architecture & Engineering (100.0%), Management (76.7%), and Computers & Mathematics (72.7%), while the most female-oriented occupations are Life, Physical & Social Science (100.0%), Legal Services & Support (100.0%), and Business & Financial (92.5%).
| Occupation | Male | Female |
| Management | 267 (76.7%) | 81 (23.3%) |
| Business & Financial | 20 (7.5%) | 248 (92.5%) |
| Computers, Engineering & Science | 55 (69.6%) | 24 (30.4%) |
| Computers & Mathematics | 16 (72.7%) | 6 (27.3%) |
| Architecture & Engineering | 39 (100.0%) | 0 (0.0%) |
| Life, Physical & Social Science | 0 (0.0%) | 18 (100.0%) |
| Community & Social Service | 83 (17.8%) | 384 (82.2%) |
| Education, Arts & Media | 44 (24.6%) | 135 (75.4%) |
| Legal Services & Support | 0 (0.0%) | 20 (100.0%) |
| Education Instruction & Library | 39 (14.5%) | 229 (85.5%) |
| Arts, Media & Entertainment | 0 (0.0%) | 0 (0.0%) |
| Health Diagnosing & Treating | 25 (20.0%) | 100 (80.0%) |
| Health Technologists | 25 (45.5%) | 30 (54.5%) |
| Total (Category) | 450 (35.0%) | 837 (65.0%) |
| Total (Overall) | 1,400 (36.0%) | 2,486 (64.0%) |
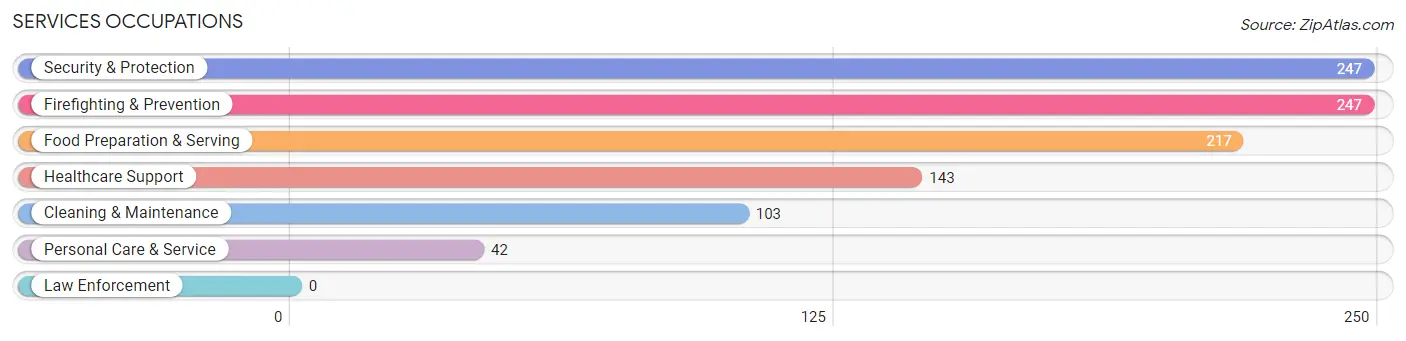
Services Occupations
The most common Services occupations in Montrose are Security & Protection (247 | 6.4%), Firefighting & Prevention (247 | 6.4%), Food Preparation & Serving (217 | 5.6%), Healthcare Support (143 | 3.7%), and Cleaning & Maintenance (103 | 2.6%).
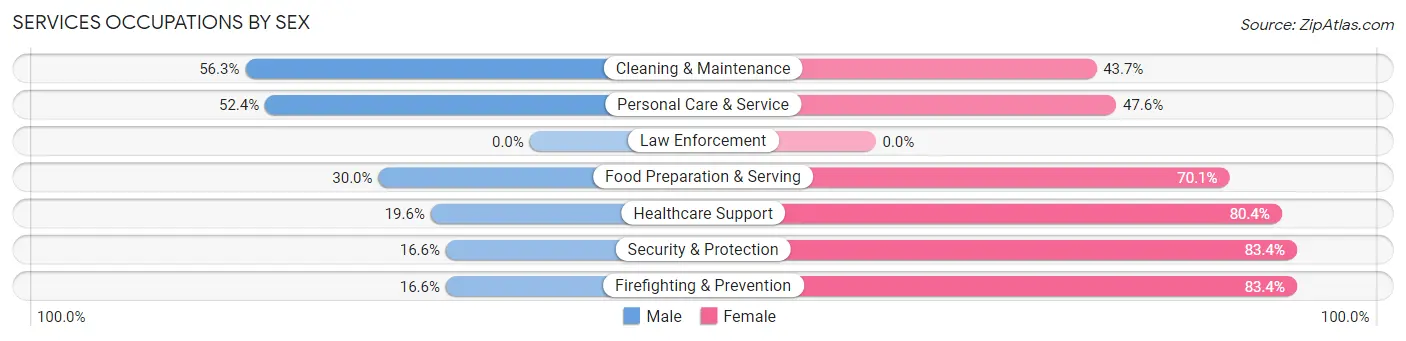
Services Occupations by Sex
Within the Services occupations in Montrose, the most male-oriented occupations are Cleaning & Maintenance (56.3%), Personal Care & Service (52.4%), and Food Preparation & Serving (29.9%), while the most female-oriented occupations are Security & Protection (83.4%), Firefighting & Prevention (83.4%), and Healthcare Support (80.4%).
| Occupation | Male | Female |
| Healthcare Support | 28 (19.6%) | 115 (80.4%) |
| Security & Protection | 41 (16.6%) | 206 (83.4%) |
| Firefighting & Prevention | 41 (16.6%) | 206 (83.4%) |
| Law Enforcement | 0 (0.0%) | 0 (0.0%) |
| Food Preparation & Serving | 65 (29.9%) | 152 (70.1%) |
| Cleaning & Maintenance | 58 (56.3%) | 45 (43.7%) |
| Personal Care & Service | 22 (52.4%) | 20 (47.6%) |
| Total (Category) | 214 (28.5%) | 538 (71.5%) |
| Total (Overall) | 1,400 (36.0%) | 2,486 (64.0%) |
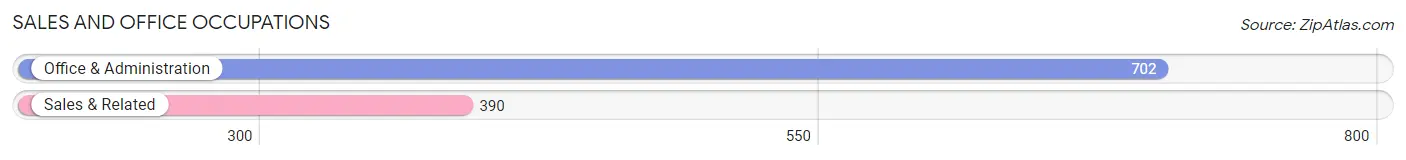
Sales and Office Occupations
The most common Sales and Office occupations in Montrose are Office & Administration (702 | 18.1%), and Sales & Related (390 | 10.0%).
Sales and Office Occupations by Sex
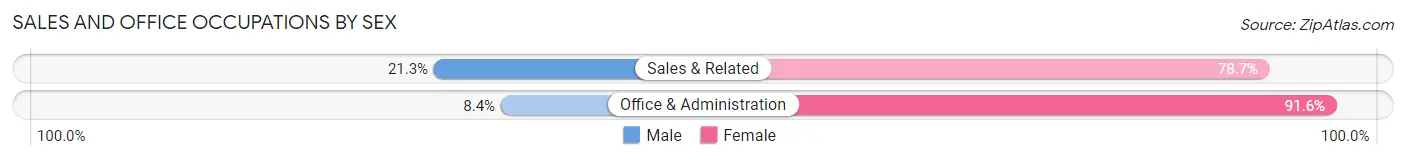
| Occupation | Male | Female |
| Sales & Related | 83 (21.3%) | 307 (78.7%) |
| Office & Administration | 59 (8.4%) | 643 (91.6%) |
| Total (Category) | 142 (13.0%) | 950 (87.0%) |
| Total (Overall) | 1,400 (36.0%) | 2,486 (64.0%) |
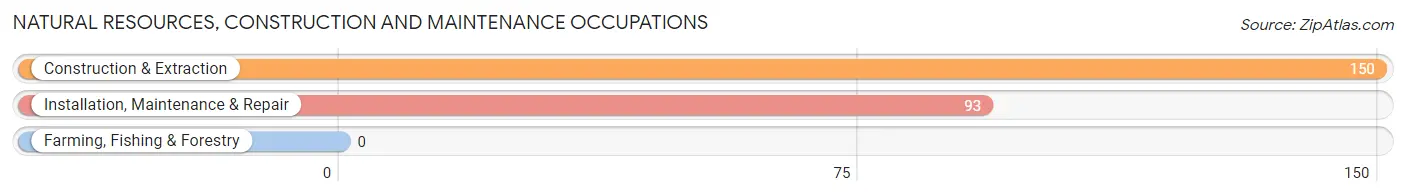
Natural Resources, Construction and Maintenance Occupations
The most common Natural Resources, Construction and Maintenance occupations in Montrose are Construction & Extraction (150 | 3.9%), and Installation, Maintenance & Repair (93 | 2.4%).
Natural Resources, Construction and Maintenance Occupations by Sex
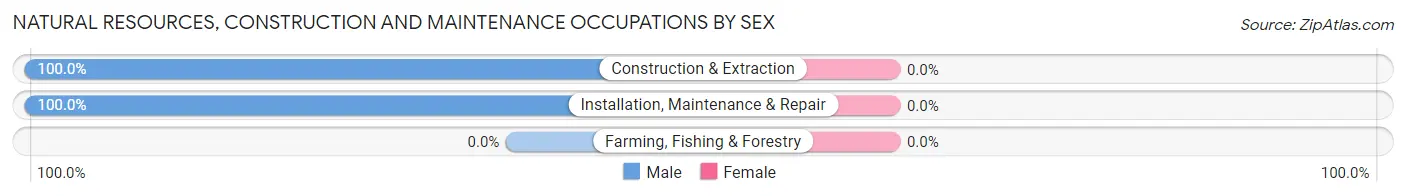
| Occupation | Male | Female |
| Farming, Fishing & Forestry | 0 (0.0%) | 0 (0.0%) |
| Construction & Extraction | 150 (100.0%) | 0 (0.0%) |
| Installation, Maintenance & Repair | 93 (100.0%) | 0 (0.0%) |
| Total (Category) | 243 (100.0%) | 0 (0.0%) |
| Total (Overall) | 1,400 (36.0%) | 2,486 (64.0%) |
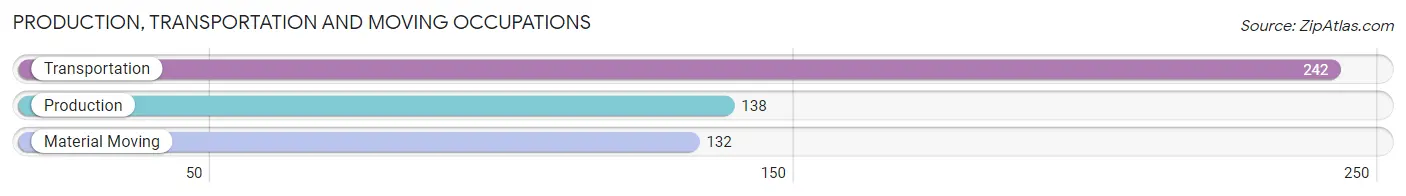
Production, Transportation and Moving Occupations
The most common Production, Transportation and Moving occupations in Montrose are Transportation (242 | 6.2%), Production (138 | 3.5%), and Material Moving (132 | 3.4%).
Production, Transportation and Moving Occupations by Sex
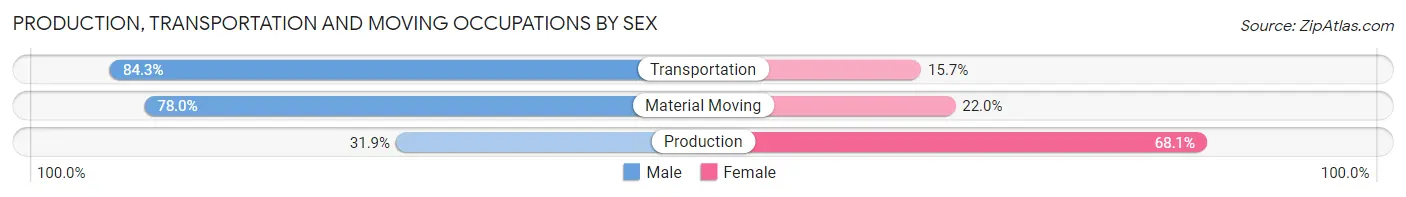
| Occupation | Male | Female |
| Production | 44 (31.9%) | 94 (68.1%) |
| Transportation | 204 (84.3%) | 38 (15.7%) |
| Material Moving | 103 (78.0%) | 29 (22.0%) |
| Total (Category) | 351 (68.5%) | 161 (31.5%) |
| Total (Overall) | 1,400 (36.0%) | 2,486 (64.0%) |
Employment Industries by Sex in Montrose
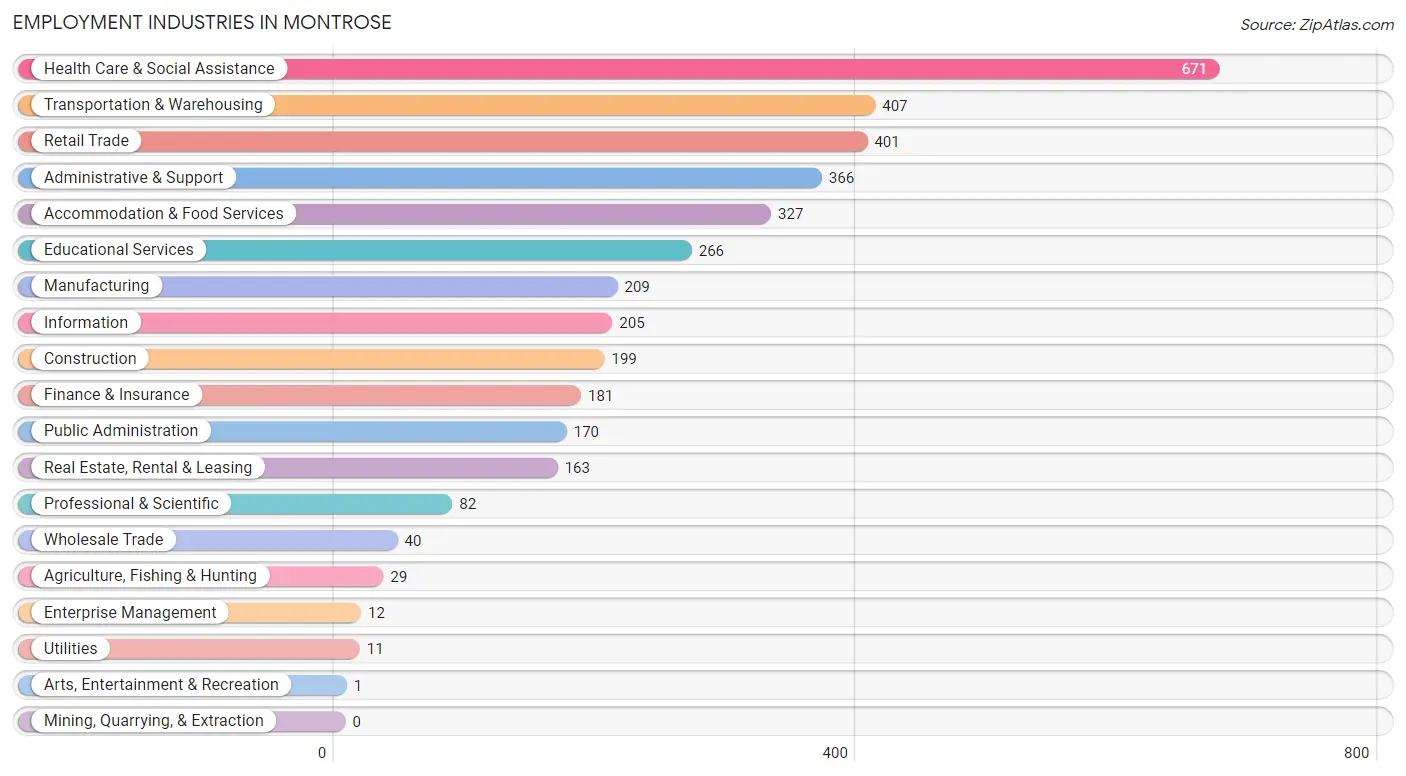
Employment Industries in Montrose
The major employment industries in Montrose include Health Care & Social Assistance (671 | 17.3%), Transportation & Warehousing (407 | 10.5%), Retail Trade (401 | 10.3%), Administrative & Support (366 | 9.4%), and Accommodation & Food Services (327 | 8.4%).
Employment Industries by Sex in Montrose
The Montrose industries that see more men than women are Construction (100.0%), Utilities (100.0%), and Information (91.2%), whereas the industries that tend to have a higher number of women are Agriculture, Fishing & Hunting (100.0%), Finance & Insurance (100.0%), and Enterprise Management (100.0%).
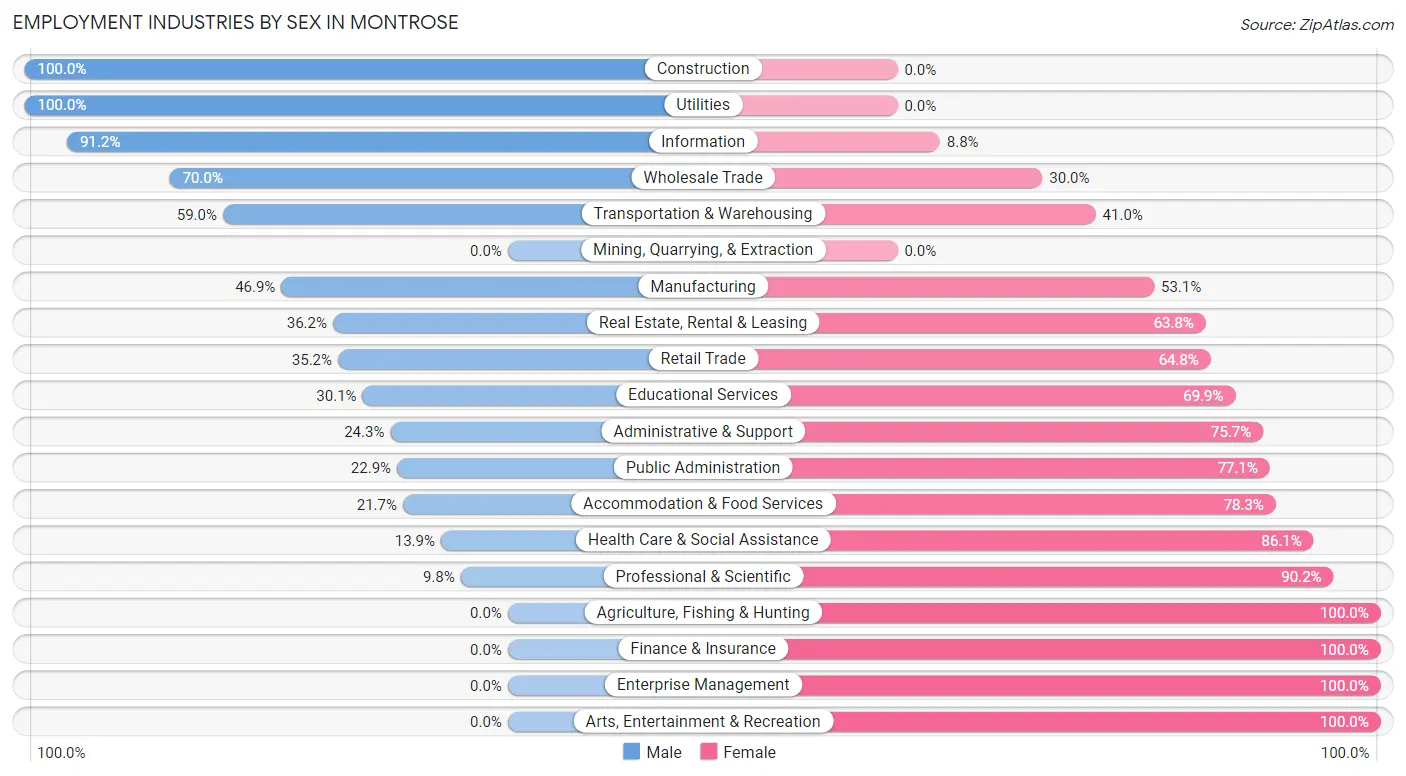
| Industry | Male | Female |
| Agriculture, Fishing & Hunting | 0 (0.0%) | 29 (100.0%) |
| Mining, Quarrying, & Extraction | 0 (0.0%) | 0 (0.0%) |
| Construction | 199 (100.0%) | 0 (0.0%) |
| Manufacturing | 98 (46.9%) | 111 (53.1%) |
| Wholesale Trade | 28 (70.0%) | 12 (30.0%) |
| Retail Trade | 141 (35.2%) | 260 (64.8%) |
| Transportation & Warehousing | 240 (59.0%) | 167 (41.0%) |
| Utilities | 11 (100.0%) | 0 (0.0%) |
| Information | 187 (91.2%) | 18 (8.8%) |
| Finance & Insurance | 0 (0.0%) | 181 (100.0%) |
| Real Estate, Rental & Leasing | 59 (36.2%) | 104 (63.8%) |
| Professional & Scientific | 8 (9.8%) | 74 (90.2%) |
| Enterprise Management | 0 (0.0%) | 12 (100.0%) |
| Administrative & Support | 89 (24.3%) | 277 (75.7%) |
| Educational Services | 80 (30.1%) | 186 (69.9%) |
| Health Care & Social Assistance | 93 (13.9%) | 578 (86.1%) |
| Arts, Entertainment & Recreation | 0 (0.0%) | 1 (100.0%) |
| Accommodation & Food Services | 71 (21.7%) | 256 (78.3%) |
| Public Administration | 39 (22.9%) | 131 (77.1%) |
| Total | 1,400 (36.0%) | 2,486 (64.0%) |
Education in Montrose
School Enrollment in Montrose
The most common levels of schooling among the 2,007 students in Montrose are college / undergraduate (486 | 24.2%), high school (443 | 22.1%), and middle school (342 | 17.0%).
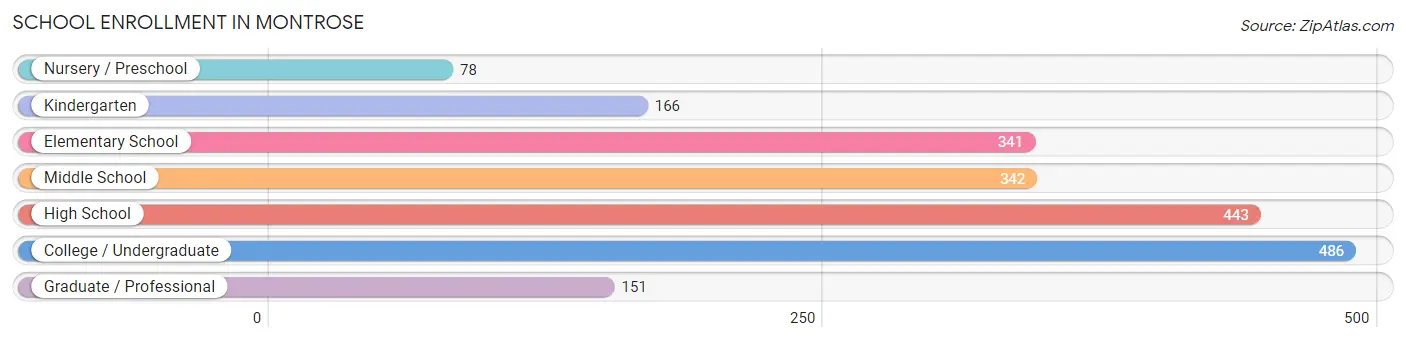
| School Level | # Students | % Students |
| Nursery / Preschool | 78 | 3.9% |
| Kindergarten | 166 | 8.3% |
| Elementary School | 341 | 17.0% |
| Middle School | 342 | 17.0% |
| High School | 443 | 22.1% |
| College / Undergraduate | 486 | 24.2% |
| Graduate / Professional | 151 | 7.5% |
| Total | 2,007 | 100.0% |
School Enrollment by Age by Funding Source in Montrose
Out of a total of 2,007 students who are enrolled in schools in Montrose, 239 (11.9%) attend a private institution, while the remaining 1,768 (88.1%) are enrolled in public schools. The age group of 35 years and over has the highest likelihood of being enrolled in private schools, with 130 (70.7% in the age bracket) enrolled. Conversely, the age group of 18 to 19 year olds has the lowest likelihood of being enrolled in a private school, with 108 (100.0% in the age bracket) attending a public institution.
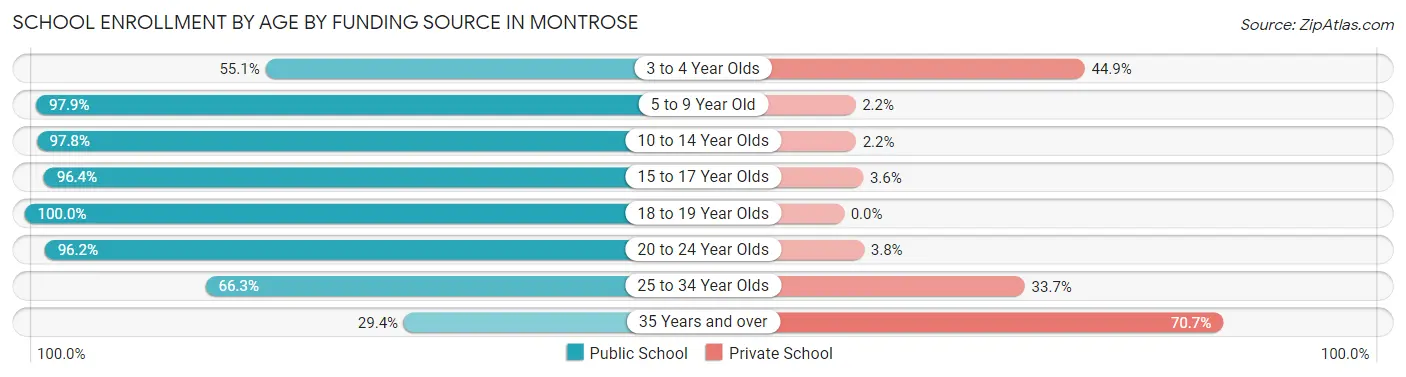
| Age Bracket | Public School | Private School |
| 3 to 4 Year Olds | 43 (55.1%) | 35 (44.9%) |
| 5 to 9 Year Old | 456 (97.9%) | 10 (2.1%) |
| 10 to 14 Year Olds | 392 (97.8%) | 9 (2.2%) |
| 15 to 17 Year Olds | 349 (96.4%) | 13 (3.6%) |
| 18 to 19 Year Olds | 108 (100.0%) | 0 (0.0%) |
| 20 to 24 Year Olds | 307 (96.2%) | 12 (3.8%) |
| 25 to 34 Year Olds | 59 (66.3%) | 30 (33.7%) |
| 35 Years and over | 54 (29.3%) | 130 (70.7%) |
| Total | 1,768 (88.1%) | 239 (11.9%) |
Educational Attainment by Field of Study in Montrose
Business (275 | 27.8%), communications (201 | 20.3%), science & technology (86 | 8.7%), literature & languages (57 | 5.8%), and multidisciplinary studies (52 | 5.2%) are the most common fields of study among 991 individuals in Montrose who have obtained a bachelor's degree or higher.
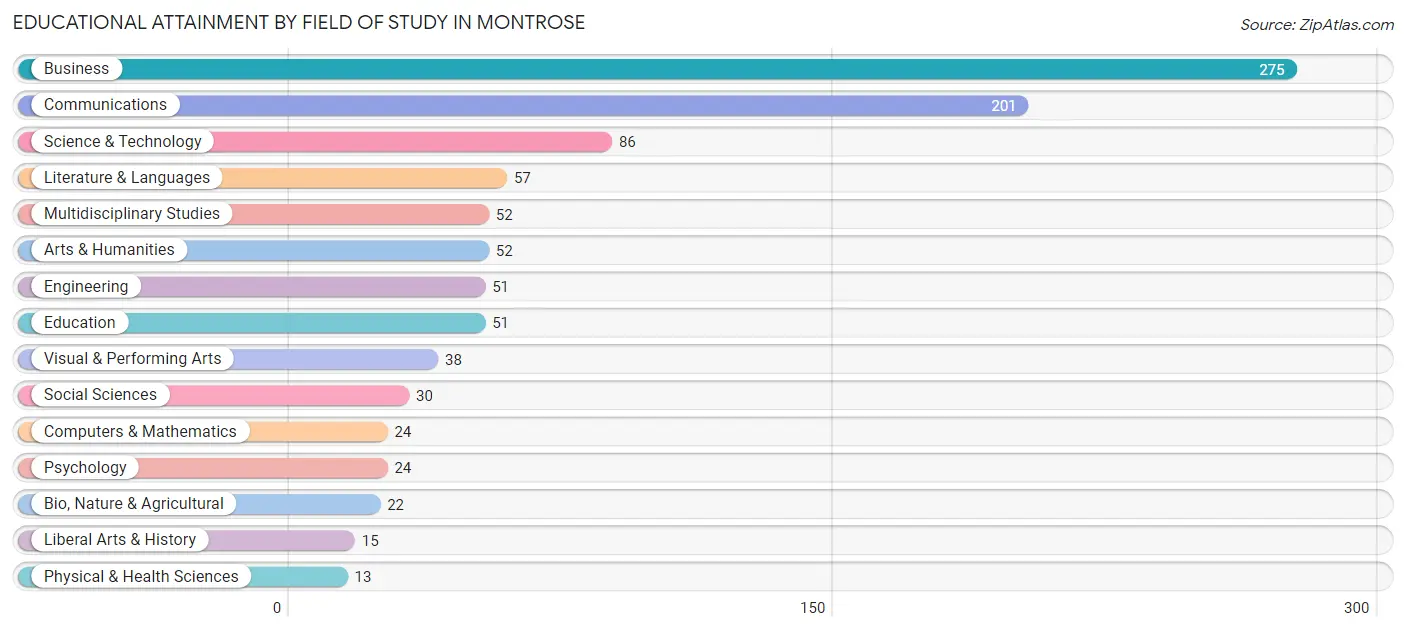
| Field of Study | # Graduates | % Graduates |
| Computers & Mathematics | 24 | 2.4% |
| Bio, Nature & Agricultural | 22 | 2.2% |
| Physical & Health Sciences | 13 | 1.3% |
| Psychology | 24 | 2.4% |
| Social Sciences | 30 | 3.0% |
| Engineering | 51 | 5.1% |
| Multidisciplinary Studies | 52 | 5.2% |
| Science & Technology | 86 | 8.7% |
| Business | 275 | 27.8% |
| Education | 51 | 5.1% |
| Literature & Languages | 57 | 5.8% |
| Liberal Arts & History | 15 | 1.5% |
| Visual & Performing Arts | 38 | 3.8% |
| Communications | 201 | 20.3% |
| Arts & Humanities | 52 | 5.2% |
| Total | 991 | 100.0% |
Transportation & Commute in Montrose
Vehicle Availability by Sex in Montrose
The most prevalent vehicle ownership categories in Montrose are males with 2 vehicles (536, accounting for 39.2%) and females with 2 vehicles (734, making up 21.7%).
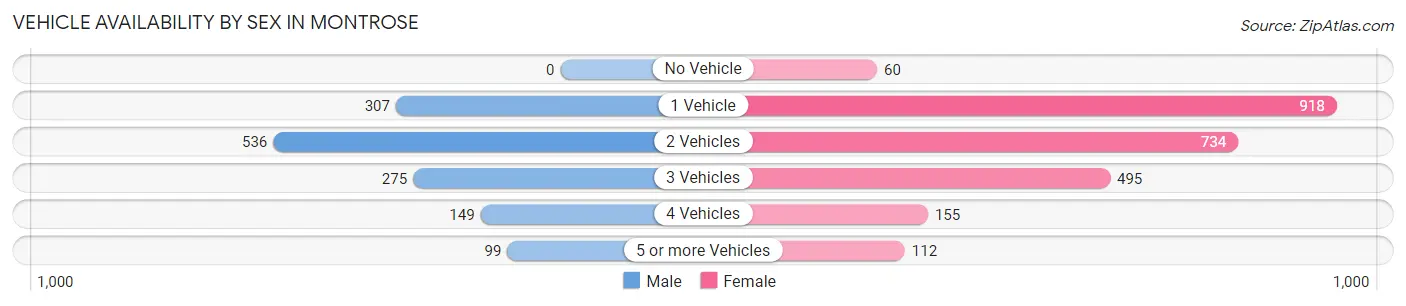
| Vehicles Available | Male | Female |
| No Vehicle | 0 (0.0%) | 60 (2.4%) |
| 1 Vehicle | 307 (22.5%) | 918 (37.1%) |
| 2 Vehicles | 536 (39.2%) | 734 (29.7%) |
| 3 Vehicles | 275 (20.1%) | 495 (20.0%) |
| 4 Vehicles | 149 (10.9%) | 155 (6.3%) |
| 5 or more Vehicles | 99 (7.2%) | 112 (4.5%) |
| Total | 1,366 (100.0%) | 2,474 (100.0%) |
Commute Time in Montrose
The most frequently occuring commute durations in Montrose are 15 to 19 minutes (749 commuters, 20.5%), 5 to 9 minutes (653 commuters, 17.9%), and 10 to 14 minutes (623 commuters, 17.1%).
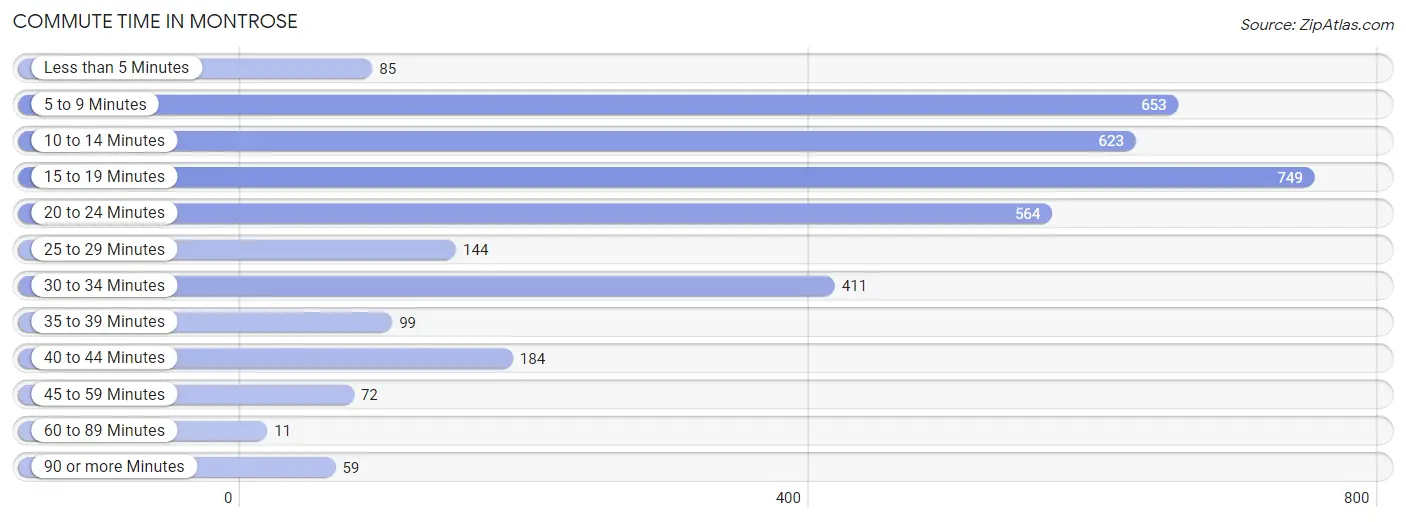
| Commute Time | # Commuters | % Commuters |
| Less than 5 Minutes | 85 | 2.3% |
| 5 to 9 Minutes | 653 | 17.9% |
| 10 to 14 Minutes | 623 | 17.1% |
| 15 to 19 Minutes | 749 | 20.5% |
| 20 to 24 Minutes | 564 | 15.4% |
| 25 to 29 Minutes | 144 | 3.9% |
| 30 to 34 Minutes | 411 | 11.3% |
| 35 to 39 Minutes | 99 | 2.7% |
| 40 to 44 Minutes | 184 | 5.0% |
| 45 to 59 Minutes | 72 | 2.0% |
| 60 to 89 Minutes | 11 | 0.3% |
| 90 or more Minutes | 59 | 1.6% |
Commute Time by Sex in Montrose
The most common commute times in Montrose are 15 to 19 minutes (370 commuters, 27.3%) for males and 5 to 9 minutes (471 commuters, 20.5%) for females.
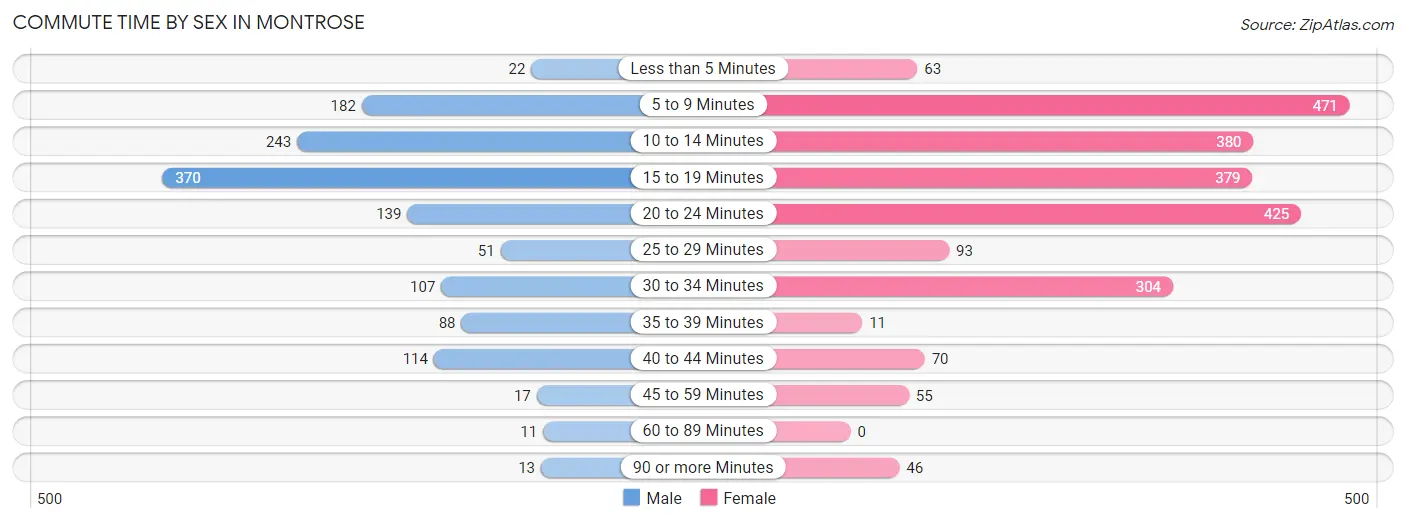
| Commute Time | Male | Female |
| Less than 5 Minutes | 22 (1.6%) | 63 (2.7%) |
| 5 to 9 Minutes | 182 (13.4%) | 471 (20.5%) |
| 10 to 14 Minutes | 243 (17.9%) | 380 (16.5%) |
| 15 to 19 Minutes | 370 (27.3%) | 379 (16.5%) |
| 20 to 24 Minutes | 139 (10.2%) | 425 (18.5%) |
| 25 to 29 Minutes | 51 (3.8%) | 93 (4.1%) |
| 30 to 34 Minutes | 107 (7.9%) | 304 (13.2%) |
| 35 to 39 Minutes | 88 (6.5%) | 11 (0.5%) |
| 40 to 44 Minutes | 114 (8.4%) | 70 (3.0%) |
| 45 to 59 Minutes | 17 (1.3%) | 55 (2.4%) |
| 60 to 89 Minutes | 11 (0.8%) | 0 (0.0%) |
| 90 or more Minutes | 13 (1.0%) | 46 (2.0%) |
Time of Departure to Work by Sex in Montrose
The most frequent times of departure to work in Montrose are 7:00 AM to 7:29 AM (349, 25.7%) for males and 8:00 AM to 8:29 AM (506, 22.0%) for females.
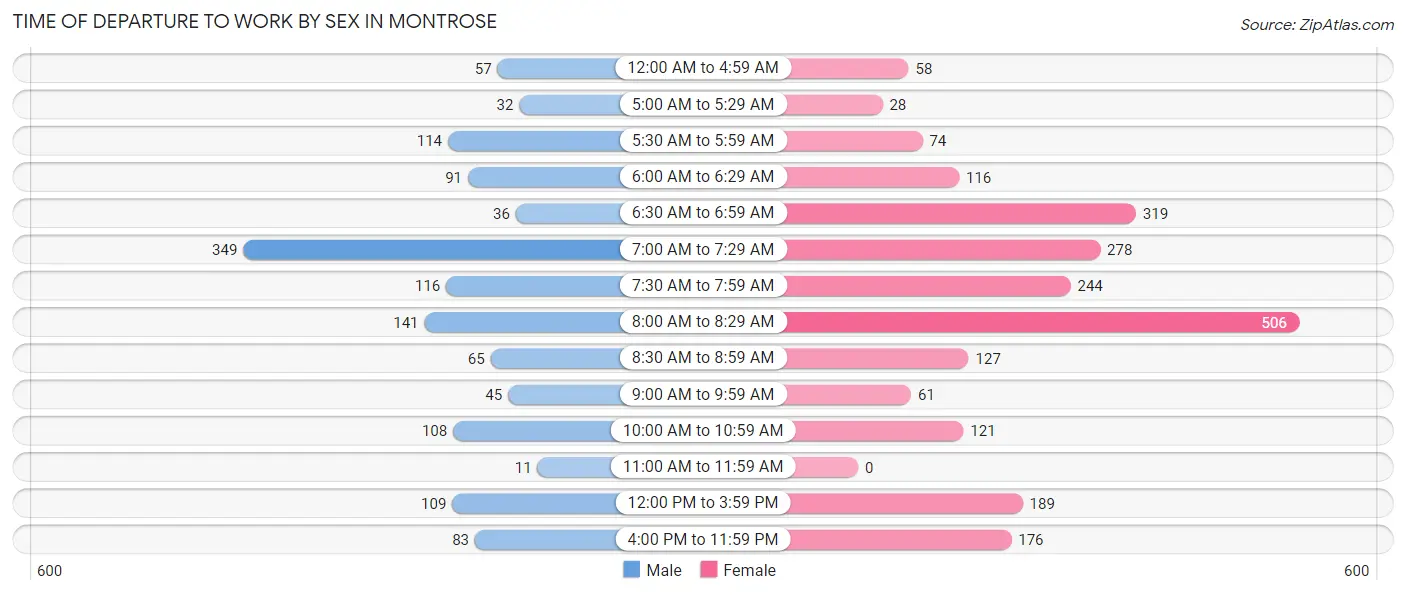
| Time of Departure | Male | Female |
| 12:00 AM to 4:59 AM | 57 (4.2%) | 58 (2.5%) |
| 5:00 AM to 5:29 AM | 32 (2.4%) | 28 (1.2%) |
| 5:30 AM to 5:59 AM | 114 (8.4%) | 74 (3.2%) |
| 6:00 AM to 6:29 AM | 91 (6.7%) | 116 (5.1%) |
| 6:30 AM to 6:59 AM | 36 (2.6%) | 319 (13.9%) |
| 7:00 AM to 7:29 AM | 349 (25.7%) | 278 (12.1%) |
| 7:30 AM to 7:59 AM | 116 (8.6%) | 244 (10.6%) |
| 8:00 AM to 8:29 AM | 141 (10.4%) | 506 (22.0%) |
| 8:30 AM to 8:59 AM | 65 (4.8%) | 127 (5.5%) |
| 9:00 AM to 9:59 AM | 45 (3.3%) | 61 (2.7%) |
| 10:00 AM to 10:59 AM | 108 (8.0%) | 121 (5.3%) |
| 11:00 AM to 11:59 AM | 11 (0.8%) | 0 (0.0%) |
| 12:00 PM to 3:59 PM | 109 (8.0%) | 189 (8.2%) |
| 4:00 PM to 11:59 PM | 83 (6.1%) | 176 (7.7%) |
| Total | 1,357 (100.0%) | 2,297 (100.0%) |
Housing Occupancy in Montrose
Occupancy by Ownership in Montrose
Of the total 3,589 dwellings in Montrose, owner-occupied units account for 1,326 (36.9%), while renter-occupied units make up 2,263 (63.0%).
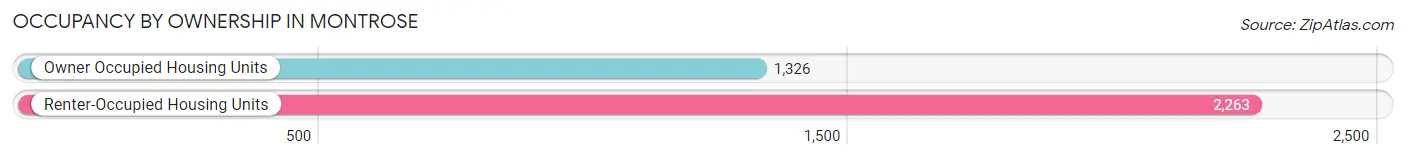
| Occupancy | # Housing Units | % Housing Units |
| Owner Occupied Housing Units | 1,326 | 36.9% |
| Renter-Occupied Housing Units | 2,263 | 63.0% |
| Total Occupied Housing Units | 3,589 | 100.0% |
Occupancy by Household Size in Montrose
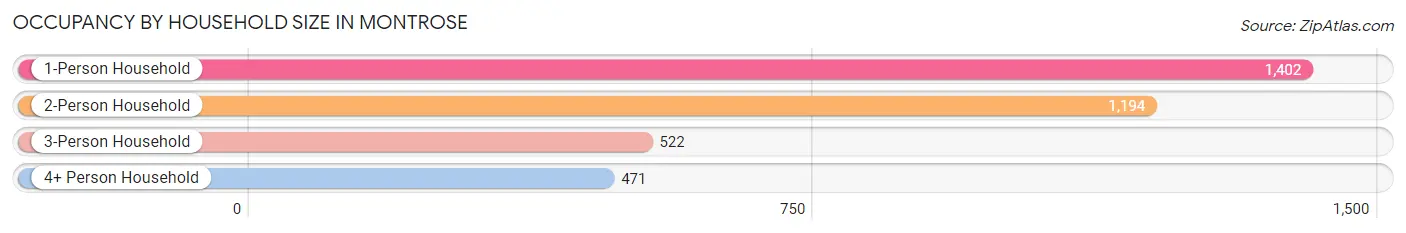
| Household Size | # Housing Units | % Housing Units |
| 1-Person Household | 1,402 | 39.1% |
| 2-Person Household | 1,194 | 33.3% |
| 3-Person Household | 522 | 14.5% |
| 4+ Person Household | 471 | 13.1% |
| Total Housing Units | 3,589 | 100.0% |
Occupancy by Ownership by Household Size in Montrose
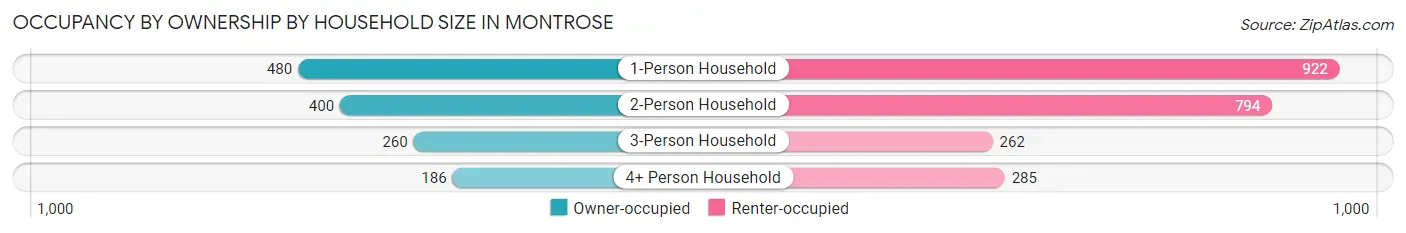
| Household Size | Owner-occupied | Renter-occupied |
| 1-Person Household | 480 (34.2%) | 922 (65.8%) |
| 2-Person Household | 400 (33.5%) | 794 (66.5%) |
| 3-Person Household | 260 (49.8%) | 262 (50.2%) |
| 4+ Person Household | 186 (39.5%) | 285 (60.5%) |
| Total Housing Units | 1,326 (36.9%) | 2,263 (63.0%) |
Occupancy by Educational Attainment in Montrose
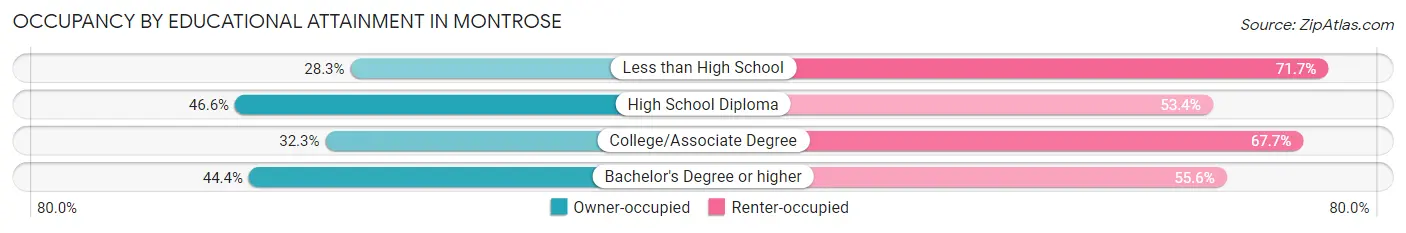
| Household Size | Owner-occupied | Renter-occupied |
| Less than High School | 185 (28.3%) | 468 (71.7%) |
| High School Diploma | 417 (46.6%) | 477 (53.4%) |
| College/Associate Degree | 488 (32.3%) | 1,023 (67.7%) |
| Bachelor's Degree or higher | 236 (44.4%) | 295 (55.6%) |
Occupancy by Age of Householder in Montrose
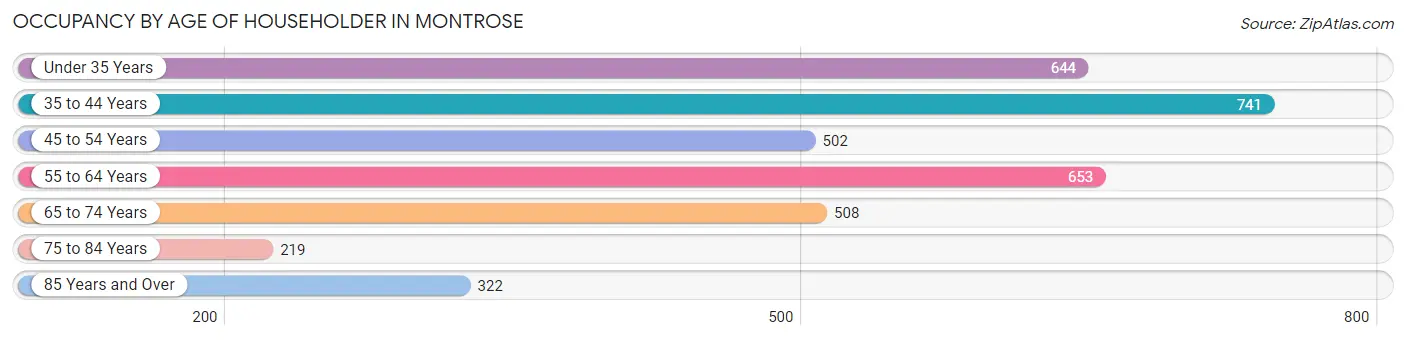
| Age Bracket | # Households | % Households |
| Under 35 Years | 644 | 17.9% |
| 35 to 44 Years | 741 | 20.6% |
| 45 to 54 Years | 502 | 14.0% |
| 55 to 64 Years | 653 | 18.2% |
| 65 to 74 Years | 508 | 14.1% |
| 75 to 84 Years | 219 | 6.1% |
| 85 Years and Over | 322 | 9.0% |
| Total | 3,589 | 100.0% |
Housing Finances in Montrose
Median Income by Occupancy in Montrose
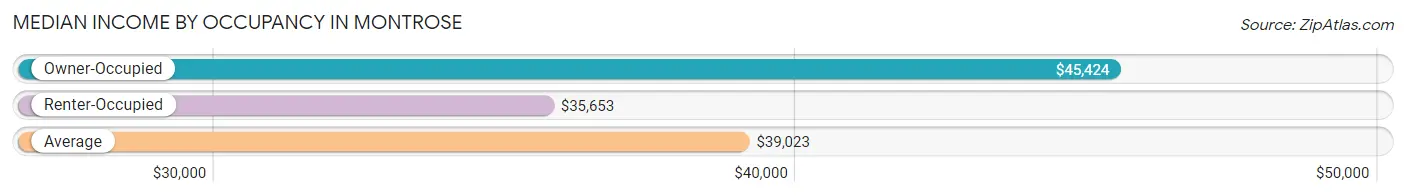
| Occupancy Type | # Households | Median Income |
| Owner-Occupied | 1,326 (36.9%) | $45,424 |
| Renter-Occupied | 2,263 (63.0%) | $35,653 |
| Average | 3,589 (100.0%) | $39,023 |
Occupancy by Householder Income Bracket in Montrose
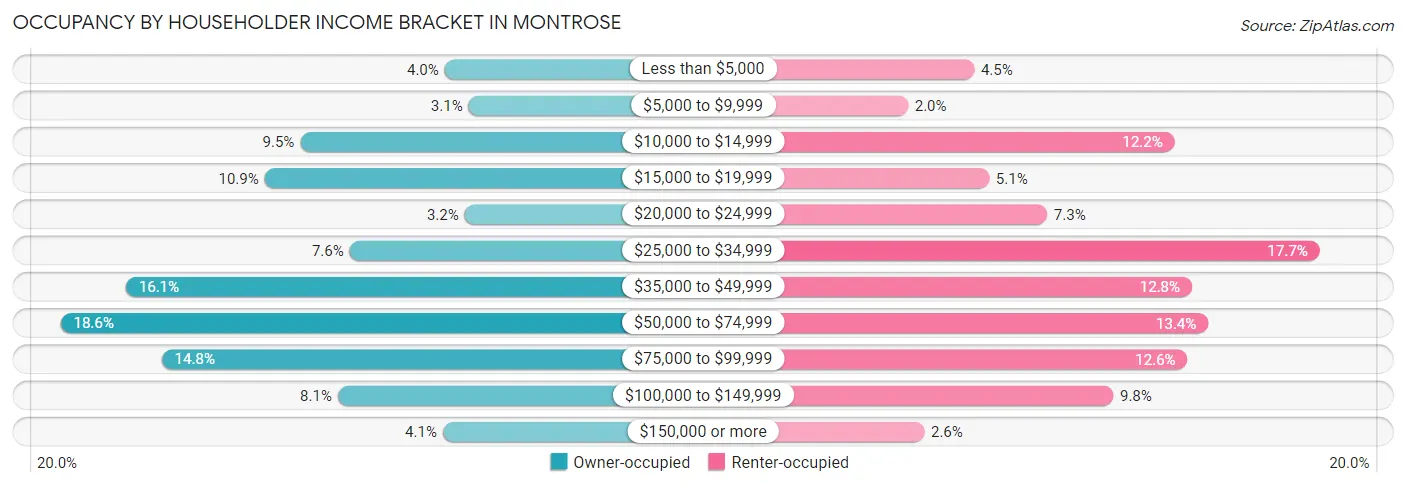
| Income Bracket | Owner-occupied | Renter-occupied |
| Less than $5,000 | 53 (4.0%) | 102 (4.5%) |
| $5,000 to $9,999 | 41 (3.1%) | 45 (2.0%) |
| $10,000 to $14,999 | 126 (9.5%) | 275 (12.1%) |
| $15,000 to $19,999 | 144 (10.9%) | 115 (5.1%) |
| $20,000 to $24,999 | 43 (3.2%) | 165 (7.3%) |
| $25,000 to $34,999 | 101 (7.6%) | 400 (17.7%) |
| $35,000 to $49,999 | 214 (16.1%) | 290 (12.8%) |
| $50,000 to $74,999 | 247 (18.6%) | 304 (13.4%) |
| $75,000 to $99,999 | 196 (14.8%) | 286 (12.6%) |
| $100,000 to $149,999 | 107 (8.1%) | 222 (9.8%) |
| $150,000 or more | 54 (4.1%) | 59 (2.6%) |
| Total | 1,326 (100.0%) | 2,263 (100.0%) |
Monthly Housing Cost Tiers in Montrose
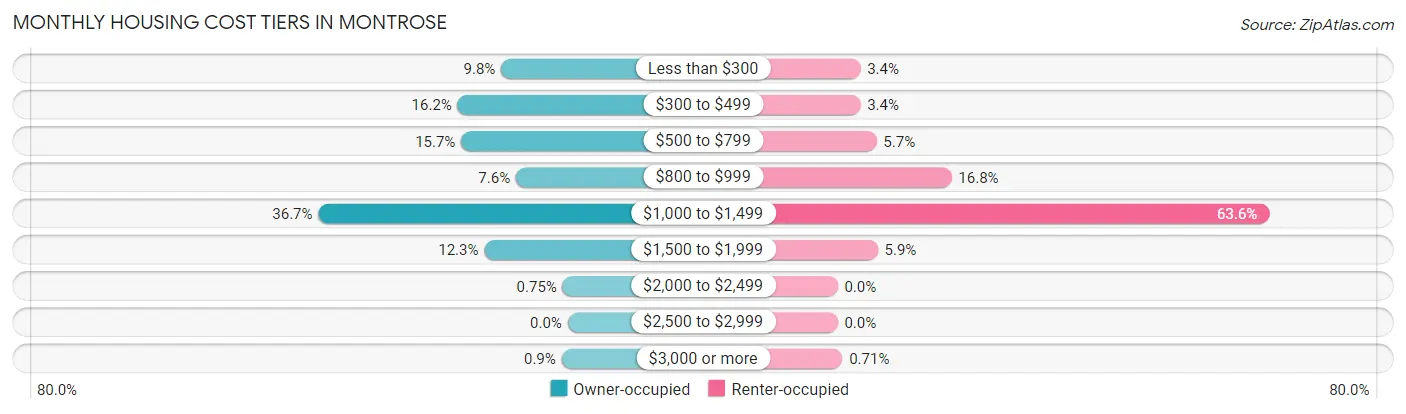
| Monthly Cost | Owner-occupied | Renter-occupied |
| Less than $300 | 130 (9.8%) | 76 (3.4%) |
| $300 to $499 | 215 (16.2%) | 76 (3.4%) |
| $500 to $799 | 208 (15.7%) | 130 (5.7%) |
| $800 to $999 | 101 (7.6%) | 380 (16.8%) |
| $1,000 to $1,499 | 487 (36.7%) | 1,439 (63.6%) |
| $1,500 to $1,999 | 163 (12.3%) | 134 (5.9%) |
| $2,000 to $2,499 | 10 (0.7%) | 0 (0.0%) |
| $2,500 to $2,999 | 0 (0.0%) | 0 (0.0%) |
| $3,000 or more | 12 (0.9%) | 16 (0.7%) |
| Total | 1,326 (100.0%) | 2,263 (100.0%) |
Physical Housing Characteristics in Montrose
Housing Structures in Montrose
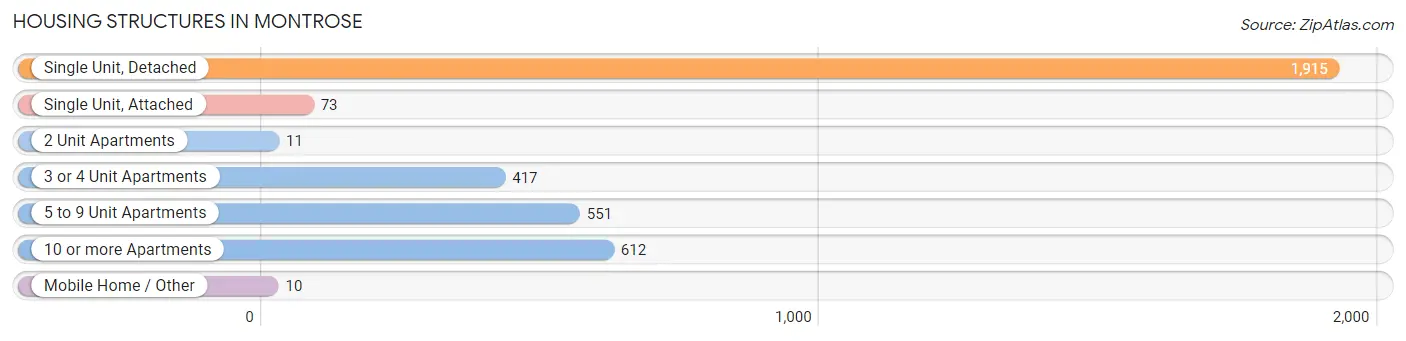
| Structure Type | # Housing Units | % Housing Units |
| Single Unit, Detached | 1,915 | 53.4% |
| Single Unit, Attached | 73 | 2.0% |
| 2 Unit Apartments | 11 | 0.3% |
| 3 or 4 Unit Apartments | 417 | 11.6% |
| 5 to 9 Unit Apartments | 551 | 15.3% |
| 10 or more Apartments | 612 | 17.1% |
| Mobile Home / Other | 10 | 0.3% |
| Total | 3,589 | 100.0% |
Housing Structures by Occupancy in Montrose
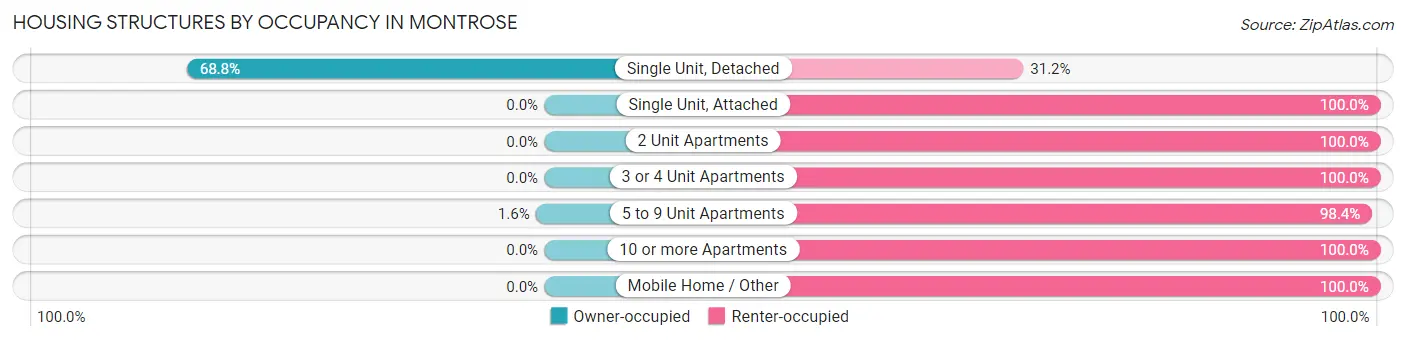
| Structure Type | Owner-occupied | Renter-occupied |
| Single Unit, Detached | 1,317 (68.8%) | 598 (31.2%) |
| Single Unit, Attached | 0 (0.0%) | 73 (100.0%) |
| 2 Unit Apartments | 0 (0.0%) | 11 (100.0%) |
| 3 or 4 Unit Apartments | 0 (0.0%) | 417 (100.0%) |
| 5 to 9 Unit Apartments | 9 (1.6%) | 542 (98.4%) |
| 10 or more Apartments | 0 (0.0%) | 612 (100.0%) |
| Mobile Home / Other | 0 (0.0%) | 10 (100.0%) |
| Total | 1,326 (36.9%) | 2,263 (63.0%) |
Housing Structures by Number of Rooms in Montrose
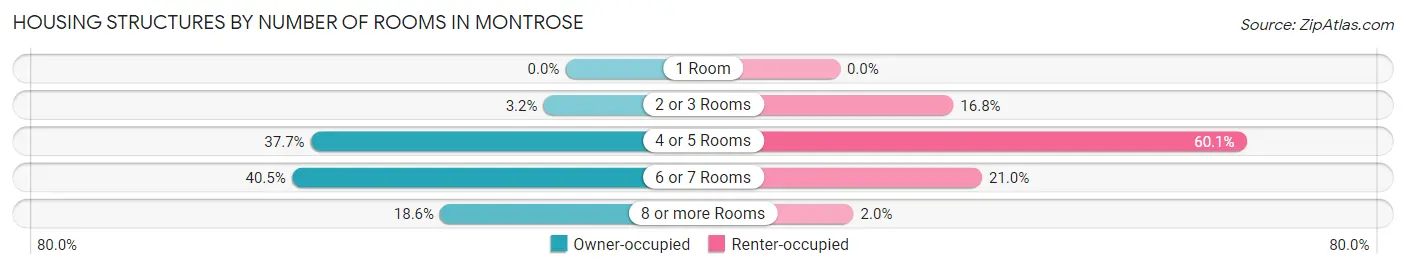
| Number of Rooms | Owner-occupied | Renter-occupied |
| 1 Room | 0 (0.0%) | 0 (0.0%) |
| 2 or 3 Rooms | 43 (3.2%) | 380 (16.8%) |
| 4 or 5 Rooms | 500 (37.7%) | 1,361 (60.1%) |
| 6 or 7 Rooms | 537 (40.5%) | 476 (21.0%) |
| 8 or more Rooms | 246 (18.5%) | 46 (2.0%) |
| Total | 1,326 (100.0%) | 2,263 (100.0%) |
Housing Structure by Heating Type in Montrose
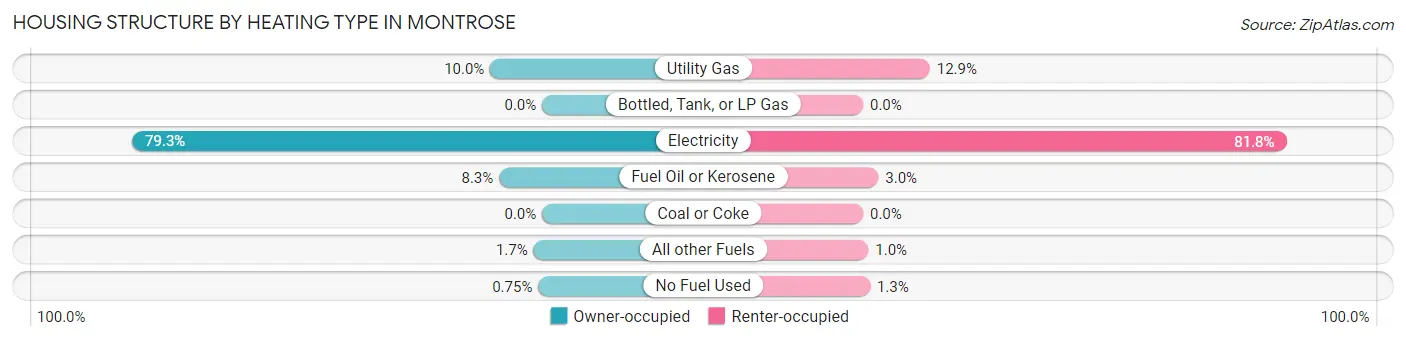
| Heating Type | Owner-occupied | Renter-occupied |
| Utility Gas | 133 (10.0%) | 292 (12.9%) |
| Bottled, Tank, or LP Gas | 0 (0.0%) | 0 (0.0%) |
| Electricity | 1,051 (79.3%) | 1,851 (81.8%) |
| Fuel Oil or Kerosene | 110 (8.3%) | 67 (3.0%) |
| Coal or Coke | 0 (0.0%) | 0 (0.0%) |
| All other Fuels | 22 (1.7%) | 23 (1.0%) |
| No Fuel Used | 10 (0.7%) | 30 (1.3%) |
| Total | 1,326 (100.0%) | 2,263 (100.0%) |
Household Vehicle Usage in Montrose
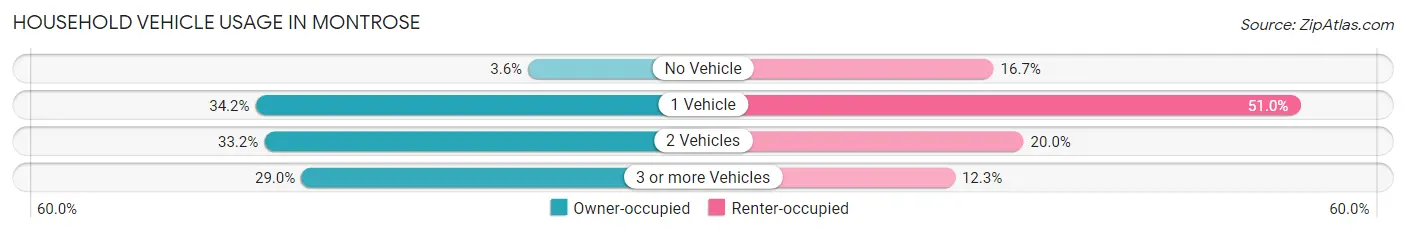
| Vehicles per Household | Owner-occupied | Renter-occupied |
| No Vehicle | 48 (3.6%) | 377 (16.7%) |
| 1 Vehicle | 453 (34.2%) | 1,154 (51.0%) |
| 2 Vehicles | 440 (33.2%) | 453 (20.0%) |
| 3 or more Vehicles | 385 (29.0%) | 279 (12.3%) |
| Total | 1,326 (100.0%) | 2,263 (100.0%) |
Real Estate & Mortgages in Montrose
Real Estate and Mortgage Overview in Montrose
| Characteristic | Without Mortgage | With Mortgage |
| Housing Units | 382 | 944 |
| Median Property Value | $153,700 | $170,500 |
| Median Household Income | $34,167 | $54 |
| Monthly Housing Costs | $349 | $12 |
| Real Estate Taxes | $1,152 | $45 |
Property Value by Mortgage Status in Montrose
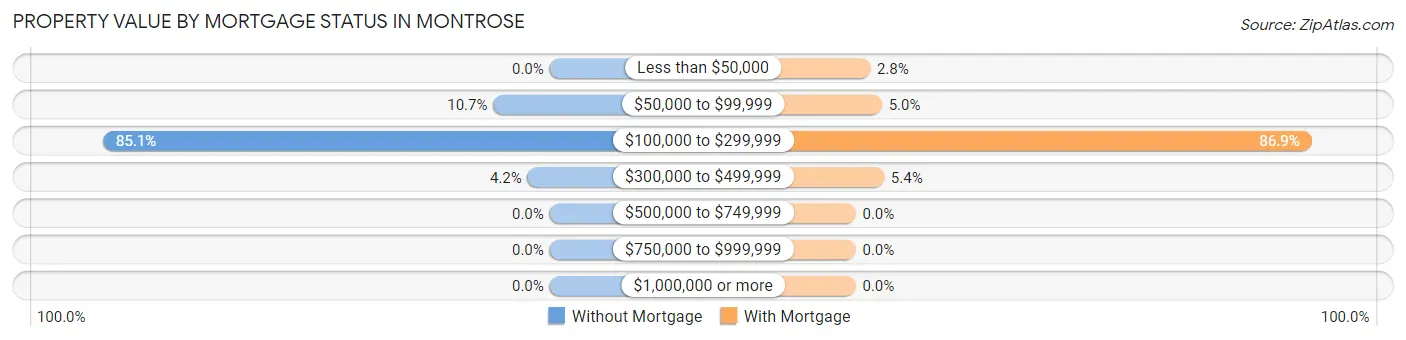
| Property Value | Without Mortgage | With Mortgage |
| Less than $50,000 | 0 (0.0%) | 26 (2.8%) |
| $50,000 to $99,999 | 41 (10.7%) | 47 (5.0%) |
| $100,000 to $299,999 | 325 (85.1%) | 820 (86.9%) |
| $300,000 to $499,999 | 16 (4.2%) | 51 (5.4%) |
| $500,000 to $749,999 | 0 (0.0%) | 0 (0.0%) |
| $750,000 to $999,999 | 0 (0.0%) | 0 (0.0%) |
| $1,000,000 or more | 0 (0.0%) | 0 (0.0%) |
| Total | 382 (100.0%) | 944 (100.0%) |
Household Income by Mortgage Status in Montrose
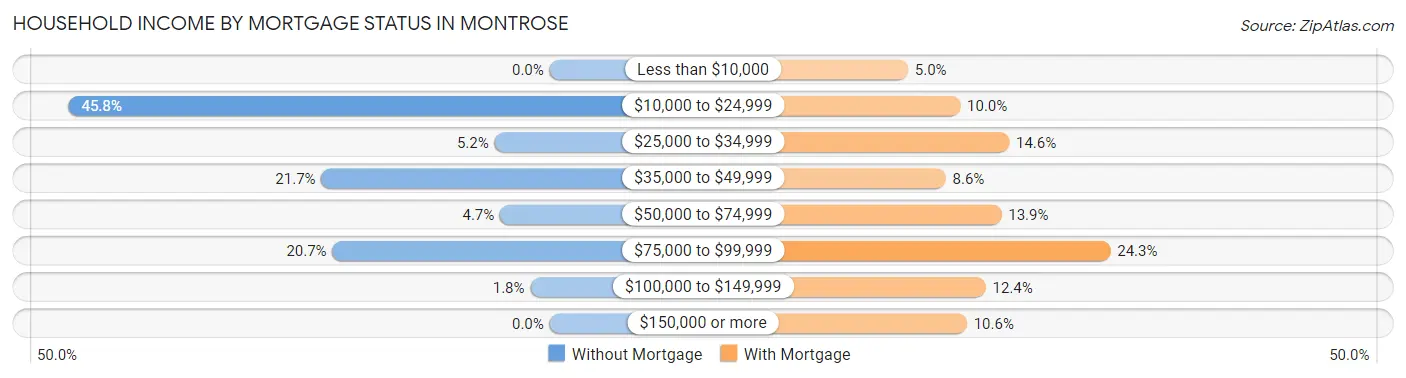
| Household Income | Without Mortgage | With Mortgage |
| Less than $10,000 | 0 (0.0%) | 47 (5.0%) |
| $10,000 to $24,999 | 175 (45.8%) | 94 (10.0%) |
| $25,000 to $34,999 | 20 (5.2%) | 138 (14.6%) |
| $35,000 to $49,999 | 83 (21.7%) | 81 (8.6%) |
| $50,000 to $74,999 | 18 (4.7%) | 131 (13.9%) |
| $75,000 to $99,999 | 79 (20.7%) | 229 (24.3%) |
| $100,000 to $149,999 | 7 (1.8%) | 117 (12.4%) |
| $150,000 or more | 0 (0.0%) | 100 (10.6%) |
| Total | 382 (100.0%) | 944 (100.0%) |
Property Value to Household Income Ratio in Montrose
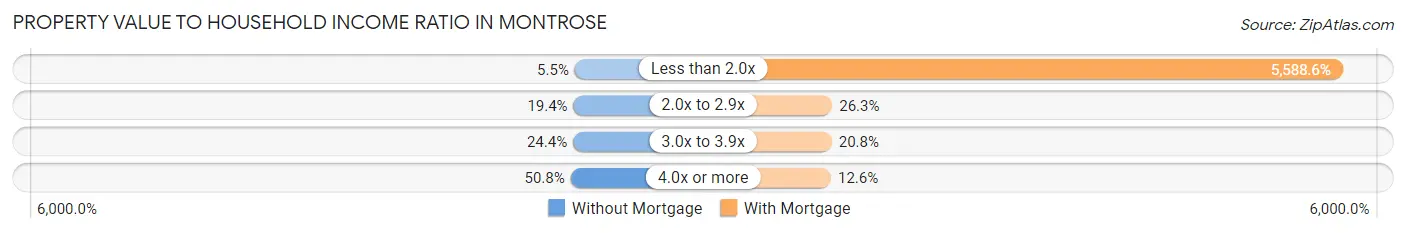
| Value-to-Income Ratio | Without Mortgage | With Mortgage |
| Less than 2.0x | 21 (5.5%) | 52,756 (5,588.6%) |
| 2.0x to 2.9x | 74 (19.4%) | 248 (26.3%) |
| 3.0x to 3.9x | 93 (24.3%) | 196 (20.8%) |
| 4.0x or more | 194 (50.8%) | 119 (12.6%) |
| Total | 382 (100.0%) | 944 (100.0%) |
Real Estate Taxes by Mortgage Status in Montrose
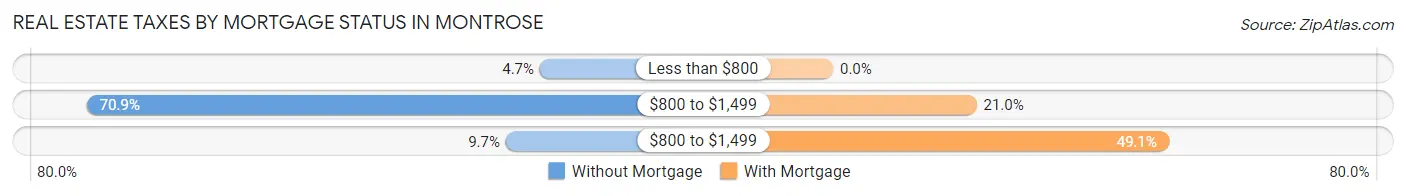
| Property Taxes | Without Mortgage | With Mortgage |
| Less than $800 | 18 (4.7%) | 0 (0.0%) |
| $800 to $1,499 | 271 (70.9%) | 198 (21.0%) |
| $800 to $1,499 | 37 (9.7%) | 463 (49.0%) |
| Total | 382 (100.0%) | 944 (100.0%) |
Health & Disability in Montrose
Health Insurance Coverage by Age in Montrose
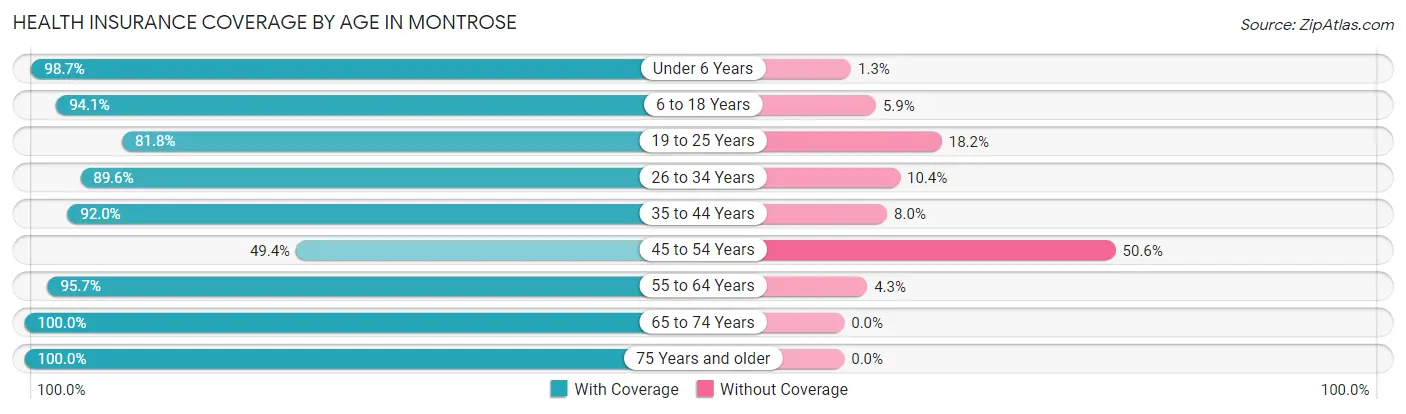
| Age Bracket | With Coverage | Without Coverage |
| Under 6 Years | 624 (98.7%) | 8 (1.3%) |
| 6 to 18 Years | 1,242 (94.1%) | 78 (5.9%) |
| 19 to 25 Years | 666 (81.8%) | 148 (18.2%) |
| 26 to 34 Years | 681 (89.6%) | 79 (10.4%) |
| 35 to 44 Years | 1,255 (92.0%) | 109 (8.0%) |
| 45 to 54 Years | 498 (49.4%) | 510 (50.6%) |
| 55 to 64 Years | 942 (95.7%) | 42 (4.3%) |
| 65 to 74 Years | 791 (100.0%) | 0 (0.0%) |
| 75 Years and older | 690 (100.0%) | 0 (0.0%) |
| Total | 7,389 (88.3%) | 974 (11.7%) |
Health Insurance Coverage by Citizenship Status in Montrose
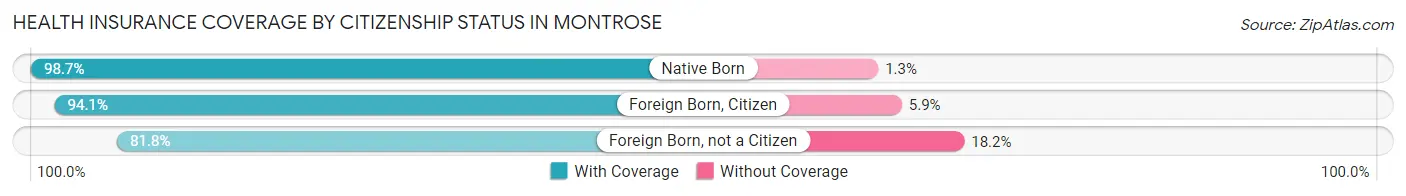
| Citizenship Status | With Coverage | Without Coverage |
| Native Born | 624 (98.7%) | 8 (1.3%) |
| Foreign Born, Citizen | 1,242 (94.1%) | 78 (5.9%) |
| Foreign Born, not a Citizen | 666 (81.8%) | 148 (18.2%) |
Health Insurance Coverage by Household Income in Montrose
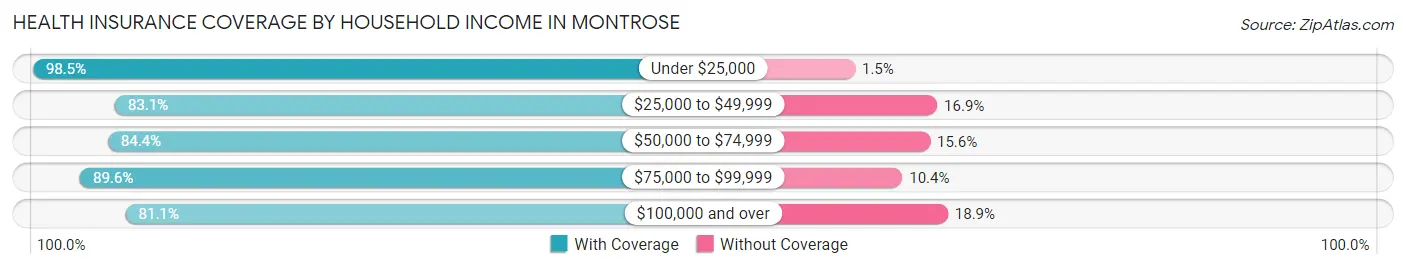
| Household Income | With Coverage | Without Coverage |
| Under $25,000 | 2,232 (98.5%) | 35 (1.5%) |
| $25,000 to $49,999 | 1,330 (83.1%) | 271 (16.9%) |
| $50,000 to $74,999 | 1,098 (84.4%) | 203 (15.6%) |
| $75,000 to $99,999 | 1,448 (89.6%) | 168 (10.4%) |
| $100,000 and over | 1,272 (81.1%) | 297 (18.9%) |
Public vs Private Health Insurance Coverage by Age in Montrose
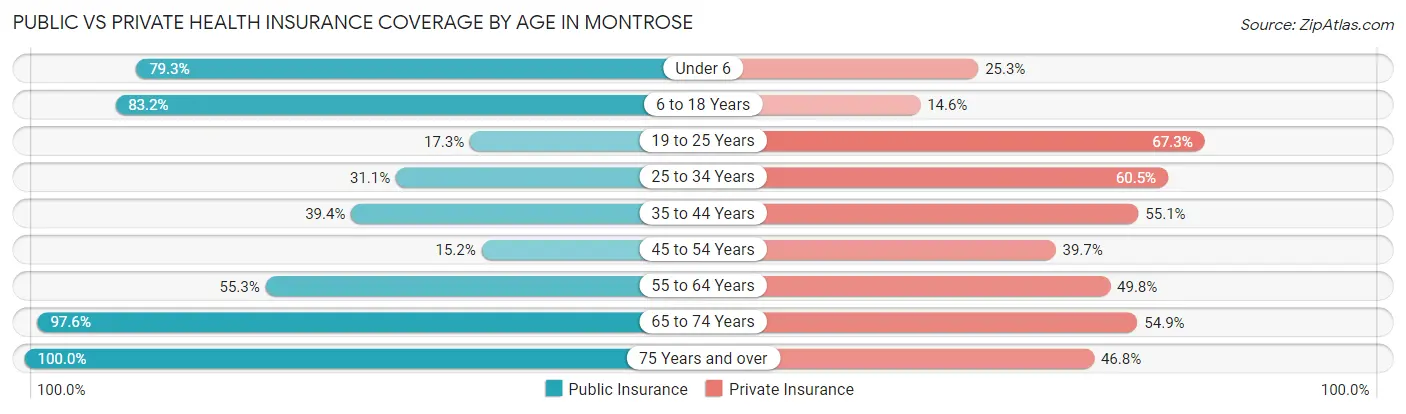
| Age Bracket | Public Insurance | Private Insurance |
| Under 6 | 501 (79.3%) | 160 (25.3%) |
| 6 to 18 Years | 1,098 (83.2%) | 192 (14.5%) |
| 19 to 25 Years | 141 (17.3%) | 548 (67.3%) |
| 25 to 34 Years | 236 (31.0%) | 460 (60.5%) |
| 35 to 44 Years | 537 (39.4%) | 751 (55.1%) |
| 45 to 54 Years | 153 (15.2%) | 400 (39.7%) |
| 55 to 64 Years | 544 (55.3%) | 490 (49.8%) |
| 65 to 74 Years | 772 (97.6%) | 434 (54.9%) |
| 75 Years and over | 690 (100.0%) | 323 (46.8%) |
| Total | 4,672 (55.9%) | 3,758 (44.9%) |
Disability Status by Sex by Age in Montrose
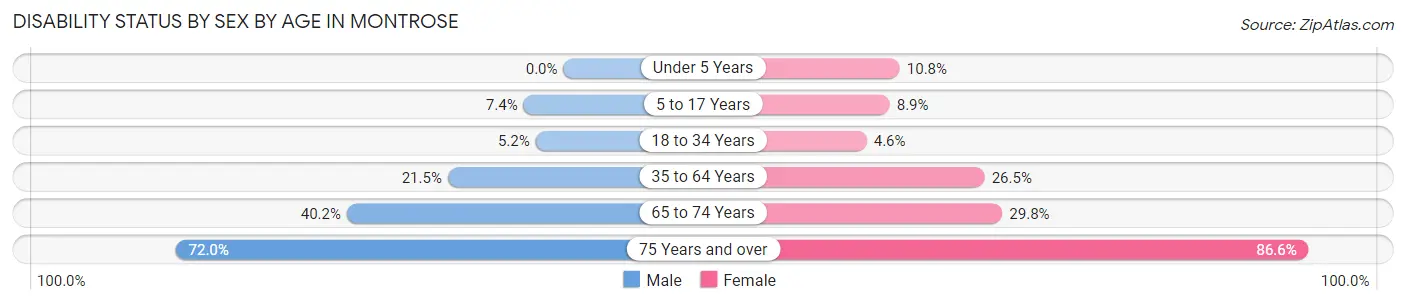
| Age Bracket | Male | Female |
| Under 5 Years | 0 (0.0%) | 36 (10.8%) |
| 5 to 17 Years | 39 (7.4%) | 73 (8.9%) |
| 18 to 34 Years | 29 (5.2%) | 52 (4.6%) |
| 35 to 64 Years | 268 (21.5%) | 559 (26.5%) |
| 65 to 74 Years | 82 (40.2%) | 175 (29.8%) |
| 75 Years and over | 136 (72.0%) | 434 (86.6%) |
Disability Class by Sex by Age in Montrose
Disability Class: Hearing Difficulty
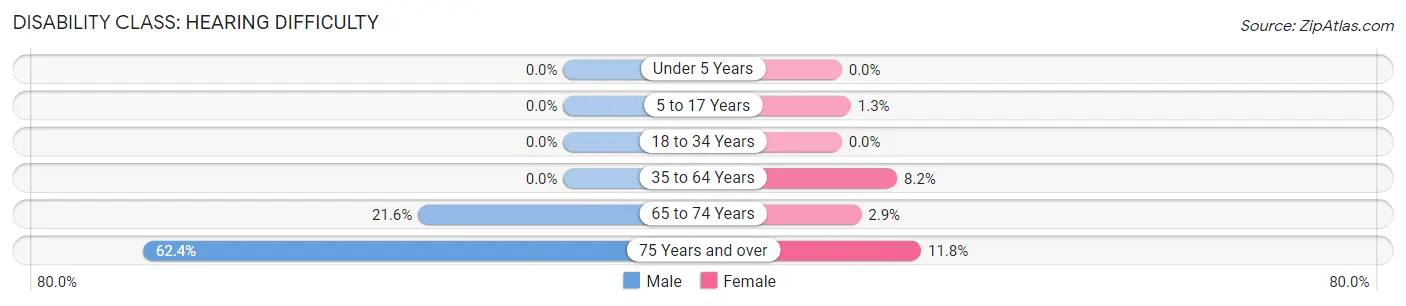
| Age Bracket | Male | Female |
| Under 5 Years | 0 (0.0%) | 0 (0.0%) |
| 5 to 17 Years | 0 (0.0%) | 11 (1.3%) |
| 18 to 34 Years | 0 (0.0%) | 0 (0.0%) |
| 35 to 64 Years | 0 (0.0%) | 173 (8.2%) |
| 65 to 74 Years | 44 (21.6%) | 17 (2.9%) |
| 75 Years and over | 118 (62.4%) | 59 (11.8%) |
Disability Class: Vision Difficulty
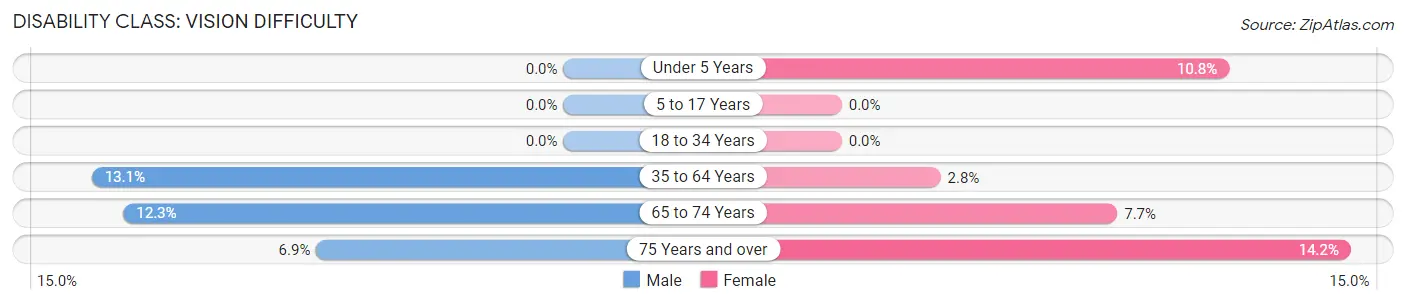
| Age Bracket | Male | Female |
| Under 5 Years | 0 (0.0%) | 36 (10.8%) |
| 5 to 17 Years | 0 (0.0%) | 0 (0.0%) |
| 18 to 34 Years | 0 (0.0%) | 0 (0.0%) |
| 35 to 64 Years | 164 (13.1%) | 58 (2.8%) |
| 65 to 74 Years | 25 (12.2%) | 45 (7.7%) |
| 75 Years and over | 13 (6.9%) | 71 (14.2%) |
Disability Class: Cognitive Difficulty
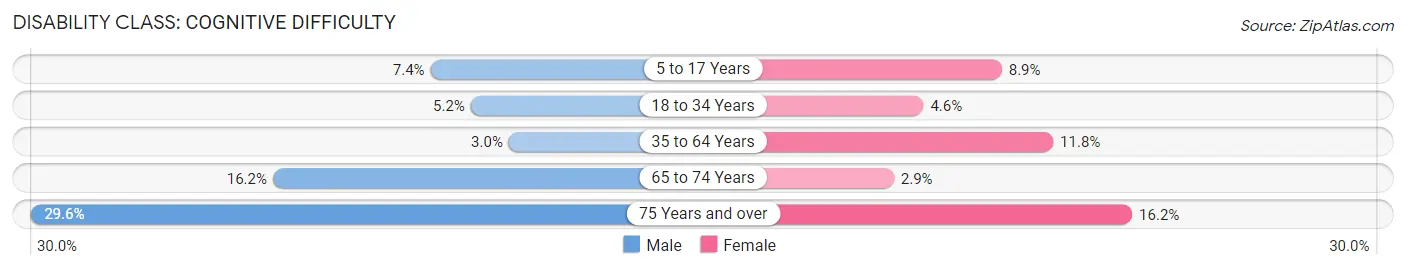
| Age Bracket | Male | Female |
| 5 to 17 Years | 39 (7.4%) | 73 (8.9%) |
| 18 to 34 Years | 29 (5.2%) | 51 (4.5%) |
| 35 to 64 Years | 38 (3.0%) | 248 (11.8%) |
| 65 to 74 Years | 33 (16.2%) | 17 (2.9%) |
| 75 Years and over | 56 (29.6%) | 81 (16.2%) |
Disability Class: Ambulatory Difficulty
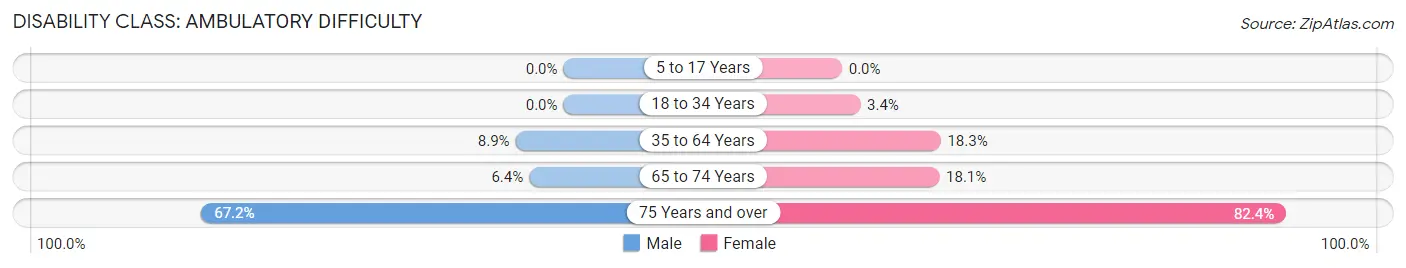
| Age Bracket | Male | Female |
| 5 to 17 Years | 0 (0.0%) | 0 (0.0%) |
| 18 to 34 Years | 0 (0.0%) | 38 (3.4%) |
| 35 to 64 Years | 111 (8.9%) | 386 (18.3%) |
| 65 to 74 Years | 13 (6.4%) | 106 (18.1%) |
| 75 Years and over | 127 (67.2%) | 413 (82.4%) |
Disability Class: Self-Care Difficulty
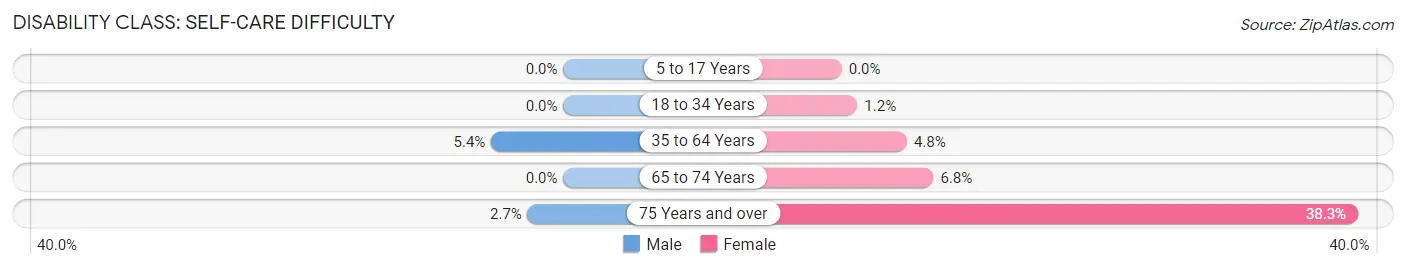
| Age Bracket | Male | Female |
| 5 to 17 Years | 0 (0.0%) | 0 (0.0%) |
| 18 to 34 Years | 0 (0.0%) | 13 (1.2%) |
| 35 to 64 Years | 67 (5.4%) | 102 (4.8%) |
| 65 to 74 Years | 0 (0.0%) | 40 (6.8%) |
| 75 Years and over | 5 (2.6%) | 192 (38.3%) |
Technology Access in Montrose
Computing Device Access in Montrose
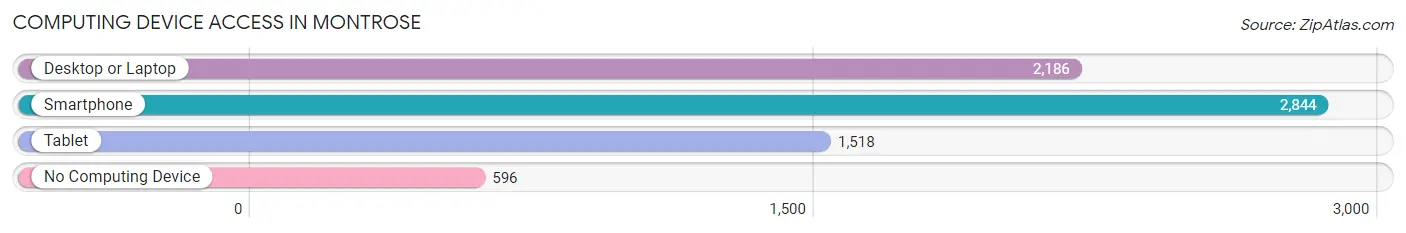
| Device Type | # Households | % Households |
| Desktop or Laptop | 2,186 | 60.9% |
| Smartphone | 2,844 | 79.2% |
| Tablet | 1,518 | 42.3% |
| No Computing Device | 596 | 16.6% |
| Total | 3,589 | 100.0% |
Internet Access in Montrose
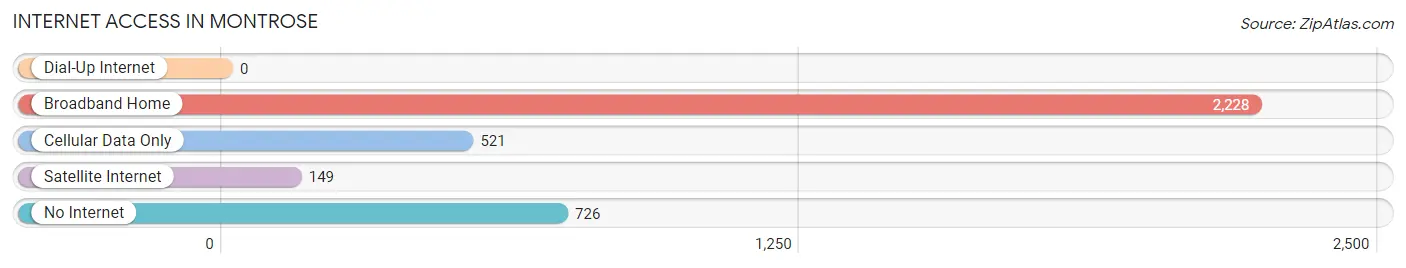
| Internet Type | # Households | % Households |
| Dial-Up Internet | 0 | 0.0% |
| Broadband Home | 2,228 | 62.1% |
| Cellular Data Only | 521 | 14.5% |
| Satellite Internet | 149 | 4.2% |
| No Internet | 726 | 20.2% |
| Total | 3,589 | 100.0% |
Montrose Summary
Montrose is a small unincorporated community located in Albemarle County, Virginia. It is situated in the foothills of the Blue Ridge Mountains, approximately 10 miles south of Charlottesville. The community is home to a population of approximately 500 people, and is known for its rural charm and close-knit community.
History
Montrose was first settled in the late 1700s by a group of German immigrants. The community was originally known as “Mountain Rose”, and was later shortened to “Montrose”. The town was officially established in 1809, and was named after the Scottish town of Montrose.
The town was a popular stop for travelers on the James River and Kanawha Canal, which ran through the area. The canal was an important transportation route for goods and people, and helped to spur the growth of the town.
In the late 1800s, Montrose was a thriving agricultural community. The town was home to several farms, and was known for its production of apples, peaches, and other fruits. The town also had a thriving lumber industry, and was home to several sawmills.
In the early 1900s, Montrose began to decline. The James River and Kanawha Canal was replaced by the railroad, and the town’s economy shifted away from agriculture and lumber. The town’s population began to decline, and by the mid-1900s, Montrose was a small, quiet community.
Geography
Montrose is located in the foothills of the Blue Ridge Mountains, approximately 10 miles south of Charlottesville. The town is situated on the banks of the James River, and is surrounded by rolling hills and forests. The town is located in a rural area, and is known for its scenic beauty and peaceful atmosphere.
The climate in Montrose is mild and temperate. Summers are warm and humid, with temperatures reaching into the mid-80s. Winters are cold and wet, with temperatures dropping into the low-30s. The town receives an average of 45 inches of rain per year, and is known for its mild winters and warm summers.
Economy
Montrose is a small, rural community with a limited economy. The town is home to several small businesses, including a grocery store, a hardware store, and a few restaurants. The town is also home to a few small farms, and is known for its production of apples, peaches, and other fruits.
The town is also home to a few small manufacturing companies, including a furniture factory and a woodworking shop. The town is also home to a few small wineries, and is known for its production of wine.
Demographics
Montrose is home to a population of approximately 500 people. The town is predominantly white, with a small African American population. The town is also home to a small Hispanic population, and a few Native American families.
The town is home to a few churches, including a Methodist church, a Baptist church, and a Catholic church. The town is also home to a few schools, including a public elementary school and a private high school.
Montrose is a small, rural community with a close-knit community. The town is known for its scenic beauty and peaceful atmosphere, and is a popular destination for tourists and outdoor enthusiasts. The town is also home to a few small businesses, and is known for its production of apples, peaches, and other fruits.
Common Questions
What is Per Capita Income in Montrose?
Per Capita income in Montrose is $23,625.
What is the Median Family Income in Montrose?
Median Family Income in Montrose is $52,960.
What is the Median Household income in Montrose?
Median Household Income in Montrose is $39,023.
What is Income or Wage Gap in Montrose?
Income or Wage Gap in Montrose is 31.9%.
Women in Montrose earn 68.1 cents for every dollar earned by a man.
What is Inequality or Gini Index in Montrose?
Inequality or Gini Index in Montrose is 0.42.
What is the Total Population of Montrose?
Total Population of Montrose is 8,363.
What is the Total Male Population of Montrose?
Total Male Population of Montrose is 2,894.
What is the Total Female Population of Montrose?
Total Female Population of Montrose is 5,469.
What is the Ratio of Males per 100 Females in Montrose?
There are 52.92 Males per 100 Females in Montrose.
What is the Ratio of Females per 100 Males in Montrose?
There are 188.98 Females per 100 Males in Montrose.
What is the Median Population Age in Montrose?
Median Population Age in Montrose is 39.7 Years.
What is the Average Family Size in Montrose
Average Family Size in Montrose is 3.2 People.
What is the Average Household Size in Montrose
Average Household Size in Montrose is 2.3 People.
How Large is the Labor Force in Montrose?
There are 4,065 People in the Labor Forcein in Montrose.
What is the Percentage of People in the Labor Force in Montrose?
59.6% of People are in the Labor Force in Montrose.
What is the Unemployment Rate in Montrose?
Unemployment Rate in Montrose is 4.3%.