Belview, VA Map & Demographics
Belview Map
Belview Overview
$18,448
PER CAPITA INCOME
$38,458
AVG FAMILY INCOME
$52,969
AVG HOUSEHOLD INCOME
52.6%
WAGE / INCOME GAP [ % ]
47.4¢/ $1
WAGE / INCOME GAP [ $ ]
0.25
INEQUALITY / GINI INDEX
1,197
TOTAL POPULATION
656
MALE POPULATION
541
FEMALE POPULATION
121.26
MALES / 100 FEMALES
82.47
FEMALES / 100 MALES
26.2
MEDIAN AGE
3.2
AVG FAMILY SIZE
2.8
AVG HOUSEHOLD SIZE
491
LABOR FORCE [ PEOPLE ]
56.3%
PERCENT IN LABOR FORCE
Income in Belview
Income Overview in Belview
Per Capita Income in Belview is $18,448, while median incomes of families and households are $38,458 and $52,969 respectively.
| Characteristic | Number | Measure |
| Per Capita Income | 1,197 | $18,448 |
| Median Family Income | 301 | $38,458 |
| Mean Family Income | 301 | $43,513 |
| Median Household Income | 426 | $52,969 |
| Mean Household Income | 426 | $49,235 |
| Income Deficit | 301 | $0 |
| Wage / Income Gap (%) | 1,197 | 52.56% |
| Wage / Income Gap ($) | 1,197 | 47.44¢ per $1 |
| Gini / Inequality Index | 1,197 | 0.25 |
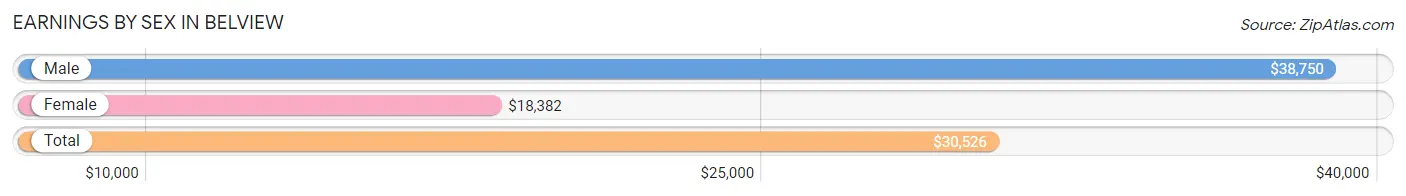
Earnings by Sex in Belview
Average Earnings in Belview are $30,526, $38,750 for men and $18,382 for women, a difference of 52.6%.
| Sex | Number | Average Earnings |
| Male | 368 (73.9%) | $38,750 |
| Female | 130 (26.1%) | $18,382 |
| Total | 498 (100.0%) | $30,526 |
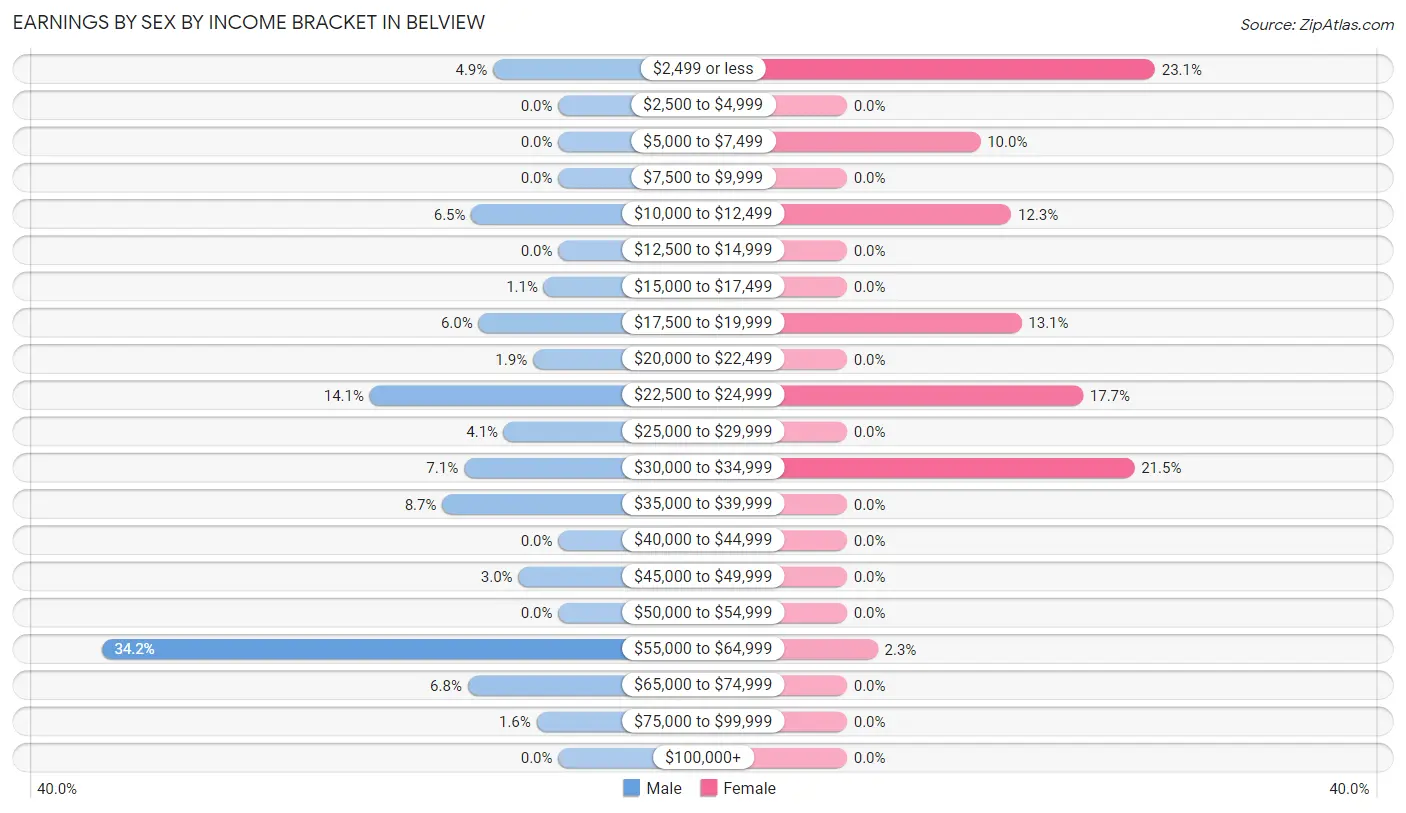
Earnings by Sex by Income Bracket in Belview
The most common earnings brackets in Belview are $55,000 to $64,999 for men (126 | 34.2%) and $2,499 or less for women (30 | 23.1%).
| Income | Male | Female |
| $2,499 or less | 18 (4.9%) | 30 (23.1%) |
| $2,500 to $4,999 | 0 (0.0%) | 0 (0.0%) |
| $5,000 to $7,499 | 0 (0.0%) | 13 (10.0%) |
| $7,500 to $9,999 | 0 (0.0%) | 0 (0.0%) |
| $10,000 to $12,499 | 24 (6.5%) | 16 (12.3%) |
| $12,500 to $14,999 | 0 (0.0%) | 0 (0.0%) |
| $15,000 to $17,499 | 4 (1.1%) | 0 (0.0%) |
| $17,500 to $19,999 | 22 (6.0%) | 17 (13.1%) |
| $20,000 to $22,499 | 7 (1.9%) | 0 (0.0%) |
| $22,500 to $24,999 | 52 (14.1%) | 23 (17.7%) |
| $25,000 to $29,999 | 15 (4.1%) | 0 (0.0%) |
| $30,000 to $34,999 | 26 (7.1%) | 28 (21.5%) |
| $35,000 to $39,999 | 32 (8.7%) | 0 (0.0%) |
| $40,000 to $44,999 | 0 (0.0%) | 0 (0.0%) |
| $45,000 to $49,999 | 11 (3.0%) | 0 (0.0%) |
| $50,000 to $54,999 | 0 (0.0%) | 0 (0.0%) |
| $55,000 to $64,999 | 126 (34.2%) | 3 (2.3%) |
| $65,000 to $74,999 | 25 (6.8%) | 0 (0.0%) |
| $75,000 to $99,999 | 6 (1.6%) | 0 (0.0%) |
| $100,000+ | 0 (0.0%) | 0 (0.0%) |
| Total | 368 (100.0%) | 130 (100.0%) |
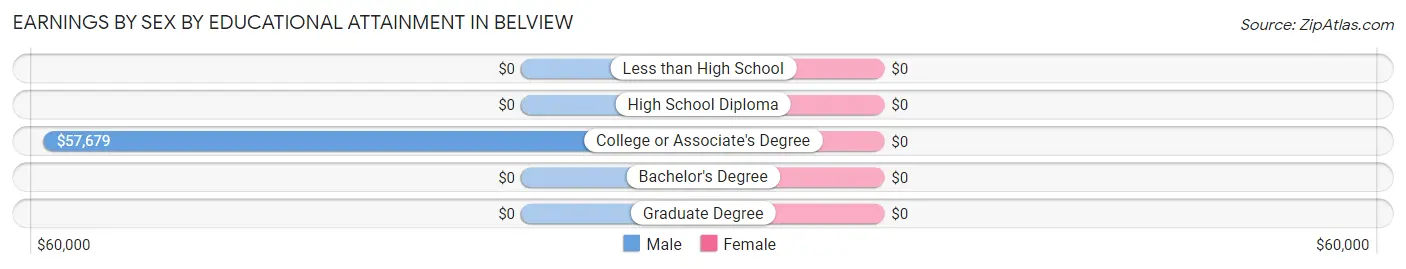
Earnings by Sex by Educational Attainment in Belview
| Educational Attainment | Male Income | Female Income |
| Less than High School | - | - |
| High School Diploma | - | - |
| College or Associate's Degree | $57,679 | $0 |
| Bachelor's Degree | - | - |
| Graduate Degree | - | - |
| Total | $62,753 | $0 |
Family Income in Belview
Family Income Brackets in Belview
According to the Belview family income data, there are 86 families falling into the $50,000 to $74,999 income range, which is the most common income bracket and makes up 28.6% of all families.
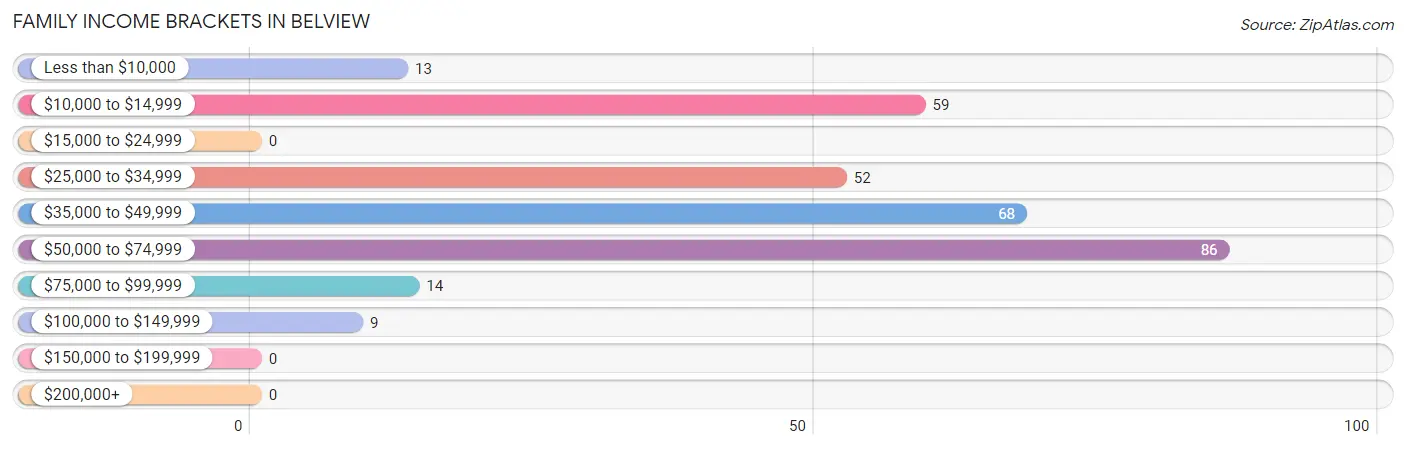
| Income Bracket | # Families | % Families |
| Less than $10,000 | 13 | 4.3% |
| $10,000 to $14,999 | 59 | 19.6% |
| $15,000 to $24,999 | 0 | 0.0% |
| $25,000 to $34,999 | 52 | 17.3% |
| $35,000 to $49,999 | 68 | 22.6% |
| $50,000 to $74,999 | 86 | 28.6% |
| $75,000 to $99,999 | 14 | 4.7% |
| $100,000 to $149,999 | 9 | 3.0% |
| $150,000 to $199,999 | 0 | 0.0% |
| $200,000+ | 0 | 0.0% |
Family Income by Famaliy Size in Belview
3-person families (78 | 25.9%) account for the highest median family income in Belview with $43,478 per family, while 3-person families (78 | 25.9%) have the highest median income of $14,493 per family member.
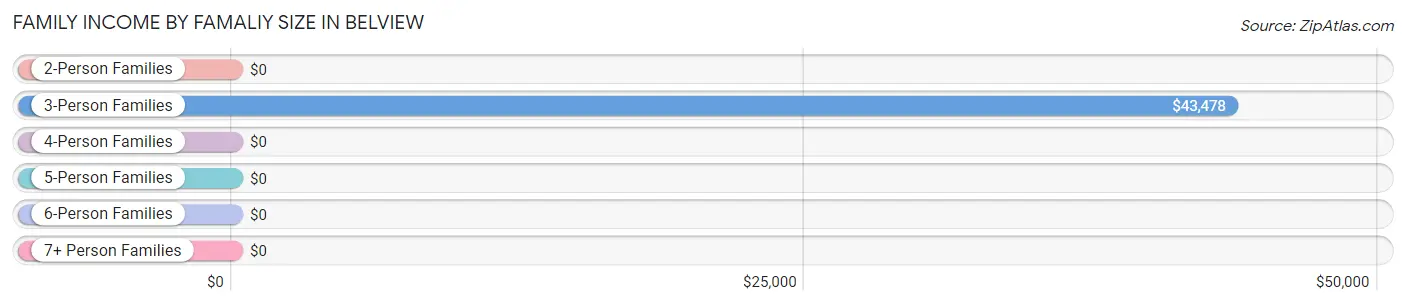
| Income Bracket | # Families | Median Income |
| 2-Person Families | 140 (46.5%) | $0 |
| 3-Person Families | 78 (25.9%) | $43,478 |
| 4-Person Families | 83 (27.6%) | $0 |
| 5-Person Families | 0 (0.0%) | $0 |
| 6-Person Families | 0 (0.0%) | $0 |
| 7+ Person Families | 0 (0.0%) | $0 |
| Total | 301 (100.0%) | $38,458 |
Family Income by Number of Earners in Belview
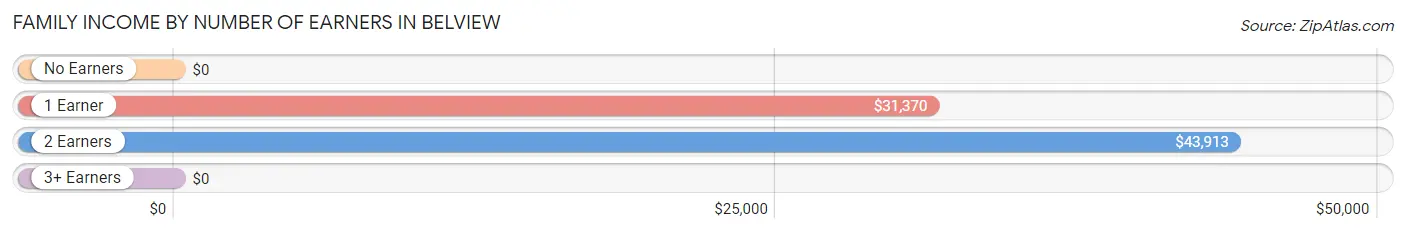
| Number of Earners | # Families | Median Income |
| No Earners | 58 (19.3%) | $0 |
| 1 Earner | 123 (40.9%) | $31,370 |
| 2 Earners | 116 (38.5%) | $43,913 |
| 3+ Earners | 4 (1.3%) | $0 |
| Total | 301 (100.0%) | $38,458 |
Household Income in Belview
Household Income Brackets in Belview
With 193 households falling in the category, the $50,000 to $74,999 income range is the most frequent in Belview, accounting for 45.3% of all households.
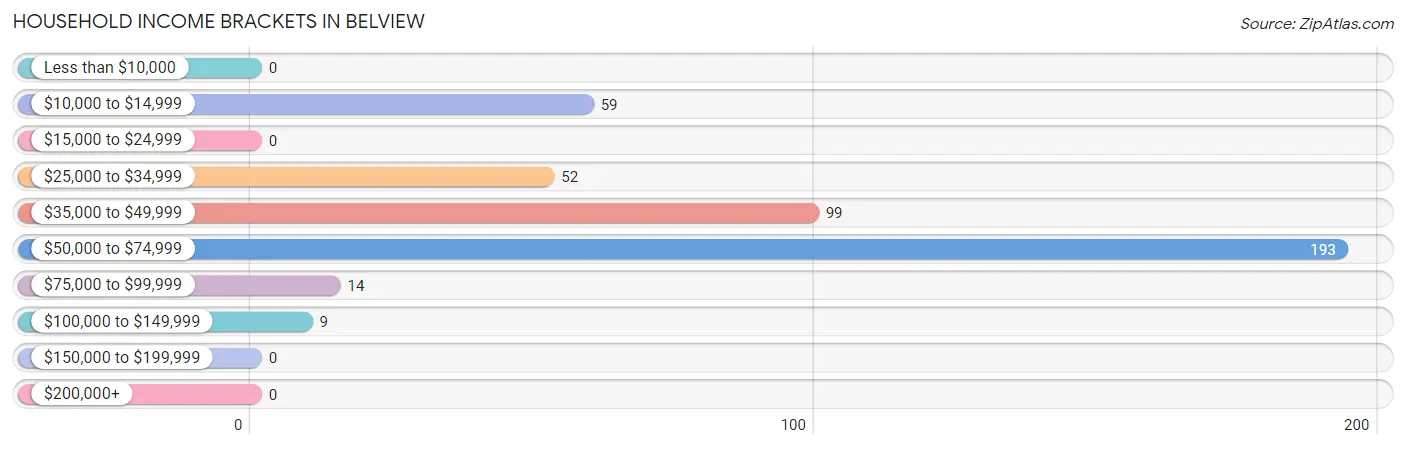
| Income Bracket | # Households | % Households |
| Less than $10,000 | 0 | 0.0% |
| $10,000 to $14,999 | 59 | 13.8% |
| $15,000 to $24,999 | 0 | 0.0% |
| $25,000 to $34,999 | 52 | 12.2% |
| $35,000 to $49,999 | 99 | 23.2% |
| $50,000 to $74,999 | 193 | 45.3% |
| $75,000 to $99,999 | 14 | 3.3% |
| $100,000 to $149,999 | 9 | 2.1% |
| $150,000 to $199,999 | 0 | 0.0% |
| $200,000+ | 0 | 0.0% |
Household Income by Householder Age in Belview
The median household income in Belview is $52,969, with the highest median household income of $80,875 found in the 65+ years age bracket for the primary householder. A total of 25 households (5.9%) fall into this category. Meanwhile, the 15 to 24 years age bracket for the primary householder has the lowest median household income of $35,583, with 111 households (26.1%) in this group.
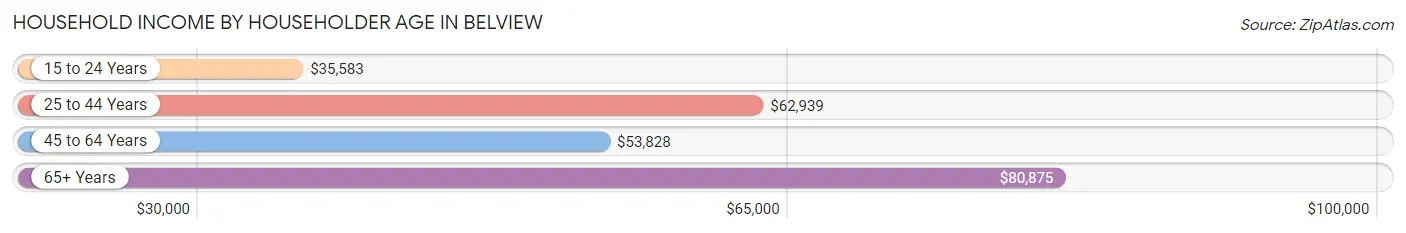
| Income Bracket | # Households | Median Income |
| 15 to 24 Years | 111 (26.1%) | $35,583 |
| 25 to 44 Years | 211 (49.5%) | $62,939 |
| 45 to 64 Years | 79 (18.5%) | $53,828 |
| 65+ Years | 25 (5.9%) | $80,875 |
| Total | 426 (100.0%) | $52,969 |
Poverty in Belview
Income Below Poverty by Sex and Age in Belview
With 25.3% poverty level for males and 38.6% for females among the residents of Belview, 12 to 14 year old males and 6 to 11 year old females are the most vulnerable to poverty, with 36 males (100.0%) and 137 females (97.2%) in their respective age groups living below the poverty level.
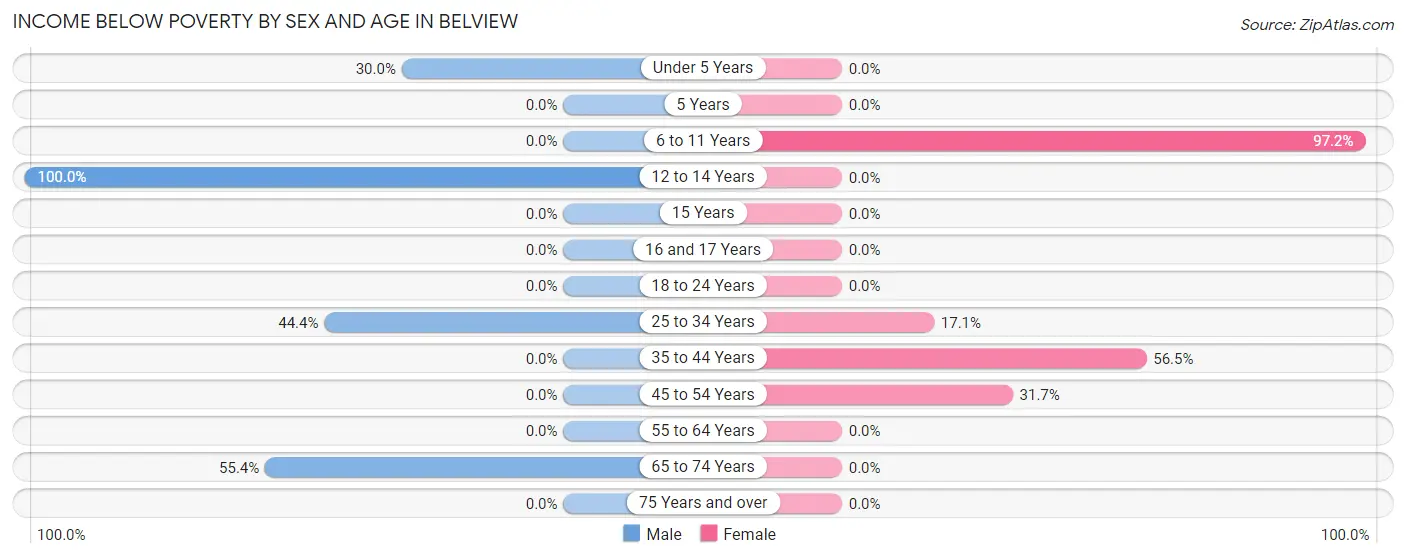
| Age Bracket | Male | Female |
| Under 5 Years | 24 (30.0%) | 0 (0.0%) |
| 5 Years | 0 (0.0%) | 0 (0.0%) |
| 6 to 11 Years | 0 (0.0%) | 137 (97.2%) |
| 12 to 14 Years | 36 (100.0%) | 0 (0.0%) |
| 15 Years | 0 (0.0%) | 0 (0.0%) |
| 16 and 17 Years | 0 (0.0%) | 0 (0.0%) |
| 18 to 24 Years | 0 (0.0%) | 0 (0.0%) |
| 25 to 34 Years | 75 (44.4%) | 20 (17.1%) |
| 35 to 44 Years | 0 (0.0%) | 39 (56.5%) |
| 45 to 54 Years | 0 (0.0%) | 13 (31.7%) |
| 55 to 64 Years | 0 (0.0%) | 0 (0.0%) |
| 65 to 74 Years | 31 (55.4%) | 0 (0.0%) |
| 75 Years and over | 0 (0.0%) | 0 (0.0%) |
| Total | 166 (25.3%) | 209 (38.6%) |
Income Above Poverty by Sex and Age in Belview
According to the poverty statistics in Belview, males aged 5 years and females aged 16 and 17 years are the age groups that are most secure financially, with 100.0% of males and 100.0% of females in these age groups living above the poverty line.
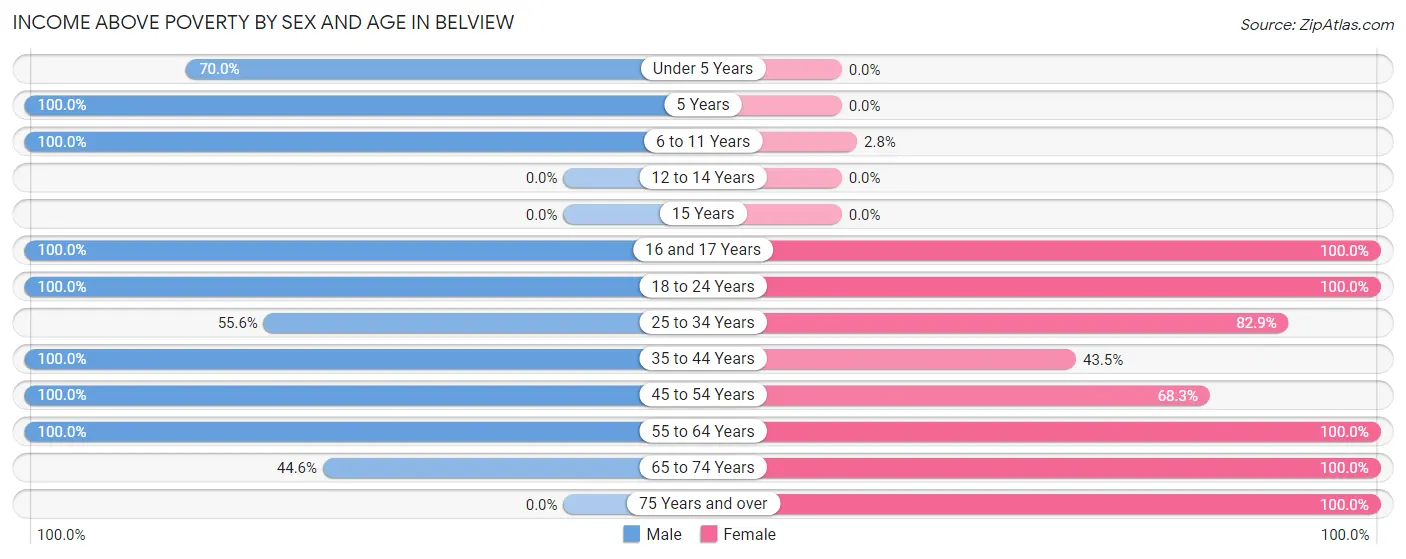
| Age Bracket | Male | Female |
| Under 5 Years | 56 (70.0%) | 0 (0.0%) |
| 5 Years | 21 (100.0%) | 0 (0.0%) |
| 6 to 11 Years | 47 (100.0%) | 4 (2.8%) |
| 12 to 14 Years | 0 (0.0%) | 0 (0.0%) |
| 15 Years | 0 (0.0%) | 0 (0.0%) |
| 16 and 17 Years | 22 (100.0%) | 30 (100.0%) |
| 18 to 24 Years | 115 (100.0%) | 81 (100.0%) |
| 25 to 34 Years | 94 (55.6%) | 97 (82.9%) |
| 35 to 44 Years | 68 (100.0%) | 30 (43.5%) |
| 45 to 54 Years | 14 (100.0%) | 28 (68.3%) |
| 55 to 64 Years | 28 (100.0%) | 31 (100.0%) |
| 65 to 74 Years | 25 (44.6%) | 21 (100.0%) |
| 75 Years and over | 0 (0.0%) | 10 (100.0%) |
| Total | 490 (74.7%) | 332 (61.4%) |
Income Below Poverty Among Married-Couple Families in Belview
The poverty statistics for married-couple families in Belview show that 11.9% or 20 of the total 168 families live below the poverty line. Families with 1 or 2 children have the highest poverty rate of 17.0%, comprising of 20 families. On the other hand, families with no children have the lowest poverty rate of 0.0%, which includes 0 families.
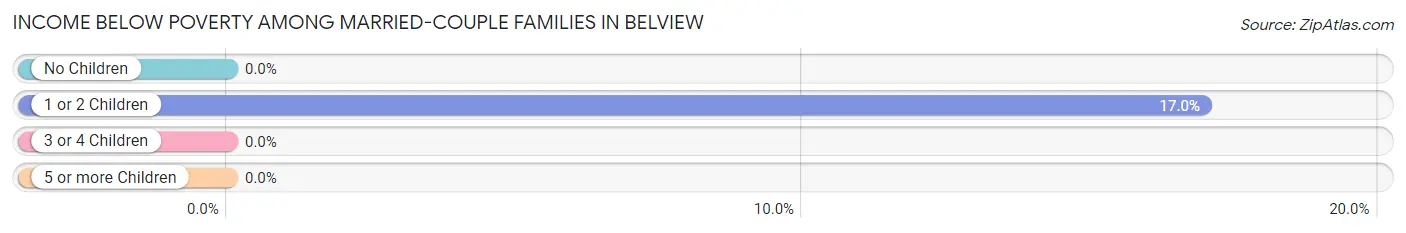
| Children | Above Poverty | Below Poverty |
| No Children | 50 (100.0%) | 0 (0.0%) |
| 1 or 2 Children | 98 (83.1%) | 20 (17.0%) |
| 3 or 4 Children | 0 (0.0%) | 0 (0.0%) |
| 5 or more Children | 0 (0.0%) | 0 (0.0%) |
| Total | 148 (88.1%) | 20 (11.9%) |
Income Below Poverty Among Single-Parent Households in Belview
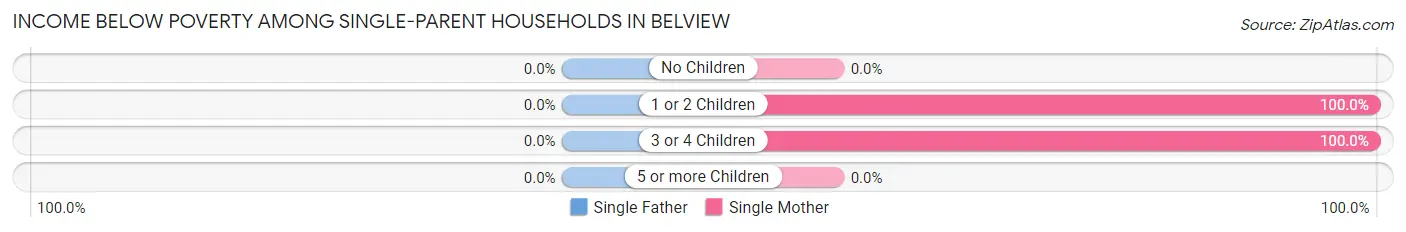
| Children | Single Father | Single Mother |
| No Children | 0 (0.0%) | 0 (0.0%) |
| 1 or 2 Children | 0 (0.0%) | 13 (100.0%) |
| 3 or 4 Children | 0 (0.0%) | 39 (100.0%) |
| 5 or more Children | 0 (0.0%) | 0 (0.0%) |
| Total | 0 (0.0%) | 52 (100.0%) |
Income Below Poverty Among Married-Couple vs Single-Parent Households in Belview
The poverty data for Belview shows that 20 of the married-couple family households (11.9%) and 52 of the single-parent households (39.1%) are living below the poverty level. Within the married-couple family households, those with 1 or 2 children have the highest poverty rate, with 20 households (17.0%) falling below the poverty line. Among the single-parent households, those with 3 or 4 children have the highest poverty rate, with 39 household (100.0%) living below poverty.
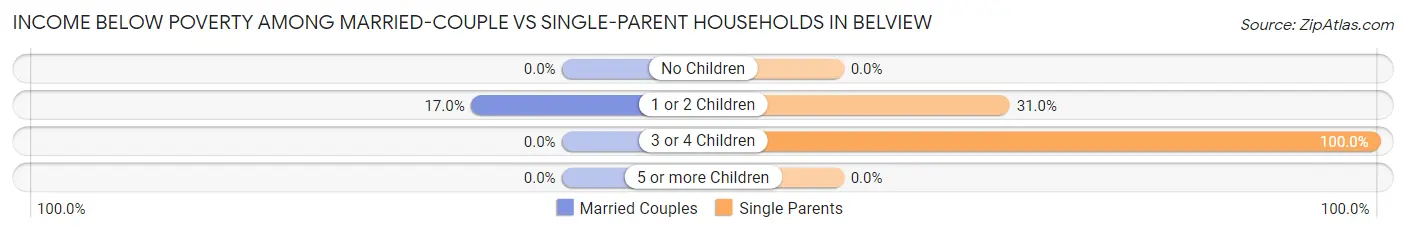
| Children | Married-Couple Families | Single-Parent Households |
| No Children | 0 (0.0%) | 0 (0.0%) |
| 1 or 2 Children | 20 (17.0%) | 13 (30.9%) |
| 3 or 4 Children | 0 (0.0%) | 39 (100.0%) |
| 5 or more Children | 0 (0.0%) | 0 (0.0%) |
| Total | 20 (11.9%) | 52 (39.1%) |
Race in Belview
The most populous races in Belview are White / Caucasian (877 | 73.3%), Black / African American (238 | 19.9%), and Hispanic or Latino (75 | 6.3%).
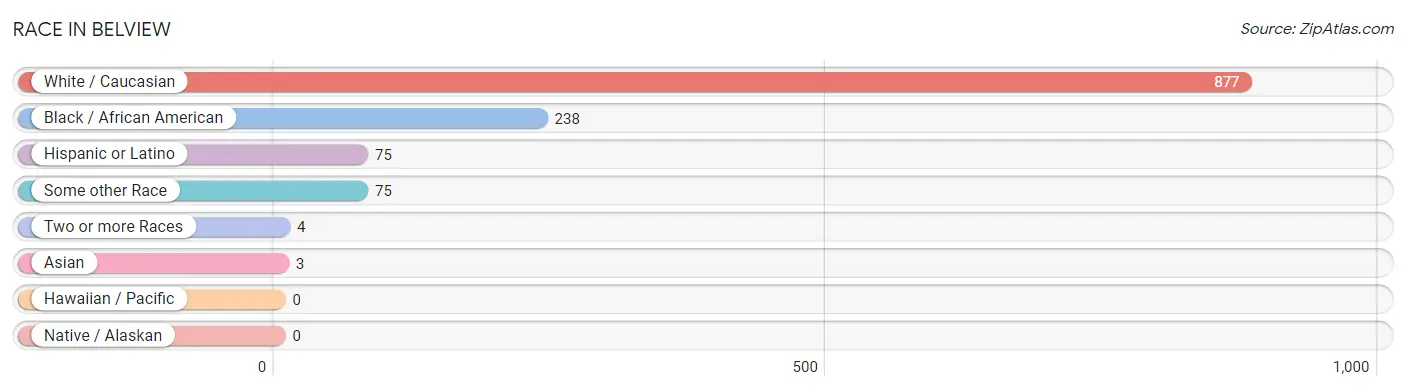
| Race | # Population | % Population |
| Asian | 3 | 0.3% |
| Black / African American | 238 | 19.9% |
| Hawaiian / Pacific | 0 | 0.0% |
| Hispanic or Latino | 75 | 6.3% |
| Native / Alaskan | 0 | 0.0% |
| White / Caucasian | 877 | 73.3% |
| Two or more Races | 4 | 0.3% |
| Some other Race | 75 | 6.3% |
| Total | 1,197 | 100.0% |
Ancestry in Belview
The most populous ancestries reported in Belview are American (455 | 38.0%), Central American (75 | 6.3%), Honduran (75 | 6.3%), English (66 | 5.5%), and Irish (55 | 4.6%), together accounting for 60.7% of all Belview residents.
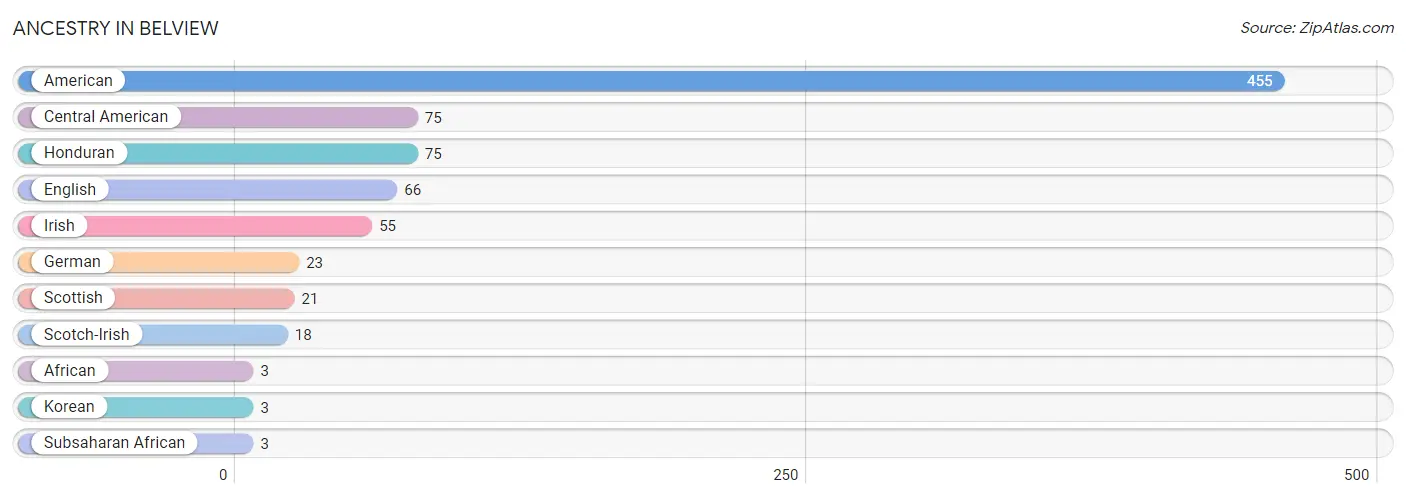
| Ancestry | # Population | % Population |
| African | 3 | 0.3% |
| American | 455 | 38.0% |
| Central American | 75 | 6.3% |
| English | 66 | 5.5% |
| German | 23 | 1.9% |
| Honduran | 75 | 6.3% |
| Irish | 55 | 4.6% |
| Korean | 3 | 0.3% |
| Scotch-Irish | 18 | 1.5% |
| Scottish | 21 | 1.8% |
| Subsaharan African | 3 | 0.3% | View All 11 Rows |
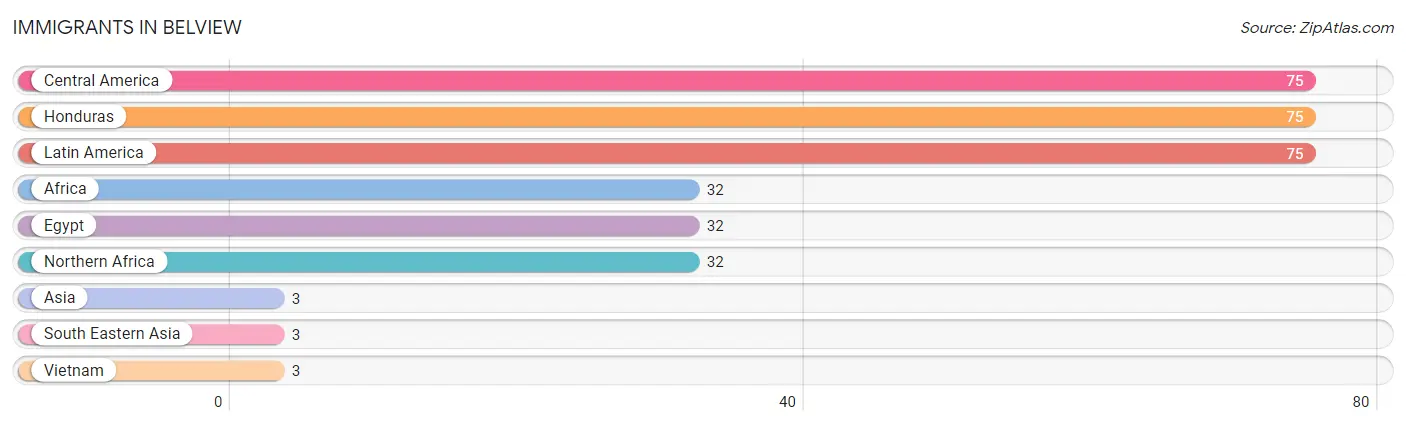
Immigrants in Belview
The most numerous immigrant groups reported in Belview came from Central America (75 | 6.3%), Honduras (75 | 6.3%), Latin America (75 | 6.3%), Africa (32 | 2.7%), and Egypt (32 | 2.7%), together accounting for 24.2% of all Belview residents.
| Immigration Origin | # Population | % Population |
| Africa | 32 | 2.7% |
| Asia | 3 | 0.3% |
| Central America | 75 | 6.3% |
| Egypt | 32 | 2.7% |
| Honduras | 75 | 6.3% |
| Latin America | 75 | 6.3% |
| Northern Africa | 32 | 2.7% |
| South Eastern Asia | 3 | 0.3% |
| Vietnam | 3 | 0.3% | View All 9 Rows |
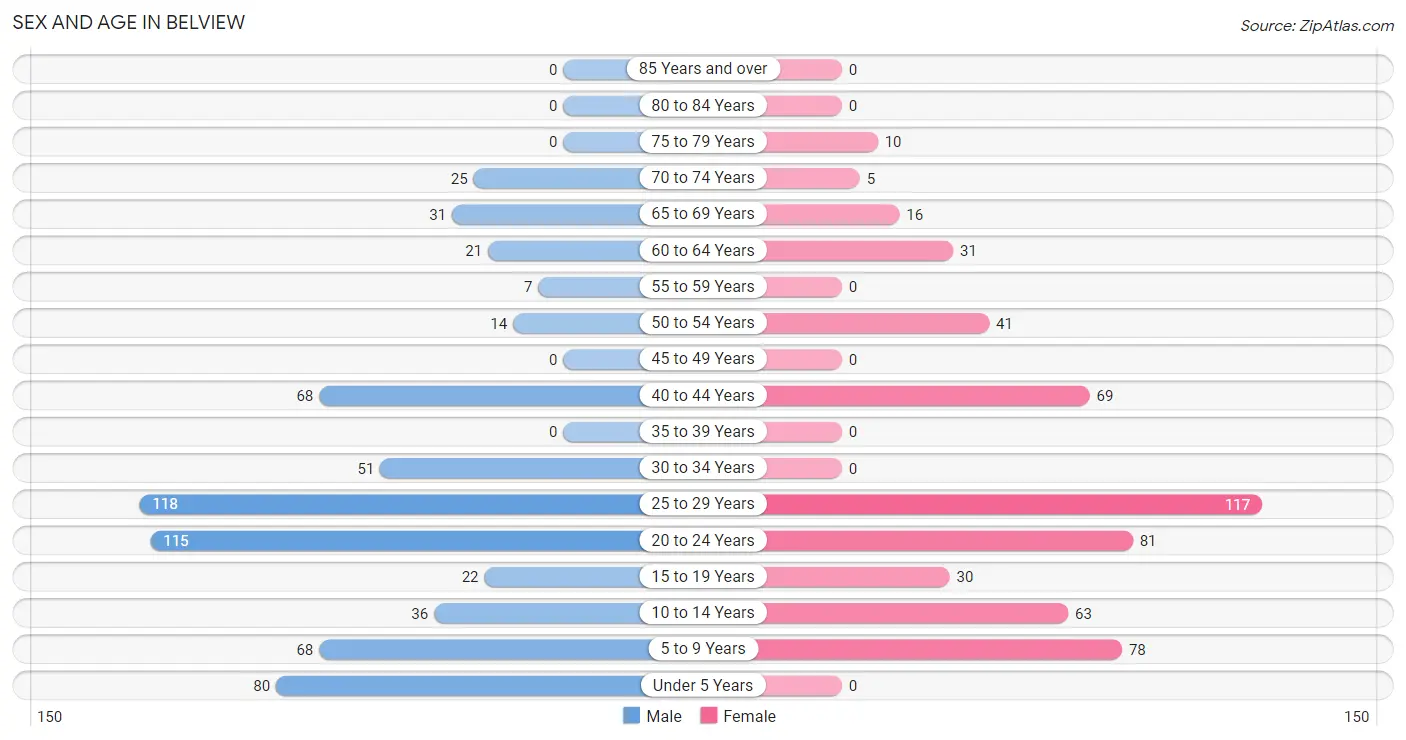
Sex and Age in Belview
Sex and Age in Belview
The most populous age groups in Belview are 25 to 29 Years (118 | 18.0%) for men and 25 to 29 Years (117 | 21.6%) for women.
| Age Bracket | Male | Female |
| Under 5 Years | 80 (12.2%) | 0 (0.0%) |
| 5 to 9 Years | 68 (10.4%) | 78 (14.4%) |
| 10 to 14 Years | 36 (5.5%) | 63 (11.7%) |
| 15 to 19 Years | 22 (3.4%) | 30 (5.6%) |
| 20 to 24 Years | 115 (17.5%) | 81 (15.0%) |
| 25 to 29 Years | 118 (18.0%) | 117 (21.6%) |
| 30 to 34 Years | 51 (7.8%) | 0 (0.0%) |
| 35 to 39 Years | 0 (0.0%) | 0 (0.0%) |
| 40 to 44 Years | 68 (10.4%) | 69 (12.8%) |
| 45 to 49 Years | 0 (0.0%) | 0 (0.0%) |
| 50 to 54 Years | 14 (2.1%) | 41 (7.6%) |
| 55 to 59 Years | 7 (1.1%) | 0 (0.0%) |
| 60 to 64 Years | 21 (3.2%) | 31 (5.7%) |
| 65 to 69 Years | 31 (4.7%) | 16 (3.0%) |
| 70 to 74 Years | 25 (3.8%) | 5 (0.9%) |
| 75 to 79 Years | 0 (0.0%) | 10 (1.8%) |
| 80 to 84 Years | 0 (0.0%) | 0 (0.0%) |
| 85 Years and over | 0 (0.0%) | 0 (0.0%) |
| Total | 656 (100.0%) | 541 (100.0%) |
Families and Households in Belview
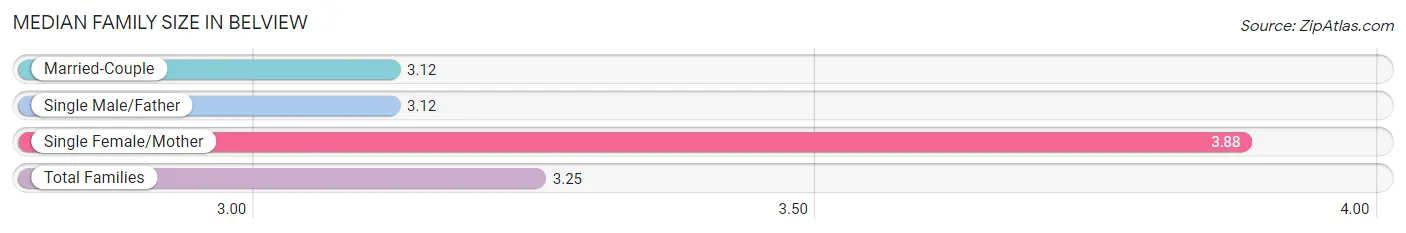
Median Family Size in Belview
The median family size in Belview is 3.25 persons per family, with single female/mother families (52 | 17.3%) accounting for the largest median family size of 3.88 persons per family. On the other hand, married-couple families (168 | 55.8%) represent the smallest median family size with 3.12 persons per family.
| Family Type | # Families | Family Size |
| Married-Couple | 168 (55.8%) | 3.12 |
| Single Male/Father | 81 (26.9%) | 3.12 |
| Single Female/Mother | 52 (17.3%) | 3.88 |
| Total Families | 301 (100.0%) | 3.25 |
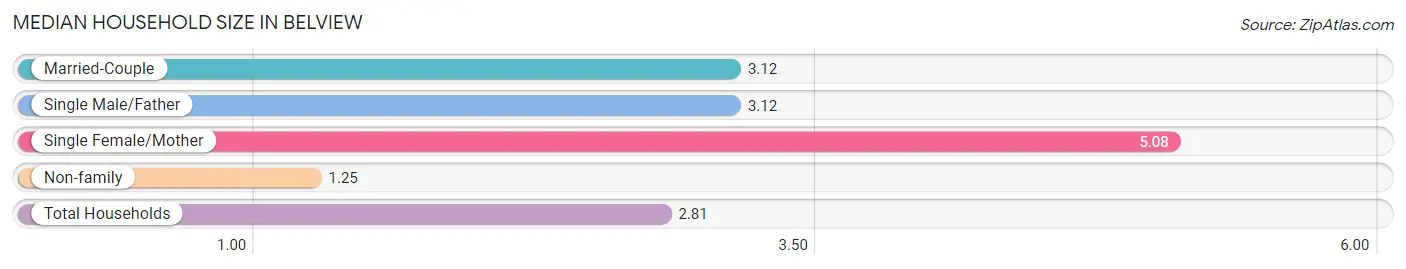
Median Household Size in Belview
The median household size in Belview is 2.81 persons per household, with single female/mother households (52 | 12.2%) accounting for the largest median household size of 5.08 persons per household. non-family households (125 | 29.3%) represent the smallest median household size with 1.25 persons per household.
| Household Type | # Households | Household Size |
| Married-Couple | 168 (39.4%) | 3.12 |
| Single Male/Father | 81 (19.0%) | 3.12 |
| Single Female/Mother | 52 (12.2%) | 5.08 |
| Non-family | 125 (29.3%) | 1.25 |
| Total Households | 426 (100.0%) | 2.81 |
Household Size by Marriage Status in Belview
Out of a total of 426 households in Belview, 301 (70.7%) are family households, while 125 (29.3%) are nonfamily households. The most numerous type of family households are 2-person households, comprising 127, and the most common type of nonfamily households are 1-person households, comprising 94.
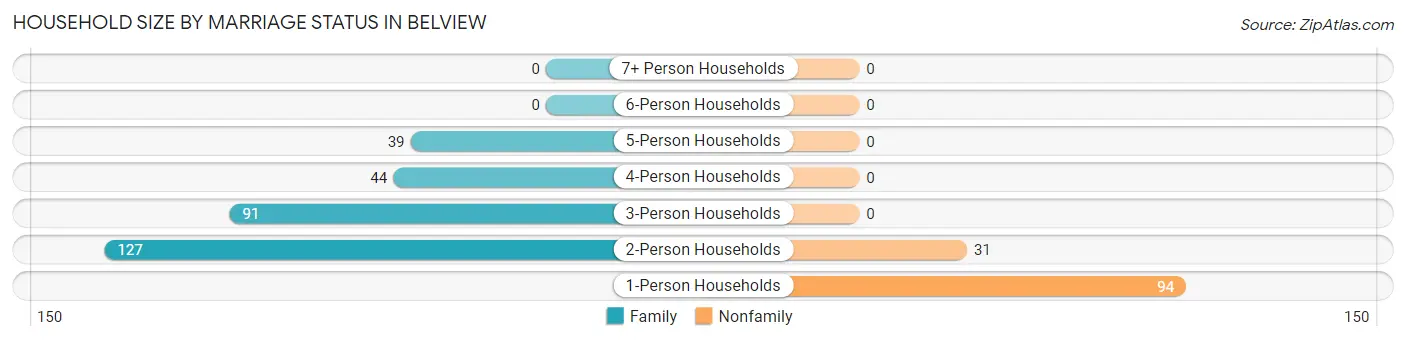
| Household Size | Family Households | Nonfamily Households |
| 1-Person Households | - | 94 (22.1%) |
| 2-Person Households | 127 (29.8%) | 31 (7.3%) |
| 3-Person Households | 91 (21.4%) | 0 (0.0%) |
| 4-Person Households | 44 (10.3%) | 0 (0.0%) |
| 5-Person Households | 39 (9.1%) | 0 (0.0%) |
| 6-Person Households | 0 (0.0%) | 0 (0.0%) |
| 7+ Person Households | 0 (0.0%) | 0 (0.0%) |
| Total | 301 (70.7%) | 125 (29.3%) |
Female Fertility in Belview
Fertility by Age in Belview
| Age Bracket | Women with Births | Births / 1,000 Women |
| 15 to 19 years | 0 (0.0%) | 0.0 |
| 20 to 34 years | 0 (0.0%) | 0.0 |
| 35 to 50 years | 0 (0.0%) | 0.0 |
| Total | 0 (0.0%) | 0.0 |
Fertility by Age by Marriage Status in Belview
| Age Bracket | Married | Unmarried |
| 15 to 19 years | 0 (0.0%) | 0 (0.0%) |
| 20 to 34 years | 0 (0.0%) | 0 (0.0%) |
| 35 to 50 years | 0 (0.0%) | 0 (0.0%) |
| Total | 0 (0.0%) | 0 (0.0%) |
Fertility by Education in Belview
| Educational Attainment | Women with Births | Births / 1,000 Women |
| Less than High School | 0 (0.0%) | 0.0 |
| High School Diploma | 0 (0.0%) | 0.0 |
| College or Associate's Degree | 0 (0.0%) | 0.0 |
| Bachelor's Degree | 0 (0.0%) | 0.0 |
| Graduate Degree | 0 (0.0%) | 0.0 |
| Total | 0 (0.0%) | 0.0 |
Fertility by Education by Marriage Status in Belview
| Educational Attainment | Married | Unmarried |
| Less than High School | 0 (0.0%) | 0 (0.0%) |
| High School Diploma | 0 (0.0%) | 0 (0.0%) |
| College or Associate's Degree | 0 (0.0%) | 0 (0.0%) |
| Bachelor's Degree | 0 (0.0%) | 0 (0.0%) |
| Graduate Degree | 0 (0.0%) | 0 (0.0%) |
| Total | 0 (0.0%) | 0 (0.0%) |
Employment Characteristics in Belview
Employment by Class of Employer in Belview
Among the 491 employed individuals in Belview, private company employees (351 | 71.5%), state government employees (32 | 6.5%), and not-for-profit organizations (30 | 6.1%) make up the most common classes of employment.
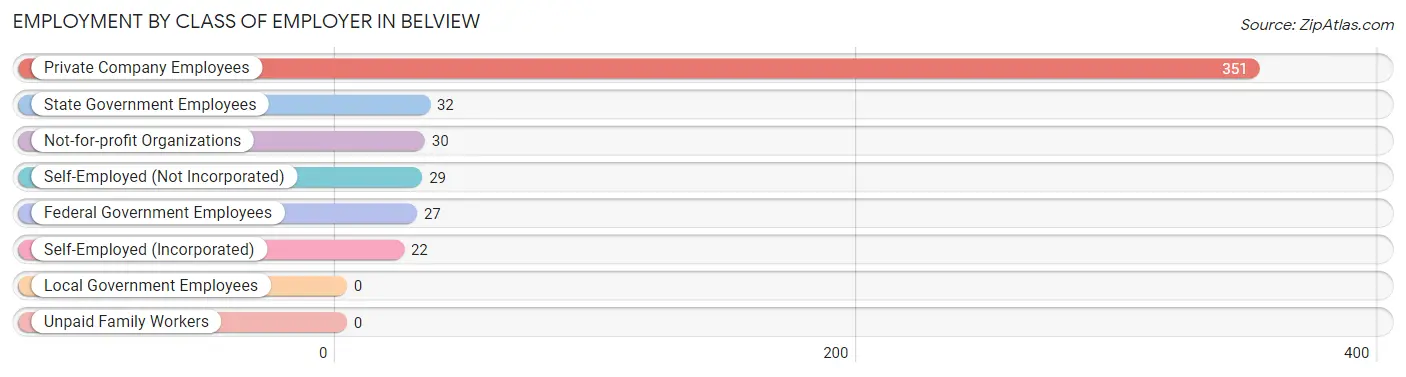
| Employer Class | # Employees | % Employees |
| Private Company Employees | 351 | 71.5% |
| Self-Employed (Incorporated) | 22 | 4.5% |
| Self-Employed (Not Incorporated) | 29 | 5.9% |
| Not-for-profit Organizations | 30 | 6.1% |
| Local Government Employees | 0 | 0.0% |
| State Government Employees | 32 | 6.5% |
| Federal Government Employees | 27 | 5.5% |
| Unpaid Family Workers | 0 | 0.0% |
| Total | 491 | 100.0% |
Employment Status by Age in Belview
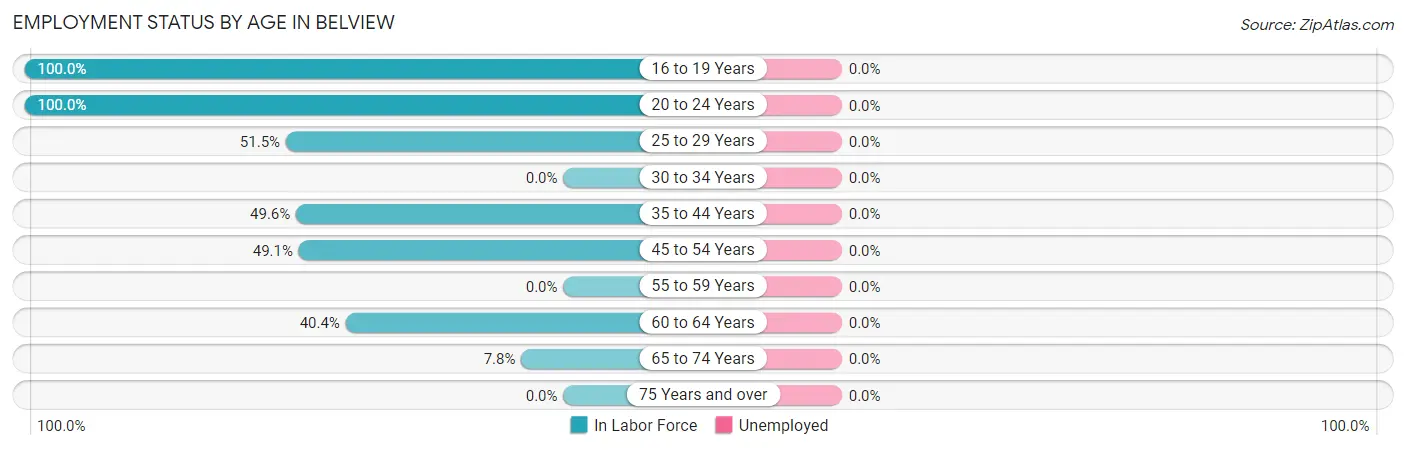
| Age Bracket | In Labor Force | Unemployed |
| 16 to 19 Years | 52 (100.0%) | 0 (0.0%) |
| 20 to 24 Years | 196 (100.0%) | 0 (0.0%) |
| 25 to 29 Years | 121 (51.5%) | 0 (0.0%) |
| 30 to 34 Years | 0 (0.0%) | 0 (0.0%) |
| 35 to 44 Years | 68 (49.6%) | 0 (0.0%) |
| 45 to 54 Years | 27 (49.1%) | 0 (0.0%) |
| 55 to 59 Years | 0 (0.0%) | 0 (0.0%) |
| 60 to 64 Years | 21 (40.4%) | 0 (0.0%) |
| 65 to 74 Years | 6 (7.8%) | 0 (0.0%) |
| 75 Years and over | 0 (0.0%) | 0 (0.0%) |
| Total | 491 (56.3%) | 0 (0.0%) |
Employment Status by Educational Attainment in Belview
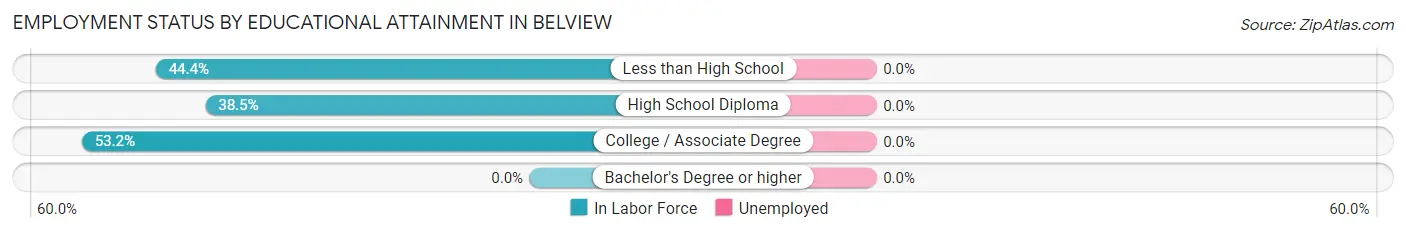
| Educational Attainment | In Labor Force | Unemployed |
| Less than High School | 24 (44.4%) | 0 (0.0%) |
| High School Diploma | 105 (38.5%) | 0 (0.0%) |
| College / Associate Degree | 108 (53.2%) | 0 (0.0%) |
| Bachelor's Degree or higher | 0 (0.0%) | 0 (0.0%) |
| Total | 237 (44.1%) | 0 (0.0%) |
Employment Occupations by Sex in Belview
Management, Business, Science and Arts Occupations
The most common Management, Business, Science and Arts occupations in Belview are Management (27 | 5.8%), Health Diagnosing & Treating (3 | 0.6%), and Health Technologists (3 | 0.6%).
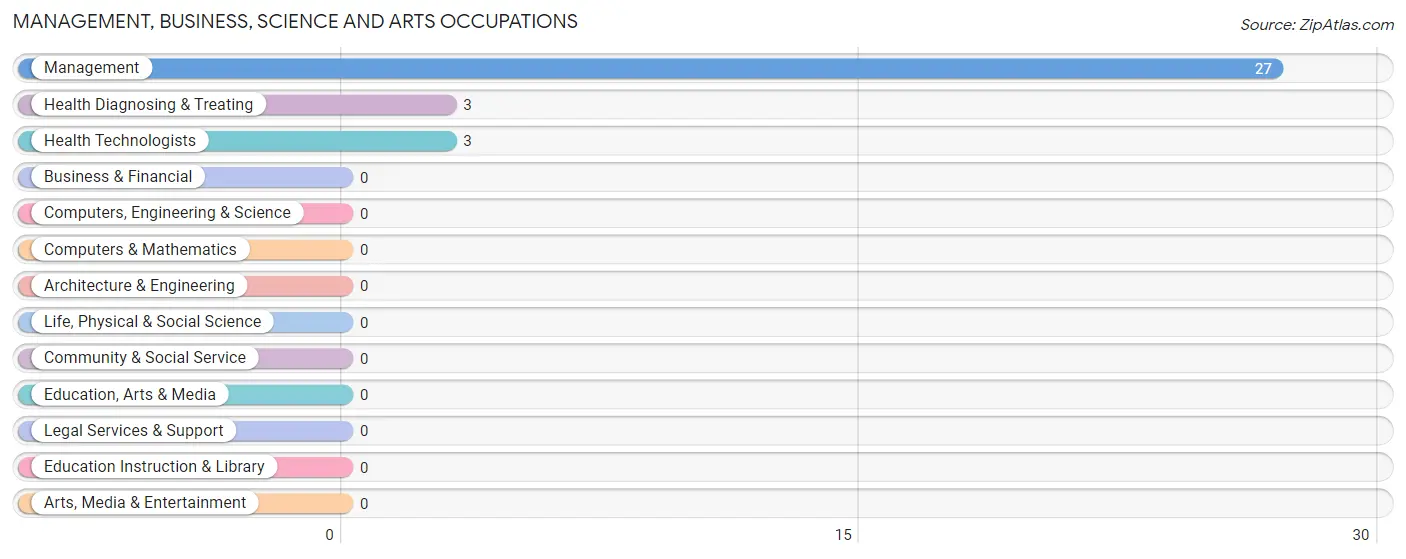
Management, Business, Science and Arts Occupations by Sex
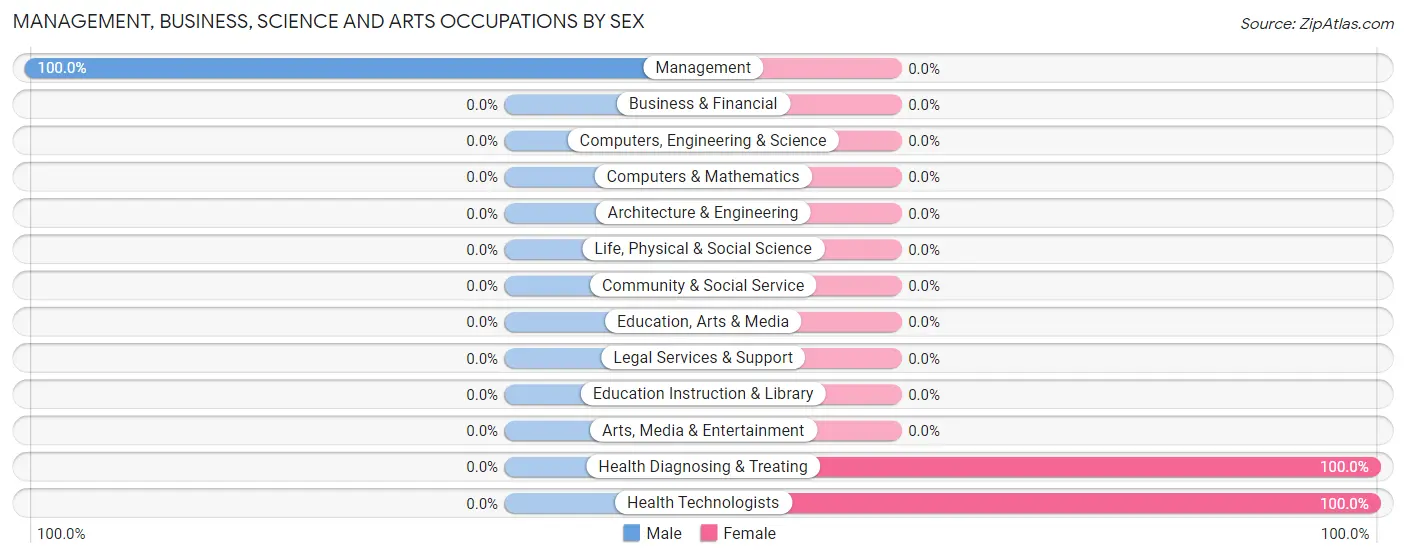
| Occupation | Male | Female |
| Management | 27 (100.0%) | 0 (0.0%) |
| Business & Financial | 0 (0.0%) | 0 (0.0%) |
| Computers, Engineering & Science | 0 (0.0%) | 0 (0.0%) |
| Computers & Mathematics | 0 (0.0%) | 0 (0.0%) |
| Architecture & Engineering | 0 (0.0%) | 0 (0.0%) |
| Life, Physical & Social Science | 0 (0.0%) | 0 (0.0%) |
| Community & Social Service | 0 (0.0%) | 0 (0.0%) |
| Education, Arts & Media | 0 (0.0%) | 0 (0.0%) |
| Legal Services & Support | 0 (0.0%) | 0 (0.0%) |
| Education Instruction & Library | 0 (0.0%) | 0 (0.0%) |
| Arts, Media & Entertainment | 0 (0.0%) | 0 (0.0%) |
| Health Diagnosing & Treating | 0 (0.0%) | 3 (100.0%) |
| Health Technologists | 0 (0.0%) | 3 (100.0%) |
| Total (Category) | 27 (90.0%) | 3 (10.0%) |
| Total (Overall) | 334 (72.0%) | 130 (28.0%) |
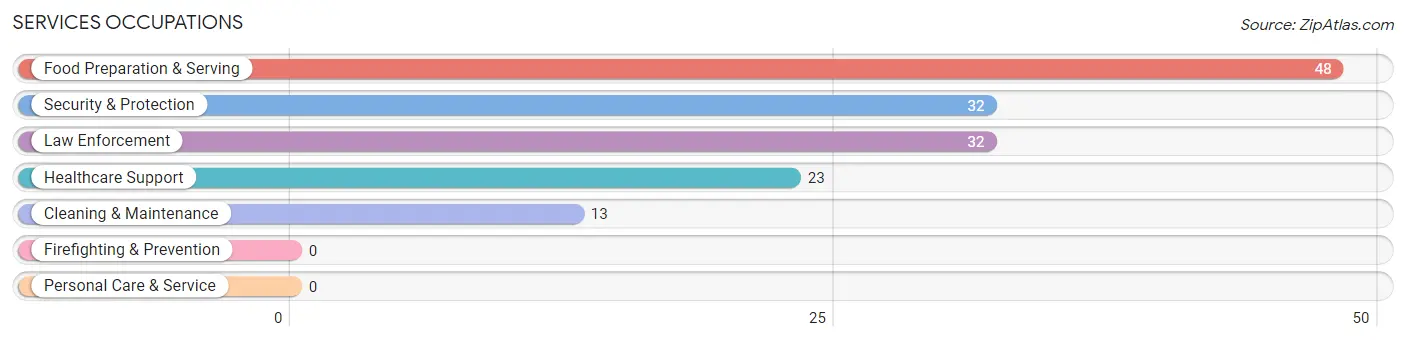
Services Occupations
The most common Services occupations in Belview are Food Preparation & Serving (48 | 10.3%), Security & Protection (32 | 6.9%), Law Enforcement (32 | 6.9%), Healthcare Support (23 | 5.0%), and Cleaning & Maintenance (13 | 2.8%).
Services Occupations by Sex
Within the Services occupations in Belview, the most male-oriented occupations are Security & Protection (100.0%), Law Enforcement (100.0%), and Food Preparation & Serving (37.5%), while the most female-oriented occupations are Healthcare Support (100.0%), Cleaning & Maintenance (100.0%), and Food Preparation & Serving (62.5%).
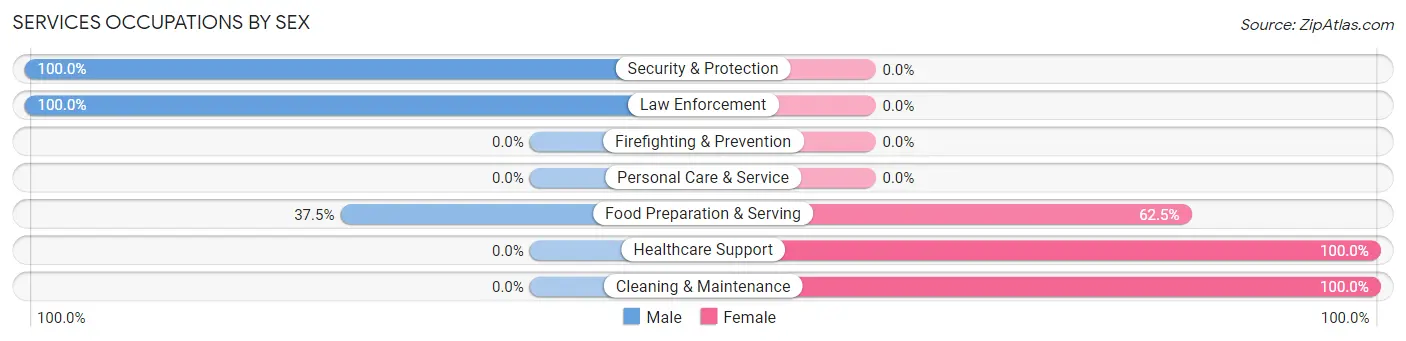
| Occupation | Male | Female |
| Healthcare Support | 0 (0.0%) | 23 (100.0%) |
| Security & Protection | 32 (100.0%) | 0 (0.0%) |
| Firefighting & Prevention | 0 (0.0%) | 0 (0.0%) |
| Law Enforcement | 32 (100.0%) | 0 (0.0%) |
| Food Preparation & Serving | 18 (37.5%) | 30 (62.5%) |
| Cleaning & Maintenance | 0 (0.0%) | 13 (100.0%) |
| Personal Care & Service | 0 (0.0%) | 0 (0.0%) |
| Total (Category) | 50 (43.1%) | 66 (56.9%) |
| Total (Overall) | 334 (72.0%) | 130 (28.0%) |
Sales and Office Occupations
The most common Sales and Office occupations in Belview are Office & Administration (36 | 7.8%), and Sales & Related (19 | 4.1%).

Sales and Office Occupations by Sex

| Occupation | Male | Female |
| Sales & Related | 19 (100.0%) | 0 (0.0%) |
| Office & Administration | 0 (0.0%) | 36 (100.0%) |
| Total (Category) | 19 (34.5%) | 36 (65.4%) |
| Total (Overall) | 334 (72.0%) | 130 (28.0%) |
Natural Resources, Construction and Maintenance Occupations
The most common Natural Resources, Construction and Maintenance occupations in Belview are Construction & Extraction (178 | 38.4%), and Installation, Maintenance & Repair (11 | 2.4%).
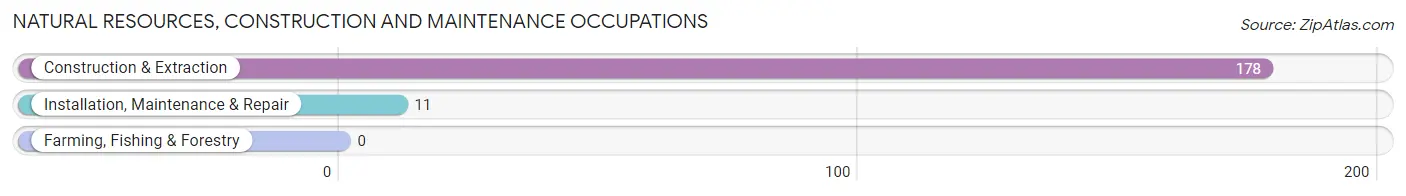
Natural Resources, Construction and Maintenance Occupations by Sex

| Occupation | Male | Female |
| Farming, Fishing & Forestry | 0 (0.0%) | 0 (0.0%) |
| Construction & Extraction | 153 (86.0%) | 25 (14.0%) |
| Installation, Maintenance & Repair | 11 (100.0%) | 0 (0.0%) |
| Total (Category) | 164 (86.8%) | 25 (13.2%) |
| Total (Overall) | 334 (72.0%) | 130 (28.0%) |
Production, Transportation and Moving Occupations
The most common Production, Transportation and Moving occupations in Belview are Production (52 | 11.2%), and Material Moving (22 | 4.7%).
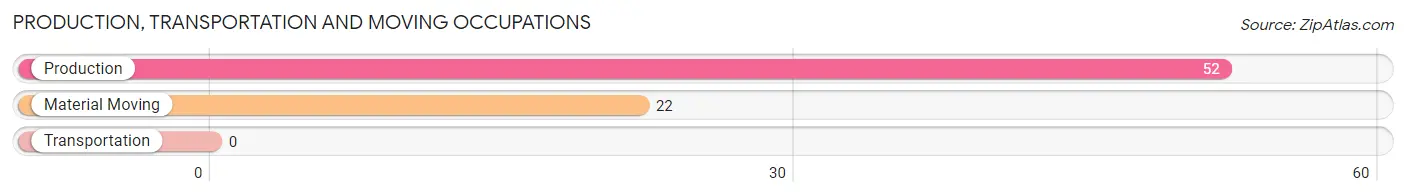
Production, Transportation and Moving Occupations by Sex

| Occupation | Male | Female |
| Production | 52 (100.0%) | 0 (0.0%) |
| Transportation | 0 (0.0%) | 0 (0.0%) |
| Material Moving | 22 (100.0%) | 0 (0.0%) |
| Total (Category) | 74 (100.0%) | 0 (0.0%) |
| Total (Overall) | 334 (72.0%) | 130 (28.0%) |
Employment Industries by Sex in Belview
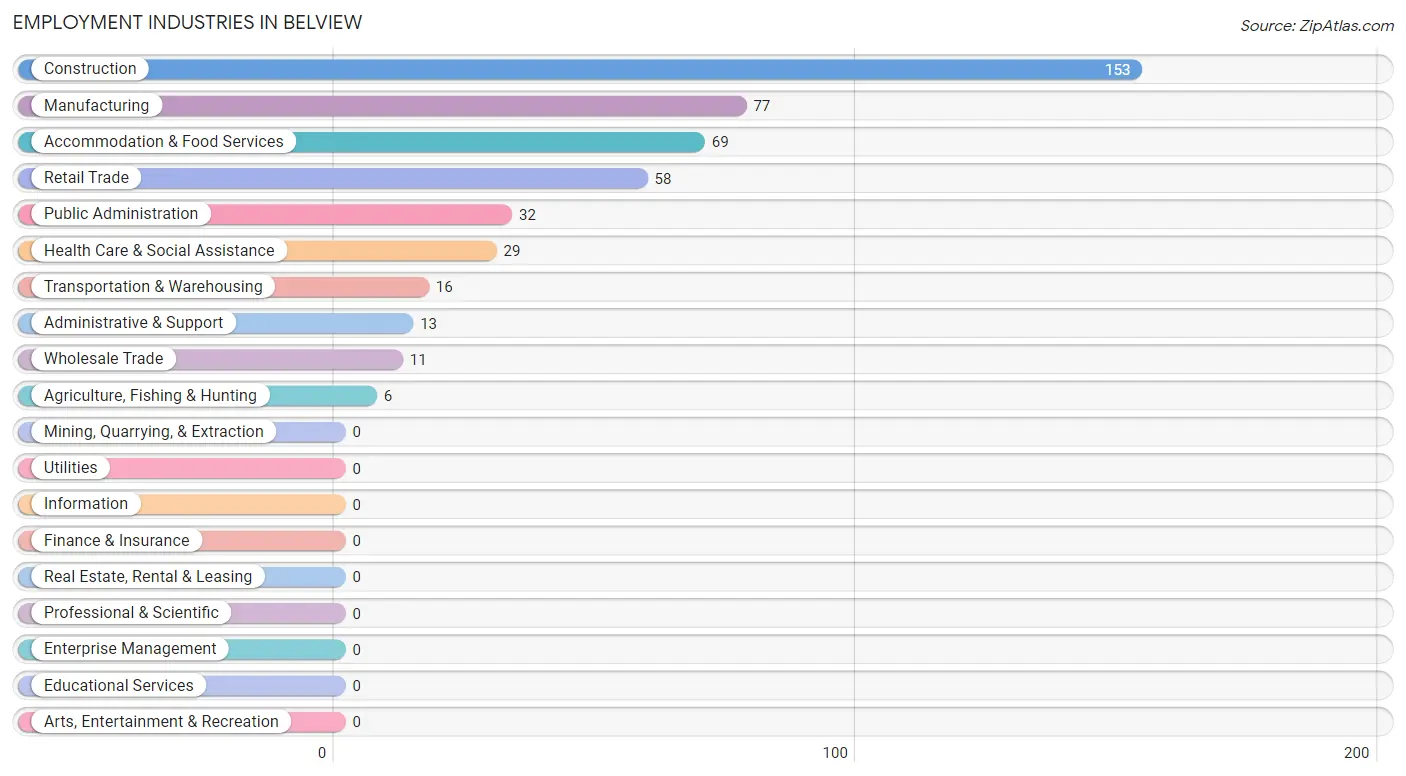
Employment Industries in Belview
The major employment industries in Belview include Construction (153 | 33.0%), Manufacturing (77 | 16.6%), Accommodation & Food Services (69 | 14.9%), Retail Trade (58 | 12.5%), and Public Administration (32 | 6.9%).
Employment Industries by Sex in Belview
The Belview industries that see more men than women are Agriculture, Fishing & Hunting (100.0%), Manufacturing (100.0%), and Wholesale Trade (100.0%), whereas the industries that tend to have a higher number of women are Transportation & Warehousing (100.0%), Administrative & Support (100.0%), and Health Care & Social Assistance (100.0%).
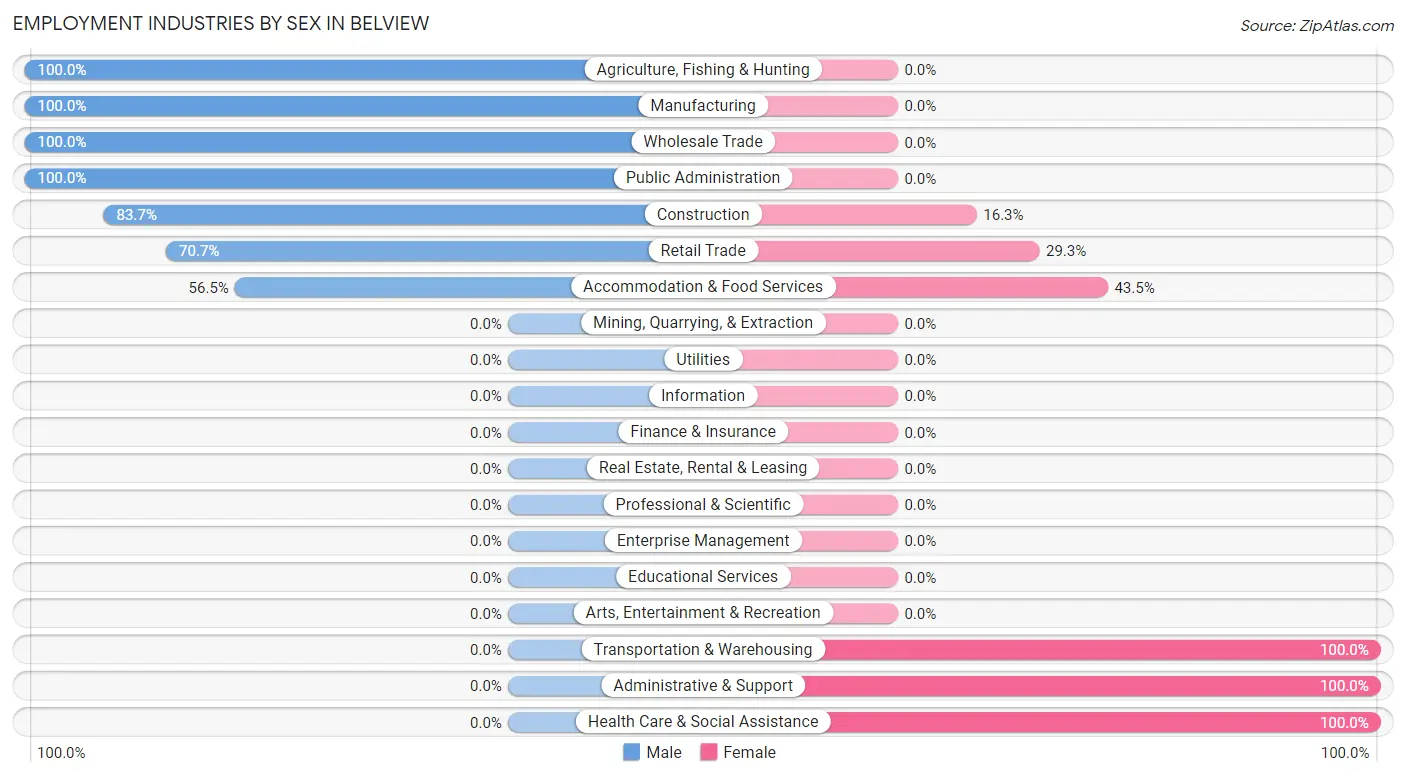
| Industry | Male | Female |
| Agriculture, Fishing & Hunting | 6 (100.0%) | 0 (0.0%) |
| Mining, Quarrying, & Extraction | 0 (0.0%) | 0 (0.0%) |
| Construction | 128 (83.7%) | 25 (16.3%) |
| Manufacturing | 77 (100.0%) | 0 (0.0%) |
| Wholesale Trade | 11 (100.0%) | 0 (0.0%) |
| Retail Trade | 41 (70.7%) | 17 (29.3%) |
| Transportation & Warehousing | 0 (0.0%) | 16 (100.0%) |
| Utilities | 0 (0.0%) | 0 (0.0%) |
| Information | 0 (0.0%) | 0 (0.0%) |
| Finance & Insurance | 0 (0.0%) | 0 (0.0%) |
| Real Estate, Rental & Leasing | 0 (0.0%) | 0 (0.0%) |
| Professional & Scientific | 0 (0.0%) | 0 (0.0%) |
| Enterprise Management | 0 (0.0%) | 0 (0.0%) |
| Administrative & Support | 0 (0.0%) | 13 (100.0%) |
| Educational Services | 0 (0.0%) | 0 (0.0%) |
| Health Care & Social Assistance | 0 (0.0%) | 29 (100.0%) |
| Arts, Entertainment & Recreation | 0 (0.0%) | 0 (0.0%) |
| Accommodation & Food Services | 39 (56.5%) | 30 (43.5%) |
| Public Administration | 32 (100.0%) | 0 (0.0%) |
| Total | 334 (72.0%) | 130 (28.0%) |
Education in Belview
School Enrollment in Belview
The most common levels of schooling among the 298 students in Belview are elementary school (136 | 45.6%), high school (52 | 17.4%), and middle school (48 | 16.1%).
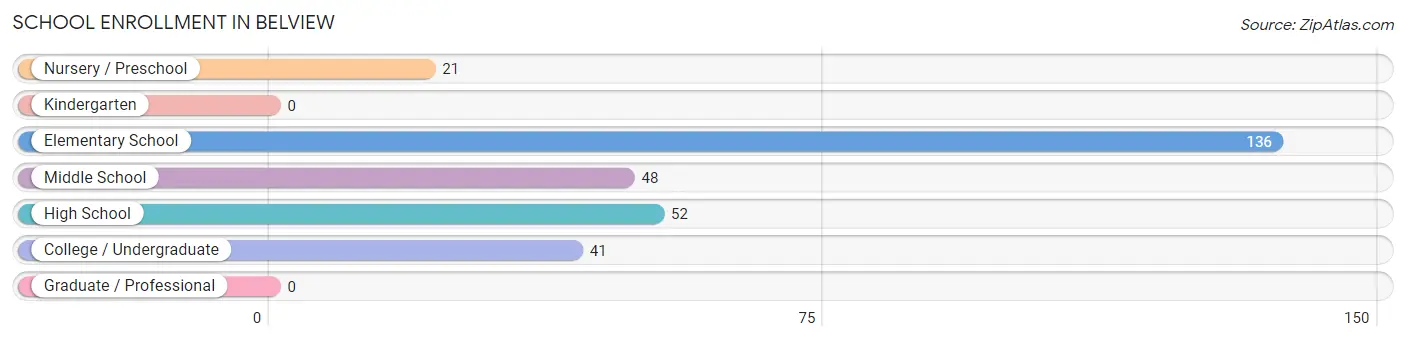
| School Level | # Students | % Students |
| Nursery / Preschool | 21 | 7.0% |
| Kindergarten | 0 | 0.0% |
| Elementary School | 136 | 45.6% |
| Middle School | 48 | 16.1% |
| High School | 52 | 17.4% |
| College / Undergraduate | 41 | 13.8% |
| Graduate / Professional | 0 | 0.0% |
| Total | 298 | 100.0% |
School Enrollment by Age by Funding Source in Belview
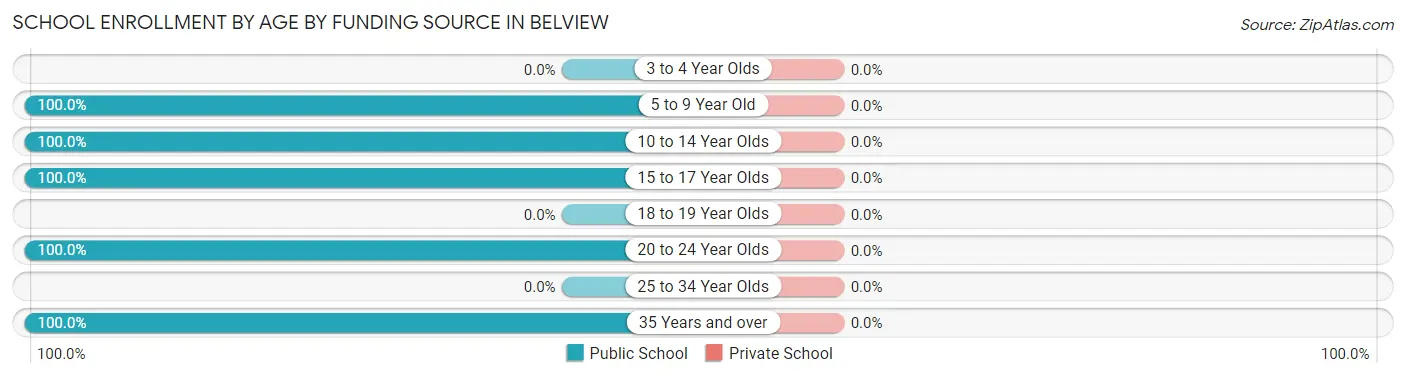
| Age Bracket | Public School | Private School |
| 3 to 4 Year Olds | 0 (0.0%) | 0 (0.0%) |
| 5 to 9 Year Old | 106 (100.0%) | 0 (0.0%) |
| 10 to 14 Year Olds | 99 (100.0%) | 0 (0.0%) |
| 15 to 17 Year Olds | 52 (100.0%) | 0 (0.0%) |
| 18 to 19 Year Olds | 0 (0.0%) | 0 (0.0%) |
| 20 to 24 Year Olds | 16 (100.0%) | 0 (0.0%) |
| 25 to 34 Year Olds | 0 (0.0%) | 0 (0.0%) |
| 35 Years and over | 25 (100.0%) | 0 (0.0%) |
| Total | 298 (100.0%) | 0 (0.0%) |
Educational Attainment by Field of Study in Belview
Business (15 | 53.6%), arts & humanities (7 | 25.0%), and bio, nature & agricultural (6 | 21.4%) are the most common fields of study among 28 individuals in Belview who have obtained a bachelor's degree or higher.
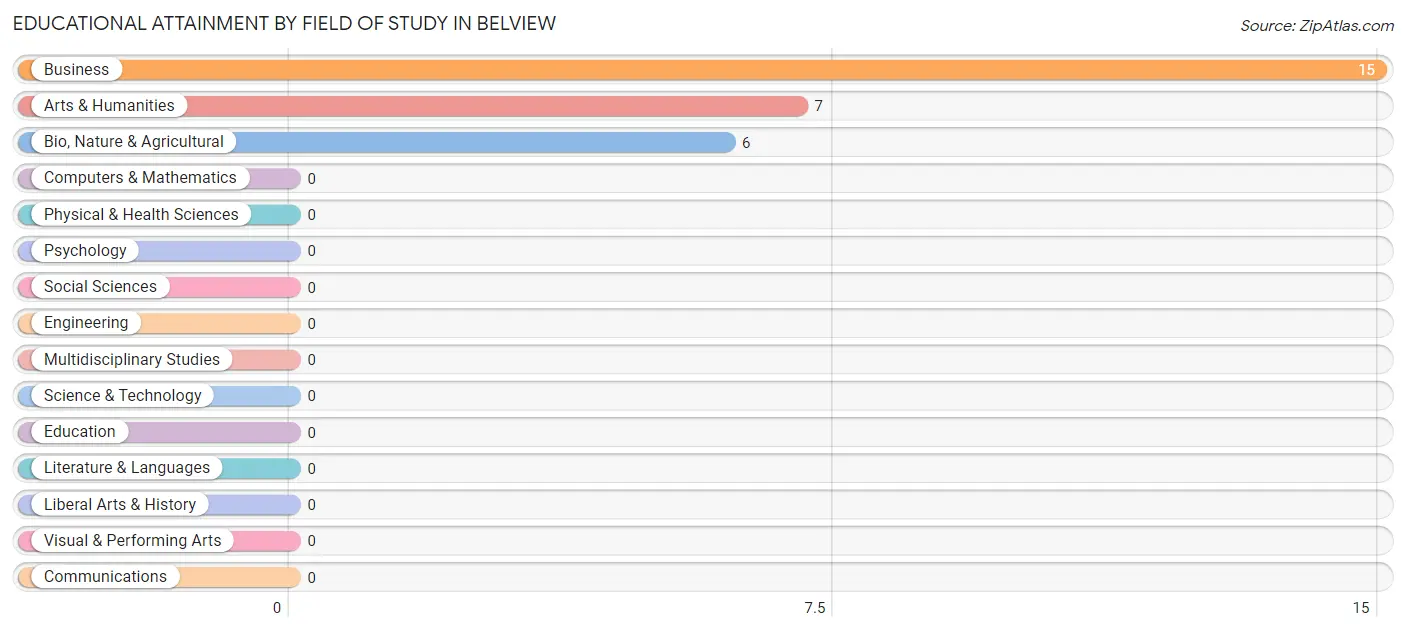
| Field of Study | # Graduates | % Graduates |
| Computers & Mathematics | 0 | 0.0% |
| Bio, Nature & Agricultural | 6 | 21.4% |
| Physical & Health Sciences | 0 | 0.0% |
| Psychology | 0 | 0.0% |
| Social Sciences | 0 | 0.0% |
| Engineering | 0 | 0.0% |
| Multidisciplinary Studies | 0 | 0.0% |
| Science & Technology | 0 | 0.0% |
| Business | 15 | 53.6% |
| Education | 0 | 0.0% |
| Literature & Languages | 0 | 0.0% |
| Liberal Arts & History | 0 | 0.0% |
| Visual & Performing Arts | 0 | 0.0% |
| Communications | 0 | 0.0% |
| Arts & Humanities | 7 | 25.0% |
| Total | 28 | 100.0% |
Transportation & Commute in Belview
Vehicle Availability by Sex in Belview
The most prevalent vehicle ownership categories in Belview are males with 3 vehicles (210, accounting for 58.2%) and females with 3 vehicles (68, making up 161.5%).
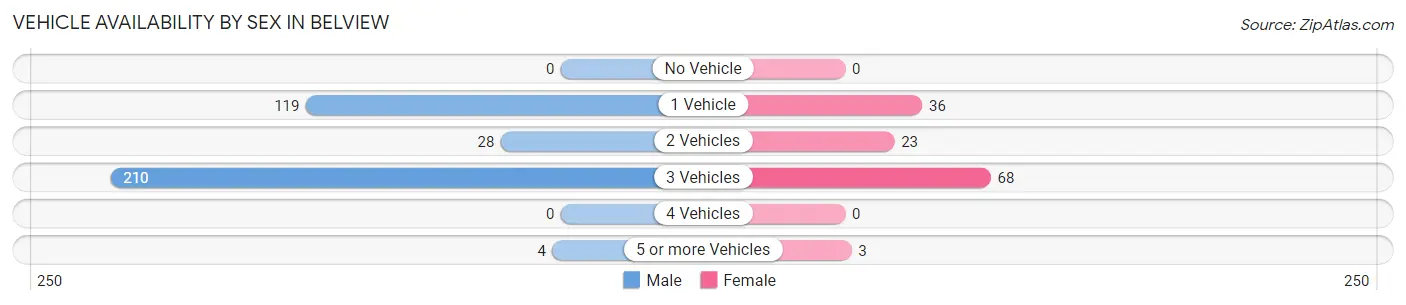
| Vehicles Available | Male | Female |
| No Vehicle | 0 (0.0%) | 0 (0.0%) |
| 1 Vehicle | 119 (33.0%) | 36 (27.7%) |
| 2 Vehicles | 28 (7.8%) | 23 (17.7%) |
| 3 Vehicles | 210 (58.2%) | 68 (52.3%) |
| 4 Vehicles | 0 (0.0%) | 0 (0.0%) |
| 5 or more Vehicles | 4 (1.1%) | 3 (2.3%) |
| Total | 361 (100.0%) | 130 (100.0%) |
Commute Time in Belview
The most frequently occuring commute durations in Belview are 20 to 24 minutes (137 commuters, 29.3%), 40 to 44 minutes (110 commuters, 23.5%), and 15 to 19 minutes (72 commuters, 15.4%).
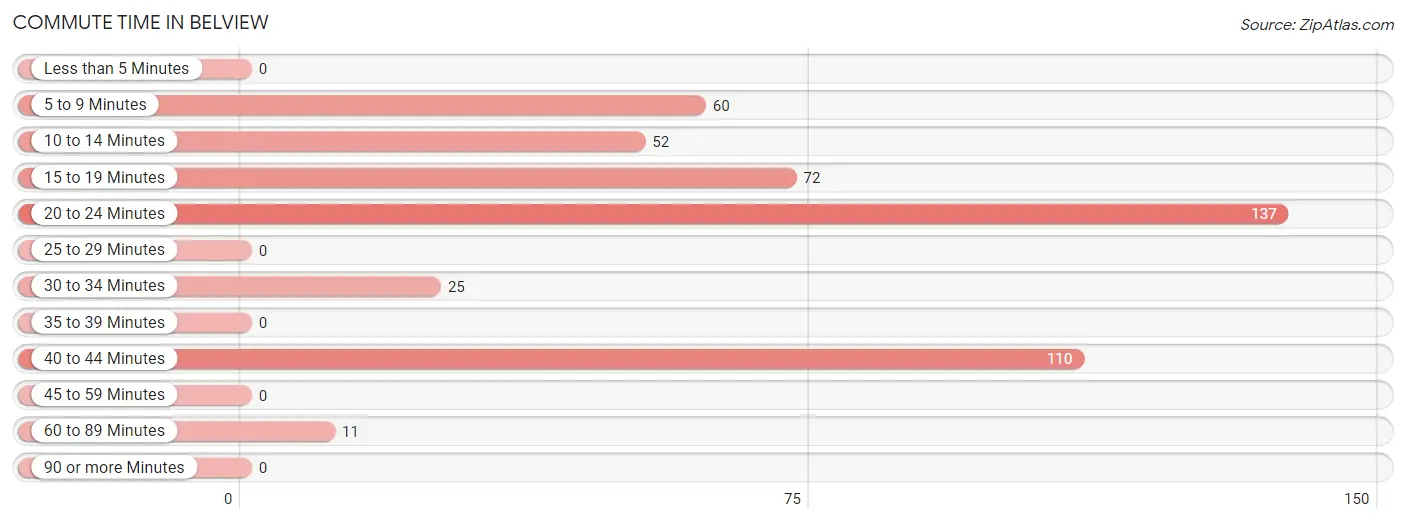
| Commute Time | # Commuters | % Commuters |
| Less than 5 Minutes | 0 | 0.0% |
| 5 to 9 Minutes | 60 | 12.9% |
| 10 to 14 Minutes | 52 | 11.1% |
| 15 to 19 Minutes | 72 | 15.4% |
| 20 to 24 Minutes | 137 | 29.3% |
| 25 to 29 Minutes | 0 | 0.0% |
| 30 to 34 Minutes | 25 | 5.3% |
| 35 to 39 Minutes | 0 | 0.0% |
| 40 to 44 Minutes | 110 | 23.5% |
| 45 to 59 Minutes | 0 | 0.0% |
| 60 to 89 Minutes | 11 | 2.4% |
| 90 or more Minutes | 0 | 0.0% |
Commute Time by Sex in Belview
The most common commute times in Belview are 40 to 44 minutes (110 commuters, 32.6%) for males and 20 to 24 minutes (83 commuters, 63.8%) for females.
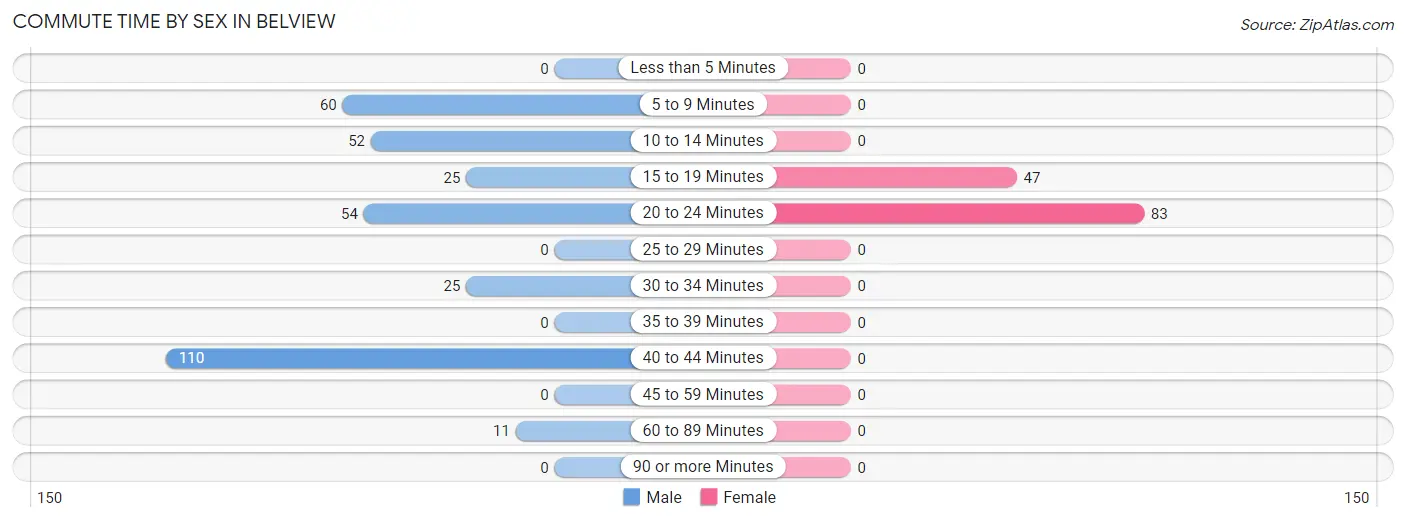
| Commute Time | Male | Female |
| Less than 5 Minutes | 0 (0.0%) | 0 (0.0%) |
| 5 to 9 Minutes | 60 (17.8%) | 0 (0.0%) |
| 10 to 14 Minutes | 52 (15.4%) | 0 (0.0%) |
| 15 to 19 Minutes | 25 (7.4%) | 47 (36.1%) |
| 20 to 24 Minutes | 54 (16.0%) | 83 (63.8%) |
| 25 to 29 Minutes | 0 (0.0%) | 0 (0.0%) |
| 30 to 34 Minutes | 25 (7.4%) | 0 (0.0%) |
| 35 to 39 Minutes | 0 (0.0%) | 0 (0.0%) |
| 40 to 44 Minutes | 110 (32.6%) | 0 (0.0%) |
| 45 to 59 Minutes | 0 (0.0%) | 0 (0.0%) |
| 60 to 89 Minutes | 11 (3.3%) | 0 (0.0%) |
| 90 or more Minutes | 0 (0.0%) | 0 (0.0%) |
Time of Departure to Work by Sex in Belview
The most frequent times of departure to work in Belview are 8:00 AM to 8:29 AM (110, 32.6%) for males and 7:30 AM to 7:59 AM (53, 40.8%) for females.
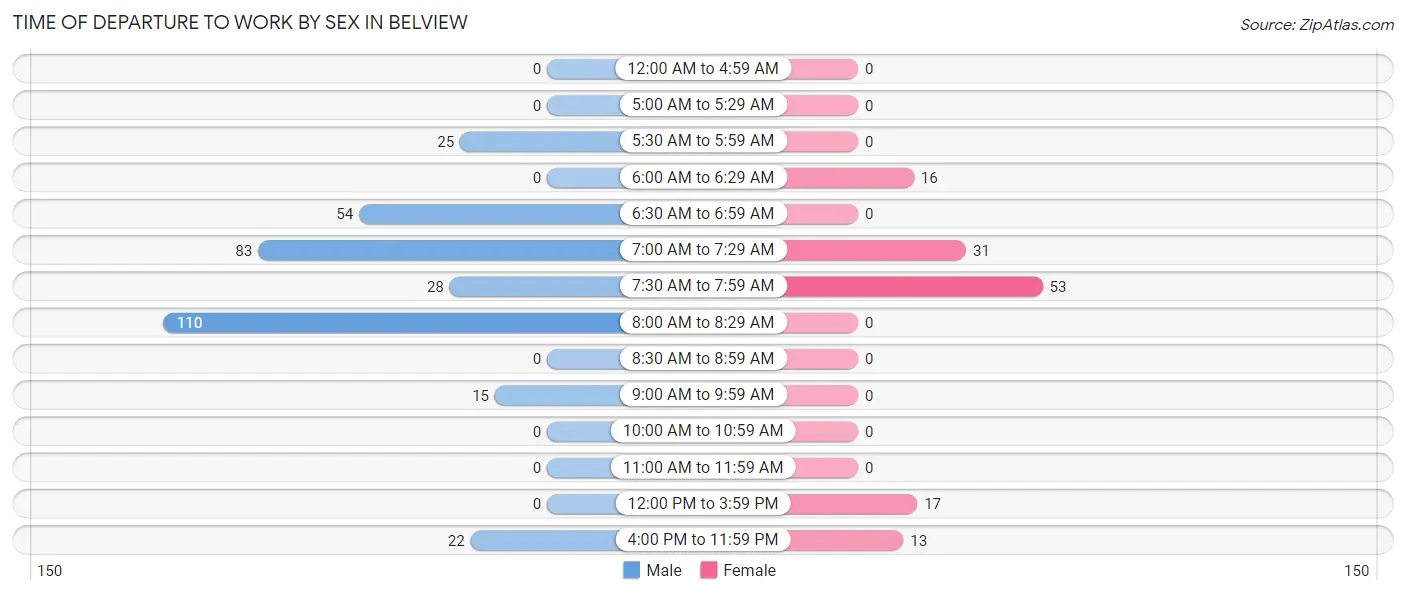
| Time of Departure | Male | Female |
| 12:00 AM to 4:59 AM | 0 (0.0%) | 0 (0.0%) |
| 5:00 AM to 5:29 AM | 0 (0.0%) | 0 (0.0%) |
| 5:30 AM to 5:59 AM | 25 (7.4%) | 0 (0.0%) |
| 6:00 AM to 6:29 AM | 0 (0.0%) | 16 (12.3%) |
| 6:30 AM to 6:59 AM | 54 (16.0%) | 0 (0.0%) |
| 7:00 AM to 7:29 AM | 83 (24.6%) | 31 (23.8%) |
| 7:30 AM to 7:59 AM | 28 (8.3%) | 53 (40.8%) |
| 8:00 AM to 8:29 AM | 110 (32.6%) | 0 (0.0%) |
| 8:30 AM to 8:59 AM | 0 (0.0%) | 0 (0.0%) |
| 9:00 AM to 9:59 AM | 15 (4.4%) | 0 (0.0%) |
| 10:00 AM to 10:59 AM | 0 (0.0%) | 0 (0.0%) |
| 11:00 AM to 11:59 AM | 0 (0.0%) | 0 (0.0%) |
| 12:00 PM to 3:59 PM | 0 (0.0%) | 17 (13.1%) |
| 4:00 PM to 11:59 PM | 22 (6.5%) | 13 (10.0%) |
| Total | 337 (100.0%) | 130 (100.0%) |
Housing Occupancy in Belview
Occupancy by Ownership in Belview
Of the total 426 dwellings in Belview, owner-occupied units account for 156 (36.6%), while renter-occupied units make up 270 (63.4%).
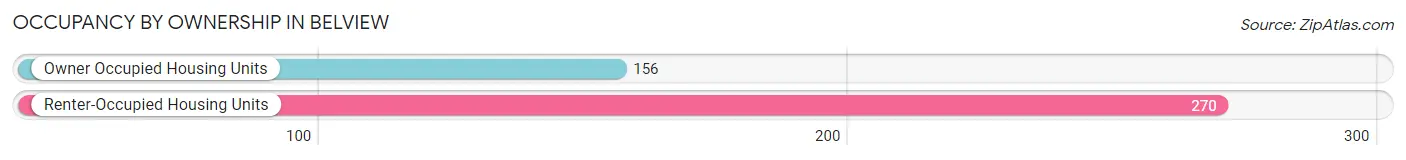
| Occupancy | # Housing Units | % Housing Units |
| Owner Occupied Housing Units | 156 | 36.6% |
| Renter-Occupied Housing Units | 270 | 63.4% |
| Total Occupied Housing Units | 426 | 100.0% |
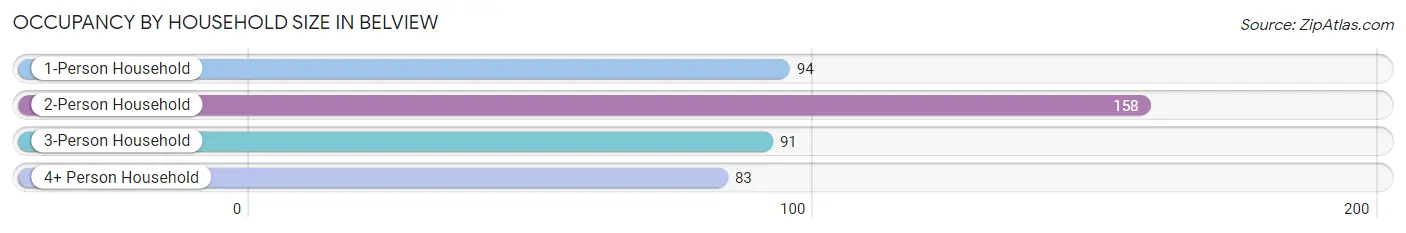
Occupancy by Household Size in Belview
| Household Size | # Housing Units | % Housing Units |
| 1-Person Household | 94 | 22.1% |
| 2-Person Household | 158 | 37.1% |
| 3-Person Household | 91 | 21.4% |
| 4+ Person Household | 83 | 19.5% |
| Total Housing Units | 426 | 100.0% |
Occupancy by Ownership by Household Size in Belview
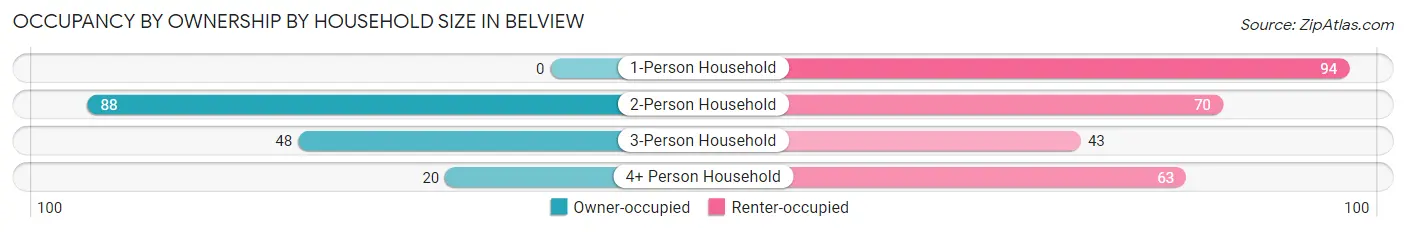
| Household Size | Owner-occupied | Renter-occupied |
| 1-Person Household | 0 (0.0%) | 94 (100.0%) |
| 2-Person Household | 88 (55.7%) | 70 (44.3%) |
| 3-Person Household | 48 (52.7%) | 43 (47.2%) |
| 4+ Person Household | 20 (24.1%) | 63 (75.9%) |
| Total Housing Units | 156 (36.6%) | 270 (63.4%) |
Occupancy by Educational Attainment in Belview
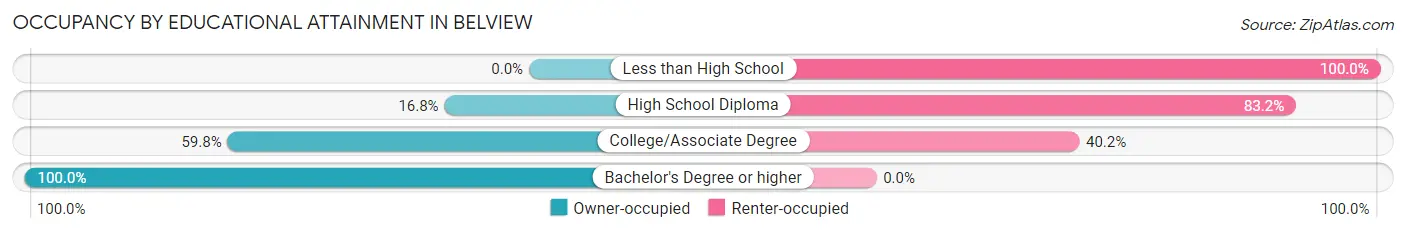
| Household Size | Owner-occupied | Renter-occupied |
| Less than High School | 0 (0.0%) | 51 (100.0%) |
| High School Diploma | 30 (16.8%) | 149 (83.2%) |
| College/Associate Degree | 104 (59.8%) | 70 (40.2%) |
| Bachelor's Degree or higher | 22 (100.0%) | 0 (0.0%) |
Occupancy by Age of Householder in Belview
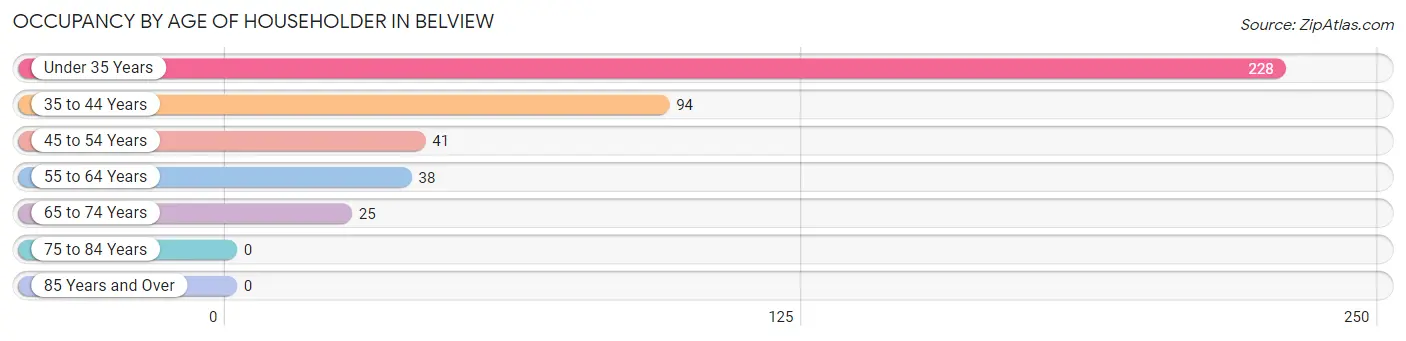
| Age Bracket | # Households | % Households |
| Under 35 Years | 228 | 53.5% |
| 35 to 44 Years | 94 | 22.1% |
| 45 to 54 Years | 41 | 9.6% |
| 55 to 64 Years | 38 | 8.9% |
| 65 to 74 Years | 25 | 5.9% |
| 75 to 84 Years | 0 | 0.0% |
| 85 Years and Over | 0 | 0.0% |
| Total | 426 | 100.0% |
Housing Finances in Belview
Median Income by Occupancy in Belview
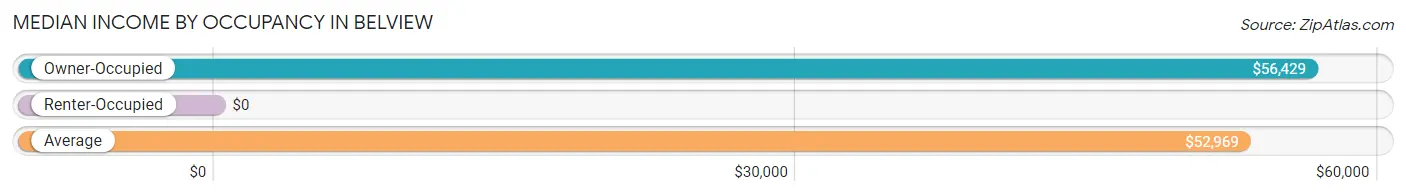
| Occupancy Type | # Households | Median Income |
| Owner-Occupied | 156 (36.6%) | $56,429 |
| Renter-Occupied | 270 (63.4%) | $0 |
| Average | 426 (100.0%) | $52,969 |
Occupancy by Householder Income Bracket in Belview
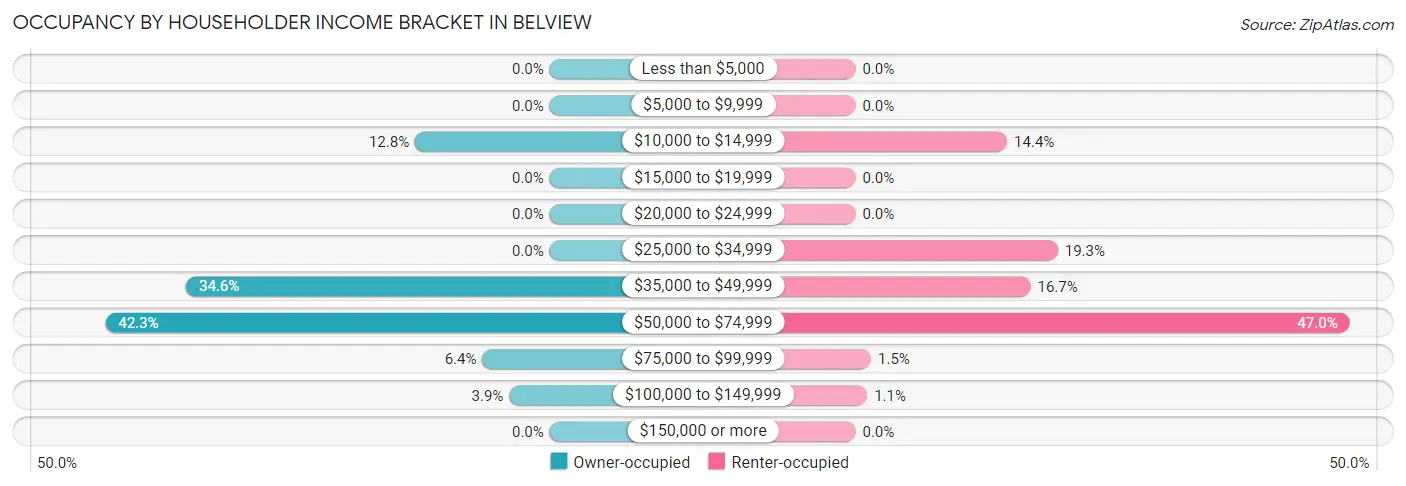
| Income Bracket | Owner-occupied | Renter-occupied |
| Less than $5,000 | 0 (0.0%) | 0 (0.0%) |
| $5,000 to $9,999 | 0 (0.0%) | 0 (0.0%) |
| $10,000 to $14,999 | 20 (12.8%) | 39 (14.4%) |
| $15,000 to $19,999 | 0 (0.0%) | 0 (0.0%) |
| $20,000 to $24,999 | 0 (0.0%) | 0 (0.0%) |
| $25,000 to $34,999 | 0 (0.0%) | 52 (19.3%) |
| $35,000 to $49,999 | 54 (34.6%) | 45 (16.7%) |
| $50,000 to $74,999 | 66 (42.3%) | 127 (47.0%) |
| $75,000 to $99,999 | 10 (6.4%) | 4 (1.5%) |
| $100,000 to $149,999 | 6 (3.8%) | 3 (1.1%) |
| $150,000 or more | 0 (0.0%) | 0 (0.0%) |
| Total | 156 (100.0%) | 270 (100.0%) |
Monthly Housing Cost Tiers in Belview
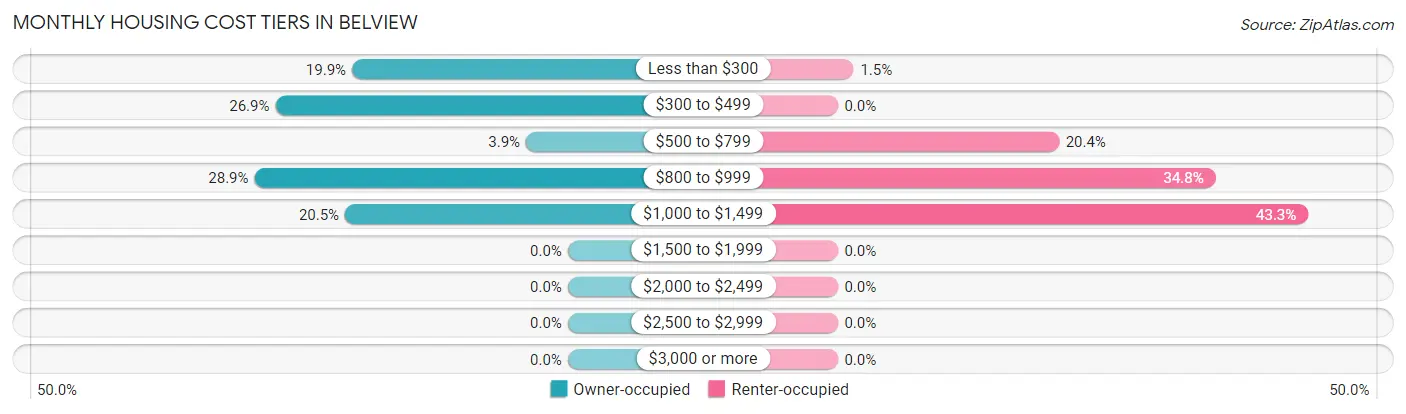
| Monthly Cost | Owner-occupied | Renter-occupied |
| Less than $300 | 31 (19.9%) | 4 (1.5%) |
| $300 to $499 | 42 (26.9%) | 0 (0.0%) |
| $500 to $799 | 6 (3.8%) | 55 (20.4%) |
| $800 to $999 | 45 (28.8%) | 94 (34.8%) |
| $1,000 to $1,499 | 32 (20.5%) | 117 (43.3%) |
| $1,500 to $1,999 | 0 (0.0%) | 0 (0.0%) |
| $2,000 to $2,499 | 0 (0.0%) | 0 (0.0%) |
| $2,500 to $2,999 | 0 (0.0%) | 0 (0.0%) |
| $3,000 or more | 0 (0.0%) | 0 (0.0%) |
| Total | 156 (100.0%) | 270 (100.0%) |
Physical Housing Characteristics in Belview
Housing Structures in Belview
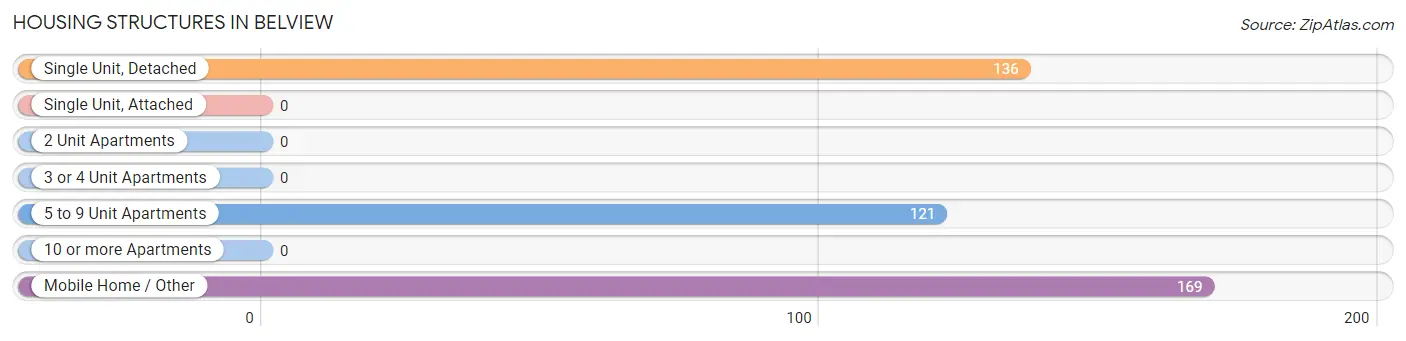
| Structure Type | # Housing Units | % Housing Units |
| Single Unit, Detached | 136 | 31.9% |
| Single Unit, Attached | 0 | 0.0% |
| 2 Unit Apartments | 0 | 0.0% |
| 3 or 4 Unit Apartments | 0 | 0.0% |
| 5 to 9 Unit Apartments | 121 | 28.4% |
| 10 or more Apartments | 0 | 0.0% |
| Mobile Home / Other | 169 | 39.7% |
| Total | 426 | 100.0% |
Housing Structures by Occupancy in Belview
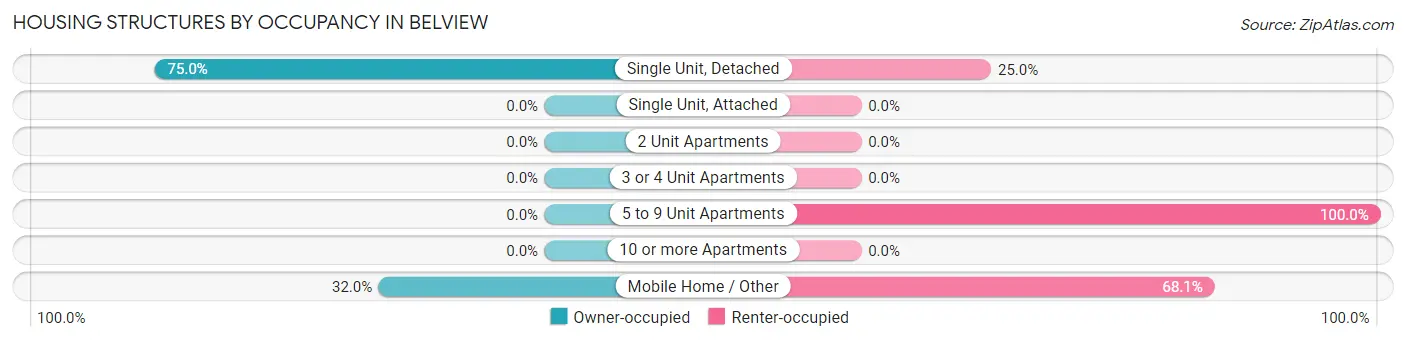
| Structure Type | Owner-occupied | Renter-occupied |
| Single Unit, Detached | 102 (75.0%) | 34 (25.0%) |
| Single Unit, Attached | 0 (0.0%) | 0 (0.0%) |
| 2 Unit Apartments | 0 (0.0%) | 0 (0.0%) |
| 3 or 4 Unit Apartments | 0 (0.0%) | 0 (0.0%) |
| 5 to 9 Unit Apartments | 0 (0.0%) | 121 (100.0%) |
| 10 or more Apartments | 0 (0.0%) | 0 (0.0%) |
| Mobile Home / Other | 54 (32.0%) | 115 (68.0%) |
| Total | 156 (36.6%) | 270 (63.4%) |
Housing Structures by Number of Rooms in Belview
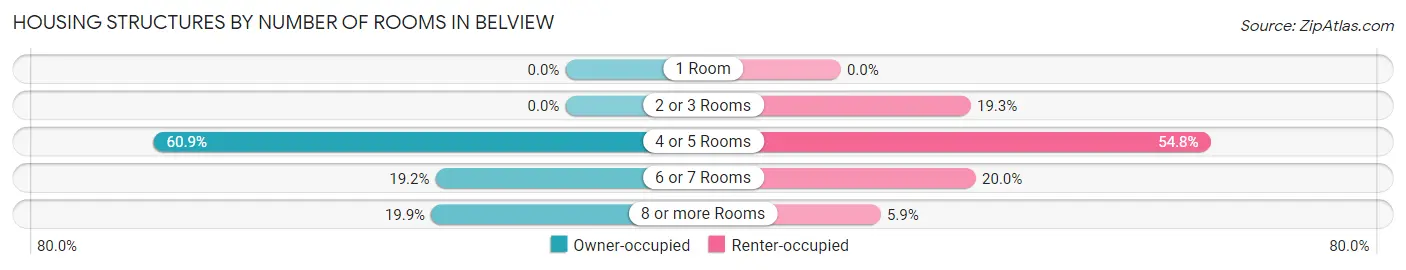
| Number of Rooms | Owner-occupied | Renter-occupied |
| 1 Room | 0 (0.0%) | 0 (0.0%) |
| 2 or 3 Rooms | 0 (0.0%) | 52 (19.3%) |
| 4 or 5 Rooms | 95 (60.9%) | 148 (54.8%) |
| 6 or 7 Rooms | 30 (19.2%) | 54 (20.0%) |
| 8 or more Rooms | 31 (19.9%) | 16 (5.9%) |
| Total | 156 (100.0%) | 270 (100.0%) |
Housing Structure by Heating Type in Belview
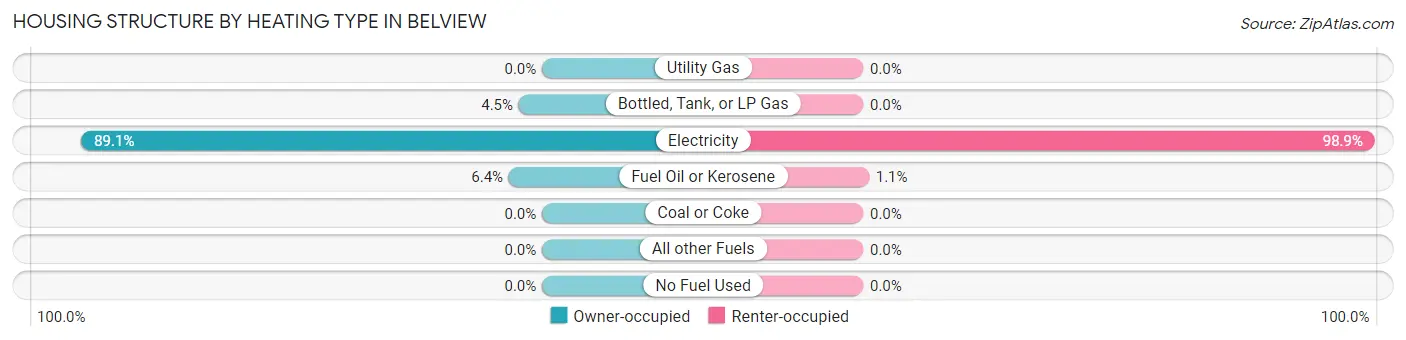
| Heating Type | Owner-occupied | Renter-occupied |
| Utility Gas | 0 (0.0%) | 0 (0.0%) |
| Bottled, Tank, or LP Gas | 7 (4.5%) | 0 (0.0%) |
| Electricity | 139 (89.1%) | 267 (98.9%) |
| Fuel Oil or Kerosene | 10 (6.4%) | 3 (1.1%) |
| Coal or Coke | 0 (0.0%) | 0 (0.0%) |
| All other Fuels | 0 (0.0%) | 0 (0.0%) |
| No Fuel Used | 0 (0.0%) | 0 (0.0%) |
| Total | 156 (100.0%) | 270 (100.0%) |
Household Vehicle Usage in Belview
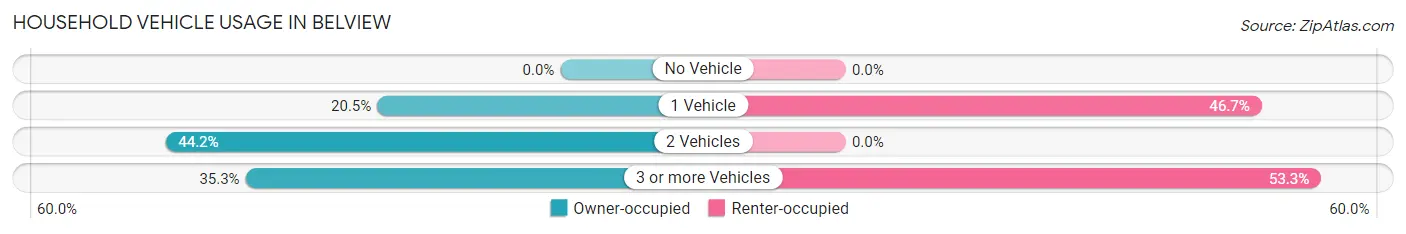
| Vehicles per Household | Owner-occupied | Renter-occupied |
| No Vehicle | 0 (0.0%) | 0 (0.0%) |
| 1 Vehicle | 32 (20.5%) | 126 (46.7%) |
| 2 Vehicles | 69 (44.2%) | 0 (0.0%) |
| 3 or more Vehicles | 55 (35.3%) | 144 (53.3%) |
| Total | 156 (100.0%) | 270 (100.0%) |
Real Estate & Mortgages in Belview
Real Estate and Mortgage Overview in Belview
| Characteristic | Without Mortgage | With Mortgage |
| Housing Units | 79 | 77 |
| Median Property Value | $135,100 | $0 |
| Median Household Income | $43,424 | $0 |
| Monthly Housing Costs | $397 | $0 |
| Real Estate Taxes | - | - |
Property Value by Mortgage Status in Belview
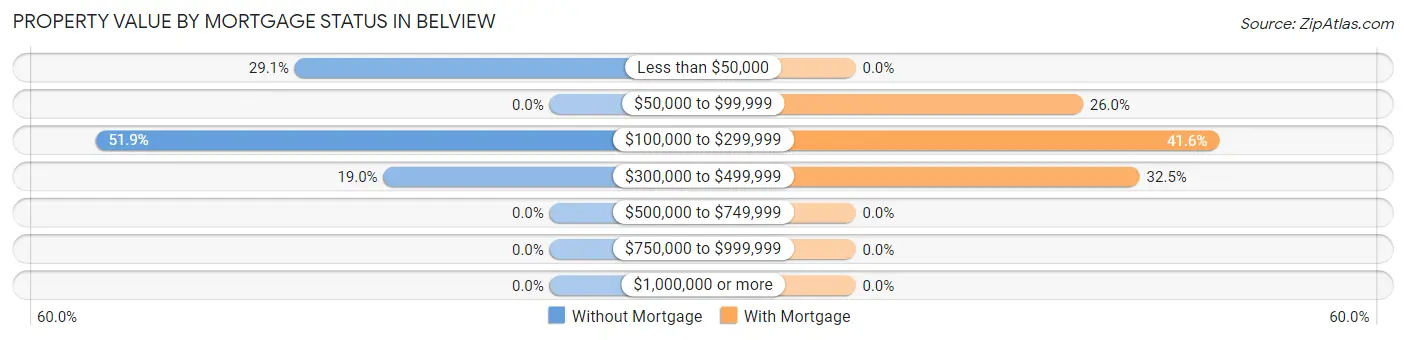
| Property Value | Without Mortgage | With Mortgage |
| Less than $50,000 | 23 (29.1%) | 0 (0.0%) |
| $50,000 to $99,999 | 0 (0.0%) | 20 (26.0%) |
| $100,000 to $299,999 | 41 (51.9%) | 32 (41.6%) |
| $300,000 to $499,999 | 15 (19.0%) | 25 (32.5%) |
| $500,000 to $749,999 | 0 (0.0%) | 0 (0.0%) |
| $750,000 to $999,999 | 0 (0.0%) | 0 (0.0%) |
| $1,000,000 or more | 0 (0.0%) | 0 (0.0%) |
| Total | 79 (100.0%) | 77 (100.0%) |
Household Income by Mortgage Status in Belview
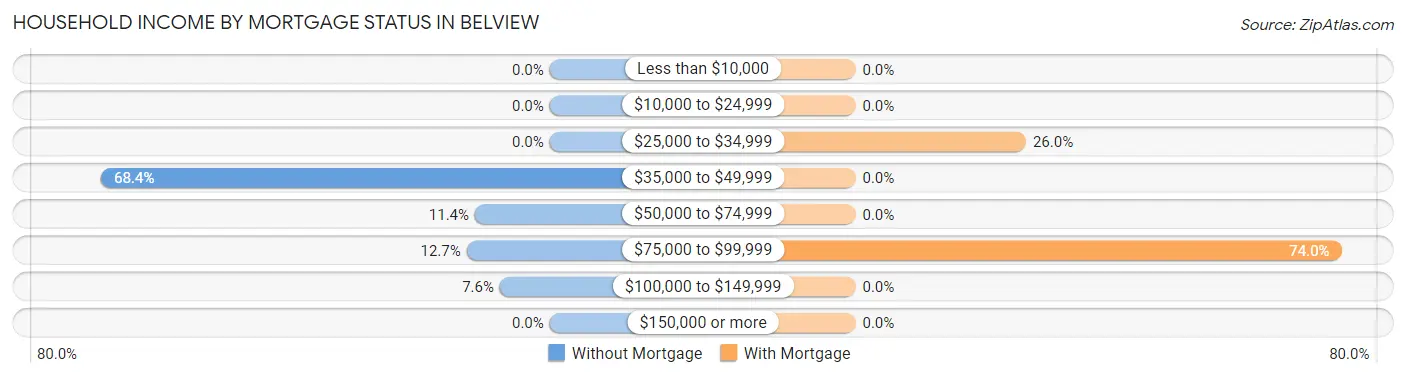
| Household Income | Without Mortgage | With Mortgage |
| Less than $10,000 | 0 (0.0%) | 0 (0.0%) |
| $10,000 to $24,999 | 0 (0.0%) | 0 (0.0%) |
| $25,000 to $34,999 | 0 (0.0%) | 20 (26.0%) |
| $35,000 to $49,999 | 54 (68.3%) | 0 (0.0%) |
| $50,000 to $74,999 | 9 (11.4%) | 0 (0.0%) |
| $75,000 to $99,999 | 10 (12.7%) | 57 (74.0%) |
| $100,000 to $149,999 | 6 (7.6%) | 0 (0.0%) |
| $150,000 or more | 0 (0.0%) | 0 (0.0%) |
| Total | 79 (100.0%) | 77 (100.0%) |
Property Value to Household Income Ratio in Belview
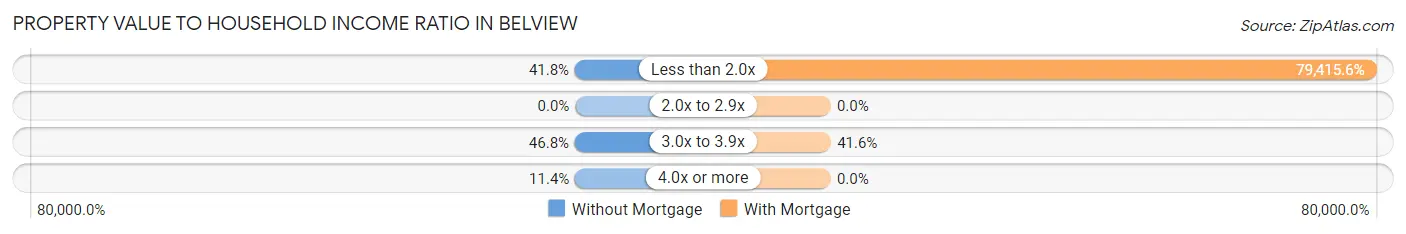
| Value-to-Income Ratio | Without Mortgage | With Mortgage |
| Less than 2.0x | 33 (41.8%) | 61,150 (79,415.6%) |
| 2.0x to 2.9x | 0 (0.0%) | 0 (0.0%) |
| 3.0x to 3.9x | 37 (46.8%) | 32 (41.6%) |
| 4.0x or more | 9 (11.4%) | 0 (0.0%) |
| Total | 79 (100.0%) | 77 (100.0%) |
Real Estate Taxes by Mortgage Status in Belview
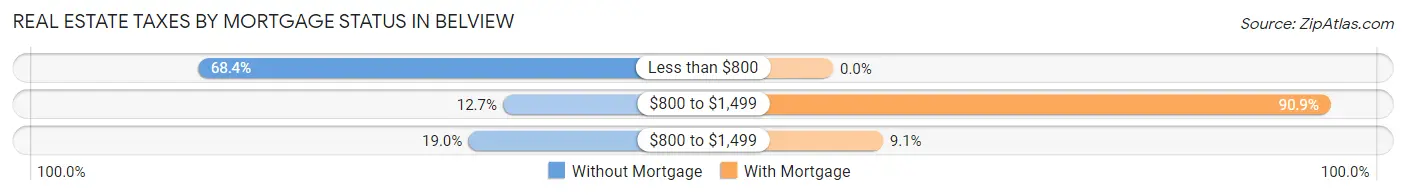
| Property Taxes | Without Mortgage | With Mortgage |
| Less than $800 | 54 (68.3%) | 0 (0.0%) |
| $800 to $1,499 | 10 (12.7%) | 70 (90.9%) |
| $800 to $1,499 | 15 (19.0%) | 7 (9.1%) |
| Total | 79 (100.0%) | 77 (100.0%) |
Health & Disability in Belview
Health Insurance Coverage by Age in Belview
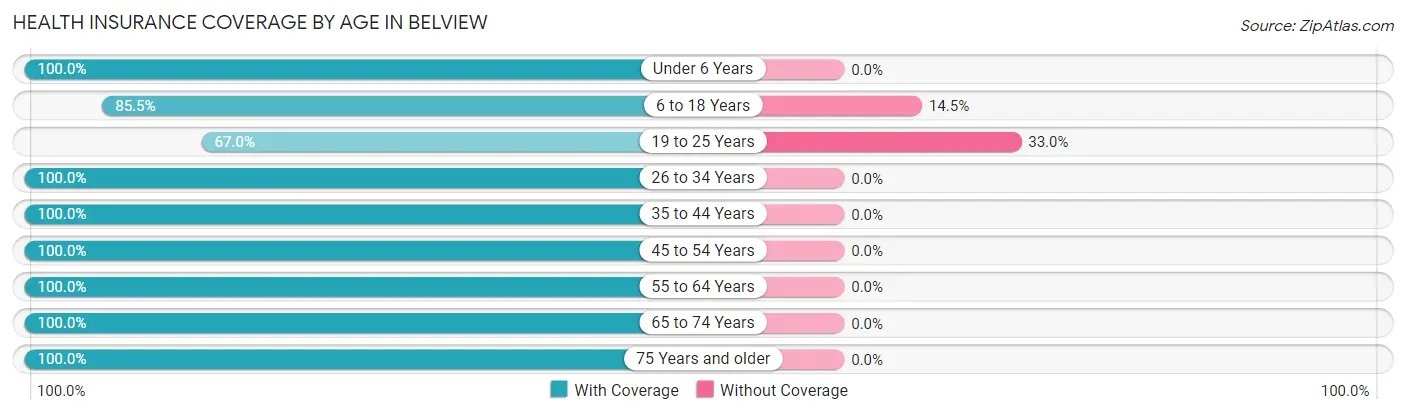
| Age Bracket | With Coverage | Without Coverage |
| Under 6 Years | 101 (100.0%) | 0 (0.0%) |
| 6 to 18 Years | 236 (85.5%) | 40 (14.5%) |
| 19 to 25 Years | 134 (67.0%) | 66 (33.0%) |
| 26 to 34 Years | 266 (100.0%) | 0 (0.0%) |
| 35 to 44 Years | 126 (100.0%) | 0 (0.0%) |
| 45 to 54 Years | 55 (100.0%) | 0 (0.0%) |
| 55 to 64 Years | 59 (100.0%) | 0 (0.0%) |
| 65 to 74 Years | 77 (100.0%) | 0 (0.0%) |
| 75 Years and older | 10 (100.0%) | 0 (0.0%) |
| Total | 1,064 (90.9%) | 106 (9.1%) |
Health Insurance Coverage by Citizenship Status in Belview

| Citizenship Status | With Coverage | Without Coverage |
| Native Born | 101 (100.0%) | 0 (0.0%) |
| Foreign Born, Citizen | 236 (85.5%) | 40 (14.5%) |
| Foreign Born, not a Citizen | 134 (67.0%) | 66 (33.0%) |
Health Insurance Coverage by Household Income in Belview
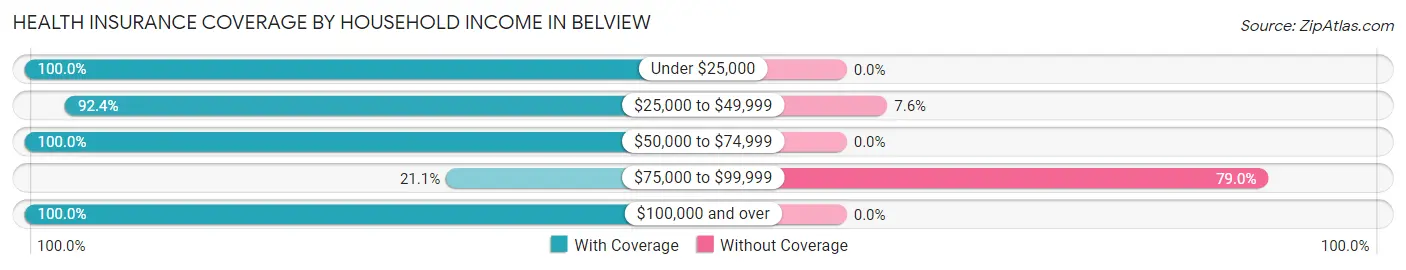
| Household Income | With Coverage | Without Coverage |
| Under $25,000 | 319 (100.0%) | 0 (0.0%) |
| $25,000 to $49,999 | 377 (92.4%) | 31 (7.6%) |
| $50,000 to $74,999 | 333 (100.0%) | 0 (0.0%) |
| $75,000 to $99,999 | 20 (21.0%) | 75 (78.9%) |
| $100,000 and over | 15 (100.0%) | 0 (0.0%) |
Public vs Private Health Insurance Coverage by Age in Belview
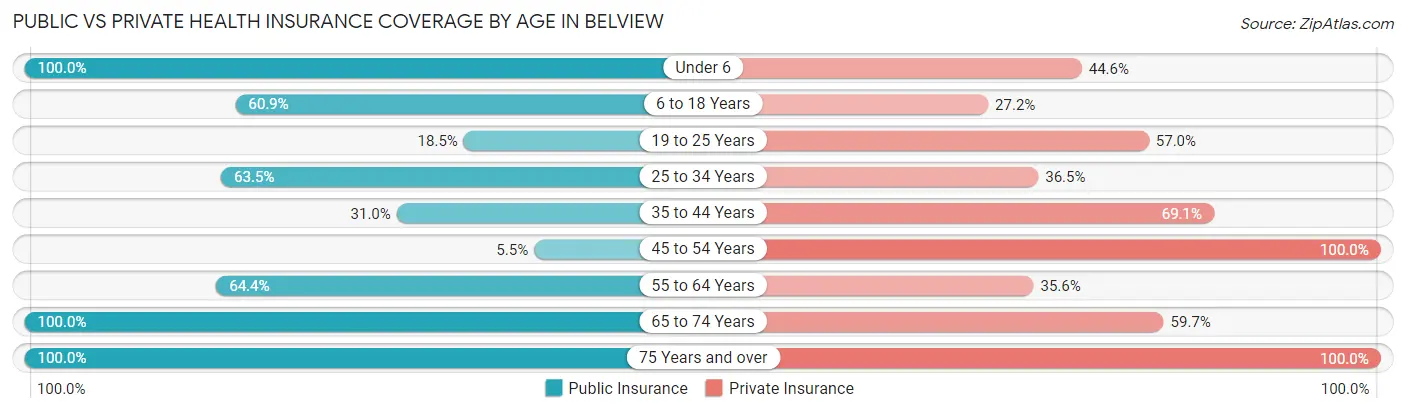
| Age Bracket | Public Insurance | Private Insurance |
| Under 6 | 101 (100.0%) | 45 (44.6%) |
| 6 to 18 Years | 168 (60.9%) | 75 (27.2%) |
| 19 to 25 Years | 37 (18.5%) | 114 (57.0%) |
| 25 to 34 Years | 169 (63.5%) | 97 (36.5%) |
| 35 to 44 Years | 39 (30.9%) | 87 (69.1%) |
| 45 to 54 Years | 3 (5.4%) | 55 (100.0%) |
| 55 to 64 Years | 38 (64.4%) | 21 (35.6%) |
| 65 to 74 Years | 77 (100.0%) | 46 (59.7%) |
| 75 Years and over | 10 (100.0%) | 10 (100.0%) |
| Total | 642 (54.9%) | 550 (47.0%) |
Disability Status by Sex by Age in Belview
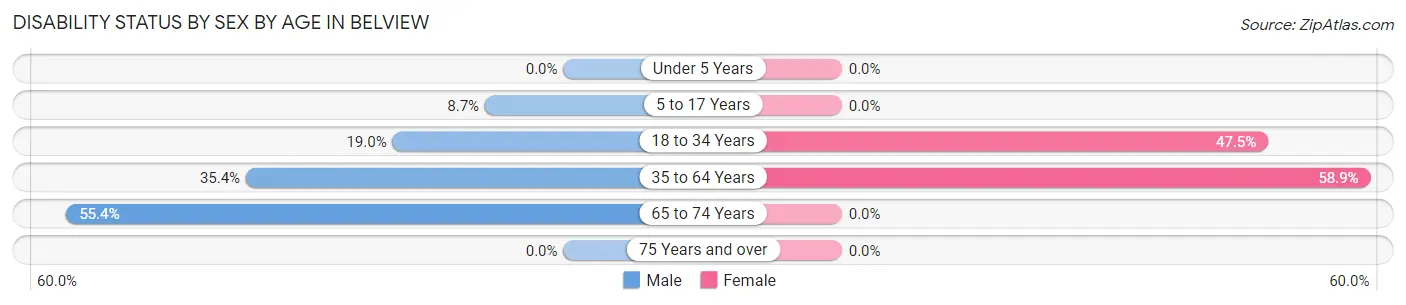
| Age Bracket | Male | Female |
| Under 5 Years | 0 (0.0%) | 0 (0.0%) |
| 5 to 17 Years | 11 (8.7%) | 0 (0.0%) |
| 18 to 34 Years | 51 (19.0%) | 94 (47.5%) |
| 35 to 64 Years | 35 (35.3%) | 83 (58.9%) |
| 65 to 74 Years | 31 (55.4%) | 0 (0.0%) |
| 75 Years and over | 0 (0.0%) | 0 (0.0%) |
Disability Class by Sex by Age in Belview
Disability Class: Hearing Difficulty
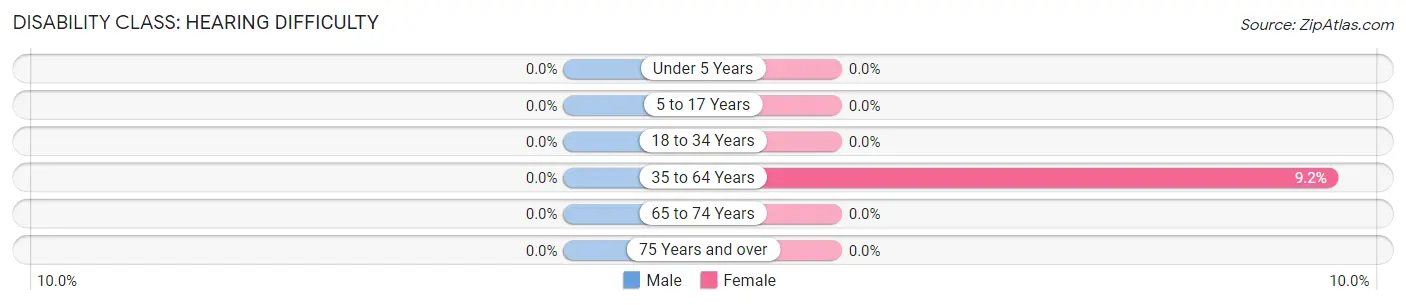
| Age Bracket | Male | Female |
| Under 5 Years | 0 (0.0%) | 0 (0.0%) |
| 5 to 17 Years | 0 (0.0%) | 0 (0.0%) |
| 18 to 34 Years | 0 (0.0%) | 0 (0.0%) |
| 35 to 64 Years | 0 (0.0%) | 13 (9.2%) |
| 65 to 74 Years | 0 (0.0%) | 0 (0.0%) |
| 75 Years and over | 0 (0.0%) | 0 (0.0%) |
Disability Class: Vision Difficulty
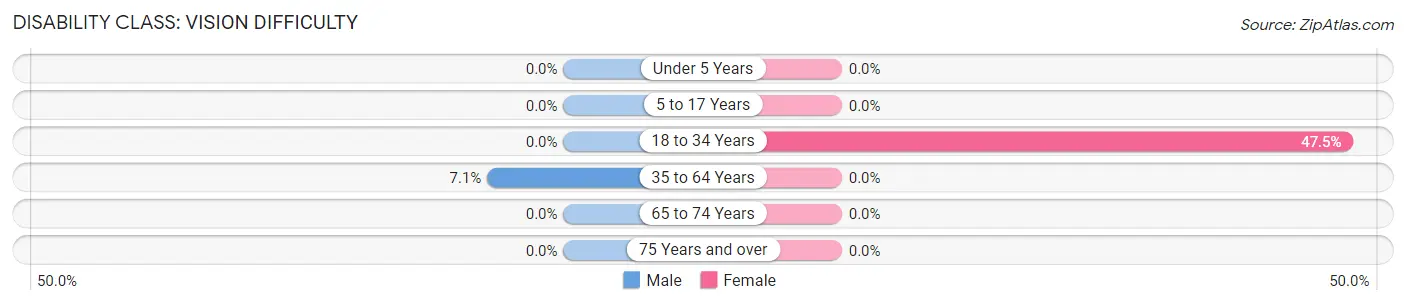
| Age Bracket | Male | Female |
| Under 5 Years | 0 (0.0%) | 0 (0.0%) |
| 5 to 17 Years | 0 (0.0%) | 0 (0.0%) |
| 18 to 34 Years | 0 (0.0%) | 94 (47.5%) |
| 35 to 64 Years | 7 (7.1%) | 0 (0.0%) |
| 65 to 74 Years | 0 (0.0%) | 0 (0.0%) |
| 75 Years and over | 0 (0.0%) | 0 (0.0%) |
Disability Class: Cognitive Difficulty
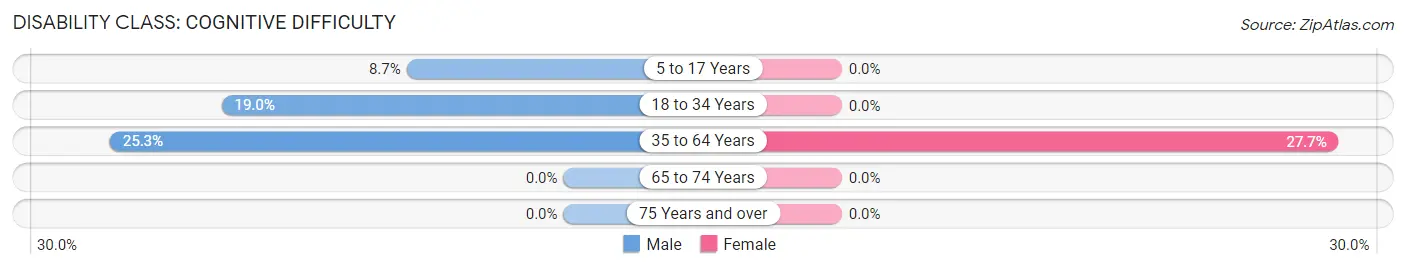
| Age Bracket | Male | Female |
| 5 to 17 Years | 11 (8.7%) | 0 (0.0%) |
| 18 to 34 Years | 51 (19.0%) | 0 (0.0%) |
| 35 to 64 Years | 25 (25.3%) | 39 (27.7%) |
| 65 to 74 Years | 0 (0.0%) | 0 (0.0%) |
| 75 Years and over | 0 (0.0%) | 0 (0.0%) |
Disability Class: Ambulatory Difficulty
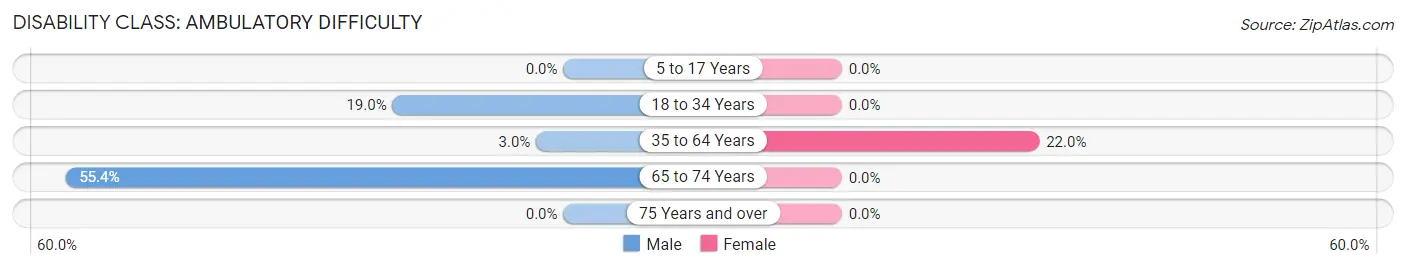
| Age Bracket | Male | Female |
| 5 to 17 Years | 0 (0.0%) | 0 (0.0%) |
| 18 to 34 Years | 51 (19.0%) | 0 (0.0%) |
| 35 to 64 Years | 3 (3.0%) | 31 (22.0%) |
| 65 to 74 Years | 31 (55.4%) | 0 (0.0%) |
| 75 Years and over | 0 (0.0%) | 0 (0.0%) |
Disability Class: Self-Care Difficulty
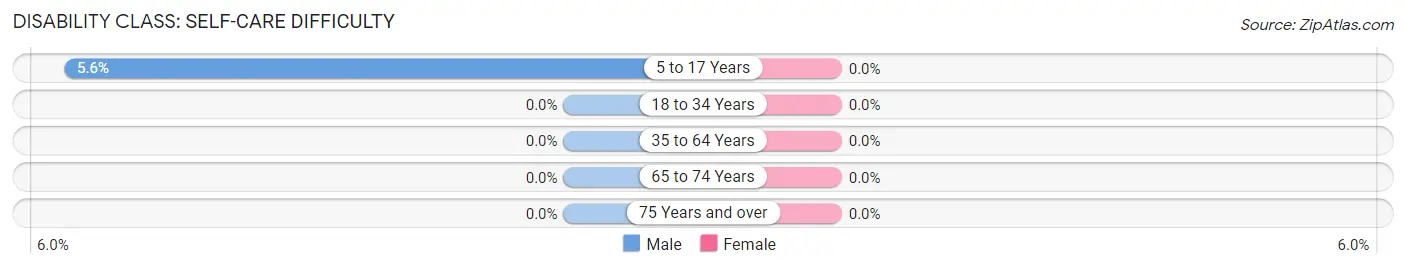
| Age Bracket | Male | Female |
| 5 to 17 Years | 7 (5.6%) | 0 (0.0%) |
| 18 to 34 Years | 0 (0.0%) | 0 (0.0%) |
| 35 to 64 Years | 0 (0.0%) | 0 (0.0%) |
| 65 to 74 Years | 0 (0.0%) | 0 (0.0%) |
| 75 Years and over | 0 (0.0%) | 0 (0.0%) |
Technology Access in Belview
Computing Device Access in Belview
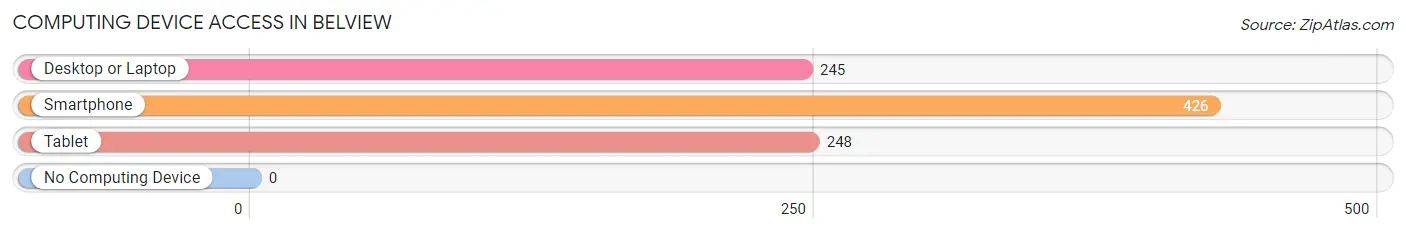
| Device Type | # Households | % Households |
| Desktop or Laptop | 245 | 57.5% |
| Smartphone | 426 | 100.0% |
| Tablet | 248 | 58.2% |
| No Computing Device | 0 | 0.0% |
| Total | 426 | 100.0% |
Internet Access in Belview
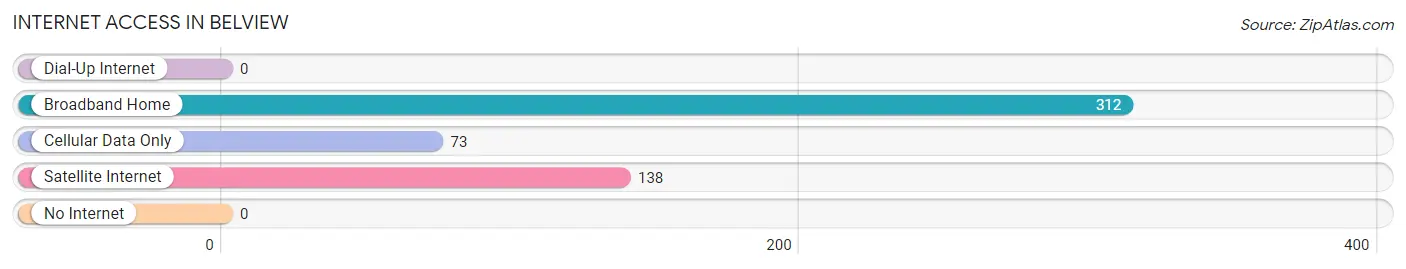
| Internet Type | # Households | % Households |
| Dial-Up Internet | 0 | 0.0% |
| Broadband Home | 312 | 73.2% |
| Cellular Data Only | 73 | 17.1% |
| Satellite Internet | 138 | 32.4% |
| No Internet | 0 | 0.0% |
| Total | 426 | 100.0% |
Belview Summary
Belview is a small town located in the state of Virginia, in the United States. It is situated in the Shenandoah Valley, in the northern part of the state. The town is located in the county of Rockingham, and is part of the Harrisonburg Metropolitan Statistical Area. Belview has a population of approximately 1,000 people, and is a rural community with a strong agricultural heritage.
History
Belview was first settled in the late 1700s by German immigrants. The town was originally known as “Belleview”, and was named after the beautiful view of the Shenandoah Valley from the town. The town was officially incorporated in 1891, and has remained a small, rural community ever since.
Geography
Belview is located in the northern part of the state of Virginia, in the Shenandoah Valley. The town is situated in the county of Rockingham, and is part of the Harrisonburg Metropolitan Statistical Area. The town is located at an elevation of 1,000 feet, and is surrounded by rolling hills and mountains. The town is located near the Blue Ridge Mountains, and is close to the Shenandoah National Park.
Economy
Belview’s economy is largely based on agriculture. The town is home to several farms, and the surrounding area is known for its production of apples, peaches, and other fruits and vegetables. The town is also home to several small businesses, including a grocery store, a hardware store, and a few restaurants.
Demographics
As of the 2010 census, Belview had a population of 1,000 people. The town is predominantly white, with a small African American population. The median household income in Belview is $41,000, and the median age is 44. The town has a low unemployment rate, and the majority of the population is employed in the agricultural sector.
Belview is a small, rural town with a strong agricultural heritage. The town is home to a diverse population, and is known for its beautiful views of the Shenandoah Valley. The town is home to several small businesses, and the surrounding area is known for its production of apples, peaches, and other fruits and vegetables. Belview is a great place to live, work, and raise a family.
Common Questions
What is Per Capita Income in Belview?
Per Capita income in Belview is $18,448.
What is the Median Family Income in Belview?
Median Family Income in Belview is $38,458.
What is the Median Household income in Belview?
Median Household Income in Belview is $52,969.
What is Income or Wage Gap in Belview?
Income or Wage Gap in Belview is 52.6%.
Women in Belview earn 47.4 cents for every dollar earned by a man.
What is Inequality or Gini Index in Belview?
Inequality or Gini Index in Belview is 0.25.
What is the Total Population of Belview?
Total Population of Belview is 1,197.
What is the Total Male Population of Belview?
Total Male Population of Belview is 656.
What is the Total Female Population of Belview?
Total Female Population of Belview is 541.
What is the Ratio of Males per 100 Females in Belview?
There are 121.26 Males per 100 Females in Belview.
What is the Ratio of Females per 100 Males in Belview?
There are 82.47 Females per 100 Males in Belview.
What is the Median Population Age in Belview?
Median Population Age in Belview is 26.2 Years.
What is the Average Family Size in Belview
Average Family Size in Belview is 3.2 People.
What is the Average Household Size in Belview
Average Household Size in Belview is 2.8 People.
How Large is the Labor Force in Belview?
There are 491 People in the Labor Forcein in Belview.
What is the Percentage of People in the Labor Force in Belview?
56.3% of People are in the Labor Force in Belview.