Fieldale, VA Map & Demographics
Fieldale Map
Fieldale Overview
$18,878
PER CAPITA INCOME
$41,250
AVG FAMILY INCOME
$41,601
AVG HOUSEHOLD INCOME
22.0%
WAGE / INCOME GAP [ % ]
78.0¢/ $1
WAGE / INCOME GAP [ $ ]
0.31
INEQUALITY / GINI INDEX
802
TOTAL POPULATION
453
MALE POPULATION
349
FEMALE POPULATION
129.80
MALES / 100 FEMALES
77.04
FEMALES / 100 MALES
34.4
MEDIAN AGE
4.3
AVG FAMILY SIZE
2.8
AVG HOUSEHOLD SIZE
200
LABOR FORCE [ PEOPLE ]
30.7%
PERCENT IN LABOR FORCE
Fieldale Zip Codes
Fieldale Area Codes
Income in Fieldale
Income Overview in Fieldale
Per Capita Income in Fieldale is $18,878, while median incomes of families and households are $41,250 and $41,601 respectively.
| Characteristic | Number | Measure |
| Per Capita Income | 802 | $18,878 |
| Median Family Income | 152 | $41,250 |
| Mean Family Income | 152 | $60,607 |
| Median Household Income | 285 | $41,601 |
| Mean Household Income | 285 | $53,433 |
| Income Deficit | 152 | $0 |
| Wage / Income Gap (%) | 802 | 21.98% |
| Wage / Income Gap ($) | 802 | 78.02¢ per $1 |
| Gini / Inequality Index | 802 | 0.31 |
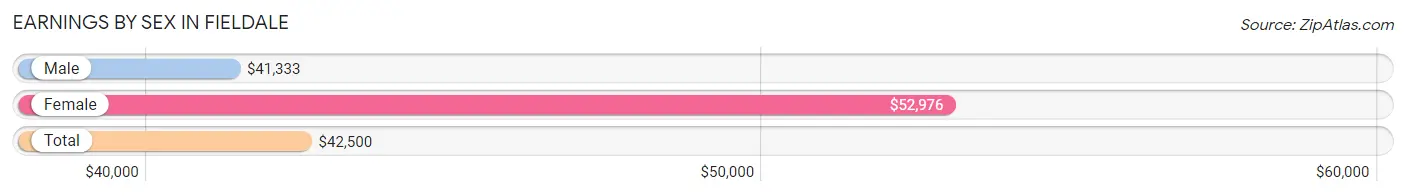
Earnings by Sex in Fieldale
Average Earnings in Fieldale are $42,500, $41,333 for men and $52,976 for women, a difference of 22.0%.
| Sex | Number | Average Earnings |
| Male | 100 (50.0%) | $41,333 |
| Female | 100 (50.0%) | $52,976 |
| Total | 200 (100.0%) | $42,500 |
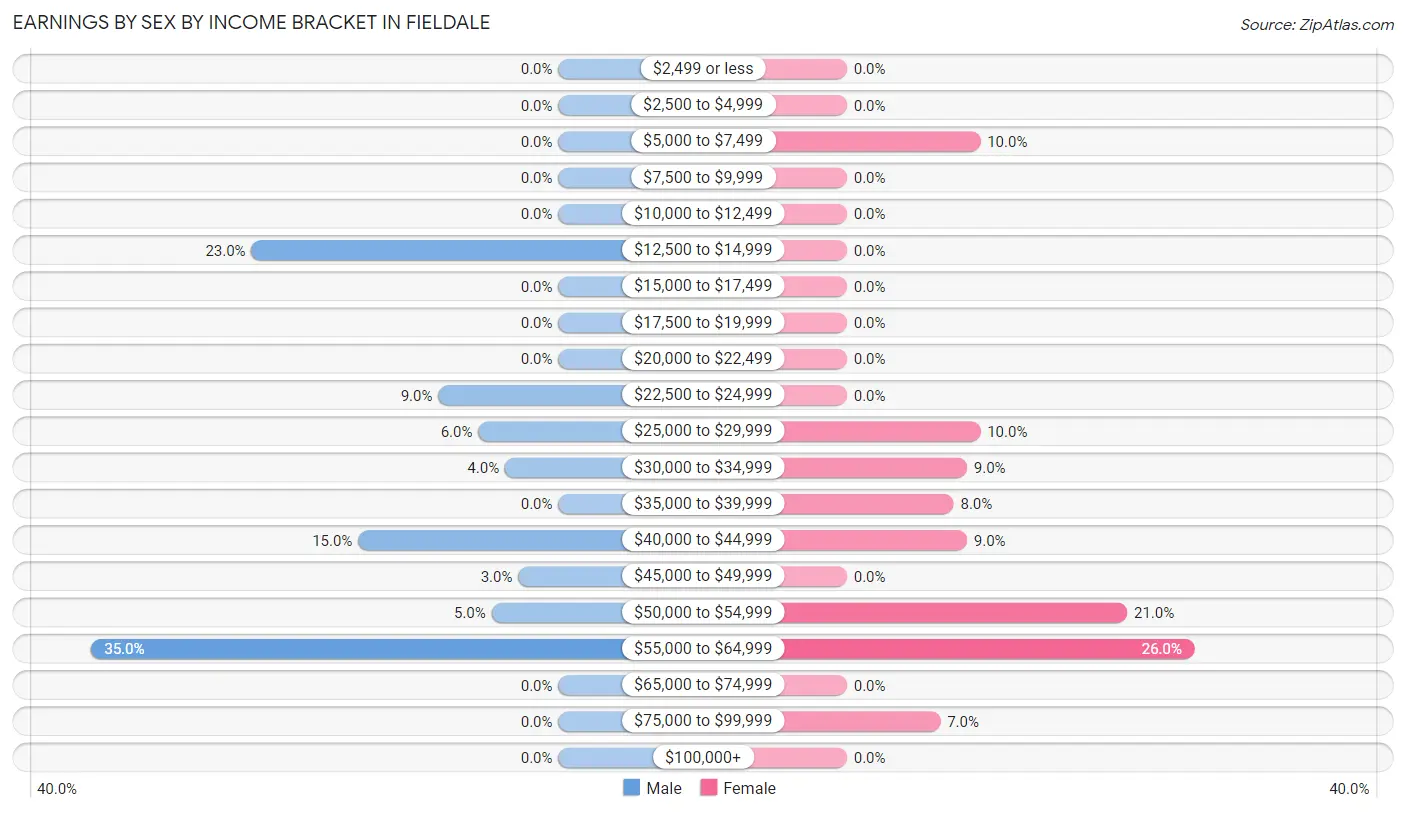
Earnings by Sex by Income Bracket in Fieldale
The most common earnings brackets in Fieldale are $55,000 to $64,999 for men (35 | 35.0%) and $55,000 to $64,999 for women (26 | 26.0%).
| Income | Male | Female |
| $2,499 or less | 0 (0.0%) | 0 (0.0%) |
| $2,500 to $4,999 | 0 (0.0%) | 0 (0.0%) |
| $5,000 to $7,499 | 0 (0.0%) | 10 (10.0%) |
| $7,500 to $9,999 | 0 (0.0%) | 0 (0.0%) |
| $10,000 to $12,499 | 0 (0.0%) | 0 (0.0%) |
| $12,500 to $14,999 | 23 (23.0%) | 0 (0.0%) |
| $15,000 to $17,499 | 0 (0.0%) | 0 (0.0%) |
| $17,500 to $19,999 | 0 (0.0%) | 0 (0.0%) |
| $20,000 to $22,499 | 0 (0.0%) | 0 (0.0%) |
| $22,500 to $24,999 | 9 (9.0%) | 0 (0.0%) |
| $25,000 to $29,999 | 6 (6.0%) | 10 (10.0%) |
| $30,000 to $34,999 | 4 (4.0%) | 9 (9.0%) |
| $35,000 to $39,999 | 0 (0.0%) | 8 (8.0%) |
| $40,000 to $44,999 | 15 (15.0%) | 9 (9.0%) |
| $45,000 to $49,999 | 3 (3.0%) | 0 (0.0%) |
| $50,000 to $54,999 | 5 (5.0%) | 21 (21.0%) |
| $55,000 to $64,999 | 35 (35.0%) | 26 (26.0%) |
| $65,000 to $74,999 | 0 (0.0%) | 0 (0.0%) |
| $75,000 to $99,999 | 0 (0.0%) | 7 (7.0%) |
| $100,000+ | 0 (0.0%) | 0 (0.0%) |
| Total | 100 (100.0%) | 100 (100.0%) |
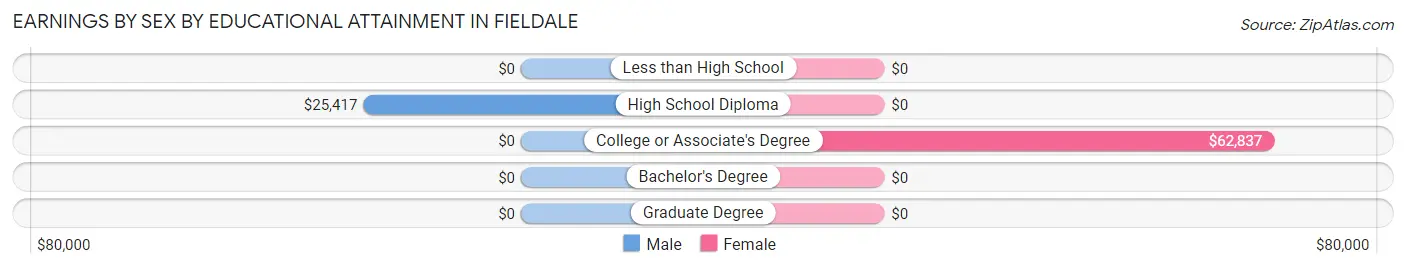
Earnings by Sex by Educational Attainment in Fieldale
Average earnings in Fieldale are $41,333 for men and $53,571 for women, a difference of 22.8%. Men with an educational attainment of high school diploma enjoy the highest average annual earnings of $25,417, while those with high school diploma education earn the least with $25,417. Women with an educational attainment of college or associate's degree earn the most with the average annual earnings of $62,837, while those with college or associate's degree education have the smallest earnings of $62,837.
| Educational Attainment | Male Income | Female Income |
| Less than High School | - | - |
| High School Diploma | $25,417 | $0 |
| College or Associate's Degree | - | - |
| Bachelor's Degree | - | - |
| Graduate Degree | - | - |
| Total | $41,333 | $53,571 |
Family Income in Fieldale
Family Income Brackets in Fieldale
According to the Fieldale family income data, there are 58 families falling into the $35,000 to $49,999 income range, which is the most common income bracket and makes up 38.2% of all families.
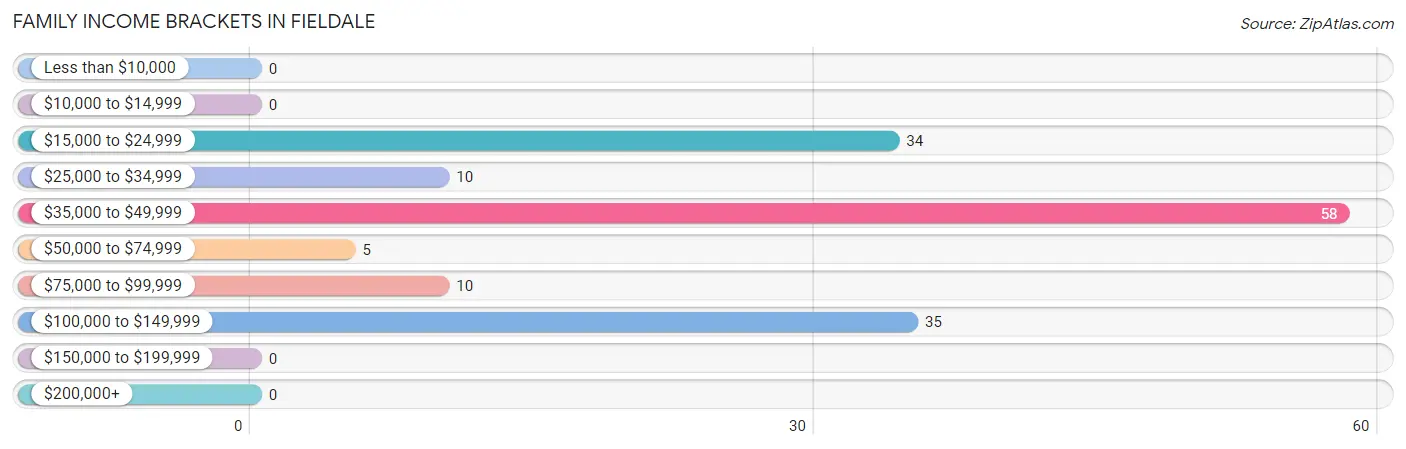
| Income Bracket | # Families | % Families |
| Less than $10,000 | 0 | 0.0% |
| $10,000 to $14,999 | 0 | 0.0% |
| $15,000 to $24,999 | 34 | 22.4% |
| $25,000 to $34,999 | 10 | 6.6% |
| $35,000 to $49,999 | 58 | 38.2% |
| $50,000 to $74,999 | 5 | 3.3% |
| $75,000 to $99,999 | 10 | 6.6% |
| $100,000 to $149,999 | 35 | 23.0% |
| $150,000 to $199,999 | 0 | 0.0% |
| $200,000+ | 0 | 0.0% |
Family Income by Famaliy Size in Fieldale
2-person families (60 | 39.5%) account for the highest median family income in Fieldale with $41,136 per family, while 2-person families (60 | 39.5%) have the highest median income of $20,568 per family member.
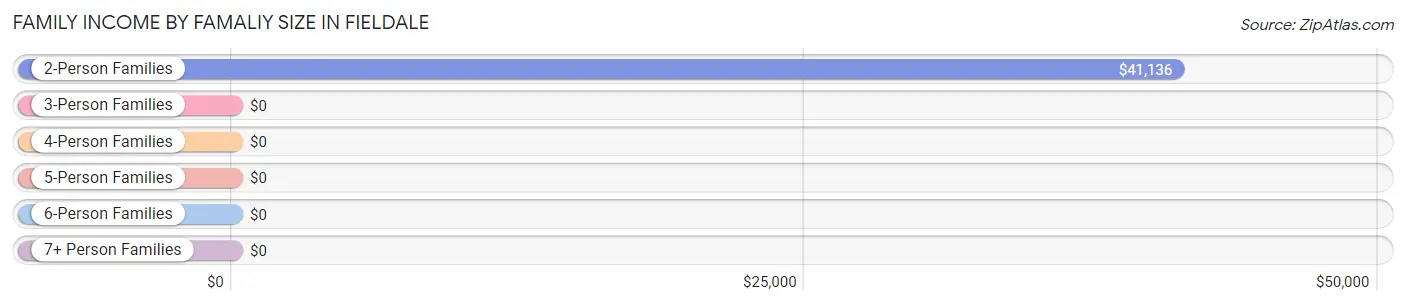
| Income Bracket | # Families | Median Income |
| 2-Person Families | 60 (39.5%) | $41,136 |
| 3-Person Families | 35 (23.0%) | $0 |
| 4-Person Families | 23 (15.1%) | $0 |
| 5-Person Families | 0 (0.0%) | $0 |
| 6-Person Families | 34 (22.4%) | $0 |
| 7+ Person Families | 0 (0.0%) | $0 |
| Total | 152 (100.0%) | $41,250 |
Family Income by Number of Earners in Fieldale
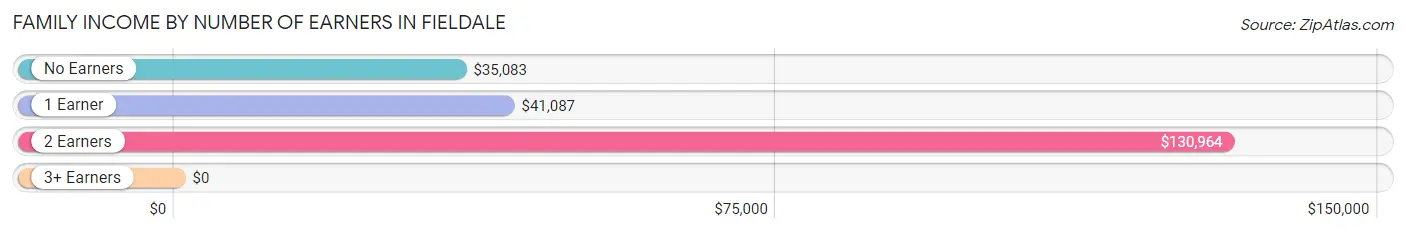
| Number of Earners | # Families | Median Income |
| No Earners | 69 (45.4%) | $35,083 |
| 1 Earner | 40 (26.3%) | $41,087 |
| 2 Earners | 43 (28.3%) | $130,964 |
| 3+ Earners | 0 (0.0%) | $0 |
| Total | 152 (100.0%) | $41,250 |
Household Income in Fieldale
Household Income Brackets in Fieldale
With 107 households falling in the category, the $35,000 to $49,999 income range is the most frequent in Fieldale, accounting for 37.5% of all households.
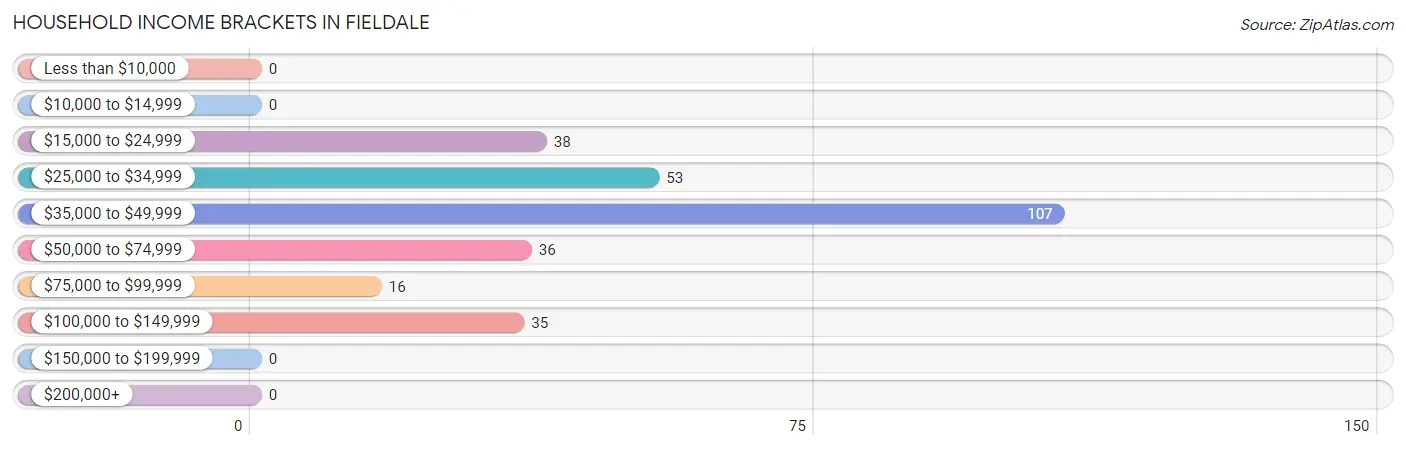
| Income Bracket | # Households | % Households |
| Less than $10,000 | 0 | 0.0% |
| $10,000 to $14,999 | 0 | 0.0% |
| $15,000 to $24,999 | 38 | 13.3% |
| $25,000 to $34,999 | 53 | 18.6% |
| $35,000 to $49,999 | 107 | 37.5% |
| $50,000 to $74,999 | 36 | 12.6% |
| $75,000 to $99,999 | 16 | 5.6% |
| $100,000 to $149,999 | 35 | 12.3% |
| $150,000 to $199,999 | 0 | 0.0% |
| $200,000+ | 0 | 0.0% |
Household Income by Householder Age in Fieldale
The median household income in Fieldale is $41,601, with the highest median household income of $41,848 found in the 45 to 64 years age bracket for the primary householder. A total of 150 households (52.6%) fall into this category. Meanwhile, the 15 to 24 years age bracket for the primary householder has the lowest median household income of $0, with 5 households (1.8%) in this group.
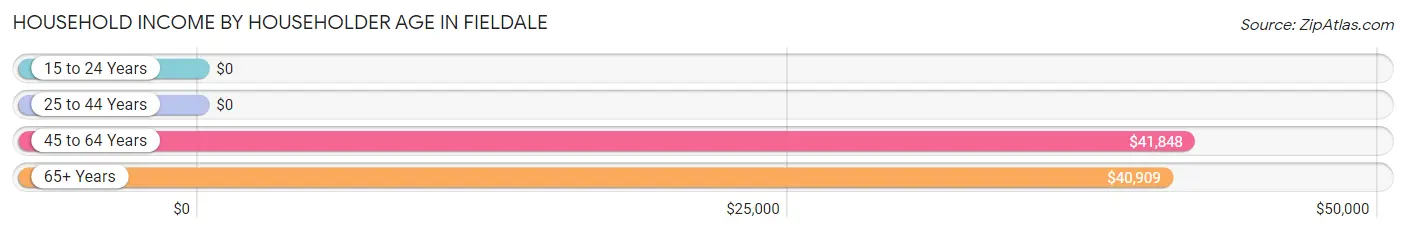
| Income Bracket | # Households | Median Income |
| 15 to 24 Years | 5 (1.8%) | $0 |
| 25 to 44 Years | 60 (21.0%) | $0 |
| 45 to 64 Years | 150 (52.6%) | $41,848 |
| 65+ Years | 70 (24.6%) | $40,909 |
| Total | 285 (100.0%) | $41,601 |
Poverty in Fieldale
Income Below Poverty by Sex and Age in Fieldale
With 31.6% poverty level for males and 35.8% for females among the residents of Fieldale, under 5 year old males and 6 to 11 year old females are the most vulnerable to poverty, with 58 males (100.0%) and 50 females (100.0%) in their respective age groups living below the poverty level.
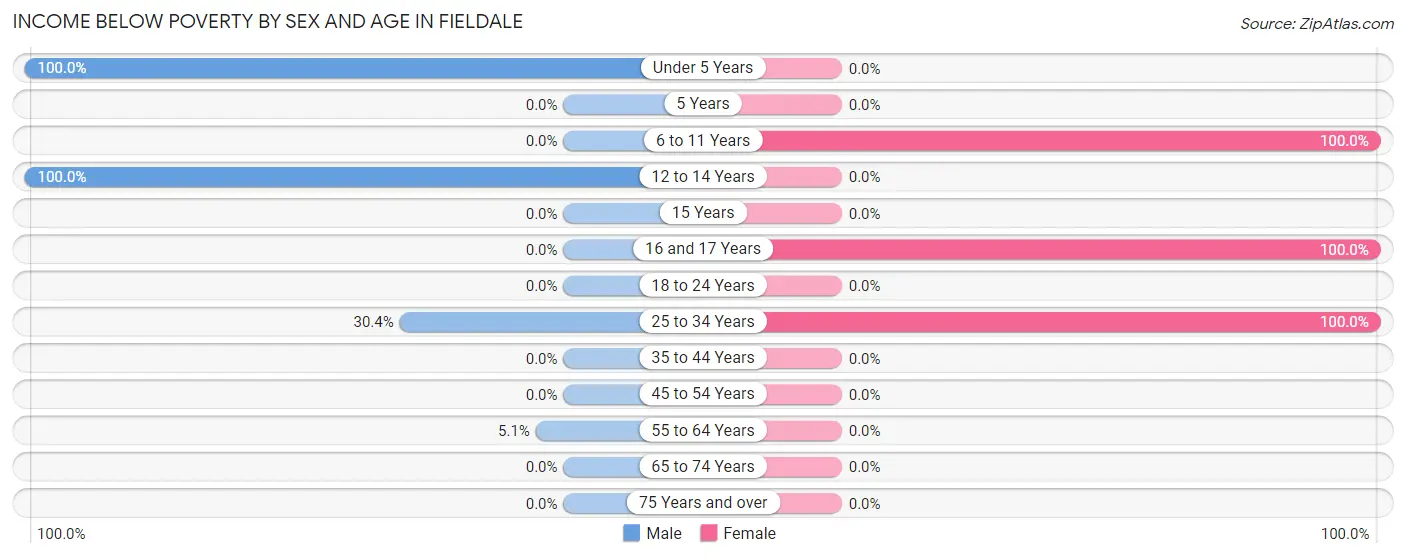
| Age Bracket | Male | Female |
| Under 5 Years | 58 (100.0%) | 0 (0.0%) |
| 5 Years | 0 (0.0%) | 0 (0.0%) |
| 6 to 11 Years | 0 (0.0%) | 50 (100.0%) |
| 12 to 14 Years | 43 (100.0%) | 0 (0.0%) |
| 15 Years | 0 (0.0%) | 0 (0.0%) |
| 16 and 17 Years | 0 (0.0%) | 41 (100.0%) |
| 18 to 24 Years | 0 (0.0%) | 0 (0.0%) |
| 25 to 34 Years | 38 (30.4%) | 34 (100.0%) |
| 35 to 44 Years | 0 (0.0%) | 0 (0.0%) |
| 45 to 54 Years | 0 (0.0%) | 0 (0.0%) |
| 55 to 64 Years | 4 (5.1%) | 0 (0.0%) |
| 65 to 74 Years | 0 (0.0%) | 0 (0.0%) |
| 75 Years and over | 0 (0.0%) | 0 (0.0%) |
| Total | 143 (31.6%) | 125 (35.8%) |
Income Above Poverty by Sex and Age in Fieldale
According to the poverty statistics in Fieldale, males aged 18 to 24 years and females aged 18 to 24 years are the age groups that are most secure financially, with 100.0% of males and 100.0% of females in these age groups living above the poverty line.
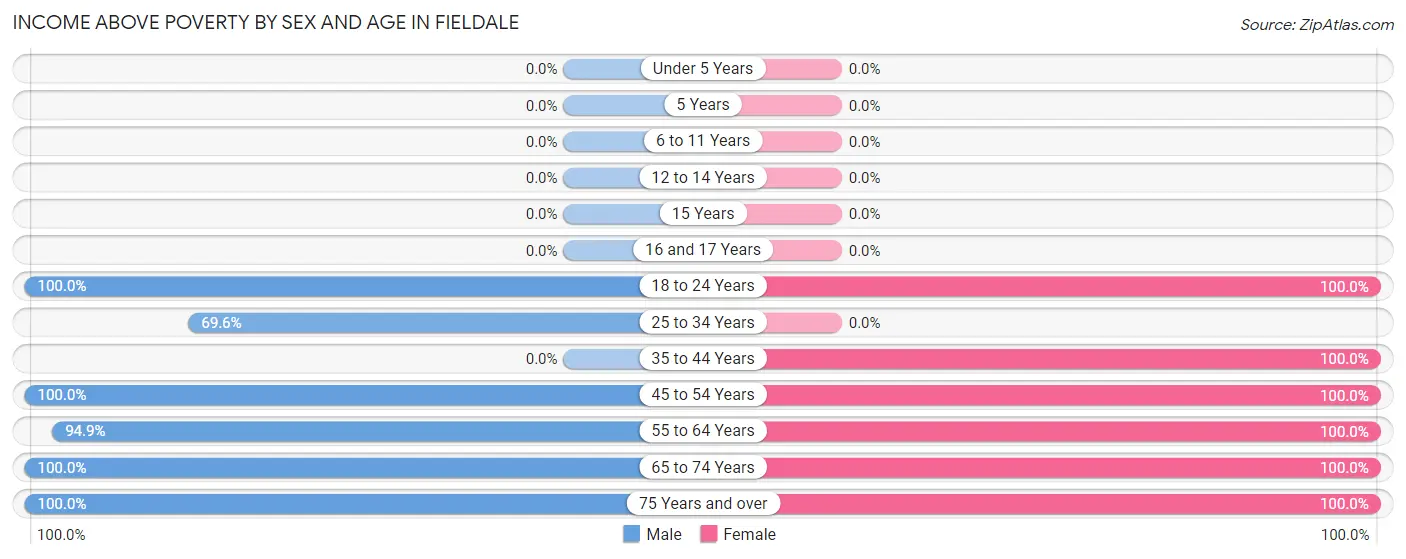
| Age Bracket | Male | Female |
| Under 5 Years | 0 (0.0%) | 0 (0.0%) |
| 5 Years | 0 (0.0%) | 0 (0.0%) |
| 6 to 11 Years | 0 (0.0%) | 0 (0.0%) |
| 12 to 14 Years | 0 (0.0%) | 0 (0.0%) |
| 15 Years | 0 (0.0%) | 0 (0.0%) |
| 16 and 17 Years | 0 (0.0%) | 0 (0.0%) |
| 18 to 24 Years | 34 (100.0%) | 37 (100.0%) |
| 25 to 34 Years | 87 (69.6%) | 0 (0.0%) |
| 35 to 44 Years | 0 (0.0%) | 32 (100.0%) |
| 45 to 54 Years | 64 (100.0%) | 24 (100.0%) |
| 55 to 64 Years | 74 (94.9%) | 62 (100.0%) |
| 65 to 74 Years | 36 (100.0%) | 9 (100.0%) |
| 75 Years and over | 15 (100.0%) | 60 (100.0%) |
| Total | 310 (68.4%) | 224 (64.2%) |
Income Below Poverty Among Married-Couple Families in Fieldale
The poverty statistics for married-couple families in Fieldale show that 25.8% or 34 of the total 132 families live below the poverty line. Families with 3 or 4 children have the highest poverty rate of 100.0%, comprising of 34 families. On the other hand, families with no children have the lowest poverty rate of 0.0%, which includes 0 families.
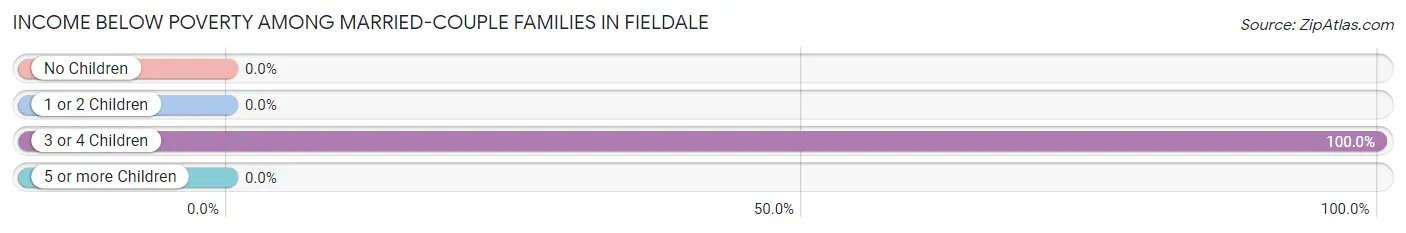
| Children | Above Poverty | Below Poverty |
| No Children | 98 (100.0%) | 0 (0.0%) |
| 1 or 2 Children | 0 (0.0%) | 0 (0.0%) |
| 3 or 4 Children | 0 (0.0%) | 34 (100.0%) |
| 5 or more Children | 0 (0.0%) | 0 (0.0%) |
| Total | 98 (74.2%) | 34 (25.8%) |
Income Below Poverty Among Single-Parent Households in Fieldale
| Children | Single Father | Single Mother |
| No Children | 0 (0.0%) | 0 (0.0%) |
| 1 or 2 Children | 0 (0.0%) | 0 (0.0%) |
| 3 or 4 Children | 0 (0.0%) | 0 (0.0%) |
| 5 or more Children | 0 (0.0%) | 0 (0.0%) |
| Total | 0 (0.0%) | 0 (0.0%) |
Income Below Poverty Among Married-Couple vs Single-Parent Households in Fieldale
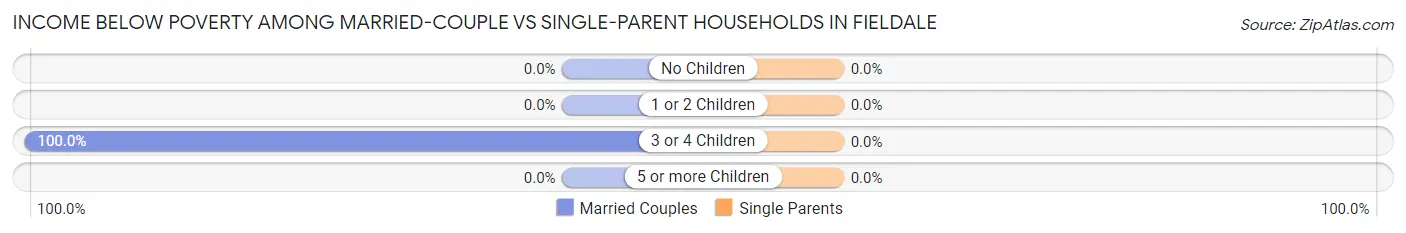
| Children | Married-Couple Families | Single-Parent Households |
| No Children | 0 (0.0%) | 0 (0.0%) |
| 1 or 2 Children | 0 (0.0%) | 0 (0.0%) |
| 3 or 4 Children | 34 (100.0%) | 0 (0.0%) |
| 5 or more Children | 0 (0.0%) | 0 (0.0%) |
| Total | 34 (25.8%) | 0 (0.0%) |
Race in Fieldale
The most populous races in Fieldale are , and White / Caucasian (802 | 100.0%).
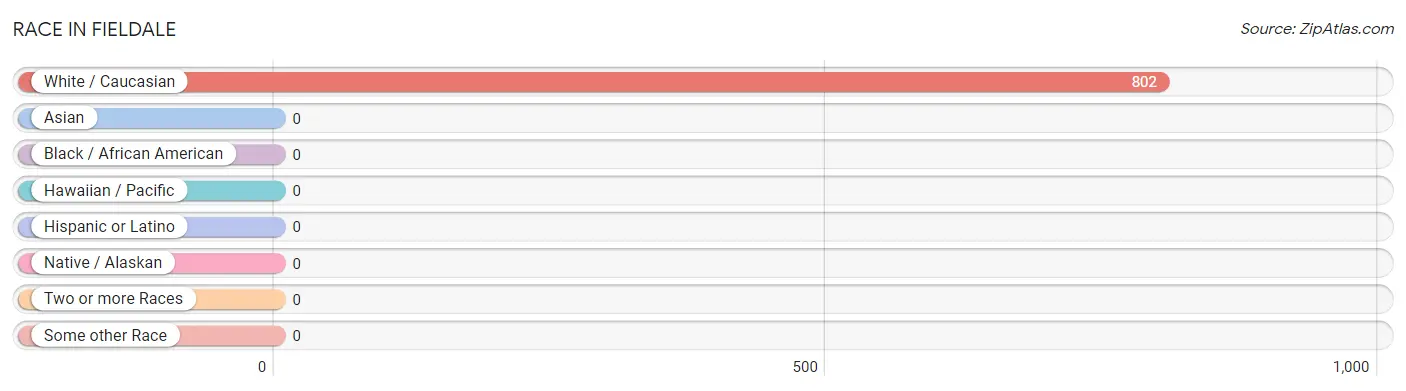
| Race | # Population | % Population |
| Asian | 0 | 0.0% |
| Black / African American | 0 | 0.0% |
| Hawaiian / Pacific | 0 | 0.0% |
| Hispanic or Latino | 0 | 0.0% |
| Native / Alaskan | 0 | 0.0% |
| White / Caucasian | 802 | 100.0% |
| Two or more Races | 0 | 0.0% |
| Some other Race | 0 | 0.0% |
| Total | 802 | 100.0% |
Ancestry in Fieldale
The most populous ancestries reported in Fieldale are American (66 | 8.2%), German (56 | 7.0%), English (53 | 6.6%), Irish (48 | 6.0%), and Portuguese (26 | 3.2%), together accounting for 31.0% of all Fieldale residents.
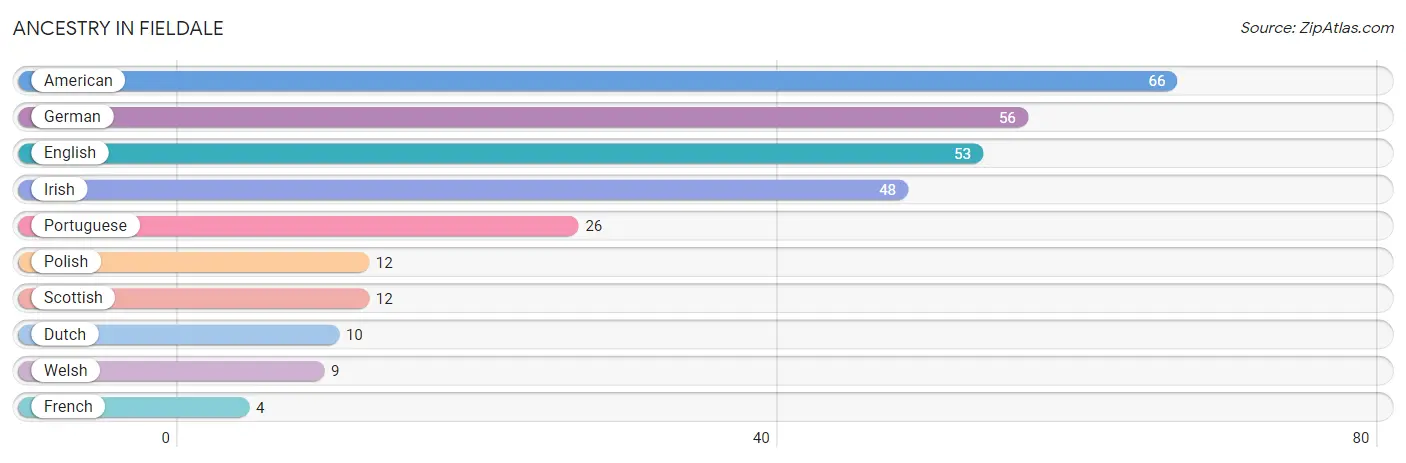
| Ancestry | # Population | % Population |
| American | 66 | 8.2% |
| Dutch | 10 | 1.3% |
| English | 53 | 6.6% |
| French | 4 | 0.5% |
| German | 56 | 7.0% |
| Irish | 48 | 6.0% |
| Polish | 12 | 1.5% |
| Portuguese | 26 | 3.2% |
| Scottish | 12 | 1.5% |
| Welsh | 9 | 1.1% | View All 10 Rows |
Immigrants in Fieldale

| Immigration Origin | # Population | % Population | View All 0 Rows |
Sex and Age in Fieldale
Sex and Age in Fieldale
The most populous age groups in Fieldale are 30 to 34 Years (125 | 27.6%) for men and 15 to 19 Years (68 | 19.5%) for women.
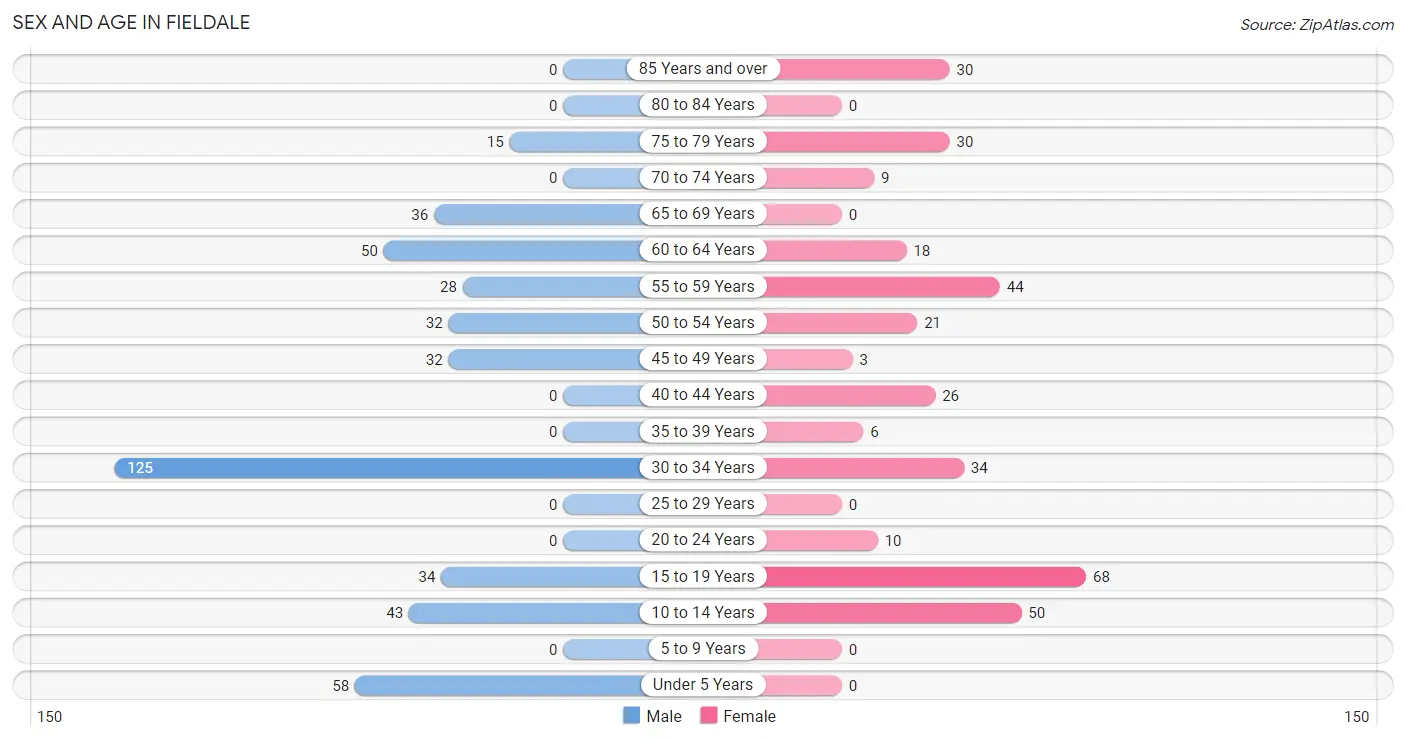
| Age Bracket | Male | Female |
| Under 5 Years | 58 (12.8%) | 0 (0.0%) |
| 5 to 9 Years | 0 (0.0%) | 0 (0.0%) |
| 10 to 14 Years | 43 (9.5%) | 50 (14.3%) |
| 15 to 19 Years | 34 (7.5%) | 68 (19.5%) |
| 20 to 24 Years | 0 (0.0%) | 10 (2.9%) |
| 25 to 29 Years | 0 (0.0%) | 0 (0.0%) |
| 30 to 34 Years | 125 (27.6%) | 34 (9.7%) |
| 35 to 39 Years | 0 (0.0%) | 6 (1.7%) |
| 40 to 44 Years | 0 (0.0%) | 26 (7.4%) |
| 45 to 49 Years | 32 (7.1%) | 3 (0.9%) |
| 50 to 54 Years | 32 (7.1%) | 21 (6.0%) |
| 55 to 59 Years | 28 (6.2%) | 44 (12.6%) |
| 60 to 64 Years | 50 (11.0%) | 18 (5.2%) |
| 65 to 69 Years | 36 (8.0%) | 0 (0.0%) |
| 70 to 74 Years | 0 (0.0%) | 9 (2.6%) |
| 75 to 79 Years | 15 (3.3%) | 30 (8.6%) |
| 80 to 84 Years | 0 (0.0%) | 0 (0.0%) |
| 85 Years and over | 0 (0.0%) | 30 (8.6%) |
| Total | 453 (100.0%) | 349 (100.0%) |
Families and Households in Fieldale
Median Family Size in Fieldale
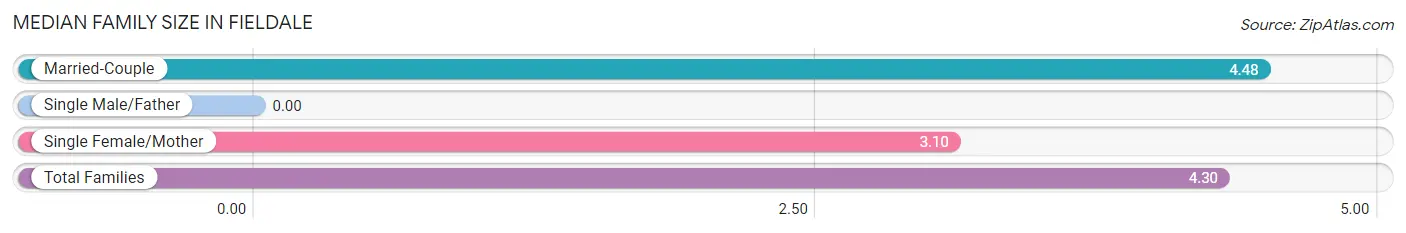
| Family Type | # Families | Family Size |
| Married-Couple | 132 (86.8%) | 4.48 |
| Single Male/Father | 0 (0.0%) | - |
| Single Female/Mother | 20 (13.2%) | 3.10 |
| Total Families | 152 (100.0%) | 4.30 |
Median Household Size in Fieldale
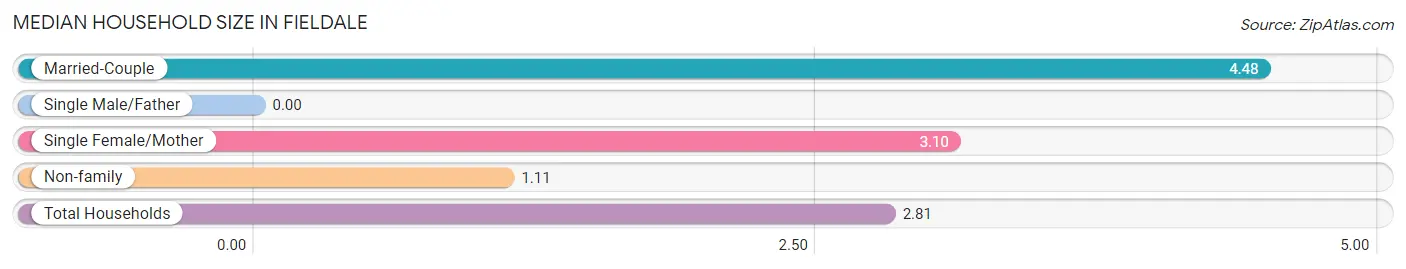
| Household Type | # Households | Household Size |
| Married-Couple | 132 (46.3%) | 4.48 |
| Single Male/Father | 0 (0.0%) | - |
| Single Female/Mother | 20 (7.0%) | 3.10 |
| Non-family | 133 (46.7%) | 1.11 |
| Total Households | 285 (100.0%) | 2.81 |
Household Size by Marriage Status in Fieldale
Out of a total of 285 households in Fieldale, 152 (53.3%) are family households, while 133 (46.7%) are nonfamily households. The most numerous type of family households are 2-person households, comprising 60, and the most common type of nonfamily households are 1-person households, comprising 120.
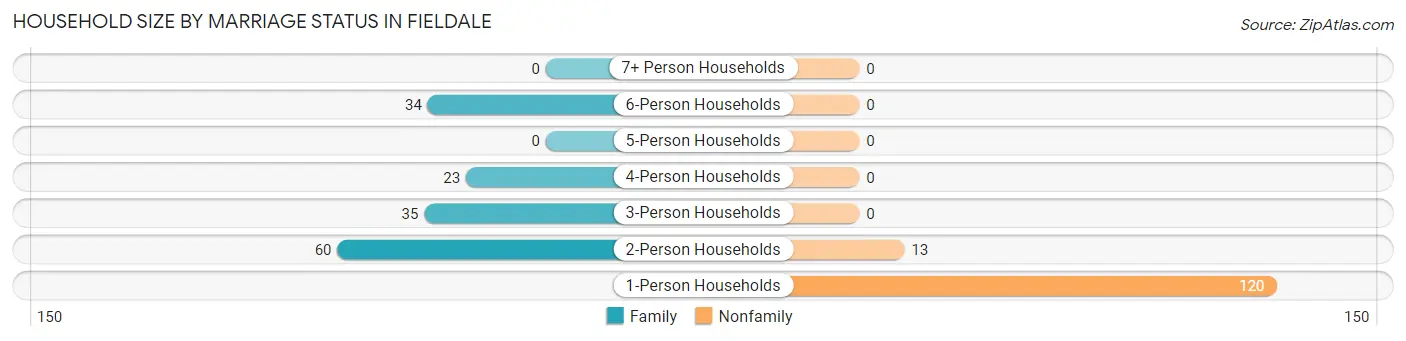
| Household Size | Family Households | Nonfamily Households |
| 1-Person Households | - | 120 (42.1%) |
| 2-Person Households | 60 (21.0%) | 13 (4.6%) |
| 3-Person Households | 35 (12.3%) | 0 (0.0%) |
| 4-Person Households | 23 (8.1%) | 0 (0.0%) |
| 5-Person Households | 0 (0.0%) | 0 (0.0%) |
| 6-Person Households | 34 (11.9%) | 0 (0.0%) |
| 7+ Person Households | 0 (0.0%) | 0 (0.0%) |
| Total | 152 (53.3%) | 133 (46.7%) |
Female Fertility in Fieldale
Fertility by Age in Fieldale
| Age Bracket | Women with Births | Births / 1,000 Women |
| 15 to 19 years | 0 (0.0%) | 0.0 |
| 20 to 34 years | 0 (0.0%) | 0.0 |
| 35 to 50 years | 0 (0.0%) | 0.0 |
| Total | 0 (0.0%) | 0.0 |
Fertility by Age by Marriage Status in Fieldale
| Age Bracket | Married | Unmarried |
| 15 to 19 years | 0 (0.0%) | 0 (0.0%) |
| 20 to 34 years | 0 (0.0%) | 0 (0.0%) |
| 35 to 50 years | 0 (0.0%) | 0 (0.0%) |
| Total | 0 (0.0%) | 0 (0.0%) |
Fertility by Education in Fieldale
| Educational Attainment | Women with Births | Births / 1,000 Women |
| Less than High School | 0 (0.0%) | 0.0 |
| High School Diploma | 0 (0.0%) | 0.0 |
| College or Associate's Degree | 0 (0.0%) | 0.0 |
| Bachelor's Degree | 0 (0.0%) | 0.0 |
| Graduate Degree | 0 (0.0%) | 0.0 |
| Total | 0 (0.0%) | 0.0 |
Fertility by Education by Marriage Status in Fieldale
| Educational Attainment | Married | Unmarried |
| Less than High School | 0 (0.0%) | 0 (0.0%) |
| High School Diploma | 0 (0.0%) | 0 (0.0%) |
| College or Associate's Degree | 0 (0.0%) | 0 (0.0%) |
| Bachelor's Degree | 0 (0.0%) | 0 (0.0%) |
| Graduate Degree | 0 (0.0%) | 0 (0.0%) |
| Total | 0 (0.0%) | 0 (0.0%) |
Employment Characteristics in Fieldale
Employment by Class of Employer in Fieldale
Among the 200 employed individuals in Fieldale, private company employees (143 | 71.5%), self-employed (not incorporated) (33 | 16.5%), and local government employees (24 | 12.0%) make up the most common classes of employment.
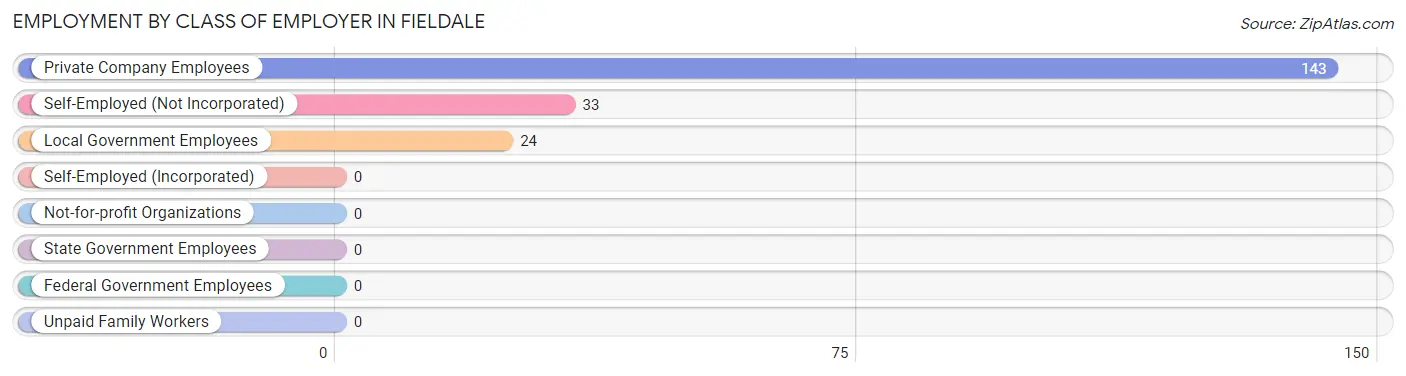
| Employer Class | # Employees | % Employees |
| Private Company Employees | 143 | 71.5% |
| Self-Employed (Incorporated) | 0 | 0.0% |
| Self-Employed (Not Incorporated) | 33 | 16.5% |
| Not-for-profit Organizations | 0 | 0.0% |
| Local Government Employees | 24 | 12.0% |
| State Government Employees | 0 | 0.0% |
| Federal Government Employees | 0 | 0.0% |
| Unpaid Family Workers | 0 | 0.0% |
| Total | 200 | 100.0% |
Employment Status by Age in Fieldale
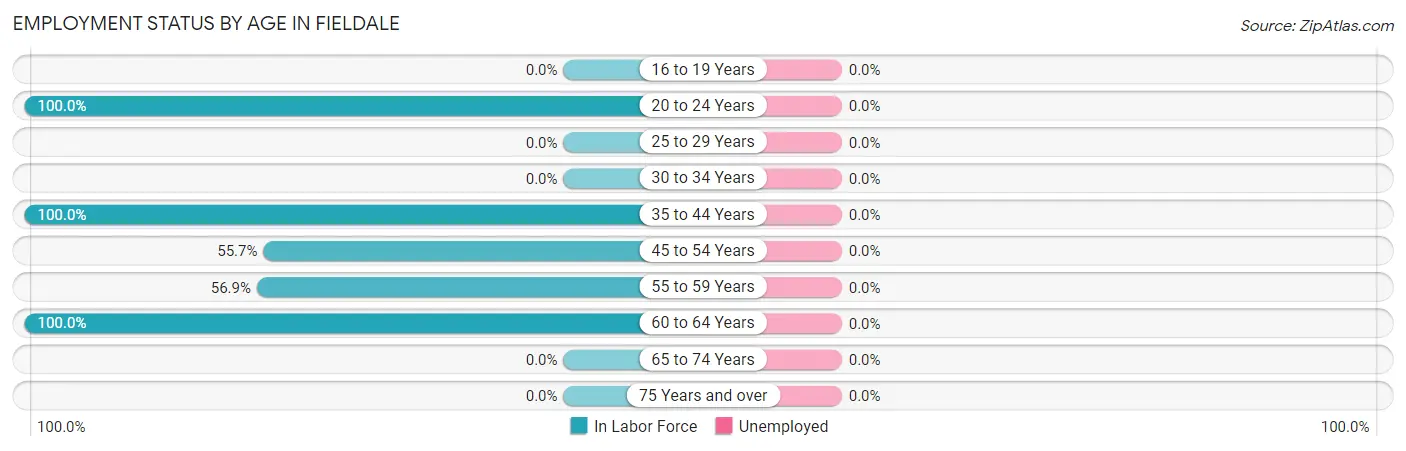
| Age Bracket | In Labor Force | Unemployed |
| 16 to 19 Years | 0 (0.0%) | 0 (0.0%) |
| 20 to 24 Years | 10 (100.0%) | 0 (0.0%) |
| 25 to 29 Years | 0 (0.0%) | 0 (0.0%) |
| 30 to 34 Years | 0 (0.0%) | 0 (0.0%) |
| 35 to 44 Years | 32 (100.0%) | 0 (0.0%) |
| 45 to 54 Years | 49 (55.7%) | 0 (0.0%) |
| 55 to 59 Years | 41 (56.9%) | 0 (0.0%) |
| 60 to 64 Years | 68 (100.0%) | 0 (0.0%) |
| 65 to 74 Years | 0 (0.0%) | 0 (0.0%) |
| 75 Years and over | 0 (0.0%) | 0 (0.0%) |
| Total | 200 (30.7%) | 0 (0.0%) |
Employment Status by Educational Attainment in Fieldale
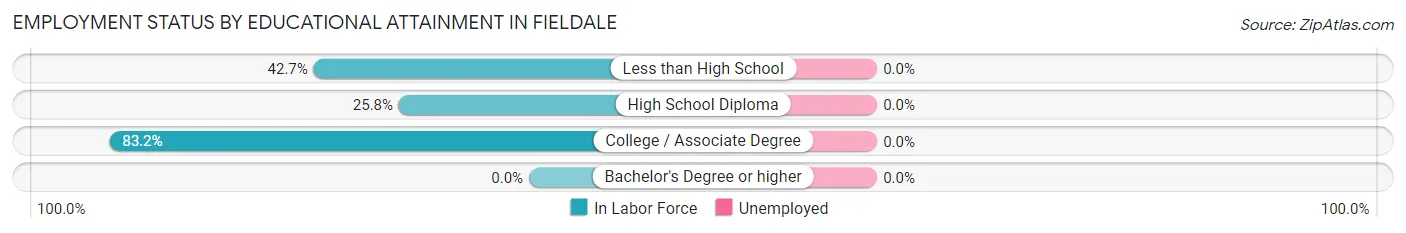
| Educational Attainment | In Labor Force | Unemployed |
| Less than High School | 35 (42.7%) | 0 (0.0%) |
| High School Diploma | 51 (25.8%) | 0 (0.0%) |
| College / Associate Degree | 104 (83.2%) | 0 (0.0%) |
| Bachelor's Degree or higher | 0 (0.0%) | 0 (0.0%) |
| Total | 190 (45.3%) | 0 (0.0%) |
Employment Occupations by Sex in Fieldale
Management, Business, Science and Arts Occupations
The most common Management, Business, Science and Arts occupations in Fieldale are Management (58 | 29.0%), Health Diagnosing & Treating (54 | 27.0%), and Health Technologists (33 | 16.5%).
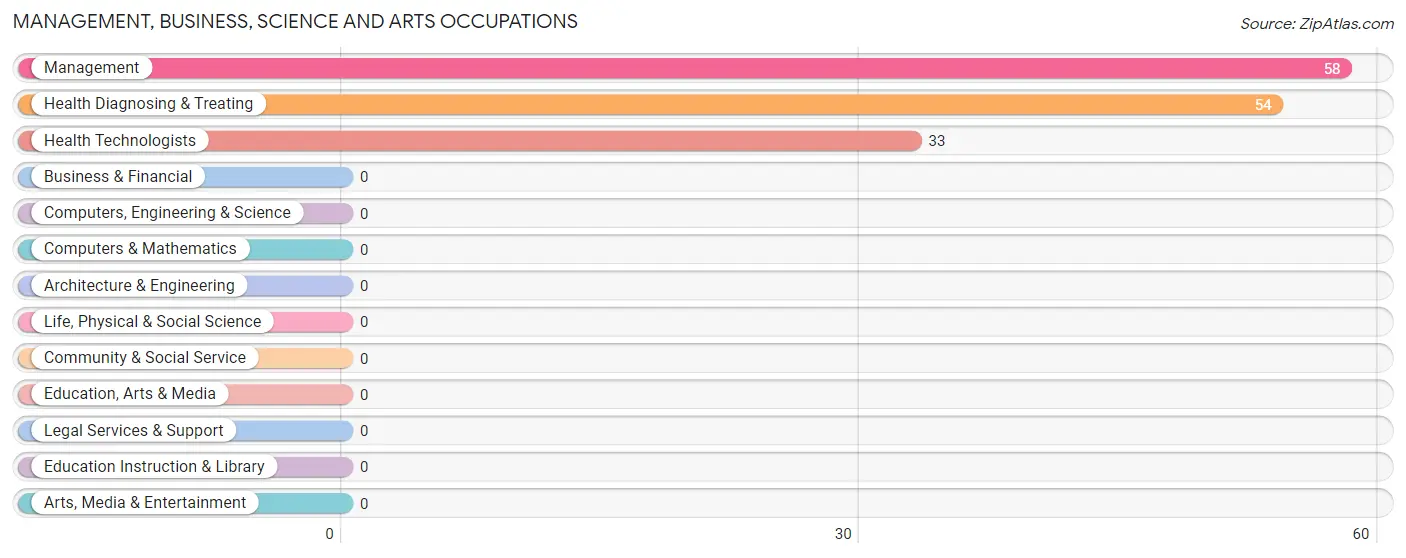
Management, Business, Science and Arts Occupations by Sex
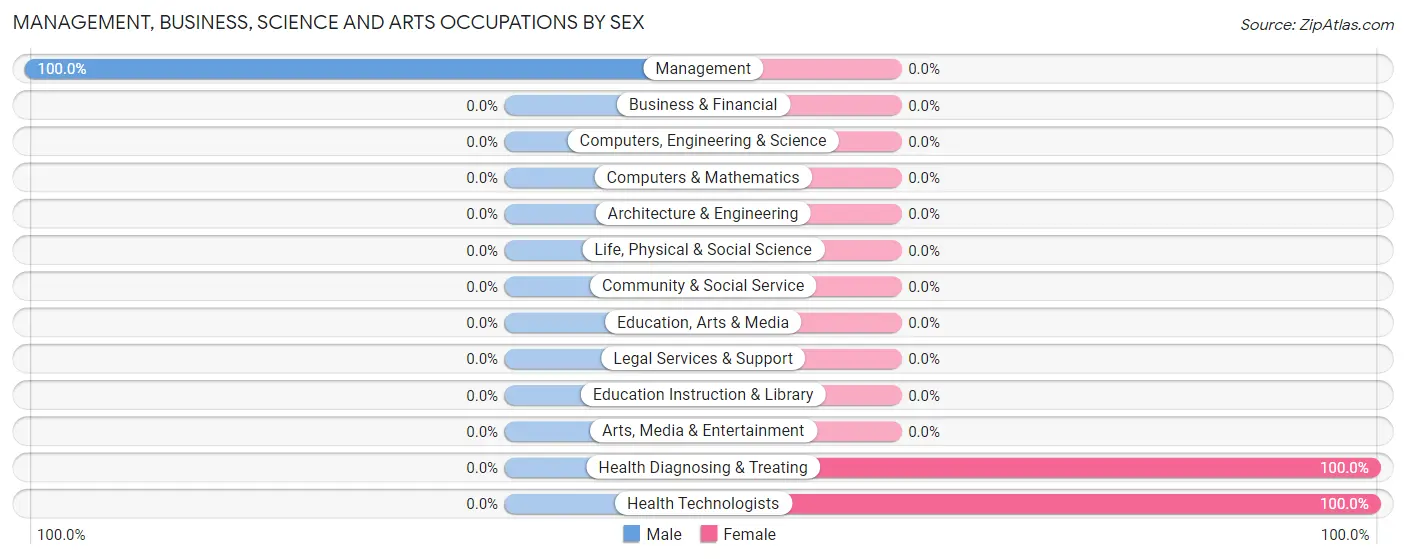
| Occupation | Male | Female |
| Management | 58 (100.0%) | 0 (0.0%) |
| Business & Financial | 0 (0.0%) | 0 (0.0%) |
| Computers, Engineering & Science | 0 (0.0%) | 0 (0.0%) |
| Computers & Mathematics | 0 (0.0%) | 0 (0.0%) |
| Architecture & Engineering | 0 (0.0%) | 0 (0.0%) |
| Life, Physical & Social Science | 0 (0.0%) | 0 (0.0%) |
| Community & Social Service | 0 (0.0%) | 0 (0.0%) |
| Education, Arts & Media | 0 (0.0%) | 0 (0.0%) |
| Legal Services & Support | 0 (0.0%) | 0 (0.0%) |
| Education Instruction & Library | 0 (0.0%) | 0 (0.0%) |
| Arts, Media & Entertainment | 0 (0.0%) | 0 (0.0%) |
| Health Diagnosing & Treating | 0 (0.0%) | 54 (100.0%) |
| Health Technologists | 0 (0.0%) | 33 (100.0%) |
| Total (Category) | 58 (51.8%) | 54 (48.2%) |
| Total (Overall) | 100 (50.0%) | 100 (50.0%) |
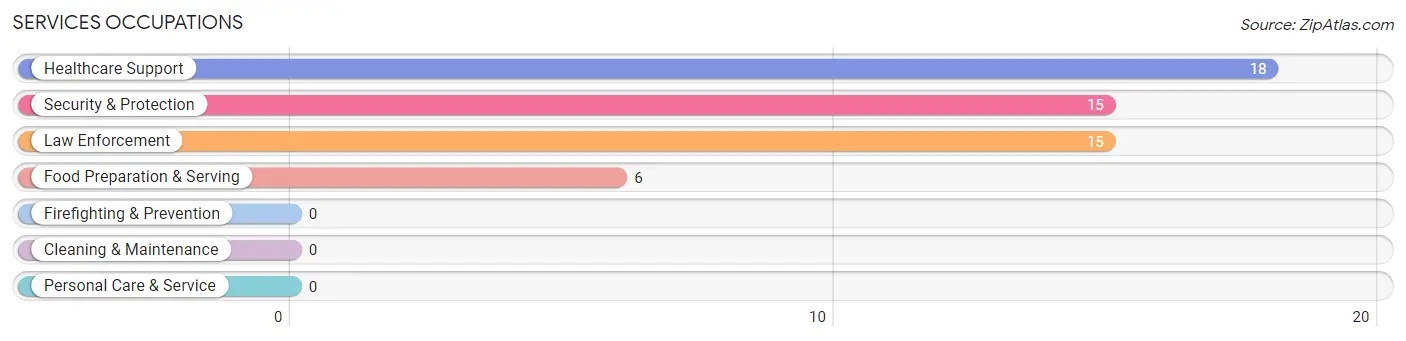
Services Occupations
The most common Services occupations in Fieldale are Healthcare Support (18 | 9.0%), Security & Protection (15 | 7.5%), Law Enforcement (15 | 7.5%), and Food Preparation & Serving (6 | 3.0%).
Services Occupations by Sex
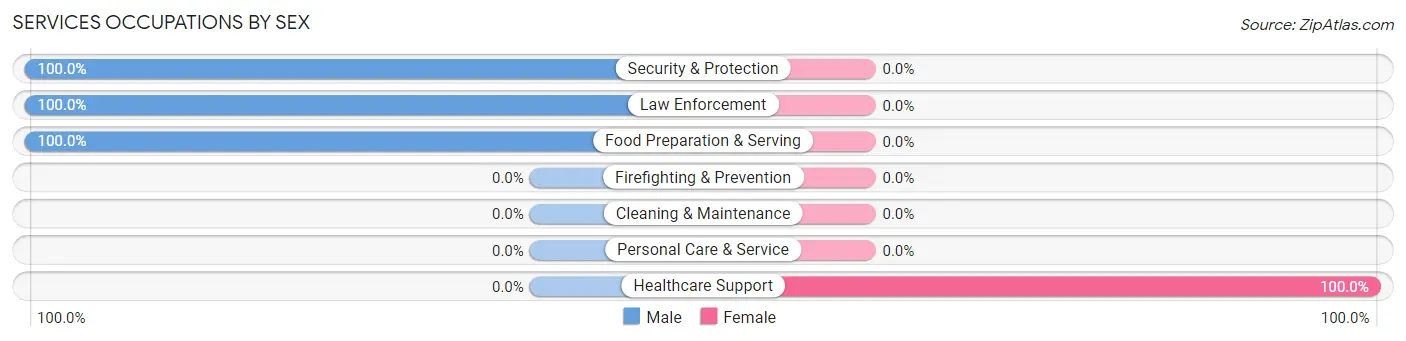
| Occupation | Male | Female |
| Healthcare Support | 0 (0.0%) | 18 (100.0%) |
| Security & Protection | 15 (100.0%) | 0 (0.0%) |
| Firefighting & Prevention | 0 (0.0%) | 0 (0.0%) |
| Law Enforcement | 15 (100.0%) | 0 (0.0%) |
| Food Preparation & Serving | 6 (100.0%) | 0 (0.0%) |
| Cleaning & Maintenance | 0 (0.0%) | 0 (0.0%) |
| Personal Care & Service | 0 (0.0%) | 0 (0.0%) |
| Total (Category) | 21 (53.8%) | 18 (46.2%) |
| Total (Overall) | 100 (50.0%) | 100 (50.0%) |
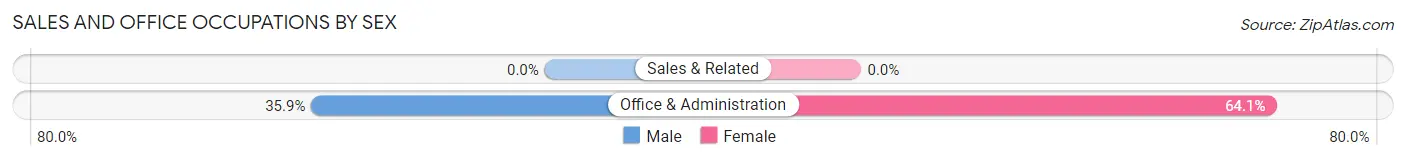
Sales and Office Occupations
The most common Sales and Office occupations in Fieldale are , and Office & Administration (39 | 19.5%).
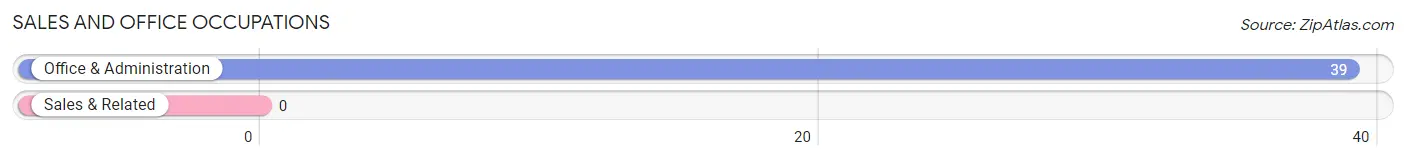
Sales and Office Occupations by Sex
| Occupation | Male | Female |
| Sales & Related | 0 (0.0%) | 0 (0.0%) |
| Office & Administration | 14 (35.9%) | 25 (64.1%) |
| Total (Category) | 14 (35.9%) | 25 (64.1%) |
| Total (Overall) | 100 (50.0%) | 100 (50.0%) |
Natural Resources, Construction and Maintenance Occupations
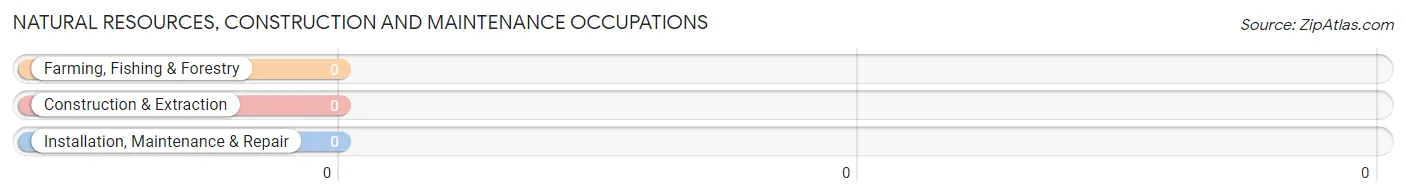
Natural Resources, Construction and Maintenance Occupations by Sex
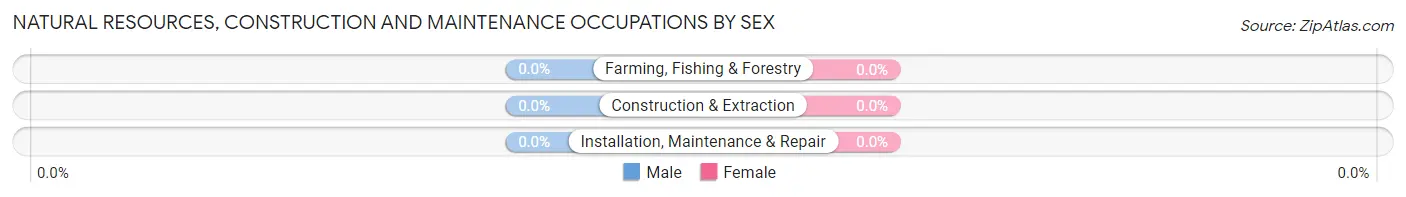
| Occupation | Male | Female |
| Farming, Fishing & Forestry | 0 (0.0%) | 0 (0.0%) |
| Construction & Extraction | 0 (0.0%) | 0 (0.0%) |
| Installation, Maintenance & Repair | 0 (0.0%) | 0 (0.0%) |
| Total (Category) | 0 (0.0%) | 0 (0.0%) |
| Total (Overall) | 100 (50.0%) | 100 (50.0%) |
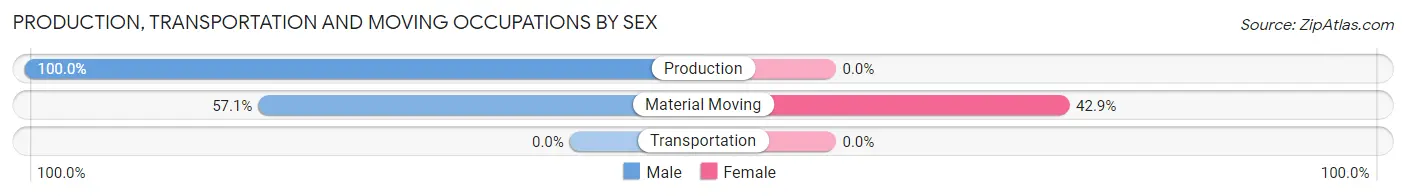
Production, Transportation and Moving Occupations
The most common Production, Transportation and Moving occupations in Fieldale are Material Moving (7 | 3.5%), and Production (3 | 1.5%).
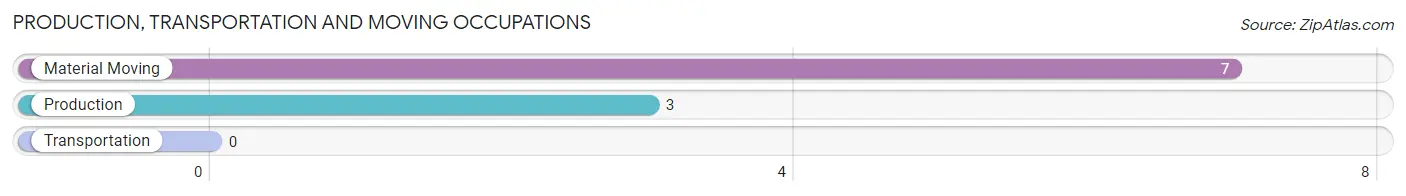
Production, Transportation and Moving Occupations by Sex
| Occupation | Male | Female |
| Production | 3 (100.0%) | 0 (0.0%) |
| Transportation | 0 (0.0%) | 0 (0.0%) |
| Material Moving | 4 (57.1%) | 3 (42.9%) |
| Total (Category) | 7 (70.0%) | 3 (30.0%) |
| Total (Overall) | 100 (50.0%) | 100 (50.0%) |
Employment Industries by Sex in Fieldale
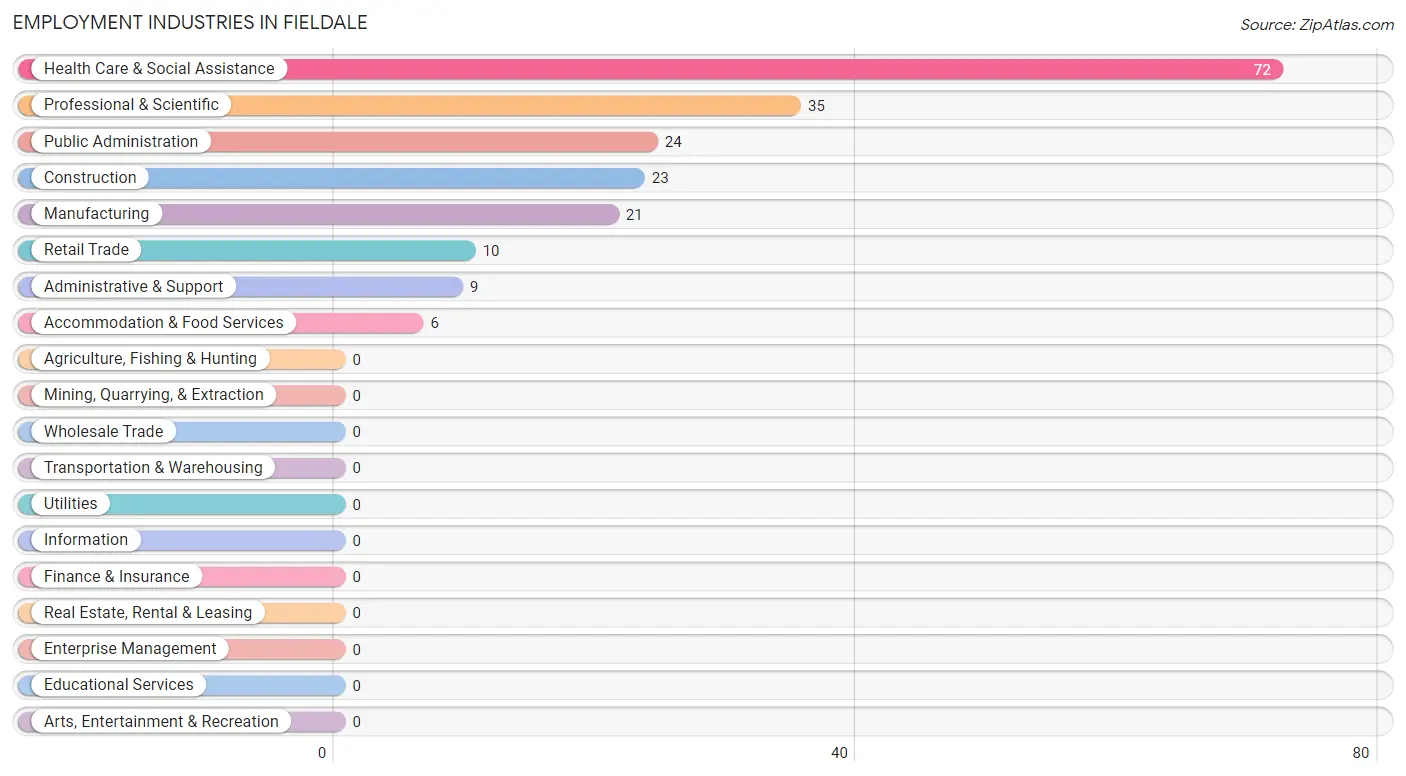
Employment Industries in Fieldale
The major employment industries in Fieldale include Health Care & Social Assistance (72 | 36.0%), Professional & Scientific (35 | 17.5%), Public Administration (24 | 12.0%), Construction (23 | 11.5%), and Manufacturing (21 | 10.5%).
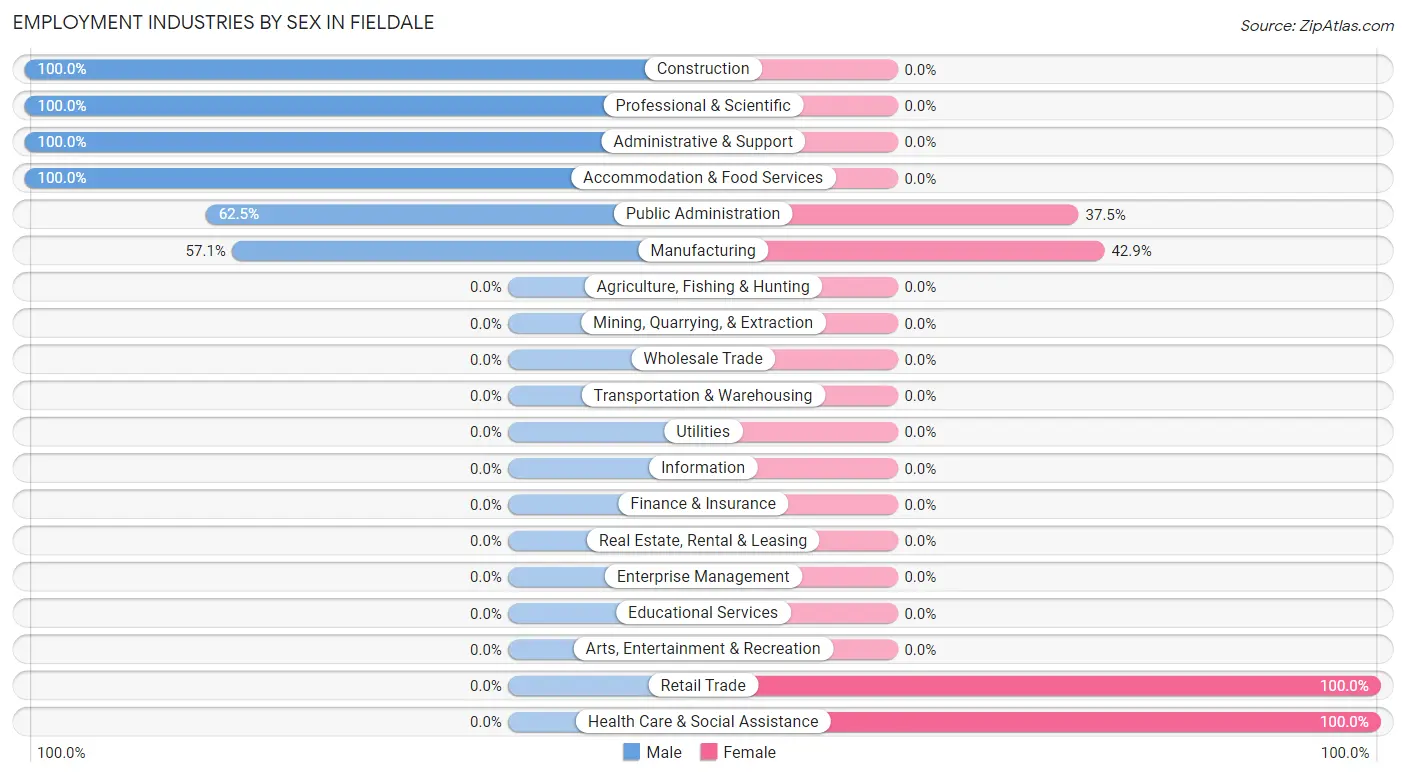
Employment Industries by Sex in Fieldale
The Fieldale industries that see more men than women are Construction (100.0%), Professional & Scientific (100.0%), and Administrative & Support (100.0%), whereas the industries that tend to have a higher number of women are Retail Trade (100.0%), Health Care & Social Assistance (100.0%), and Manufacturing (42.9%).
| Industry | Male | Female |
| Agriculture, Fishing & Hunting | 0 (0.0%) | 0 (0.0%) |
| Mining, Quarrying, & Extraction | 0 (0.0%) | 0 (0.0%) |
| Construction | 23 (100.0%) | 0 (0.0%) |
| Manufacturing | 12 (57.1%) | 9 (42.9%) |
| Wholesale Trade | 0 (0.0%) | 0 (0.0%) |
| Retail Trade | 0 (0.0%) | 10 (100.0%) |
| Transportation & Warehousing | 0 (0.0%) | 0 (0.0%) |
| Utilities | 0 (0.0%) | 0 (0.0%) |
| Information | 0 (0.0%) | 0 (0.0%) |
| Finance & Insurance | 0 (0.0%) | 0 (0.0%) |
| Real Estate, Rental & Leasing | 0 (0.0%) | 0 (0.0%) |
| Professional & Scientific | 35 (100.0%) | 0 (0.0%) |
| Enterprise Management | 0 (0.0%) | 0 (0.0%) |
| Administrative & Support | 9 (100.0%) | 0 (0.0%) |
| Educational Services | 0 (0.0%) | 0 (0.0%) |
| Health Care & Social Assistance | 0 (0.0%) | 72 (100.0%) |
| Arts, Entertainment & Recreation | 0 (0.0%) | 0 (0.0%) |
| Accommodation & Food Services | 6 (100.0%) | 0 (0.0%) |
| Public Administration | 15 (62.5%) | 9 (37.5%) |
| Total | 100 (50.0%) | 100 (50.0%) |
Education in Fieldale
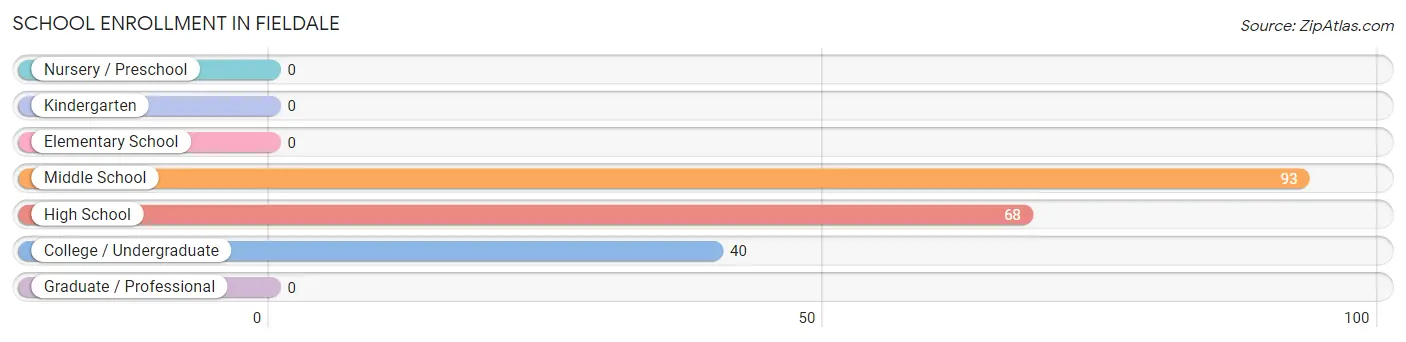
School Enrollment in Fieldale
The most common levels of schooling among the 201 students in Fieldale are middle school (93 | 46.3%), high school (68 | 33.8%), and college / undergraduate (40 | 19.9%).
| School Level | # Students | % Students |
| Nursery / Preschool | 0 | 0.0% |
| Kindergarten | 0 | 0.0% |
| Elementary School | 0 | 0.0% |
| Middle School | 93 | 46.3% |
| High School | 68 | 33.8% |
| College / Undergraduate | 40 | 19.9% |
| Graduate / Professional | 0 | 0.0% |
| Total | 201 | 100.0% |
School Enrollment by Age by Funding Source in Fieldale
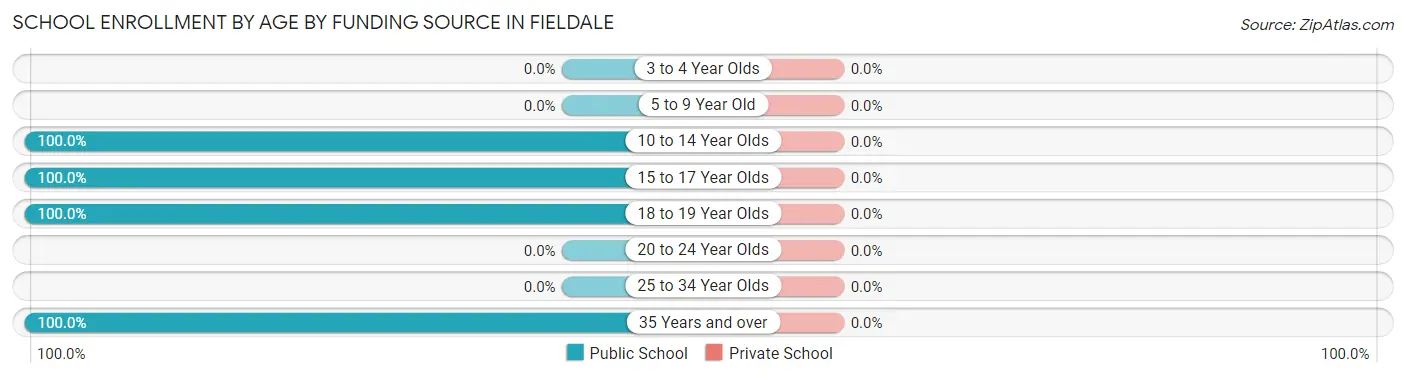
| Age Bracket | Public School | Private School |
| 3 to 4 Year Olds | 0 (0.0%) | 0 (0.0%) |
| 5 to 9 Year Old | 0 (0.0%) | 0 (0.0%) |
| 10 to 14 Year Olds | 93 (100.0%) | 0 (0.0%) |
| 15 to 17 Year Olds | 41 (100.0%) | 0 (0.0%) |
| 18 to 19 Year Olds | 61 (100.0%) | 0 (0.0%) |
| 20 to 24 Year Olds | 0 (0.0%) | 0 (0.0%) |
| 25 to 34 Year Olds | 0 (0.0%) | 0 (0.0%) |
| 35 Years and over | 6 (100.0%) | 0 (0.0%) |
| Total | 201 (100.0%) | 0 (0.0%) |
Educational Attainment by Field of Study in Fieldale
, and arts & humanities (14 | 100.0%) are the most common fields of study among 14 individuals in Fieldale who have obtained a bachelor's degree or higher.
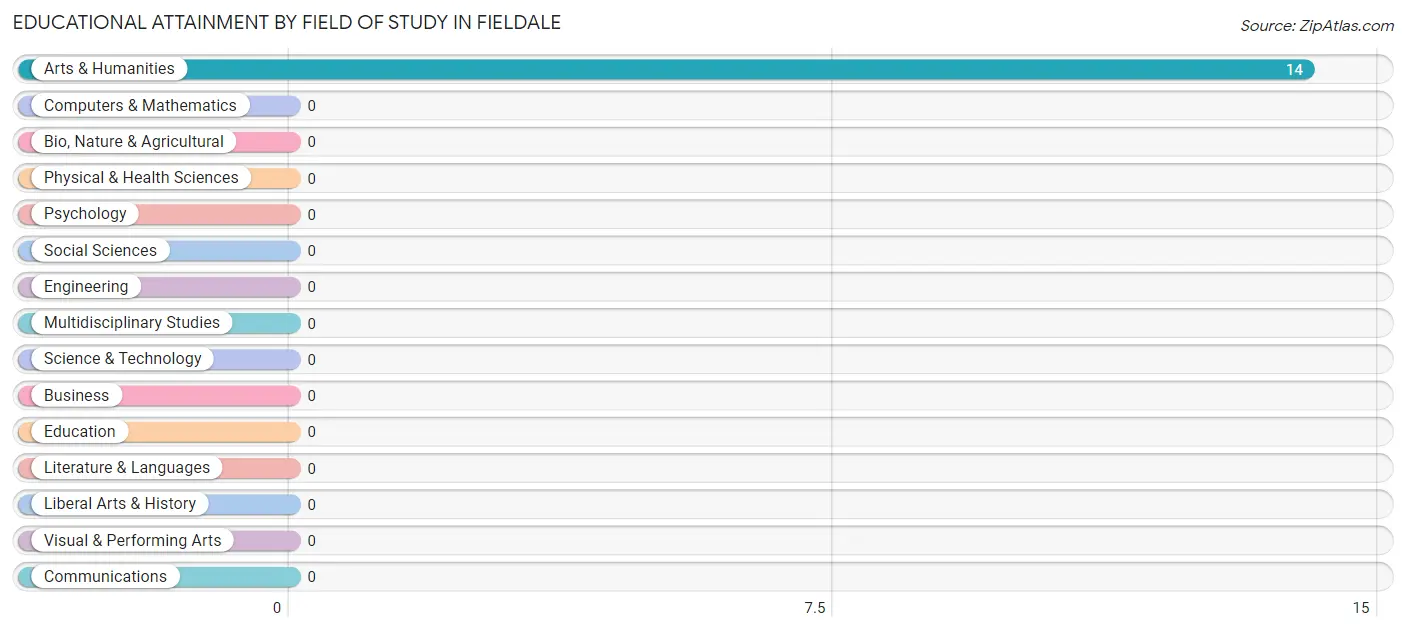
| Field of Study | # Graduates | % Graduates |
| Computers & Mathematics | 0 | 0.0% |
| Bio, Nature & Agricultural | 0 | 0.0% |
| Physical & Health Sciences | 0 | 0.0% |
| Psychology | 0 | 0.0% |
| Social Sciences | 0 | 0.0% |
| Engineering | 0 | 0.0% |
| Multidisciplinary Studies | 0 | 0.0% |
| Science & Technology | 0 | 0.0% |
| Business | 0 | 0.0% |
| Education | 0 | 0.0% |
| Literature & Languages | 0 | 0.0% |
| Liberal Arts & History | 0 | 0.0% |
| Visual & Performing Arts | 0 | 0.0% |
| Communications | 0 | 0.0% |
| Arts & Humanities | 14 | 100.0% |
| Total | 14 | 100.0% |
Transportation & Commute in Fieldale
Vehicle Availability by Sex in Fieldale
The most prevalent vehicle ownership categories in Fieldale are males with 2 vehicles (54, accounting for 54.0%) and females with 2 vehicles (37, making up 54.0%).
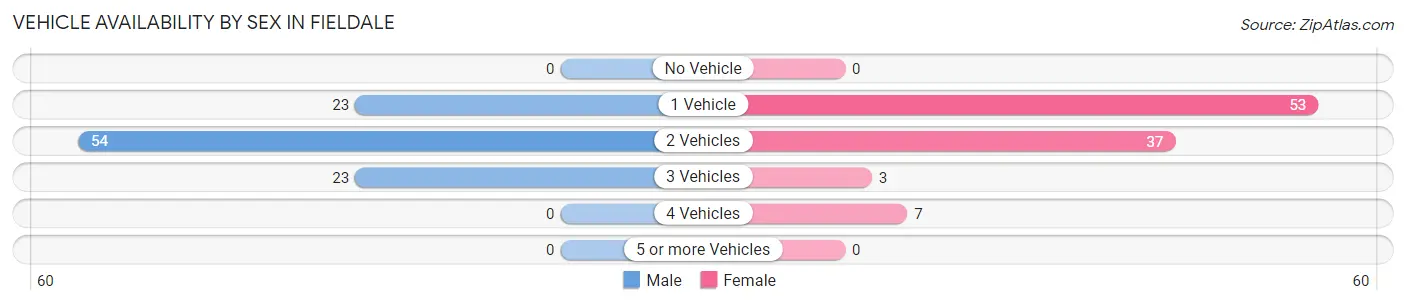
| Vehicles Available | Male | Female |
| No Vehicle | 0 (0.0%) | 0 (0.0%) |
| 1 Vehicle | 23 (23.0%) | 53 (53.0%) |
| 2 Vehicles | 54 (54.0%) | 37 (37.0%) |
| 3 Vehicles | 23 (23.0%) | 3 (3.0%) |
| 4 Vehicles | 0 (0.0%) | 7 (7.0%) |
| 5 or more Vehicles | 0 (0.0%) | 0 (0.0%) |
| Total | 100 (100.0%) | 100 (100.0%) |
Commute Time in Fieldale
The most frequently occuring commute durations in Fieldale are 15 to 19 minutes (80 commuters, 41.2%), 10 to 14 minutes (63 commuters, 32.5%), and 20 to 24 minutes (15 commuters, 7.7%).
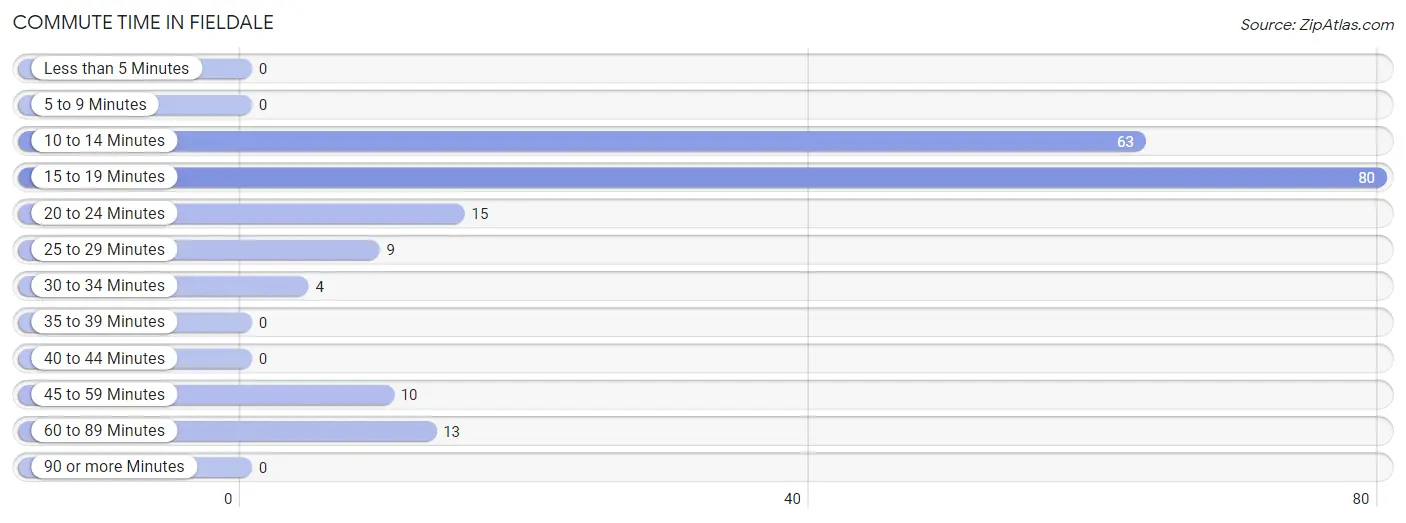
| Commute Time | # Commuters | % Commuters |
| Less than 5 Minutes | 0 | 0.0% |
| 5 to 9 Minutes | 0 | 0.0% |
| 10 to 14 Minutes | 63 | 32.5% |
| 15 to 19 Minutes | 80 | 41.2% |
| 20 to 24 Minutes | 15 | 7.7% |
| 25 to 29 Minutes | 9 | 4.6% |
| 30 to 34 Minutes | 4 | 2.1% |
| 35 to 39 Minutes | 0 | 0.0% |
| 40 to 44 Minutes | 0 | 0.0% |
| 45 to 59 Minutes | 10 | 5.1% |
| 60 to 89 Minutes | 13 | 6.7% |
| 90 or more Minutes | 0 | 0.0% |
Commute Time by Sex in Fieldale
The most common commute times in Fieldale are 15 to 19 minutes (72 commuters, 72.0%) for males and 10 to 14 minutes (54 commuters, 57.5%) for females.
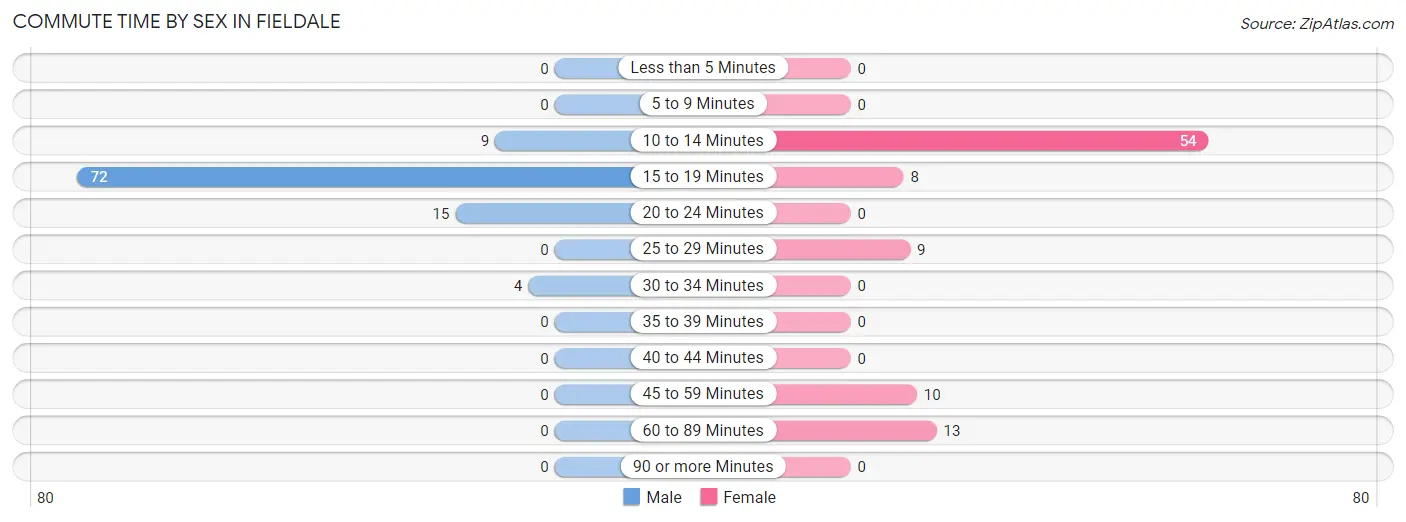
| Commute Time | Male | Female |
| Less than 5 Minutes | 0 (0.0%) | 0 (0.0%) |
| 5 to 9 Minutes | 0 (0.0%) | 0 (0.0%) |
| 10 to 14 Minutes | 9 (9.0%) | 54 (57.5%) |
| 15 to 19 Minutes | 72 (72.0%) | 8 (8.5%) |
| 20 to 24 Minutes | 15 (15.0%) | 0 (0.0%) |
| 25 to 29 Minutes | 0 (0.0%) | 9 (9.6%) |
| 30 to 34 Minutes | 4 (4.0%) | 0 (0.0%) |
| 35 to 39 Minutes | 0 (0.0%) | 0 (0.0%) |
| 40 to 44 Minutes | 0 (0.0%) | 0 (0.0%) |
| 45 to 59 Minutes | 0 (0.0%) | 10 (10.6%) |
| 60 to 89 Minutes | 0 (0.0%) | 13 (13.8%) |
| 90 or more Minutes | 0 (0.0%) | 0 (0.0%) |
Time of Departure to Work by Sex in Fieldale
The most frequent times of departure to work in Fieldale are 6:30 AM to 6:59 AM (62, 62.0%) for males and 8:00 AM to 8:29 AM (47, 50.0%) for females.
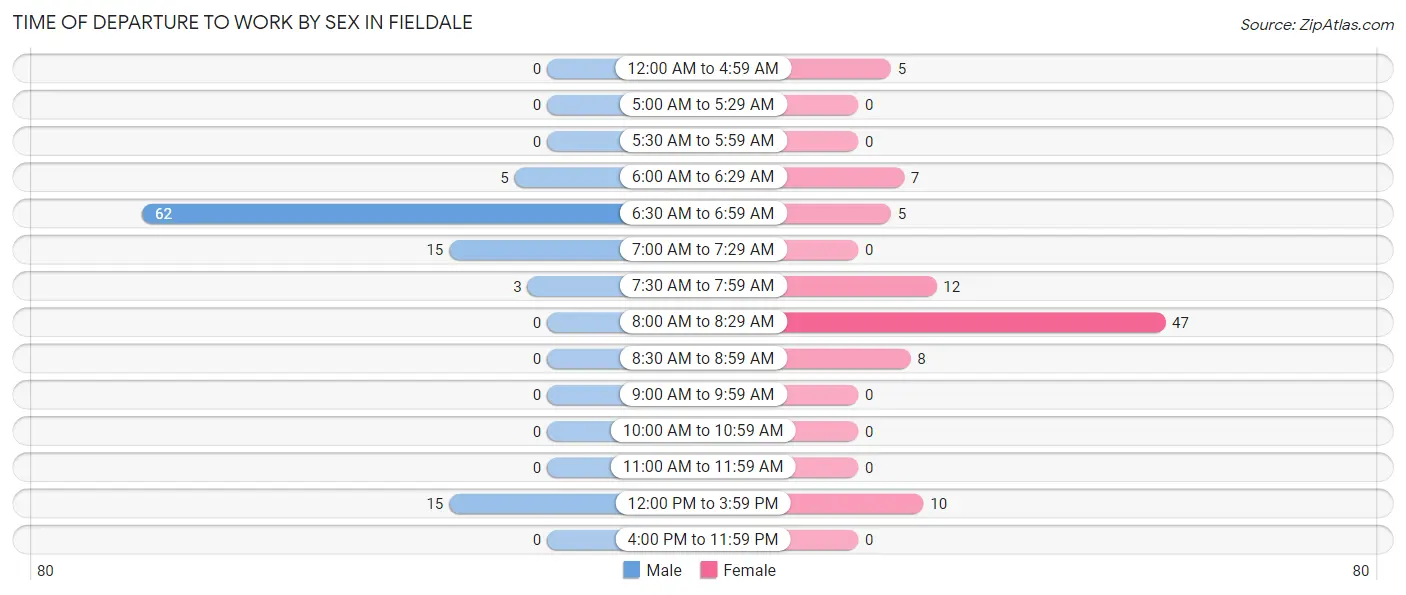
| Time of Departure | Male | Female |
| 12:00 AM to 4:59 AM | 0 (0.0%) | 5 (5.3%) |
| 5:00 AM to 5:29 AM | 0 (0.0%) | 0 (0.0%) |
| 5:30 AM to 5:59 AM | 0 (0.0%) | 0 (0.0%) |
| 6:00 AM to 6:29 AM | 5 (5.0%) | 7 (7.4%) |
| 6:30 AM to 6:59 AM | 62 (62.0%) | 5 (5.3%) |
| 7:00 AM to 7:29 AM | 15 (15.0%) | 0 (0.0%) |
| 7:30 AM to 7:59 AM | 3 (3.0%) | 12 (12.8%) |
| 8:00 AM to 8:29 AM | 0 (0.0%) | 47 (50.0%) |
| 8:30 AM to 8:59 AM | 0 (0.0%) | 8 (8.5%) |
| 9:00 AM to 9:59 AM | 0 (0.0%) | 0 (0.0%) |
| 10:00 AM to 10:59 AM | 0 (0.0%) | 0 (0.0%) |
| 11:00 AM to 11:59 AM | 0 (0.0%) | 0 (0.0%) |
| 12:00 PM to 3:59 PM | 15 (15.0%) | 10 (10.6%) |
| 4:00 PM to 11:59 PM | 0 (0.0%) | 0 (0.0%) |
| Total | 100 (100.0%) | 94 (100.0%) |
Housing Occupancy in Fieldale
Occupancy by Ownership in Fieldale
Of the total 285 dwellings in Fieldale, owner-occupied units account for 220 (77.2%), while renter-occupied units make up 65 (22.8%).
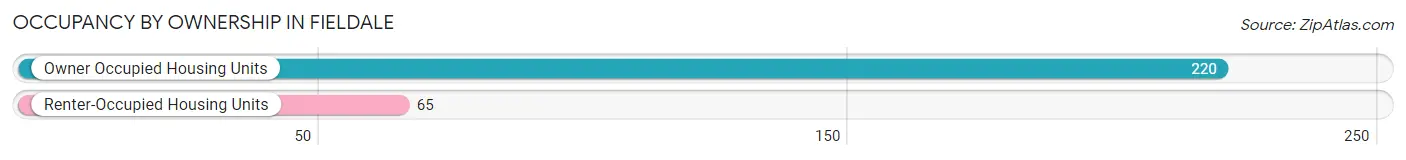
| Occupancy | # Housing Units | % Housing Units |
| Owner Occupied Housing Units | 220 | 77.2% |
| Renter-Occupied Housing Units | 65 | 22.8% |
| Total Occupied Housing Units | 285 | 100.0% |
Occupancy by Household Size in Fieldale
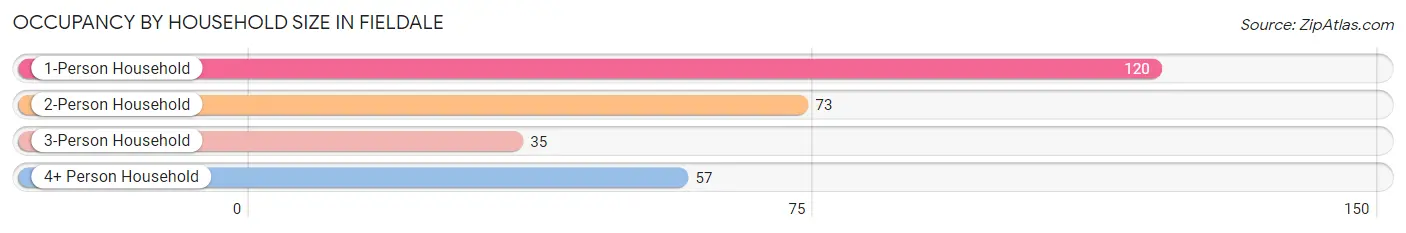
| Household Size | # Housing Units | % Housing Units |
| 1-Person Household | 120 | 42.1% |
| 2-Person Household | 73 | 25.6% |
| 3-Person Household | 35 | 12.3% |
| 4+ Person Household | 57 | 20.0% |
| Total Housing Units | 285 | 100.0% |
Occupancy by Ownership by Household Size in Fieldale
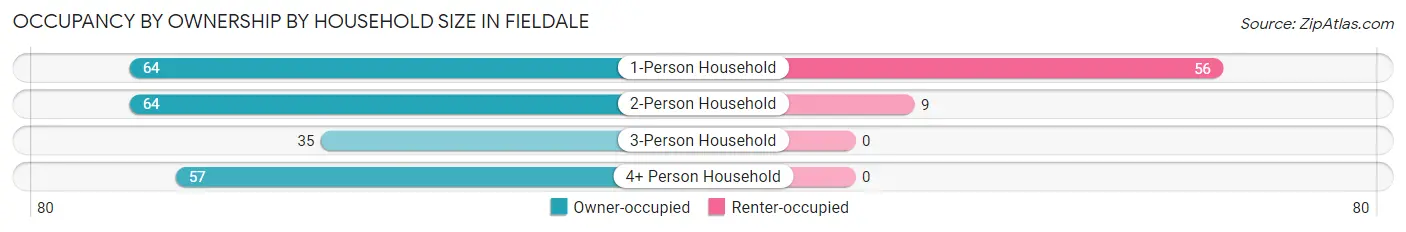
| Household Size | Owner-occupied | Renter-occupied |
| 1-Person Household | 64 (53.3%) | 56 (46.7%) |
| 2-Person Household | 64 (87.7%) | 9 (12.3%) |
| 3-Person Household | 35 (100.0%) | 0 (0.0%) |
| 4+ Person Household | 57 (100.0%) | 0 (0.0%) |
| Total Housing Units | 220 (77.2%) | 65 (22.8%) |
Occupancy by Educational Attainment in Fieldale
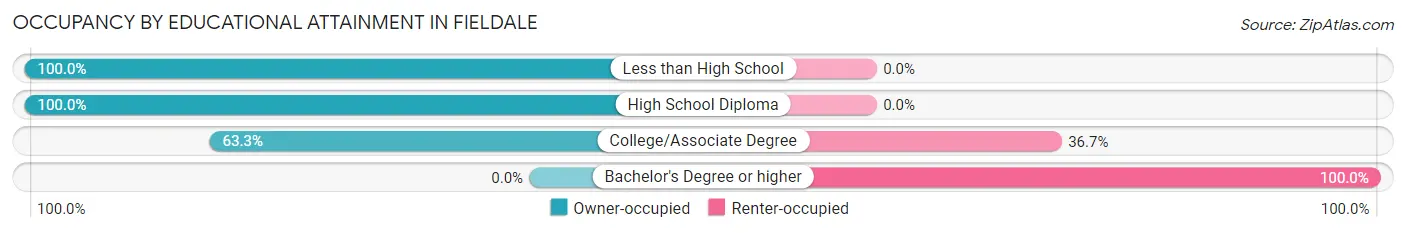
| Household Size | Owner-occupied | Renter-occupied |
| Less than High School | 76 (100.0%) | 0 (0.0%) |
| High School Diploma | 56 (100.0%) | 0 (0.0%) |
| College/Associate Degree | 88 (63.3%) | 51 (36.7%) |
| Bachelor's Degree or higher | 0 (0.0%) | 14 (100.0%) |
Occupancy by Age of Householder in Fieldale
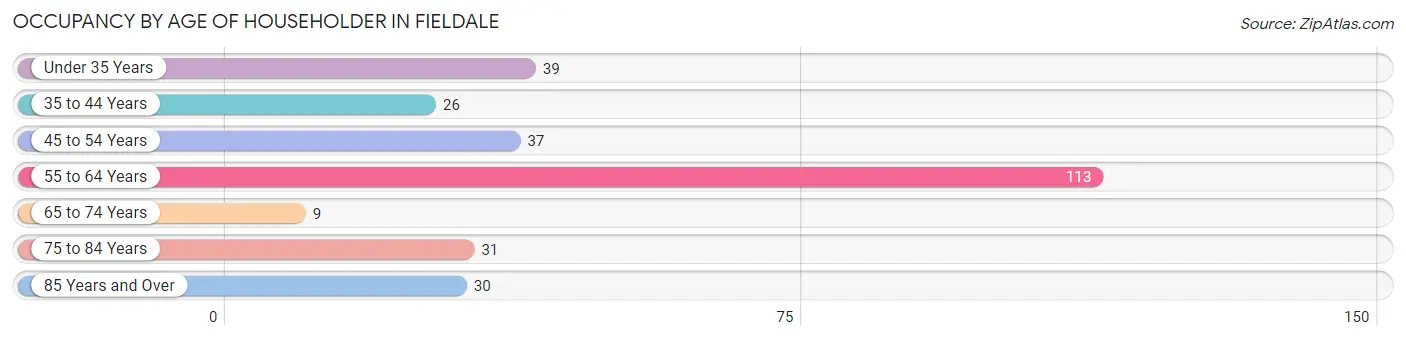
| Age Bracket | # Households | % Households |
| Under 35 Years | 39 | 13.7% |
| 35 to 44 Years | 26 | 9.1% |
| 45 to 54 Years | 37 | 13.0% |
| 55 to 64 Years | 113 | 39.7% |
| 65 to 74 Years | 9 | 3.2% |
| 75 to 84 Years | 31 | 10.9% |
| 85 Years and Over | 30 | 10.5% |
| Total | 285 | 100.0% |
Housing Finances in Fieldale
Median Income by Occupancy in Fieldale
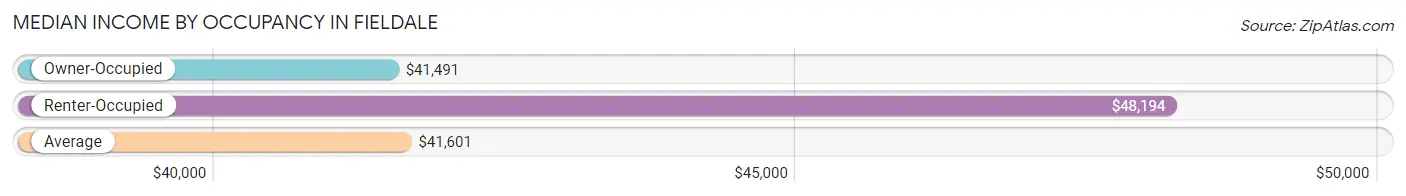
| Occupancy Type | # Households | Median Income |
| Owner-Occupied | 220 (77.2%) | $41,491 |
| Renter-Occupied | 65 (22.8%) | $48,194 |
| Average | 285 (100.0%) | $41,601 |
Occupancy by Householder Income Bracket in Fieldale
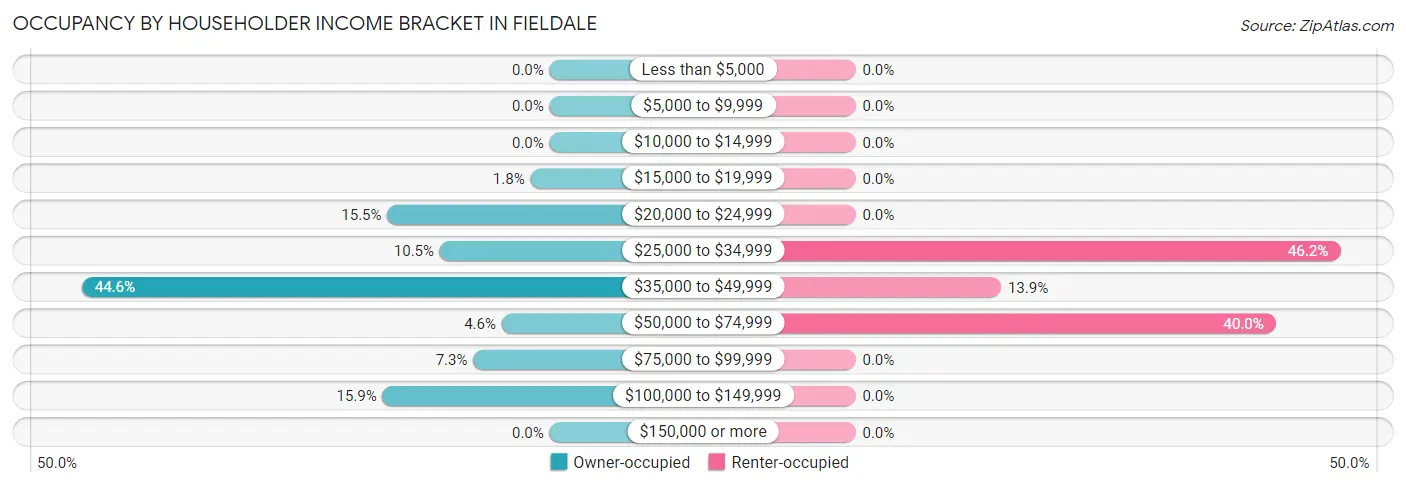
| Income Bracket | Owner-occupied | Renter-occupied |
| Less than $5,000 | 0 (0.0%) | 0 (0.0%) |
| $5,000 to $9,999 | 0 (0.0%) | 0 (0.0%) |
| $10,000 to $14,999 | 0 (0.0%) | 0 (0.0%) |
| $15,000 to $19,999 | 4 (1.8%) | 0 (0.0%) |
| $20,000 to $24,999 | 34 (15.4%) | 0 (0.0%) |
| $25,000 to $34,999 | 23 (10.4%) | 30 (46.2%) |
| $35,000 to $49,999 | 98 (44.6%) | 9 (13.9%) |
| $50,000 to $74,999 | 10 (4.5%) | 26 (40.0%) |
| $75,000 to $99,999 | 16 (7.3%) | 0 (0.0%) |
| $100,000 to $149,999 | 35 (15.9%) | 0 (0.0%) |
| $150,000 or more | 0 (0.0%) | 0 (0.0%) |
| Total | 220 (100.0%) | 65 (100.0%) |
Monthly Housing Cost Tiers in Fieldale
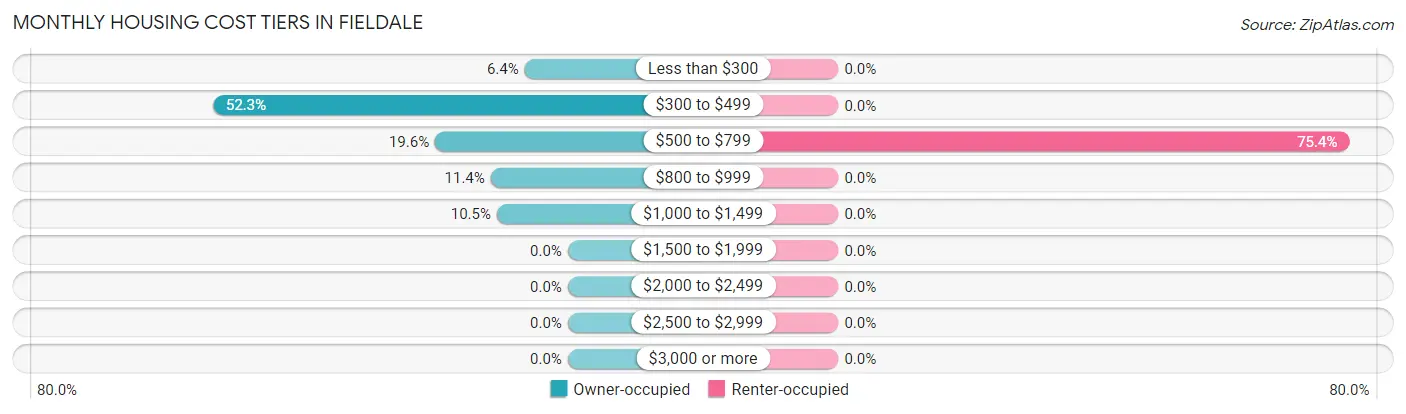
| Monthly Cost | Owner-occupied | Renter-occupied |
| Less than $300 | 14 (6.4%) | 0 (0.0%) |
| $300 to $499 | 115 (52.3%) | 0 (0.0%) |
| $500 to $799 | 43 (19.6%) | 49 (75.4%) |
| $800 to $999 | 25 (11.4%) | 0 (0.0%) |
| $1,000 to $1,499 | 23 (10.4%) | 0 (0.0%) |
| $1,500 to $1,999 | 0 (0.0%) | 0 (0.0%) |
| $2,000 to $2,499 | 0 (0.0%) | 0 (0.0%) |
| $2,500 to $2,999 | 0 (0.0%) | 0 (0.0%) |
| $3,000 or more | 0 (0.0%) | 0 (0.0%) |
| Total | 220 (100.0%) | 65 (100.0%) |
Physical Housing Characteristics in Fieldale
Housing Structures in Fieldale
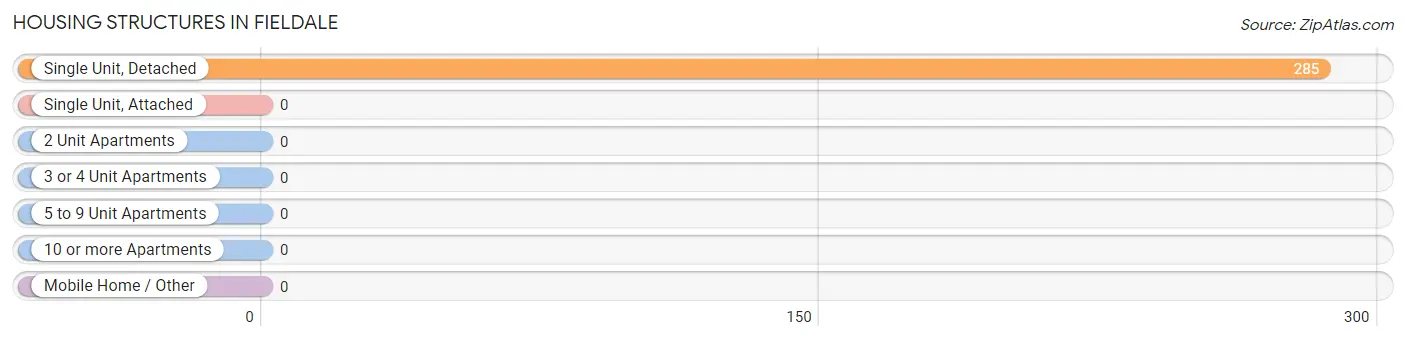
| Structure Type | # Housing Units | % Housing Units |
| Single Unit, Detached | 285 | 100.0% |
| Single Unit, Attached | 0 | 0.0% |
| 2 Unit Apartments | 0 | 0.0% |
| 3 or 4 Unit Apartments | 0 | 0.0% |
| 5 to 9 Unit Apartments | 0 | 0.0% |
| 10 or more Apartments | 0 | 0.0% |
| Mobile Home / Other | 0 | 0.0% |
| Total | 285 | 100.0% |
Housing Structures by Occupancy in Fieldale
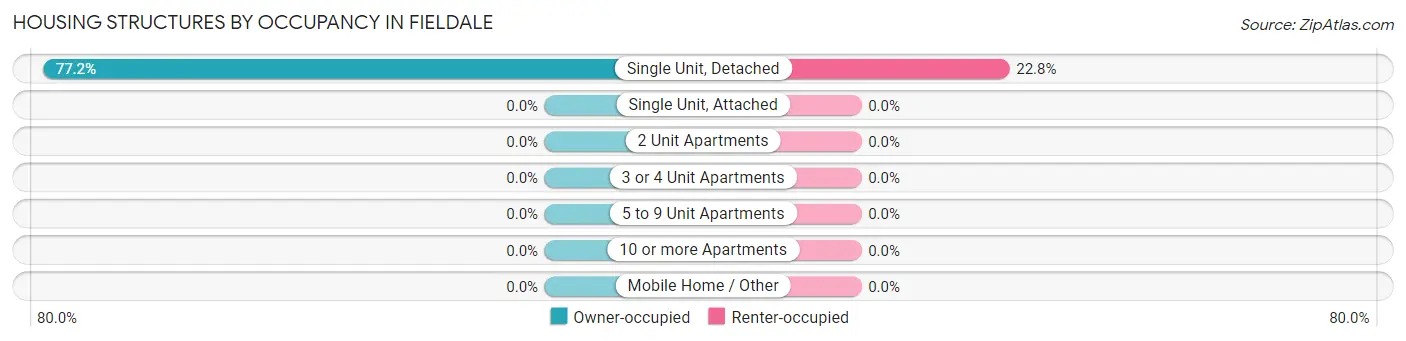
| Structure Type | Owner-occupied | Renter-occupied |
| Single Unit, Detached | 220 (77.2%) | 65 (22.8%) |
| Single Unit, Attached | 0 (0.0%) | 0 (0.0%) |
| 2 Unit Apartments | 0 (0.0%) | 0 (0.0%) |
| 3 or 4 Unit Apartments | 0 (0.0%) | 0 (0.0%) |
| 5 to 9 Unit Apartments | 0 (0.0%) | 0 (0.0%) |
| 10 or more Apartments | 0 (0.0%) | 0 (0.0%) |
| Mobile Home / Other | 0 (0.0%) | 0 (0.0%) |
| Total | 220 (77.2%) | 65 (22.8%) |
Housing Structures by Number of Rooms in Fieldale
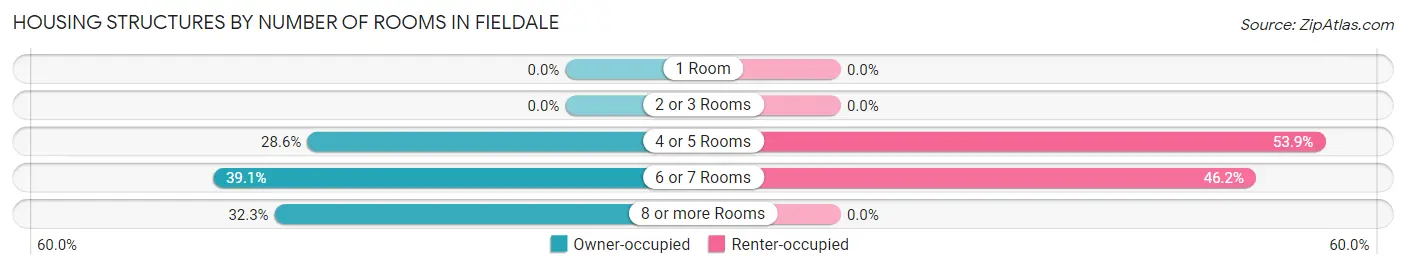
| Number of Rooms | Owner-occupied | Renter-occupied |
| 1 Room | 0 (0.0%) | 0 (0.0%) |
| 2 or 3 Rooms | 0 (0.0%) | 0 (0.0%) |
| 4 or 5 Rooms | 63 (28.6%) | 35 (53.8%) |
| 6 or 7 Rooms | 86 (39.1%) | 30 (46.2%) |
| 8 or more Rooms | 71 (32.3%) | 0 (0.0%) |
| Total | 220 (100.0%) | 65 (100.0%) |
Housing Structure by Heating Type in Fieldale
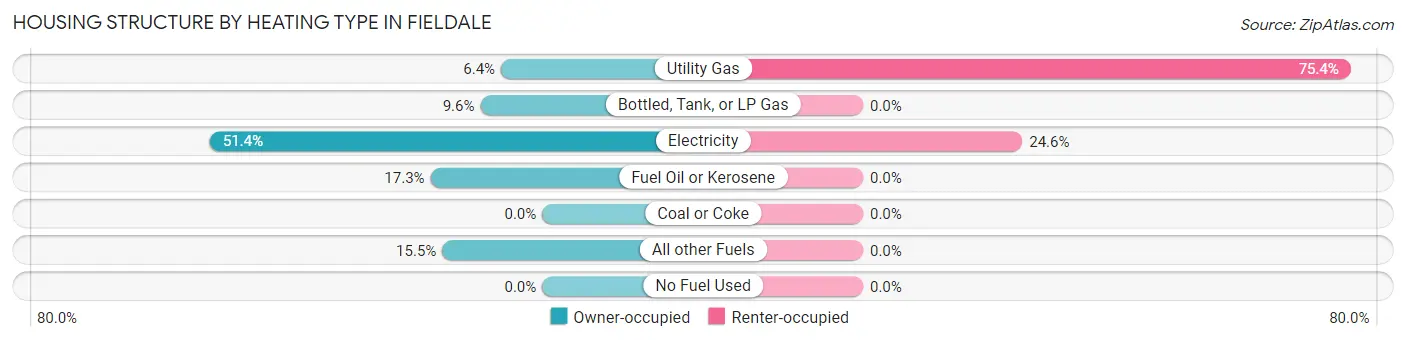
| Heating Type | Owner-occupied | Renter-occupied |
| Utility Gas | 14 (6.4%) | 49 (75.4%) |
| Bottled, Tank, or LP Gas | 21 (9.6%) | 0 (0.0%) |
| Electricity | 113 (51.4%) | 16 (24.6%) |
| Fuel Oil or Kerosene | 38 (17.3%) | 0 (0.0%) |
| Coal or Coke | 0 (0.0%) | 0 (0.0%) |
| All other Fuels | 34 (15.4%) | 0 (0.0%) |
| No Fuel Used | 0 (0.0%) | 0 (0.0%) |
| Total | 220 (100.0%) | 65 (100.0%) |
Household Vehicle Usage in Fieldale
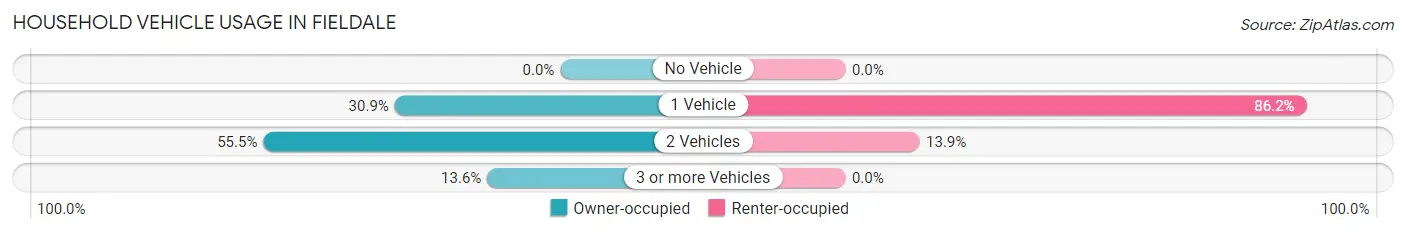
| Vehicles per Household | Owner-occupied | Renter-occupied |
| No Vehicle | 0 (0.0%) | 0 (0.0%) |
| 1 Vehicle | 68 (30.9%) | 56 (86.2%) |
| 2 Vehicles | 122 (55.4%) | 9 (13.9%) |
| 3 or more Vehicles | 30 (13.6%) | 0 (0.0%) |
| Total | 220 (100.0%) | 65 (100.0%) |
Real Estate & Mortgages in Fieldale
Real Estate and Mortgage Overview in Fieldale
| Characteristic | Without Mortgage | With Mortgage |
| Housing Units | 135 | 85 |
| Median Property Value | $54,700 | $96,500 |
| Median Household Income | $42,434 | $0 |
| Monthly Housing Costs | $426 | $0 |
| Real Estate Taxes | $428 | $4 |
Property Value by Mortgage Status in Fieldale
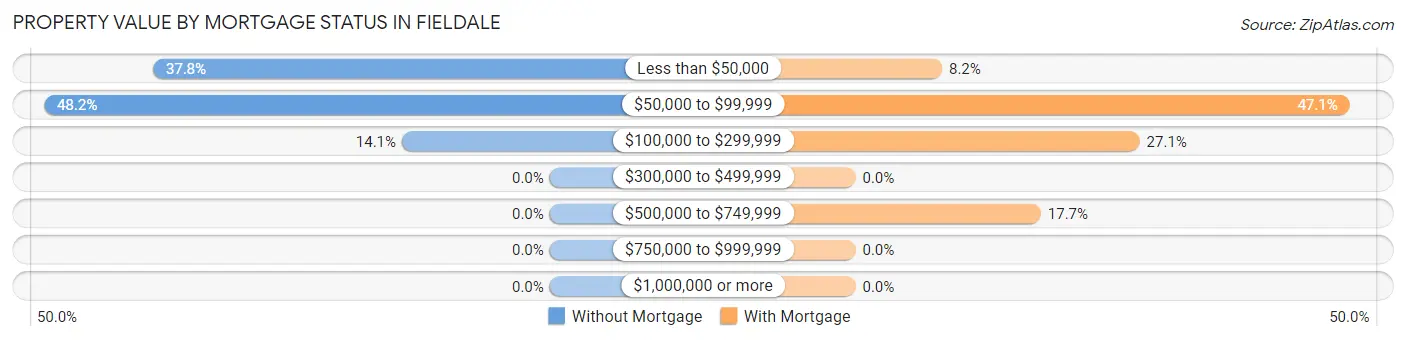
| Property Value | Without Mortgage | With Mortgage |
| Less than $50,000 | 51 (37.8%) | 7 (8.2%) |
| $50,000 to $99,999 | 65 (48.1%) | 40 (47.1%) |
| $100,000 to $299,999 | 19 (14.1%) | 23 (27.1%) |
| $300,000 to $499,999 | 0 (0.0%) | 0 (0.0%) |
| $500,000 to $749,999 | 0 (0.0%) | 15 (17.6%) |
| $750,000 to $999,999 | 0 (0.0%) | 0 (0.0%) |
| $1,000,000 or more | 0 (0.0%) | 0 (0.0%) |
| Total | 135 (100.0%) | 85 (100.0%) |
Household Income by Mortgage Status in Fieldale
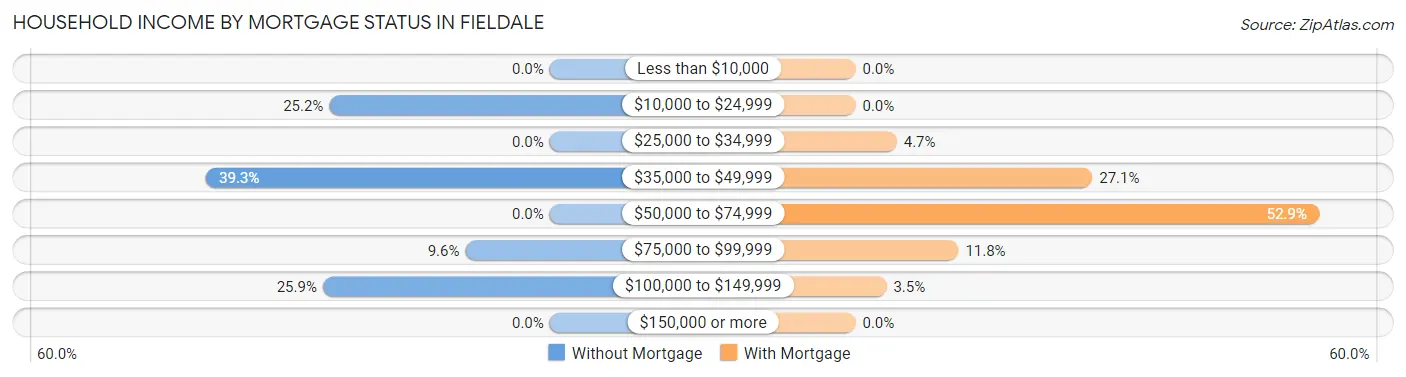
| Household Income | Without Mortgage | With Mortgage |
| Less than $10,000 | 0 (0.0%) | 0 (0.0%) |
| $10,000 to $24,999 | 34 (25.2%) | 0 (0.0%) |
| $25,000 to $34,999 | 0 (0.0%) | 4 (4.7%) |
| $35,000 to $49,999 | 53 (39.3%) | 23 (27.1%) |
| $50,000 to $74,999 | 0 (0.0%) | 45 (52.9%) |
| $75,000 to $99,999 | 13 (9.6%) | 10 (11.8%) |
| $100,000 to $149,999 | 35 (25.9%) | 3 (3.5%) |
| $150,000 or more | 0 (0.0%) | 0 (0.0%) |
| Total | 135 (100.0%) | 85 (100.0%) |
Property Value to Household Income Ratio in Fieldale
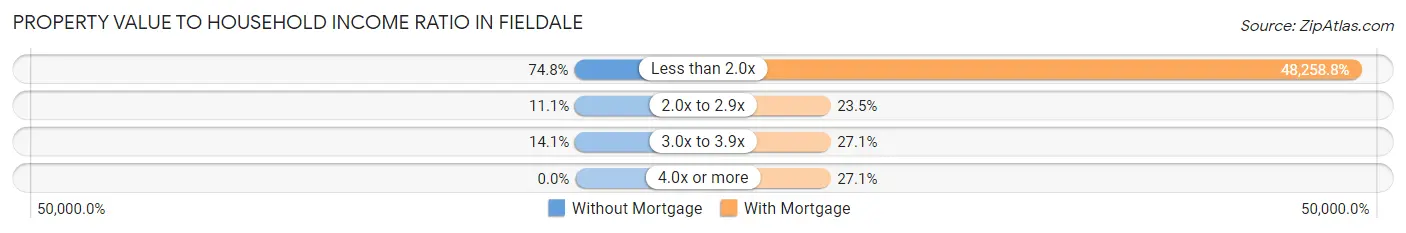
| Value-to-Income Ratio | Without Mortgage | With Mortgage |
| Less than 2.0x | 101 (74.8%) | 41,020 (48,258.8%) |
| 2.0x to 2.9x | 15 (11.1%) | 20 (23.5%) |
| 3.0x to 3.9x | 19 (14.1%) | 23 (27.1%) |
| 4.0x or more | 0 (0.0%) | 23 (27.1%) |
| Total | 135 (100.0%) | 85 (100.0%) |
Real Estate Taxes by Mortgage Status in Fieldale
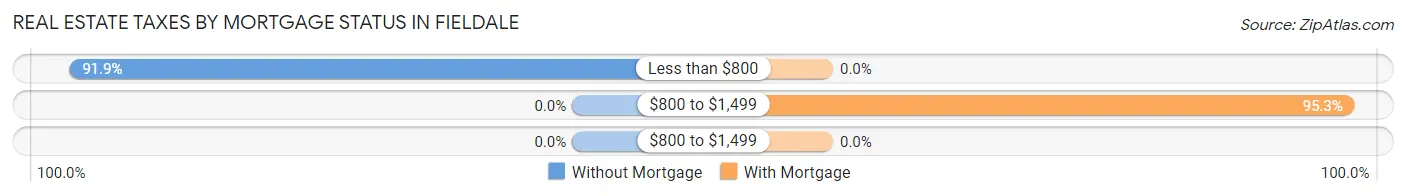
| Property Taxes | Without Mortgage | With Mortgage |
| Less than $800 | 124 (91.8%) | 0 (0.0%) |
| $800 to $1,499 | 0 (0.0%) | 81 (95.3%) |
| $800 to $1,499 | 0 (0.0%) | 0 (0.0%) |
| Total | 135 (100.0%) | 85 (100.0%) |
Health & Disability in Fieldale
Health Insurance Coverage by Age in Fieldale
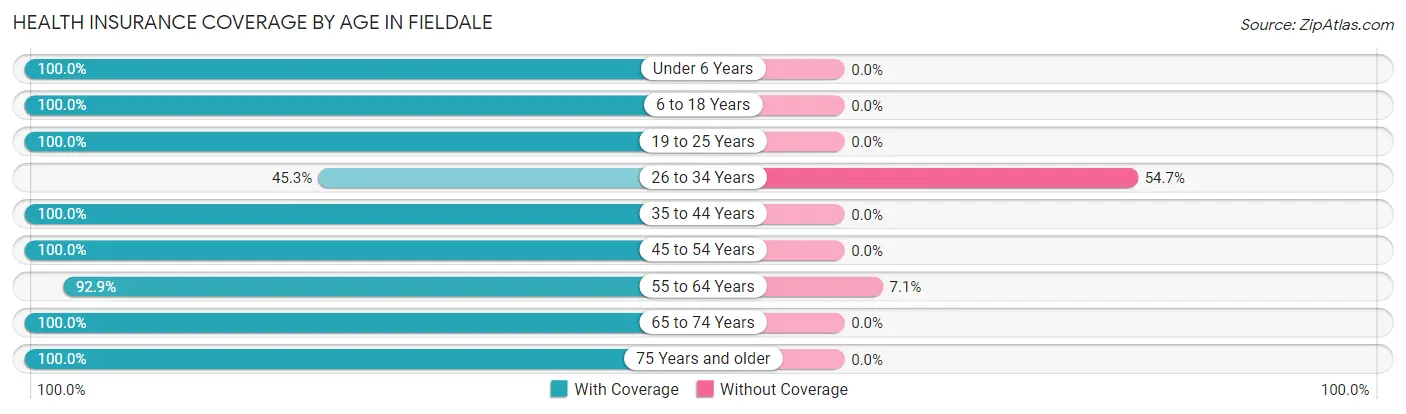
| Age Bracket | With Coverage | Without Coverage |
| Under 6 Years | 58 (100.0%) | 0 (0.0%) |
| 6 to 18 Years | 195 (100.0%) | 0 (0.0%) |
| 19 to 25 Years | 10 (100.0%) | 0 (0.0%) |
| 26 to 34 Years | 72 (45.3%) | 87 (54.7%) |
| 35 to 44 Years | 32 (100.0%) | 0 (0.0%) |
| 45 to 54 Years | 88 (100.0%) | 0 (0.0%) |
| 55 to 64 Years | 130 (92.9%) | 10 (7.1%) |
| 65 to 74 Years | 45 (100.0%) | 0 (0.0%) |
| 75 Years and older | 75 (100.0%) | 0 (0.0%) |
| Total | 705 (87.9%) | 97 (12.1%) |
Health Insurance Coverage by Citizenship Status in Fieldale
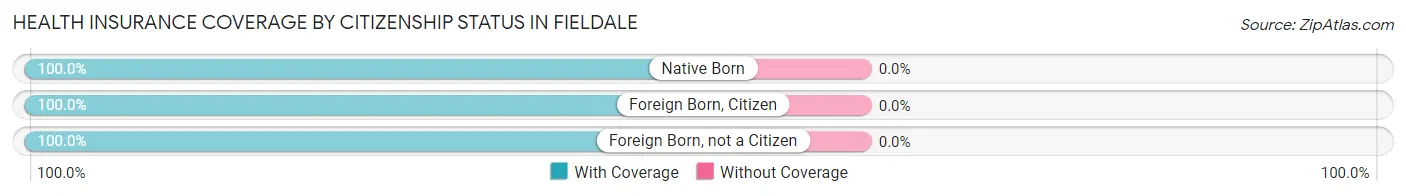
| Citizenship Status | With Coverage | Without Coverage |
| Native Born | 58 (100.0%) | 0 (0.0%) |
| Foreign Born, Citizen | 195 (100.0%) | 0 (0.0%) |
| Foreign Born, not a Citizen | 10 (100.0%) | 0 (0.0%) |
Health Insurance Coverage by Household Income in Fieldale
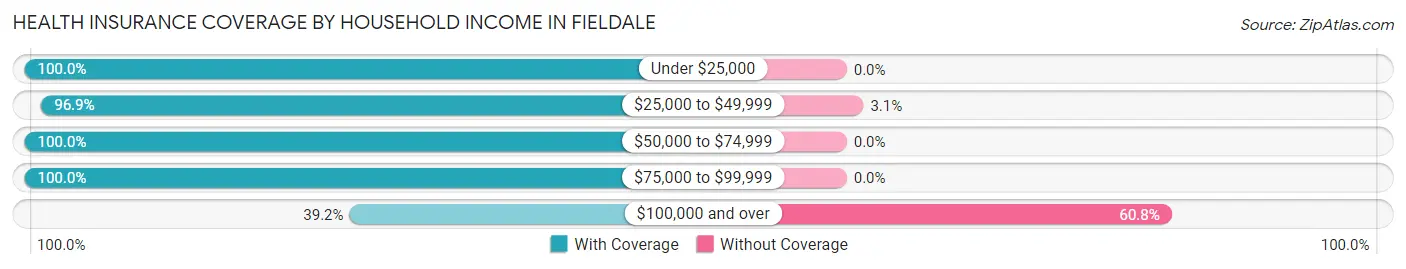
| Household Income | With Coverage | Without Coverage |
| Under $25,000 | 268 (100.0%) | 0 (0.0%) |
| $25,000 to $49,999 | 309 (96.9%) | 10 (3.1%) |
| $50,000 to $74,999 | 41 (100.0%) | 0 (0.0%) |
| $75,000 to $99,999 | 31 (100.0%) | 0 (0.0%) |
| $100,000 and over | 56 (39.2%) | 87 (60.8%) |
Public vs Private Health Insurance Coverage by Age in Fieldale
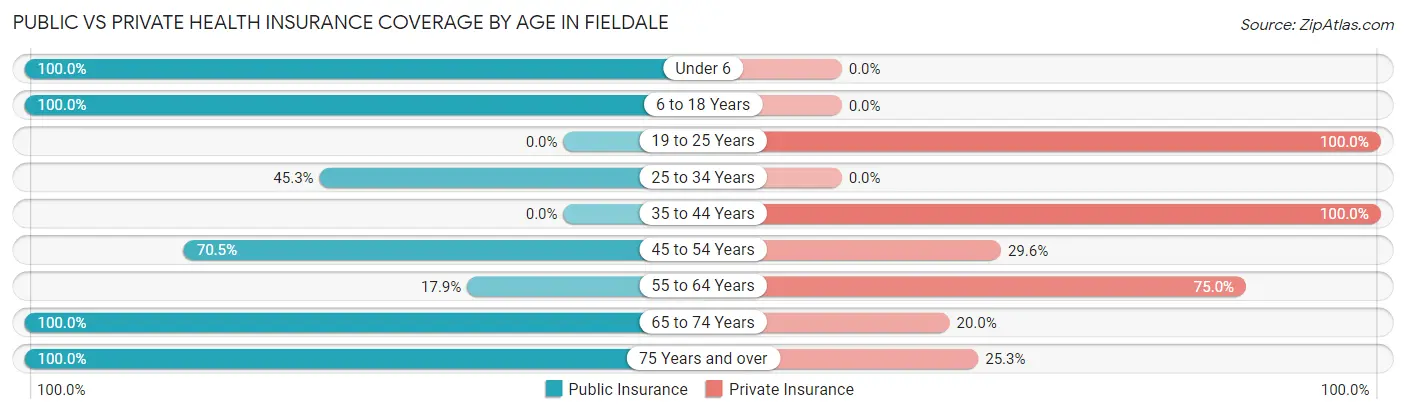
| Age Bracket | Public Insurance | Private Insurance |
| Under 6 | 58 (100.0%) | 0 (0.0%) |
| 6 to 18 Years | 195 (100.0%) | 0 (0.0%) |
| 19 to 25 Years | 0 (0.0%) | 10 (100.0%) |
| 25 to 34 Years | 72 (45.3%) | 0 (0.0%) |
| 35 to 44 Years | 0 (0.0%) | 32 (100.0%) |
| 45 to 54 Years | 62 (70.5%) | 26 (29.5%) |
| 55 to 64 Years | 25 (17.9%) | 105 (75.0%) |
| 65 to 74 Years | 45 (100.0%) | 9 (20.0%) |
| 75 Years and over | 75 (100.0%) | 19 (25.3%) |
| Total | 532 (66.3%) | 201 (25.1%) |
Disability Status by Sex by Age in Fieldale
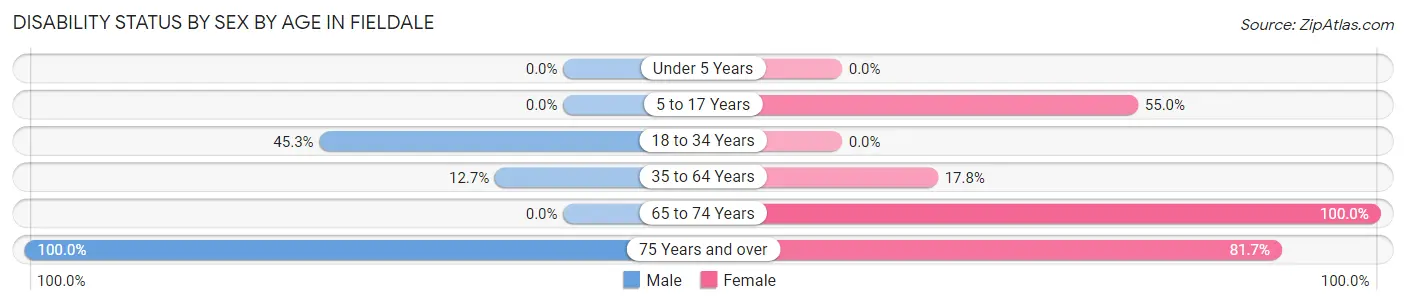
| Age Bracket | Male | Female |
| Under 5 Years | 0 (0.0%) | 0 (0.0%) |
| 5 to 17 Years | 0 (0.0%) | 50 (54.9%) |
| 18 to 34 Years | 72 (45.3%) | 0 (0.0%) |
| 35 to 64 Years | 18 (12.7%) | 21 (17.8%) |
| 65 to 74 Years | 0 (0.0%) | 9 (100.0%) |
| 75 Years and over | 15 (100.0%) | 49 (81.7%) |
Disability Class by Sex by Age in Fieldale
Disability Class: Hearing Difficulty
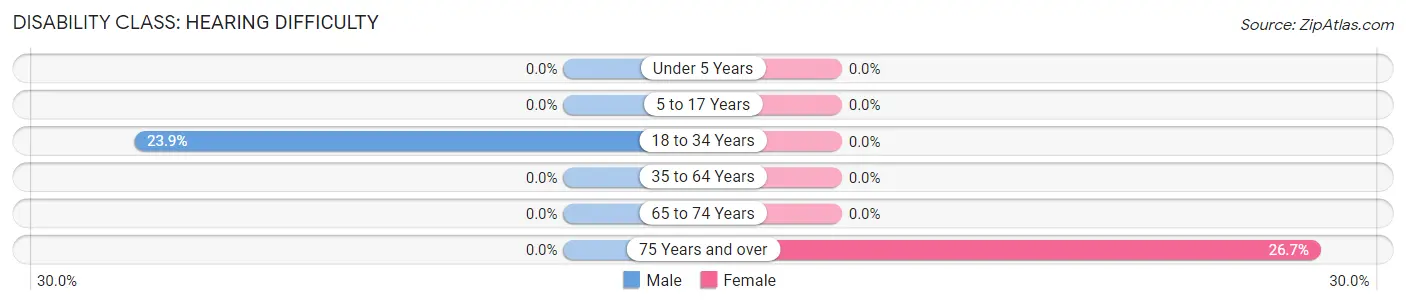
| Age Bracket | Male | Female |
| Under 5 Years | 0 (0.0%) | 0 (0.0%) |
| 5 to 17 Years | 0 (0.0%) | 0 (0.0%) |
| 18 to 34 Years | 38 (23.9%) | 0 (0.0%) |
| 35 to 64 Years | 0 (0.0%) | 0 (0.0%) |
| 65 to 74 Years | 0 (0.0%) | 0 (0.0%) |
| 75 Years and over | 0 (0.0%) | 16 (26.7%) |
Disability Class: Vision Difficulty
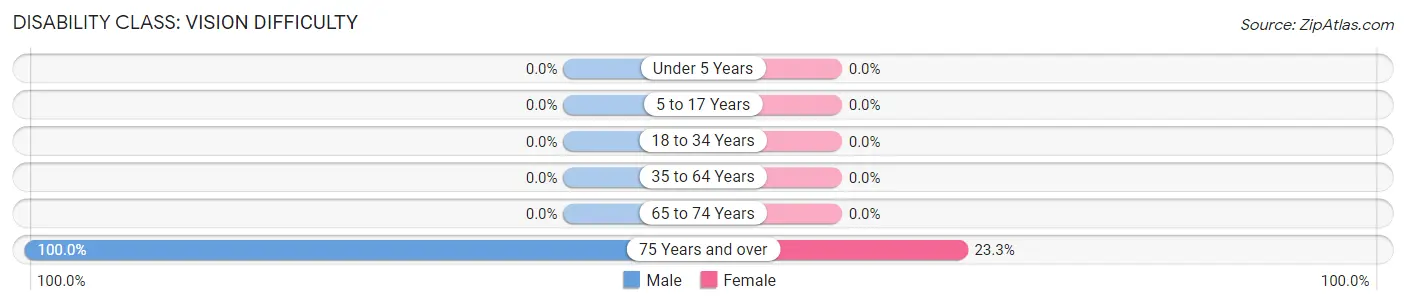
| Age Bracket | Male | Female |
| Under 5 Years | 0 (0.0%) | 0 (0.0%) |
| 5 to 17 Years | 0 (0.0%) | 0 (0.0%) |
| 18 to 34 Years | 0 (0.0%) | 0 (0.0%) |
| 35 to 64 Years | 0 (0.0%) | 0 (0.0%) |
| 65 to 74 Years | 0 (0.0%) | 0 (0.0%) |
| 75 Years and over | 15 (100.0%) | 14 (23.3%) |
Disability Class: Cognitive Difficulty
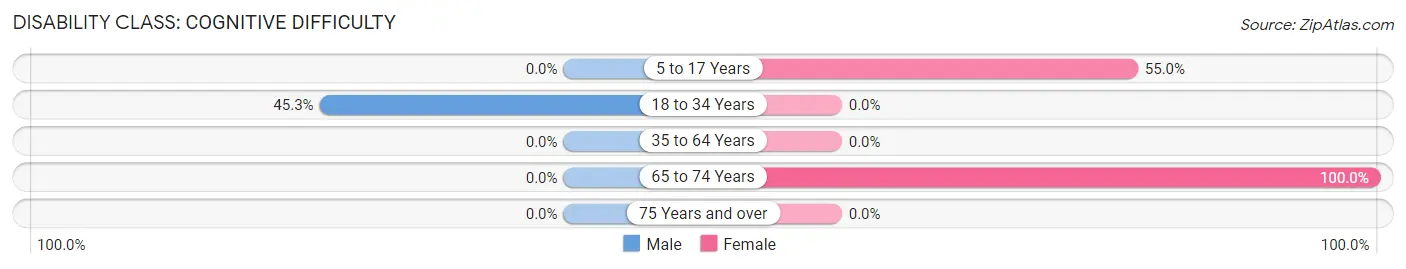
| Age Bracket | Male | Female |
| 5 to 17 Years | 0 (0.0%) | 50 (54.9%) |
| 18 to 34 Years | 72 (45.3%) | 0 (0.0%) |
| 35 to 64 Years | 0 (0.0%) | 0 (0.0%) |
| 65 to 74 Years | 0 (0.0%) | 9 (100.0%) |
| 75 Years and over | 0 (0.0%) | 0 (0.0%) |
Disability Class: Ambulatory Difficulty
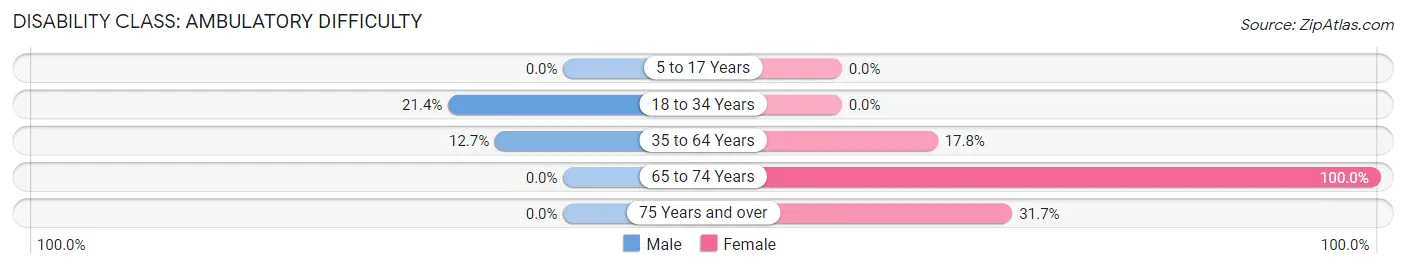
| Age Bracket | Male | Female |
| 5 to 17 Years | 0 (0.0%) | 0 (0.0%) |
| 18 to 34 Years | 34 (21.4%) | 0 (0.0%) |
| 35 to 64 Years | 18 (12.7%) | 21 (17.8%) |
| 65 to 74 Years | 0 (0.0%) | 9 (100.0%) |
| 75 Years and over | 0 (0.0%) | 19 (31.7%) |
Disability Class: Self-Care Difficulty
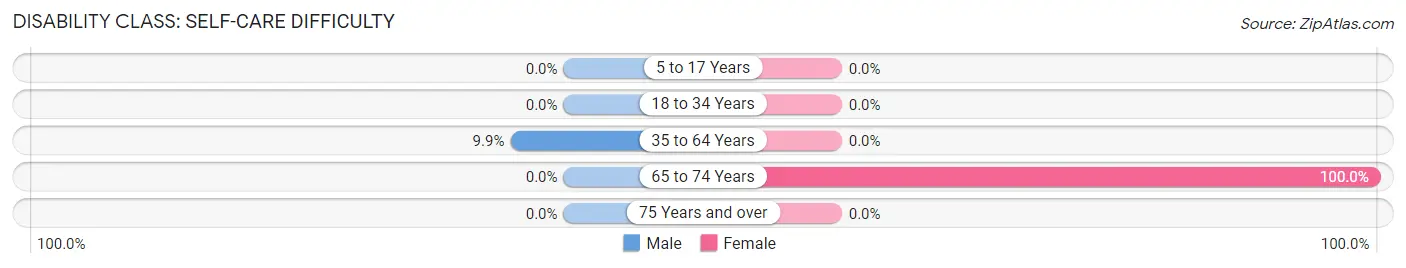
| Age Bracket | Male | Female |
| 5 to 17 Years | 0 (0.0%) | 0 (0.0%) |
| 18 to 34 Years | 0 (0.0%) | 0 (0.0%) |
| 35 to 64 Years | 14 (9.9%) | 0 (0.0%) |
| 65 to 74 Years | 0 (0.0%) | 9 (100.0%) |
| 75 Years and over | 0 (0.0%) | 0 (0.0%) |
Technology Access in Fieldale
Computing Device Access in Fieldale
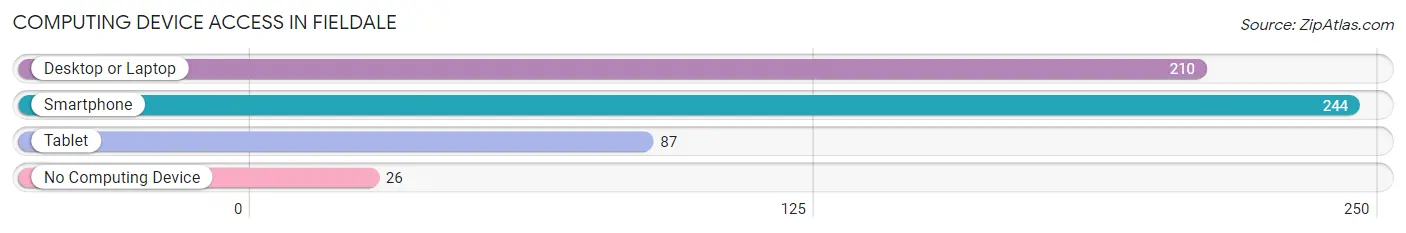
| Device Type | # Households | % Households |
| Desktop or Laptop | 210 | 73.7% |
| Smartphone | 244 | 85.6% |
| Tablet | 87 | 30.5% |
| No Computing Device | 26 | 9.1% |
| Total | 285 | 100.0% |
Internet Access in Fieldale
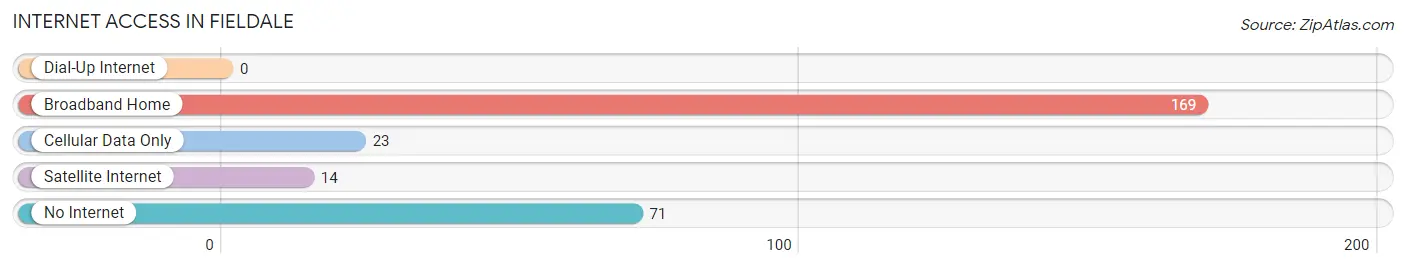
| Internet Type | # Households | % Households |
| Dial-Up Internet | 0 | 0.0% |
| Broadband Home | 169 | 59.3% |
| Cellular Data Only | 23 | 8.1% |
| Satellite Internet | 14 | 4.9% |
| No Internet | 71 | 24.9% |
| Total | 285 | 100.0% |
Fieldale Summary
Fieldale is a small town located in Henry County, Virginia. It is situated in the foothills of the Blue Ridge Mountains, about 25 miles northeast of the city of Martinsville. The town was founded in the late 19th century and has a population of approximately 1,500 people.
Geography
Fieldale is located in the Piedmont region of Virginia, which is characterized by rolling hills and valleys. The town is situated in the foothills of the Blue Ridge Mountains, about 25 miles northeast of the city of Martinsville. The town is bordered by the Smith River to the north and the Mayo River to the south. The town is located at an elevation of 1,000 feet above sea level.
The climate in Fieldale is humid subtropical, with hot, humid summers and mild winters. The average annual temperature is around 60 degrees Fahrenheit. The average annual precipitation is around 40 inches.
Economy
Fieldale’s economy is largely based on agriculture and manufacturing. The town is home to several large poultry processing plants, as well as a number of smaller businesses. The town is also home to a number of small farms, which produce a variety of crops, including corn, soybeans, and tobacco.
The town is also home to a number of retail stores, including a grocery store, a hardware store, and a few restaurants. The town is also home to a number of small businesses, such as auto repair shops, beauty salons, and barbershops.
Demographics
As of the 2010 census, the population of Fieldale was 1,500 people. The racial makeup of the town was 94.2% White, 3.3% African American, 0.7% Native American, 0.3% Asian, and 1.5% from other races. The median household income was $30,000, and the median family income was $35,000.
The town is served by the Henry County Public Schools system. The town is home to Fieldale-Collinsville High School, which serves students in grades 9-12. The town is also home to a number of churches, including the First Baptist Church of Fieldale, the Fieldale United Methodist Church, and the Fieldale Presbyterian Church.
Conclusion
Fieldale is a small town located in Henry County, Virginia. It is situated in the foothills of the Blue Ridge Mountains, about 25 miles northeast of the city of Martinsville. The town was founded in the late 19th century and has a population of approximately 1,500 people. The town’s economy is largely based on agriculture and manufacturing, and the town is home to a number of retail stores, small businesses, and churches. The town is served by the Henry County Public Schools system, and the median household income is $30,000.
Common Questions
What is Per Capita Income in Fieldale?
Per Capita income in Fieldale is $18,878.
What is the Median Family Income in Fieldale?
Median Family Income in Fieldale is $41,250.
What is the Median Household income in Fieldale?
Median Household Income in Fieldale is $41,601.
What is Income or Wage Gap in Fieldale?
Income or Wage Gap in Fieldale is 22.0%.
Women in Fieldale earn 78.0 cents for every dollar earned by a man.
What is Inequality or Gini Index in Fieldale?
Inequality or Gini Index in Fieldale is 0.31.
What is the Total Population of Fieldale?
Total Population of Fieldale is 802.
What is the Total Male Population of Fieldale?
Total Male Population of Fieldale is 453.
What is the Total Female Population of Fieldale?
Total Female Population of Fieldale is 349.
What is the Ratio of Males per 100 Females in Fieldale?
There are 129.80 Males per 100 Females in Fieldale.
What is the Ratio of Females per 100 Males in Fieldale?
There are 77.04 Females per 100 Males in Fieldale.
What is the Median Population Age in Fieldale?
Median Population Age in Fieldale is 34.4 Years.
What is the Average Family Size in Fieldale
Average Family Size in Fieldale is 4.3 People.
What is the Average Household Size in Fieldale
Average Household Size in Fieldale is 2.8 People.
How Large is the Labor Force in Fieldale?
There are 200 People in the Labor Forcein in Fieldale.
What is the Percentage of People in the Labor Force in Fieldale?
30.7% of People are in the Labor Force in Fieldale.