Zip Codes with the Highest Percentage of Population Employed in Security & Protection in Chesapeake, VA
RELATED REPORTS & OPTIONS
Security & Protection
Chesapeake
Compare Zip Codes
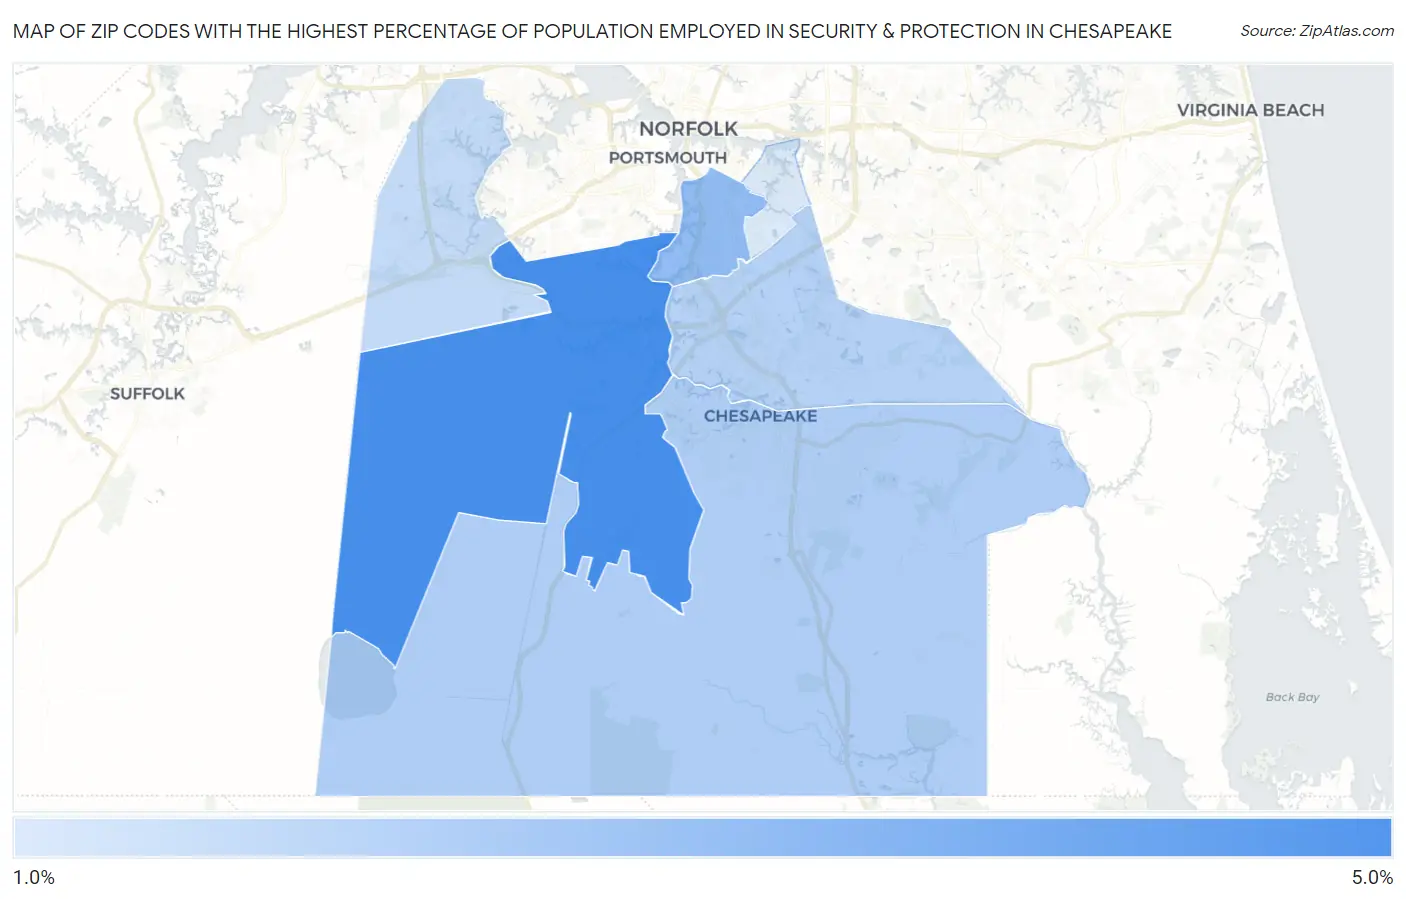
Map of Zip Codes with the Highest Percentage of Population Employed in Security & Protection in Chesapeake
1.5%
4.5%
Zip Codes with the Highest Percentage of Population Employed in Security & Protection in Chesapeake, VA
| Zip Code | % Employed | vs State | vs National | |
| 1. | 23323 | 4.5% | 2.7%(+1.84)#159 | 2.1%(+2.38)#3,575 |
| 2. | 23324 | 3.0% | 2.7%(+0.323)#294 | 2.1%(+0.857)#7,209 |
| 3. | 23322 | 2.4% | 2.7%(-0.283)#383 | 2.1%(+0.251)#10,056 |
| 4. | 23320 | 2.3% | 2.7%(-0.418)#399 | 2.1%(+0.115)#10,859 |
| 5. | 23321 | 2.0% | 2.7%(-0.712)#442 | 2.1%(-0.178)#12,759 |
| 6. | 23325 | 1.5% | 2.7%(-1.21)#528 | 2.1%(-0.673)#16,382 |
1
Common Questions
What are the Top 5 Zip Codes with the Highest Percentage of Population Employed in Security & Protection in Chesapeake, VA?
Top 5 Zip Codes with the Highest Percentage of Population Employed in Security & Protection in Chesapeake, VA are:
What zip code has the Highest Percentage of Population Employed in Security & Protection in Chesapeake, VA?
23323 has the Highest Percentage of Population Employed in Security & Protection in Chesapeake, VA with 4.5%.
What is the Percentage of Population Employed in Security & Protection in Chesapeake, VA?
Percentage of Population Employed in Security & Protection in Chesapeake is 2.6%.
What is the Percentage of Population Employed in Security & Protection in Virginia?
Percentage of Population Employed in Security & Protection in Virginia is 2.7%.
What is the Percentage of Population Employed in Security & Protection in the United States?
Percentage of Population Employed in Security & Protection in the United States is 2.1%.