Montross, VA Map & Demographics
Montross Map
Montross Overview
$68,599
PER CAPITA INCOME
$84,853
AVG FAMILY INCOME
$60,313
AVG HOUSEHOLD INCOME
0.56
INEQUALITY / GINI INDEX
368
TOTAL POPULATION
175
MALE POPULATION
193
FEMALE POPULATION
90.67
MALES / 100 FEMALES
110.29
FEMALES / 100 MALES
44.0
MEDIAN AGE
3.6
AVG FAMILY SIZE
2.2
AVG HOUSEHOLD SIZE
216
LABOR FORCE [ PEOPLE ]
64.3%
PERCENT IN LABOR FORCE
0.9%
UNEMPLOYMENT RATE
Montross Zip Codes
Montross Area Codes
Income in Montross
Income Overview in Montross
Per Capita Income in Montross is $68,599, while median incomes of families and households are $84,853 and $60,313 respectively.
| Characteristic | Number | Measure |
| Per Capita Income | 368 | $68,599 |
| Median Family Income | 74 | $84,853 |
| Mean Family Income | 74 | $118,172 |
| Median Household Income | 167 | $60,313 |
| Mean Household Income | 167 | $98,085 |
| Income Deficit | 74 | $0 |
| Wage / Income Gap (%) | 368 | 0.00% |
| Wage / Income Gap ($) | 368 | 100.00¢ per $1 |
| Gini / Inequality Index | 368 | 0.56 |
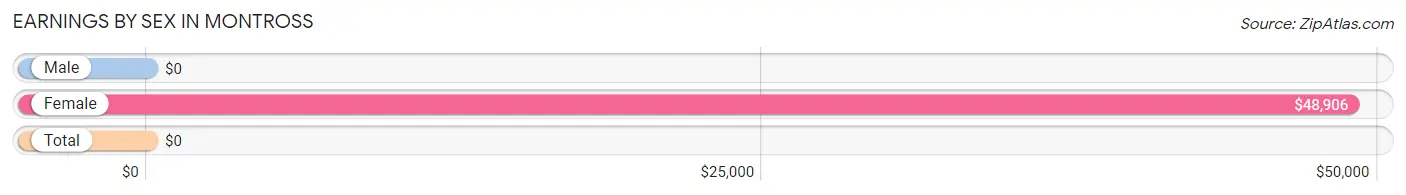
Earnings by Sex in Montross
| Sex | Number | Average Earnings |
| Male | 133 (61.0%) | $0 |
| Female | 85 (39.0%) | $48,906 |
| Total | 218 (100.0%) | $0 |
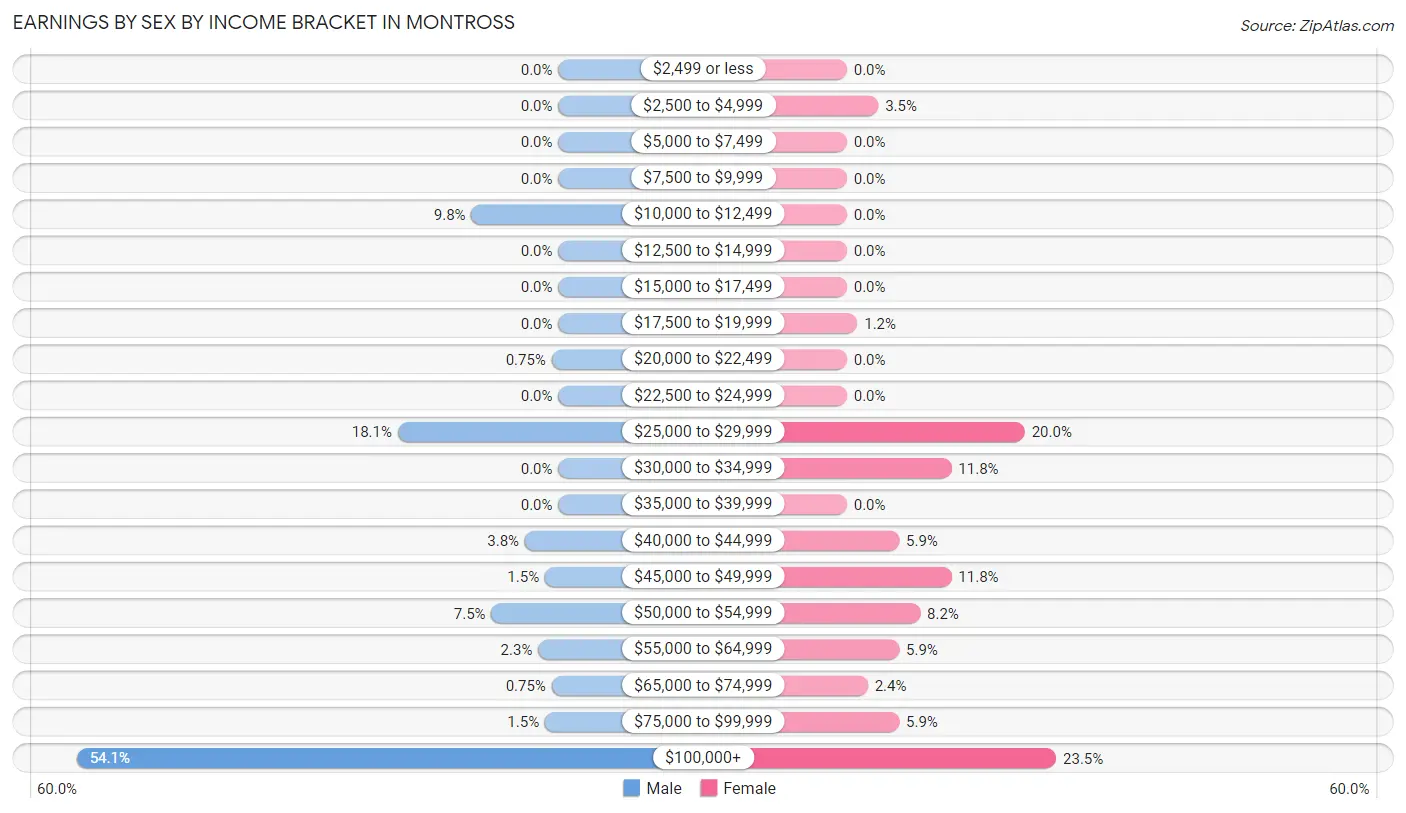
Earnings by Sex by Income Bracket in Montross
The most common earnings brackets in Montross are $100,000+ for men (72 | 54.1%) and $100,000+ for women (20 | 23.5%).
| Income | Male | Female |
| $2,499 or less | 0 (0.0%) | 0 (0.0%) |
| $2,500 to $4,999 | 0 (0.0%) | 3 (3.5%) |
| $5,000 to $7,499 | 0 (0.0%) | 0 (0.0%) |
| $7,500 to $9,999 | 0 (0.0%) | 0 (0.0%) |
| $10,000 to $12,499 | 13 (9.8%) | 0 (0.0%) |
| $12,500 to $14,999 | 0 (0.0%) | 0 (0.0%) |
| $15,000 to $17,499 | 0 (0.0%) | 0 (0.0%) |
| $17,500 to $19,999 | 0 (0.0%) | 1 (1.2%) |
| $20,000 to $22,499 | 1 (0.7%) | 0 (0.0%) |
| $22,500 to $24,999 | 0 (0.0%) | 0 (0.0%) |
| $25,000 to $29,999 | 24 (18.0%) | 17 (20.0%) |
| $30,000 to $34,999 | 0 (0.0%) | 10 (11.8%) |
| $35,000 to $39,999 | 0 (0.0%) | 0 (0.0%) |
| $40,000 to $44,999 | 5 (3.8%) | 5 (5.9%) |
| $45,000 to $49,999 | 2 (1.5%) | 10 (11.8%) |
| $50,000 to $54,999 | 10 (7.5%) | 7 (8.2%) |
| $55,000 to $64,999 | 3 (2.3%) | 5 (5.9%) |
| $65,000 to $74,999 | 1 (0.7%) | 2 (2.4%) |
| $75,000 to $99,999 | 2 (1.5%) | 5 (5.9%) |
| $100,000+ | 72 (54.1%) | 20 (23.5%) |
| Total | 133 (100.0%) | 85 (100.0%) |
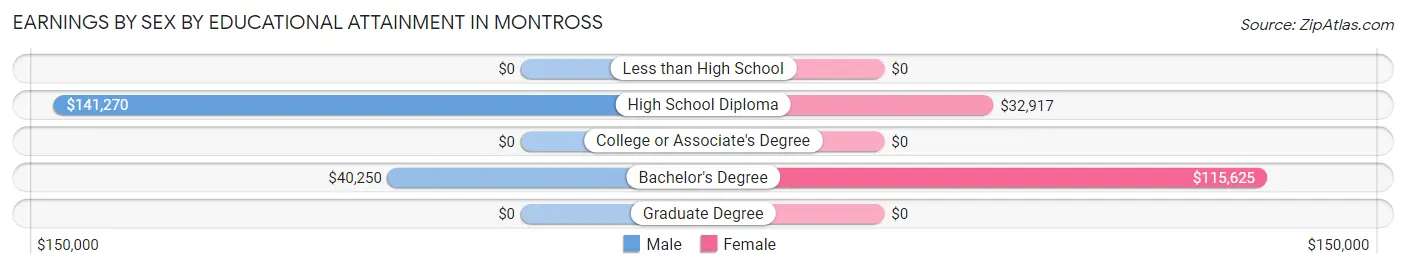
Earnings by Sex by Educational Attainment in Montross
| Educational Attainment | Male Income | Female Income |
| Less than High School | - | - |
| High School Diploma | $141,270 | $32,917 |
| College or Associate's Degree | - | - |
| Bachelor's Degree | $40,250 | $115,625 |
| Graduate Degree | - | - |
| Total | - | - |
Family Income in Montross
Family Income Brackets in Montross
According to the Montross family income data, there are 25 families falling into the $75,000 to $99,999 income range, which is the most common income bracket and makes up 33.8% of all families.
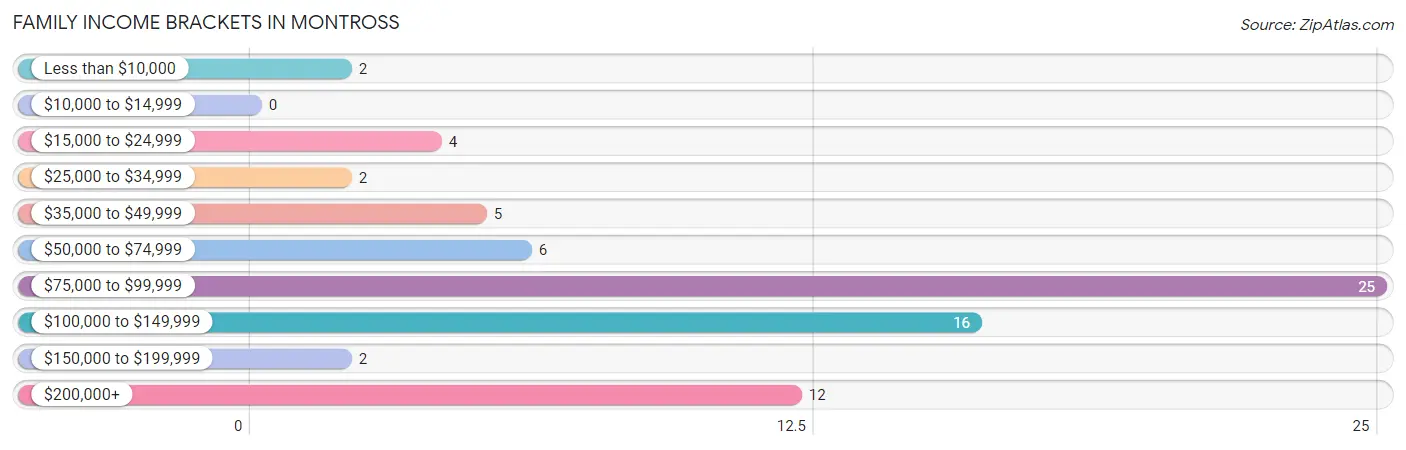
| Income Bracket | # Families | % Families |
| Less than $10,000 | 2 | 2.7% |
| $10,000 to $14,999 | 0 | 0.0% |
| $15,000 to $24,999 | 4 | 5.4% |
| $25,000 to $34,999 | 2 | 2.7% |
| $35,000 to $49,999 | 5 | 6.8% |
| $50,000 to $74,999 | 6 | 8.1% |
| $75,000 to $99,999 | 25 | 33.8% |
| $100,000 to $149,999 | 16 | 21.6% |
| $150,000 to $199,999 | 2 | 2.7% |
| $200,000+ | 12 | 16.2% |
Family Income by Famaliy Size in Montross
4-person families (7 | 9.5%) account for the highest median family income in Montross with $92,188 per family, while 2-person families (51 | 68.9%) have the highest median income of $41,948 per family member.
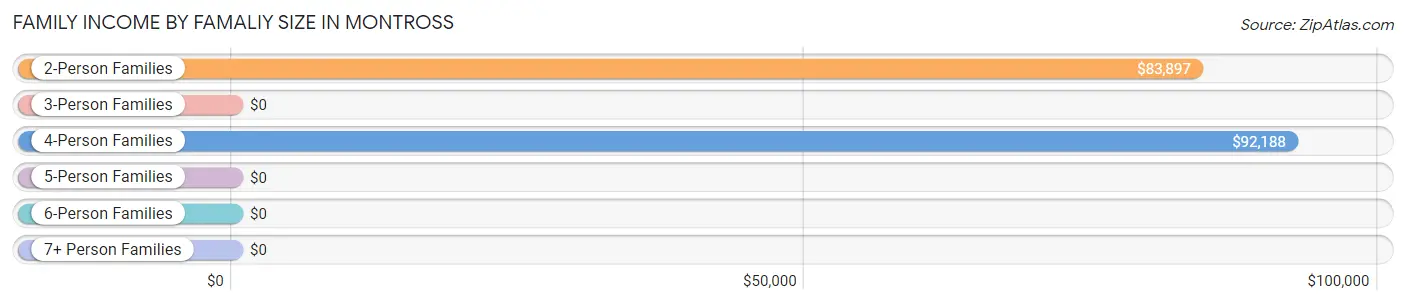
| Income Bracket | # Families | Median Income |
| 2-Person Families | 51 (68.9%) | $83,897 |
| 3-Person Families | 12 (16.2%) | $0 |
| 4-Person Families | 7 (9.5%) | $92,188 |
| 5-Person Families | 2 (2.7%) | $0 |
| 6-Person Families | 2 (2.7%) | $0 |
| 7+ Person Families | 0 (0.0%) | $0 |
| Total | 74 (100.0%) | $84,853 |
Family Income by Number of Earners in Montross
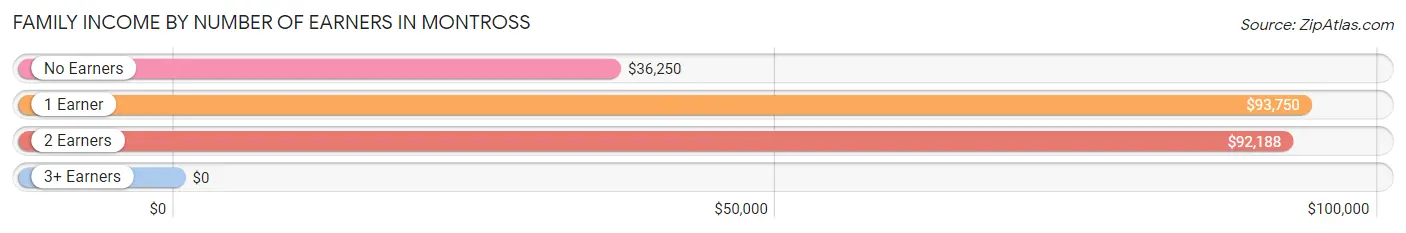
| Number of Earners | # Families | Median Income |
| No Earners | 12 (16.2%) | $36,250 |
| 1 Earner | 15 (20.3%) | $93,750 |
| 2 Earners | 47 (63.5%) | $92,188 |
| 3+ Earners | 0 (0.0%) | $0 |
| Total | 74 (100.0%) | $84,853 |
Household Income in Montross
Household Income Brackets in Montross
With 25 households falling in the category, the $75,000 to $99,999 income range is the most frequent in Montross, accounting for 15.0% of all households. In contrast, only 6 households (3.6%) fall into the $15,000 to $24,999 income bracket, making it the least populous group.
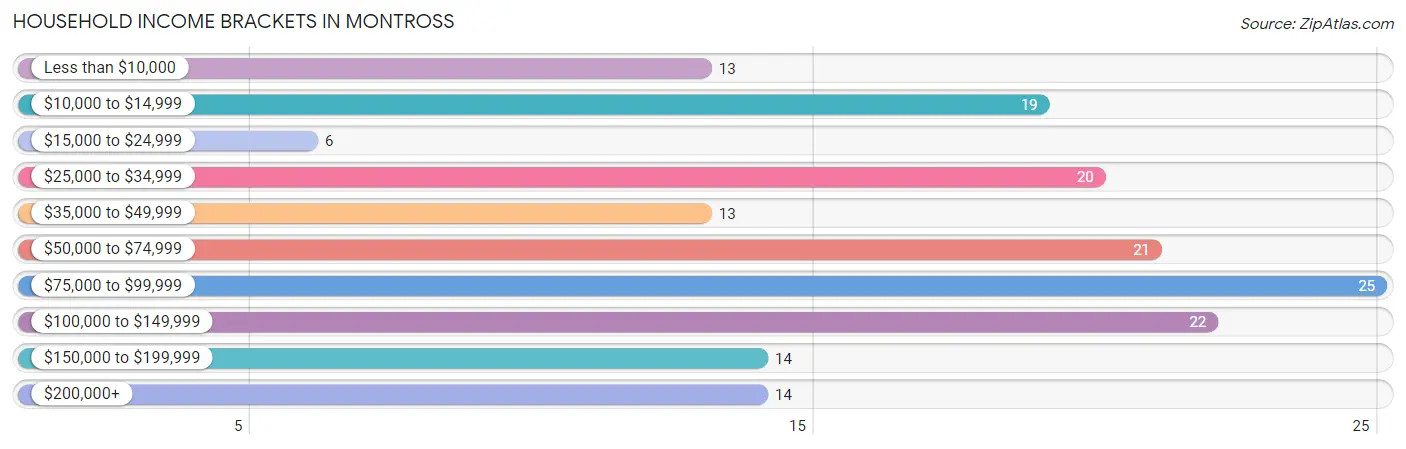
| Income Bracket | # Households | % Households |
| Less than $10,000 | 13 | 7.8% |
| $10,000 to $14,999 | 19 | 11.4% |
| $15,000 to $24,999 | 6 | 3.6% |
| $25,000 to $34,999 | 20 | 12.0% |
| $35,000 to $49,999 | 13 | 7.8% |
| $50,000 to $74,999 | 21 | 12.6% |
| $75,000 to $99,999 | 25 | 15.0% |
| $100,000 to $149,999 | 22 | 13.2% |
| $150,000 to $199,999 | 14 | 8.4% |
| $200,000+ | 14 | 8.4% |
Household Income by Householder Age in Montross
The median household income in Montross is $60,313, with the highest median household income of $103,750 found in the 45 to 64 years age bracket for the primary householder. A total of 40 households (23.9%) fall into this category. Meanwhile, the 15 to 24 years age bracket for the primary householder has the lowest median household income of $0, with 3 households (1.8%) in this group.
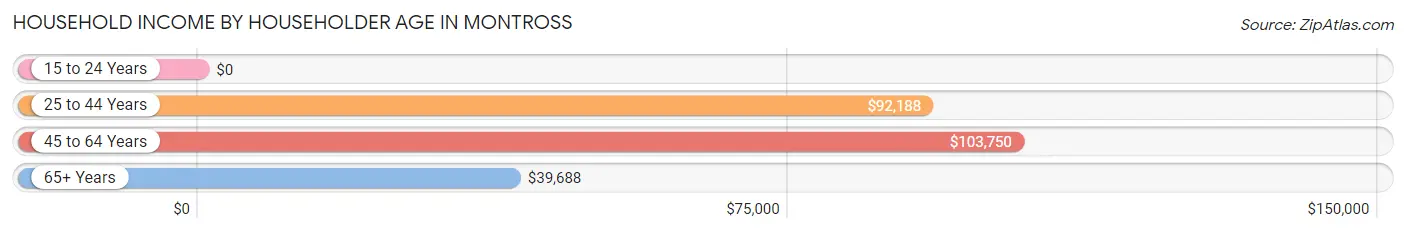
| Income Bracket | # Households | Median Income |
| 15 to 24 Years | 3 (1.8%) | $0 |
| 25 to 44 Years | 27 (16.2%) | $92,188 |
| 45 to 64 Years | 40 (23.9%) | $103,750 |
| 65+ Years | 97 (58.1%) | $39,688 |
| Total | 167 (100.0%) | $60,313 |
Poverty in Montross
Income Below Poverty by Sex and Age in Montross
With 6.9% poverty level for males and 14.0% for females among the residents of Montross, 5 year old males and 75 year old and over females are the most vulnerable to poverty, with 1 males (50.0%) and 12 females (30.0%) in their respective age groups living below the poverty level.
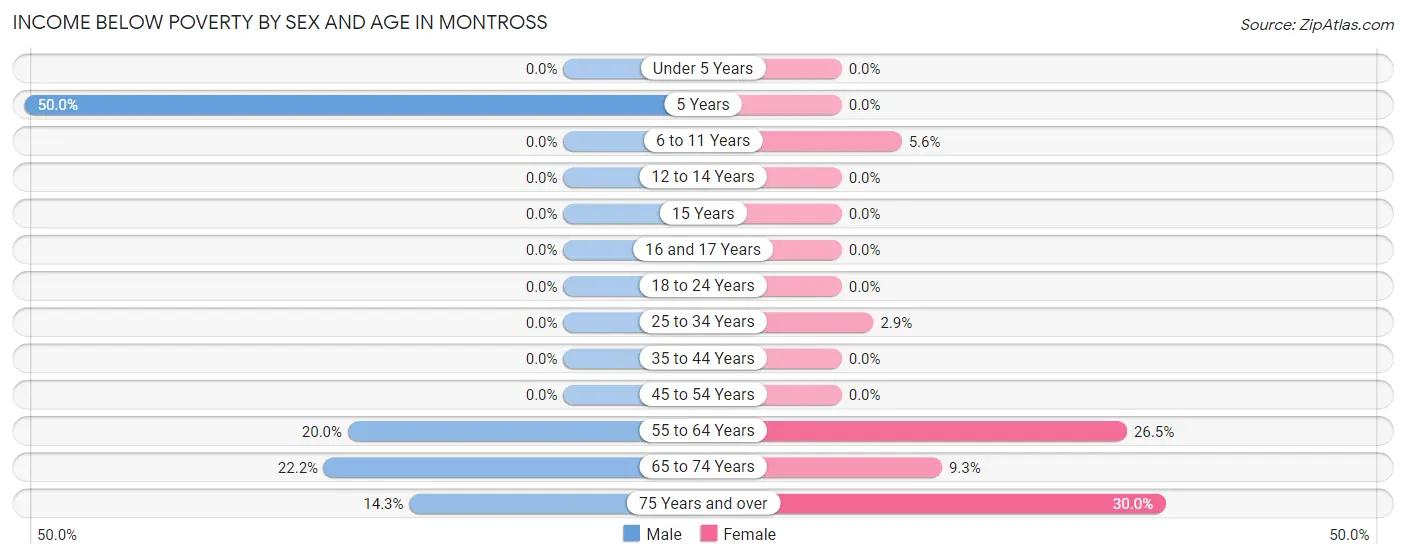
| Age Bracket | Male | Female |
| Under 5 Years | 0 (0.0%) | 0 (0.0%) |
| 5 Years | 1 (50.0%) | 0 (0.0%) |
| 6 to 11 Years | 0 (0.0%) | 1 (5.6%) |
| 12 to 14 Years | 0 (0.0%) | 0 (0.0%) |
| 15 Years | 0 (0.0%) | 0 (0.0%) |
| 16 and 17 Years | 0 (0.0%) | 0 (0.0%) |
| 18 to 24 Years | 0 (0.0%) | 0 (0.0%) |
| 25 to 34 Years | 0 (0.0%) | 1 (2.9%) |
| 35 to 44 Years | 0 (0.0%) | 0 (0.0%) |
| 45 to 54 Years | 0 (0.0%) | 0 (0.0%) |
| 55 to 64 Years | 3 (20.0%) | 9 (26.5%) |
| 65 to 74 Years | 6 (22.2%) | 4 (9.3%) |
| 75 Years and over | 2 (14.3%) | 12 (30.0%) |
| Total | 12 (6.9%) | 27 (14.0%) |
Income Above Poverty by Sex and Age in Montross
According to the poverty statistics in Montross, males aged under 5 years and females aged under 5 years are the age groups that are most secure financially, with 100.0% of males and 100.0% of females in these age groups living above the poverty line.
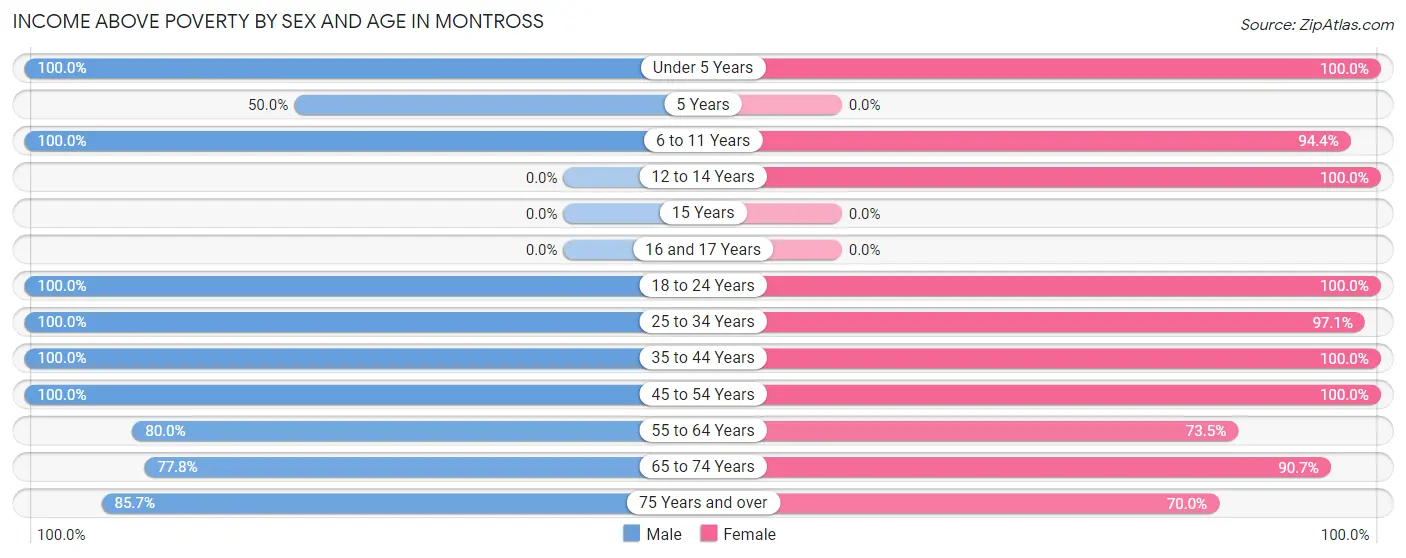
| Age Bracket | Male | Female |
| Under 5 Years | 5 (100.0%) | 3 (100.0%) |
| 5 Years | 1 (50.0%) | 0 (0.0%) |
| 6 to 11 Years | 3 (100.0%) | 17 (94.4%) |
| 12 to 14 Years | 0 (0.0%) | 1 (100.0%) |
| 15 Years | 0 (0.0%) | 0 (0.0%) |
| 16 and 17 Years | 0 (0.0%) | 0 (0.0%) |
| 18 to 24 Years | 4 (100.0%) | 4 (100.0%) |
| 25 to 34 Years | 24 (100.0%) | 33 (97.1%) |
| 35 to 44 Years | 76 (100.0%) | 12 (100.0%) |
| 45 to 54 Years | 5 (100.0%) | 4 (100.0%) |
| 55 to 64 Years | 12 (80.0%) | 25 (73.5%) |
| 65 to 74 Years | 21 (77.8%) | 39 (90.7%) |
| 75 Years and over | 12 (85.7%) | 28 (70.0%) |
| Total | 163 (93.1%) | 166 (86.0%) |
Income Below Poverty Among Married-Couple Families in Montross
The poverty statistics for married-couple families in Montross show that 3.3% or 2 of the total 60 families live below the poverty line. Families with no children have the highest poverty rate of 4.3%, comprising of 2 families. On the other hand, families with 1 or 2 children have the lowest poverty rate of 0.0%, which includes 0 families.
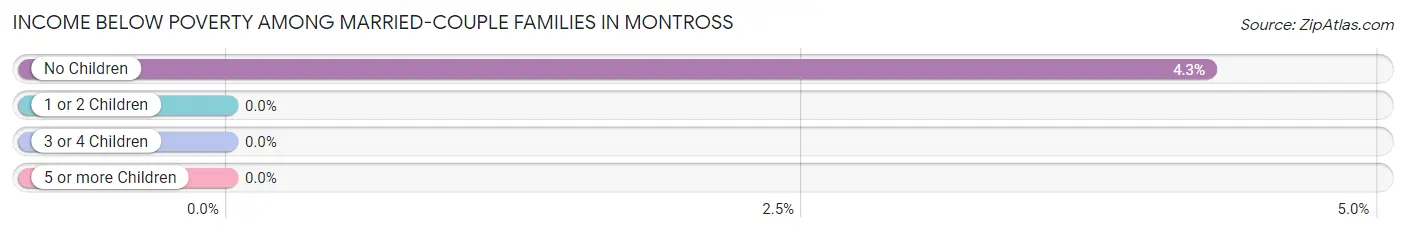
| Children | Above Poverty | Below Poverty |
| No Children | 45 (95.7%) | 2 (4.3%) |
| 1 or 2 Children | 9 (100.0%) | 0 (0.0%) |
| 3 or 4 Children | 4 (100.0%) | 0 (0.0%) |
| 5 or more Children | 0 (0.0%) | 0 (0.0%) |
| Total | 58 (96.7%) | 2 (3.3%) |
Income Below Poverty Among Single-Parent Households in Montross
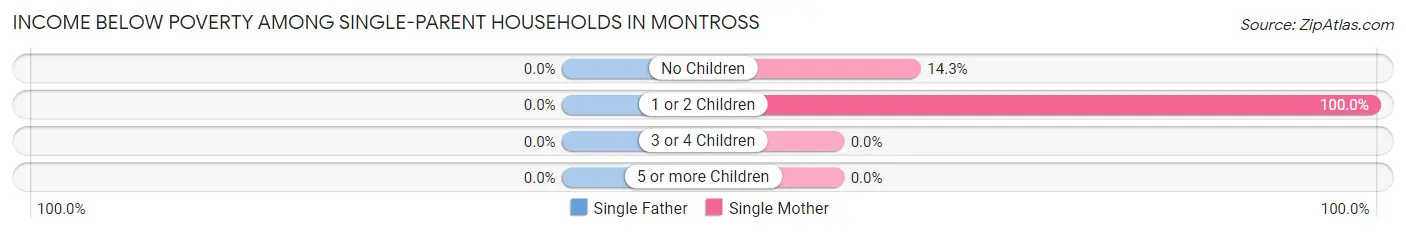
| Children | Single Father | Single Mother |
| No Children | 0 (0.0%) | 1 (14.3%) |
| 1 or 2 Children | 0 (0.0%) | 1 (100.0%) |
| 3 or 4 Children | 0 (0.0%) | 0 (0.0%) |
| 5 or more Children | 0 (0.0%) | 0 (0.0%) |
| Total | 0 (0.0%) | 2 (25.0%) |
Income Below Poverty Among Married-Couple vs Single-Parent Households in Montross
The poverty data for Montross shows that 2 of the married-couple family households (3.3%) and 2 of the single-parent households (14.3%) are living below the poverty level. Within the married-couple family households, those with no children have the highest poverty rate, with 2 households (4.3%) falling below the poverty line. Among the single-parent households, those with 1 or 2 children have the highest poverty rate, with 1 household (33.3%) living below poverty.
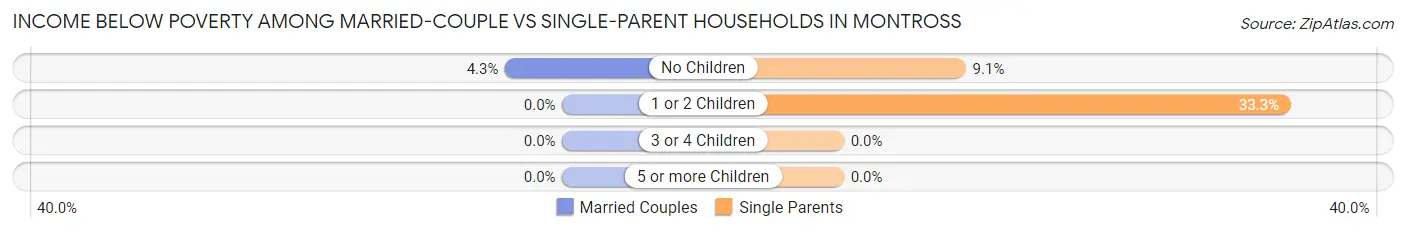
| Children | Married-Couple Families | Single-Parent Households |
| No Children | 2 (4.3%) | 1 (9.1%) |
| 1 or 2 Children | 0 (0.0%) | 1 (33.3%) |
| 3 or 4 Children | 0 (0.0%) | 0 (0.0%) |
| 5 or more Children | 0 (0.0%) | 0 (0.0%) |
| Total | 2 (3.3%) | 2 (14.3%) |
Race in Montross
The most populous races in Montross are White / Caucasian (279 | 75.8%), Black / African American (47 | 12.8%), and Asian (33 | 9.0%).
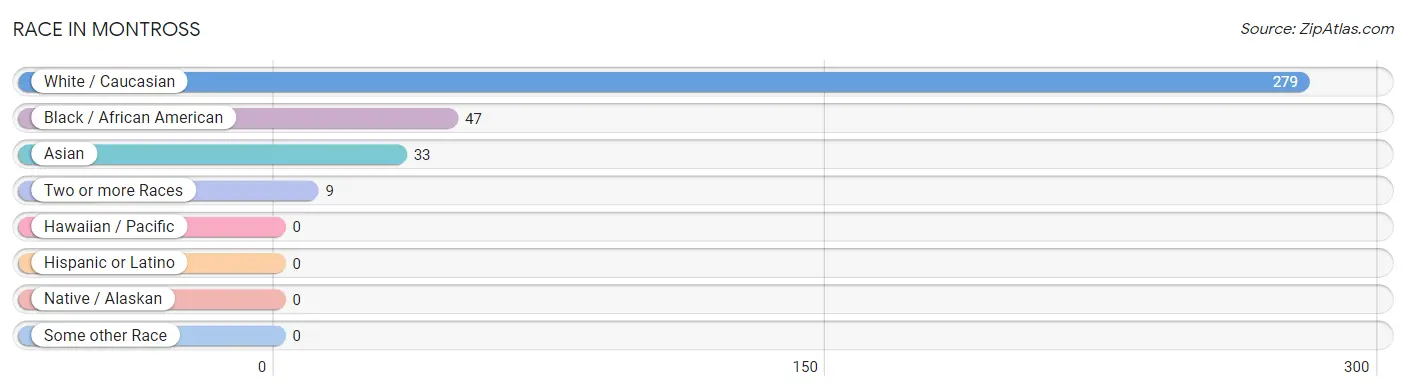
| Race | # Population | % Population |
| Asian | 33 | 9.0% |
| Black / African American | 47 | 12.8% |
| Hawaiian / Pacific | 0 | 0.0% |
| Hispanic or Latino | 0 | 0.0% |
| Native / Alaskan | 0 | 0.0% |
| White / Caucasian | 279 | 75.8% |
| Two or more Races | 9 | 2.5% |
| Some other Race | 0 | 0.0% |
| Total | 368 | 100.0% |
Ancestry in Montross
The most populous ancestries reported in Montross are Scotch-Irish (79 | 21.5%), Irish (71 | 19.3%), English (62 | 16.9%), German (33 | 9.0%), and Thai (28 | 7.6%), together accounting for 74.2% of all Montross residents.
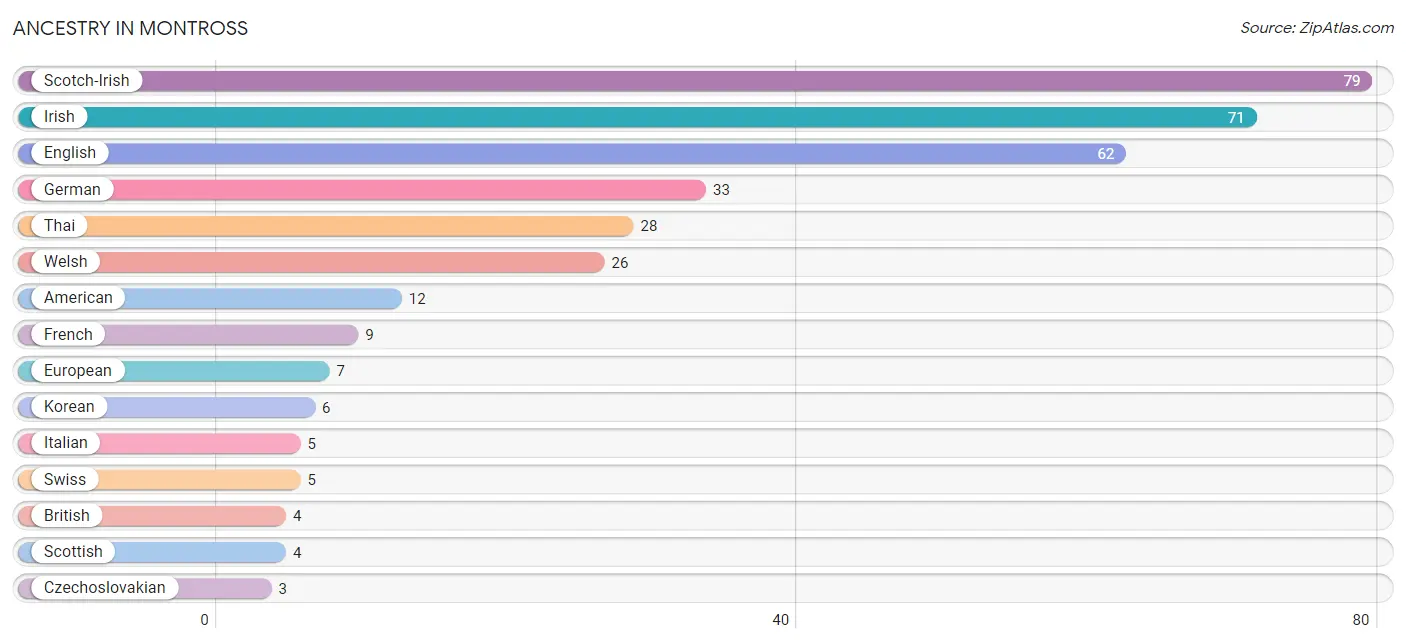
| Ancestry | # Population | % Population |
| American | 12 | 3.3% |
| British | 4 | 1.1% |
| Burmese | 2 | 0.5% |
| Czechoslovakian | 3 | 0.8% |
| Dutch | 1 | 0.3% |
| Eastern European | 1 | 0.3% |
| English | 62 | 16.9% |
| European | 7 | 1.9% |
| French | 9 | 2.5% |
| German | 33 | 9.0% |
| Irish | 71 | 19.3% |
| Italian | 5 | 1.4% |
| Korean | 6 | 1.6% |
| Pakistani | 3 | 0.8% |
| Scotch-Irish | 79 | 21.5% |
| Scottish | 4 | 1.1% |
| Swiss | 5 | 1.4% |
| Thai | 28 | 7.6% |
| Welsh | 26 | 7.1% | View All 19 Rows |
Immigrants in Montross
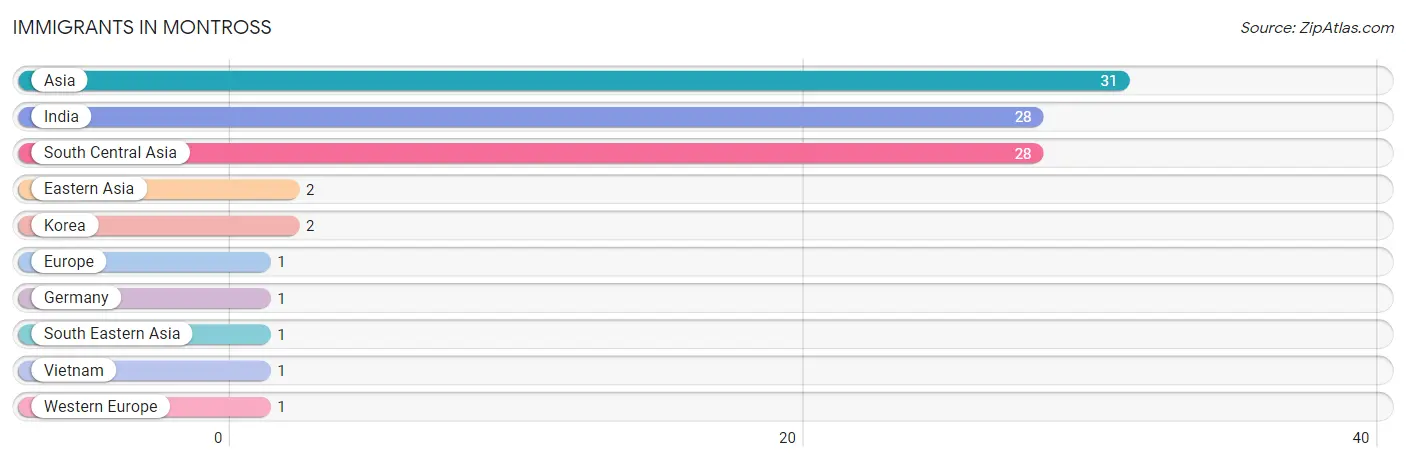
The most numerous immigrant groups reported in Montross came from Asia (31 | 8.4%), India (28 | 7.6%), South Central Asia (28 | 7.6%), Eastern Asia (2 | 0.5%), and Korea (2 | 0.5%), together accounting for 24.7% of all Montross residents.
| Immigration Origin | # Population | % Population |
| Asia | 31 | 8.4% |
| Eastern Asia | 2 | 0.5% |
| Europe | 1 | 0.3% |
| Germany | 1 | 0.3% |
| India | 28 | 7.6% |
| Korea | 2 | 0.5% |
| South Central Asia | 28 | 7.6% |
| South Eastern Asia | 1 | 0.3% |
| Vietnam | 1 | 0.3% |
| Western Europe | 1 | 0.3% | View All 10 Rows |
Sex and Age in Montross
Sex and Age in Montross
The most populous age groups in Montross are 40 to 44 Years (65 | 37.1%) for men and 65 to 69 Years (30 | 15.5%) for women.
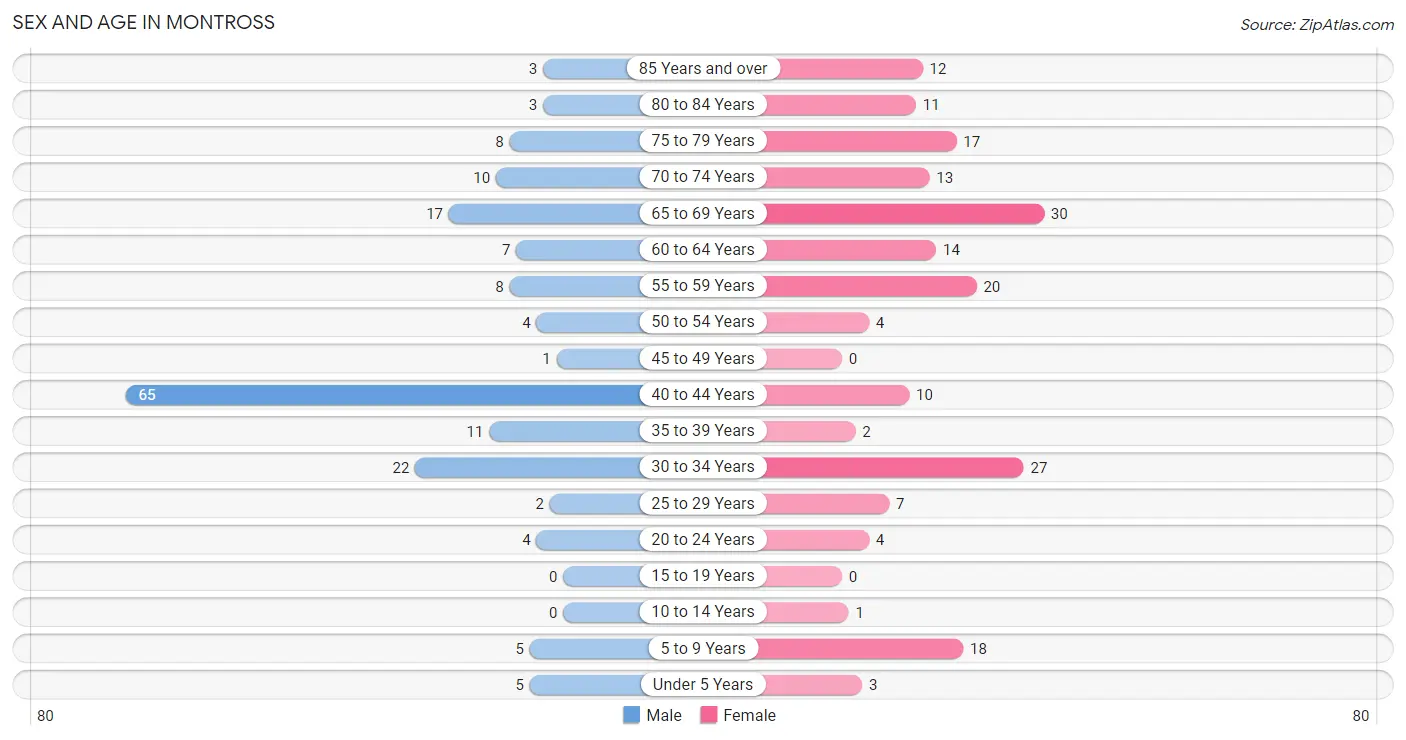
| Age Bracket | Male | Female |
| Under 5 Years | 5 (2.9%) | 3 (1.5%) |
| 5 to 9 Years | 5 (2.9%) | 18 (9.3%) |
| 10 to 14 Years | 0 (0.0%) | 1 (0.5%) |
| 15 to 19 Years | 0 (0.0%) | 0 (0.0%) |
| 20 to 24 Years | 4 (2.3%) | 4 (2.1%) |
| 25 to 29 Years | 2 (1.1%) | 7 (3.6%) |
| 30 to 34 Years | 22 (12.6%) | 27 (14.0%) |
| 35 to 39 Years | 11 (6.3%) | 2 (1.0%) |
| 40 to 44 Years | 65 (37.1%) | 10 (5.2%) |
| 45 to 49 Years | 1 (0.6%) | 0 (0.0%) |
| 50 to 54 Years | 4 (2.3%) | 4 (2.1%) |
| 55 to 59 Years | 8 (4.6%) | 20 (10.4%) |
| 60 to 64 Years | 7 (4.0%) | 14 (7.2%) |
| 65 to 69 Years | 17 (9.7%) | 30 (15.5%) |
| 70 to 74 Years | 10 (5.7%) | 13 (6.7%) |
| 75 to 79 Years | 8 (4.6%) | 17 (8.8%) |
| 80 to 84 Years | 3 (1.7%) | 11 (5.7%) |
| 85 Years and over | 3 (1.7%) | 12 (6.2%) |
| Total | 175 (100.0%) | 193 (100.0%) |
Families and Households in Montross
Median Family Size in Montross
The median family size in Montross is 3.65 persons per family, with single male/father families (6 | 8.1%) accounting for the largest median family size of 6.67 persons per family. On the other hand, single female/mother families (8 | 10.8%) represent the smallest median family size with 2.38 persons per family.
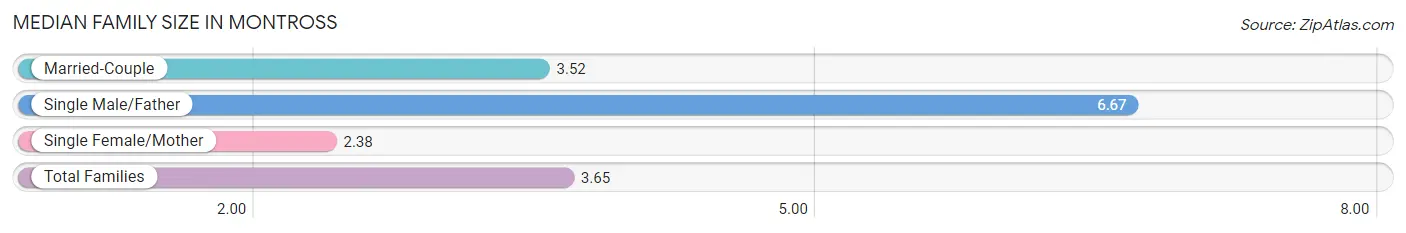
| Family Type | # Families | Family Size |
| Married-Couple | 60 (81.1%) | 3.52 |
| Single Male/Father | 6 (8.1%) | 6.67 |
| Single Female/Mother | 8 (10.8%) | 2.38 |
| Total Families | 74 (100.0%) | 3.65 |
Median Household Size in Montross
The median household size in Montross is 2.20 persons per household, with single male/father households (6 | 3.6%) accounting for the largest median household size of 6.67 persons per household. non-family households (93 | 55.7%) represent the smallest median household size with 1.04 persons per household.
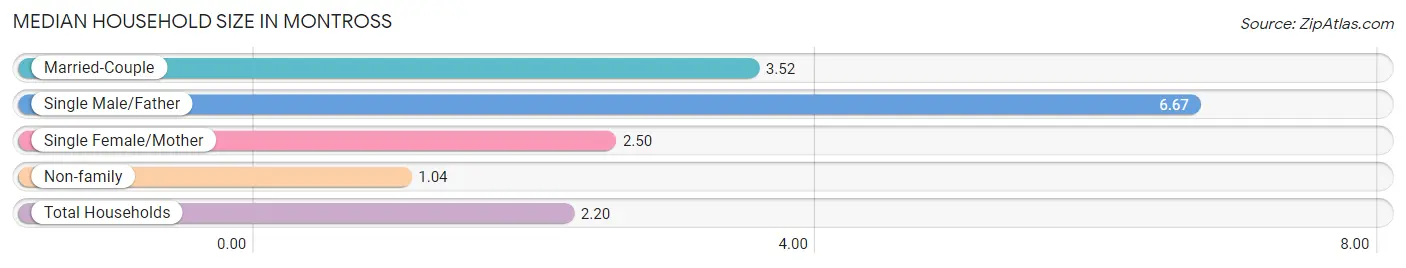
| Household Type | # Households | Household Size |
| Married-Couple | 60 (35.9%) | 3.52 |
| Single Male/Father | 6 (3.6%) | 6.67 |
| Single Female/Mother | 8 (4.8%) | 2.50 |
| Non-family | 93 (55.7%) | 1.04 |
| Total Households | 167 (100.0%) | 2.20 |
Household Size by Marriage Status in Montross
Out of a total of 167 households in Montross, 74 (44.3%) are family households, while 93 (55.7%) are nonfamily households. The most numerous type of family households are 2-person households, comprising 51, and the most common type of nonfamily households are 1-person households, comprising 90.
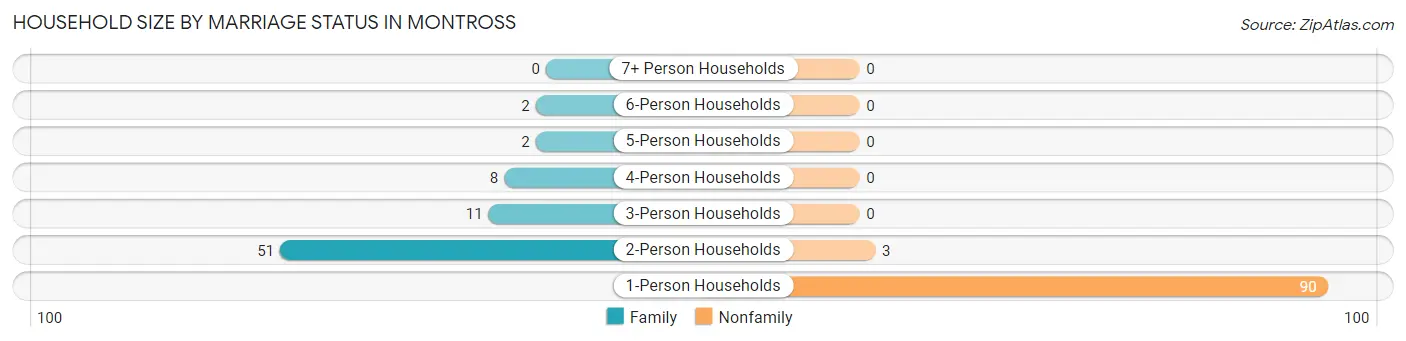
| Household Size | Family Households | Nonfamily Households |
| 1-Person Households | - | 90 (53.9%) |
| 2-Person Households | 51 (30.5%) | 3 (1.8%) |
| 3-Person Households | 11 (6.6%) | 0 (0.0%) |
| 4-Person Households | 8 (4.8%) | 0 (0.0%) |
| 5-Person Households | 2 (1.2%) | 0 (0.0%) |
| 6-Person Households | 2 (1.2%) | 0 (0.0%) |
| 7+ Person Households | 0 (0.0%) | 0 (0.0%) |
| Total | 74 (44.3%) | 93 (55.7%) |
Female Fertility in Montross
Fertility by Age in Montross
Average fertility rate in Montross is 100.0 births per 1,000 women. Women in the age bracket of 20 to 34 years have the highest fertility rate with 132.0 births per 1,000 women. Women in the age bracket of 20 to 34 years acount for 100.0% of all women with births.
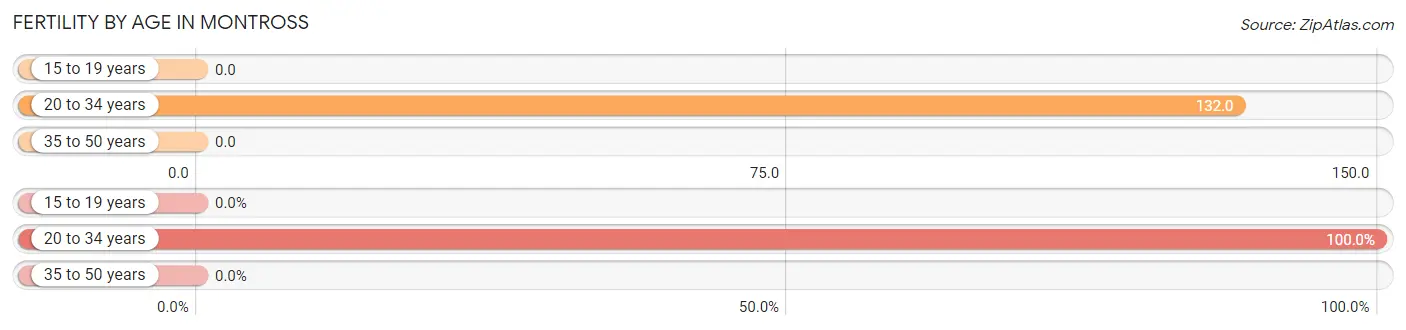
| Age Bracket | Women with Births | Births / 1,000 Women |
| 15 to 19 years | 0 (0.0%) | 0.0 |
| 20 to 34 years | 5 (100.0%) | 132.0 |
| 35 to 50 years | 0 (0.0%) | 0.0 |
| Total | 5 (100.0%) | 100.0 |
Fertility by Age by Marriage Status in Montross
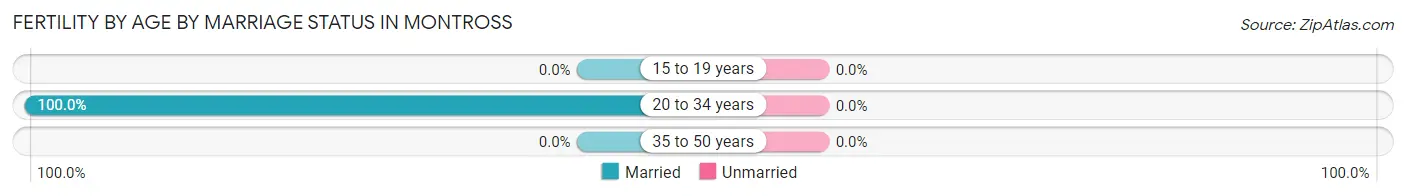
| Age Bracket | Married | Unmarried |
| 15 to 19 years | 0 (0.0%) | 0 (0.0%) |
| 20 to 34 years | 5 (100.0%) | 0 (0.0%) |
| 35 to 50 years | 0 (0.0%) | 0 (0.0%) |
| Total | 5 (100.0%) | 0 (0.0%) |
Fertility by Education in Montross
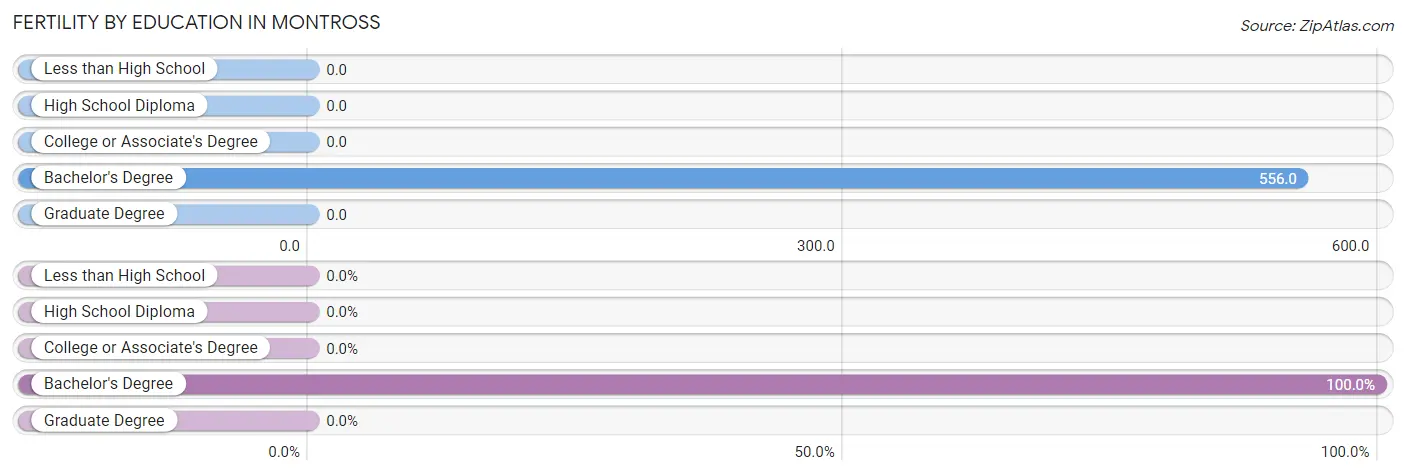
| Educational Attainment | Women with Births | Births / 1,000 Women |
| Less than High School | 0 (0.0%) | 0.0 |
| High School Diploma | 0 (0.0%) | 0.0 |
| College or Associate's Degree | 0 (0.0%) | 0.0 |
| Bachelor's Degree | 5 (100.0%) | 556.0 |
| Graduate Degree | 0 (0.0%) | 0.0 |
| Total | 5 (100.0%) | 100.0 |
Fertility by Education by Marriage Status in Montross
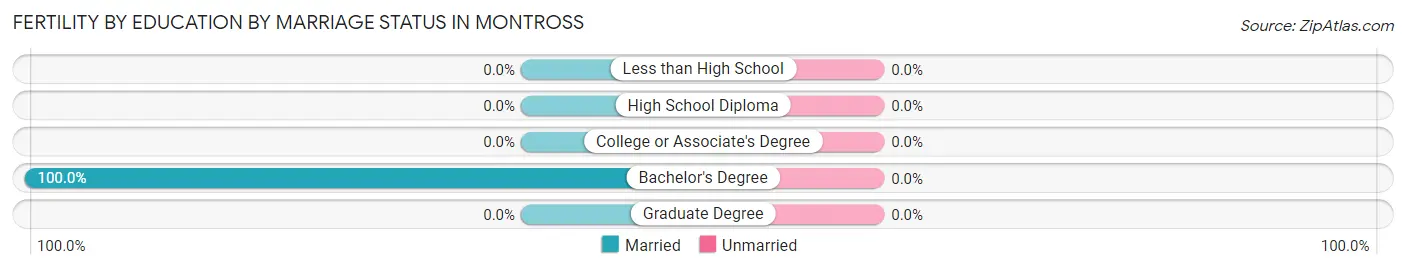
| Educational Attainment | Married | Unmarried |
| Less than High School | 0 (0.0%) | 0 (0.0%) |
| High School Diploma | 0 (0.0%) | 0 (0.0%) |
| College or Associate's Degree | 0 (0.0%) | 0 (0.0%) |
| Bachelor's Degree | 5 (100.0%) | 0 (0.0%) |
| Graduate Degree | 0 (0.0%) | 0 (0.0%) |
| Total | 5 (100.0%) | 0 (0.0%) |
Employment Characteristics in Montross
Employment by Class of Employer in Montross
Among the 214 employed individuals in Montross, local government employees (103 | 48.1%), private company employees (71 | 33.2%), and self-employed (not incorporated) (15 | 7.0%) make up the most common classes of employment.
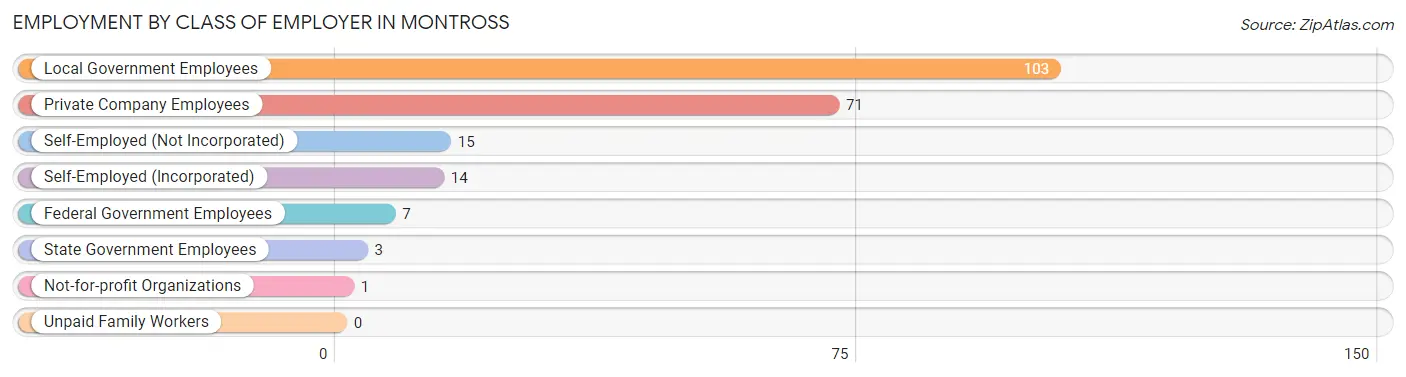
| Employer Class | # Employees | % Employees |
| Private Company Employees | 71 | 33.2% |
| Self-Employed (Incorporated) | 14 | 6.5% |
| Self-Employed (Not Incorporated) | 15 | 7.0% |
| Not-for-profit Organizations | 1 | 0.5% |
| Local Government Employees | 103 | 48.1% |
| State Government Employees | 3 | 1.4% |
| Federal Government Employees | 7 | 3.3% |
| Unpaid Family Workers | 0 | 0.0% |
| Total | 214 | 100.0% |
Employment Status by Age in Montross
According to the labor force statistics for Montross, out of the total population over 16 years of age (336), 64.3% or 216 individuals are in the labor force, with 0.9% or 2 of them unemployed. The age group with the highest labor force participation rate is 35 to 44 years, with 100.0% or 88 individuals in the labor force. Within the labor force, the 60 to 64 years age range has the highest percentage of unemployed individuals, with 22.2% or 2 of them being unemployed.
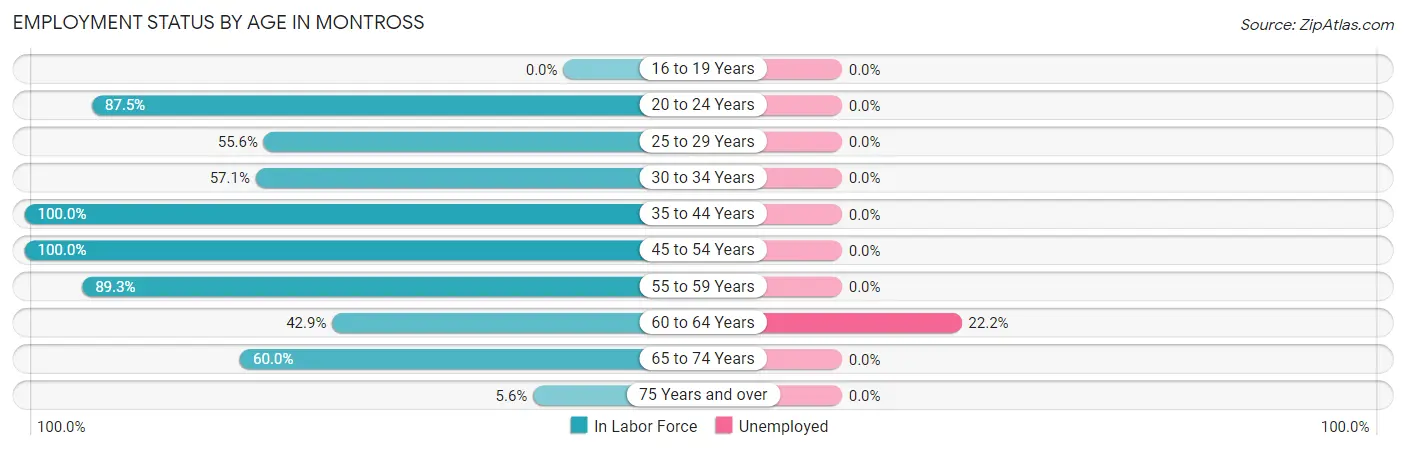
| Age Bracket | In Labor Force | Unemployed |
| 16 to 19 Years | 0 (0.0%) | 0 (0.0%) |
| 20 to 24 Years | 7 (87.5%) | 0 (0.0%) |
| 25 to 29 Years | 5 (55.6%) | 0 (0.0%) |
| 30 to 34 Years | 28 (57.1%) | 0 (0.0%) |
| 35 to 44 Years | 88 (100.0%) | 0 (0.0%) |
| 45 to 54 Years | 9 (100.0%) | 0 (0.0%) |
| 55 to 59 Years | 25 (89.3%) | 0 (0.0%) |
| 60 to 64 Years | 9 (42.9%) | 2 (22.2%) |
| 65 to 74 Years | 42 (60.0%) | 0 (0.0%) |
| 75 Years and over | 3 (5.6%) | 0 (0.0%) |
| Total | 216 (64.3%) | 2 (0.9%) |
Employment Status by Educational Attainment in Montross
According to labor force statistics for Montross, 80.4% of individuals (164) out of the total population between 25 and 64 years of age (204) are in the labor force, with 1.2% or 2 of them being unemployed. The group with the highest labor force participation rate are those with the educational attainment of high school diploma, with 91.7% or 77 individuals in the labor force. Within the labor force, individuals with less than high school education have the highest percentage of unemployment, with 66.7% or 2 of them being unemployed.
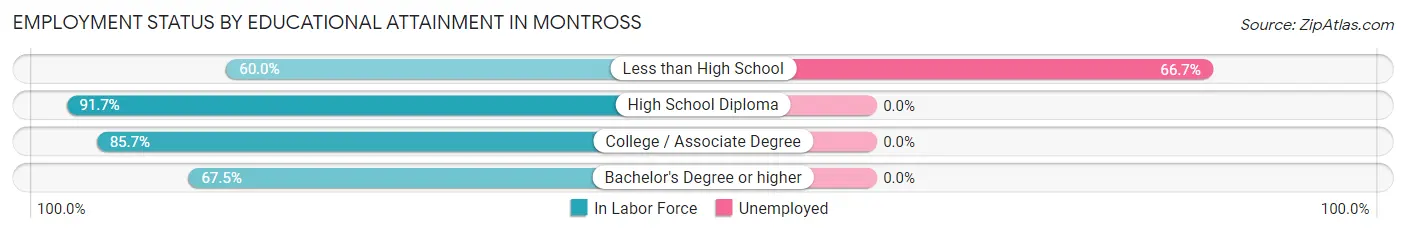
| Educational Attainment | In Labor Force | Unemployed |
| Less than High School | 3 (60.0%) | 3 (66.7%) |
| High School Diploma | 77 (91.7%) | 0 (0.0%) |
| College / Associate Degree | 30 (85.7%) | 0 (0.0%) |
| Bachelor's Degree or higher | 54 (67.5%) | 0 (0.0%) |
| Total | 164 (80.4%) | 2 (1.2%) |
Employment Occupations by Sex in Montross
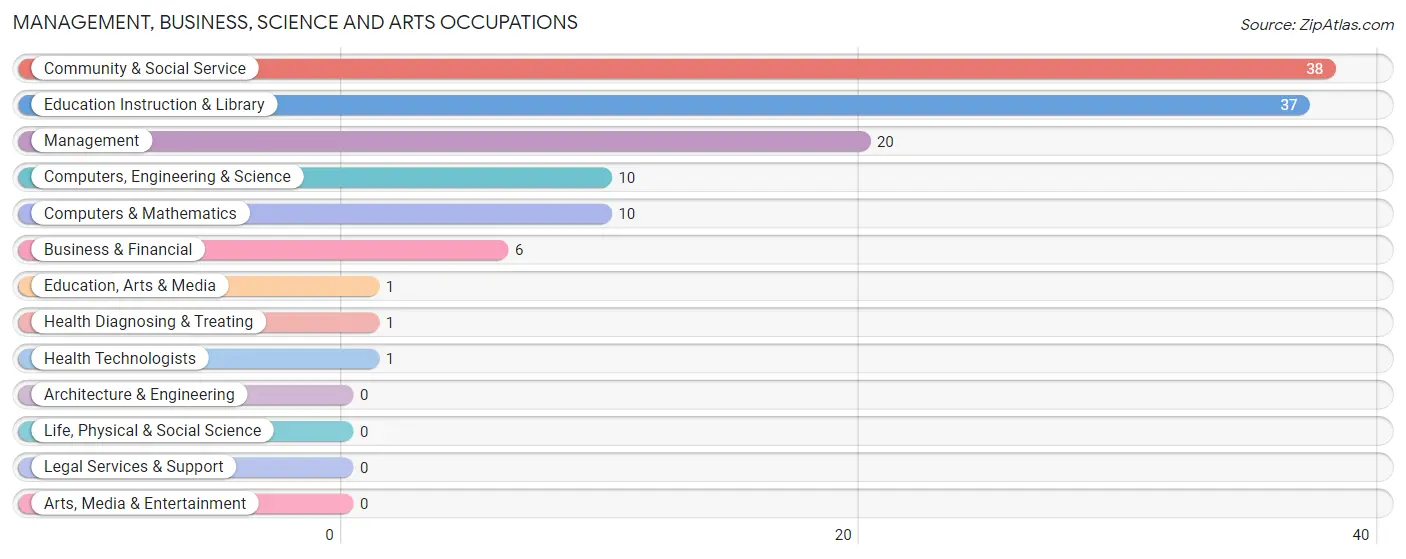
Management, Business, Science and Arts Occupations
The most common Management, Business, Science and Arts occupations in Montross are Community & Social Service (38 | 17.8%), Education Instruction & Library (37 | 17.3%), Management (20 | 9.3%), Computers, Engineering & Science (10 | 4.7%), and Computers & Mathematics (10 | 4.7%).
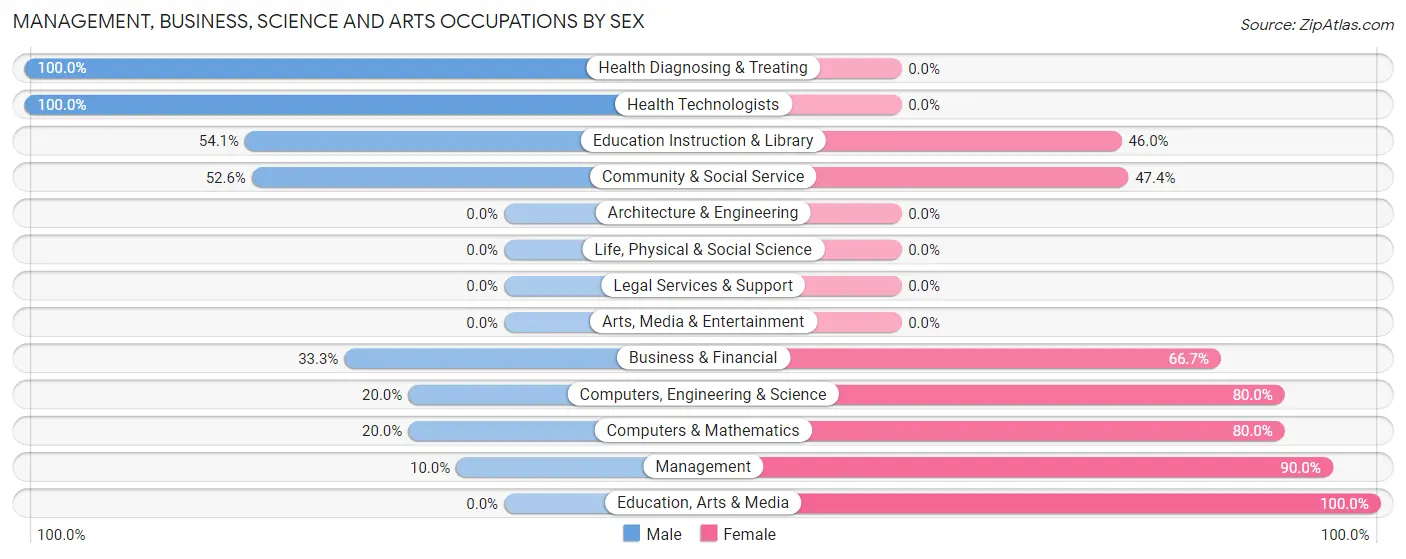
Management, Business, Science and Arts Occupations by Sex
Within the Management, Business, Science and Arts occupations in Montross, the most male-oriented occupations are Health Diagnosing & Treating (100.0%), Health Technologists (100.0%), and Education Instruction & Library (54.0%), while the most female-oriented occupations are Education, Arts & Media (100.0%), Management (90.0%), and Computers, Engineering & Science (80.0%).
| Occupation | Male | Female |
| Management | 2 (10.0%) | 18 (90.0%) |
| Business & Financial | 2 (33.3%) | 4 (66.7%) |
| Computers, Engineering & Science | 2 (20.0%) | 8 (80.0%) |
| Computers & Mathematics | 2 (20.0%) | 8 (80.0%) |
| Architecture & Engineering | 0 (0.0%) | 0 (0.0%) |
| Life, Physical & Social Science | 0 (0.0%) | 0 (0.0%) |
| Community & Social Service | 20 (52.6%) | 18 (47.4%) |
| Education, Arts & Media | 0 (0.0%) | 1 (100.0%) |
| Legal Services & Support | 0 (0.0%) | 0 (0.0%) |
| Education Instruction & Library | 20 (54.0%) | 17 (46.0%) |
| Arts, Media & Entertainment | 0 (0.0%) | 0 (0.0%) |
| Health Diagnosing & Treating | 1 (100.0%) | 0 (0.0%) |
| Health Technologists | 1 (100.0%) | 0 (0.0%) |
| Total (Category) | 27 (36.0%) | 48 (64.0%) |
| Total (Overall) | 132 (61.7%) | 82 (38.3%) |
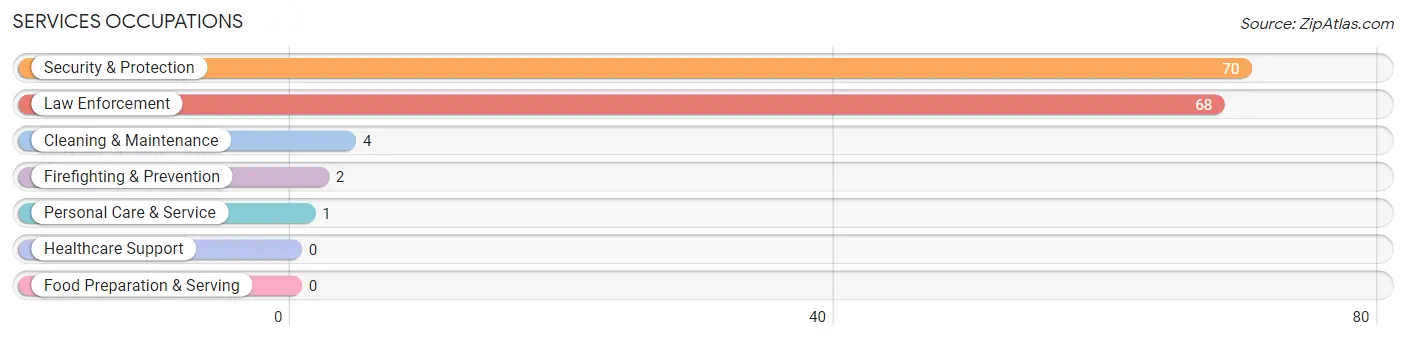
Services Occupations
The most common Services occupations in Montross are Security & Protection (70 | 32.7%), Law Enforcement (68 | 31.8%), Cleaning & Maintenance (4 | 1.9%), Firefighting & Prevention (2 | 0.9%), and Personal Care & Service (1 | 0.5%).
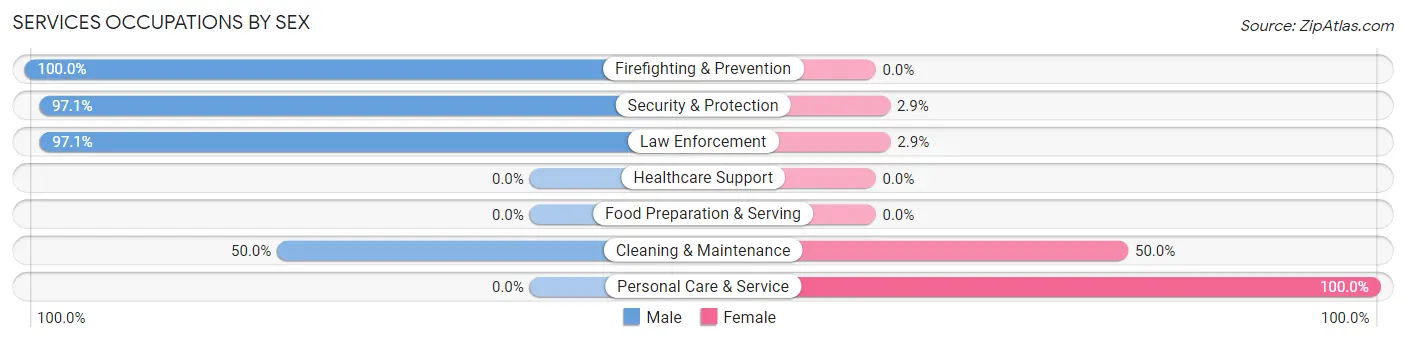
Services Occupations by Sex
Within the Services occupations in Montross, the most male-oriented occupations are Firefighting & Prevention (100.0%), Security & Protection (97.1%), and Law Enforcement (97.1%), while the most female-oriented occupations are Personal Care & Service (100.0%), Cleaning & Maintenance (50.0%), and Law Enforcement (2.9%).
| Occupation | Male | Female |
| Healthcare Support | 0 (0.0%) | 0 (0.0%) |
| Security & Protection | 68 (97.1%) | 2 (2.9%) |
| Firefighting & Prevention | 2 (100.0%) | 0 (0.0%) |
| Law Enforcement | 66 (97.1%) | 2 (2.9%) |
| Food Preparation & Serving | 0 (0.0%) | 0 (0.0%) |
| Cleaning & Maintenance | 2 (50.0%) | 2 (50.0%) |
| Personal Care & Service | 0 (0.0%) | 1 (100.0%) |
| Total (Category) | 70 (93.3%) | 5 (6.7%) |
| Total (Overall) | 132 (61.7%) | 82 (38.3%) |
Sales and Office Occupations
The most common Sales and Office occupations in Montross are Sales & Related (22 | 10.3%), and Office & Administration (8 | 3.7%).
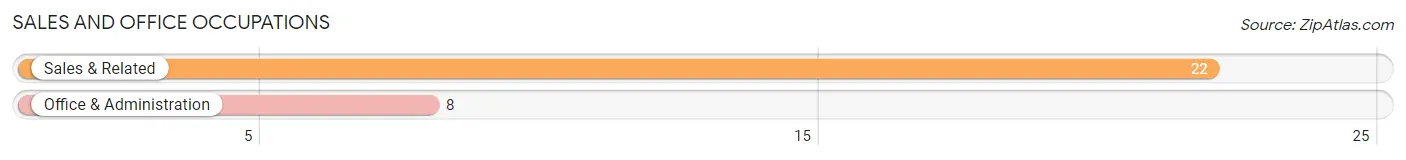
Sales and Office Occupations by Sex
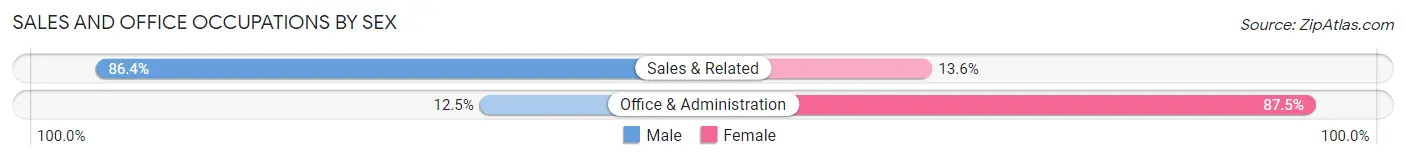
| Occupation | Male | Female |
| Sales & Related | 19 (86.4%) | 3 (13.6%) |
| Office & Administration | 1 (12.5%) | 7 (87.5%) |
| Total (Category) | 20 (66.7%) | 10 (33.3%) |
| Total (Overall) | 132 (61.7%) | 82 (38.3%) |
Natural Resources, Construction and Maintenance Occupations
The most common Natural Resources, Construction and Maintenance occupations in Montross are Installation, Maintenance & Repair (5 | 2.3%), and Construction & Extraction (4 | 1.9%).
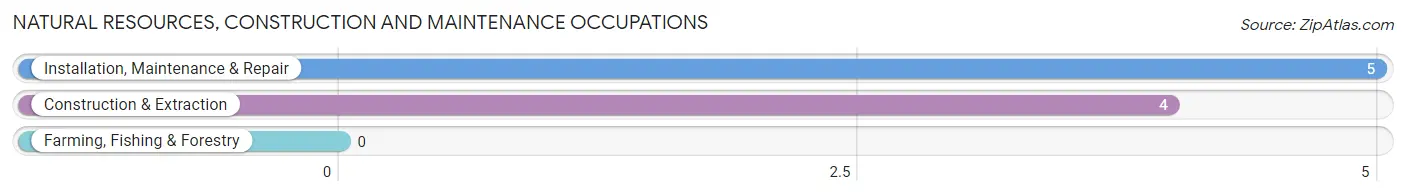
Natural Resources, Construction and Maintenance Occupations by Sex
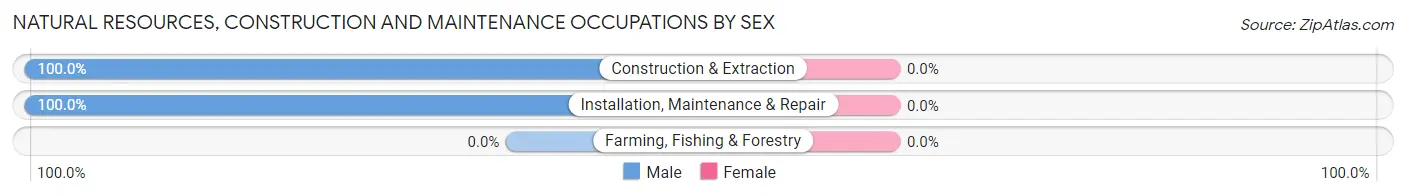
| Occupation | Male | Female |
| Farming, Fishing & Forestry | 0 (0.0%) | 0 (0.0%) |
| Construction & Extraction | 4 (100.0%) | 0 (0.0%) |
| Installation, Maintenance & Repair | 5 (100.0%) | 0 (0.0%) |
| Total (Category) | 9 (100.0%) | 0 (0.0%) |
| Total (Overall) | 132 (61.7%) | 82 (38.3%) |
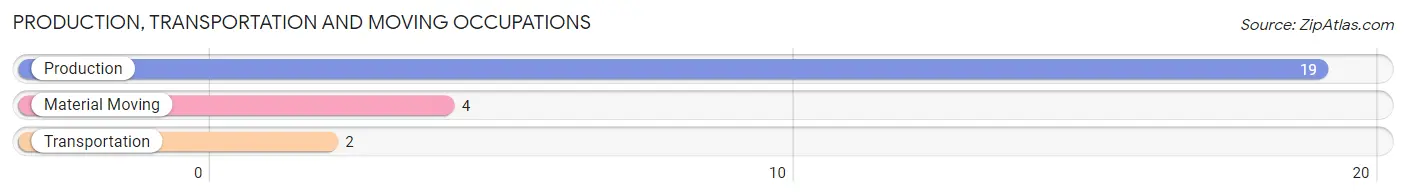
Production, Transportation and Moving Occupations
The most common Production, Transportation and Moving occupations in Montross are Production (19 | 8.9%), Material Moving (4 | 1.9%), and Transportation (2 | 0.9%).
Production, Transportation and Moving Occupations by Sex
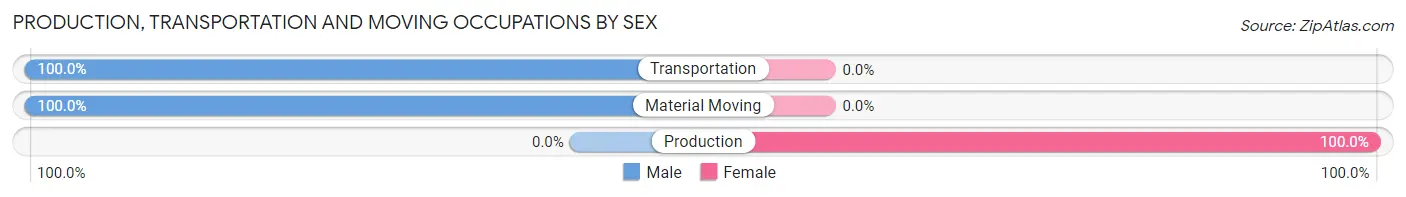
| Occupation | Male | Female |
| Production | 0 (0.0%) | 19 (100.0%) |
| Transportation | 2 (100.0%) | 0 (0.0%) |
| Material Moving | 4 (100.0%) | 0 (0.0%) |
| Total (Category) | 6 (24.0%) | 19 (76.0%) |
| Total (Overall) | 132 (61.7%) | 82 (38.3%) |
Employment Industries by Sex in Montross
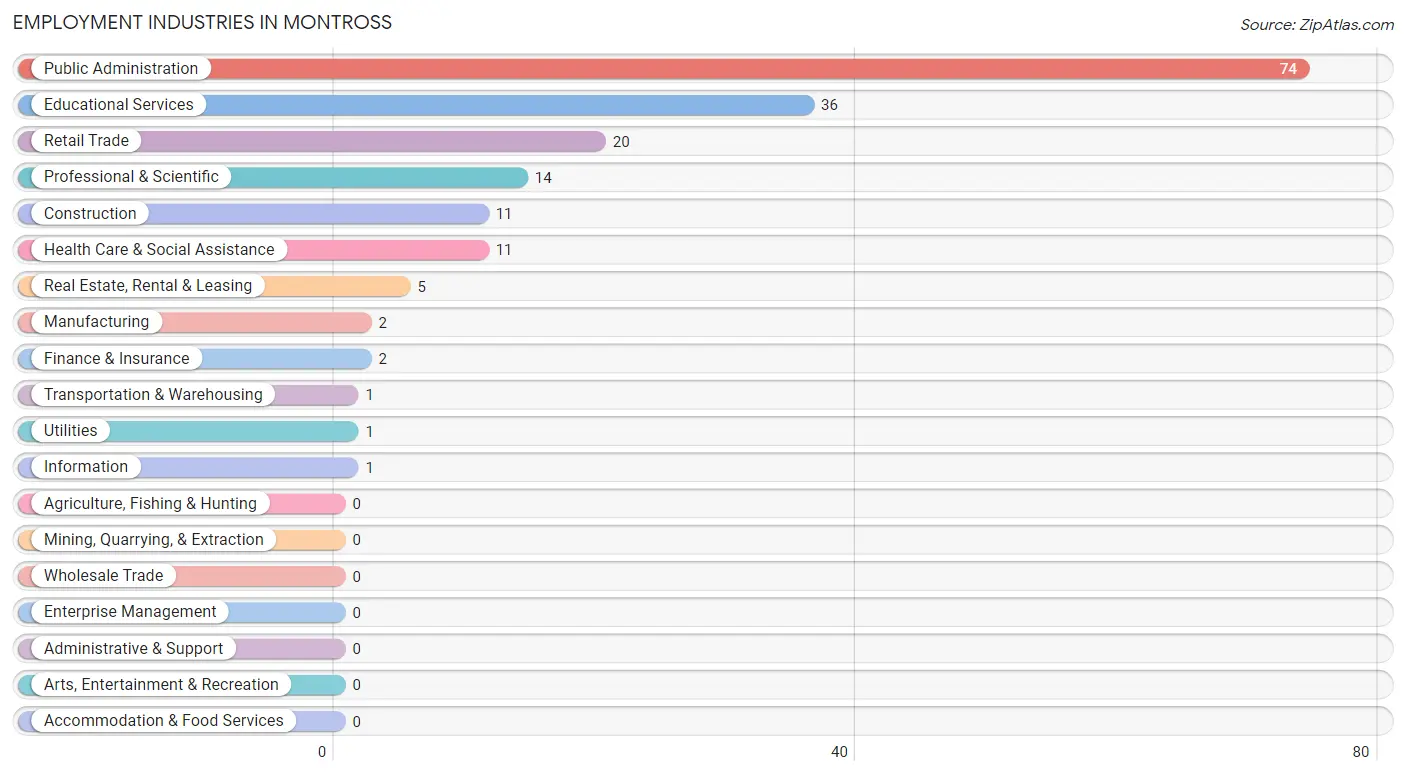
Employment Industries in Montross
The major employment industries in Montross include Public Administration (74 | 34.6%), Educational Services (36 | 16.8%), Retail Trade (20 | 9.3%), Professional & Scientific (14 | 6.5%), and Construction (11 | 5.1%).
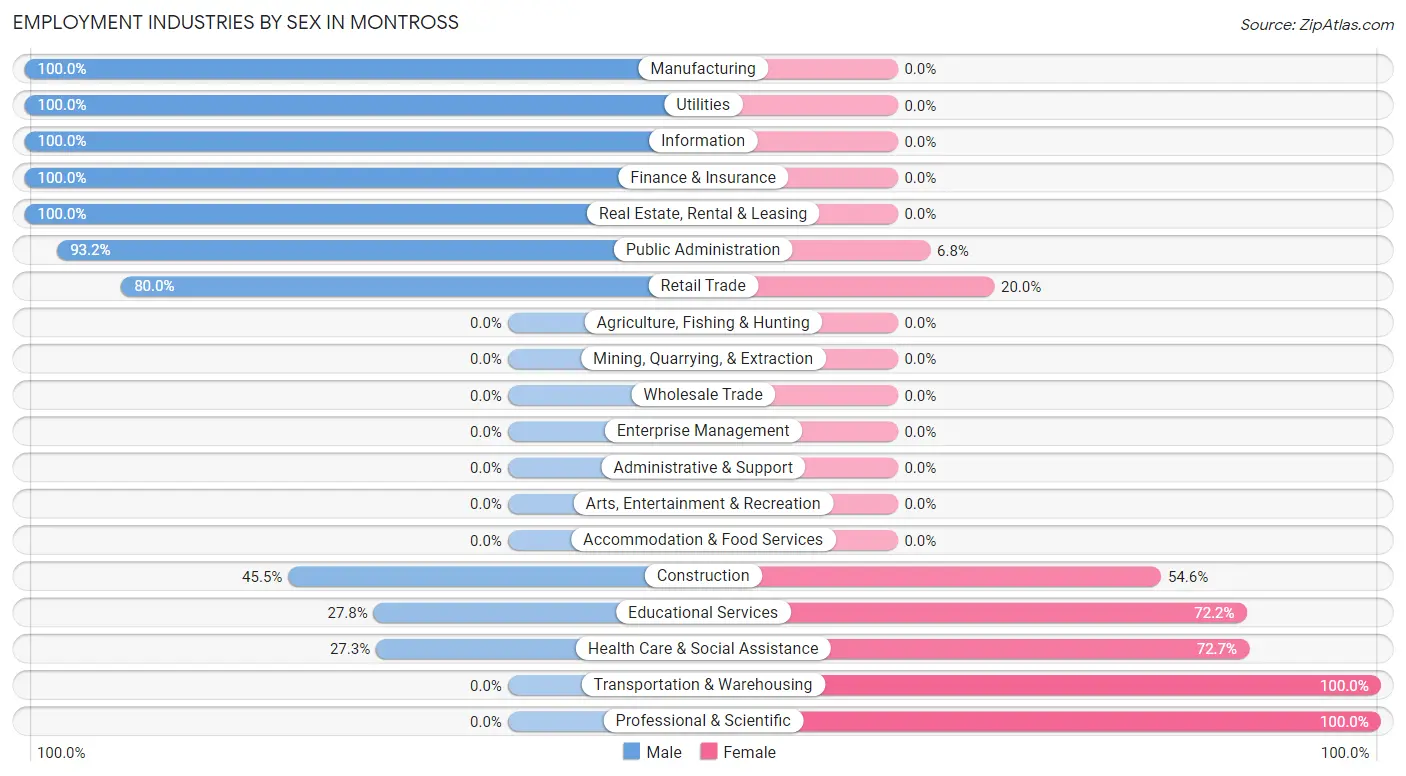
Employment Industries by Sex in Montross
The Montross industries that see more men than women are Manufacturing (100.0%), Utilities (100.0%), and Information (100.0%), whereas the industries that tend to have a higher number of women are Transportation & Warehousing (100.0%), Professional & Scientific (100.0%), and Health Care & Social Assistance (72.7%).
| Industry | Male | Female |
| Agriculture, Fishing & Hunting | 0 (0.0%) | 0 (0.0%) |
| Mining, Quarrying, & Extraction | 0 (0.0%) | 0 (0.0%) |
| Construction | 5 (45.5%) | 6 (54.5%) |
| Manufacturing | 2 (100.0%) | 0 (0.0%) |
| Wholesale Trade | 0 (0.0%) | 0 (0.0%) |
| Retail Trade | 16 (80.0%) | 4 (20.0%) |
| Transportation & Warehousing | 0 (0.0%) | 1 (100.0%) |
| Utilities | 1 (100.0%) | 0 (0.0%) |
| Information | 1 (100.0%) | 0 (0.0%) |
| Finance & Insurance | 2 (100.0%) | 0 (0.0%) |
| Real Estate, Rental & Leasing | 5 (100.0%) | 0 (0.0%) |
| Professional & Scientific | 0 (0.0%) | 14 (100.0%) |
| Enterprise Management | 0 (0.0%) | 0 (0.0%) |
| Administrative & Support | 0 (0.0%) | 0 (0.0%) |
| Educational Services | 10 (27.8%) | 26 (72.2%) |
| Health Care & Social Assistance | 3 (27.3%) | 8 (72.7%) |
| Arts, Entertainment & Recreation | 0 (0.0%) | 0 (0.0%) |
| Accommodation & Food Services | 0 (0.0%) | 0 (0.0%) |
| Public Administration | 69 (93.2%) | 5 (6.8%) |
| Total | 132 (61.7%) | 82 (38.3%) |
Education in Montross
School Enrollment in Montross
The most common levels of schooling among the 30 students in Montross are elementary school (12 | 40.0%), middle school (7 | 23.3%), and graduate / professional (5 | 16.7%).
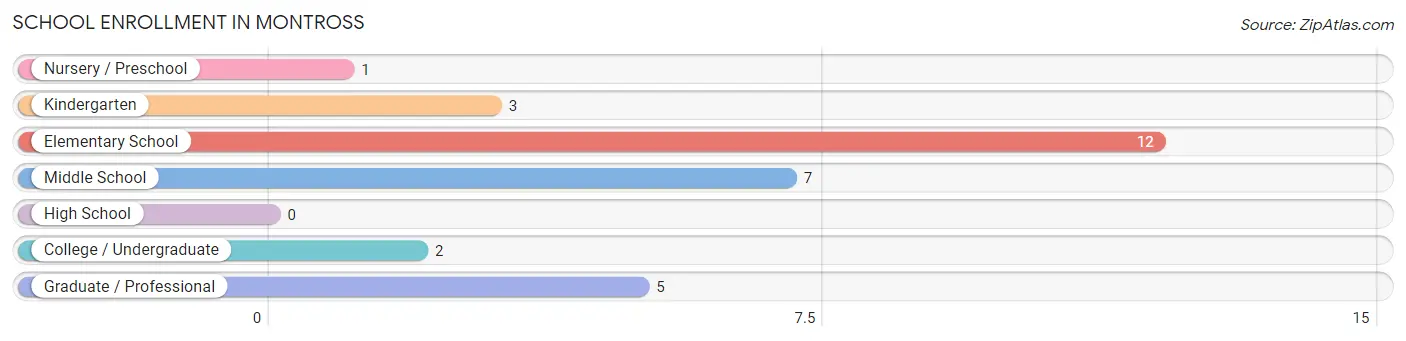
| School Level | # Students | % Students |
| Nursery / Preschool | 1 | 3.3% |
| Kindergarten | 3 | 10.0% |
| Elementary School | 12 | 40.0% |
| Middle School | 7 | 23.3% |
| High School | 0 | 0.0% |
| College / Undergraduate | 2 | 6.7% |
| Graduate / Professional | 5 | 16.7% |
| Total | 30 | 100.0% |
School Enrollment by Age by Funding Source in Montross
Out of a total of 30 students who are enrolled in schools in Montross, 3 (10.0%) attend a private institution, while the remaining 27 (90.0%) are enrolled in public schools. The age group of 20 to 24 year olds has the highest likelihood of being enrolled in private schools, with 1 (100.0% in the age bracket) enrolled. Conversely, the age group of 10 to 14 year olds has the lowest likelihood of being enrolled in a private school, with 1 (100.0% in the age bracket) attending a public institution.
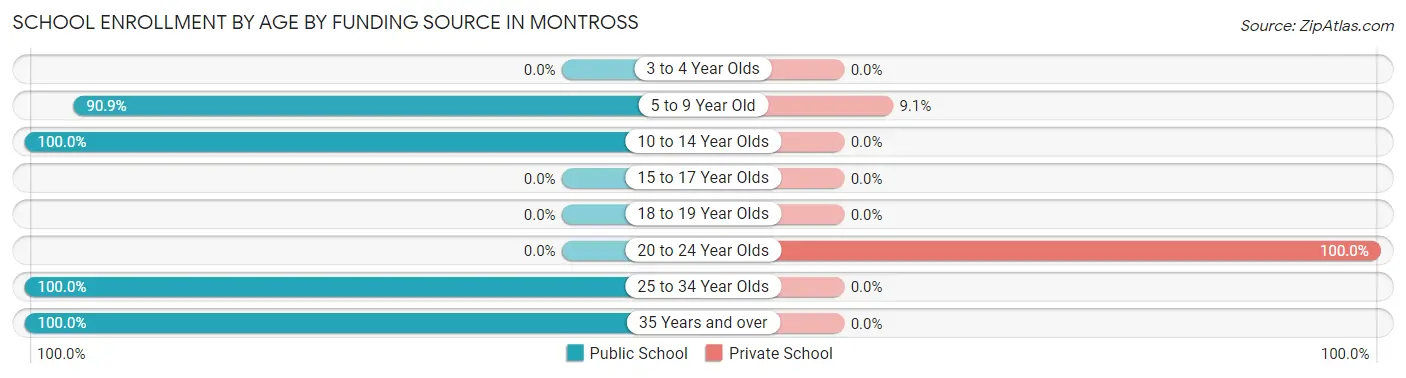
| Age Bracket | Public School | Private School |
| 3 to 4 Year Olds | 0 (0.0%) | 0 (0.0%) |
| 5 to 9 Year Old | 20 (90.9%) | 2 (9.1%) |
| 10 to 14 Year Olds | 1 (100.0%) | 0 (0.0%) |
| 15 to 17 Year Olds | 0 (0.0%) | 0 (0.0%) |
| 18 to 19 Year Olds | 0 (0.0%) | 0 (0.0%) |
| 20 to 24 Year Olds | 0 (0.0%) | 1 (100.0%) |
| 25 to 34 Year Olds | 5 (100.0%) | 0 (0.0%) |
| 35 Years and over | 1 (100.0%) | 0 (0.0%) |
| Total | 27 (90.0%) | 3 (10.0%) |
Educational Attainment by Field of Study in Montross
Literature & languages (24 | 19.2%), education (20 | 16.0%), business (18 | 14.4%), multidisciplinary studies (13 | 10.4%), and computers & mathematics (8 | 6.4%) are the most common fields of study among 125 individuals in Montross who have obtained a bachelor's degree or higher.
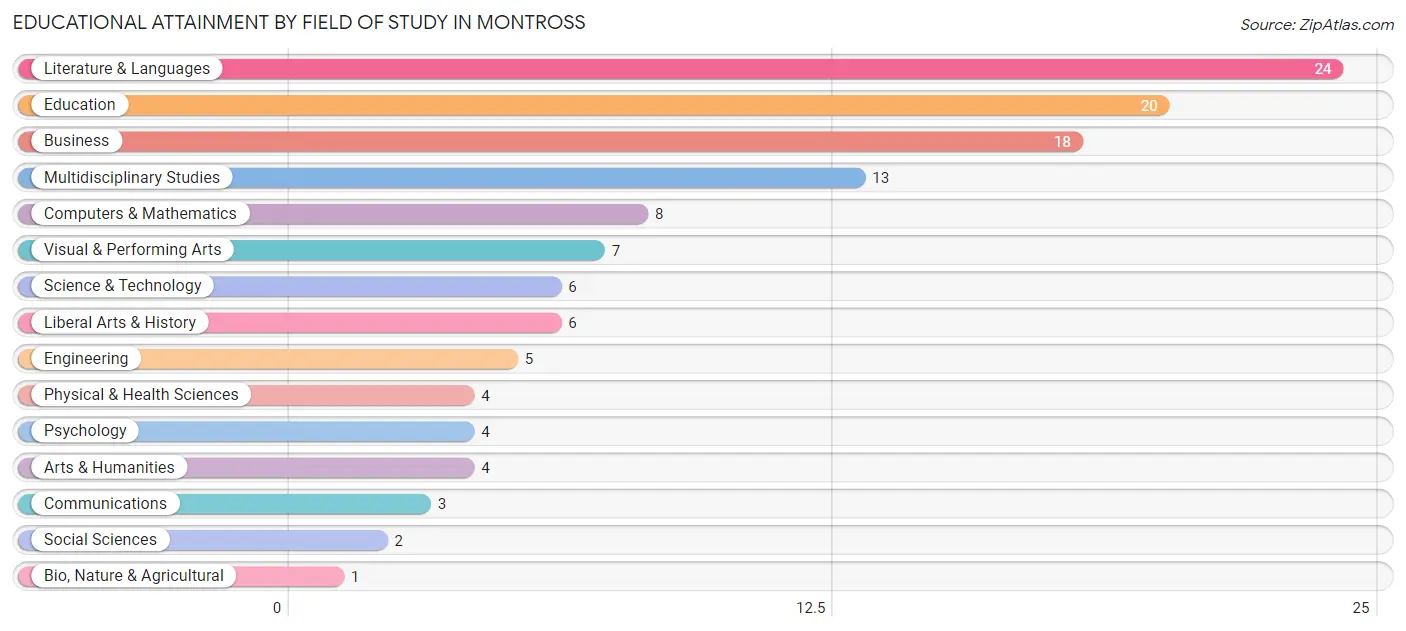
| Field of Study | # Graduates | % Graduates |
| Computers & Mathematics | 8 | 6.4% |
| Bio, Nature & Agricultural | 1 | 0.8% |
| Physical & Health Sciences | 4 | 3.2% |
| Psychology | 4 | 3.2% |
| Social Sciences | 2 | 1.6% |
| Engineering | 5 | 4.0% |
| Multidisciplinary Studies | 13 | 10.4% |
| Science & Technology | 6 | 4.8% |
| Business | 18 | 14.4% |
| Education | 20 | 16.0% |
| Literature & Languages | 24 | 19.2% |
| Liberal Arts & History | 6 | 4.8% |
| Visual & Performing Arts | 7 | 5.6% |
| Communications | 3 | 2.4% |
| Arts & Humanities | 4 | 3.2% |
| Total | 125 | 100.0% |
Transportation & Commute in Montross
Vehicle Availability by Sex in Montross
The most prevalent vehicle ownership categories in Montross are males with 5 or more vehicles (63, accounting for 47.7%) and females with 5 or more vehicles (6, making up 76.8%).
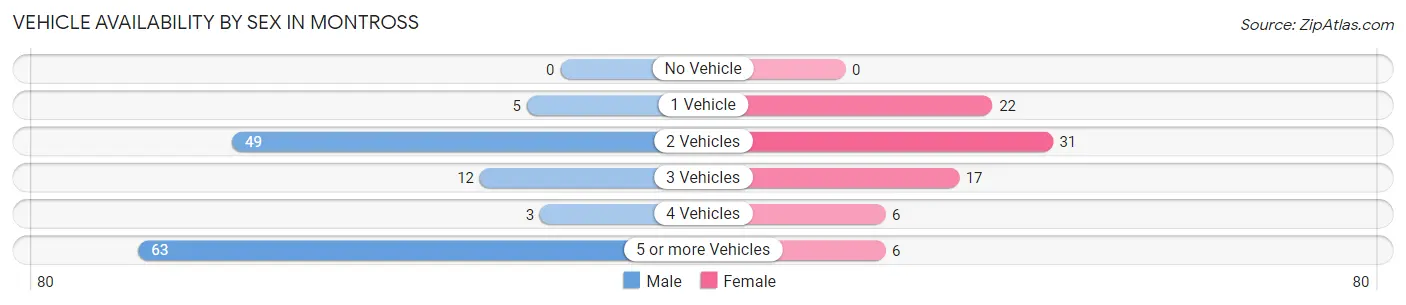
| Vehicles Available | Male | Female |
| No Vehicle | 0 (0.0%) | 0 (0.0%) |
| 1 Vehicle | 5 (3.8%) | 22 (26.8%) |
| 2 Vehicles | 49 (37.1%) | 31 (37.8%) |
| 3 Vehicles | 12 (9.1%) | 17 (20.7%) |
| 4 Vehicles | 3 (2.3%) | 6 (7.3%) |
| 5 or more Vehicles | 63 (47.7%) | 6 (7.3%) |
| Total | 132 (100.0%) | 82 (100.0%) |
Commute Time in Montross
The most frequently occuring commute durations in Montross are 10 to 14 minutes (63 commuters, 32.0%), 5 to 9 minutes (53 commuters, 26.9%), and 45 to 59 minutes (22 commuters, 11.2%).
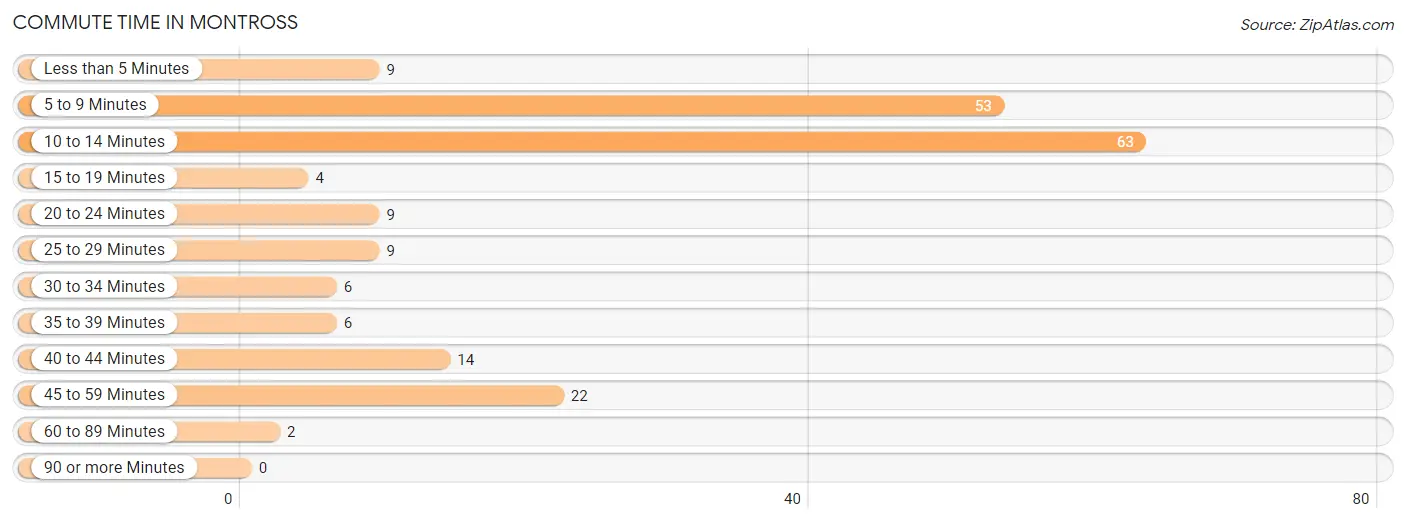
| Commute Time | # Commuters | % Commuters |
| Less than 5 Minutes | 9 | 4.6% |
| 5 to 9 Minutes | 53 | 26.9% |
| 10 to 14 Minutes | 63 | 32.0% |
| 15 to 19 Minutes | 4 | 2.0% |
| 20 to 24 Minutes | 9 | 4.6% |
| 25 to 29 Minutes | 9 | 4.6% |
| 30 to 34 Minutes | 6 | 3.0% |
| 35 to 39 Minutes | 6 | 3.0% |
| 40 to 44 Minutes | 14 | 7.1% |
| 45 to 59 Minutes | 22 | 11.2% |
| 60 to 89 Minutes | 2 | 1.0% |
| 90 or more Minutes | 0 | 0.0% |
Commute Time by Sex in Montross
The most common commute times in Montross are 10 to 14 minutes (63 commuters, 50.8%) for males and 5 to 9 minutes (32 commuters, 43.8%) for females.
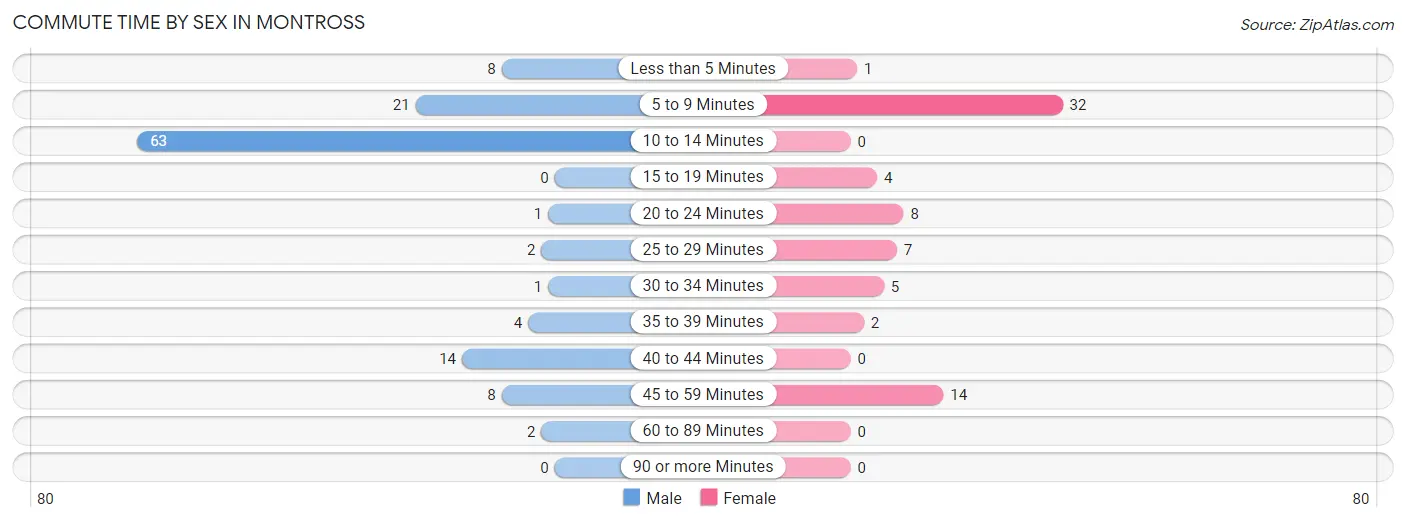
| Commute Time | Male | Female |
| Less than 5 Minutes | 8 (6.5%) | 1 (1.4%) |
| 5 to 9 Minutes | 21 (16.9%) | 32 (43.8%) |
| 10 to 14 Minutes | 63 (50.8%) | 0 (0.0%) |
| 15 to 19 Minutes | 0 (0.0%) | 4 (5.5%) |
| 20 to 24 Minutes | 1 (0.8%) | 8 (11.0%) |
| 25 to 29 Minutes | 2 (1.6%) | 7 (9.6%) |
| 30 to 34 Minutes | 1 (0.8%) | 5 (6.9%) |
| 35 to 39 Minutes | 4 (3.2%) | 2 (2.7%) |
| 40 to 44 Minutes | 14 (11.3%) | 0 (0.0%) |
| 45 to 59 Minutes | 8 (6.5%) | 14 (19.2%) |
| 60 to 89 Minutes | 2 (1.6%) | 0 (0.0%) |
| 90 or more Minutes | 0 (0.0%) | 0 (0.0%) |
Time of Departure to Work by Sex in Montross
The most frequent times of departure to work in Montross are 7:30 AM to 7:59 AM (73, 58.9%) for males and 7:00 AM to 7:29 AM (23, 31.5%) for females.
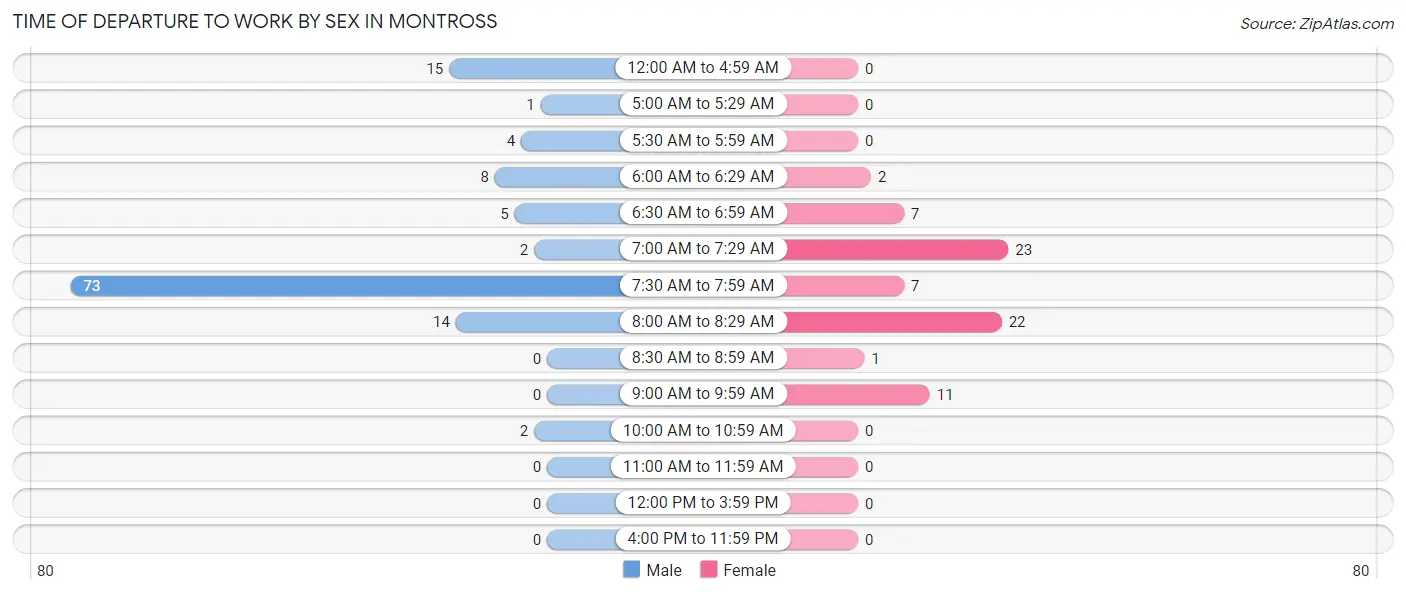
| Time of Departure | Male | Female |
| 12:00 AM to 4:59 AM | 15 (12.1%) | 0 (0.0%) |
| 5:00 AM to 5:29 AM | 1 (0.8%) | 0 (0.0%) |
| 5:30 AM to 5:59 AM | 4 (3.2%) | 0 (0.0%) |
| 6:00 AM to 6:29 AM | 8 (6.5%) | 2 (2.7%) |
| 6:30 AM to 6:59 AM | 5 (4.0%) | 7 (9.6%) |
| 7:00 AM to 7:29 AM | 2 (1.6%) | 23 (31.5%) |
| 7:30 AM to 7:59 AM | 73 (58.9%) | 7 (9.6%) |
| 8:00 AM to 8:29 AM | 14 (11.3%) | 22 (30.1%) |
| 8:30 AM to 8:59 AM | 0 (0.0%) | 1 (1.4%) |
| 9:00 AM to 9:59 AM | 0 (0.0%) | 11 (15.1%) |
| 10:00 AM to 10:59 AM | 2 (1.6%) | 0 (0.0%) |
| 11:00 AM to 11:59 AM | 0 (0.0%) | 0 (0.0%) |
| 12:00 PM to 3:59 PM | 0 (0.0%) | 0 (0.0%) |
| 4:00 PM to 11:59 PM | 0 (0.0%) | 0 (0.0%) |
| Total | 124 (100.0%) | 73 (100.0%) |
Housing Occupancy in Montross
Occupancy by Ownership in Montross
Of the total 167 dwellings in Montross, owner-occupied units account for 109 (65.3%), while renter-occupied units make up 58 (34.7%).
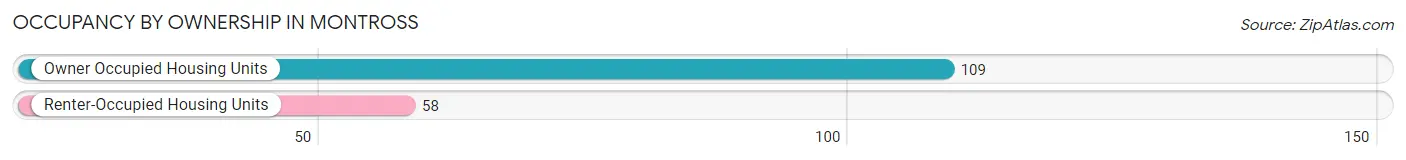
| Occupancy | # Housing Units | % Housing Units |
| Owner Occupied Housing Units | 109 | 65.3% |
| Renter-Occupied Housing Units | 58 | 34.7% |
| Total Occupied Housing Units | 167 | 100.0% |
Occupancy by Household Size in Montross
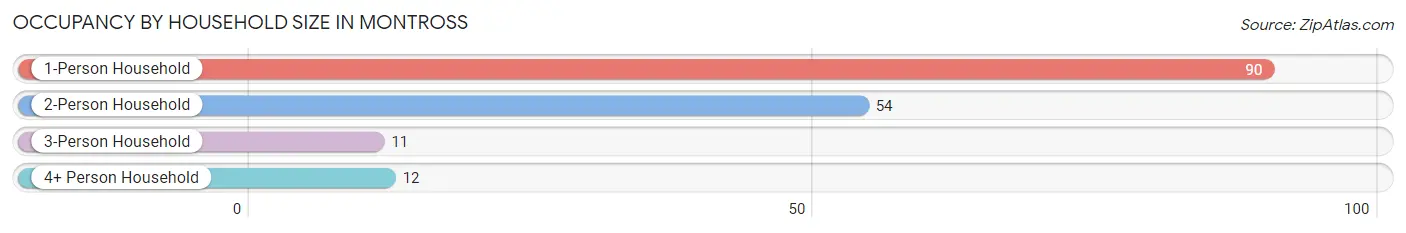
| Household Size | # Housing Units | % Housing Units |
| 1-Person Household | 90 | 53.9% |
| 2-Person Household | 54 | 32.3% |
| 3-Person Household | 11 | 6.6% |
| 4+ Person Household | 12 | 7.2% |
| Total Housing Units | 167 | 100.0% |
Occupancy by Ownership by Household Size in Montross
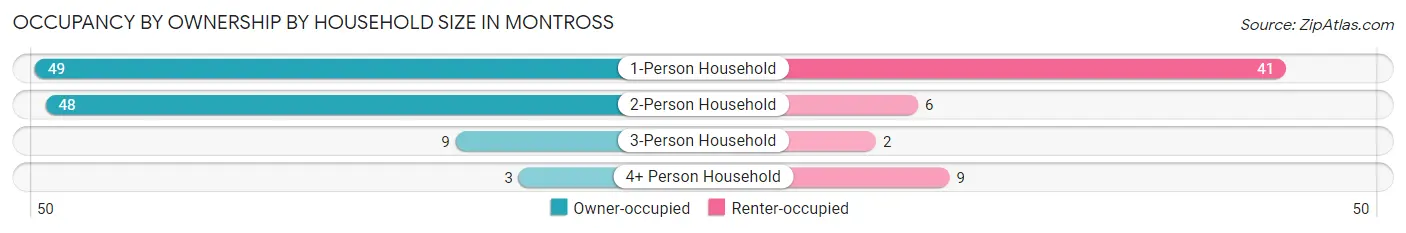
| Household Size | Owner-occupied | Renter-occupied |
| 1-Person Household | 49 (54.4%) | 41 (45.6%) |
| 2-Person Household | 48 (88.9%) | 6 (11.1%) |
| 3-Person Household | 9 (81.8%) | 2 (18.2%) |
| 4+ Person Household | 3 (25.0%) | 9 (75.0%) |
| Total Housing Units | 109 (65.3%) | 58 (34.7%) |
Occupancy by Educational Attainment in Montross
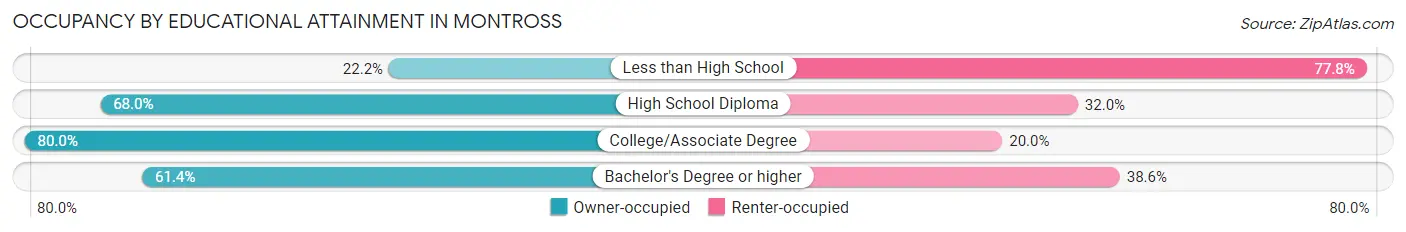
| Household Size | Owner-occupied | Renter-occupied |
| Less than High School | 4 (22.2%) | 14 (77.8%) |
| High School Diploma | 34 (68.0%) | 16 (32.0%) |
| College/Associate Degree | 44 (80.0%) | 11 (20.0%) |
| Bachelor's Degree or higher | 27 (61.4%) | 17 (38.6%) |
Occupancy by Age of Householder in Montross
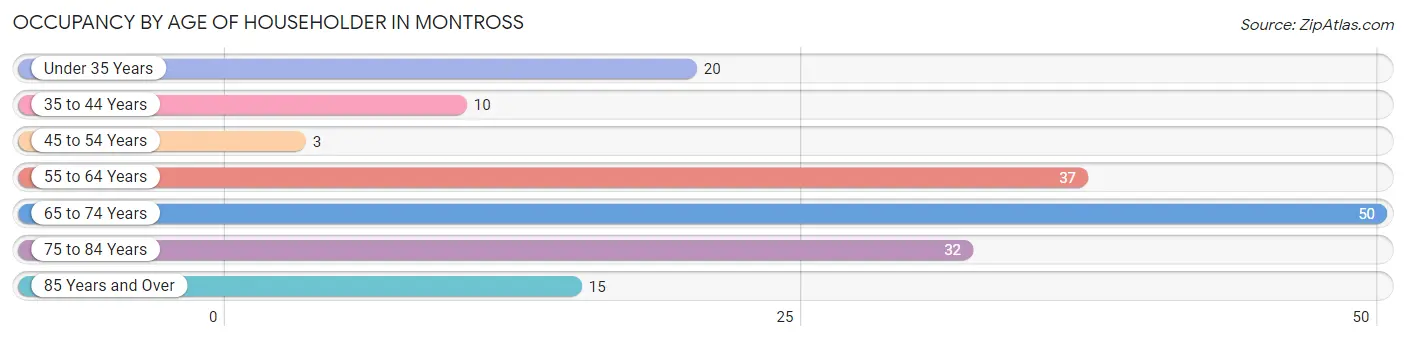
| Age Bracket | # Households | % Households |
| Under 35 Years | 20 | 12.0% |
| 35 to 44 Years | 10 | 6.0% |
| 45 to 54 Years | 3 | 1.8% |
| 55 to 64 Years | 37 | 22.2% |
| 65 to 74 Years | 50 | 29.9% |
| 75 to 84 Years | 32 | 19.2% |
| 85 Years and Over | 15 | 9.0% |
| Total | 167 | 100.0% |
Housing Finances in Montross
Median Income by Occupancy in Montross
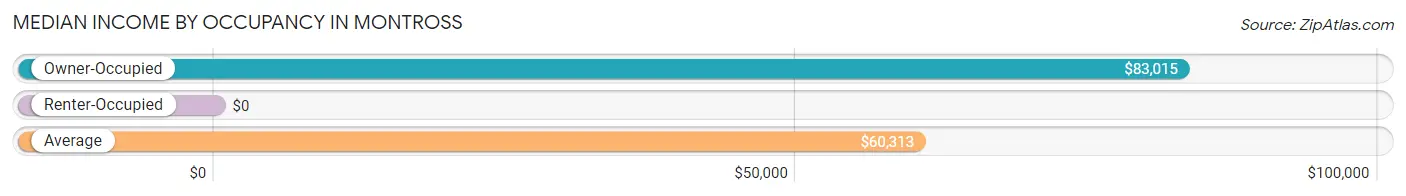
| Occupancy Type | # Households | Median Income |
| Owner-Occupied | 109 (65.3%) | $83,015 |
| Renter-Occupied | 58 (34.7%) | $0 |
| Average | 167 (100.0%) | $60,313 |
Occupancy by Householder Income Bracket in Montross
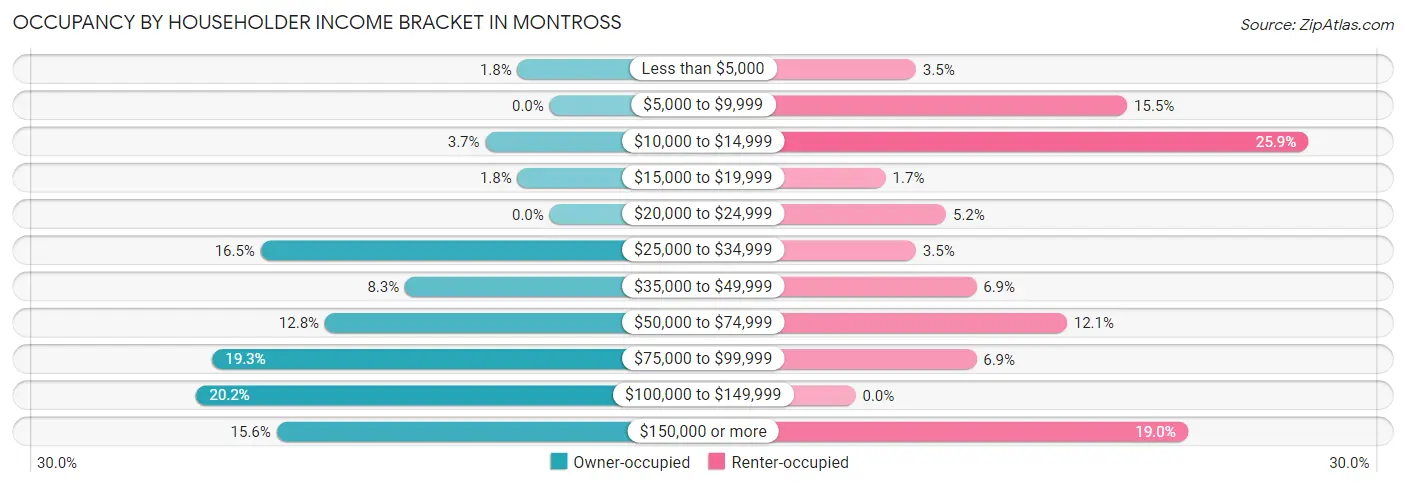
| Income Bracket | Owner-occupied | Renter-occupied |
| Less than $5,000 | 2 (1.8%) | 2 (3.5%) |
| $5,000 to $9,999 | 0 (0.0%) | 9 (15.5%) |
| $10,000 to $14,999 | 4 (3.7%) | 15 (25.9%) |
| $15,000 to $19,999 | 2 (1.8%) | 1 (1.7%) |
| $20,000 to $24,999 | 0 (0.0%) | 3 (5.2%) |
| $25,000 to $34,999 | 18 (16.5%) | 2 (3.5%) |
| $35,000 to $49,999 | 9 (8.3%) | 4 (6.9%) |
| $50,000 to $74,999 | 14 (12.8%) | 7 (12.1%) |
| $75,000 to $99,999 | 21 (19.3%) | 4 (6.9%) |
| $100,000 to $149,999 | 22 (20.2%) | 0 (0.0%) |
| $150,000 or more | 17 (15.6%) | 11 (19.0%) |
| Total | 109 (100.0%) | 58 (100.0%) |
Monthly Housing Cost Tiers in Montross
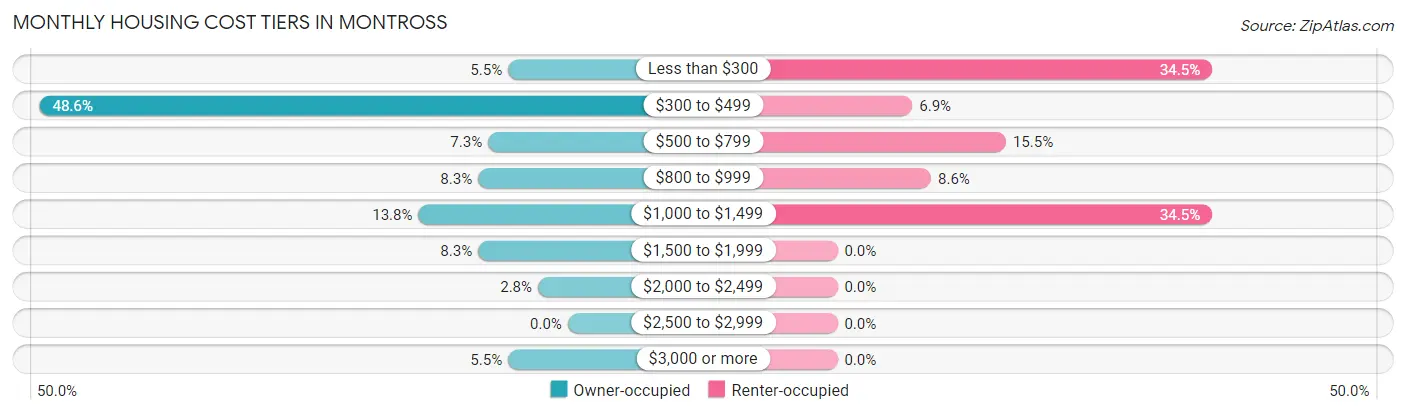
| Monthly Cost | Owner-occupied | Renter-occupied |
| Less than $300 | 6 (5.5%) | 20 (34.5%) |
| $300 to $499 | 53 (48.6%) | 4 (6.9%) |
| $500 to $799 | 8 (7.3%) | 9 (15.5%) |
| $800 to $999 | 9 (8.3%) | 5 (8.6%) |
| $1,000 to $1,499 | 15 (13.8%) | 20 (34.5%) |
| $1,500 to $1,999 | 9 (8.3%) | 0 (0.0%) |
| $2,000 to $2,499 | 3 (2.8%) | 0 (0.0%) |
| $2,500 to $2,999 | 0 (0.0%) | 0 (0.0%) |
| $3,000 or more | 6 (5.5%) | 0 (0.0%) |
| Total | 109 (100.0%) | 58 (100.0%) |
Physical Housing Characteristics in Montross
Housing Structures in Montross
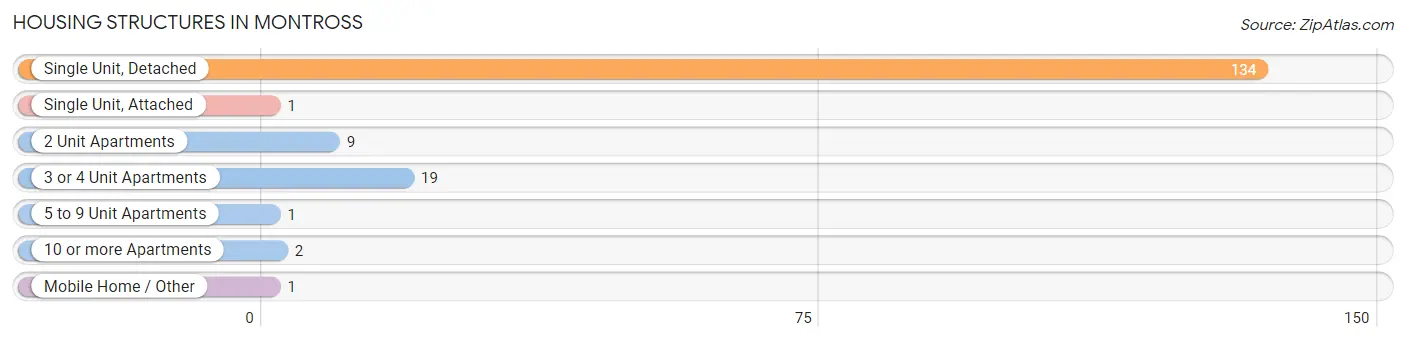
| Structure Type | # Housing Units | % Housing Units |
| Single Unit, Detached | 134 | 80.2% |
| Single Unit, Attached | 1 | 0.6% |
| 2 Unit Apartments | 9 | 5.4% |
| 3 or 4 Unit Apartments | 19 | 11.4% |
| 5 to 9 Unit Apartments | 1 | 0.6% |
| 10 or more Apartments | 2 | 1.2% |
| Mobile Home / Other | 1 | 0.6% |
| Total | 167 | 100.0% |
Housing Structures by Occupancy in Montross
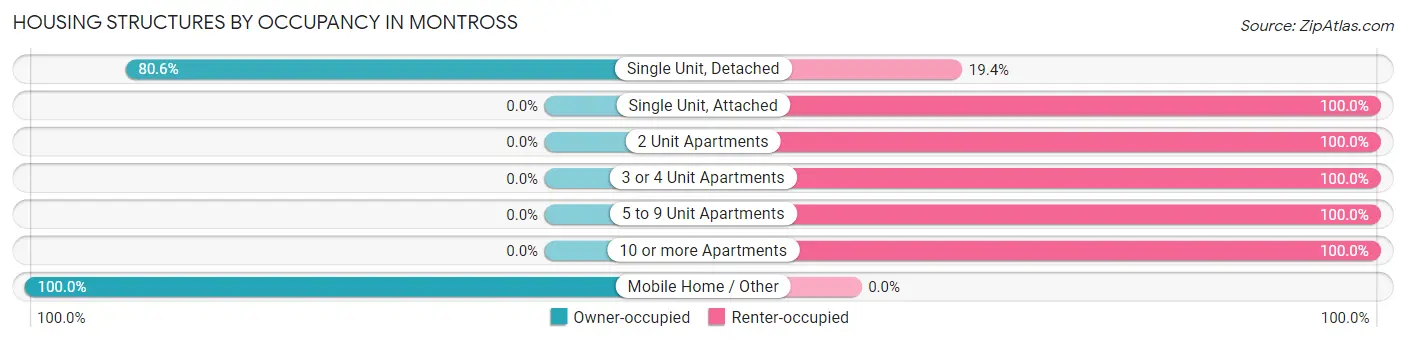
| Structure Type | Owner-occupied | Renter-occupied |
| Single Unit, Detached | 108 (80.6%) | 26 (19.4%) |
| Single Unit, Attached | 0 (0.0%) | 1 (100.0%) |
| 2 Unit Apartments | 0 (0.0%) | 9 (100.0%) |
| 3 or 4 Unit Apartments | 0 (0.0%) | 19 (100.0%) |
| 5 to 9 Unit Apartments | 0 (0.0%) | 1 (100.0%) |
| 10 or more Apartments | 0 (0.0%) | 2 (100.0%) |
| Mobile Home / Other | 1 (100.0%) | 0 (0.0%) |
| Total | 109 (65.3%) | 58 (34.7%) |
Housing Structures by Number of Rooms in Montross
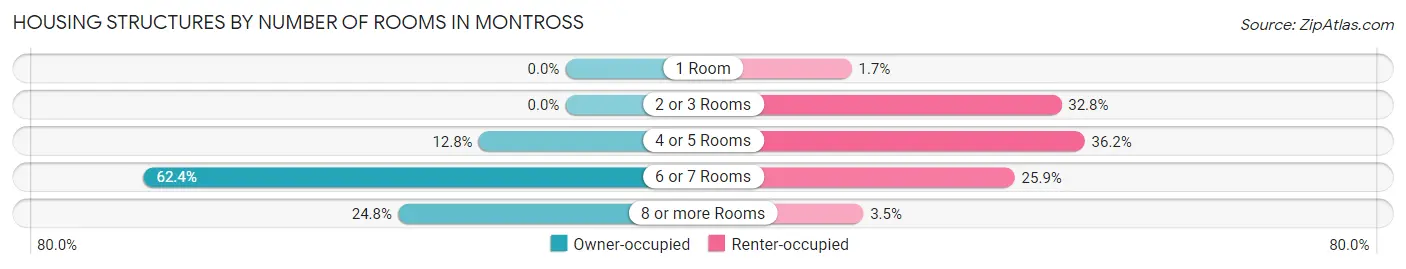
| Number of Rooms | Owner-occupied | Renter-occupied |
| 1 Room | 0 (0.0%) | 1 (1.7%) |
| 2 or 3 Rooms | 0 (0.0%) | 19 (32.8%) |
| 4 or 5 Rooms | 14 (12.8%) | 21 (36.2%) |
| 6 or 7 Rooms | 68 (62.4%) | 15 (25.9%) |
| 8 or more Rooms | 27 (24.8%) | 2 (3.5%) |
| Total | 109 (100.0%) | 58 (100.0%) |
Housing Structure by Heating Type in Montross
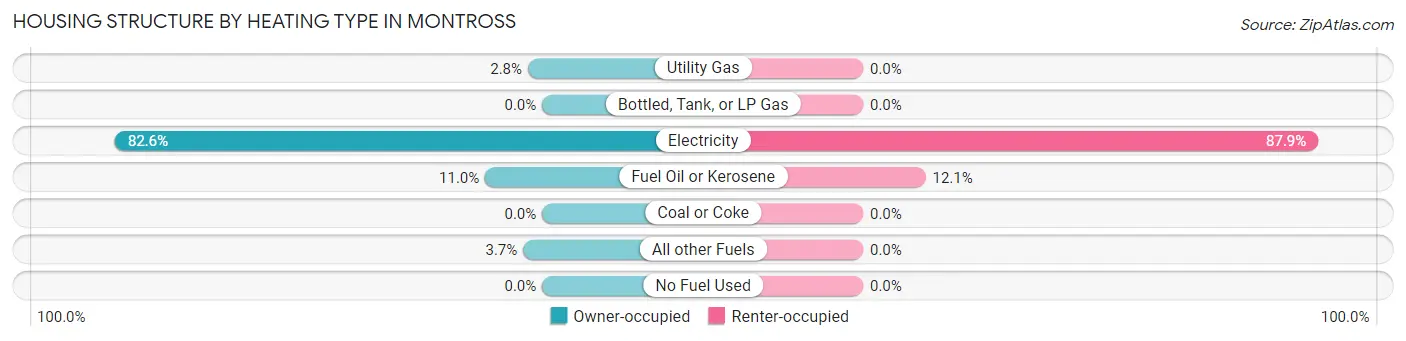
| Heating Type | Owner-occupied | Renter-occupied |
| Utility Gas | 3 (2.8%) | 0 (0.0%) |
| Bottled, Tank, or LP Gas | 0 (0.0%) | 0 (0.0%) |
| Electricity | 90 (82.6%) | 51 (87.9%) |
| Fuel Oil or Kerosene | 12 (11.0%) | 7 (12.1%) |
| Coal or Coke | 0 (0.0%) | 0 (0.0%) |
| All other Fuels | 4 (3.7%) | 0 (0.0%) |
| No Fuel Used | 0 (0.0%) | 0 (0.0%) |
| Total | 109 (100.0%) | 58 (100.0%) |
Household Vehicle Usage in Montross
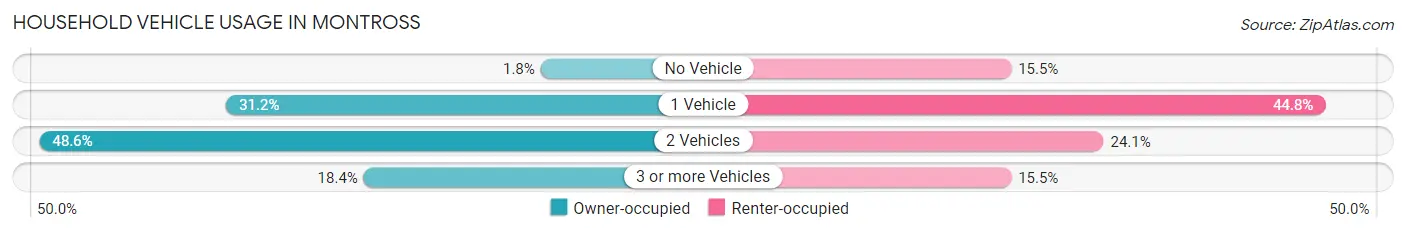
| Vehicles per Household | Owner-occupied | Renter-occupied |
| No Vehicle | 2 (1.8%) | 9 (15.5%) |
| 1 Vehicle | 34 (31.2%) | 26 (44.8%) |
| 2 Vehicles | 53 (48.6%) | 14 (24.1%) |
| 3 or more Vehicles | 20 (18.3%) | 9 (15.5%) |
| Total | 109 (100.0%) | 58 (100.0%) |
Real Estate & Mortgages in Montross
Real Estate and Mortgage Overview in Montross
| Characteristic | Without Mortgage | With Mortgage |
| Housing Units | 61 | 48 |
| Median Property Value | $242,000 | $200,000 |
| Median Household Income | - | - |
| Monthly Housing Costs | $424 | $6 |
| Real Estate Taxes | $1,250 | $0 |
Property Value by Mortgage Status in Montross
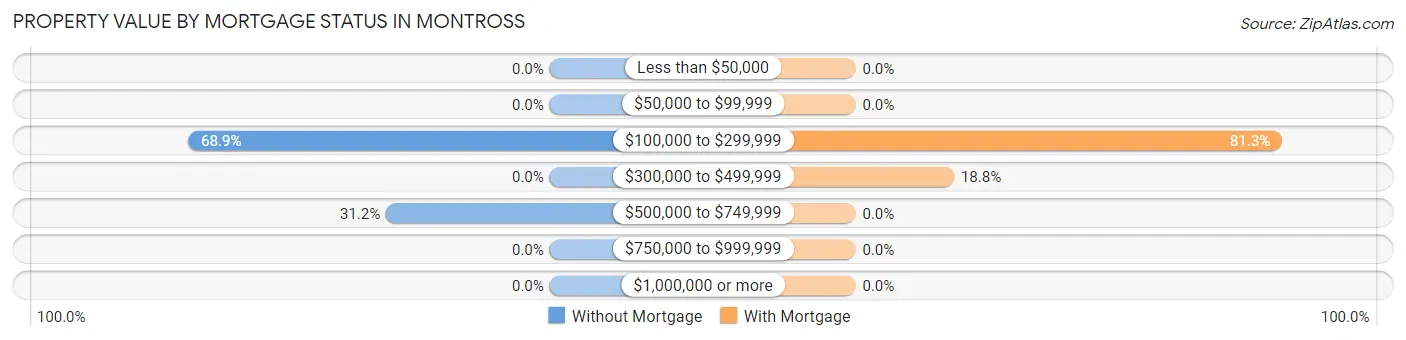
| Property Value | Without Mortgage | With Mortgage |
| Less than $50,000 | 0 (0.0%) | 0 (0.0%) |
| $50,000 to $99,999 | 0 (0.0%) | 0 (0.0%) |
| $100,000 to $299,999 | 42 (68.9%) | 39 (81.2%) |
| $300,000 to $499,999 | 0 (0.0%) | 9 (18.8%) |
| $500,000 to $749,999 | 19 (31.1%) | 0 (0.0%) |
| $750,000 to $999,999 | 0 (0.0%) | 0 (0.0%) |
| $1,000,000 or more | 0 (0.0%) | 0 (0.0%) |
| Total | 61 (100.0%) | 48 (100.0%) |
Household Income by Mortgage Status in Montross
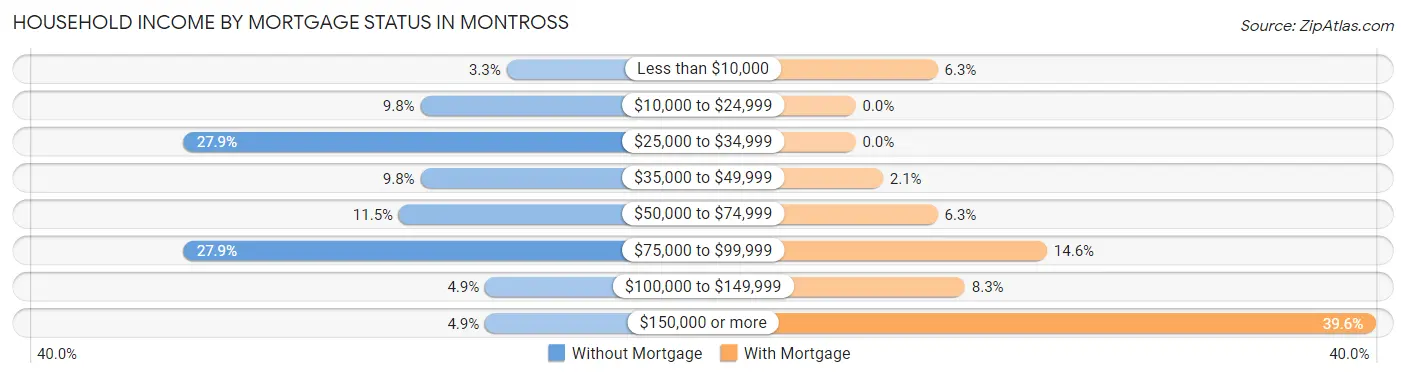
| Household Income | Without Mortgage | With Mortgage |
| Less than $10,000 | 2 (3.3%) | 3 (6.2%) |
| $10,000 to $24,999 | 6 (9.8%) | 0 (0.0%) |
| $25,000 to $34,999 | 17 (27.9%) | 0 (0.0%) |
| $35,000 to $49,999 | 6 (9.8%) | 1 (2.1%) |
| $50,000 to $74,999 | 7 (11.5%) | 3 (6.2%) |
| $75,000 to $99,999 | 17 (27.9%) | 7 (14.6%) |
| $100,000 to $149,999 | 3 (4.9%) | 4 (8.3%) |
| $150,000 or more | 3 (4.9%) | 19 (39.6%) |
| Total | 61 (100.0%) | 48 (100.0%) |
Property Value to Household Income Ratio in Montross
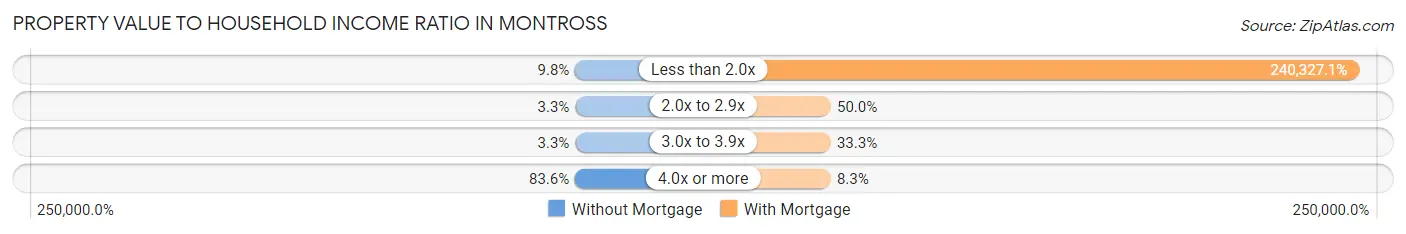
| Value-to-Income Ratio | Without Mortgage | With Mortgage |
| Less than 2.0x | 6 (9.8%) | 115,357 (240,327.1%) |
| 2.0x to 2.9x | 2 (3.3%) | 24 (50.0%) |
| 3.0x to 3.9x | 2 (3.3%) | 16 (33.3%) |
| 4.0x or more | 51 (83.6%) | 4 (8.3%) |
| Total | 61 (100.0%) | 48 (100.0%) |
Real Estate Taxes by Mortgage Status in Montross
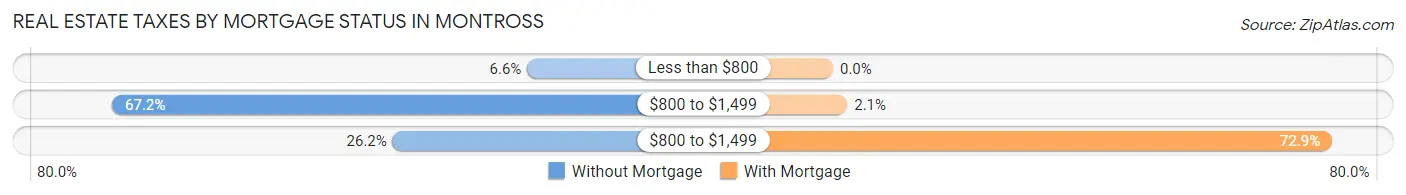
| Property Taxes | Without Mortgage | With Mortgage |
| Less than $800 | 4 (6.6%) | 0 (0.0%) |
| $800 to $1,499 | 41 (67.2%) | 1 (2.1%) |
| $800 to $1,499 | 16 (26.2%) | 35 (72.9%) |
| Total | 61 (100.0%) | 48 (100.0%) |
Health & Disability in Montross
Health Insurance Coverage by Age in Montross
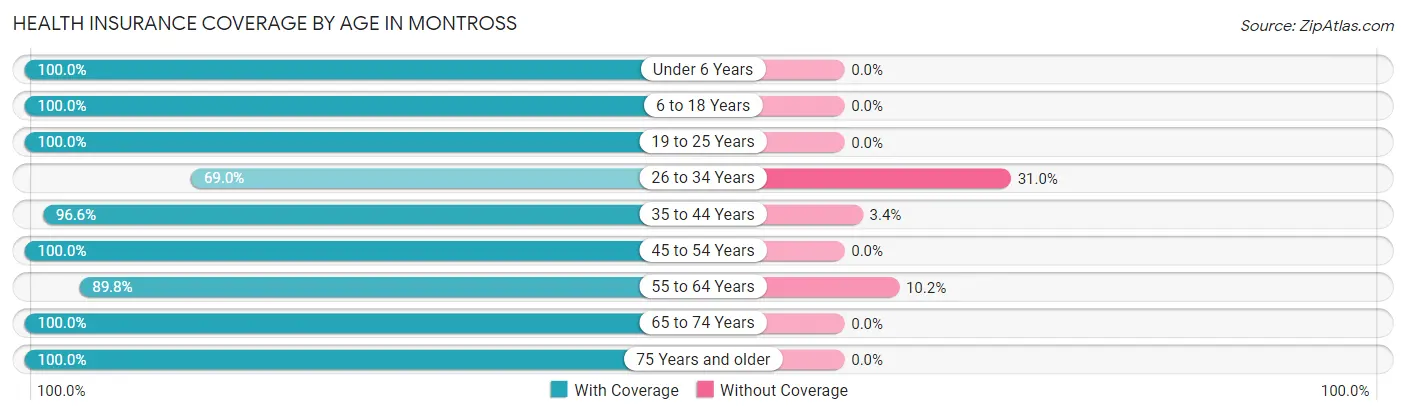
| Age Bracket | With Coverage | Without Coverage |
| Under 6 Years | 10 (100.0%) | 0 (0.0%) |
| 6 to 18 Years | 22 (100.0%) | 0 (0.0%) |
| 19 to 25 Years | 8 (100.0%) | 0 (0.0%) |
| 26 to 34 Years | 40 (69.0%) | 18 (31.0%) |
| 35 to 44 Years | 85 (96.6%) | 3 (3.4%) |
| 45 to 54 Years | 9 (100.0%) | 0 (0.0%) |
| 55 to 64 Years | 44 (89.8%) | 5 (10.2%) |
| 65 to 74 Years | 70 (100.0%) | 0 (0.0%) |
| 75 Years and older | 54 (100.0%) | 0 (0.0%) |
| Total | 342 (92.9%) | 26 (7.1%) |
Health Insurance Coverage by Citizenship Status in Montross
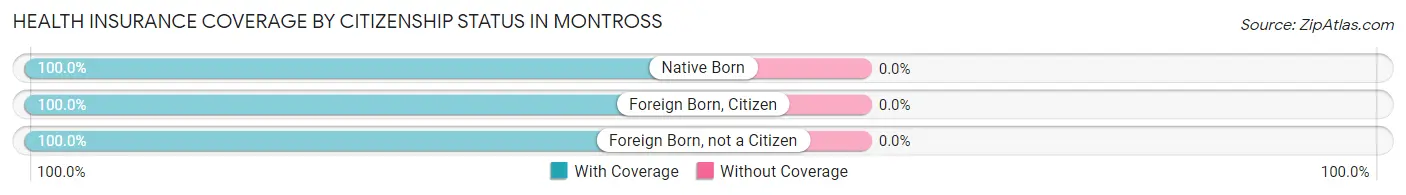
| Citizenship Status | With Coverage | Without Coverage |
| Native Born | 10 (100.0%) | 0 (0.0%) |
| Foreign Born, Citizen | 22 (100.0%) | 0 (0.0%) |
| Foreign Born, not a Citizen | 8 (100.0%) | 0 (0.0%) |
Health Insurance Coverage by Household Income in Montross
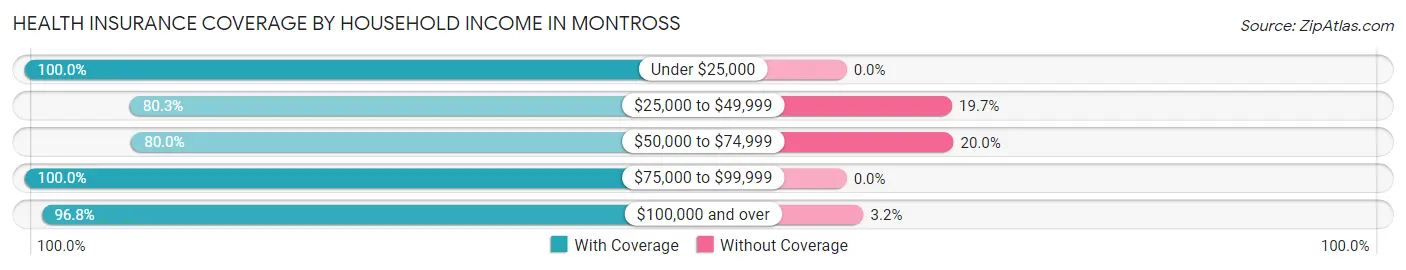
| Household Income | With Coverage | Without Coverage |
| Under $25,000 | 42 (100.0%) | 0 (0.0%) |
| $25,000 to $49,999 | 61 (80.3%) | 15 (19.7%) |
| $50,000 to $74,999 | 24 (80.0%) | 6 (20.0%) |
| $75,000 to $99,999 | 62 (100.0%) | 0 (0.0%) |
| $100,000 and over | 153 (96.8%) | 5 (3.2%) |
Public vs Private Health Insurance Coverage by Age in Montross
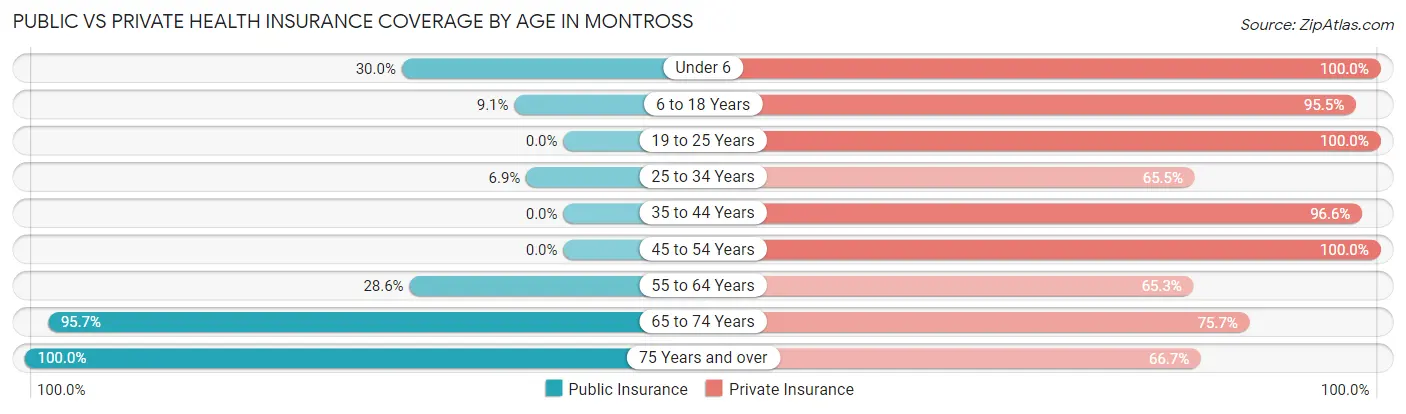
| Age Bracket | Public Insurance | Private Insurance |
| Under 6 | 3 (30.0%) | 10 (100.0%) |
| 6 to 18 Years | 2 (9.1%) | 21 (95.5%) |
| 19 to 25 Years | 0 (0.0%) | 8 (100.0%) |
| 25 to 34 Years | 4 (6.9%) | 38 (65.5%) |
| 35 to 44 Years | 0 (0.0%) | 85 (96.6%) |
| 45 to 54 Years | 0 (0.0%) | 9 (100.0%) |
| 55 to 64 Years | 14 (28.6%) | 32 (65.3%) |
| 65 to 74 Years | 67 (95.7%) | 53 (75.7%) |
| 75 Years and over | 54 (100.0%) | 36 (66.7%) |
| Total | 144 (39.1%) | 292 (79.3%) |
Disability Status by Sex by Age in Montross
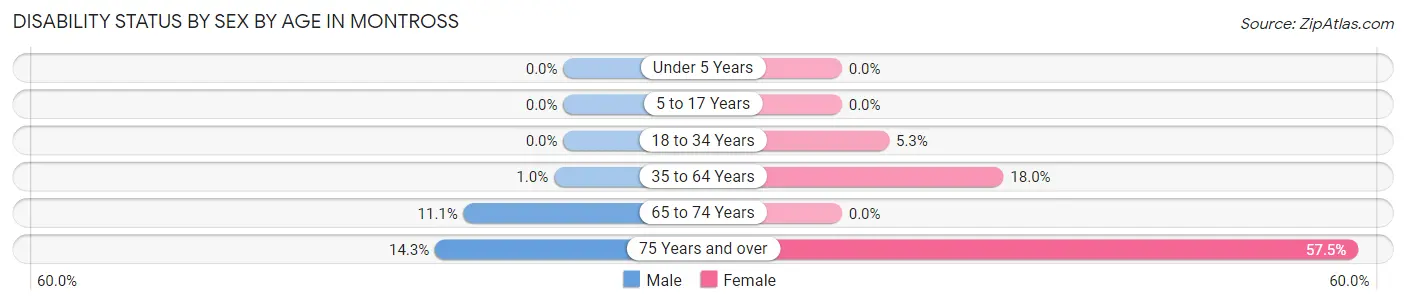
| Age Bracket | Male | Female |
| Under 5 Years | 0 (0.0%) | 0 (0.0%) |
| 5 to 17 Years | 0 (0.0%) | 0 (0.0%) |
| 18 to 34 Years | 0 (0.0%) | 2 (5.3%) |
| 35 to 64 Years | 1 (1.0%) | 9 (18.0%) |
| 65 to 74 Years | 3 (11.1%) | 0 (0.0%) |
| 75 Years and over | 2 (14.3%) | 23 (57.5%) |
Disability Class by Sex by Age in Montross
Disability Class: Hearing Difficulty
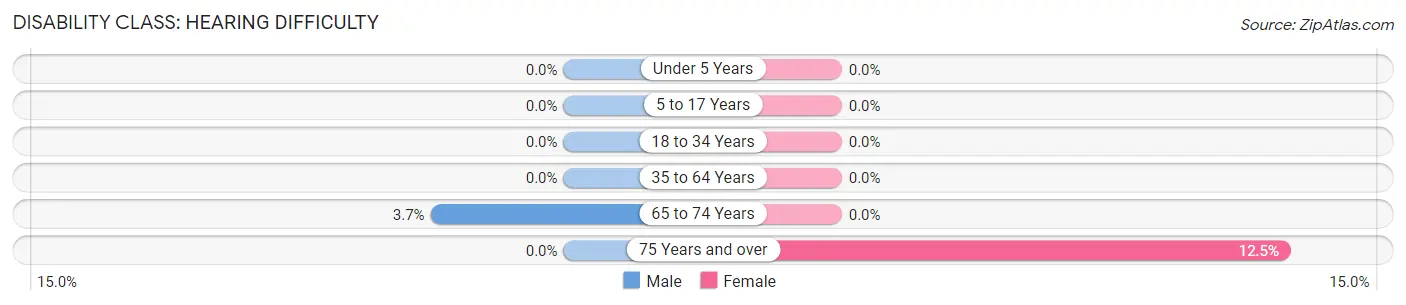
| Age Bracket | Male | Female |
| Under 5 Years | 0 (0.0%) | 0 (0.0%) |
| 5 to 17 Years | 0 (0.0%) | 0 (0.0%) |
| 18 to 34 Years | 0 (0.0%) | 0 (0.0%) |
| 35 to 64 Years | 0 (0.0%) | 0 (0.0%) |
| 65 to 74 Years | 1 (3.7%) | 0 (0.0%) |
| 75 Years and over | 0 (0.0%) | 5 (12.5%) |
Disability Class: Vision Difficulty
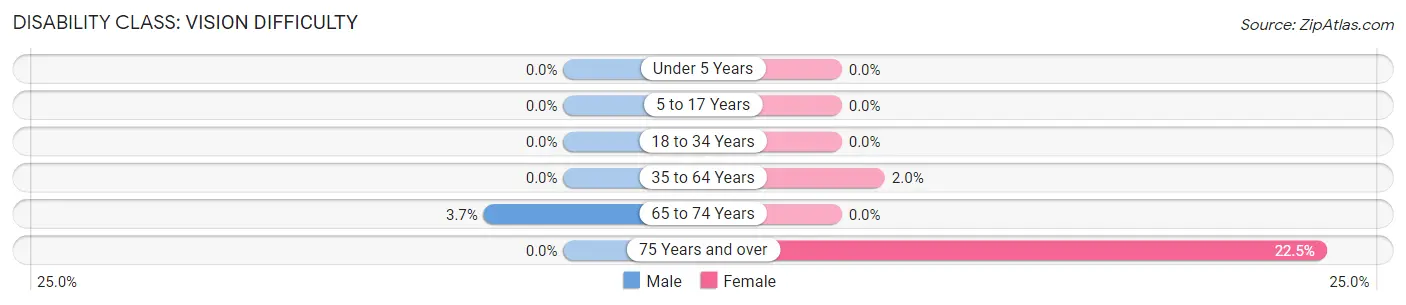
| Age Bracket | Male | Female |
| Under 5 Years | 0 (0.0%) | 0 (0.0%) |
| 5 to 17 Years | 0 (0.0%) | 0 (0.0%) |
| 18 to 34 Years | 0 (0.0%) | 0 (0.0%) |
| 35 to 64 Years | 0 (0.0%) | 1 (2.0%) |
| 65 to 74 Years | 1 (3.7%) | 0 (0.0%) |
| 75 Years and over | 0 (0.0%) | 9 (22.5%) |
Disability Class: Cognitive Difficulty
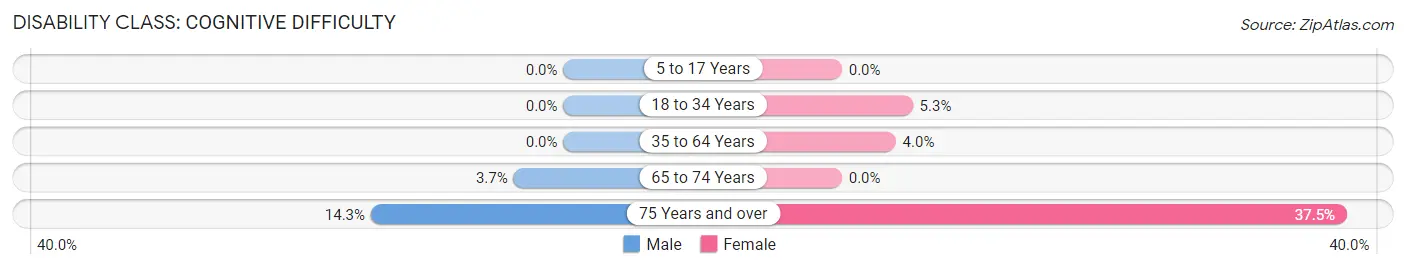
| Age Bracket | Male | Female |
| 5 to 17 Years | 0 (0.0%) | 0 (0.0%) |
| 18 to 34 Years | 0 (0.0%) | 2 (5.3%) |
| 35 to 64 Years | 0 (0.0%) | 2 (4.0%) |
| 65 to 74 Years | 1 (3.7%) | 0 (0.0%) |
| 75 Years and over | 2 (14.3%) | 15 (37.5%) |
Disability Class: Ambulatory Difficulty
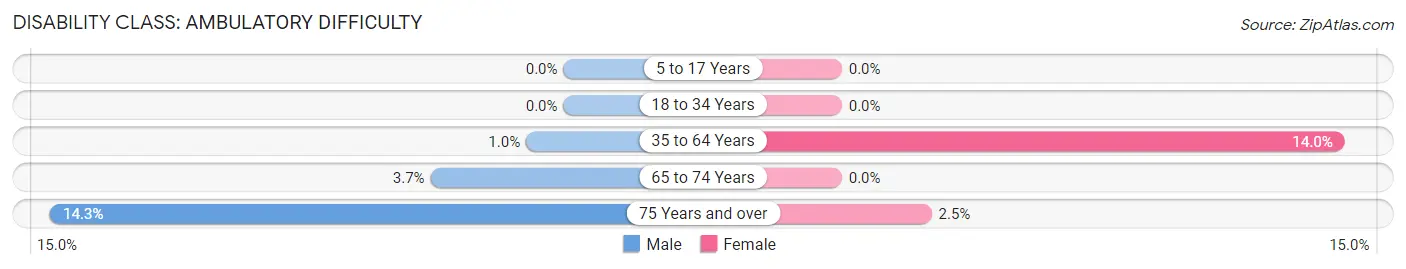
| Age Bracket | Male | Female |
| 5 to 17 Years | 0 (0.0%) | 0 (0.0%) |
| 18 to 34 Years | 0 (0.0%) | 0 (0.0%) |
| 35 to 64 Years | 1 (1.0%) | 7 (14.0%) |
| 65 to 74 Years | 1 (3.7%) | 0 (0.0%) |
| 75 Years and over | 2 (14.3%) | 1 (2.5%) |
Disability Class: Self-Care Difficulty
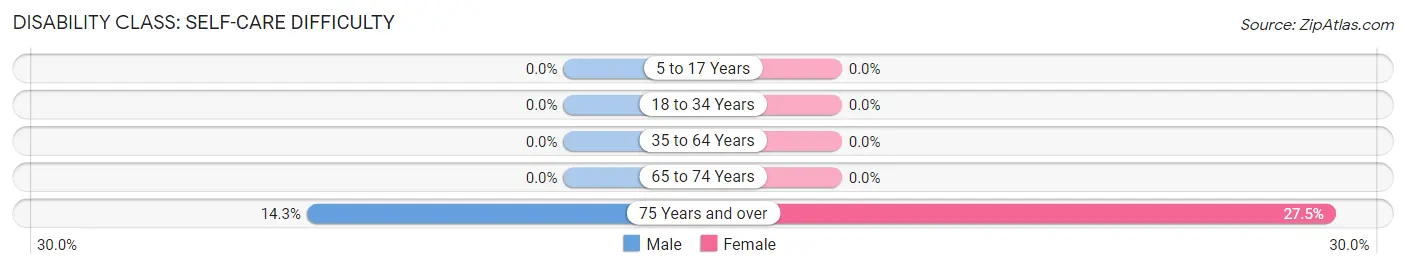
| Age Bracket | Male | Female |
| 5 to 17 Years | 0 (0.0%) | 0 (0.0%) |
| 18 to 34 Years | 0 (0.0%) | 0 (0.0%) |
| 35 to 64 Years | 0 (0.0%) | 0 (0.0%) |
| 65 to 74 Years | 0 (0.0%) | 0 (0.0%) |
| 75 Years and over | 2 (14.3%) | 11 (27.5%) |
Technology Access in Montross
Computing Device Access in Montross
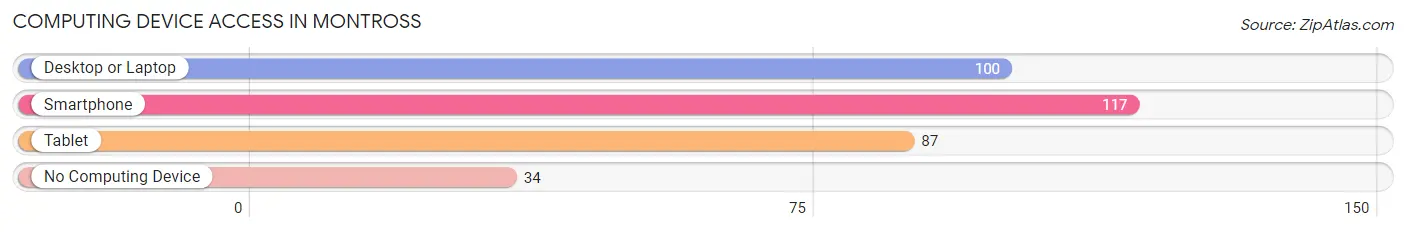
| Device Type | # Households | % Households |
| Desktop or Laptop | 100 | 59.9% |
| Smartphone | 117 | 70.1% |
| Tablet | 87 | 52.1% |
| No Computing Device | 34 | 20.4% |
| Total | 167 | 100.0% |
Internet Access in Montross
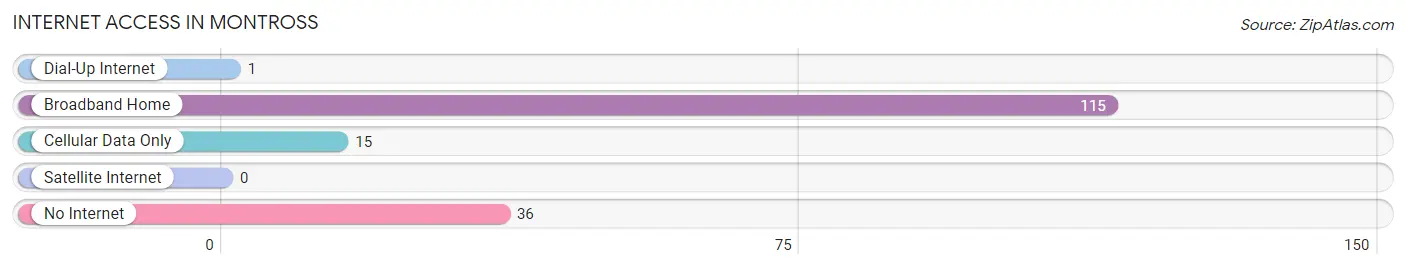
| Internet Type | # Households | % Households |
| Dial-Up Internet | 1 | 0.6% |
| Broadband Home | 115 | 68.9% |
| Cellular Data Only | 15 | 9.0% |
| Satellite Internet | 0 | 0.0% |
| No Internet | 36 | 21.6% |
| Total | 167 | 100.0% |
Montross Summary
Montross is a small town located in Westmoreland County, Virginia. It is situated on the Northern Neck of Virginia, a peninsula between the Potomac and Rappahannock Rivers. The town was founded in 1705 and is the county seat of Westmoreland County. The population of Montross was 1,717 as of the 2010 census.
Geography
Montross is located at 38°14'N 76°48'W (38.23, -76.80). It is situated on the Northern Neck of Virginia, a peninsula between the Potomac and Rappahannock Rivers. The town is located in the Northern Neck of Virginia, a region known for its rich history and natural beauty. The town is surrounded by lush forests and rolling hills, and is home to a variety of wildlife.
The town is located in the humid subtropical climate zone, with hot, humid summers and mild winters. The average temperature in the summer is around 80°F (27°C), and the average temperature in the winter is around 40°F (4°C). The average annual precipitation is around 43 inches (109 cm).
Economy
The economy of Montross is largely based on agriculture and tourism. The town is home to several farms, which produce a variety of crops, including corn, soybeans, wheat, and hay. The town is also home to several wineries, which produce a variety of wines.
Tourism is an important part of the economy of Montross. The town is home to several historic sites, including the Westmoreland County Courthouse, the Westmoreland County Museum, and the Westmoreland County Historical Society. The town is also home to several parks, including the Montross Community Park, the Westmoreland State Park, and the Westmoreland County Park.
Demographics
As of the 2010 census, the population of Montross was 1,717. The racial makeup of the town was 79.2% White, 17.7% African American, 0.5% Native American, 0.3% Asian, 0.1% Pacific Islander, 0.7% from other races, and 1.5% from two or more races. Hispanic or Latino of any race were 2.2% of the population.
The median income for a household in the town was $37,917, and the median income for a family was $45,000. The per capita income for the town was $19,945. About 11.2% of families and 14.2% of the population were below the poverty line, including 18.2% of those under age 18 and 8.3% of those age 65 or over.
Conclusion
Montross is a small town located in Westmoreland County, Virginia. It is situated on the Northern Neck of Virginia, a peninsula between the Potomac and Rappahannock Rivers. The town was founded in 1705 and is the county seat of Westmoreland County. The economy of Montross is largely based on agriculture and tourism. The population of Montross was 1,717 as of the 2010 census. The racial makeup of the town was 79.2% White, 17.7% African American, 0.5% Native American, 0.3% Asian, 0.1% Pacific Islander, 0.7% from other races, and 1.5% from two or more races. The median income for a household in the town was $37,917, and the median income for a family was $45,000. Montross is a small town with a rich history and a vibrant economy.
Common Questions
What is Per Capita Income in Montross?
Per Capita income in Montross is $68,599.
What is the Median Family Income in Montross?
Median Family Income in Montross is $84,853.
What is the Median Household income in Montross?
Median Household Income in Montross is $60,313.
What is Inequality or Gini Index in Montross?
Inequality or Gini Index in Montross is 0.56.
What is the Total Population of Montross?
Total Population of Montross is 368.
What is the Total Male Population of Montross?
Total Male Population of Montross is 175.
What is the Total Female Population of Montross?
Total Female Population of Montross is 193.
What is the Ratio of Males per 100 Females in Montross?
There are 90.67 Males per 100 Females in Montross.
What is the Ratio of Females per 100 Males in Montross?
There are 110.29 Females per 100 Males in Montross.
What is the Median Population Age in Montross?
Median Population Age in Montross is 44.0 Years.
What is the Average Family Size in Montross
Average Family Size in Montross is 3.6 People.
What is the Average Household Size in Montross
Average Household Size in Montross is 2.2 People.
How Large is the Labor Force in Montross?
There are 216 People in the Labor Forcein in Montross.
What is the Percentage of People in the Labor Force in Montross?
64.3% of People are in the Labor Force in Montross.
What is the Unemployment Rate in Montross?
Unemployment Rate in Montross is 0.9%.