East Highland Park, VA Map & Demographics
East Highland Park Map
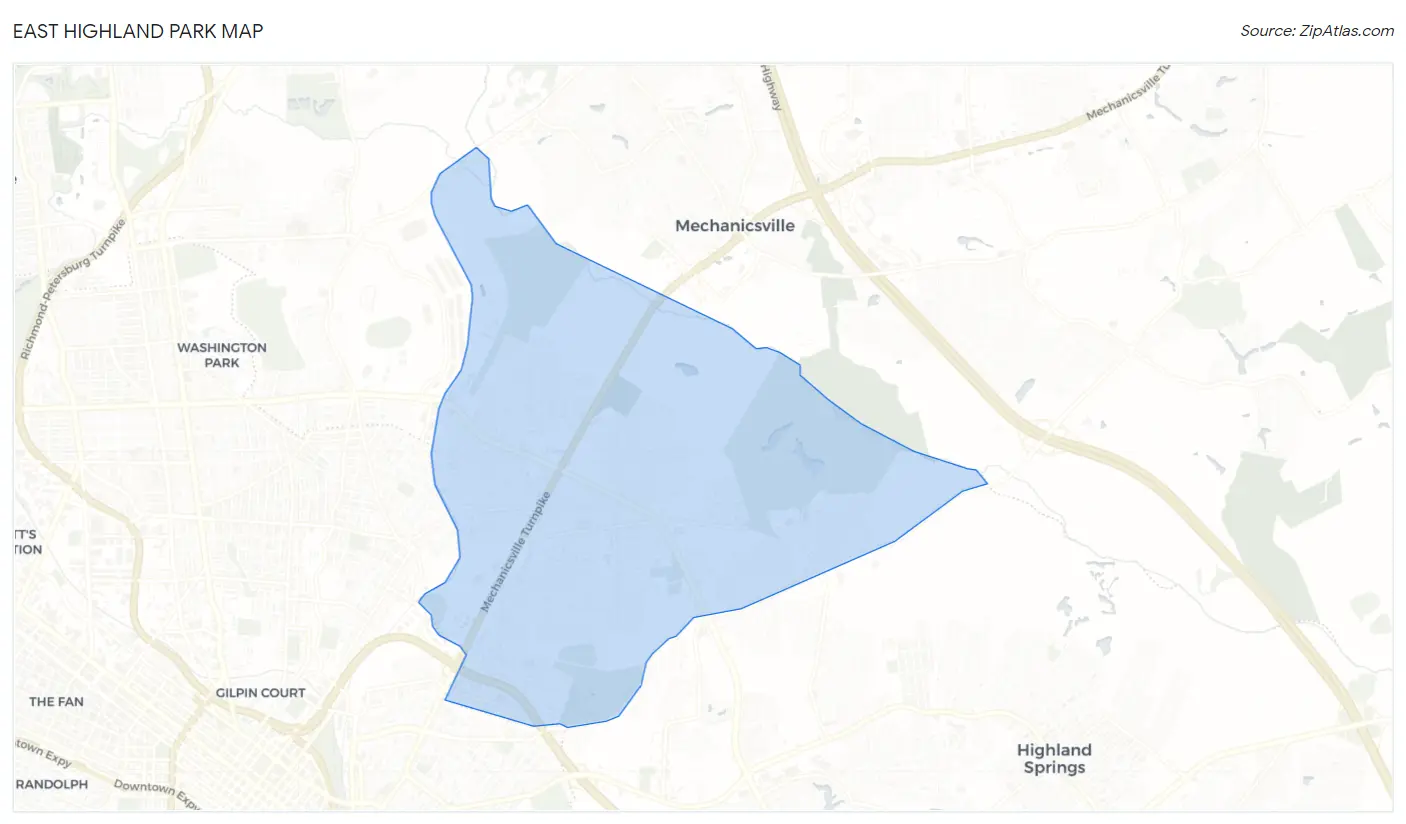
East Highland Park Overview
$33,502
PER CAPITA INCOME
$81,870
AVG FAMILY INCOME
$70,395
AVG HOUSEHOLD INCOME
7.8%
WAGE / INCOME GAP [ % ]
92.2¢/ $1
WAGE / INCOME GAP [ $ ]
0.38
INEQUALITY / GINI INDEX
16,499
TOTAL POPULATION
7,818
MALE POPULATION
8,681
FEMALE POPULATION
90.06
MALES / 100 FEMALES
111.04
FEMALES / 100 MALES
40.7
MEDIAN AGE
3.1
AVG FAMILY SIZE
2.5
AVG HOUSEHOLD SIZE
9,755
LABOR FORCE [ PEOPLE ]
71.9%
PERCENT IN LABOR FORCE
4.0%
UNEMPLOYMENT RATE
Income in East Highland Park
Income Overview in East Highland Park
Per Capita Income in East Highland Park is $33,502, while median incomes of families and households are $81,870 and $70,395 respectively.
| Characteristic | Number | Measure |
| Per Capita Income | 16,499 | $33,502 |
| Median Family Income | 4,118 | $81,870 |
| Mean Family Income | 4,118 | $88,800 |
| Median Household Income | 6,555 | $70,395 |
| Mean Household Income | 6,555 | $79,791 |
| Income Deficit | 4,118 | $0 |
| Wage / Income Gap (%) | 16,499 | 7.76% |
| Wage / Income Gap ($) | 16,499 | 92.24¢ per $1 |
| Gini / Inequality Index | 16,499 | 0.38 |
Earnings by Sex in East Highland Park
Average Earnings in East Highland Park are $41,193, $42,453 for men and $39,158 for women, a difference of 7.8%.
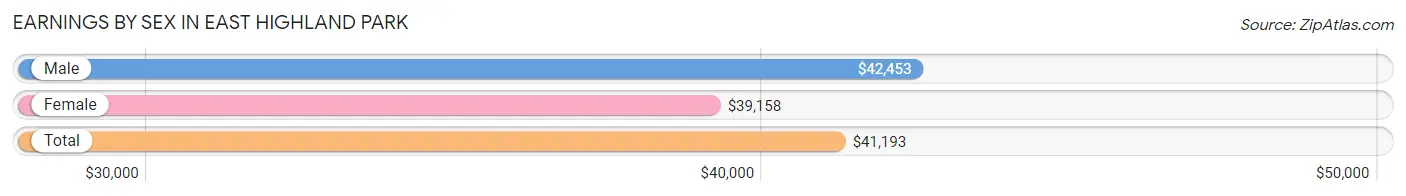
| Sex | Number | Average Earnings |
| Male | 4,924 (50.0%) | $42,453 |
| Female | 4,931 (50.0%) | $39,158 |
| Total | 9,855 (100.0%) | $41,193 |
Earnings by Sex by Income Bracket in East Highland Park
The most common earnings brackets in East Highland Park are $100,000+ for men (536 | 10.9%) and $30,000 to $34,999 for women (624 | 12.7%).
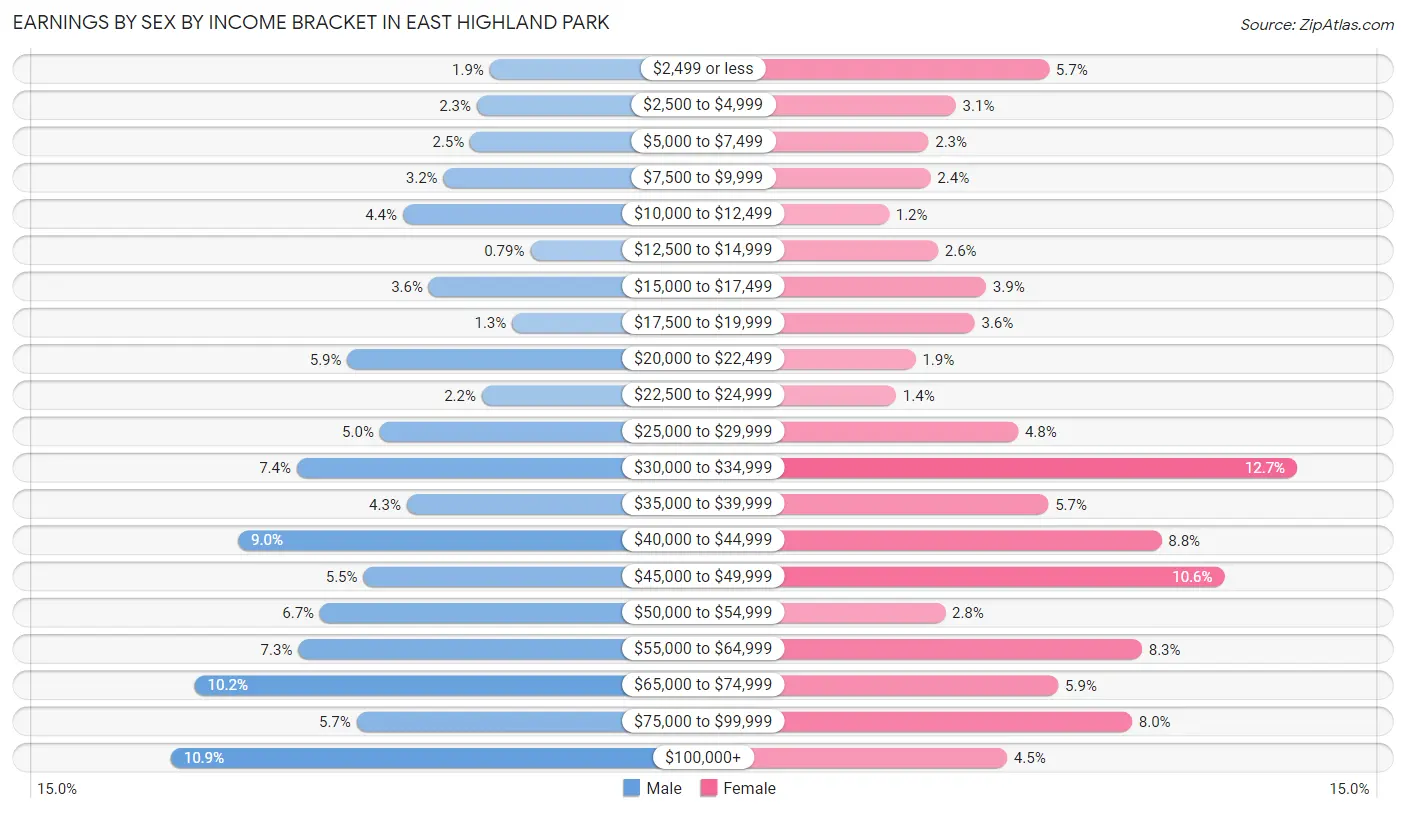
| Income | Male | Female |
| $2,499 or less | 95 (1.9%) | 280 (5.7%) |
| $2,500 to $4,999 | 113 (2.3%) | 151 (3.1%) |
| $5,000 to $7,499 | 122 (2.5%) | 113 (2.3%) |
| $7,500 to $9,999 | 159 (3.2%) | 116 (2.4%) |
| $10,000 to $12,499 | 215 (4.4%) | 58 (1.2%) |
| $12,500 to $14,999 | 39 (0.8%) | 126 (2.6%) |
| $15,000 to $17,499 | 179 (3.6%) | 193 (3.9%) |
| $17,500 to $19,999 | 64 (1.3%) | 177 (3.6%) |
| $20,000 to $22,499 | 292 (5.9%) | 95 (1.9%) |
| $22,500 to $24,999 | 106 (2.1%) | 68 (1.4%) |
| $25,000 to $29,999 | 247 (5.0%) | 237 (4.8%) |
| $30,000 to $34,999 | 362 (7.3%) | 624 (12.7%) |
| $35,000 to $39,999 | 210 (4.3%) | 279 (5.7%) |
| $40,000 to $44,999 | 443 (9.0%) | 436 (8.8%) |
| $45,000 to $49,999 | 270 (5.5%) | 523 (10.6%) |
| $50,000 to $54,999 | 330 (6.7%) | 136 (2.8%) |
| $55,000 to $64,999 | 360 (7.3%) | 409 (8.3%) |
| $65,000 to $74,999 | 503 (10.2%) | 293 (5.9%) |
| $75,000 to $99,999 | 279 (5.7%) | 395 (8.0%) |
| $100,000+ | 536 (10.9%) | 222 (4.5%) |
| Total | 4,924 (100.0%) | 4,931 (100.0%) |
Earnings by Sex by Educational Attainment in East Highland Park
Average earnings in East Highland Park are $44,839 for men and $43,264 for women, a difference of 3.5%. Men with an educational attainment of bachelor's degree enjoy the highest average annual earnings of $66,172, while those with less than high school education earn the least with $17,765. Women with an educational attainment of graduate degree earn the most with the average annual earnings of $56,726, while those with less than high school education have the smallest earnings of $31,021.
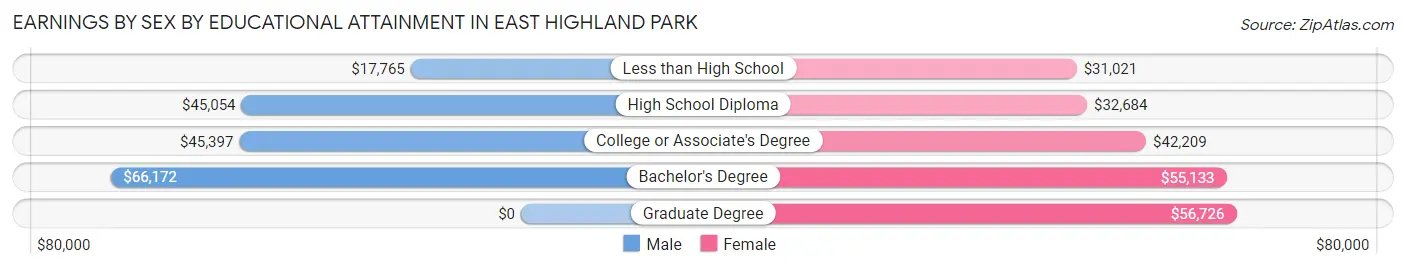
| Educational Attainment | Male Income | Female Income |
| Less than High School | $17,765 | $31,021 |
| High School Diploma | $45,054 | $32,684 |
| College or Associate's Degree | $45,397 | $42,209 |
| Bachelor's Degree | $66,172 | $55,133 |
| Graduate Degree | - | - |
| Total | $44,839 | $43,264 |
Family Income in East Highland Park
Family Income Brackets in East Highland Park
According to the East Highland Park family income data, there are 1,046 families falling into the $100,000 to $149,999 income range, which is the most common income bracket and makes up 25.4% of all families. Conversely, the $10,000 to $14,999 income bracket is the least frequent group with only 41 families (1.0%) belonging to this category.
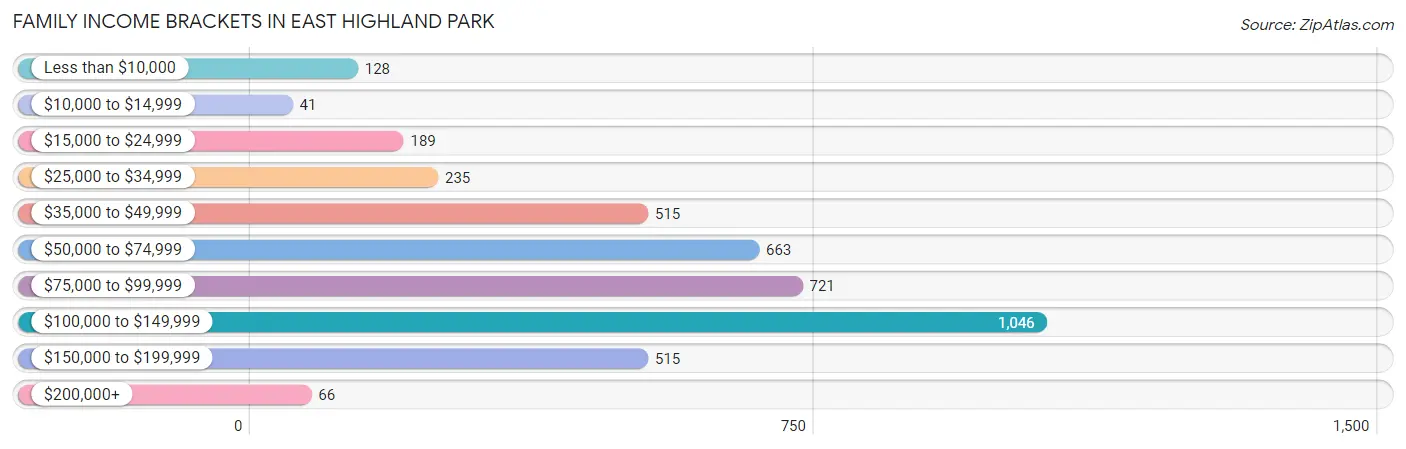
| Income Bracket | # Families | % Families |
| Less than $10,000 | 128 | 3.1% |
| $10,000 to $14,999 | 41 | 1.0% |
| $15,000 to $24,999 | 189 | 4.6% |
| $25,000 to $34,999 | 235 | 5.7% |
| $35,000 to $49,999 | 515 | 12.5% |
| $50,000 to $74,999 | 663 | 16.1% |
| $75,000 to $99,999 | 721 | 17.5% |
| $100,000 to $149,999 | 1,046 | 25.4% |
| $150,000 to $199,999 | 515 | 12.5% |
| $200,000+ | 66 | 1.6% |
Family Income by Famaliy Size in East Highland Park
6-person families (134 | 3.3%) account for the highest median family income in East Highland Park with $160,679 per family, while 3-person families (1,022 | 24.8%) have the highest median income of $37,058 per family member.
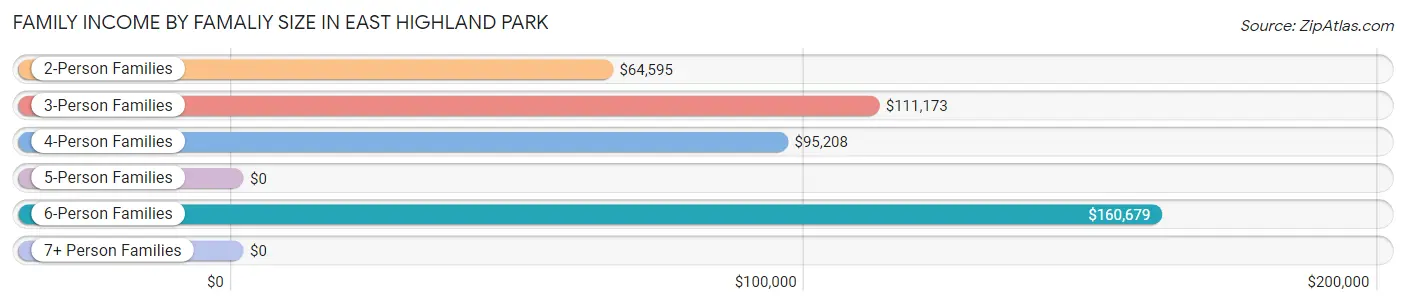
| Income Bracket | # Families | Median Income |
| 2-Person Families | 2,030 (49.3%) | $64,595 |
| 3-Person Families | 1,022 (24.8%) | $111,173 |
| 4-Person Families | 612 (14.9%) | $95,208 |
| 5-Person Families | 293 (7.1%) | $0 |
| 6-Person Families | 134 (3.3%) | $160,679 |
| 7+ Person Families | 27 (0.7%) | $0 |
| Total | 4,118 (100.0%) | $81,870 |
Family Income by Number of Earners in East Highland Park
The median family income in East Highland Park is $81,870, with families comprising 3+ earners (636) having the highest median family income of $126,184, while families with no earners (395) have the lowest median family income of $50,625, accounting for 15.4% and 9.6% of families, respectively.
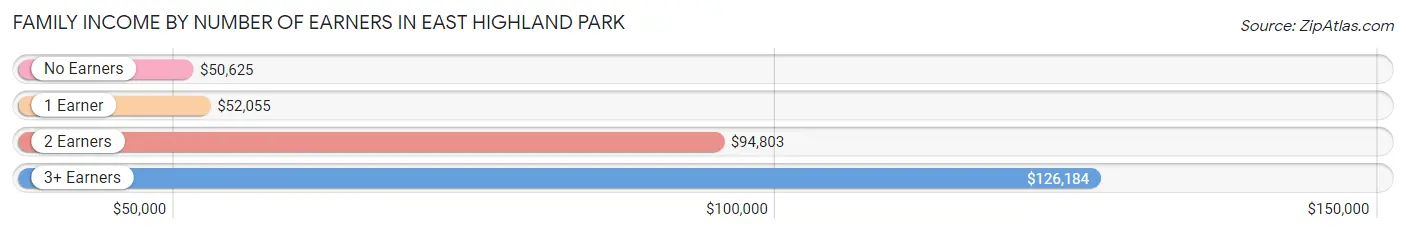
| Number of Earners | # Families | Median Income |
| No Earners | 395 (9.6%) | $50,625 |
| 1 Earner | 1,535 (37.3%) | $52,055 |
| 2 Earners | 1,552 (37.7%) | $94,803 |
| 3+ Earners | 636 (15.4%) | $126,184 |
| Total | 4,118 (100.0%) | $81,870 |
Household Income in East Highland Park
Household Income Brackets in East Highland Park
With 1,396 households falling in the category, the $100,000 to $149,999 income range is the most frequent in East Highland Park, accounting for 21.3% of all households. In contrast, only 105 households (1.6%) fall into the $10,000 to $14,999 income bracket, making it the least populous group.
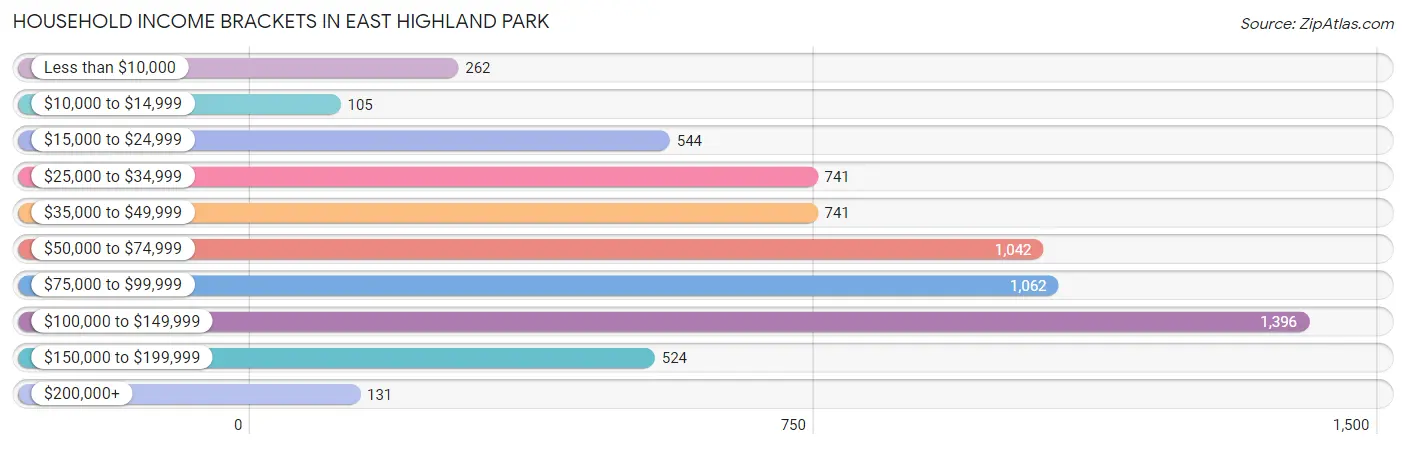
| Income Bracket | # Households | % Households |
| Less than $10,000 | 262 | 4.0% |
| $10,000 to $14,999 | 105 | 1.6% |
| $15,000 to $24,999 | 544 | 8.3% |
| $25,000 to $34,999 | 741 | 11.3% |
| $35,000 to $49,999 | 741 | 11.3% |
| $50,000 to $74,999 | 1,042 | 15.9% |
| $75,000 to $99,999 | 1,062 | 16.2% |
| $100,000 to $149,999 | 1,396 | 21.3% |
| $150,000 to $199,999 | 524 | 8.0% |
| $200,000+ | 131 | 2.0% |
Household Income by Householder Age in East Highland Park
The median household income in East Highland Park is $70,395, with the highest median household income of $78,417 found in the 45 to 64 years age bracket for the primary householder. A total of 2,647 households (40.4%) fall into this category. Meanwhile, the 15 to 24 years age bracket for the primary householder has the lowest median household income of $0, with 145 households (2.2%) in this group.
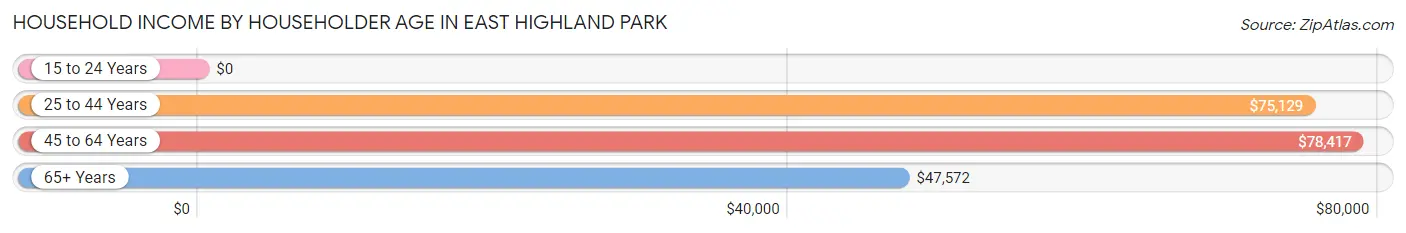
| Income Bracket | # Households | Median Income |
| 15 to 24 Years | 145 (2.2%) | $0 |
| 25 to 44 Years | 1,987 (30.3%) | $75,129 |
| 45 to 64 Years | 2,647 (40.4%) | $78,417 |
| 65+ Years | 1,776 (27.1%) | $47,572 |
| Total | 6,555 (100.0%) | $70,395 |
Poverty in East Highland Park
Income Below Poverty by Sex and Age in East Highland Park
With 12.3% poverty level for males and 14.1% for females among the residents of East Highland Park, under 5 year old males and 5 year old females are the most vulnerable to poverty, with 208 males (42.4%) and 82 females (50.0%) in their respective age groups living below the poverty level.
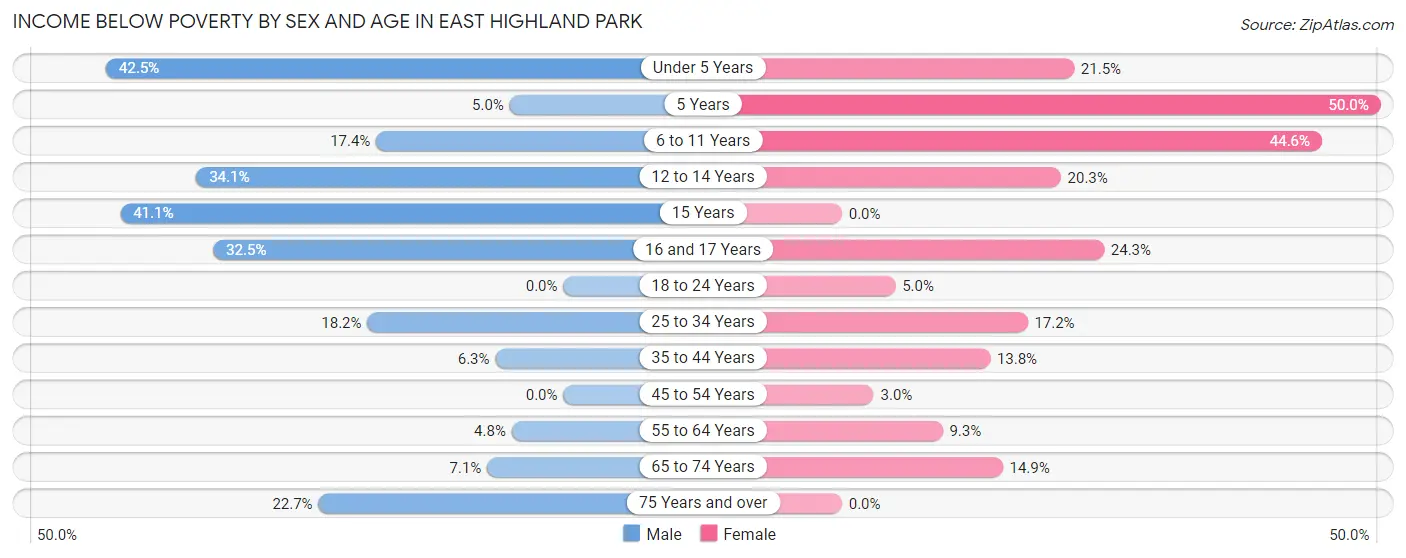
| Age Bracket | Male | Female |
| Under 5 Years | 208 (42.4%) | 70 (21.5%) |
| 5 Years | 11 (5.0%) | 82 (50.0%) |
| 6 to 11 Years | 78 (17.4%) | 278 (44.6%) |
| 12 to 14 Years | 93 (34.1%) | 26 (20.3%) |
| 15 Years | 44 (41.1%) | 0 (0.0%) |
| 16 and 17 Years | 78 (32.5%) | 63 (24.3%) |
| 18 to 24 Years | 0 (0.0%) | 34 (5.0%) |
| 25 to 34 Years | 177 (18.2%) | 220 (17.2%) |
| 35 to 44 Years | 76 (6.3%) | 153 (13.8%) |
| 45 to 54 Years | 0 (0.0%) | 35 (2.9%) |
| 55 to 64 Years | 48 (4.8%) | 129 (9.3%) |
| 65 to 74 Years | 53 (7.1%) | 135 (14.9%) |
| 75 Years and over | 90 (22.7%) | 0 (0.0%) |
| Total | 956 (12.3%) | 1,225 (14.1%) |
Income Above Poverty by Sex and Age in East Highland Park
According to the poverty statistics in East Highland Park, males aged 18 to 24 years and females aged 15 years are the age groups that are most secure financially, with 100.0% of males and 100.0% of females in these age groups living above the poverty line.
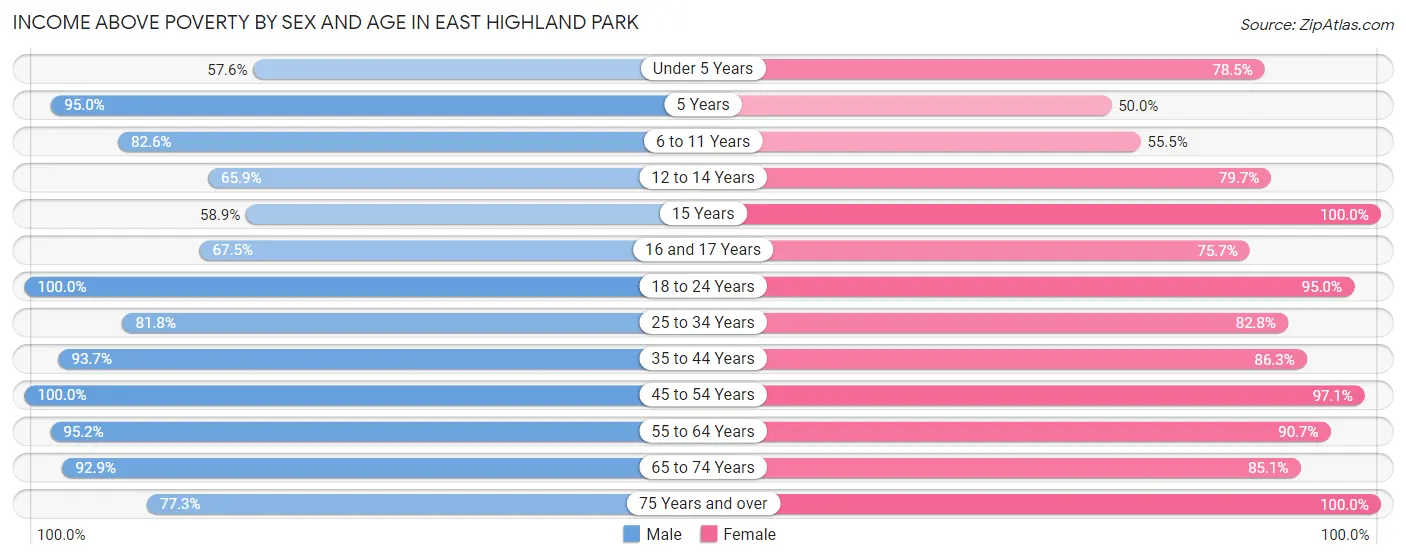
| Age Bracket | Male | Female |
| Under 5 Years | 282 (57.6%) | 255 (78.5%) |
| 5 Years | 210 (95.0%) | 82 (50.0%) |
| 6 to 11 Years | 371 (82.6%) | 346 (55.4%) |
| 12 to 14 Years | 180 (65.9%) | 102 (79.7%) |
| 15 Years | 63 (58.9%) | 136 (100.0%) |
| 16 and 17 Years | 162 (67.5%) | 196 (75.7%) |
| 18 to 24 Years | 629 (100.0%) | 651 (95.0%) |
| 25 to 34 Years | 796 (81.8%) | 1,057 (82.8%) |
| 35 to 44 Years | 1,129 (93.7%) | 960 (86.3%) |
| 45 to 54 Years | 1,045 (100.0%) | 1,151 (97.1%) |
| 55 to 64 Years | 955 (95.2%) | 1,252 (90.7%) |
| 65 to 74 Years | 697 (92.9%) | 770 (85.1%) |
| 75 Years and over | 306 (77.3%) | 493 (100.0%) |
| Total | 6,825 (87.7%) | 7,451 (85.9%) |
Income Below Poverty Among Married-Couple Families in East Highland Park
The poverty statistics for married-couple families in East Highland Park show that 4.8% or 107 of the total 2,244 families live below the poverty line. Families with 3 or 4 children have the highest poverty rate of 38.8%, comprising of 83 families. On the other hand, families with no children have the lowest poverty rate of 1.1%, which includes 15 families.
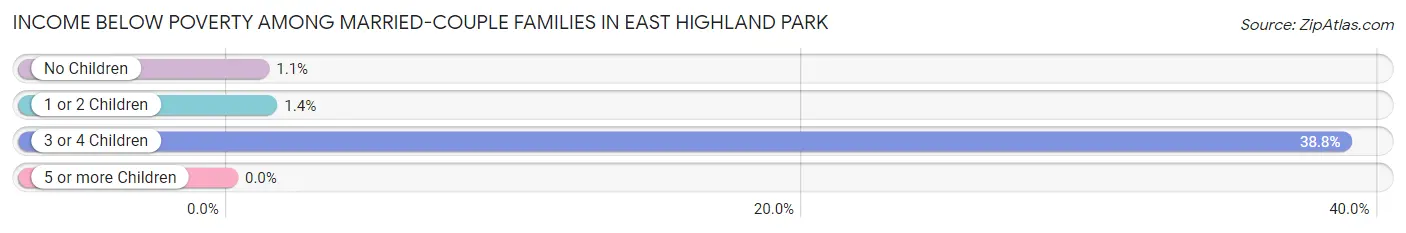
| Children | Above Poverty | Below Poverty |
| No Children | 1,360 (98.9%) | 15 (1.1%) |
| 1 or 2 Children | 646 (98.6%) | 9 (1.4%) |
| 3 or 4 Children | 131 (61.2%) | 83 (38.8%) |
| 5 or more Children | 0 (0.0%) | 0 (0.0%) |
| Total | 2,137 (95.2%) | 107 (4.8%) |
Income Below Poverty Among Single-Parent Households in East Highland Park
According to the poverty data in East Highland Park, 10.9% or 43 single-father households and 15.7% or 232 single-mother households are living below the poverty line. Among single-father households, those with 1 or 2 children have the highest poverty rate, with 43 households (15.4%) experiencing poverty. Likewise, among single-mother households, those with 5 or more children have the highest poverty rate, with 11 households (100.0%) falling below the poverty line.
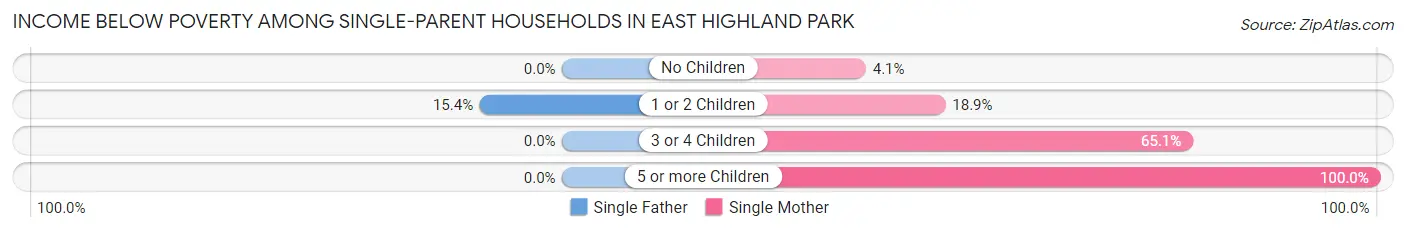
| Children | Single Father | Single Mother |
| No Children | 0 (0.0%) | 32 (4.1%) |
| 1 or 2 Children | 43 (15.4%) | 107 (18.9%) |
| 3 or 4 Children | 0 (0.0%) | 82 (65.1%) |
| 5 or more Children | 0 (0.0%) | 11 (100.0%) |
| Total | 43 (10.9%) | 232 (15.7%) |
Income Below Poverty Among Married-Couple vs Single-Parent Households in East Highland Park
The poverty data for East Highland Park shows that 107 of the married-couple family households (4.8%) and 275 of the single-parent households (14.7%) are living below the poverty level. Within the married-couple family households, those with 3 or 4 children have the highest poverty rate, with 83 households (38.8%) falling below the poverty line. Among the single-parent households, those with 5 or more children have the highest poverty rate, with 11 household (100.0%) living below poverty.
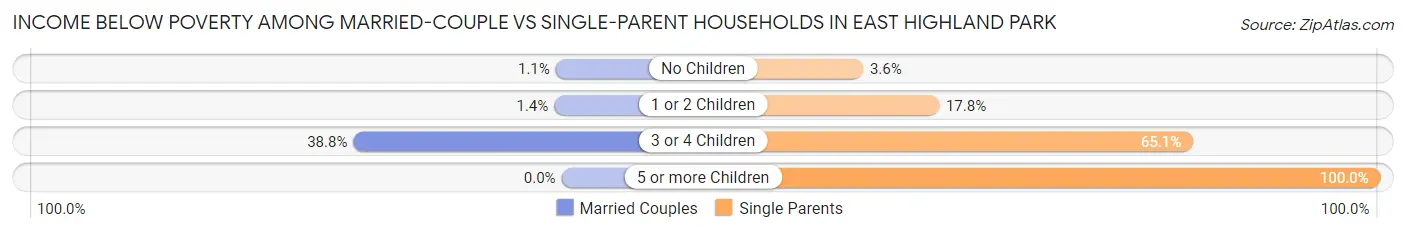
| Children | Married-Couple Families | Single-Parent Households |
| No Children | 15 (1.1%) | 32 (3.6%) |
| 1 or 2 Children | 9 (1.4%) | 150 (17.7%) |
| 3 or 4 Children | 83 (38.8%) | 82 (65.1%) |
| 5 or more Children | 0 (0.0%) | 11 (100.0%) |
| Total | 107 (4.8%) | 275 (14.7%) |
Race in East Highland Park
The most populous races in East Highland Park are Black / African American (14,176 | 85.9%), White / Caucasian (1,464 | 8.9%), and Two or more Races (778 | 4.7%).
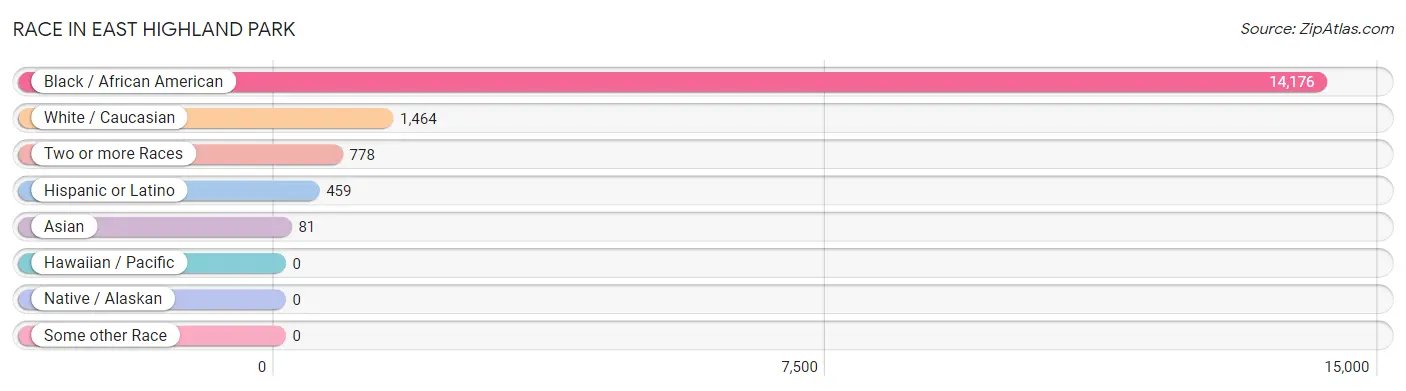
| Race | # Population | % Population |
| Asian | 81 | 0.5% |
| Black / African American | 14,176 | 85.9% |
| Hawaiian / Pacific | 0 | 0.0% |
| Hispanic or Latino | 459 | 2.8% |
| Native / Alaskan | 0 | 0.0% |
| White / Caucasian | 1,464 | 8.9% |
| Two or more Races | 778 | 4.7% |
| Some other Race | 0 | 0.0% |
| Total | 16,499 | 100.0% |
Ancestry in East Highland Park
The most populous ancestries reported in East Highland Park are American (1,194 | 7.2%), Subsaharan African (634 | 3.8%), African (501 | 3.0%), Puerto Rican (313 | 1.9%), and English (266 | 1.6%), together accounting for 17.6% of all East Highland Park residents.
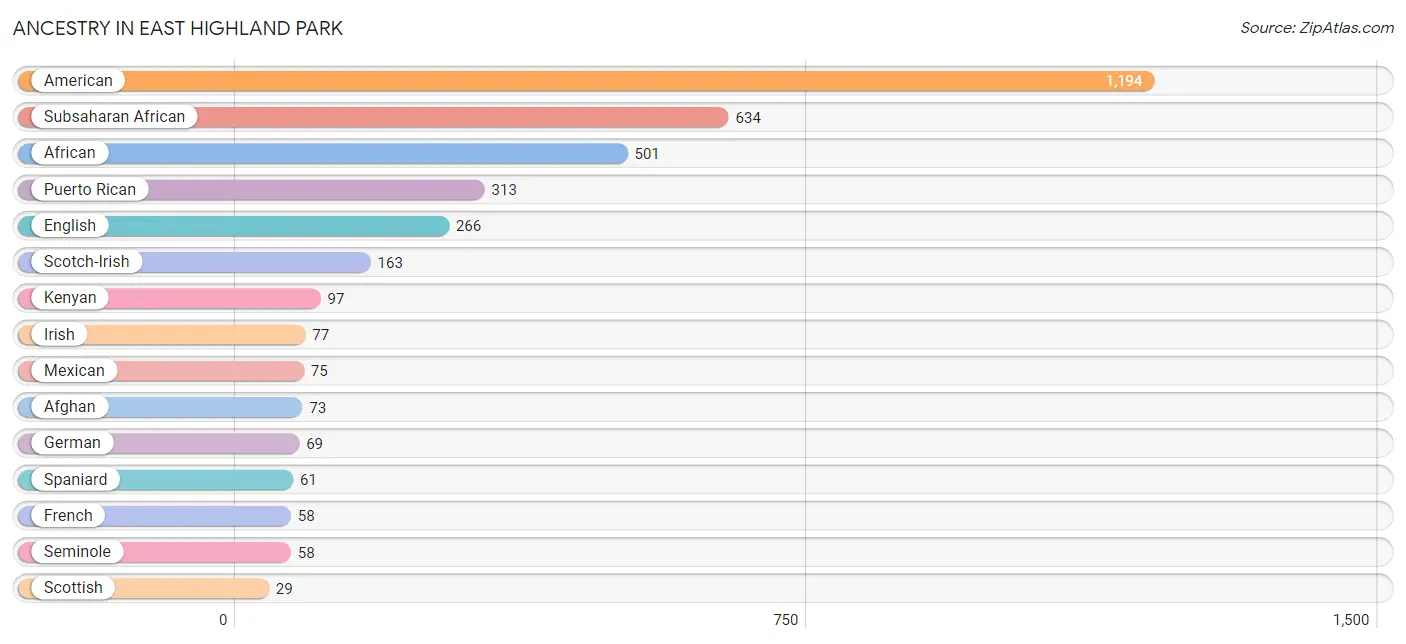
| Ancestry | # Population | % Population |
| Afghan | 73 | 0.4% |
| African | 501 | 3.0% |
| American | 1,194 | 7.2% |
| Bhutanese | 14 | 0.1% |
| British | 18 | 0.1% |
| Burmese | 8 | 0.1% |
| English | 266 | 1.6% |
| French | 58 | 0.4% |
| German | 69 | 0.4% |
| Irish | 77 | 0.5% |
| Italian | 18 | 0.1% |
| Kenyan | 97 | 0.6% |
| Mexican | 75 | 0.4% |
| Nigerian | 16 | 0.1% |
| Polish | 6 | 0.0% |
| Puerto Rican | 313 | 1.9% |
| Scotch-Irish | 163 | 1.0% |
| Scottish | 29 | 0.2% |
| Seminole | 58 | 0.4% |
| Sioux | 22 | 0.1% |
| Spaniard | 61 | 0.4% |
| Subsaharan African | 634 | 3.8% |
| Swedish | 15 | 0.1% |
| Thai | 8 | 0.1% |
| Welsh | 10 | 0.1% |
| Yaqui | 24 | 0.2% | View All 26 Rows |
Immigrants in East Highland Park
The most numerous immigrant groups reported in East Highland Park came from Africa (251 | 1.5%), South Africa (105 | 0.6%), Eastern Africa (98 | 0.6%), Kenya (97 | 0.6%), and Asia (81 | 0.5%), together accounting for 3.8% of all East Highland Park residents.
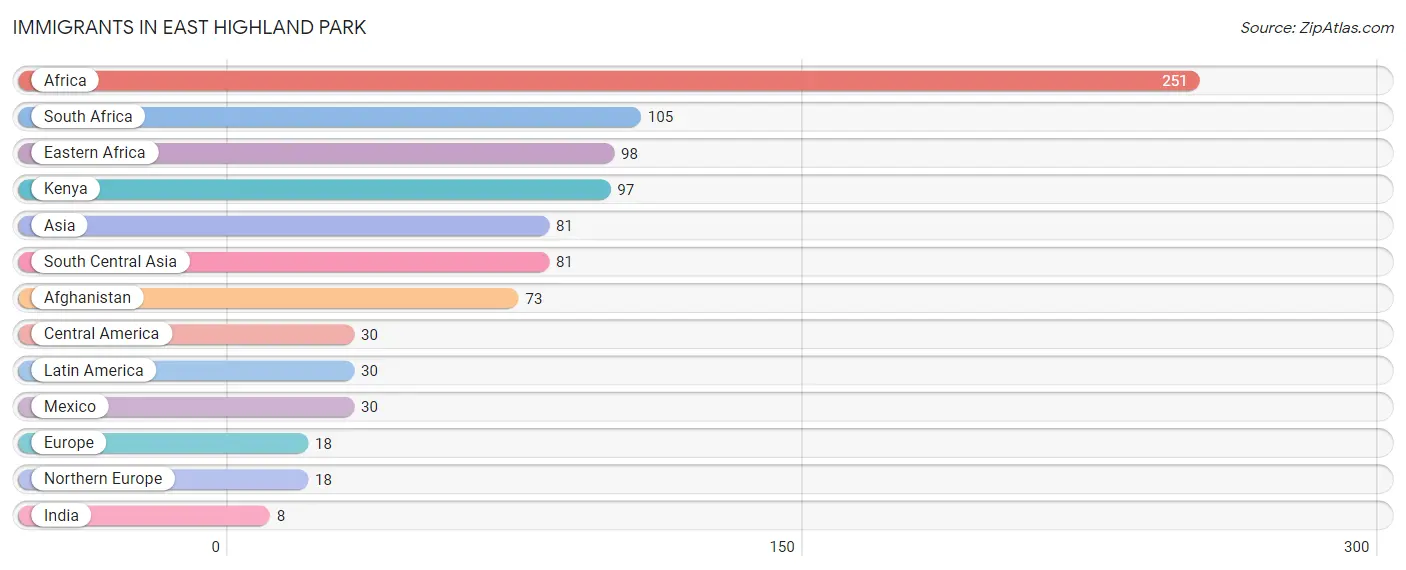
| Immigration Origin | # Population | % Population |
| Afghanistan | 73 | 0.4% |
| Africa | 251 | 1.5% |
| Asia | 81 | 0.5% |
| Central America | 30 | 0.2% |
| Eastern Africa | 98 | 0.6% |
| Europe | 18 | 0.1% |
| India | 8 | 0.1% |
| Kenya | 97 | 0.6% |
| Latin America | 30 | 0.2% |
| Mexico | 30 | 0.2% |
| Northern Europe | 18 | 0.1% |
| South Africa | 105 | 0.6% |
| South Central Asia | 81 | 0.5% | View All 13 Rows |
Sex and Age in East Highland Park
Sex and Age in East Highland Park
The most populous age groups in East Highland Park are 40 to 44 Years (773 | 9.9%) for men and 60 to 64 Years (814 | 9.4%) for women.
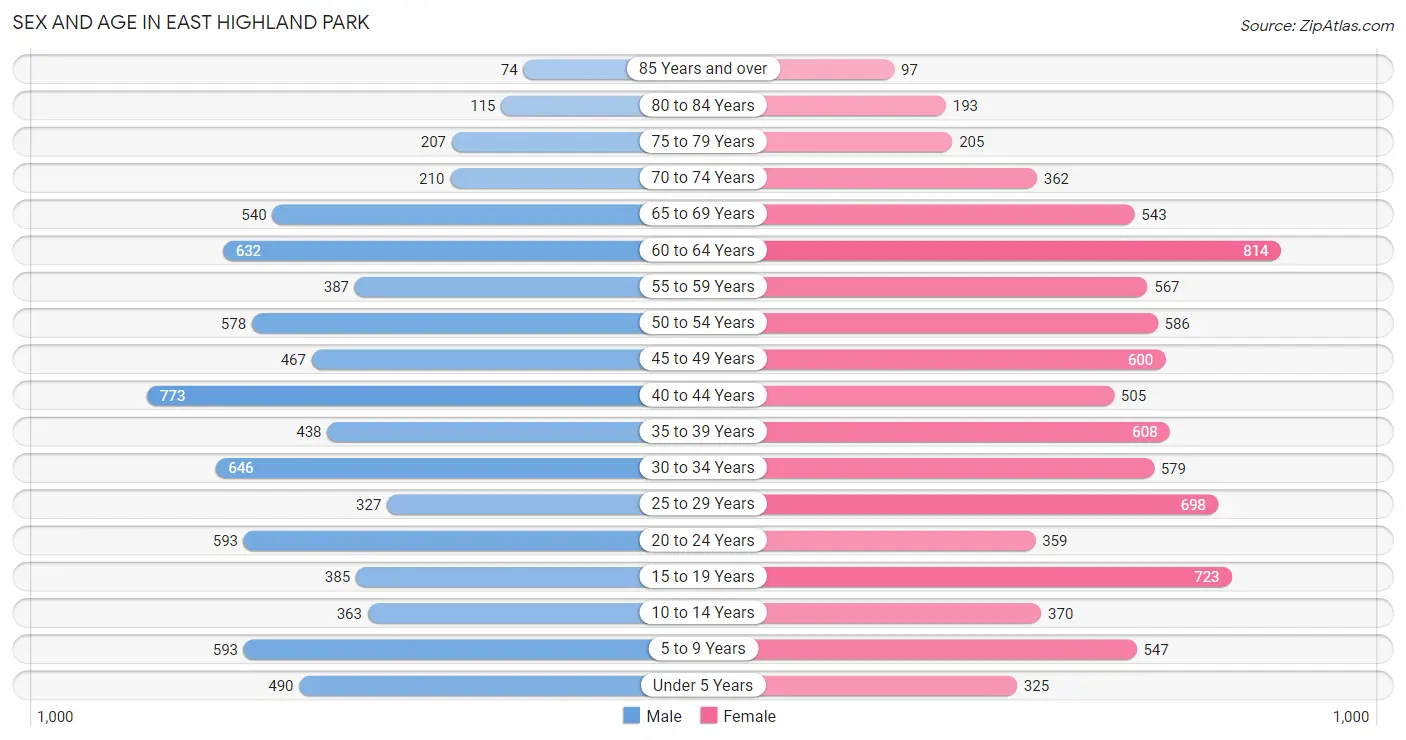
| Age Bracket | Male | Female |
| Under 5 Years | 490 (6.3%) | 325 (3.7%) |
| 5 to 9 Years | 593 (7.6%) | 547 (6.3%) |
| 10 to 14 Years | 363 (4.6%) | 370 (4.3%) |
| 15 to 19 Years | 385 (4.9%) | 723 (8.3%) |
| 20 to 24 Years | 593 (7.6%) | 359 (4.1%) |
| 25 to 29 Years | 327 (4.2%) | 698 (8.0%) |
| 30 to 34 Years | 646 (8.3%) | 579 (6.7%) |
| 35 to 39 Years | 438 (5.6%) | 608 (7.0%) |
| 40 to 44 Years | 773 (9.9%) | 505 (5.8%) |
| 45 to 49 Years | 467 (6.0%) | 600 (6.9%) |
| 50 to 54 Years | 578 (7.4%) | 586 (6.8%) |
| 55 to 59 Years | 387 (5.0%) | 567 (6.5%) |
| 60 to 64 Years | 632 (8.1%) | 814 (9.4%) |
| 65 to 69 Years | 540 (6.9%) | 543 (6.3%) |
| 70 to 74 Years | 210 (2.7%) | 362 (4.2%) |
| 75 to 79 Years | 207 (2.6%) | 205 (2.4%) |
| 80 to 84 Years | 115 (1.5%) | 193 (2.2%) |
| 85 Years and over | 74 (0.9%) | 97 (1.1%) |
| Total | 7,818 (100.0%) | 8,681 (100.0%) |
Families and Households in East Highland Park
Median Family Size in East Highland Park
The median family size in East Highland Park is 3.12 persons per family, with married-couple families (2,244 | 54.5%) accounting for the largest median family size of 3.25 persons per family. On the other hand, single male/father families (395 | 9.6%) represent the smallest median family size with 2.27 persons per family.
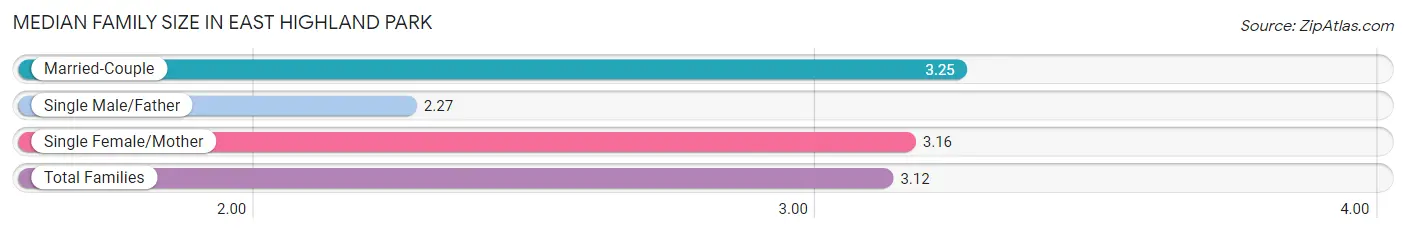
| Family Type | # Families | Family Size |
| Married-Couple | 2,244 (54.5%) | 3.25 |
| Single Male/Father | 395 (9.6%) | 2.27 |
| Single Female/Mother | 1,479 (35.9%) | 3.16 |
| Total Families | 4,118 (100.0%) | 3.12 |
Median Household Size in East Highland Park
The median household size in East Highland Park is 2.51 persons per household, with single female/mother households (1,479 | 22.6%) accounting for the largest median household size of 3.34 persons per household. non-family households (2,437 | 37.2%) represent the smallest median household size with 1.30 persons per household.
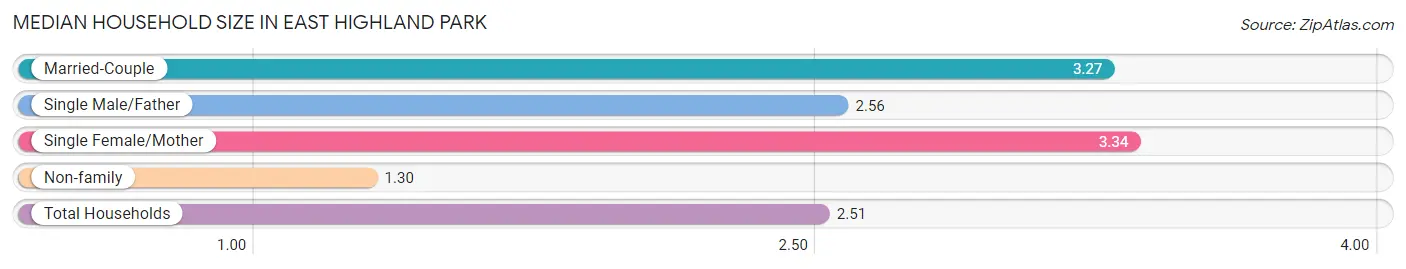
| Household Type | # Households | Household Size |
| Married-Couple | 2,244 (34.2%) | 3.27 |
| Single Male/Father | 395 (6.0%) | 2.56 |
| Single Female/Mother | 1,479 (22.6%) | 3.34 |
| Non-family | 2,437 (37.2%) | 1.30 |
| Total Households | 6,555 (100.0%) | 2.51 |
Household Size by Marriage Status in East Highland Park
Out of a total of 6,555 households in East Highland Park, 4,118 (62.8%) are family households, while 2,437 (37.2%) are nonfamily households. The most numerous type of family households are 2-person households, comprising 1,804, and the most common type of nonfamily households are 1-person households, comprising 1,966.
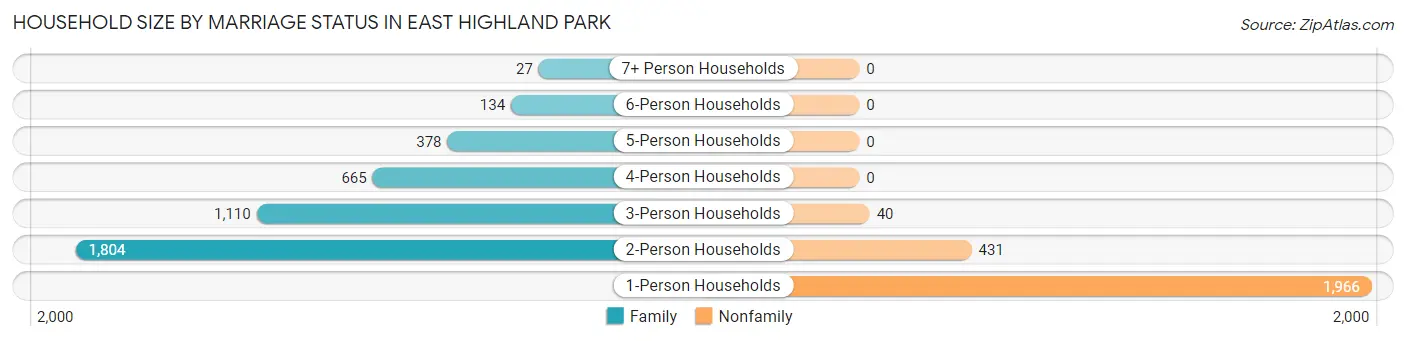
| Household Size | Family Households | Nonfamily Households |
| 1-Person Households | - | 1,966 (30.0%) |
| 2-Person Households | 1,804 (27.5%) | 431 (6.6%) |
| 3-Person Households | 1,110 (16.9%) | 40 (0.6%) |
| 4-Person Households | 665 (10.1%) | 0 (0.0%) |
| 5-Person Households | 378 (5.8%) | 0 (0.0%) |
| 6-Person Households | 134 (2.0%) | 0 (0.0%) |
| 7+ Person Households | 27 (0.4%) | 0 (0.0%) |
| Total | 4,118 (62.8%) | 2,437 (37.2%) |
Female Fertility in East Highland Park
Fertility by Age in East Highland Park
Average fertility rate in East Highland Park is 46.0 births per 1,000 women. Women in the age bracket of 20 to 34 years have the highest fertility rate with 113.0 births per 1,000 women. Women in the age bracket of 20 to 34 years acount for 95.4% of all women with births.
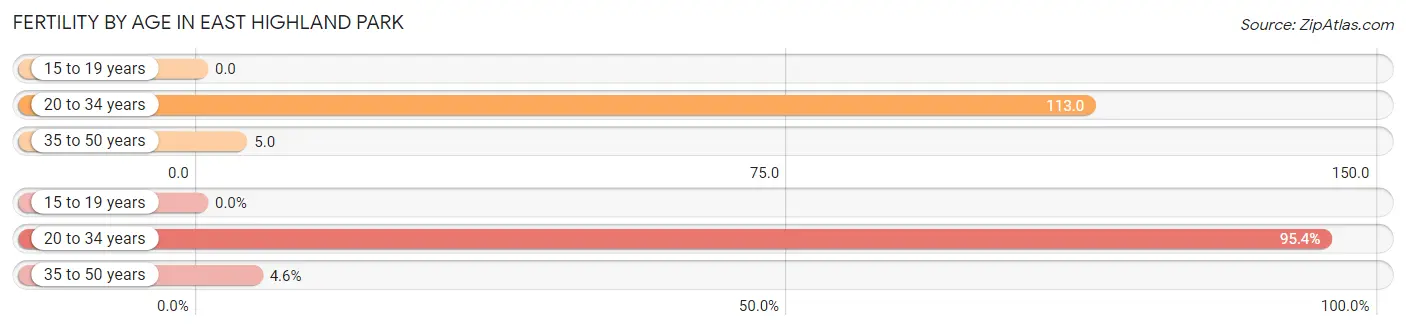
| Age Bracket | Women with Births | Births / 1,000 Women |
| 15 to 19 years | 0 (0.0%) | 0.0 |
| 20 to 34 years | 185 (95.4%) | 113.0 |
| 35 to 50 years | 9 (4.6%) | 5.0 |
| Total | 194 (100.0%) | 46.0 |
Fertility by Age by Marriage Status in East Highland Park
95.4% of women with births (194) in East Highland Park are married. The highest percentage of unmarried women with births falls into 35 to 50 years age bracket with 100.0% of them unmarried at the time of birth, while the lowest percentage of unmarried women with births belong to 20 to 34 years age bracket with 0.0% of them unmarried.
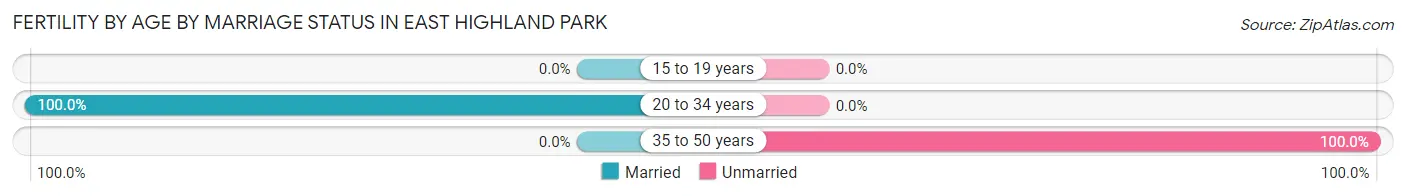
| Age Bracket | Married | Unmarried |
| 15 to 19 years | 0 (0.0%) | 0 (0.0%) |
| 20 to 34 years | 185 (100.0%) | 0 (0.0%) |
| 35 to 50 years | 0 (0.0%) | 9 (100.0%) |
| Total | 185 (95.4%) | 9 (4.6%) |
Fertility by Education in East Highland Park
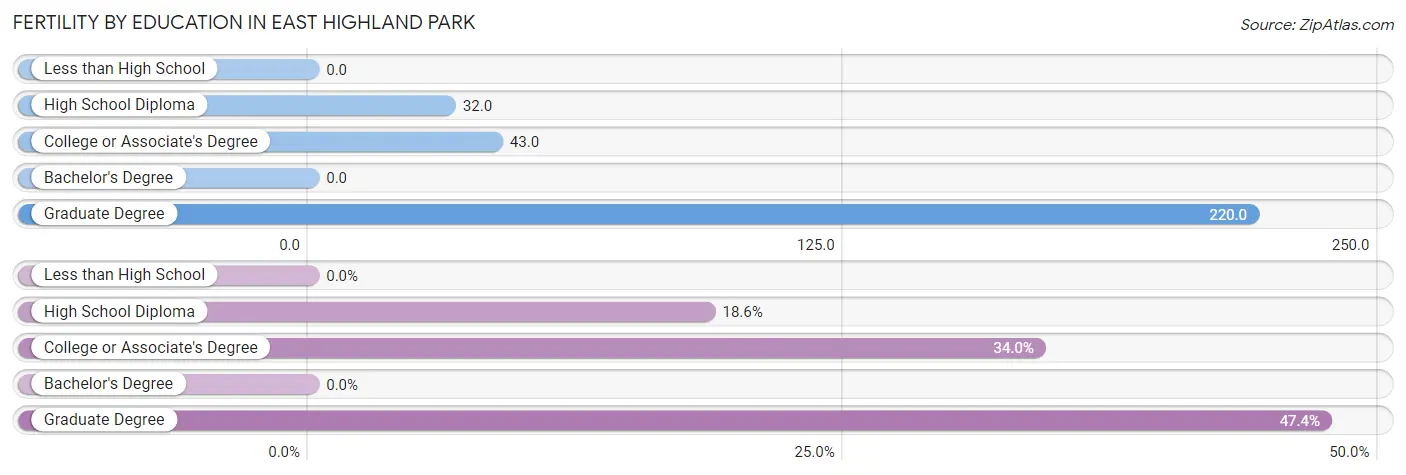
| Educational Attainment | Women with Births | Births / 1,000 Women |
| Less than High School | 0 (0.0%) | 0.0 |
| High School Diploma | 36 (18.6%) | 32.0 |
| College or Associate's Degree | 66 (34.0%) | 43.0 |
| Bachelor's Degree | 0 (0.0%) | 0.0 |
| Graduate Degree | 92 (47.4%) | 220.0 |
| Total | 194 (100.0%) | 46.0 |
Fertility by Education by Marriage Status in East Highland Park
4.6% of women with births in East Highland Park are unmarried. Women with the educational attainment of college or associate's degree are most likely to be married with 100.0% of them married at childbirth, while women with the educational attainment of high school diploma are least likely to be married with 25.0% of them unmarried at childbirth.
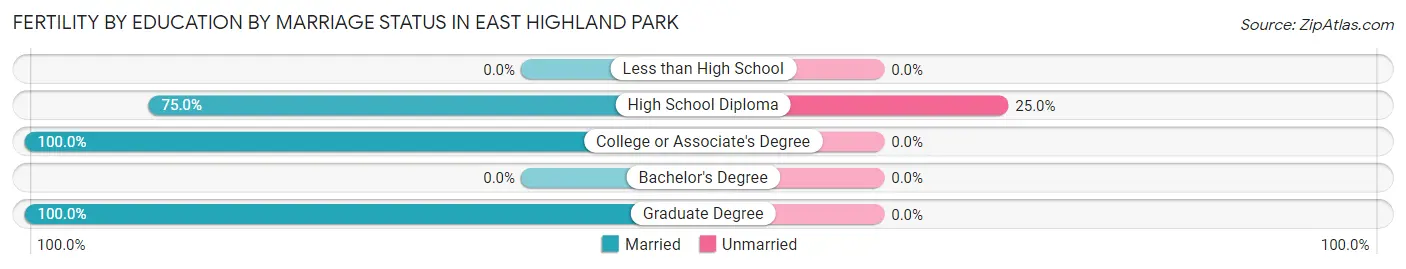
| Educational Attainment | Married | Unmarried |
| Less than High School | 0 (0.0%) | 0 (0.0%) |
| High School Diploma | 27 (75.0%) | 9 (25.0%) |
| College or Associate's Degree | 66 (100.0%) | 0 (0.0%) |
| Bachelor's Degree | 0 (0.0%) | 0 (0.0%) |
| Graduate Degree | 92 (100.0%) | 0 (0.0%) |
| Total | 185 (95.4%) | 9 (4.6%) |
Employment Characteristics in East Highland Park
Employment by Class of Employer in East Highland Park
Among the 9,173 employed individuals in East Highland Park, private company employees (6,440 | 70.2%), local government employees (994 | 10.8%), and not-for-profit organizations (497 | 5.4%) make up the most common classes of employment.
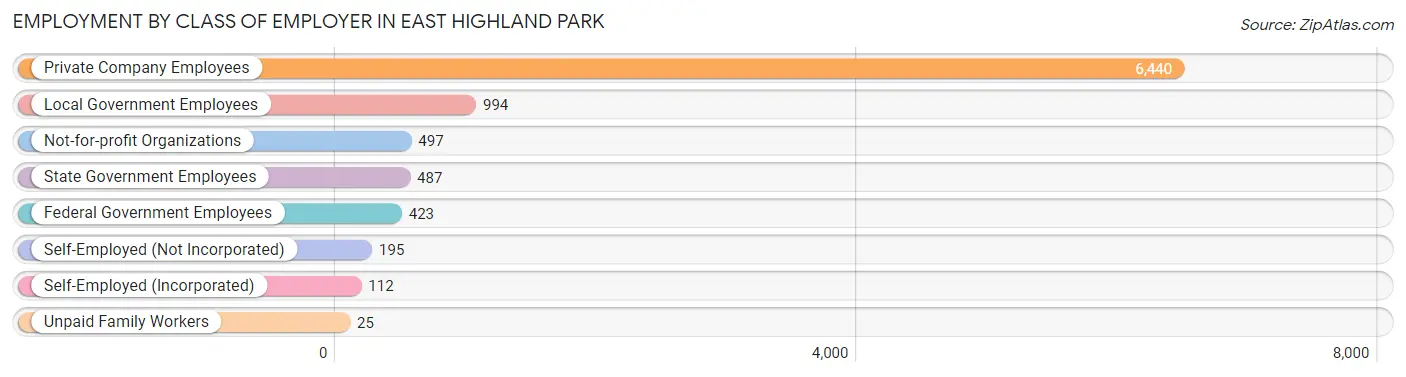
| Employer Class | # Employees | % Employees |
| Private Company Employees | 6,440 | 70.2% |
| Self-Employed (Incorporated) | 112 | 1.2% |
| Self-Employed (Not Incorporated) | 195 | 2.1% |
| Not-for-profit Organizations | 497 | 5.4% |
| Local Government Employees | 994 | 10.8% |
| State Government Employees | 487 | 5.3% |
| Federal Government Employees | 423 | 4.6% |
| Unpaid Family Workers | 25 | 0.3% |
| Total | 9,173 | 100.0% |
Employment Status by Age in East Highland Park
According to the labor force statistics for East Highland Park, out of the total population over 16 years of age (13,568), 71.9% or 9,755 individuals are in the labor force, with 4.0% or 390 of them unemployed. The age group with the highest labor force participation rate is 45 to 54 years, with 94.6% or 2,111 individuals in the labor force. Within the labor force, the 60 to 64 years age range has the highest percentage of unemployed individuals, with 14.4% or 126 of them being unemployed.
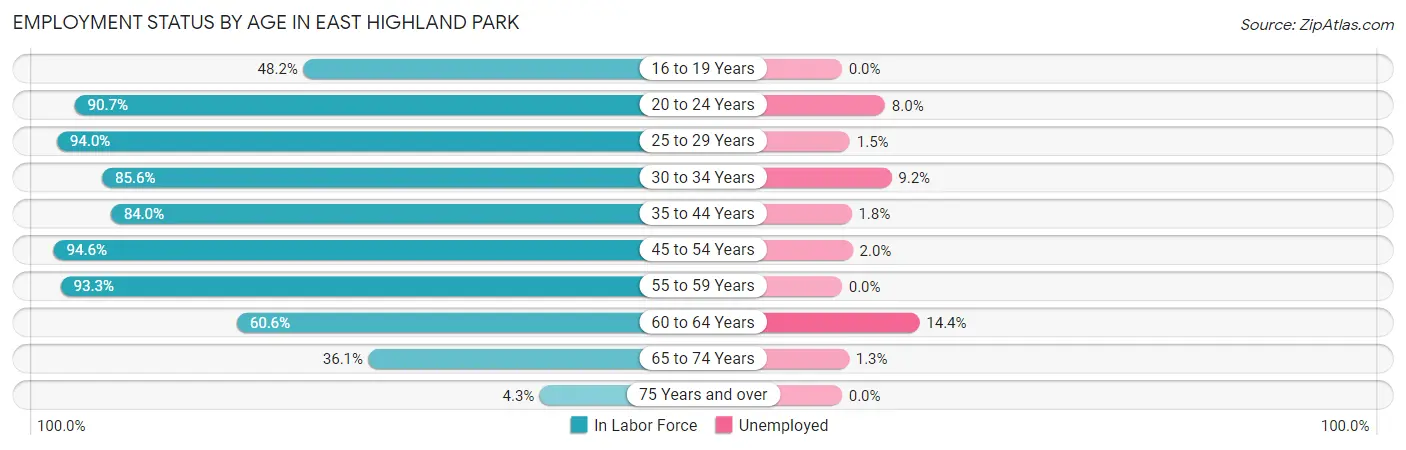
| Age Bracket | In Labor Force | Unemployed |
| 16 to 19 Years | 417 (48.2%) | 0 (0.0%) |
| 20 to 24 Years | 863 (90.7%) | 69 (8.0%) |
| 25 to 29 Years | 964 (94.0%) | 14 (1.5%) |
| 30 to 34 Years | 1,049 (85.6%) | 97 (9.2%) |
| 35 to 44 Years | 1,952 (84.0%) | 35 (1.8%) |
| 45 to 54 Years | 2,111 (94.6%) | 42 (2.0%) |
| 55 to 59 Years | 890 (93.3%) | 0 (0.0%) |
| 60 to 64 Years | 876 (60.6%) | 126 (14.4%) |
| 65 to 74 Years | 597 (36.1%) | 8 (1.3%) |
| 75 Years and over | 38 (4.3%) | 0 (0.0%) |
| Total | 9,755 (71.9%) | 390 (4.0%) |
Employment Status by Educational Attainment in East Highland Park
According to labor force statistics for East Highland Park, 85.2% of individuals (7,843) out of the total population between 25 and 64 years of age (9,205) are in the labor force, with 4.0% or 314 of them being unemployed. The group with the highest labor force participation rate are those with the educational attainment of bachelor's degree or higher, with 96.0% or 1,826 individuals in the labor force. Within the labor force, individuals with college / associate degree education have the highest percentage of unemployment, with 5.9% or 182 of them being unemployed.
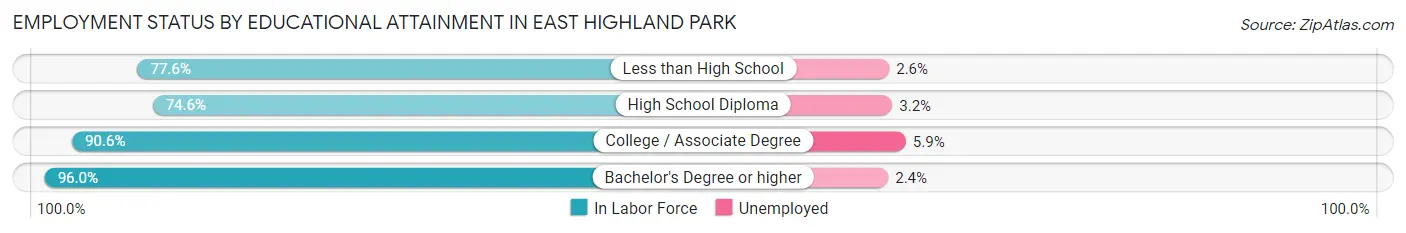
| Educational Attainment | In Labor Force | Unemployed |
| Less than High School | 535 (77.6%) | 18 (2.6%) |
| High School Diploma | 2,387 (74.6%) | 102 (3.2%) |
| College / Associate Degree | 3,093 (90.6%) | 201 (5.9%) |
| Bachelor's Degree or higher | 1,826 (96.0%) | 46 (2.4%) |
| Total | 7,843 (85.2%) | 368 (4.0%) |
Employment Occupations by Sex in East Highland Park
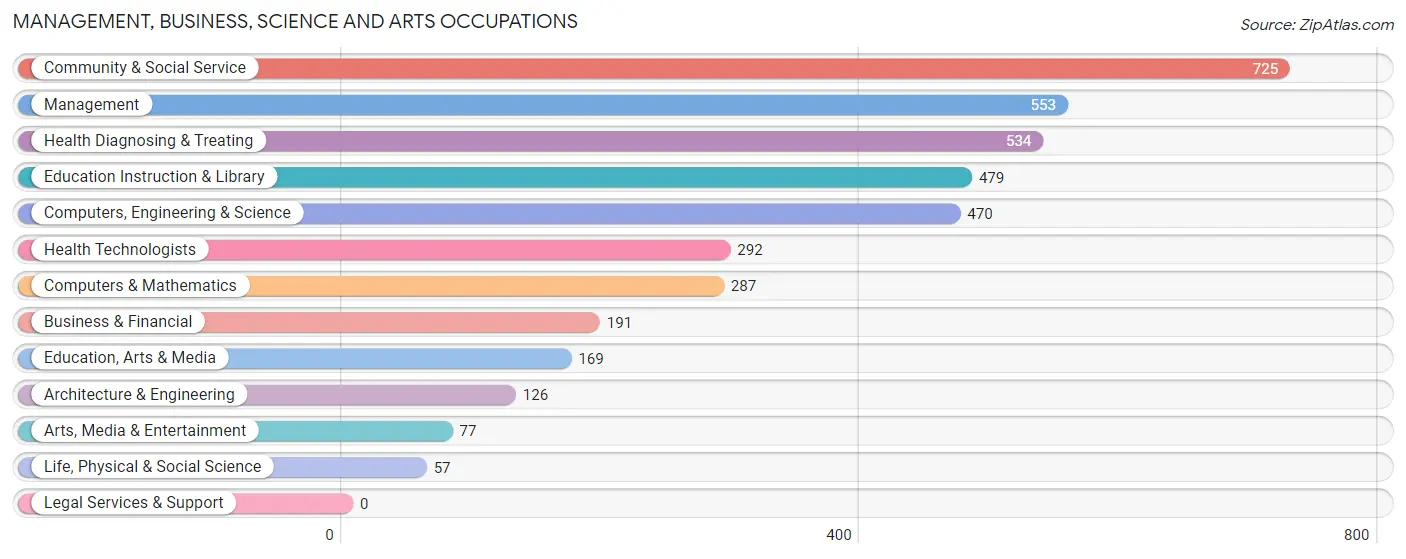
Management, Business, Science and Arts Occupations
The most common Management, Business, Science and Arts occupations in East Highland Park are Community & Social Service (725 | 7.7%), Management (553 | 5.9%), Health Diagnosing & Treating (534 | 5.7%), Education Instruction & Library (479 | 5.1%), and Computers, Engineering & Science (470 | 5.0%).
Management, Business, Science and Arts Occupations by Sex
Within the Management, Business, Science and Arts occupations in East Highland Park, the most male-oriented occupations are Architecture & Engineering (92.9%), Computers & Mathematics (74.9%), and Computers, Engineering & Science (70.6%), while the most female-oriented occupations are Life, Physical & Social Science (100.0%), Health Technologists (100.0%), and Health Diagnosing & Treating (88.0%).
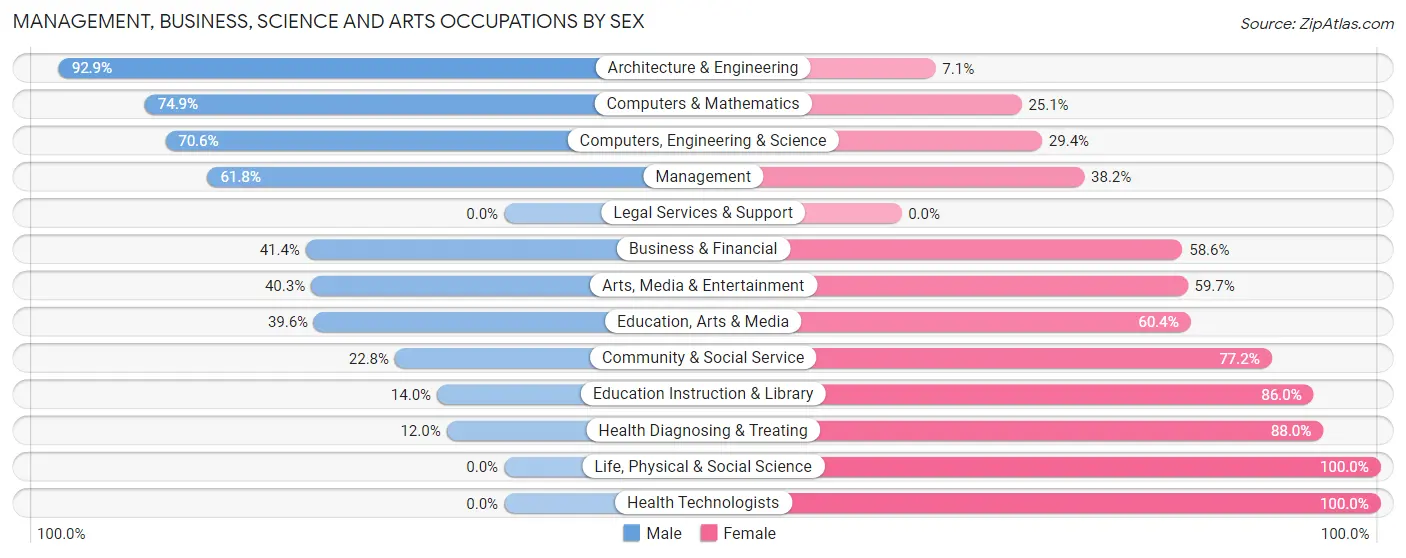
| Occupation | Male | Female |
| Management | 342 (61.8%) | 211 (38.2%) |
| Business & Financial | 79 (41.4%) | 112 (58.6%) |
| Computers, Engineering & Science | 332 (70.6%) | 138 (29.4%) |
| Computers & Mathematics | 215 (74.9%) | 72 (25.1%) |
| Architecture & Engineering | 117 (92.9%) | 9 (7.1%) |
| Life, Physical & Social Science | 0 (0.0%) | 57 (100.0%) |
| Community & Social Service | 165 (22.8%) | 560 (77.2%) |
| Education, Arts & Media | 67 (39.6%) | 102 (60.4%) |
| Legal Services & Support | 0 (0.0%) | 0 (0.0%) |
| Education Instruction & Library | 67 (14.0%) | 412 (86.0%) |
| Arts, Media & Entertainment | 31 (40.3%) | 46 (59.7%) |
| Health Diagnosing & Treating | 64 (12.0%) | 470 (88.0%) |
| Health Technologists | 0 (0.0%) | 292 (100.0%) |
| Total (Category) | 982 (39.7%) | 1,491 (60.3%) |
| Total (Overall) | 4,661 (49.8%) | 4,703 (50.2%) |
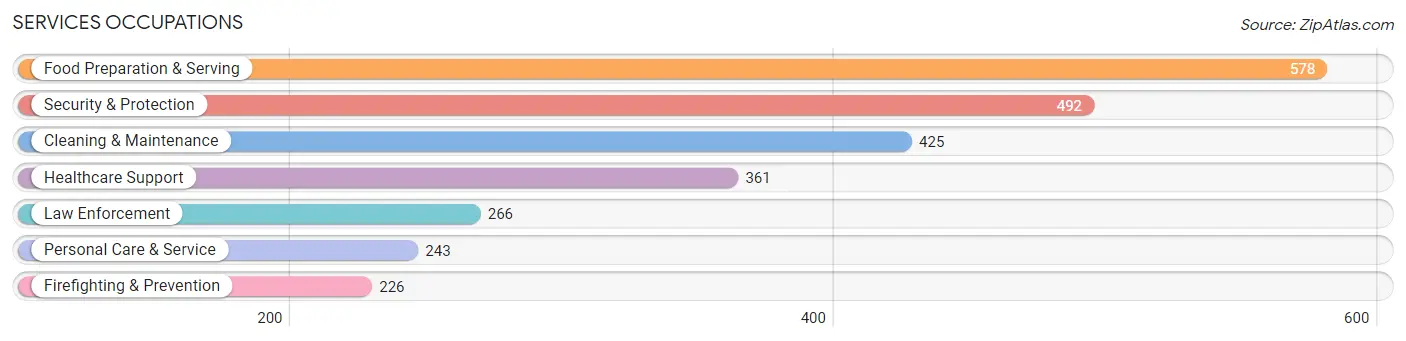
Services Occupations
The most common Services occupations in East Highland Park are Food Preparation & Serving (578 | 6.2%), Security & Protection (492 | 5.2%), Cleaning & Maintenance (425 | 4.5%), Healthcare Support (361 | 3.9%), and Law Enforcement (266 | 2.8%).
Services Occupations by Sex
Within the Services occupations in East Highland Park, the most male-oriented occupations are Law Enforcement (97.4%), Security & Protection (83.3%), and Cleaning & Maintenance (72.2%), while the most female-oriented occupations are Healthcare Support (88.6%), Personal Care & Service (69.1%), and Food Preparation & Serving (45.0%).
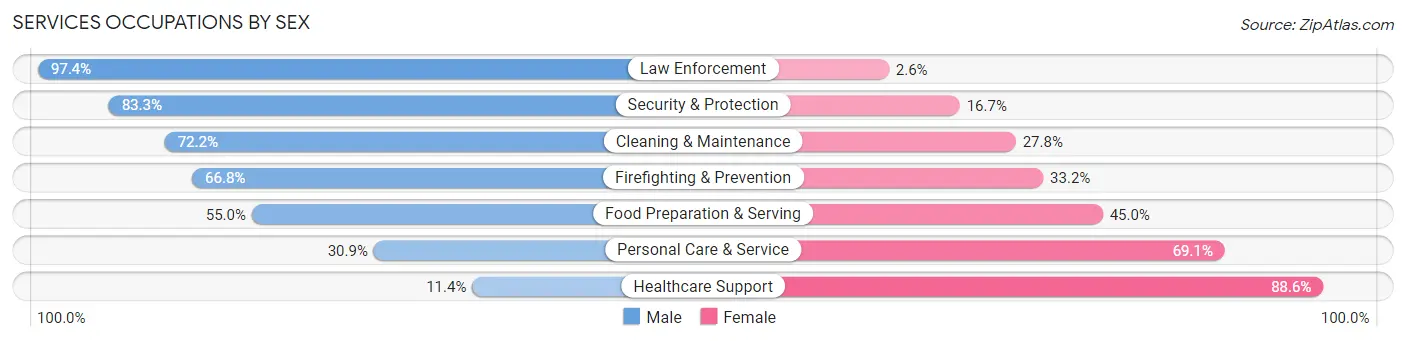
| Occupation | Male | Female |
| Healthcare Support | 41 (11.4%) | 320 (88.6%) |
| Security & Protection | 410 (83.3%) | 82 (16.7%) |
| Firefighting & Prevention | 151 (66.8%) | 75 (33.2%) |
| Law Enforcement | 259 (97.4%) | 7 (2.6%) |
| Food Preparation & Serving | 318 (55.0%) | 260 (45.0%) |
| Cleaning & Maintenance | 307 (72.2%) | 118 (27.8%) |
| Personal Care & Service | 75 (30.9%) | 168 (69.1%) |
| Total (Category) | 1,151 (54.8%) | 948 (45.2%) |
| Total (Overall) | 4,661 (49.8%) | 4,703 (50.2%) |
Sales and Office Occupations
The most common Sales and Office occupations in East Highland Park are Office & Administration (1,372 | 14.6%), and Sales & Related (963 | 10.3%).
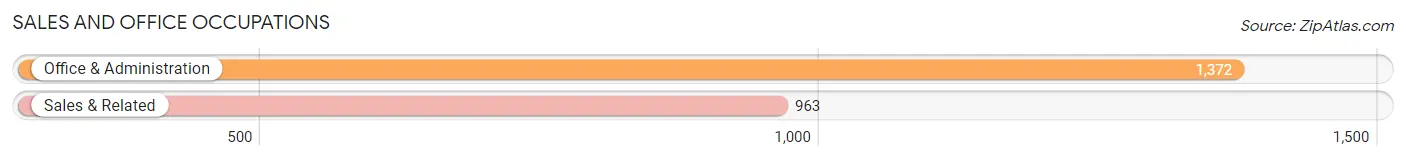
Sales and Office Occupations by Sex
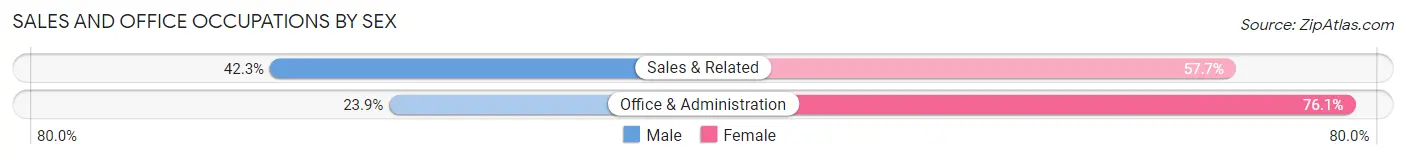
| Occupation | Male | Female |
| Sales & Related | 407 (42.3%) | 556 (57.7%) |
| Office & Administration | 328 (23.9%) | 1,044 (76.1%) |
| Total (Category) | 735 (31.5%) | 1,600 (68.5%) |
| Total (Overall) | 4,661 (49.8%) | 4,703 (50.2%) |
Natural Resources, Construction and Maintenance Occupations
The most common Natural Resources, Construction and Maintenance occupations in East Highland Park are Construction & Extraction (196 | 2.1%), and Installation, Maintenance & Repair (175 | 1.9%).
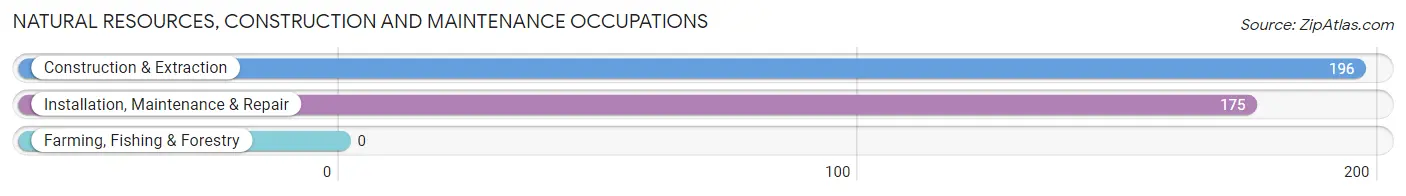
Natural Resources, Construction and Maintenance Occupations by Sex
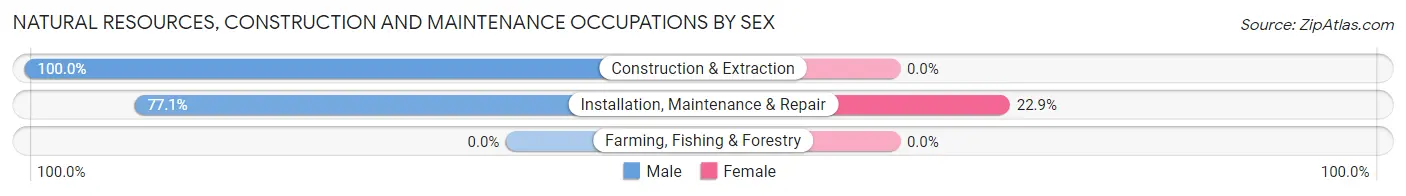
| Occupation | Male | Female |
| Farming, Fishing & Forestry | 0 (0.0%) | 0 (0.0%) |
| Construction & Extraction | 196 (100.0%) | 0 (0.0%) |
| Installation, Maintenance & Repair | 135 (77.1%) | 40 (22.9%) |
| Total (Category) | 331 (89.2%) | 40 (10.8%) |
| Total (Overall) | 4,661 (49.8%) | 4,703 (50.2%) |
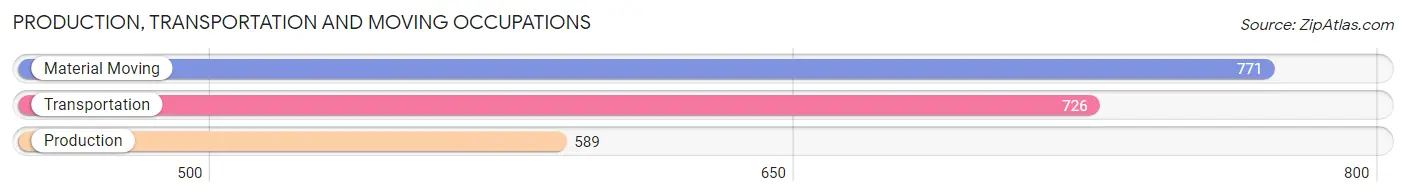
Production, Transportation and Moving Occupations
The most common Production, Transportation and Moving occupations in East Highland Park are Material Moving (771 | 8.2%), Transportation (726 | 7.7%), and Production (589 | 6.3%).
Production, Transportation and Moving Occupations by Sex
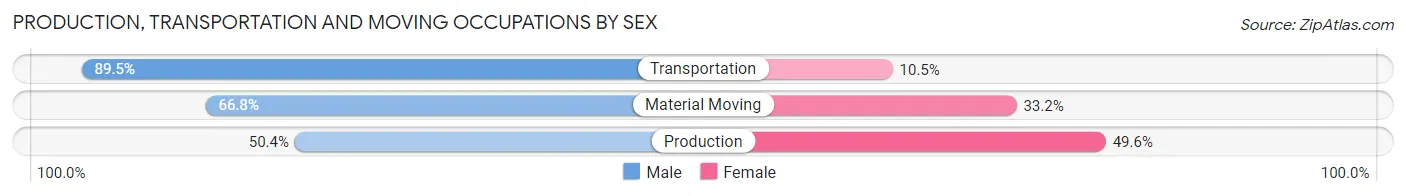
| Occupation | Male | Female |
| Production | 297 (50.4%) | 292 (49.6%) |
| Transportation | 650 (89.5%) | 76 (10.5%) |
| Material Moving | 515 (66.8%) | 256 (33.2%) |
| Total (Category) | 1,462 (70.1%) | 624 (29.9%) |
| Total (Overall) | 4,661 (49.8%) | 4,703 (50.2%) |
Employment Industries by Sex in East Highland Park
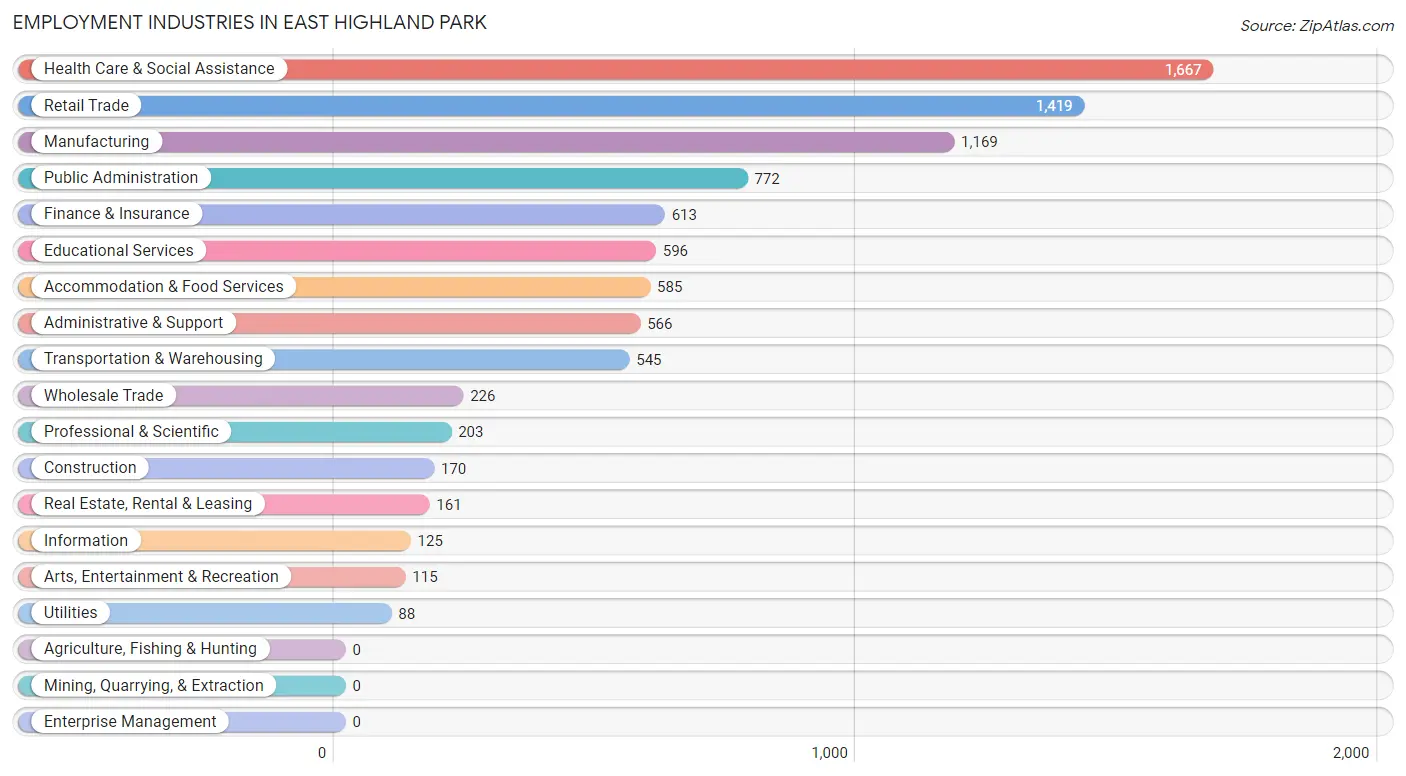
Employment Industries in East Highland Park
The major employment industries in East Highland Park include Health Care & Social Assistance (1,667 | 17.8%), Retail Trade (1,419 | 15.1%), Manufacturing (1,169 | 12.5%), Public Administration (772 | 8.2%), and Finance & Insurance (613 | 6.6%).
Employment Industries by Sex in East Highland Park
The East Highland Park industries that see more men than women are Construction (92.9%), Administrative & Support (86.6%), and Real Estate, Rental & Leasing (79.5%), whereas the industries that tend to have a higher number of women are Professional & Scientific (88.2%), Educational Services (80.4%), and Health Care & Social Assistance (72.1%).
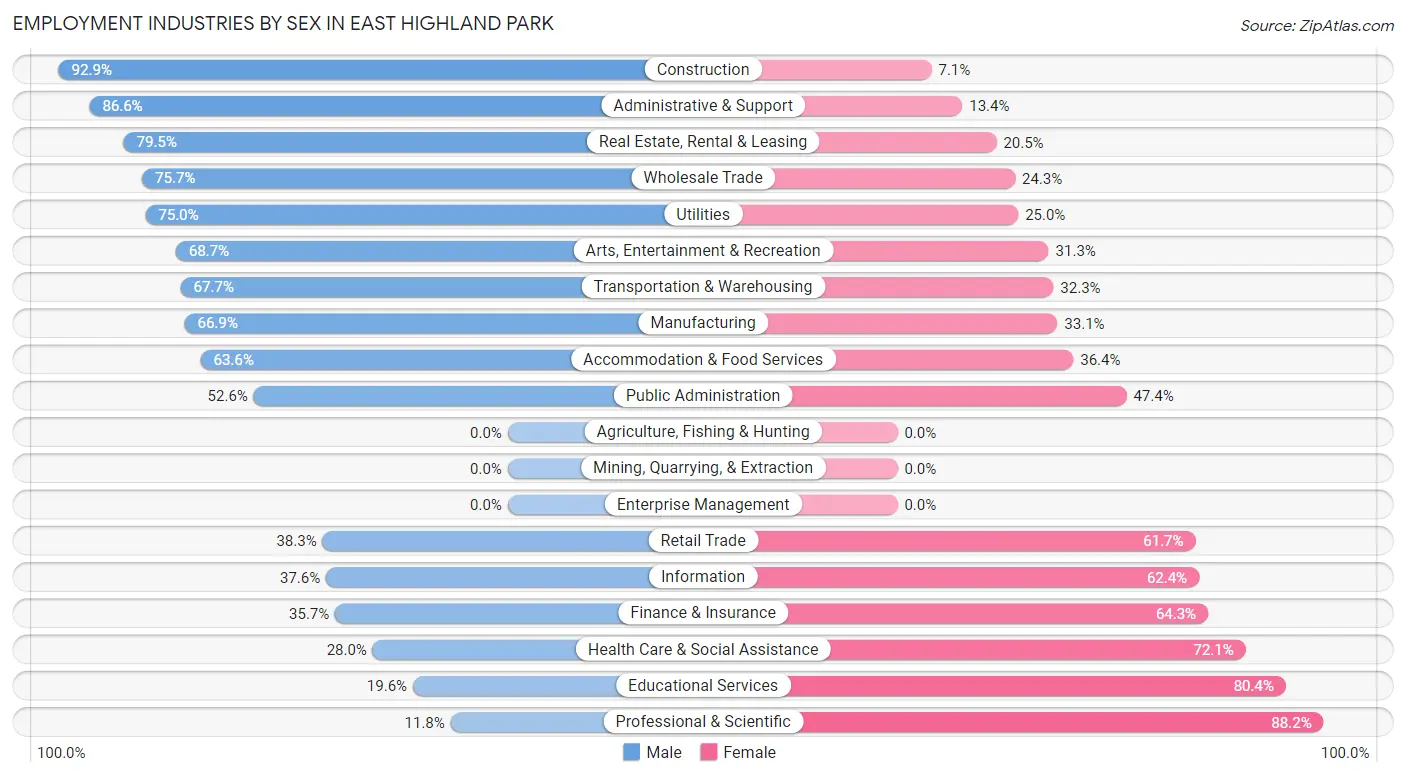
| Industry | Male | Female |
| Agriculture, Fishing & Hunting | 0 (0.0%) | 0 (0.0%) |
| Mining, Quarrying, & Extraction | 0 (0.0%) | 0 (0.0%) |
| Construction | 158 (92.9%) | 12 (7.1%) |
| Manufacturing | 782 (66.9%) | 387 (33.1%) |
| Wholesale Trade | 171 (75.7%) | 55 (24.3%) |
| Retail Trade | 544 (38.3%) | 875 (61.7%) |
| Transportation & Warehousing | 369 (67.7%) | 176 (32.3%) |
| Utilities | 66 (75.0%) | 22 (25.0%) |
| Information | 47 (37.6%) | 78 (62.4%) |
| Finance & Insurance | 219 (35.7%) | 394 (64.3%) |
| Real Estate, Rental & Leasing | 128 (79.5%) | 33 (20.5%) |
| Professional & Scientific | 24 (11.8%) | 179 (88.2%) |
| Enterprise Management | 0 (0.0%) | 0 (0.0%) |
| Administrative & Support | 490 (86.6%) | 76 (13.4%) |
| Educational Services | 117 (19.6%) | 479 (80.4%) |
| Health Care & Social Assistance | 466 (28.0%) | 1,201 (72.1%) |
| Arts, Entertainment & Recreation | 79 (68.7%) | 36 (31.3%) |
| Accommodation & Food Services | 372 (63.6%) | 213 (36.4%) |
| Public Administration | 406 (52.6%) | 366 (47.4%) |
| Total | 4,661 (49.8%) | 4,703 (50.2%) |
Education in East Highland Park
School Enrollment in East Highland Park
The most common levels of schooling among the 3,742 students in East Highland Park are high school (903 | 24.1%), college / undergraduate (846 | 22.6%), and elementary school (810 | 21.6%).
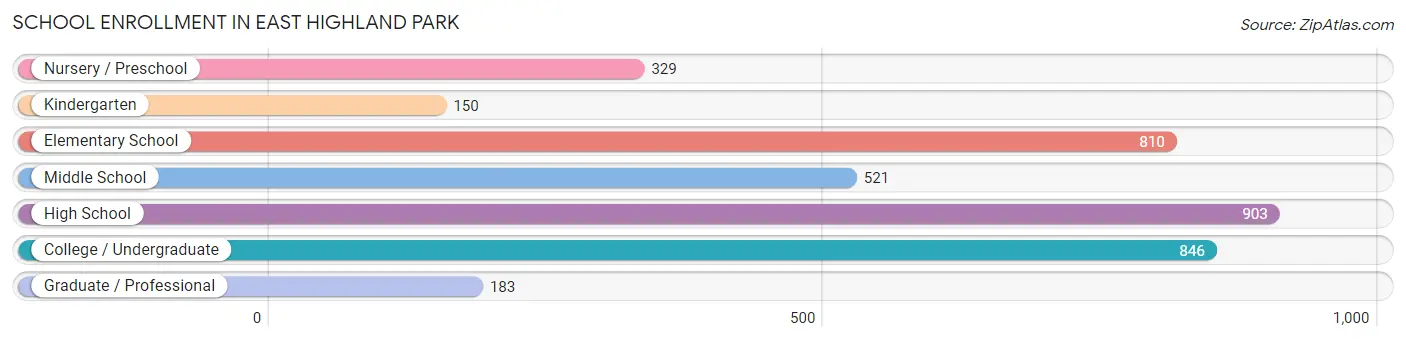
| School Level | # Students | % Students |
| Nursery / Preschool | 329 | 8.8% |
| Kindergarten | 150 | 4.0% |
| Elementary School | 810 | 21.6% |
| Middle School | 521 | 13.9% |
| High School | 903 | 24.1% |
| College / Undergraduate | 846 | 22.6% |
| Graduate / Professional | 183 | 4.9% |
| Total | 3,742 | 100.0% |
School Enrollment by Age by Funding Source in East Highland Park
Out of a total of 3,742 students who are enrolled in schools in East Highland Park, 741 (19.8%) attend a private institution, while the remaining 3,001 (80.2%) are enrolled in public schools. The age group of 35 years and over has the highest likelihood of being enrolled in private schools, with 203 (54.4% in the age bracket) enrolled. Conversely, the age group of 18 to 19 year olds has the lowest likelihood of being enrolled in a private school, with 213 (100.0% in the age bracket) attending a public institution.
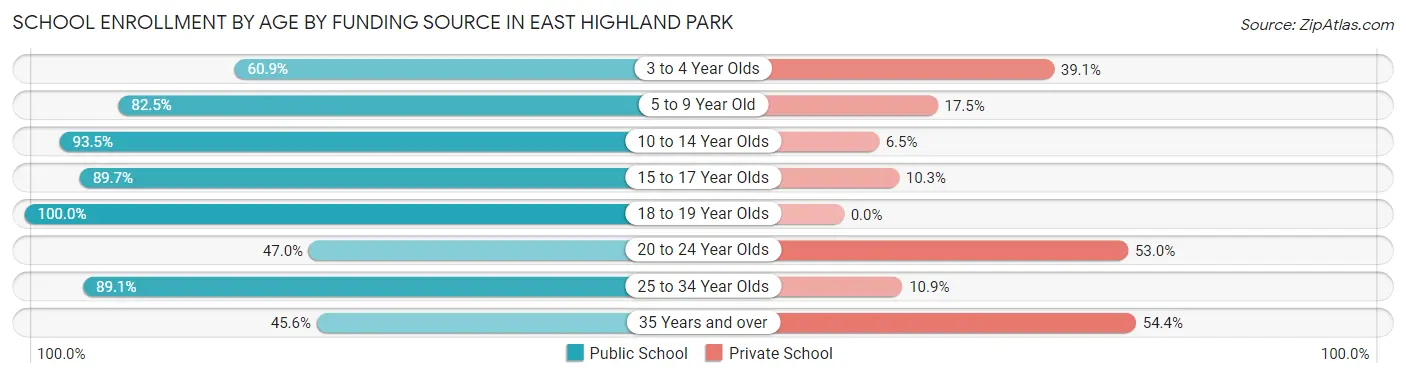
| Age Bracket | Public School | Private School |
| 3 to 4 Year Olds | 56 (60.9%) | 36 (39.1%) |
| 5 to 9 Year Old | 916 (82.5%) | 194 (17.5%) |
| 10 to 14 Year Olds | 630 (93.5%) | 44 (6.5%) |
| 15 to 17 Year Olds | 629 (89.7%) | 72 (10.3%) |
| 18 to 19 Year Olds | 213 (100.0%) | 0 (0.0%) |
| 20 to 24 Year Olds | 143 (47.0%) | 161 (53.0%) |
| 25 to 34 Year Olds | 245 (89.1%) | 30 (10.9%) |
| 35 Years and over | 170 (45.6%) | 203 (54.4%) |
| Total | 3,001 (80.2%) | 741 (19.8%) |
Educational Attainment by Field of Study in East Highland Park
Education (510 | 19.4%), business (454 | 17.2%), arts & humanities (217 | 8.2%), social sciences (210 | 8.0%), and literature & languages (182 | 6.9%) are the most common fields of study among 2,633 individuals in East Highland Park who have obtained a bachelor's degree or higher.
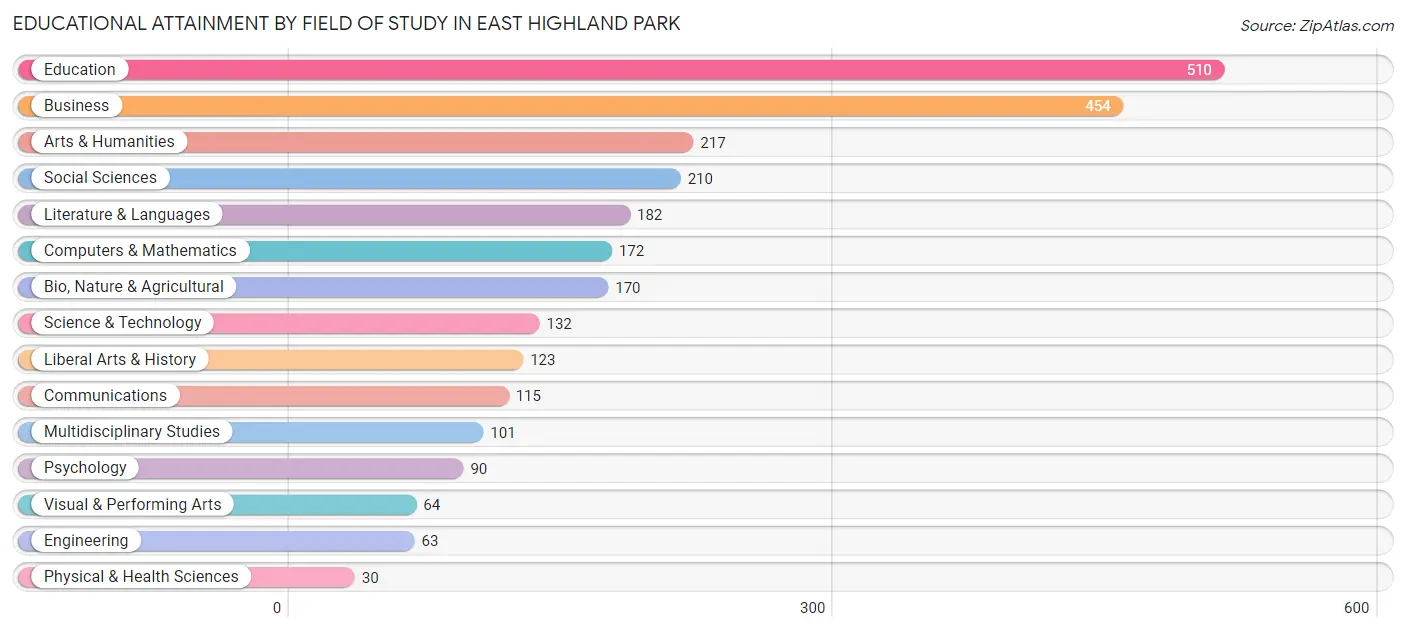
| Field of Study | # Graduates | % Graduates |
| Computers & Mathematics | 172 | 6.5% |
| Bio, Nature & Agricultural | 170 | 6.5% |
| Physical & Health Sciences | 30 | 1.1% |
| Psychology | 90 | 3.4% |
| Social Sciences | 210 | 8.0% |
| Engineering | 63 | 2.4% |
| Multidisciplinary Studies | 101 | 3.8% |
| Science & Technology | 132 | 5.0% |
| Business | 454 | 17.2% |
| Education | 510 | 19.4% |
| Literature & Languages | 182 | 6.9% |
| Liberal Arts & History | 123 | 4.7% |
| Visual & Performing Arts | 64 | 2.4% |
| Communications | 115 | 4.4% |
| Arts & Humanities | 217 | 8.2% |
| Total | 2,633 | 100.0% |
Transportation & Commute in East Highland Park
Vehicle Availability by Sex in East Highland Park
The most prevalent vehicle ownership categories in East Highland Park are males with 2 vehicles (1,503, accounting for 32.5%) and females with 2 vehicles (1,642, making up 33.1%).
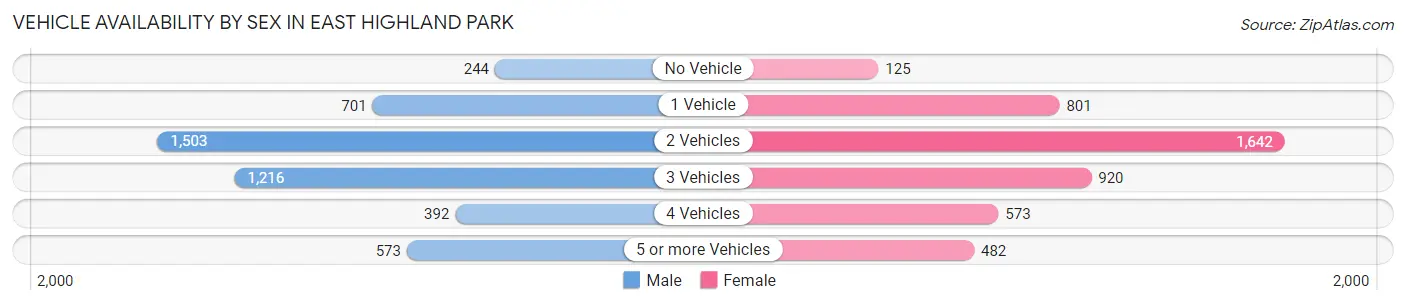
| Vehicles Available | Male | Female |
| No Vehicle | 244 (5.3%) | 125 (2.8%) |
| 1 Vehicle | 701 (15.1%) | 801 (17.6%) |
| 2 Vehicles | 1,503 (32.5%) | 1,642 (36.1%) |
| 3 Vehicles | 1,216 (26.3%) | 920 (20.3%) |
| 4 Vehicles | 392 (8.5%) | 573 (12.6%) |
| 5 or more Vehicles | 573 (12.4%) | 482 (10.6%) |
| Total | 4,629 (100.0%) | 4,543 (100.0%) |
Commute Time in East Highland Park
The most frequently occuring commute durations in East Highland Park are 20 to 24 minutes (2,017 commuters, 25.0%), 15 to 19 minutes (1,407 commuters, 17.4%), and 30 to 34 minutes (1,321 commuters, 16.4%).
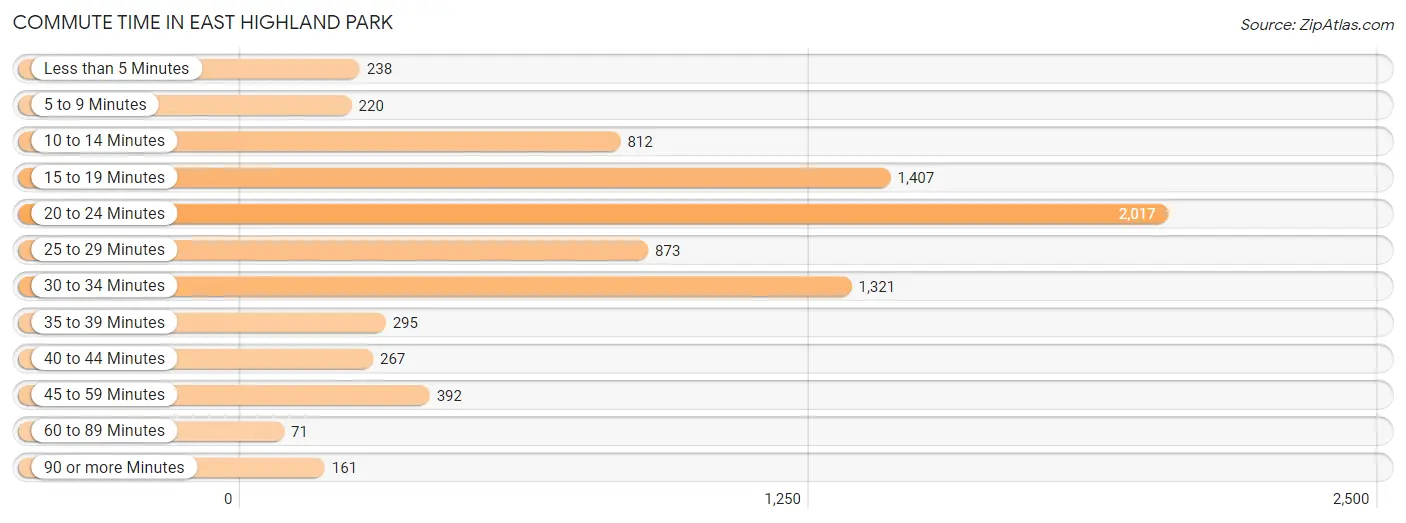
| Commute Time | # Commuters | % Commuters |
| Less than 5 Minutes | 238 | 2.9% |
| 5 to 9 Minutes | 220 | 2.7% |
| 10 to 14 Minutes | 812 | 10.1% |
| 15 to 19 Minutes | 1,407 | 17.4% |
| 20 to 24 Minutes | 2,017 | 25.0% |
| 25 to 29 Minutes | 873 | 10.8% |
| 30 to 34 Minutes | 1,321 | 16.4% |
| 35 to 39 Minutes | 295 | 3.6% |
| 40 to 44 Minutes | 267 | 3.3% |
| 45 to 59 Minutes | 392 | 4.9% |
| 60 to 89 Minutes | 71 | 0.9% |
| 90 or more Minutes | 161 | 2.0% |
Commute Time by Sex in East Highland Park
The most common commute times in East Highland Park are 20 to 24 minutes (1,192 commuters, 27.5%) for males and 20 to 24 minutes (825 commuters, 22.1%) for females.
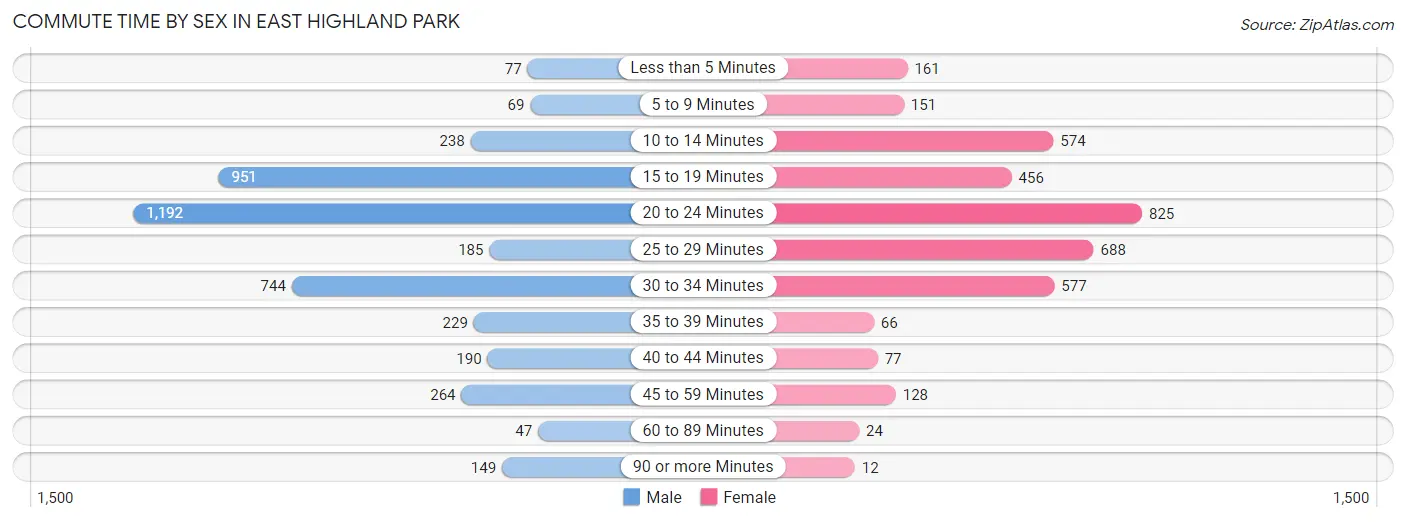
| Commute Time | Male | Female |
| Less than 5 Minutes | 77 (1.8%) | 161 (4.3%) |
| 5 to 9 Minutes | 69 (1.6%) | 151 (4.0%) |
| 10 to 14 Minutes | 238 (5.5%) | 574 (15.3%) |
| 15 to 19 Minutes | 951 (21.9%) | 456 (12.2%) |
| 20 to 24 Minutes | 1,192 (27.5%) | 825 (22.1%) |
| 25 to 29 Minutes | 185 (4.3%) | 688 (18.4%) |
| 30 to 34 Minutes | 744 (17.2%) | 577 (15.4%) |
| 35 to 39 Minutes | 229 (5.3%) | 66 (1.8%) |
| 40 to 44 Minutes | 190 (4.4%) | 77 (2.1%) |
| 45 to 59 Minutes | 264 (6.1%) | 128 (3.4%) |
| 60 to 89 Minutes | 47 (1.1%) | 24 (0.6%) |
| 90 or more Minutes | 149 (3.4%) | 12 (0.3%) |
Time of Departure to Work by Sex in East Highland Park
The most frequent times of departure to work in East Highland Park are 7:00 AM to 7:29 AM (564, 13.0%) for males and 6:30 AM to 6:59 AM (576, 15.4%) for females.
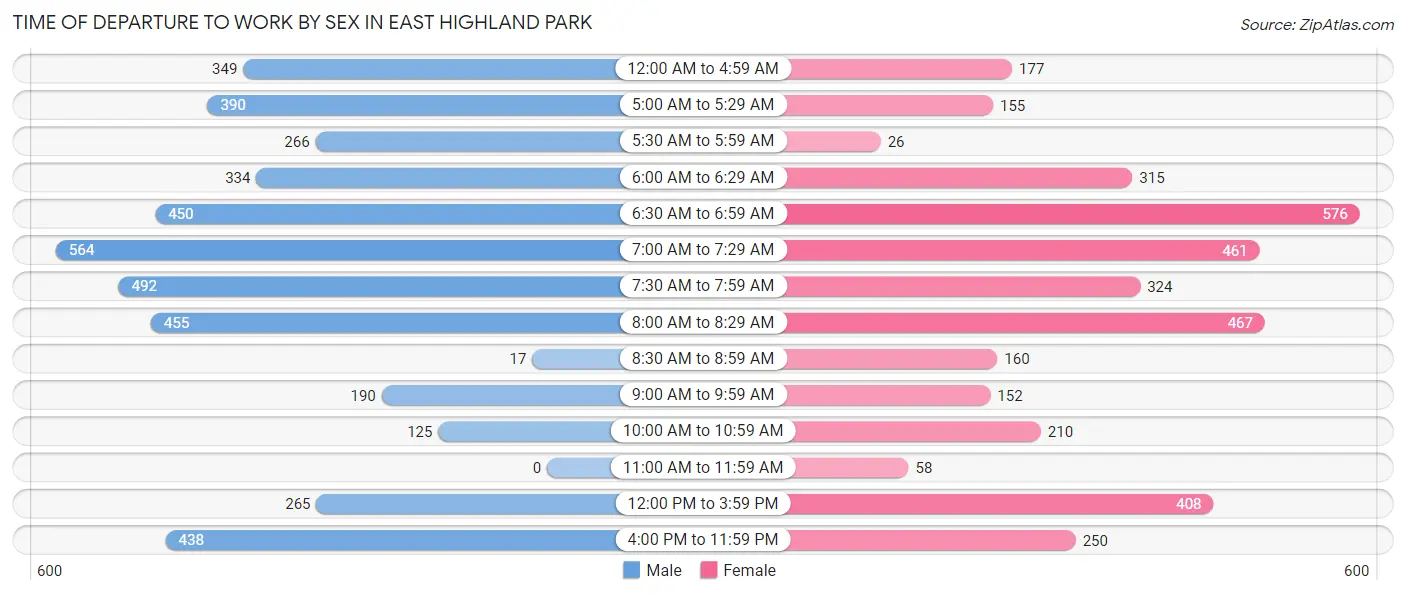
| Time of Departure | Male | Female |
| 12:00 AM to 4:59 AM | 349 (8.1%) | 177 (4.7%) |
| 5:00 AM to 5:29 AM | 390 (9.0%) | 155 (4.2%) |
| 5:30 AM to 5:59 AM | 266 (6.1%) | 26 (0.7%) |
| 6:00 AM to 6:29 AM | 334 (7.7%) | 315 (8.4%) |
| 6:30 AM to 6:59 AM | 450 (10.4%) | 576 (15.4%) |
| 7:00 AM to 7:29 AM | 564 (13.0%) | 461 (12.3%) |
| 7:30 AM to 7:59 AM | 492 (11.4%) | 324 (8.7%) |
| 8:00 AM to 8:29 AM | 455 (10.5%) | 467 (12.5%) |
| 8:30 AM to 8:59 AM | 17 (0.4%) | 160 (4.3%) |
| 9:00 AM to 9:59 AM | 190 (4.4%) | 152 (4.1%) |
| 10:00 AM to 10:59 AM | 125 (2.9%) | 210 (5.6%) |
| 11:00 AM to 11:59 AM | 0 (0.0%) | 58 (1.5%) |
| 12:00 PM to 3:59 PM | 265 (6.1%) | 408 (10.9%) |
| 4:00 PM to 11:59 PM | 438 (10.1%) | 250 (6.7%) |
| Total | 4,335 (100.0%) | 3,739 (100.0%) |
Housing Occupancy in East Highland Park
Occupancy by Ownership in East Highland Park
Of the total 6,555 dwellings in East Highland Park, owner-occupied units account for 4,491 (68.5%), while renter-occupied units make up 2,064 (31.5%).
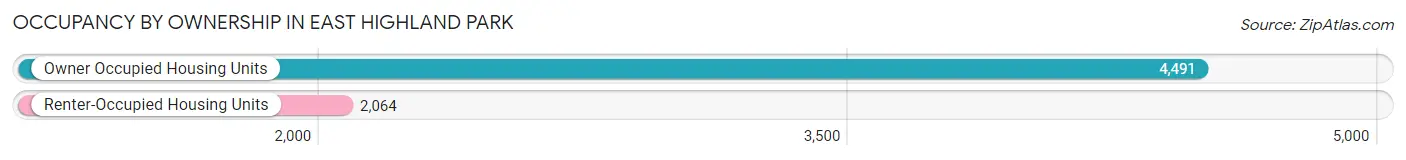
| Occupancy | # Housing Units | % Housing Units |
| Owner Occupied Housing Units | 4,491 | 68.5% |
| Renter-Occupied Housing Units | 2,064 | 31.5% |
| Total Occupied Housing Units | 6,555 | 100.0% |
Occupancy by Household Size in East Highland Park
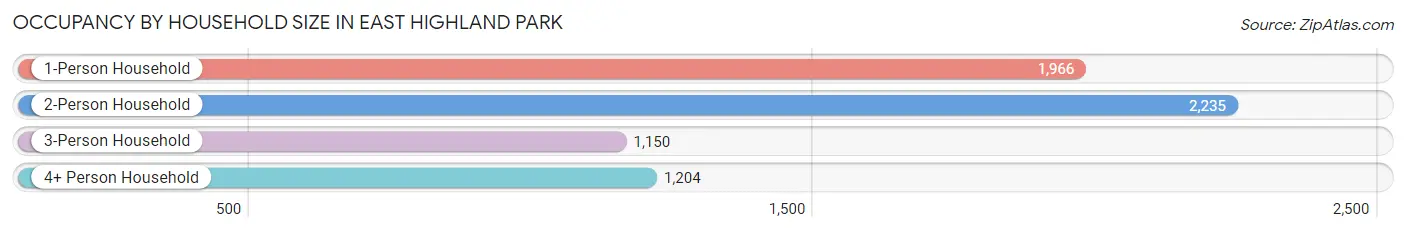
| Household Size | # Housing Units | % Housing Units |
| 1-Person Household | 1,966 | 30.0% |
| 2-Person Household | 2,235 | 34.1% |
| 3-Person Household | 1,150 | 17.5% |
| 4+ Person Household | 1,204 | 18.4% |
| Total Housing Units | 6,555 | 100.0% |
Occupancy by Ownership by Household Size in East Highland Park
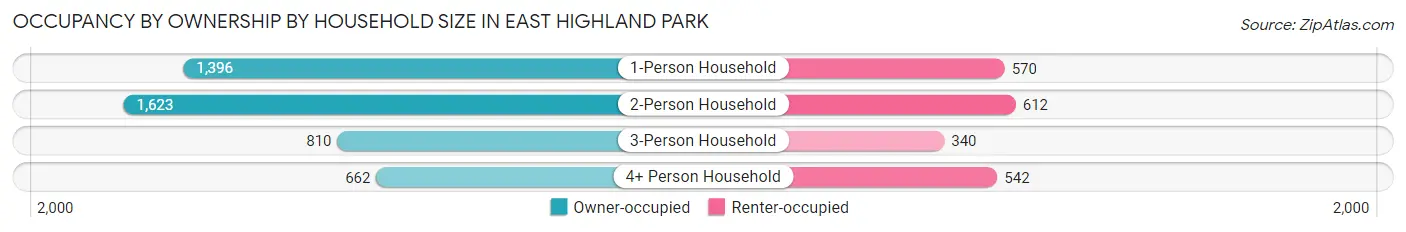
| Household Size | Owner-occupied | Renter-occupied |
| 1-Person Household | 1,396 (71.0%) | 570 (29.0%) |
| 2-Person Household | 1,623 (72.6%) | 612 (27.4%) |
| 3-Person Household | 810 (70.4%) | 340 (29.6%) |
| 4+ Person Household | 662 (55.0%) | 542 (45.0%) |
| Total Housing Units | 4,491 (68.5%) | 2,064 (31.5%) |
Occupancy by Educational Attainment in East Highland Park
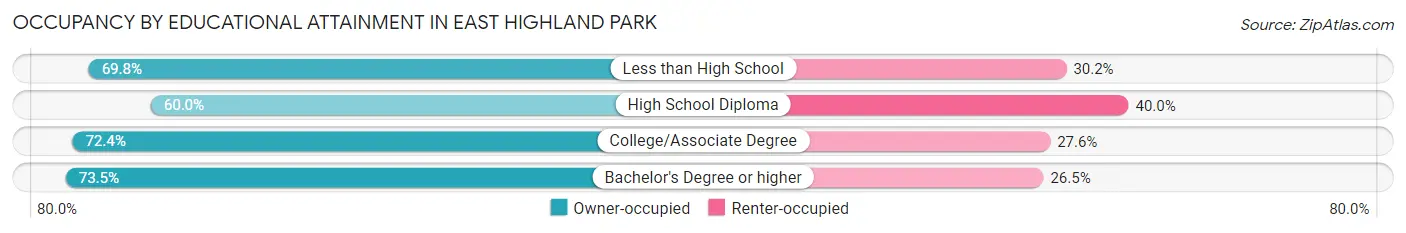
| Household Size | Owner-occupied | Renter-occupied |
| Less than High School | 435 (69.8%) | 188 (30.2%) |
| High School Diploma | 1,236 (60.0%) | 825 (40.0%) |
| College/Associate Degree | 1,613 (72.4%) | 615 (27.6%) |
| Bachelor's Degree or higher | 1,207 (73.5%) | 436 (26.5%) |
Occupancy by Age of Householder in East Highland Park
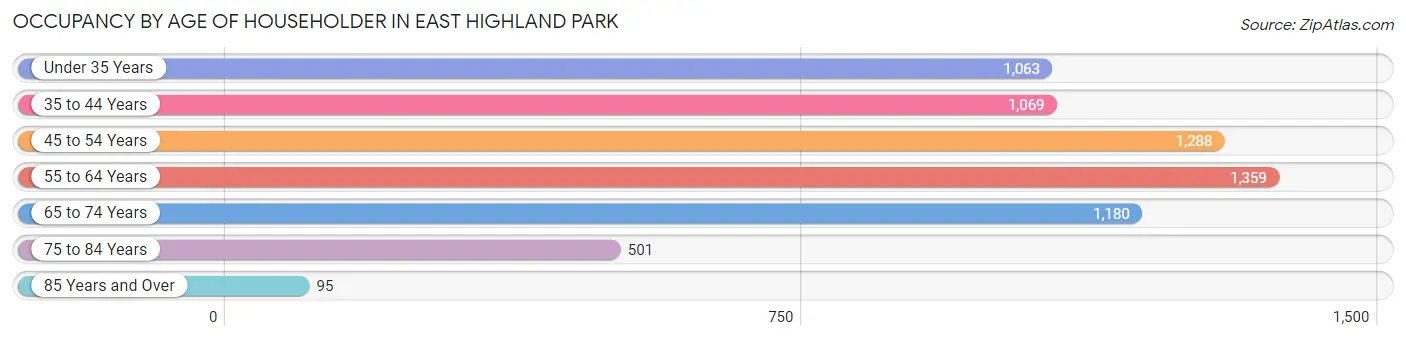
| Age Bracket | # Households | % Households |
| Under 35 Years | 1,063 | 16.2% |
| 35 to 44 Years | 1,069 | 16.3% |
| 45 to 54 Years | 1,288 | 19.7% |
| 55 to 64 Years | 1,359 | 20.7% |
| 65 to 74 Years | 1,180 | 18.0% |
| 75 to 84 Years | 501 | 7.6% |
| 85 Years and Over | 95 | 1.5% |
| Total | 6,555 | 100.0% |
Housing Finances in East Highland Park
Median Income by Occupancy in East Highland Park
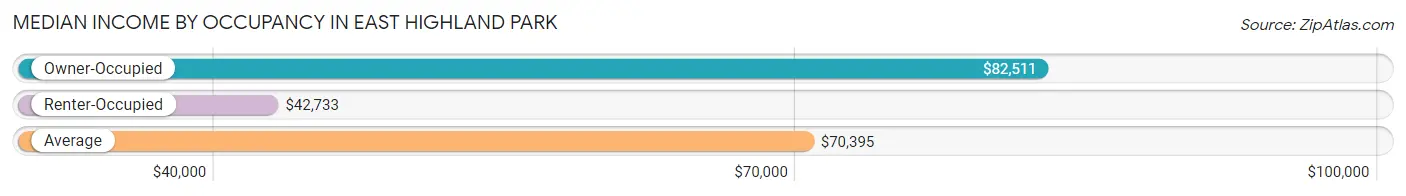
| Occupancy Type | # Households | Median Income |
| Owner-Occupied | 4,491 (68.5%) | $82,511 |
| Renter-Occupied | 2,064 (31.5%) | $42,733 |
| Average | 6,555 (100.0%) | $70,395 |
Occupancy by Householder Income Bracket in East Highland Park
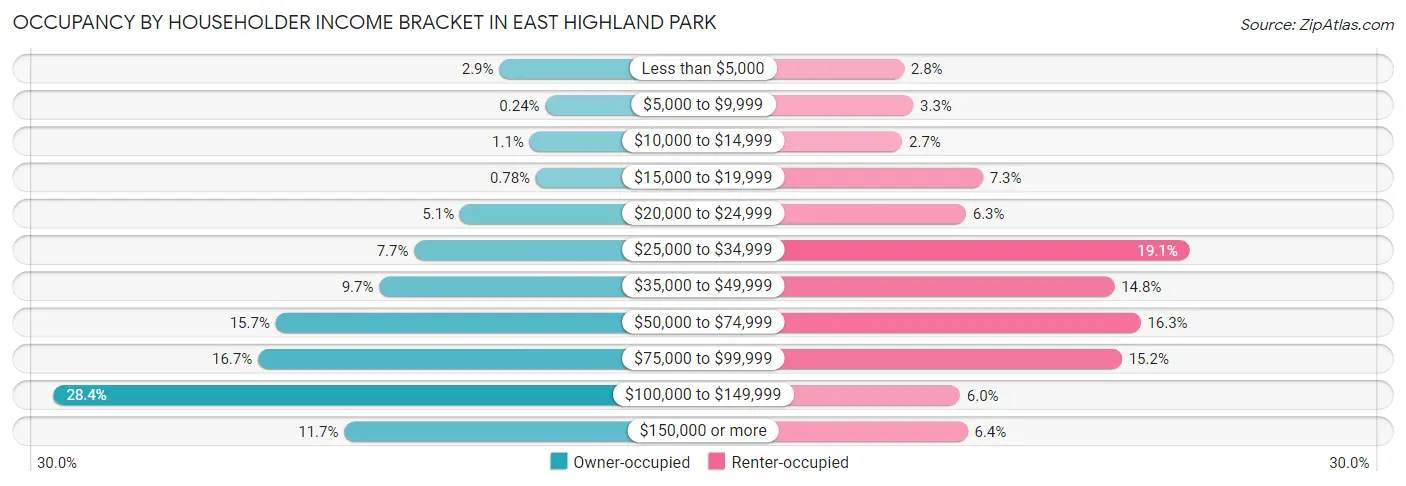
| Income Bracket | Owner-occupied | Renter-occupied |
| Less than $5,000 | 129 (2.9%) | 57 (2.8%) |
| $5,000 to $9,999 | 11 (0.2%) | 68 (3.3%) |
| $10,000 to $14,999 | 51 (1.1%) | 55 (2.7%) |
| $15,000 to $19,999 | 35 (0.8%) | 150 (7.3%) |
| $20,000 to $24,999 | 230 (5.1%) | 130 (6.3%) |
| $25,000 to $34,999 | 347 (7.7%) | 394 (19.1%) |
| $35,000 to $49,999 | 437 (9.7%) | 305 (14.8%) |
| $50,000 to $74,999 | 703 (15.7%) | 336 (16.3%) |
| $75,000 to $99,999 | 748 (16.7%) | 314 (15.2%) |
| $100,000 to $149,999 | 1,273 (28.3%) | 123 (6.0%) |
| $150,000 or more | 527 (11.7%) | 132 (6.4%) |
| Total | 4,491 (100.0%) | 2,064 (100.0%) |
Monthly Housing Cost Tiers in East Highland Park
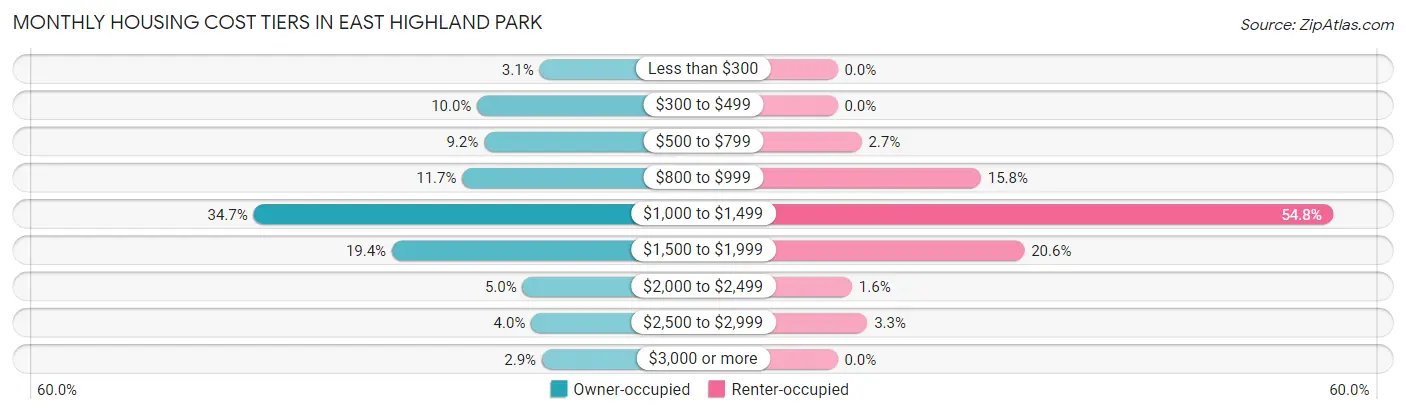
| Monthly Cost | Owner-occupied | Renter-occupied |
| Less than $300 | 140 (3.1%) | 0 (0.0%) |
| $300 to $499 | 449 (10.0%) | 0 (0.0%) |
| $500 to $799 | 415 (9.2%) | 55 (2.7%) |
| $800 to $999 | 523 (11.7%) | 327 (15.8%) |
| $1,000 to $1,499 | 1,559 (34.7%) | 1,131 (54.8%) |
| $1,500 to $1,999 | 872 (19.4%) | 426 (20.6%) |
| $2,000 to $2,499 | 224 (5.0%) | 33 (1.6%) |
| $2,500 to $2,999 | 181 (4.0%) | 68 (3.3%) |
| $3,000 or more | 128 (2.9%) | 0 (0.0%) |
| Total | 4,491 (100.0%) | 2,064 (100.0%) |
Physical Housing Characteristics in East Highland Park
Housing Structures in East Highland Park
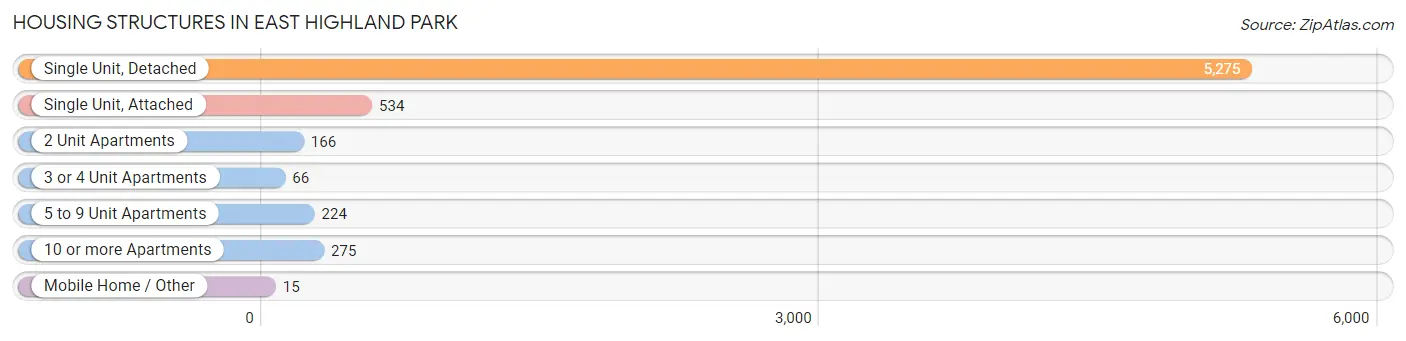
| Structure Type | # Housing Units | % Housing Units |
| Single Unit, Detached | 5,275 | 80.5% |
| Single Unit, Attached | 534 | 8.2% |
| 2 Unit Apartments | 166 | 2.5% |
| 3 or 4 Unit Apartments | 66 | 1.0% |
| 5 to 9 Unit Apartments | 224 | 3.4% |
| 10 or more Apartments | 275 | 4.2% |
| Mobile Home / Other | 15 | 0.2% |
| Total | 6,555 | 100.0% |
Housing Structures by Occupancy in East Highland Park
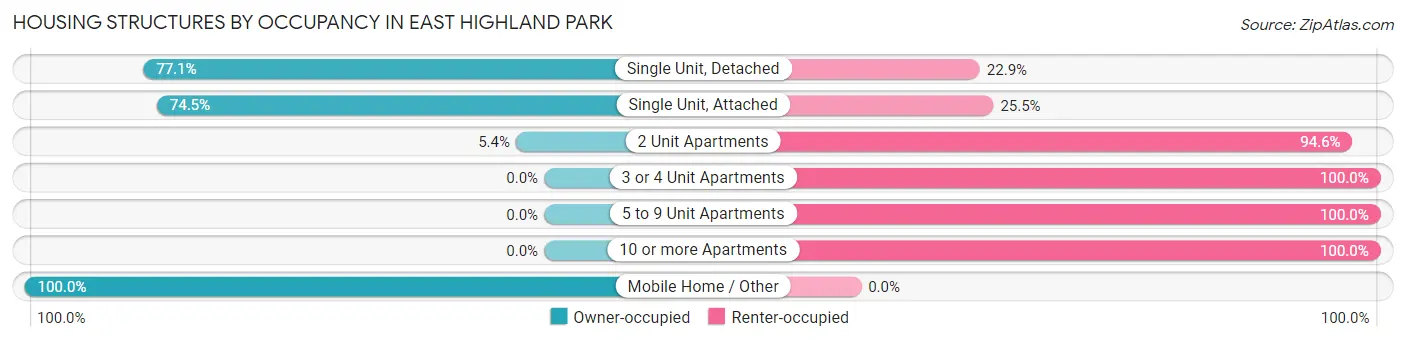
| Structure Type | Owner-occupied | Renter-occupied |
| Single Unit, Detached | 4,069 (77.1%) | 1,206 (22.9%) |
| Single Unit, Attached | 398 (74.5%) | 136 (25.5%) |
| 2 Unit Apartments | 9 (5.4%) | 157 (94.6%) |
| 3 or 4 Unit Apartments | 0 (0.0%) | 66 (100.0%) |
| 5 to 9 Unit Apartments | 0 (0.0%) | 224 (100.0%) |
| 10 or more Apartments | 0 (0.0%) | 275 (100.0%) |
| Mobile Home / Other | 15 (100.0%) | 0 (0.0%) |
| Total | 4,491 (68.5%) | 2,064 (31.5%) |
Housing Structures by Number of Rooms in East Highland Park
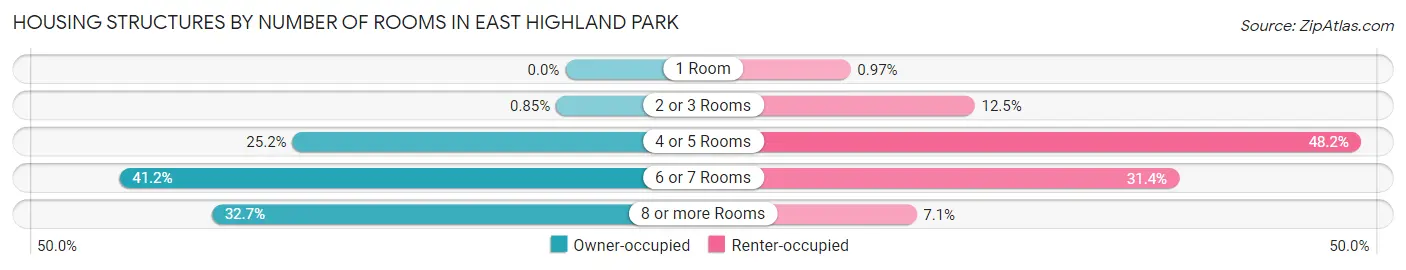
| Number of Rooms | Owner-occupied | Renter-occupied |
| 1 Room | 0 (0.0%) | 20 (1.0%) |
| 2 or 3 Rooms | 38 (0.9%) | 257 (12.4%) |
| 4 or 5 Rooms | 1,133 (25.2%) | 994 (48.2%) |
| 6 or 7 Rooms | 1,852 (41.2%) | 647 (31.4%) |
| 8 or more Rooms | 1,468 (32.7%) | 146 (7.1%) |
| Total | 4,491 (100.0%) | 2,064 (100.0%) |
Housing Structure by Heating Type in East Highland Park
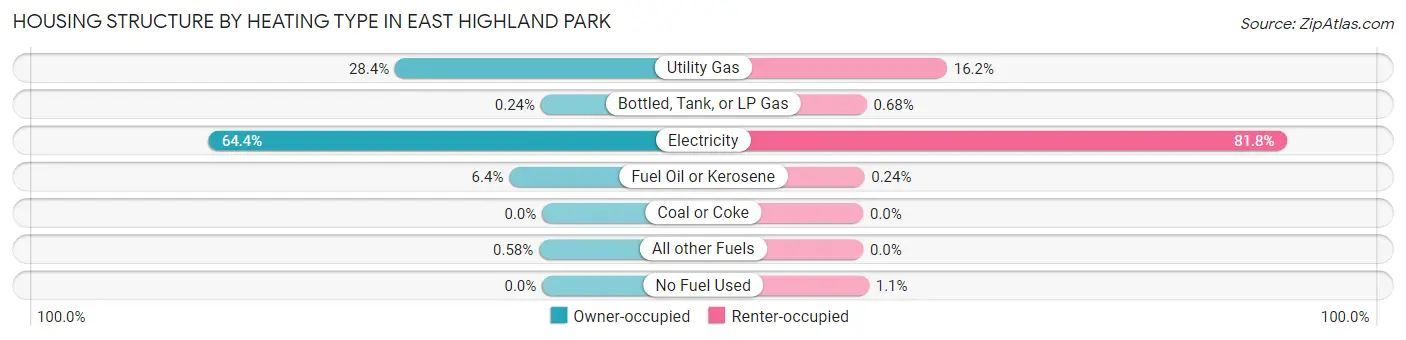
| Heating Type | Owner-occupied | Renter-occupied |
| Utility Gas | 1,277 (28.4%) | 334 (16.2%) |
| Bottled, Tank, or LP Gas | 11 (0.2%) | 14 (0.7%) |
| Electricity | 2,892 (64.4%) | 1,688 (81.8%) |
| Fuel Oil or Kerosene | 285 (6.4%) | 5 (0.2%) |
| Coal or Coke | 0 (0.0%) | 0 (0.0%) |
| All other Fuels | 26 (0.6%) | 0 (0.0%) |
| No Fuel Used | 0 (0.0%) | 23 (1.1%) |
| Total | 4,491 (100.0%) | 2,064 (100.0%) |
Household Vehicle Usage in East Highland Park
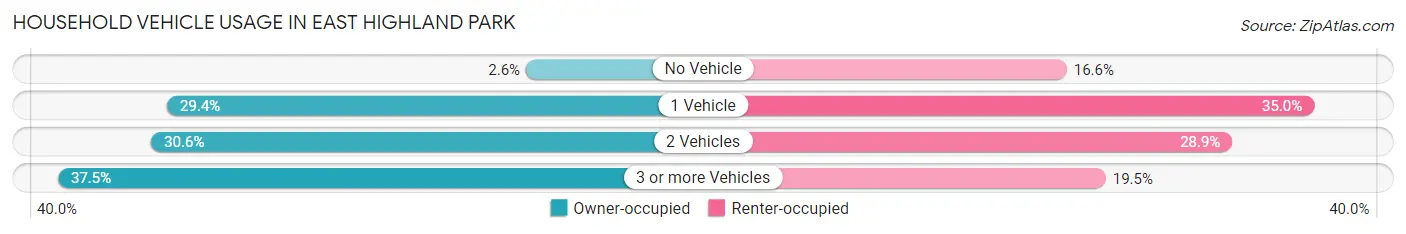
| Vehicles per Household | Owner-occupied | Renter-occupied |
| No Vehicle | 115 (2.6%) | 342 (16.6%) |
| 1 Vehicle | 1,319 (29.4%) | 723 (35.0%) |
| 2 Vehicles | 1,372 (30.5%) | 597 (28.9%) |
| 3 or more Vehicles | 1,685 (37.5%) | 402 (19.5%) |
| Total | 4,491 (100.0%) | 2,064 (100.0%) |
Real Estate & Mortgages in East Highland Park
Real Estate and Mortgage Overview in East Highland Park
| Characteristic | Without Mortgage | With Mortgage |
| Housing Units | 855 | 3,636 |
| Median Property Value | $123,200 | $204,600 |
| Median Household Income | $42,821 | $506 |
| Monthly Housing Costs | $454 | $115 |
| Real Estate Taxes | $1,120 | $261 |
Property Value by Mortgage Status in East Highland Park
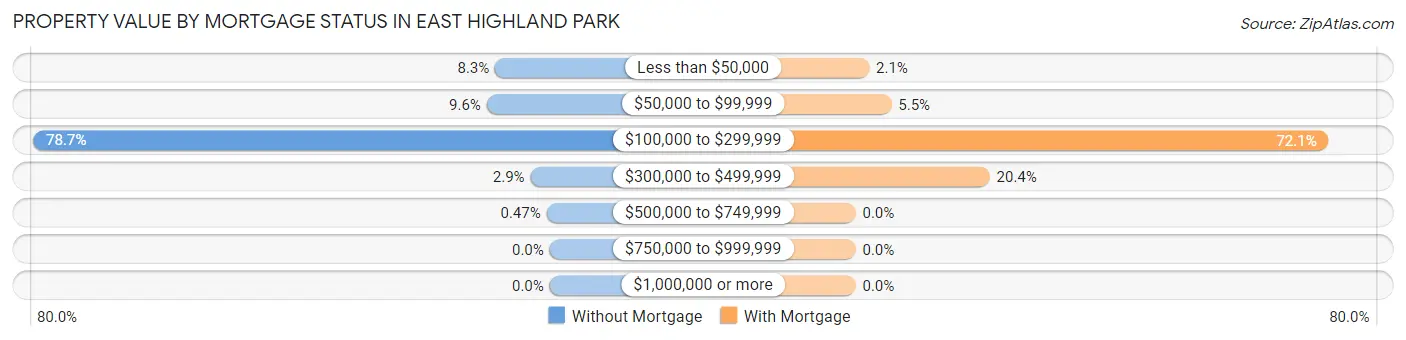
| Property Value | Without Mortgage | With Mortgage |
| Less than $50,000 | 71 (8.3%) | 75 (2.1%) |
| $50,000 to $99,999 | 82 (9.6%) | 198 (5.4%) |
| $100,000 to $299,999 | 673 (78.7%) | 2,620 (72.1%) |
| $300,000 to $499,999 | 25 (2.9%) | 743 (20.4%) |
| $500,000 to $749,999 | 4 (0.5%) | 0 (0.0%) |
| $750,000 to $999,999 | 0 (0.0%) | 0 (0.0%) |
| $1,000,000 or more | 0 (0.0%) | 0 (0.0%) |
| Total | 855 (100.0%) | 3,636 (100.0%) |
Household Income by Mortgage Status in East Highland Park
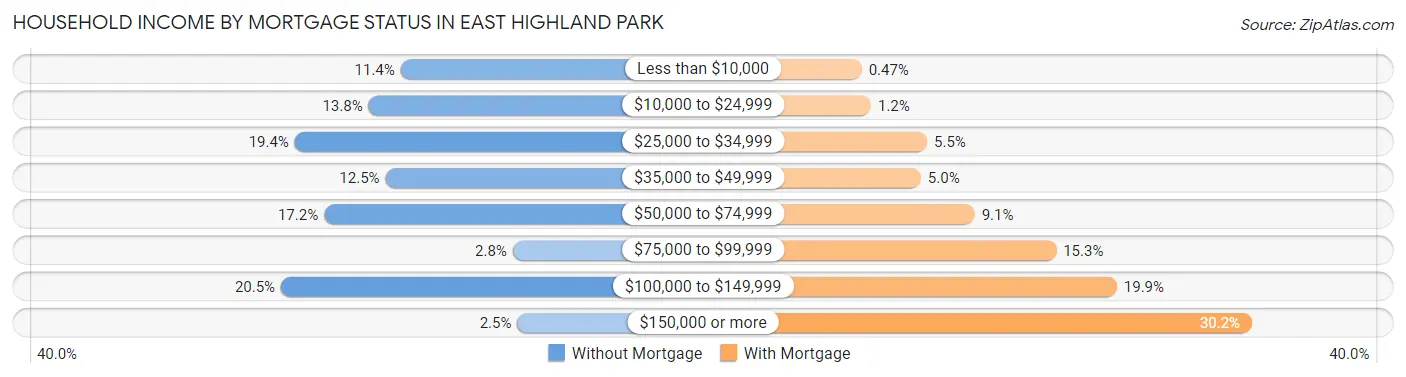
| Household Income | Without Mortgage | With Mortgage |
| Less than $10,000 | 97 (11.4%) | 17 (0.5%) |
| $10,000 to $24,999 | 118 (13.8%) | 43 (1.2%) |
| $25,000 to $34,999 | 166 (19.4%) | 198 (5.4%) |
| $35,000 to $49,999 | 107 (12.5%) | 181 (5.0%) |
| $50,000 to $74,999 | 147 (17.2%) | 330 (9.1%) |
| $75,000 to $99,999 | 24 (2.8%) | 556 (15.3%) |
| $100,000 to $149,999 | 175 (20.5%) | 724 (19.9%) |
| $150,000 or more | 21 (2.5%) | 1,098 (30.2%) |
| Total | 855 (100.0%) | 3,636 (100.0%) |
Property Value to Household Income Ratio in East Highland Park
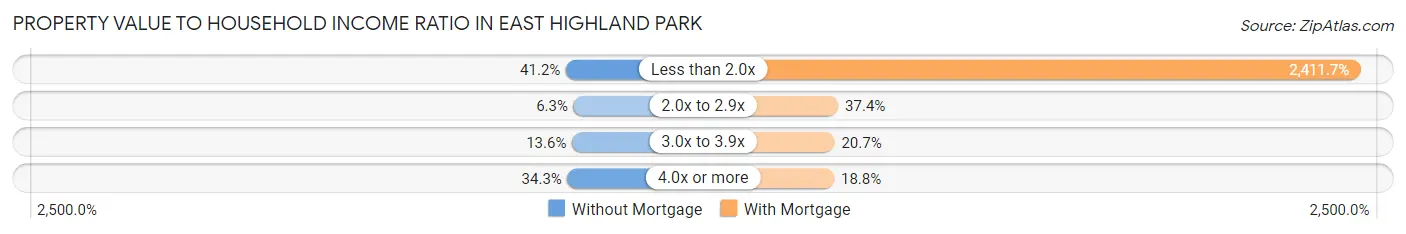
| Value-to-Income Ratio | Without Mortgage | With Mortgage |
| Less than 2.0x | 352 (41.2%) | 87,689 (2,411.7%) |
| 2.0x to 2.9x | 54 (6.3%) | 1,360 (37.4%) |
| 3.0x to 3.9x | 116 (13.6%) | 752 (20.7%) |
| 4.0x or more | 293 (34.3%) | 683 (18.8%) |
| Total | 855 (100.0%) | 3,636 (100.0%) |
Real Estate Taxes by Mortgage Status in East Highland Park
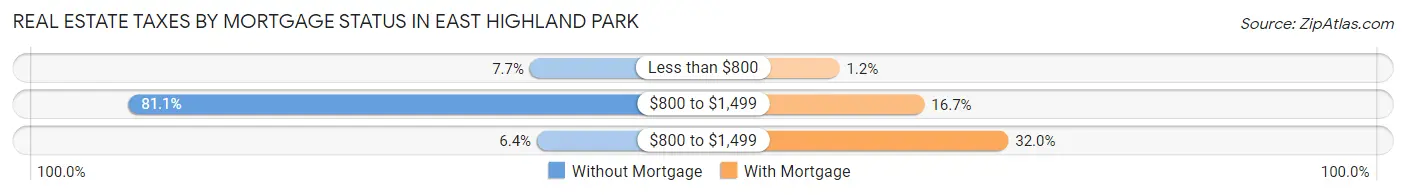
| Property Taxes | Without Mortgage | With Mortgage |
| Less than $800 | 66 (7.7%) | 43 (1.2%) |
| $800 to $1,499 | 693 (81.0%) | 607 (16.7%) |
| $800 to $1,499 | 55 (6.4%) | 1,164 (32.0%) |
| Total | 855 (100.0%) | 3,636 (100.0%) |
Health & Disability in East Highland Park
Health Insurance Coverage by Age in East Highland Park
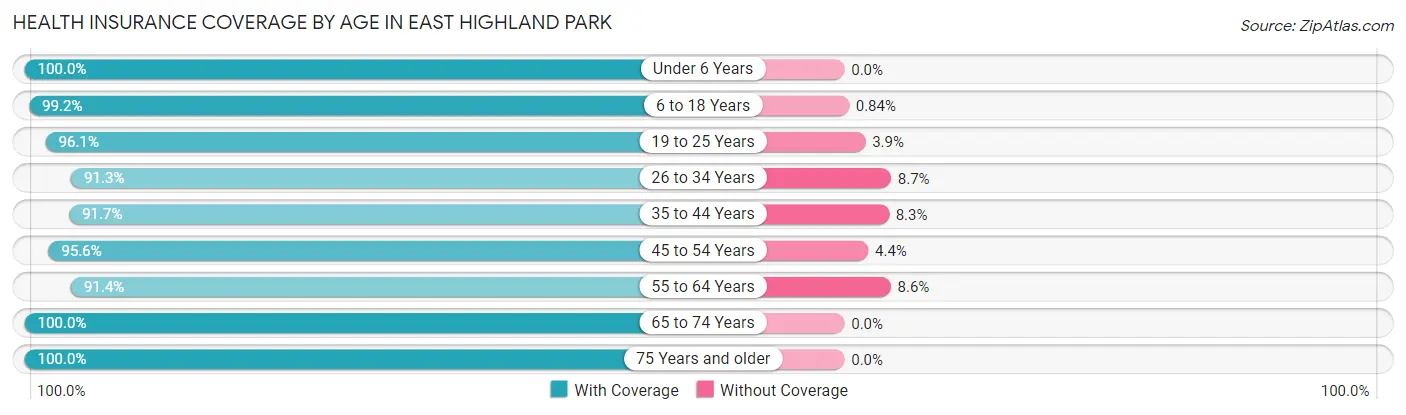
| Age Bracket | With Coverage | Without Coverage |
| Under 6 Years | 1,200 (100.0%) | 0 (0.0%) |
| 6 to 18 Years | 2,375 (99.2%) | 20 (0.8%) |
| 19 to 25 Years | 1,183 (96.1%) | 48 (3.9%) |
| 26 to 34 Years | 1,978 (91.3%) | 188 (8.7%) |
| 35 to 44 Years | 2,126 (91.7%) | 192 (8.3%) |
| 45 to 54 Years | 2,132 (95.6%) | 99 (4.4%) |
| 55 to 64 Years | 2,178 (91.4%) | 206 (8.6%) |
| 65 to 74 Years | 1,655 (100.0%) | 0 (0.0%) |
| 75 Years and older | 889 (100.0%) | 0 (0.0%) |
| Total | 15,716 (95.4%) | 753 (4.6%) |
Health Insurance Coverage by Citizenship Status in East Highland Park
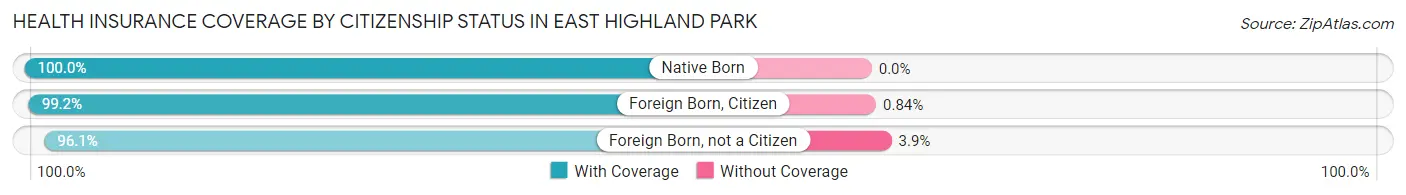
| Citizenship Status | With Coverage | Without Coverage |
| Native Born | 1,200 (100.0%) | 0 (0.0%) |
| Foreign Born, Citizen | 2,375 (99.2%) | 20 (0.8%) |
| Foreign Born, not a Citizen | 1,183 (96.1%) | 48 (3.9%) |
Health Insurance Coverage by Household Income in East Highland Park
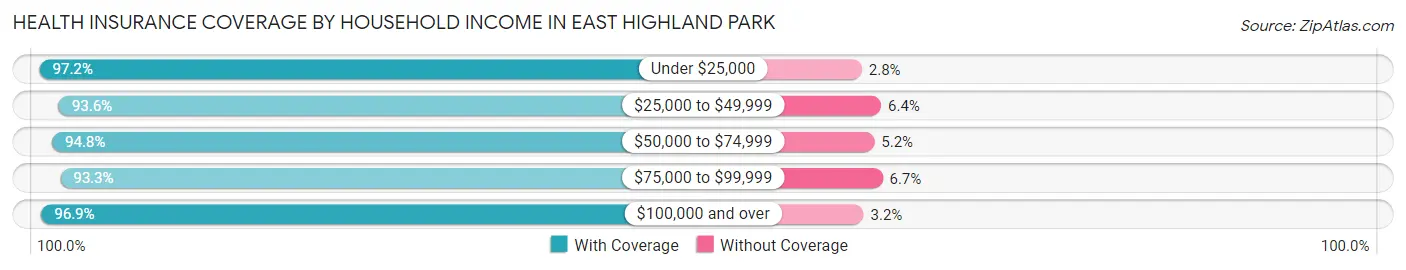
| Household Income | With Coverage | Without Coverage |
| Under $25,000 | 2,035 (97.2%) | 59 (2.8%) |
| $25,000 to $49,999 | 2,330 (93.6%) | 160 (6.4%) |
| $50,000 to $74,999 | 2,461 (94.8%) | 134 (5.2%) |
| $75,000 to $99,999 | 2,832 (93.3%) | 203 (6.7%) |
| $100,000 and over | 6,051 (96.9%) | 197 (3.2%) |
Public vs Private Health Insurance Coverage by Age in East Highland Park
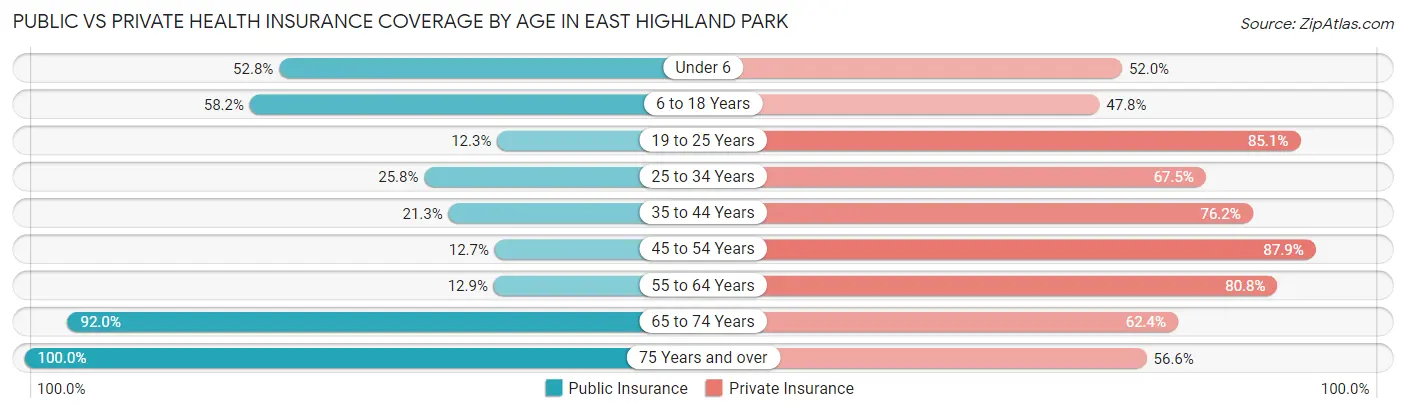
| Age Bracket | Public Insurance | Private Insurance |
| Under 6 | 633 (52.7%) | 624 (52.0%) |
| 6 to 18 Years | 1,394 (58.2%) | 1,145 (47.8%) |
| 19 to 25 Years | 151 (12.3%) | 1,047 (85.1%) |
| 25 to 34 Years | 559 (25.8%) | 1,463 (67.5%) |
| 35 to 44 Years | 494 (21.3%) | 1,767 (76.2%) |
| 45 to 54 Years | 284 (12.7%) | 1,962 (87.9%) |
| 55 to 64 Years | 308 (12.9%) | 1,927 (80.8%) |
| 65 to 74 Years | 1,523 (92.0%) | 1,032 (62.4%) |
| 75 Years and over | 889 (100.0%) | 503 (56.6%) |
| Total | 6,235 (37.9%) | 11,470 (69.7%) |
Disability Status by Sex by Age in East Highland Park
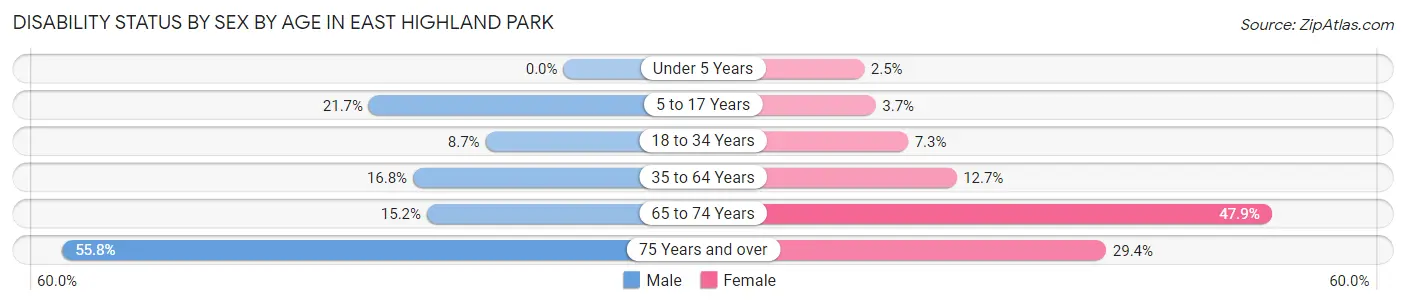
| Age Bracket | Male | Female |
| Under 5 Years | 0 (0.0%) | 8 (2.5%) |
| 5 to 17 Years | 282 (21.7%) | 49 (3.7%) |
| 18 to 34 Years | 139 (8.7%) | 144 (7.3%) |
| 35 to 64 Years | 545 (16.8%) | 469 (12.7%) |
| 65 to 74 Years | 114 (15.2%) | 433 (47.8%) |
| 75 Years and over | 221 (55.8%) | 145 (29.4%) |
Disability Class by Sex by Age in East Highland Park
Disability Class: Hearing Difficulty
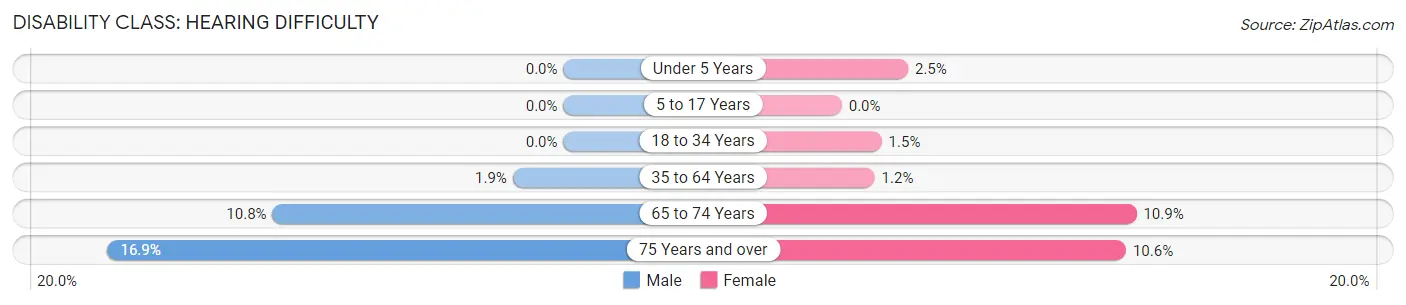
| Age Bracket | Male | Female |
| Under 5 Years | 0 (0.0%) | 8 (2.5%) |
| 5 to 17 Years | 0 (0.0%) | 0 (0.0%) |
| 18 to 34 Years | 0 (0.0%) | 29 (1.5%) |
| 35 to 64 Years | 61 (1.9%) | 45 (1.2%) |
| 65 to 74 Years | 81 (10.8%) | 99 (10.9%) |
| 75 Years and over | 67 (16.9%) | 52 (10.5%) |
Disability Class: Vision Difficulty
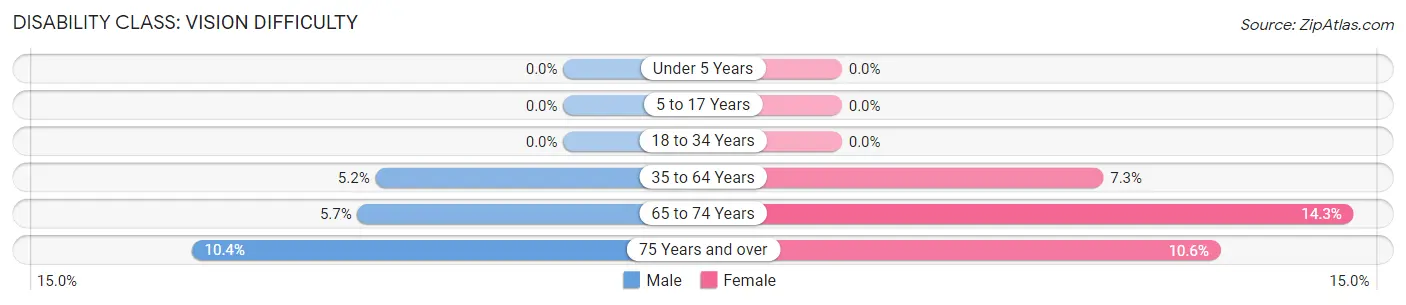
| Age Bracket | Male | Female |
| Under 5 Years | 0 (0.0%) | 0 (0.0%) |
| 5 to 17 Years | 0 (0.0%) | 0 (0.0%) |
| 18 to 34 Years | 0 (0.0%) | 0 (0.0%) |
| 35 to 64 Years | 170 (5.2%) | 268 (7.3%) |
| 65 to 74 Years | 43 (5.7%) | 129 (14.2%) |
| 75 Years and over | 41 (10.3%) | 52 (10.5%) |
Disability Class: Cognitive Difficulty
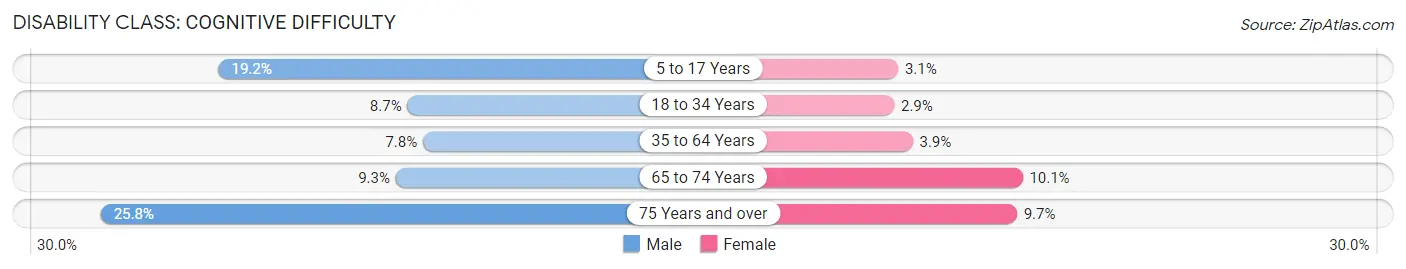
| Age Bracket | Male | Female |
| 5 to 17 Years | 250 (19.2%) | 41 (3.1%) |
| 18 to 34 Years | 139 (8.7%) | 57 (2.9%) |
| 35 to 64 Years | 254 (7.8%) | 145 (3.9%) |
| 65 to 74 Years | 70 (9.3%) | 91 (10.1%) |
| 75 Years and over | 102 (25.8%) | 48 (9.7%) |
Disability Class: Ambulatory Difficulty
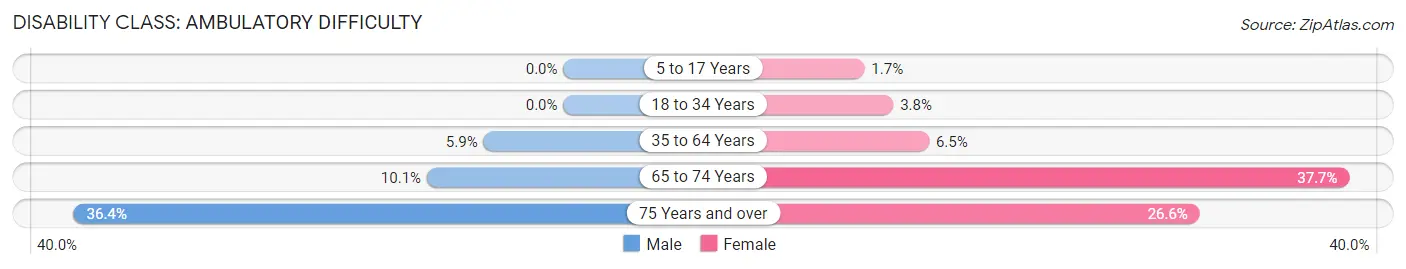
| Age Bracket | Male | Female |
| 5 to 17 Years | 0 (0.0%) | 22 (1.7%) |
| 18 to 34 Years | 0 (0.0%) | 75 (3.8%) |
| 35 to 64 Years | 193 (5.9%) | 238 (6.5%) |
| 65 to 74 Years | 76 (10.1%) | 341 (37.7%) |
| 75 Years and over | 144 (36.4%) | 131 (26.6%) |
Disability Class: Self-Care Difficulty
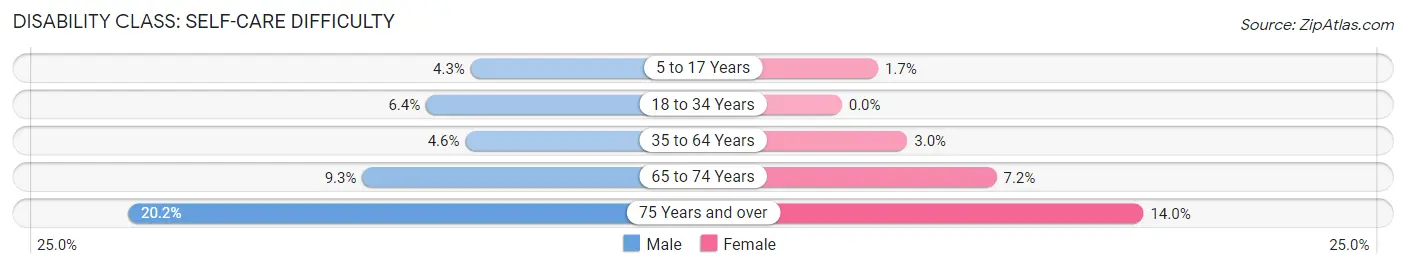
| Age Bracket | Male | Female |
| 5 to 17 Years | 56 (4.3%) | 22 (1.7%) |
| 18 to 34 Years | 102 (6.4%) | 0 (0.0%) |
| 35 to 64 Years | 148 (4.5%) | 112 (3.0%) |
| 65 to 74 Years | 70 (9.3%) | 65 (7.2%) |
| 75 Years and over | 80 (20.2%) | 69 (14.0%) |
Technology Access in East Highland Park
Computing Device Access in East Highland Park
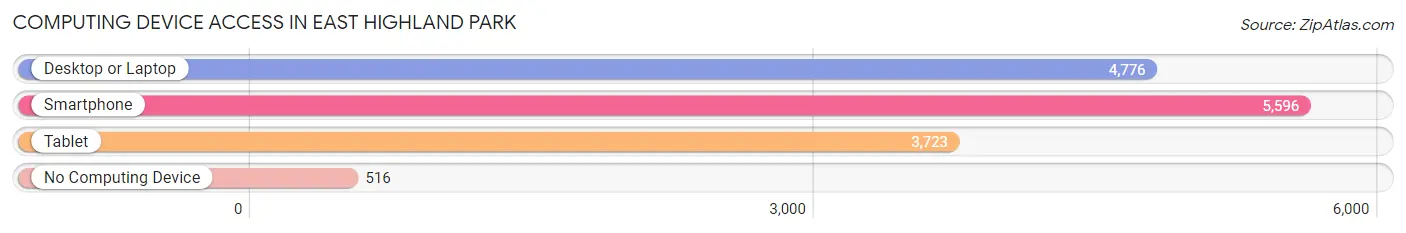
| Device Type | # Households | % Households |
| Desktop or Laptop | 4,776 | 72.9% |
| Smartphone | 5,596 | 85.4% |
| Tablet | 3,723 | 56.8% |
| No Computing Device | 516 | 7.9% |
| Total | 6,555 | 100.0% |
Internet Access in East Highland Park
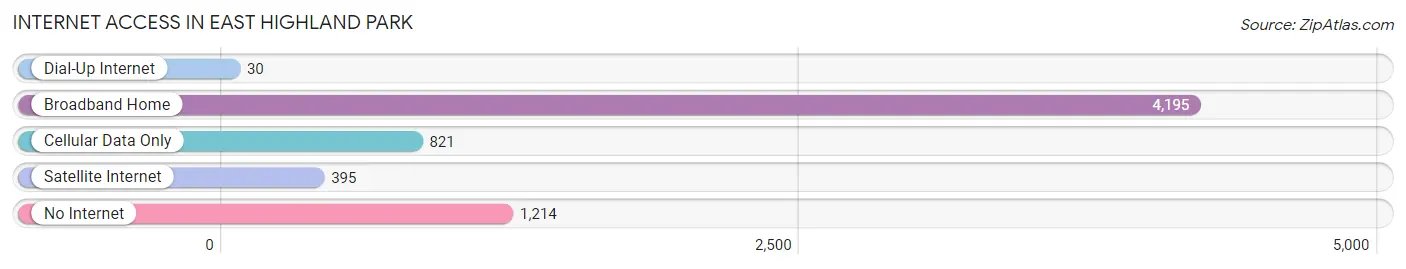
| Internet Type | # Households | % Households |
| Dial-Up Internet | 30 | 0.5% |
| Broadband Home | 4,195 | 64.0% |
| Cellular Data Only | 821 | 12.5% |
| Satellite Internet | 395 | 6.0% |
| No Internet | 1,214 | 18.5% |
| Total | 6,555 | 100.0% |
East Highland Park Summary
Highland Park is a neighborhood located in the city of Richmond, Virginia. It is located in the East End of the city, and is bordered by the neighborhoods of Church Hill, Chimborazo, Fairmount, and Woodville. Highland Park is a diverse and vibrant community, with a rich history and a bright future.
History
Highland Park was originally part of the Church Hill neighborhood, and was known as the “Highland Park” area. The area was first developed in the late 19th century, and was home to many of Richmond’s wealthy and influential families. The area was known for its grand homes and lush gardens, and was a popular destination for visitors to the city.
In the early 20th century, the area began to change as the city’s population grew and the area became more industrialized. The area was home to many factories and warehouses, and the population of the area began to shift to a more diverse mix of people. By the mid-20th century, the area had become a predominantly African-American neighborhood.
Geography
Highland Park is located in the East End of Richmond, Virginia. It is bordered by the neighborhoods of Church Hill, Chimborazo, Fairmount, and Woodville. The area is located on a hill, and is known for its views of the city skyline. The area is also home to several parks, including Chimborazo Park, which is located on the edge of the neighborhood.
Economy
Highland Park is home to a diverse range of businesses and industries. The area is home to several small businesses, including restaurants, retail stores, and service providers. The area is also home to several larger businesses, including a hospital, a grocery store, and a movie theater. The area is also home to several industrial sites, including a recycling center and a manufacturing plant.
Demographics
Highland Park is a diverse and vibrant community. According to the 2010 census, the population of the area was 8,945. The population is predominantly African-American, with a small percentage of white and Hispanic residents. The median household income in the area is $37,845, and the median home value is $128,000.
Conclusion
Highland Park is a vibrant and diverse neighborhood located in the East End of Richmond, Virginia. The area has a rich history, and is home to a diverse range of businesses and industries. The area is also home to a diverse population, with a median household income of $37,845 and a median home value of $128,000. Highland Park is a vibrant and thriving community, and is sure to continue to be a great place to live and work for many years to come.
Common Questions
What is Per Capita Income in East Highland Park?
Per Capita income in East Highland Park is $33,502.
What is the Median Family Income in East Highland Park?
Median Family Income in East Highland Park is $81,870.
What is the Median Household income in East Highland Park?
Median Household Income in East Highland Park is $70,395.
What is Income or Wage Gap in East Highland Park?
Income or Wage Gap in East Highland Park is 7.8%.
Women in East Highland Park earn 92.2 cents for every dollar earned by a man.
What is Inequality or Gini Index in East Highland Park?
Inequality or Gini Index in East Highland Park is 0.38.
What is the Total Population of East Highland Park?
Total Population of East Highland Park is 16,499.
What is the Total Male Population of East Highland Park?
Total Male Population of East Highland Park is 7,818.
What is the Total Female Population of East Highland Park?
Total Female Population of East Highland Park is 8,681.
What is the Ratio of Males per 100 Females in East Highland Park?
There are 90.06 Males per 100 Females in East Highland Park.
What is the Ratio of Females per 100 Males in East Highland Park?
There are 111.04 Females per 100 Males in East Highland Park.
What is the Median Population Age in East Highland Park?
Median Population Age in East Highland Park is 40.7 Years.
What is the Average Family Size in East Highland Park
Average Family Size in East Highland Park is 3.1 People.
What is the Average Household Size in East Highland Park
Average Household Size in East Highland Park is 2.5 People.
How Large is the Labor Force in East Highland Park?
There are 9,755 People in the Labor Forcein in East Highland Park.
What is the Percentage of People in the Labor Force in East Highland Park?
71.9% of People are in the Labor Force in East Highland Park.
What is the Unemployment Rate in East Highland Park?
Unemployment Rate in East Highland Park is 4.0%.