Chester Gap, VA Map & Demographics
Chester Gap Map
Chester Gap Overview
$32,834
PER CAPITA INCOME
$80,536
AVG FAMILY INCOME
$100,729
AVG HOUSEHOLD INCOME
4.7%
WAGE / INCOME GAP [ % ]
95.3¢/ $1
WAGE / INCOME GAP [ $ ]
0.29
INEQUALITY / GINI INDEX
1,069
TOTAL POPULATION
533
MALE POPULATION
536
FEMALE POPULATION
99.44
MALES / 100 FEMALES
100.56
FEMALES / 100 MALES
31.6
MEDIAN AGE
4.0
AVG FAMILY SIZE
3.6
AVG HOUSEHOLD SIZE
526
LABOR FORCE [ PEOPLE ]
65.5%
PERCENT IN LABOR FORCE
3.2%
UNEMPLOYMENT RATE
Chester Gap Zip Codes
Chester Gap Area Codes
Income in Chester Gap
Income Overview in Chester Gap
Per Capita Income in Chester Gap is $32,834, while median incomes of families and households are $80,536 and $100,729 respectively.
| Characteristic | Number | Measure |
| Per Capita Income | 1,069 | $32,834 |
| Median Family Income | 180 | $80,536 |
| Mean Family Income | 180 | $86,339 |
| Median Household Income | 295 | $100,729 |
| Mean Household Income | 295 | $93,088 |
| Income Deficit | 180 | $0 |
| Wage / Income Gap (%) | 1,069 | 4.75% |
| Wage / Income Gap ($) | 1,069 | 95.25¢ per $1 |
| Gini / Inequality Index | 1,069 | 0.29 |
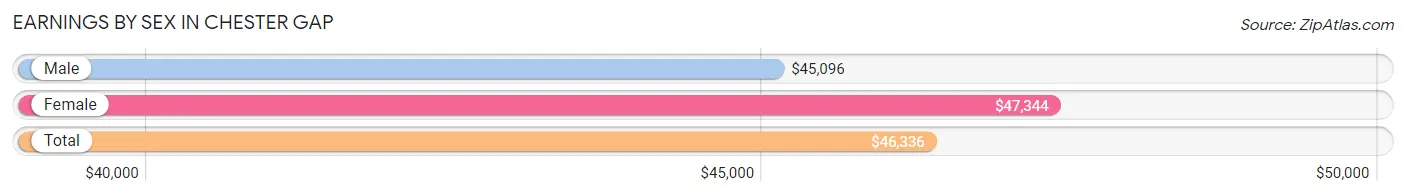
Earnings by Sex in Chester Gap
Average Earnings in Chester Gap are $46,336, $45,096 for men and $47,344 for women, a difference of 4.8%.
| Sex | Number | Average Earnings |
| Male | 307 (58.9%) | $45,096 |
| Female | 214 (41.1%) | $47,344 |
| Total | 521 (100.0%) | $46,336 |
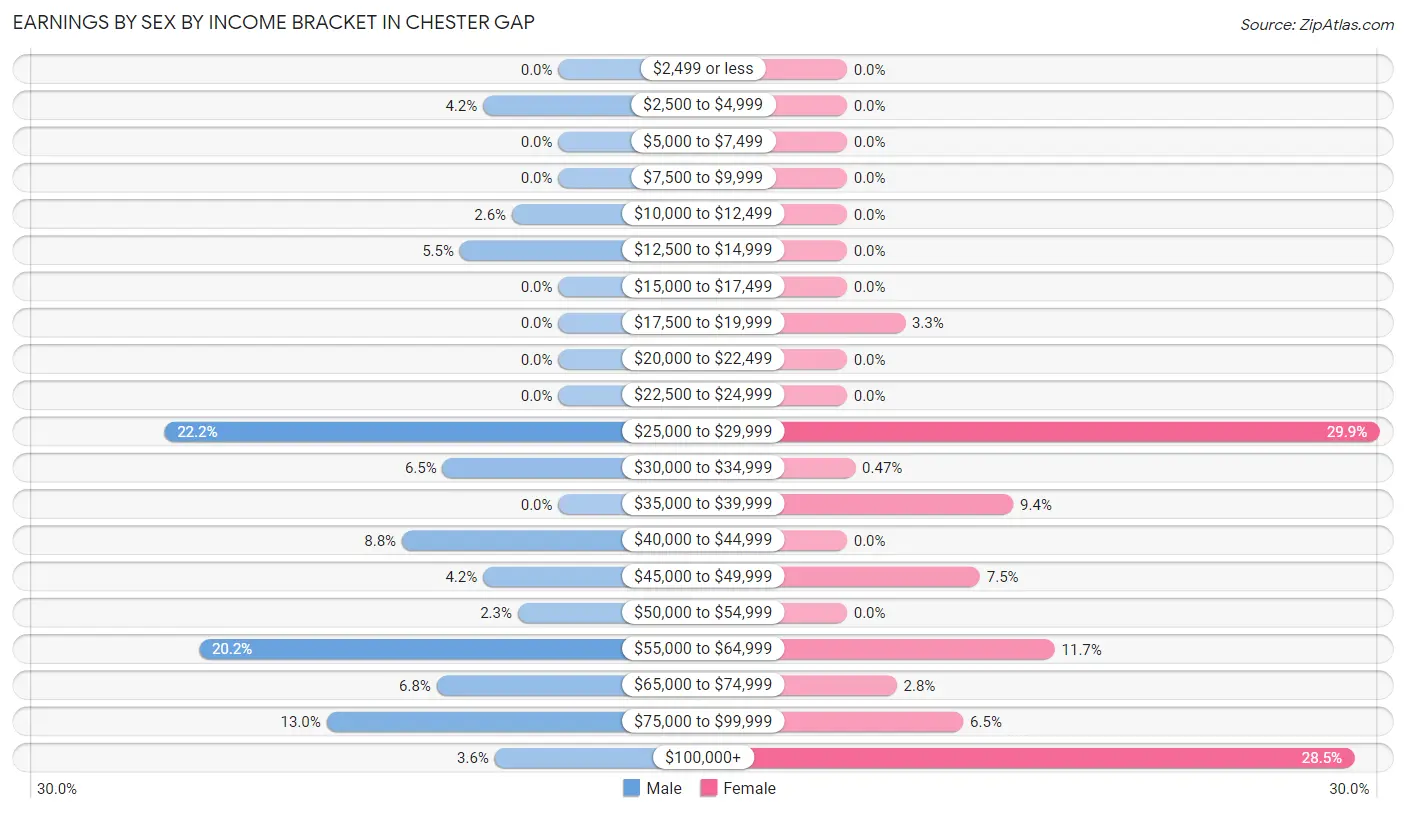
Earnings by Sex by Income Bracket in Chester Gap
The most common earnings brackets in Chester Gap are $25,000 to $29,999 for men (68 | 22.2%) and $25,000 to $29,999 for women (64 | 29.9%).
| Income | Male | Female |
| $2,499 or less | 0 (0.0%) | 0 (0.0%) |
| $2,500 to $4,999 | 13 (4.2%) | 0 (0.0%) |
| $5,000 to $7,499 | 0 (0.0%) | 0 (0.0%) |
| $7,500 to $9,999 | 0 (0.0%) | 0 (0.0%) |
| $10,000 to $12,499 | 8 (2.6%) | 0 (0.0%) |
| $12,500 to $14,999 | 17 (5.5%) | 0 (0.0%) |
| $15,000 to $17,499 | 0 (0.0%) | 0 (0.0%) |
| $17,500 to $19,999 | 0 (0.0%) | 7 (3.3%) |
| $20,000 to $22,499 | 0 (0.0%) | 0 (0.0%) |
| $22,500 to $24,999 | 0 (0.0%) | 0 (0.0%) |
| $25,000 to $29,999 | 68 (22.2%) | 64 (29.9%) |
| $30,000 to $34,999 | 20 (6.5%) | 1 (0.5%) |
| $35,000 to $39,999 | 0 (0.0%) | 20 (9.3%) |
| $40,000 to $44,999 | 27 (8.8%) | 0 (0.0%) |
| $45,000 to $49,999 | 13 (4.2%) | 16 (7.5%) |
| $50,000 to $54,999 | 7 (2.3%) | 0 (0.0%) |
| $55,000 to $64,999 | 62 (20.2%) | 25 (11.7%) |
| $65,000 to $74,999 | 21 (6.8%) | 6 (2.8%) |
| $75,000 to $99,999 | 40 (13.0%) | 14 (6.5%) |
| $100,000+ | 11 (3.6%) | 61 (28.5%) |
| Total | 307 (100.0%) | 214 (100.0%) |
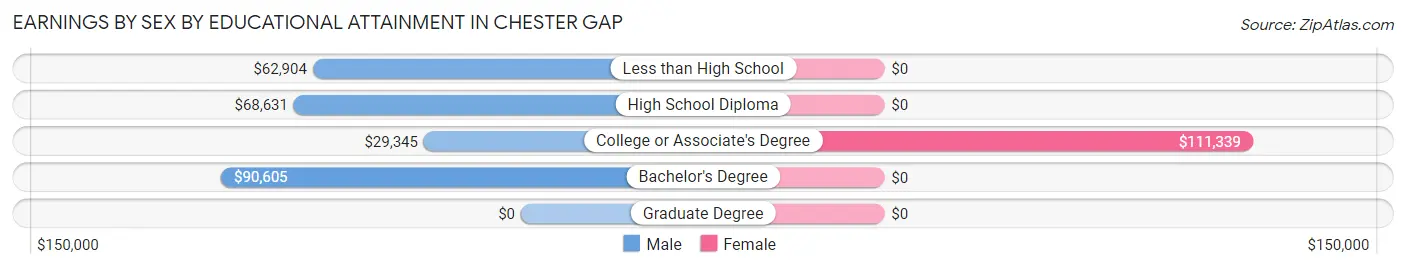
Earnings by Sex by Educational Attainment in Chester Gap
Average earnings in Chester Gap are $60,655 for men and $76,250 for women, a difference of 20.4%. Men with an educational attainment of bachelor's degree enjoy the highest average annual earnings of $90,605, while those with college or associate's degree education earn the least with $29,345. Women with an educational attainment of college or associate's degree earn the most with the average annual earnings of $111,339, while those with college or associate's degree education have the smallest earnings of $111,339.
| Educational Attainment | Male Income | Female Income |
| Less than High School | $62,904 | $0 |
| High School Diploma | $68,631 | $0 |
| College or Associate's Degree | $29,345 | $111,339 |
| Bachelor's Degree | $90,605 | $0 |
| Graduate Degree | - | - |
| Total | $60,655 | $76,250 |
Family Income in Chester Gap
Family Income Brackets in Chester Gap
According to the Chester Gap family income data, there are 63 families falling into the $100,000 to $149,999 income range, which is the most common income bracket and makes up 35.0% of all families.
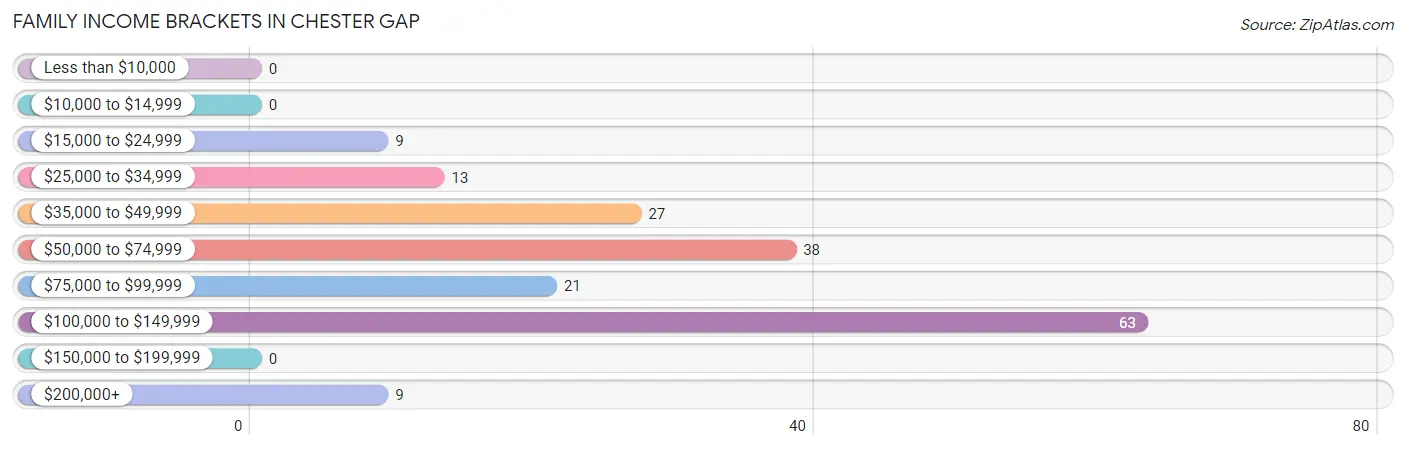
| Income Bracket | # Families | % Families |
| Less than $10,000 | 0 | 0.0% |
| $10,000 to $14,999 | 0 | 0.0% |
| $15,000 to $24,999 | 9 | 5.0% |
| $25,000 to $34,999 | 13 | 7.2% |
| $35,000 to $49,999 | 27 | 15.0% |
| $50,000 to $74,999 | 38 | 21.1% |
| $75,000 to $99,999 | 21 | 11.7% |
| $100,000 to $149,999 | 63 | 35.0% |
| $150,000 to $199,999 | 0 | 0.0% |
| $200,000+ | 9 | 5.0% |
Family Income by Famaliy Size in Chester Gap
4-person families (45 | 25.0%) account for the highest median family income in Chester Gap with $121,845 per family, while 4-person families (45 | 25.0%) have the highest median income of $30,461 per family member.
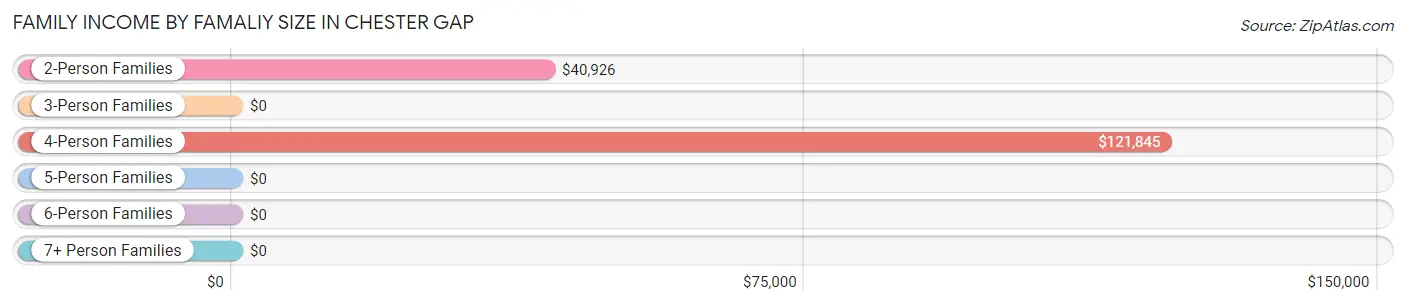
| Income Bracket | # Families | Median Income |
| 2-Person Families | 64 (35.6%) | $40,926 |
| 3-Person Families | 38 (21.1%) | $0 |
| 4-Person Families | 45 (25.0%) | $121,845 |
| 5-Person Families | 27 (15.0%) | $0 |
| 6-Person Families | 6 (3.3%) | $0 |
| 7+ Person Families | 0 (0.0%) | $0 |
| Total | 180 (100.0%) | $80,536 |
Family Income by Number of Earners in Chester Gap
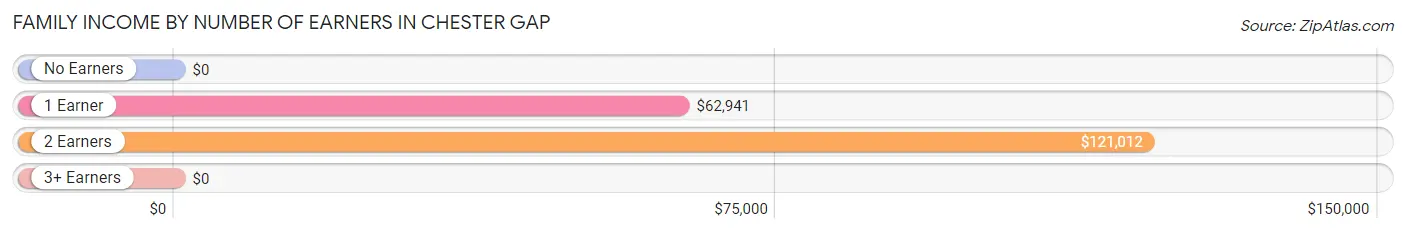
| Number of Earners | # Families | Median Income |
| No Earners | 34 (18.9%) | $0 |
| 1 Earner | 74 (41.1%) | $62,941 |
| 2 Earners | 59 (32.8%) | $121,012 |
| 3+ Earners | 13 (7.2%) | $0 |
| Total | 180 (100.0%) | $80,536 |
Household Income in Chester Gap
Household Income Brackets in Chester Gap
With 142 households falling in the category, the $100,000 to $149,999 income range is the most frequent in Chester Gap, accounting for 48.1% of all households.
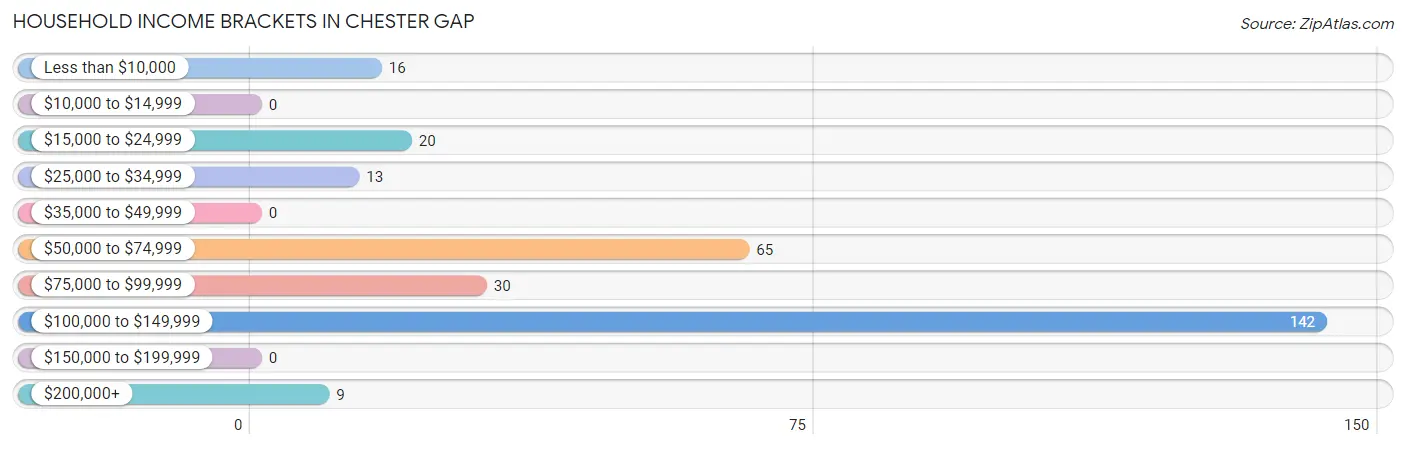
| Income Bracket | # Households | % Households |
| Less than $10,000 | 16 | 5.4% |
| $10,000 to $14,999 | 0 | 0.0% |
| $15,000 to $24,999 | 20 | 6.8% |
| $25,000 to $34,999 | 13 | 4.4% |
| $35,000 to $49,999 | 0 | 0.0% |
| $50,000 to $74,999 | 65 | 22.0% |
| $75,000 to $99,999 | 30 | 10.2% |
| $100,000 to $149,999 | 142 | 48.1% |
| $150,000 to $199,999 | 0 | 0.0% |
| $200,000+ | 9 | 3.1% |
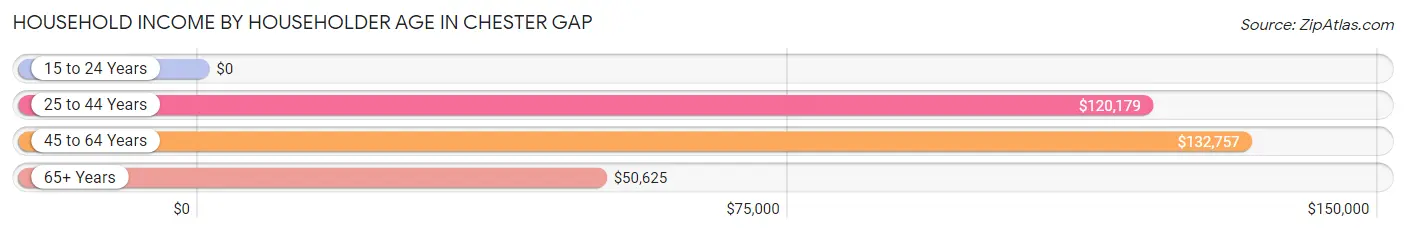
Household Income by Householder Age in Chester Gap
The median household income in Chester Gap is $100,729, with the highest median household income of $132,757 found in the 45 to 64 years age bracket for the primary householder. A total of 79 households (26.8%) fall into this category.
| Income Bracket | # Households | Median Income |
| 15 to 24 Years | 0 (0.0%) | $0 |
| 25 to 44 Years | 113 (38.3%) | $120,179 |
| 45 to 64 Years | 79 (26.8%) | $132,757 |
| 65+ Years | 103 (34.9%) | $50,625 |
| Total | 295 (100.0%) | $100,729 |
Poverty in Chester Gap
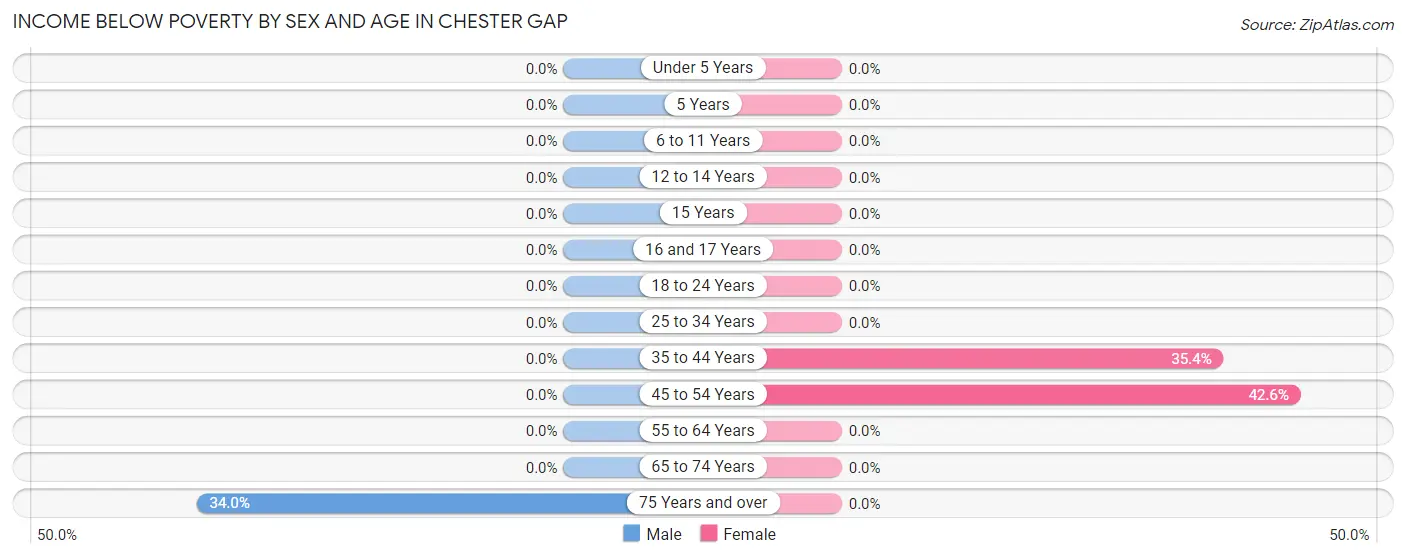
Income Below Poverty by Sex and Age in Chester Gap
With 3.0% poverty level for males and 11.2% for females among the residents of Chester Gap, 75 year old and over males and 45 to 54 year old females are the most vulnerable to poverty, with 16 males (34.0%) and 23 females (42.6%) in their respective age groups living below the poverty level.
| Age Bracket | Male | Female |
| Under 5 Years | 0 (0.0%) | 0 (0.0%) |
| 5 Years | 0 (0.0%) | 0 (0.0%) |
| 6 to 11 Years | 0 (0.0%) | 0 (0.0%) |
| 12 to 14 Years | 0 (0.0%) | 0 (0.0%) |
| 15 Years | 0 (0.0%) | 0 (0.0%) |
| 16 and 17 Years | 0 (0.0%) | 0 (0.0%) |
| 18 to 24 Years | 0 (0.0%) | 0 (0.0%) |
| 25 to 34 Years | 0 (0.0%) | 0 (0.0%) |
| 35 to 44 Years | 0 (0.0%) | 34 (35.4%) |
| 45 to 54 Years | 0 (0.0%) | 23 (42.6%) |
| 55 to 64 Years | 0 (0.0%) | 0 (0.0%) |
| 65 to 74 Years | 0 (0.0%) | 0 (0.0%) |
| 75 Years and over | 16 (34.0%) | 0 (0.0%) |
| Total | 16 (3.0%) | 57 (11.2%) |
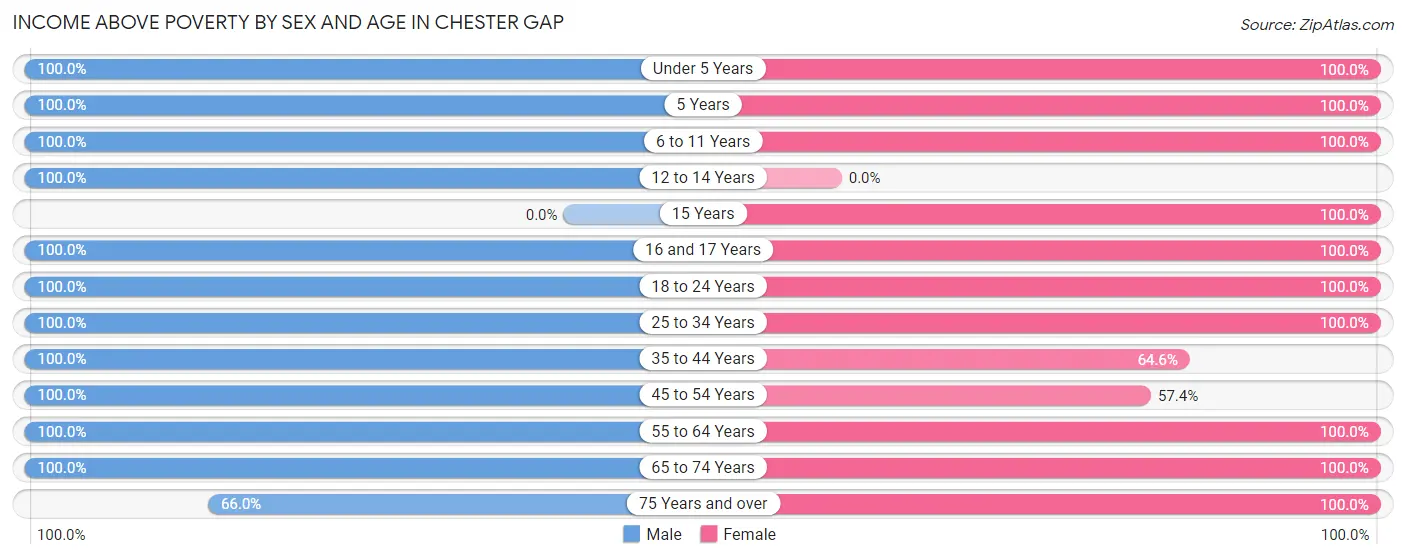
Income Above Poverty by Sex and Age in Chester Gap
According to the poverty statistics in Chester Gap, males aged under 5 years and females aged under 5 years are the age groups that are most secure financially, with 100.0% of males and 100.0% of females in these age groups living above the poverty line.
| Age Bracket | Male | Female |
| Under 5 Years | 40 (100.0%) | 55 (100.0%) |
| 5 Years | 30 (100.0%) | 22 (100.0%) |
| 6 to 11 Years | 44 (100.0%) | 34 (100.0%) |
| 12 to 14 Years | 8 (100.0%) | 0 (0.0%) |
| 15 Years | 0 (0.0%) | 7 (100.0%) |
| 16 and 17 Years | 30 (100.0%) | 13 (100.0%) |
| 18 to 24 Years | 37 (100.0%) | 94 (100.0%) |
| 25 to 34 Years | 48 (100.0%) | 73 (100.0%) |
| 35 to 44 Years | 138 (100.0%) | 62 (64.6%) |
| 45 to 54 Years | 77 (100.0%) | 31 (57.4%) |
| 55 to 64 Years | 12 (100.0%) | 15 (100.0%) |
| 65 to 74 Years | 22 (100.0%) | 12 (100.0%) |
| 75 Years and over | 31 (66.0%) | 35 (100.0%) |
| Total | 517 (97.0%) | 453 (88.8%) |
Income Below Poverty Among Married-Couple Families in Chester Gap
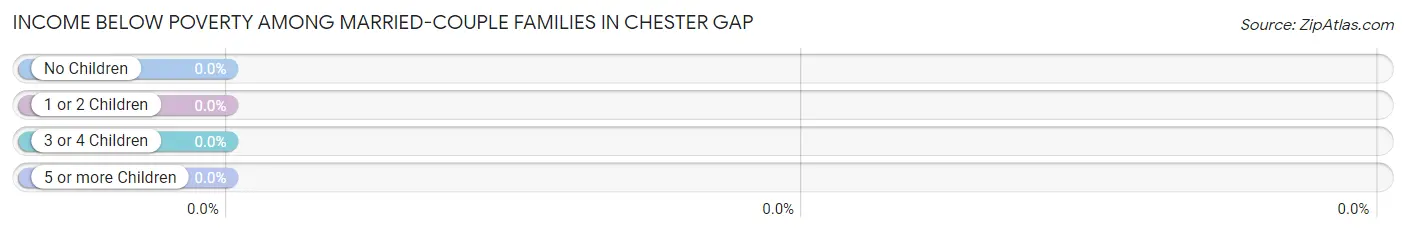
| Children | Above Poverty | Below Poverty |
| No Children | 24 (100.0%) | 0 (0.0%) |
| 1 or 2 Children | 45 (100.0%) | 0 (0.0%) |
| 3 or 4 Children | 20 (100.0%) | 0 (0.0%) |
| 5 or more Children | 0 (0.0%) | 0 (0.0%) |
| Total | 89 (100.0%) | 0 (0.0%) |
Income Below Poverty Among Single-Parent Households in Chester Gap
| Children | Single Father | Single Mother |
| No Children | 0 (0.0%) | 0 (0.0%) |
| 1 or 2 Children | 0 (0.0%) | 0 (0.0%) |
| 3 or 4 Children | 0 (0.0%) | 0 (0.0%) |
| 5 or more Children | 0 (0.0%) | 0 (0.0%) |
| Total | 0 (0.0%) | 0 (0.0%) |
Income Below Poverty Among Married-Couple vs Single-Parent Households in Chester Gap
| Children | Married-Couple Families | Single-Parent Households |
| No Children | 0 (0.0%) | 0 (0.0%) |
| 1 or 2 Children | 0 (0.0%) | 0 (0.0%) |
| 3 or 4 Children | 0 (0.0%) | 0 (0.0%) |
| 5 or more Children | 0 (0.0%) | 0 (0.0%) |
| Total | 0 (0.0%) | 0 (0.0%) |
Race in Chester Gap
The most populous races in Chester Gap are White / Caucasian (904 | 84.6%), Black / African American (143 | 13.4%), and Hispanic or Latino (35 | 3.3%).
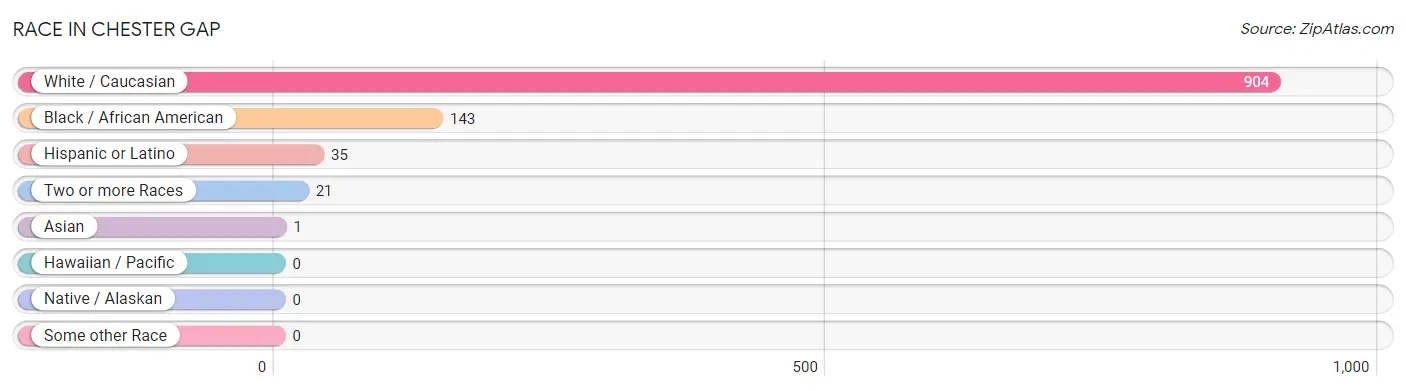
| Race | # Population | % Population |
| Asian | 1 | 0.1% |
| Black / African American | 143 | 13.4% |
| Hawaiian / Pacific | 0 | 0.0% |
| Hispanic or Latino | 35 | 3.3% |
| Native / Alaskan | 0 | 0.0% |
| White / Caucasian | 904 | 84.6% |
| Two or more Races | 21 | 2.0% |
| Some other Race | 0 | 0.0% |
| Total | 1,069 | 100.0% |
Ancestry in Chester Gap
The most populous ancestries reported in Chester Gap are English (165 | 15.4%), Irish (109 | 10.2%), Croatian (46 | 4.3%), Scottish (45 | 4.2%), and Polish (34 | 3.2%), together accounting for 37.3% of all Chester Gap residents.
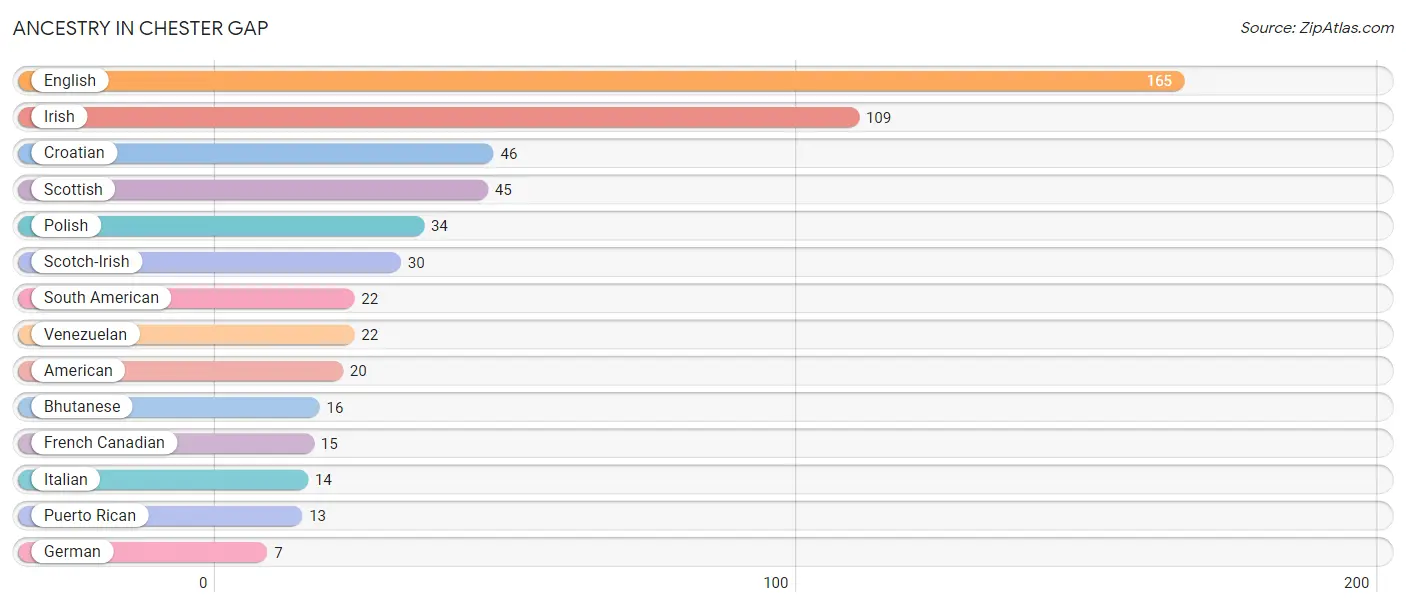
| Ancestry | # Population | % Population |
| American | 20 | 1.9% |
| Bhutanese | 16 | 1.5% |
| Croatian | 46 | 4.3% |
| English | 165 | 15.4% |
| French Canadian | 15 | 1.4% |
| German | 7 | 0.6% |
| Irish | 109 | 10.2% |
| Italian | 14 | 1.3% |
| Polish | 34 | 3.2% |
| Puerto Rican | 13 | 1.2% |
| Scotch-Irish | 30 | 2.8% |
| Scottish | 45 | 4.2% |
| South American | 22 | 2.1% |
| Venezuelan | 22 | 2.1% | View All 14 Rows |
Immigrants in Chester Gap
The most numerous immigrant groups reported in Chester Gap came from Latin America (22 | 2.1%), South America (22 | 2.1%), Venezuela (22 | 2.1%), Asia (1 | 0.1%), and Eastern Asia (1 | 0.1%), together accounting for 6.4% of all Chester Gap residents.
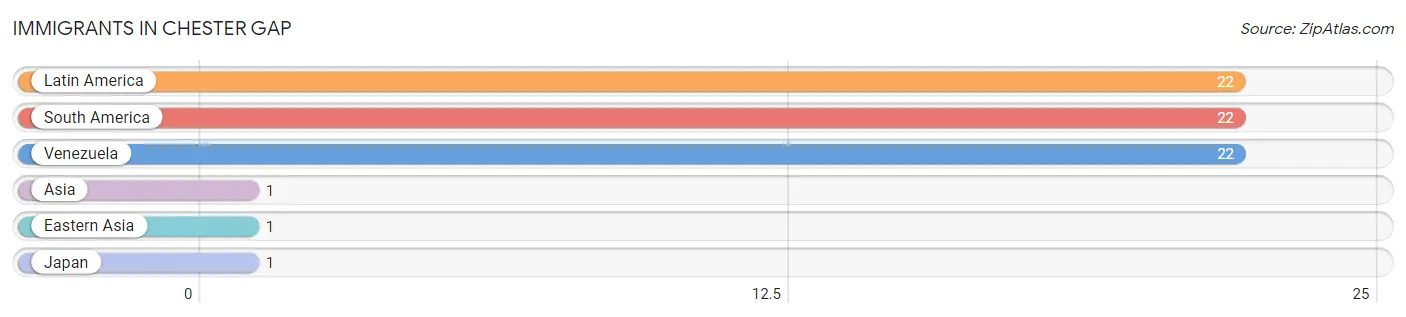
| Immigration Origin | # Population | % Population |
| Asia | 1 | 0.1% |
| Eastern Asia | 1 | 0.1% |
| Japan | 1 | 0.1% |
| Latin America | 22 | 2.1% |
| South America | 22 | 2.1% |
| Venezuela | 22 | 2.1% | View All 6 Rows |
Sex and Age in Chester Gap
Sex and Age in Chester Gap
The most populous age groups in Chester Gap are 35 to 39 Years (94 | 17.6%) for men and 35 to 39 Years (96 | 17.9%) for women.
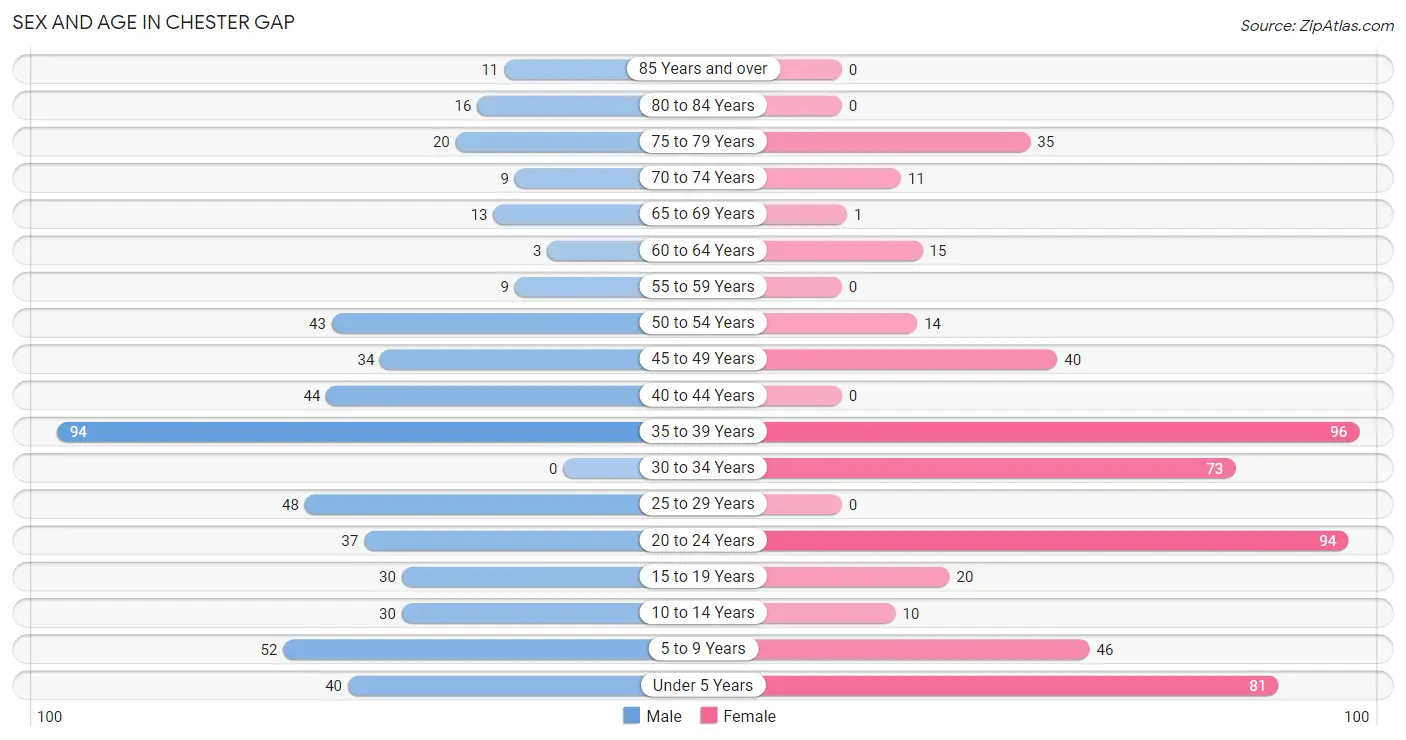
| Age Bracket | Male | Female |
| Under 5 Years | 40 (7.5%) | 81 (15.1%) |
| 5 to 9 Years | 52 (9.8%) | 46 (8.6%) |
| 10 to 14 Years | 30 (5.6%) | 10 (1.9%) |
| 15 to 19 Years | 30 (5.6%) | 20 (3.7%) |
| 20 to 24 Years | 37 (6.9%) | 94 (17.5%) |
| 25 to 29 Years | 48 (9.0%) | 0 (0.0%) |
| 30 to 34 Years | 0 (0.0%) | 73 (13.6%) |
| 35 to 39 Years | 94 (17.6%) | 96 (17.9%) |
| 40 to 44 Years | 44 (8.3%) | 0 (0.0%) |
| 45 to 49 Years | 34 (6.4%) | 40 (7.5%) |
| 50 to 54 Years | 43 (8.1%) | 14 (2.6%) |
| 55 to 59 Years | 9 (1.7%) | 0 (0.0%) |
| 60 to 64 Years | 3 (0.6%) | 15 (2.8%) |
| 65 to 69 Years | 13 (2.4%) | 1 (0.2%) |
| 70 to 74 Years | 9 (1.7%) | 11 (2.1%) |
| 75 to 79 Years | 20 (3.7%) | 35 (6.5%) |
| 80 to 84 Years | 16 (3.0%) | 0 (0.0%) |
| 85 Years and over | 11 (2.1%) | 0 (0.0%) |
| Total | 533 (100.0%) | 536 (100.0%) |
Families and Households in Chester Gap
Median Family Size in Chester Gap
The median family size in Chester Gap is 4.02 persons per family, with single female/mother families (30 | 16.7%) accounting for the largest median family size of 5.17 persons per family. On the other hand, single male/father families (61 | 33.9%) represent the smallest median family size with 2.77 persons per family.
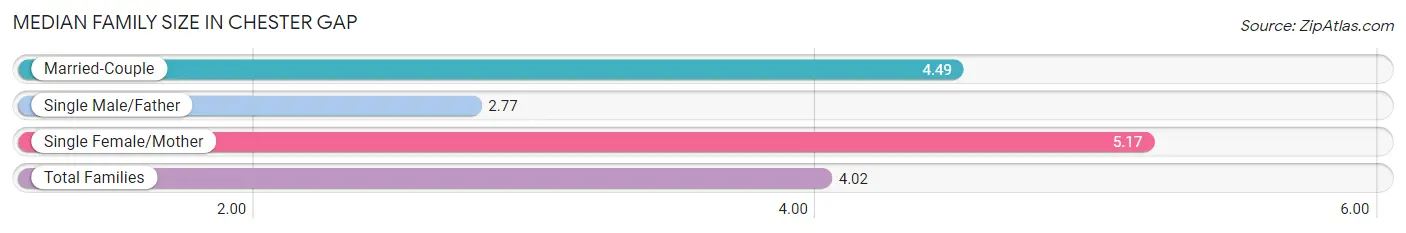
| Family Type | # Families | Family Size |
| Married-Couple | 89 (49.4%) | 4.49 |
| Single Male/Father | 61 (33.9%) | 2.77 |
| Single Female/Mother | 30 (16.7%) | 5.17 |
| Total Families | 180 (100.0%) | 4.02 |
Median Household Size in Chester Gap
The median household size in Chester Gap is 3.62 persons per household, with single female/mother households (30 | 10.2%) accounting for the largest median household size of 7.7 persons per household. non-family households (115 | 39.0%) represent the smallest median household size with 1.40 persons per household.
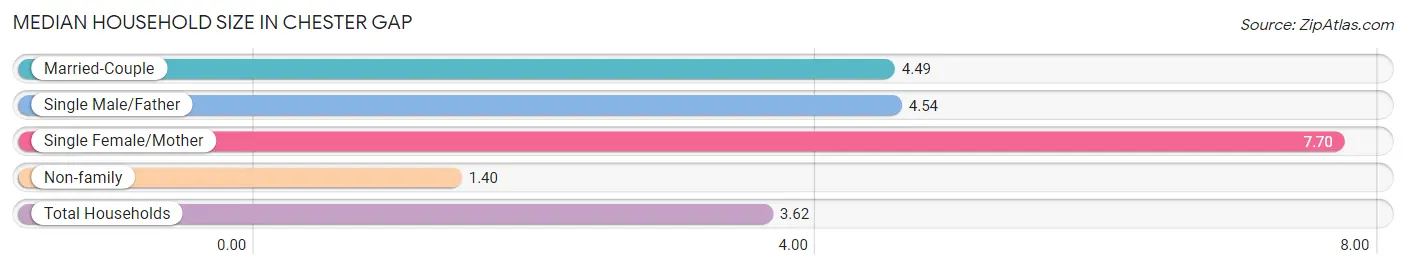
| Household Type | # Households | Household Size |
| Married-Couple | 89 (30.2%) | 4.49 |
| Single Male/Father | 61 (20.7%) | 4.54 |
| Single Female/Mother | 30 (10.2%) | 7.70 |
| Non-family | 115 (39.0%) | 1.40 |
| Total Households | 295 (100.0%) | 3.62 |
Household Size by Marriage Status in Chester Gap
Out of a total of 295 households in Chester Gap, 180 (61.0%) are family households, while 115 (39.0%) are nonfamily households. The most numerous type of family households are 5-person households, comprising 61, and the most common type of nonfamily households are 1-person households, comprising 84.
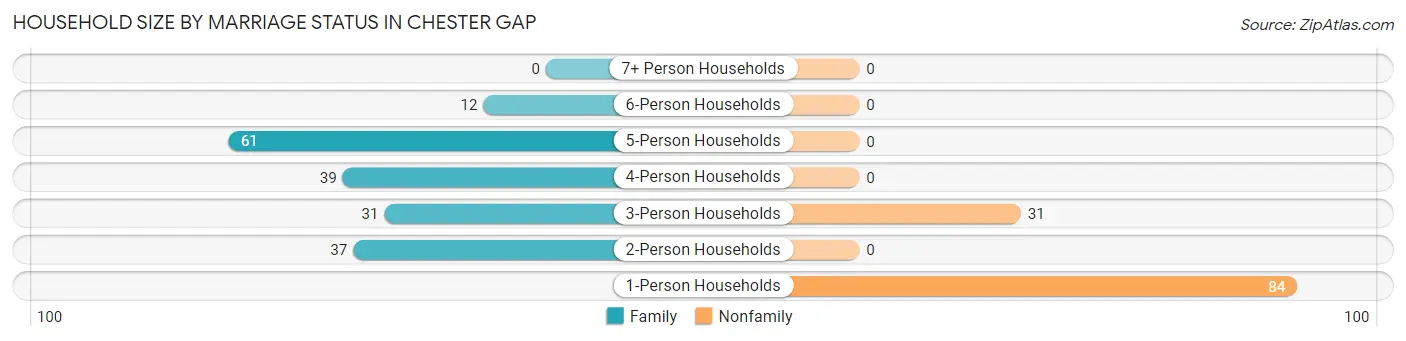
| Household Size | Family Households | Nonfamily Households |
| 1-Person Households | - | 84 (28.5%) |
| 2-Person Households | 37 (12.5%) | 0 (0.0%) |
| 3-Person Households | 31 (10.5%) | 31 (10.5%) |
| 4-Person Households | 39 (13.2%) | 0 (0.0%) |
| 5-Person Households | 61 (20.7%) | 0 (0.0%) |
| 6-Person Households | 12 (4.1%) | 0 (0.0%) |
| 7+ Person Households | 0 (0.0%) | 0 (0.0%) |
| Total | 180 (61.0%) | 115 (39.0%) |
Female Fertility in Chester Gap
Fertility by Age in Chester Gap
Average fertility rate in Chester Gap is 19.0 births per 1,000 women. Women in the age bracket of 20 to 34 years have the highest fertility rate with 36.0 births per 1,000 women. Women in the age bracket of 20 to 34 years acount for 100.0% of all women with births.
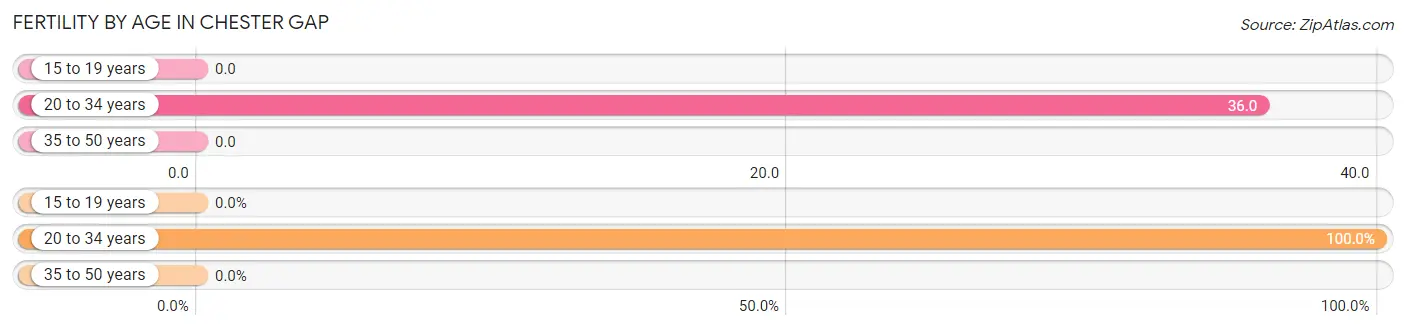
| Age Bracket | Women with Births | Births / 1,000 Women |
| 15 to 19 years | 0 (0.0%) | 0.0 |
| 20 to 34 years | 6 (100.0%) | 36.0 |
| 35 to 50 years | 0 (0.0%) | 0.0 |
| Total | 6 (100.0%) | 19.0 |
Fertility by Age by Marriage Status in Chester Gap
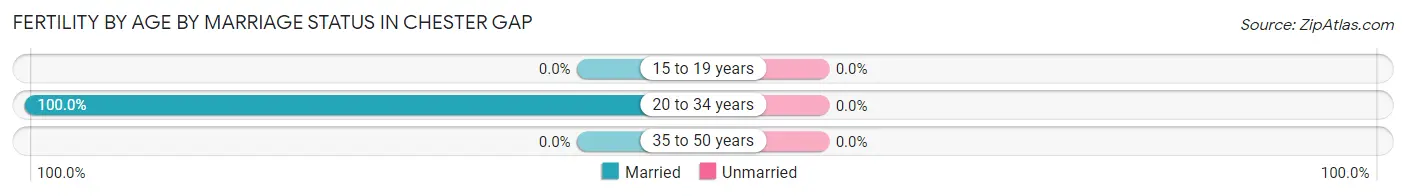
| Age Bracket | Married | Unmarried |
| 15 to 19 years | 0 (0.0%) | 0 (0.0%) |
| 20 to 34 years | 6 (100.0%) | 0 (0.0%) |
| 35 to 50 years | 0 (0.0%) | 0 (0.0%) |
| Total | 6 (100.0%) | 0 (0.0%) |
Fertility by Education in Chester Gap
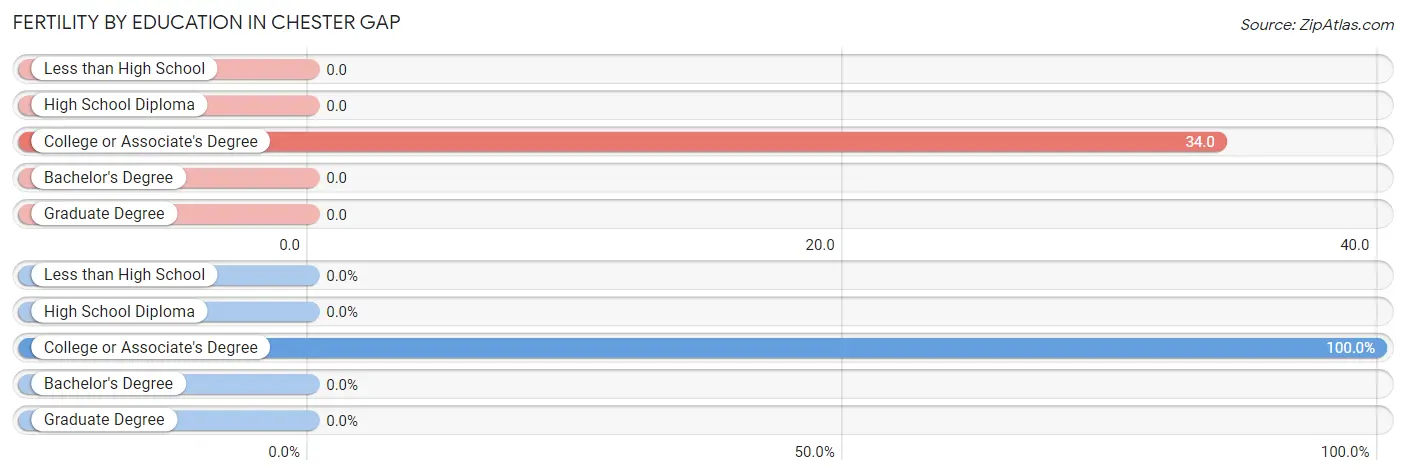
| Educational Attainment | Women with Births | Births / 1,000 Women |
| Less than High School | 0 (0.0%) | 0.0 |
| High School Diploma | 0 (0.0%) | 0.0 |
| College or Associate's Degree | 6 (100.0%) | 34.0 |
| Bachelor's Degree | 0 (0.0%) | 0.0 |
| Graduate Degree | 0 (0.0%) | 0.0 |
| Total | 6 (100.0%) | 19.0 |
Fertility by Education by Marriage Status in Chester Gap
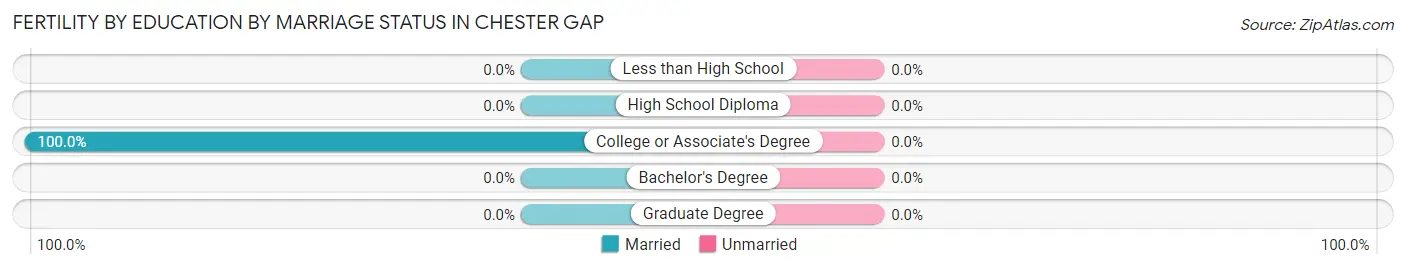
| Educational Attainment | Married | Unmarried |
| Less than High School | 0 (0.0%) | 0 (0.0%) |
| High School Diploma | 0 (0.0%) | 0 (0.0%) |
| College or Associate's Degree | 6 (100.0%) | 0 (0.0%) |
| Bachelor's Degree | 0 (0.0%) | 0 (0.0%) |
| Graduate Degree | 0 (0.0%) | 0 (0.0%) |
| Total | 6 (100.0%) | 0 (0.0%) |
Employment Characteristics in Chester Gap
Employment by Class of Employer in Chester Gap
Among the 509 employed individuals in Chester Gap, private company employees (438 | 86.1%), local government employees (35 | 6.9%), and self-employed (not incorporated) (27 | 5.3%) make up the most common classes of employment.
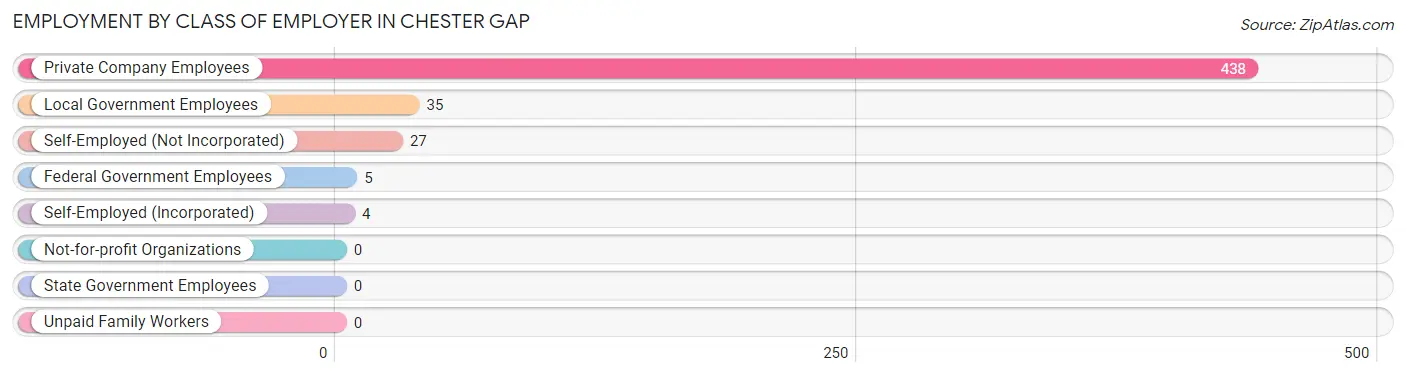
| Employer Class | # Employees | % Employees |
| Private Company Employees | 438 | 86.1% |
| Self-Employed (Incorporated) | 4 | 0.8% |
| Self-Employed (Not Incorporated) | 27 | 5.3% |
| Not-for-profit Organizations | 0 | 0.0% |
| Local Government Employees | 35 | 6.9% |
| State Government Employees | 0 | 0.0% |
| Federal Government Employees | 5 | 1.0% |
| Unpaid Family Workers | 0 | 0.0% |
| Total | 509 | 100.0% |
Employment Status by Age in Chester Gap
According to the labor force statistics for Chester Gap, out of the total population over 16 years of age (803), 65.5% or 526 individuals are in the labor force, with 3.2% or 17 of them unemployed. The age group with the highest labor force participation rate is 25 to 29 years, with 100.0% or 48 individuals in the labor force. Within the labor force, the 65 to 74 years age range has the highest percentage of unemployed individuals, with 80.0% or 4 of them being unemployed.
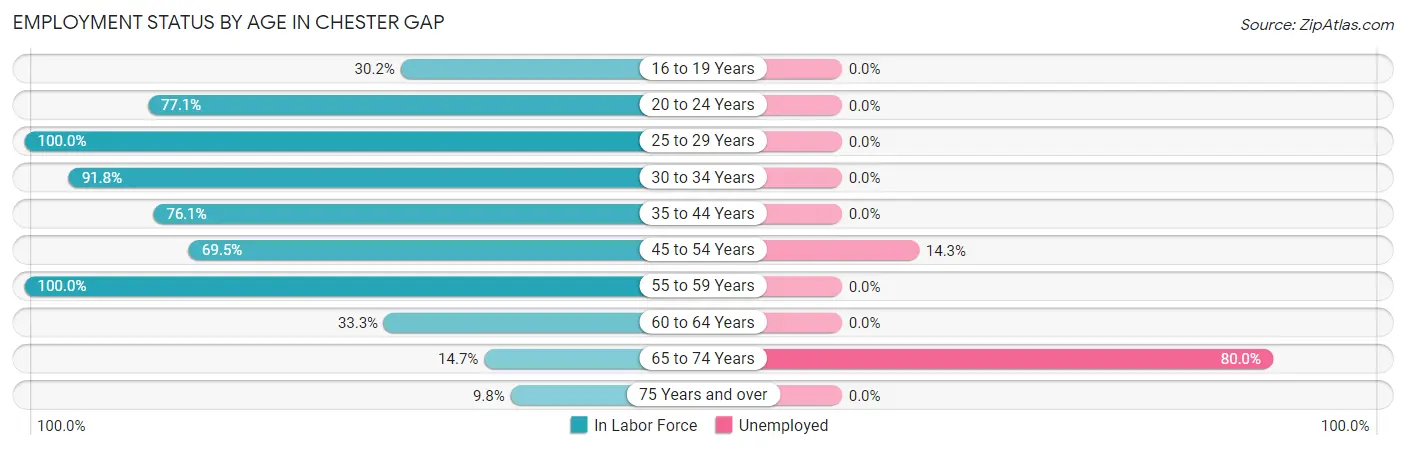
| Age Bracket | In Labor Force | Unemployed |
| 16 to 19 Years | 13 (30.2%) | 0 (0.0%) |
| 20 to 24 Years | 101 (77.1%) | 0 (0.0%) |
| 25 to 29 Years | 48 (100.0%) | 0 (0.0%) |
| 30 to 34 Years | 67 (91.8%) | 0 (0.0%) |
| 35 to 44 Years | 178 (76.1%) | 0 (0.0%) |
| 45 to 54 Years | 91 (69.5%) | 13 (14.3%) |
| 55 to 59 Years | 9 (100.0%) | 0 (0.0%) |
| 60 to 64 Years | 6 (33.3%) | 0 (0.0%) |
| 65 to 74 Years | 5 (14.7%) | 4 (80.0%) |
| 75 Years and over | 8 (9.8%) | 0 (0.0%) |
| Total | 526 (65.5%) | 17 (3.2%) |
Employment Status by Educational Attainment in Chester Gap
According to labor force statistics for Chester Gap, 77.8% of individuals (399) out of the total population between 25 and 64 years of age (513) are in the labor force, with 3.3% or 13 of them being unemployed. The group with the highest labor force participation rate are those with the educational attainment of bachelor's degree or higher, with 100.0% or 52 individuals in the labor force. Within the labor force, individuals with high school diploma education have the highest percentage of unemployment, with 19.4% or 13 of them being unemployed.
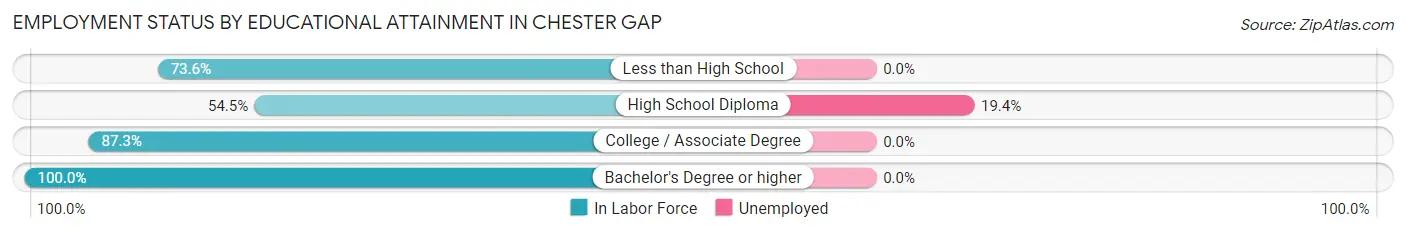
| Educational Attainment | In Labor Force | Unemployed |
| Less than High School | 81 (73.6%) | 0 (0.0%) |
| High School Diploma | 67 (54.5%) | 24 (19.4%) |
| College / Associate Degree | 199 (87.3%) | 0 (0.0%) |
| Bachelor's Degree or higher | 52 (100.0%) | 0 (0.0%) |
| Total | 399 (77.8%) | 17 (3.3%) |
Employment Occupations by Sex in Chester Gap
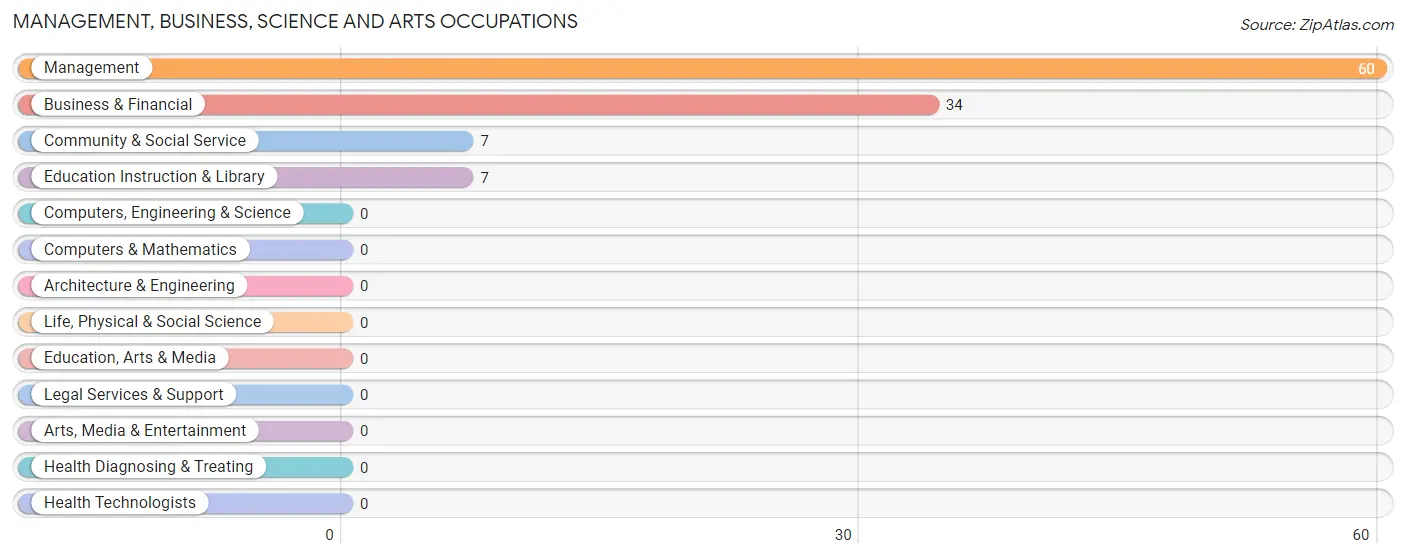
Management, Business, Science and Arts Occupations
The most common Management, Business, Science and Arts occupations in Chester Gap are Management (60 | 11.8%), Business & Financial (34 | 6.7%), Community & Social Service (7 | 1.4%), and Education Instruction & Library (7 | 1.4%).
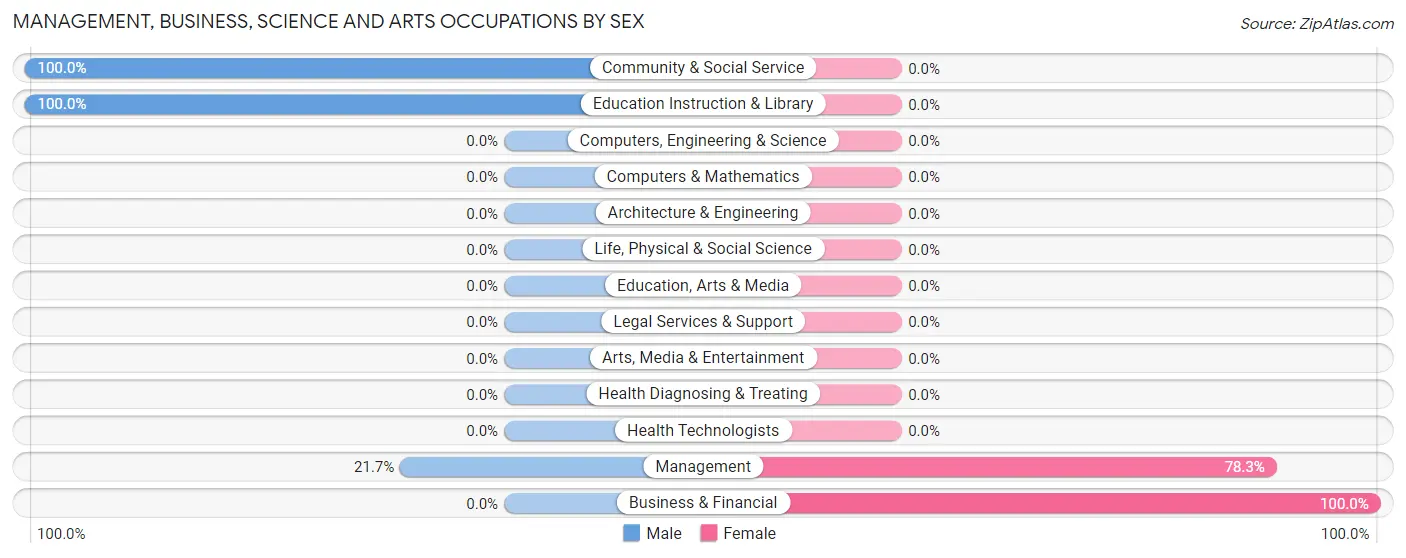
Management, Business, Science and Arts Occupations by Sex
Within the Management, Business, Science and Arts occupations in Chester Gap, the most male-oriented occupations are Community & Social Service (100.0%), Education Instruction & Library (100.0%), and Management (21.7%), while the most female-oriented occupations are Business & Financial (100.0%), and Management (78.3%).
| Occupation | Male | Female |
| Management | 13 (21.7%) | 47 (78.3%) |
| Business & Financial | 0 (0.0%) | 34 (100.0%) |
| Computers, Engineering & Science | 0 (0.0%) | 0 (0.0%) |
| Computers & Mathematics | 0 (0.0%) | 0 (0.0%) |
| Architecture & Engineering | 0 (0.0%) | 0 (0.0%) |
| Life, Physical & Social Science | 0 (0.0%) | 0 (0.0%) |
| Community & Social Service | 7 (100.0%) | 0 (0.0%) |
| Education, Arts & Media | 0 (0.0%) | 0 (0.0%) |
| Legal Services & Support | 0 (0.0%) | 0 (0.0%) |
| Education Instruction & Library | 7 (100.0%) | 0 (0.0%) |
| Arts, Media & Entertainment | 0 (0.0%) | 0 (0.0%) |
| Health Diagnosing & Treating | 0 (0.0%) | 0 (0.0%) |
| Health Technologists | 0 (0.0%) | 0 (0.0%) |
| Total (Category) | 20 (19.8%) | 81 (80.2%) |
| Total (Overall) | 295 (58.0%) | 214 (42.0%) |
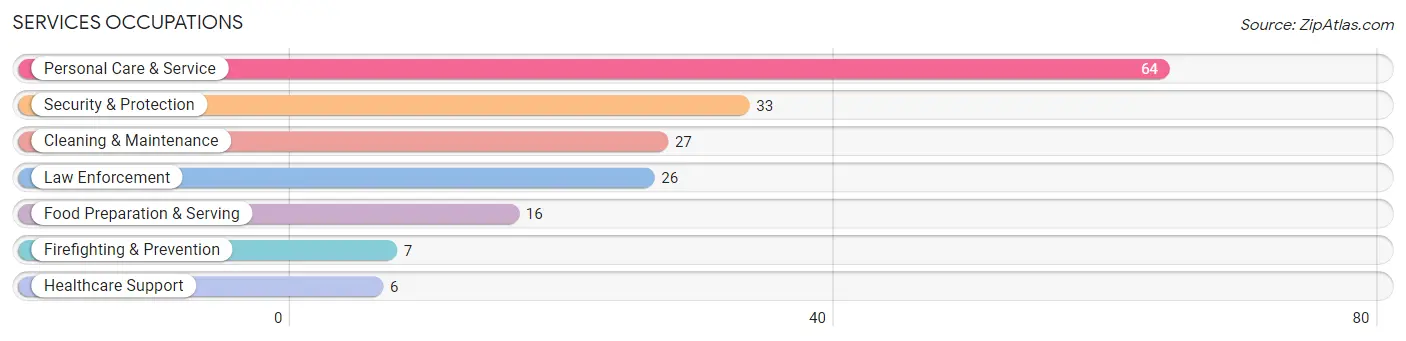
Services Occupations
The most common Services occupations in Chester Gap are Personal Care & Service (64 | 12.6%), Security & Protection (33 | 6.5%), Cleaning & Maintenance (27 | 5.3%), Law Enforcement (26 | 5.1%), and Food Preparation & Serving (16 | 3.1%).
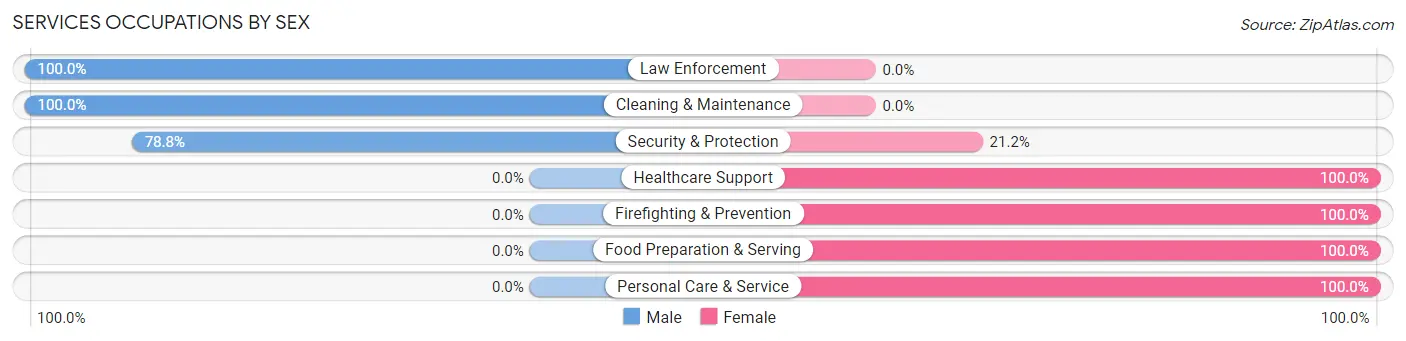
Services Occupations by Sex
Within the Services occupations in Chester Gap, the most male-oriented occupations are Law Enforcement (100.0%), Cleaning & Maintenance (100.0%), and Security & Protection (78.8%), while the most female-oriented occupations are Healthcare Support (100.0%), Firefighting & Prevention (100.0%), and Food Preparation & Serving (100.0%).
| Occupation | Male | Female |
| Healthcare Support | 0 (0.0%) | 6 (100.0%) |
| Security & Protection | 26 (78.8%) | 7 (21.2%) |
| Firefighting & Prevention | 0 (0.0%) | 7 (100.0%) |
| Law Enforcement | 26 (100.0%) | 0 (0.0%) |
| Food Preparation & Serving | 0 (0.0%) | 16 (100.0%) |
| Cleaning & Maintenance | 27 (100.0%) | 0 (0.0%) |
| Personal Care & Service | 0 (0.0%) | 64 (100.0%) |
| Total (Category) | 53 (36.3%) | 93 (63.7%) |
| Total (Overall) | 295 (58.0%) | 214 (42.0%) |
Sales and Office Occupations
The most common Sales and Office occupations in Chester Gap are Sales & Related (30 | 5.9%), and Office & Administration (1 | 0.2%).
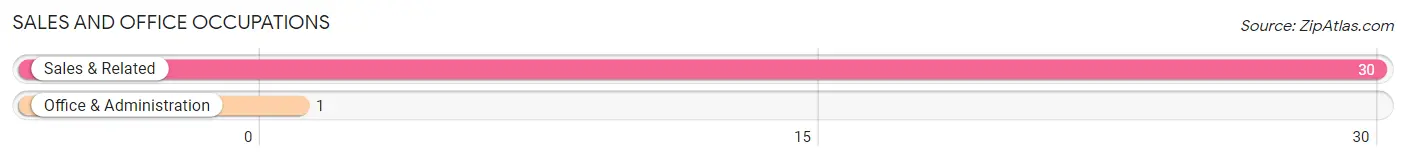
Sales and Office Occupations by Sex

| Occupation | Male | Female |
| Sales & Related | 30 (100.0%) | 0 (0.0%) |
| Office & Administration | 0 (0.0%) | 1 (100.0%) |
| Total (Category) | 30 (96.8%) | 1 (3.2%) |
| Total (Overall) | 295 (58.0%) | 214 (42.0%) |
Natural Resources, Construction and Maintenance Occupations
The most common Natural Resources, Construction and Maintenance occupations in Chester Gap are Construction & Extraction (63 | 12.4%), and Installation, Maintenance & Repair (63 | 12.4%).
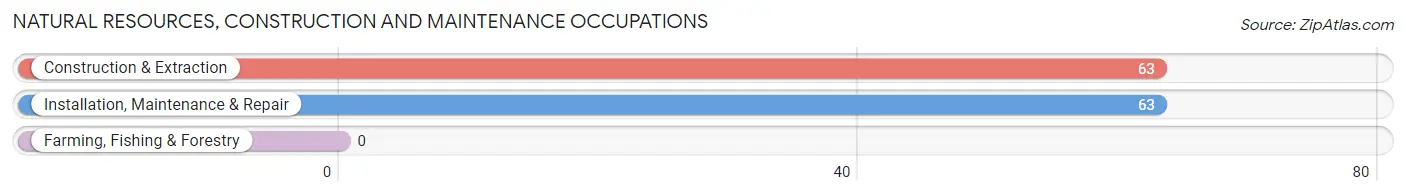
Natural Resources, Construction and Maintenance Occupations by Sex
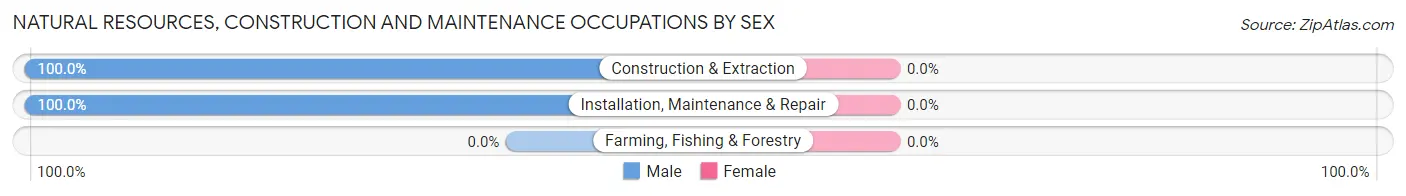
| Occupation | Male | Female |
| Farming, Fishing & Forestry | 0 (0.0%) | 0 (0.0%) |
| Construction & Extraction | 63 (100.0%) | 0 (0.0%) |
| Installation, Maintenance & Repair | 63 (100.0%) | 0 (0.0%) |
| Total (Category) | 126 (100.0%) | 0 (0.0%) |
| Total (Overall) | 295 (58.0%) | 214 (42.0%) |
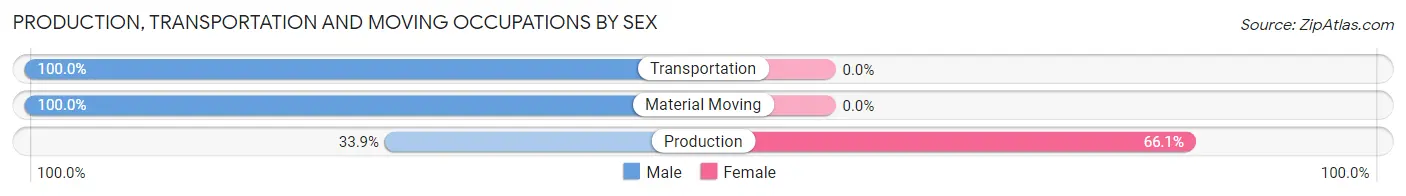
Production, Transportation and Moving Occupations
The most common Production, Transportation and Moving occupations in Chester Gap are Production (59 | 11.6%), Material Moving (42 | 8.3%), and Transportation (4 | 0.8%).
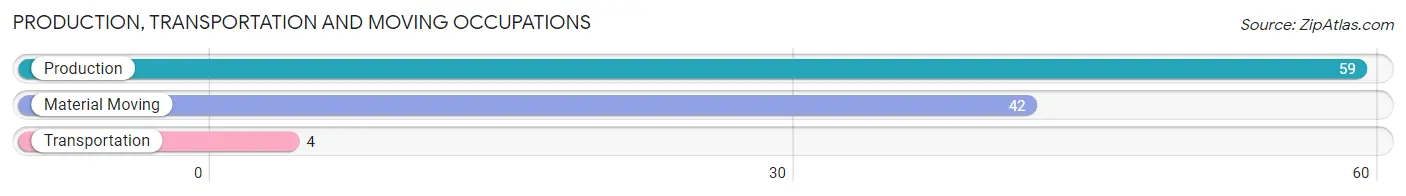
Production, Transportation and Moving Occupations by Sex
| Occupation | Male | Female |
| Production | 20 (33.9%) | 39 (66.1%) |
| Transportation | 4 (100.0%) | 0 (0.0%) |
| Material Moving | 42 (100.0%) | 0 (0.0%) |
| Total (Category) | 66 (62.9%) | 39 (37.1%) |
| Total (Overall) | 295 (58.0%) | 214 (42.0%) |
Employment Industries by Sex in Chester Gap
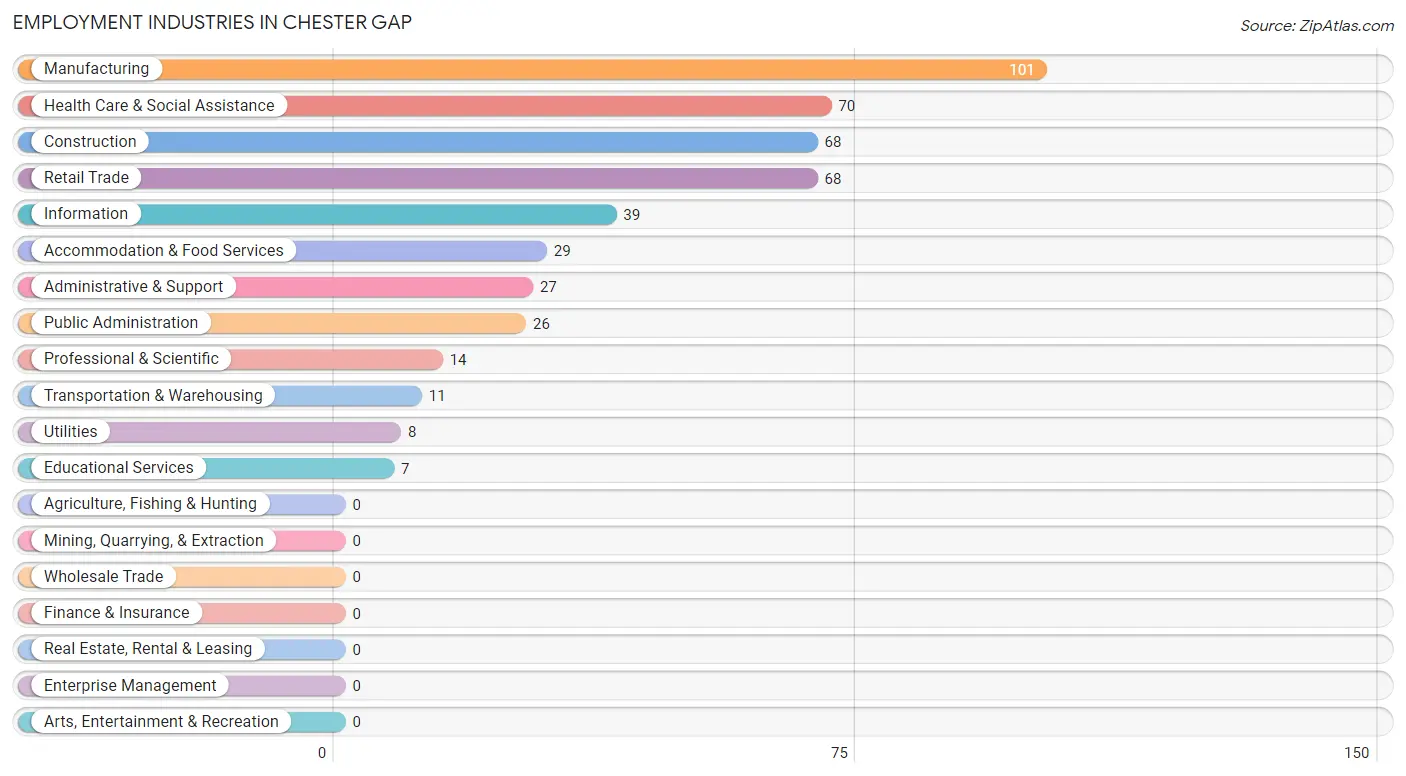
Employment Industries in Chester Gap
The major employment industries in Chester Gap include Manufacturing (101 | 19.8%), Health Care & Social Assistance (70 | 13.8%), Construction (68 | 13.4%), Retail Trade (68 | 13.4%), and Information (39 | 7.7%).
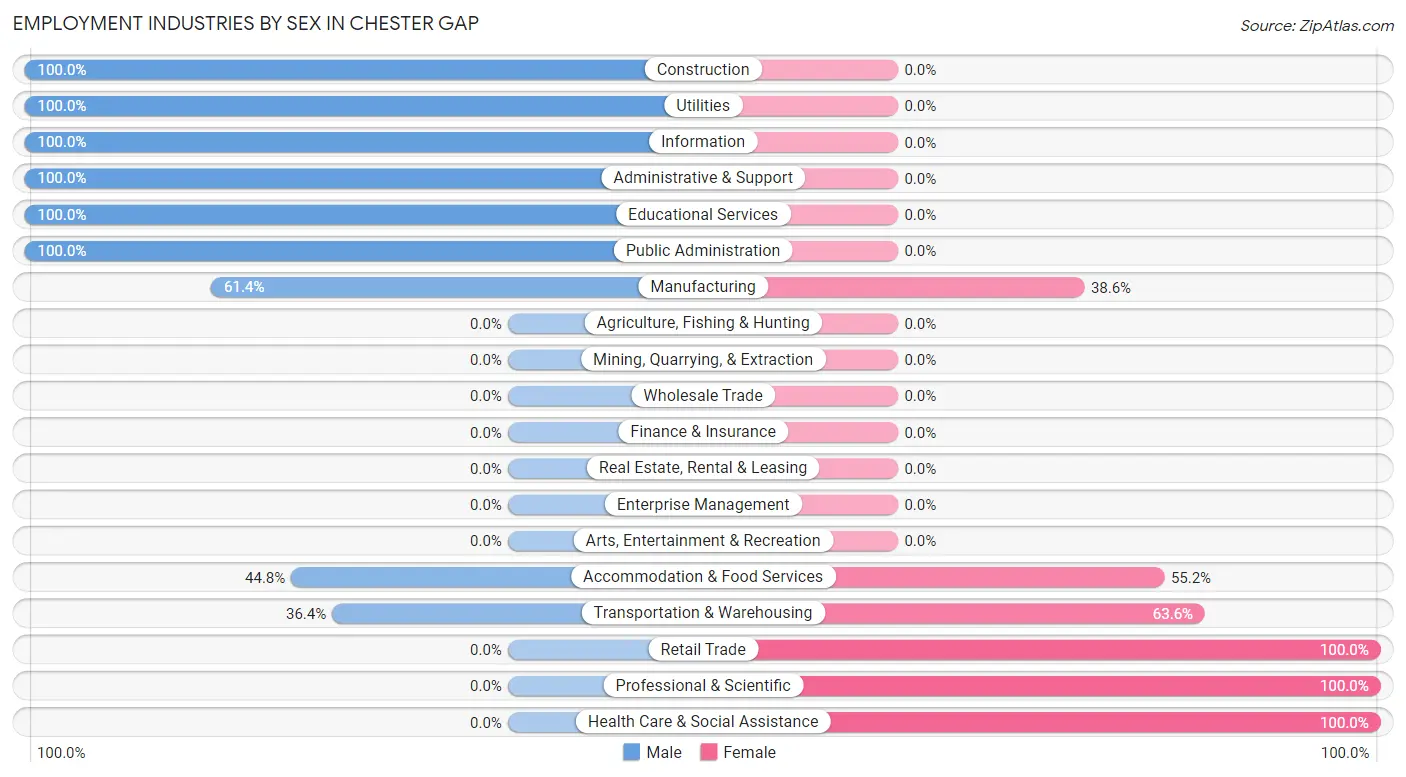
Employment Industries by Sex in Chester Gap
The Chester Gap industries that see more men than women are Construction (100.0%), Utilities (100.0%), and Information (100.0%), whereas the industries that tend to have a higher number of women are Retail Trade (100.0%), Professional & Scientific (100.0%), and Health Care & Social Assistance (100.0%).
| Industry | Male | Female |
| Agriculture, Fishing & Hunting | 0 (0.0%) | 0 (0.0%) |
| Mining, Quarrying, & Extraction | 0 (0.0%) | 0 (0.0%) |
| Construction | 68 (100.0%) | 0 (0.0%) |
| Manufacturing | 62 (61.4%) | 39 (38.6%) |
| Wholesale Trade | 0 (0.0%) | 0 (0.0%) |
| Retail Trade | 0 (0.0%) | 68 (100.0%) |
| Transportation & Warehousing | 4 (36.4%) | 7 (63.6%) |
| Utilities | 8 (100.0%) | 0 (0.0%) |
| Information | 39 (100.0%) | 0 (0.0%) |
| Finance & Insurance | 0 (0.0%) | 0 (0.0%) |
| Real Estate, Rental & Leasing | 0 (0.0%) | 0 (0.0%) |
| Professional & Scientific | 0 (0.0%) | 14 (100.0%) |
| Enterprise Management | 0 (0.0%) | 0 (0.0%) |
| Administrative & Support | 27 (100.0%) | 0 (0.0%) |
| Educational Services | 7 (100.0%) | 0 (0.0%) |
| Health Care & Social Assistance | 0 (0.0%) | 70 (100.0%) |
| Arts, Entertainment & Recreation | 0 (0.0%) | 0 (0.0%) |
| Accommodation & Food Services | 13 (44.8%) | 16 (55.2%) |
| Public Administration | 26 (100.0%) | 0 (0.0%) |
| Total | 295 (58.0%) | 214 (42.0%) |
Education in Chester Gap
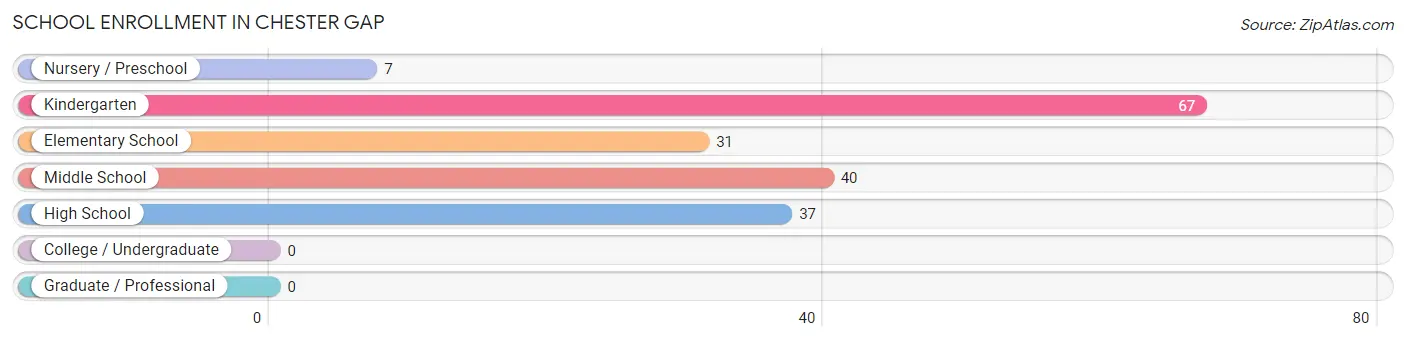
School Enrollment in Chester Gap
The most common levels of schooling among the 182 students in Chester Gap are kindergarten (67 | 36.8%), middle school (40 | 22.0%), and high school (37 | 20.3%).
| School Level | # Students | % Students |
| Nursery / Preschool | 7 | 3.8% |
| Kindergarten | 67 | 36.8% |
| Elementary School | 31 | 17.0% |
| Middle School | 40 | 22.0% |
| High School | 37 | 20.3% |
| College / Undergraduate | 0 | 0.0% |
| Graduate / Professional | 0 | 0.0% |
| Total | 182 | 100.0% |
School Enrollment by Age by Funding Source in Chester Gap
Out of a total of 182 students who are enrolled in schools in Chester Gap, 55 (30.2%) attend a private institution, while the remaining 127 (69.8%) are enrolled in public schools. The age group of 3 to 4 year olds has the highest likelihood of being enrolled in private schools, with 7 (100.0% in the age bracket) enrolled. Conversely, the age group of 10 to 14 year olds has the lowest likelihood of being enrolled in a private school, with 30 (75.0% in the age bracket) attending a public institution.
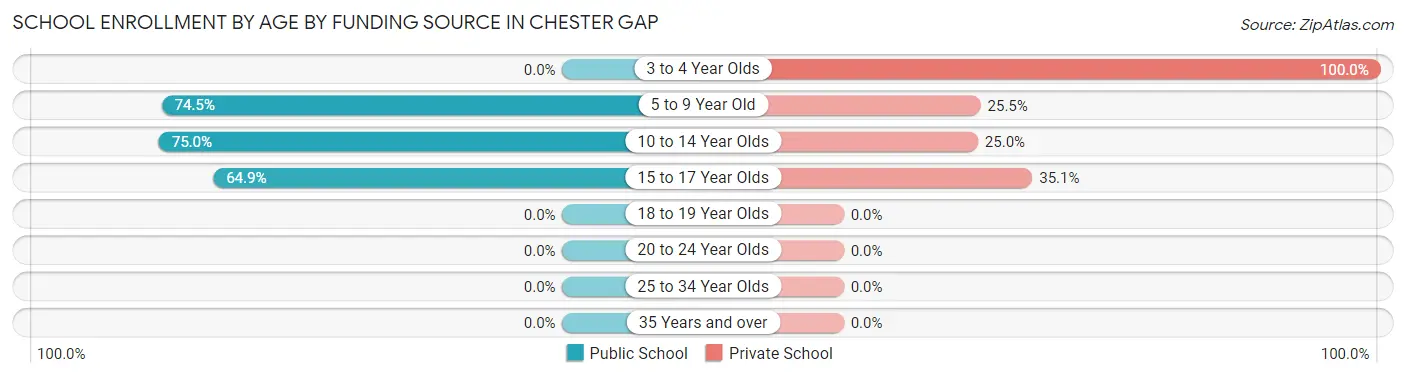
| Age Bracket | Public School | Private School |
| 3 to 4 Year Olds | 0 (0.0%) | 7 (100.0%) |
| 5 to 9 Year Old | 73 (74.5%) | 25 (25.5%) |
| 10 to 14 Year Olds | 30 (75.0%) | 10 (25.0%) |
| 15 to 17 Year Olds | 24 (64.9%) | 13 (35.1%) |
| 18 to 19 Year Olds | 0 (0.0%) | 0 (0.0%) |
| 20 to 24 Year Olds | 0 (0.0%) | 0 (0.0%) |
| 25 to 34 Year Olds | 0 (0.0%) | 0 (0.0%) |
| 35 Years and over | 0 (0.0%) | 0 (0.0%) |
| Total | 127 (69.8%) | 55 (30.2%) |
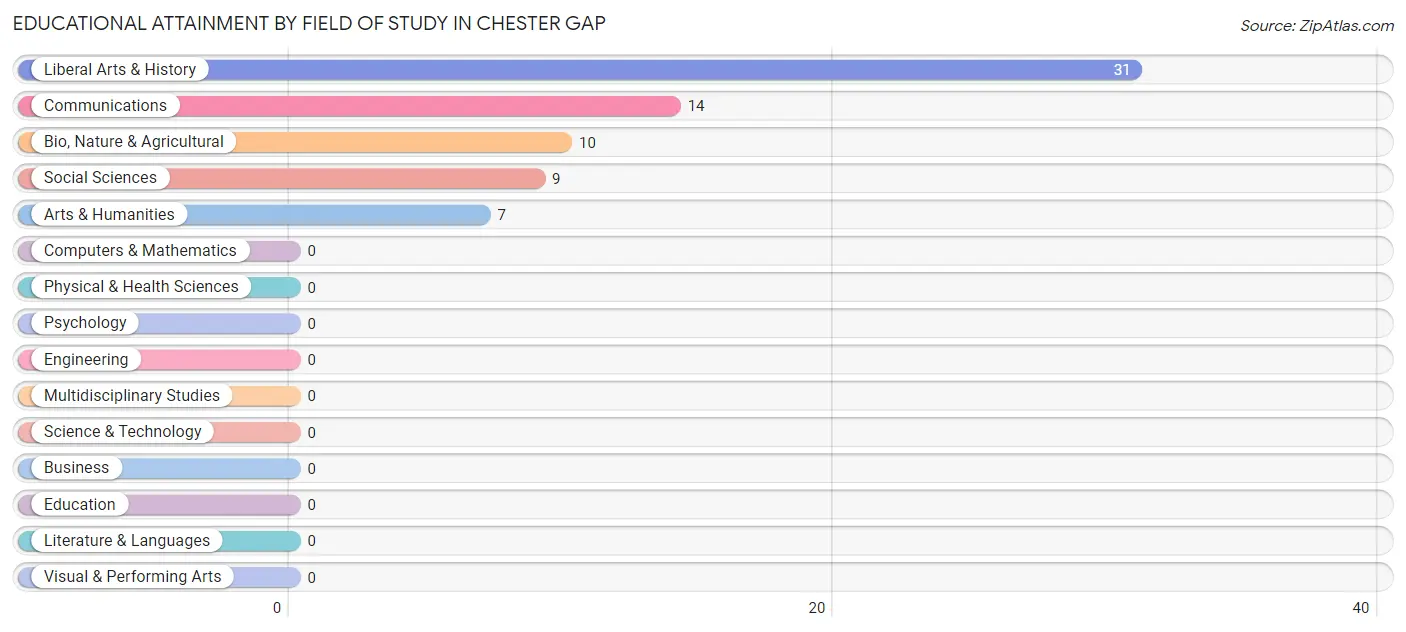
Educational Attainment by Field of Study in Chester Gap
Liberal arts & history (31 | 43.7%), communications (14 | 19.7%), bio, nature & agricultural (10 | 14.1%), social sciences (9 | 12.7%), and arts & humanities (7 | 9.9%) are the most common fields of study among 71 individuals in Chester Gap who have obtained a bachelor's degree or higher.
| Field of Study | # Graduates | % Graduates |
| Computers & Mathematics | 0 | 0.0% |
| Bio, Nature & Agricultural | 10 | 14.1% |
| Physical & Health Sciences | 0 | 0.0% |
| Psychology | 0 | 0.0% |
| Social Sciences | 9 | 12.7% |
| Engineering | 0 | 0.0% |
| Multidisciplinary Studies | 0 | 0.0% |
| Science & Technology | 0 | 0.0% |
| Business | 0 | 0.0% |
| Education | 0 | 0.0% |
| Literature & Languages | 0 | 0.0% |
| Liberal Arts & History | 31 | 43.7% |
| Visual & Performing Arts | 0 | 0.0% |
| Communications | 14 | 19.7% |
| Arts & Humanities | 7 | 9.9% |
| Total | 71 | 100.0% |
Transportation & Commute in Chester Gap
Vehicle Availability by Sex in Chester Gap
The most prevalent vehicle ownership categories in Chester Gap are males with 2 vehicles (128, accounting for 43.4%) and females with 2 vehicles (133, making up 59.8%).
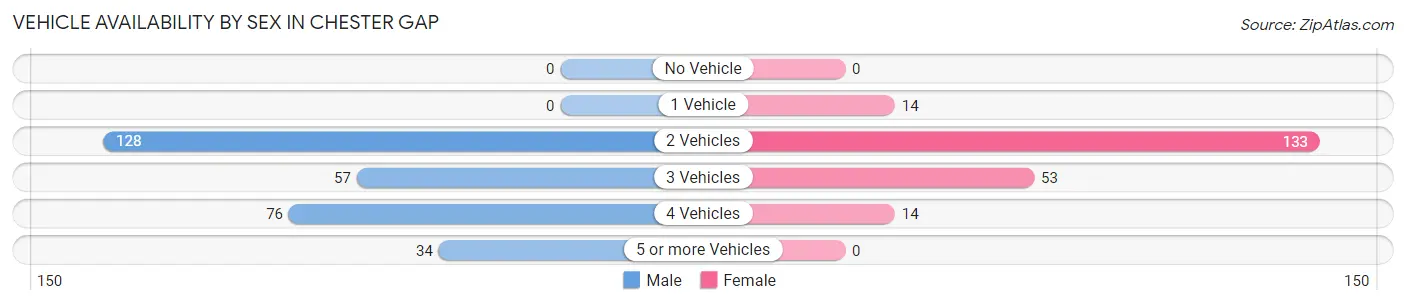
| Vehicles Available | Male | Female |
| No Vehicle | 0 (0.0%) | 0 (0.0%) |
| 1 Vehicle | 0 (0.0%) | 14 (6.5%) |
| 2 Vehicles | 128 (43.4%) | 133 (62.2%) |
| 3 Vehicles | 57 (19.3%) | 53 (24.8%) |
| 4 Vehicles | 76 (25.8%) | 14 (6.5%) |
| 5 or more Vehicles | 34 (11.5%) | 0 (0.0%) |
| Total | 295 (100.0%) | 214 (100.0%) |
Commute Time in Chester Gap
The most frequently occuring commute durations in Chester Gap are 90 or more minutes (99 commuters, 19.5%), 25 to 29 minutes (98 commuters, 19.3%), and 60 to 89 minutes (93 commuters, 18.3%).
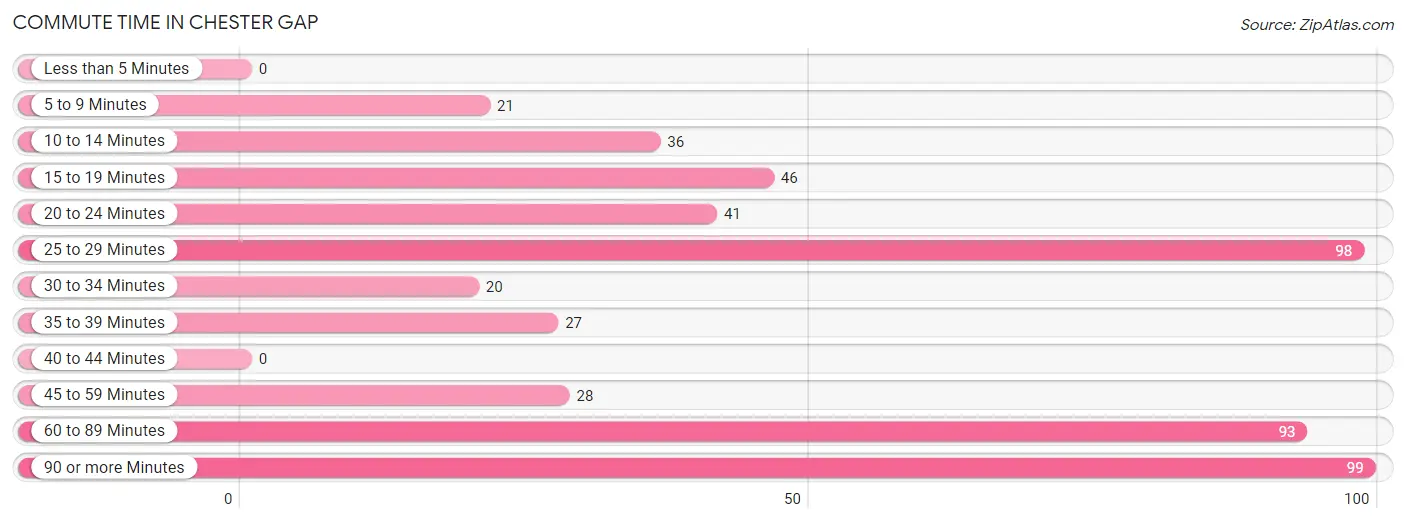
| Commute Time | # Commuters | % Commuters |
| Less than 5 Minutes | 0 | 0.0% |
| 5 to 9 Minutes | 21 | 4.1% |
| 10 to 14 Minutes | 36 | 7.1% |
| 15 to 19 Minutes | 46 | 9.0% |
| 20 to 24 Minutes | 41 | 8.1% |
| 25 to 29 Minutes | 98 | 19.3% |
| 30 to 34 Minutes | 20 | 3.9% |
| 35 to 39 Minutes | 27 | 5.3% |
| 40 to 44 Minutes | 0 | 0.0% |
| 45 to 59 Minutes | 28 | 5.5% |
| 60 to 89 Minutes | 93 | 18.3% |
| 90 or more Minutes | 99 | 19.5% |
Commute Time by Sex in Chester Gap
The most common commute times in Chester Gap are 90 or more minutes (60 commuters, 20.3%) for males and 25 to 29 minutes (64 commuters, 29.9%) for females.
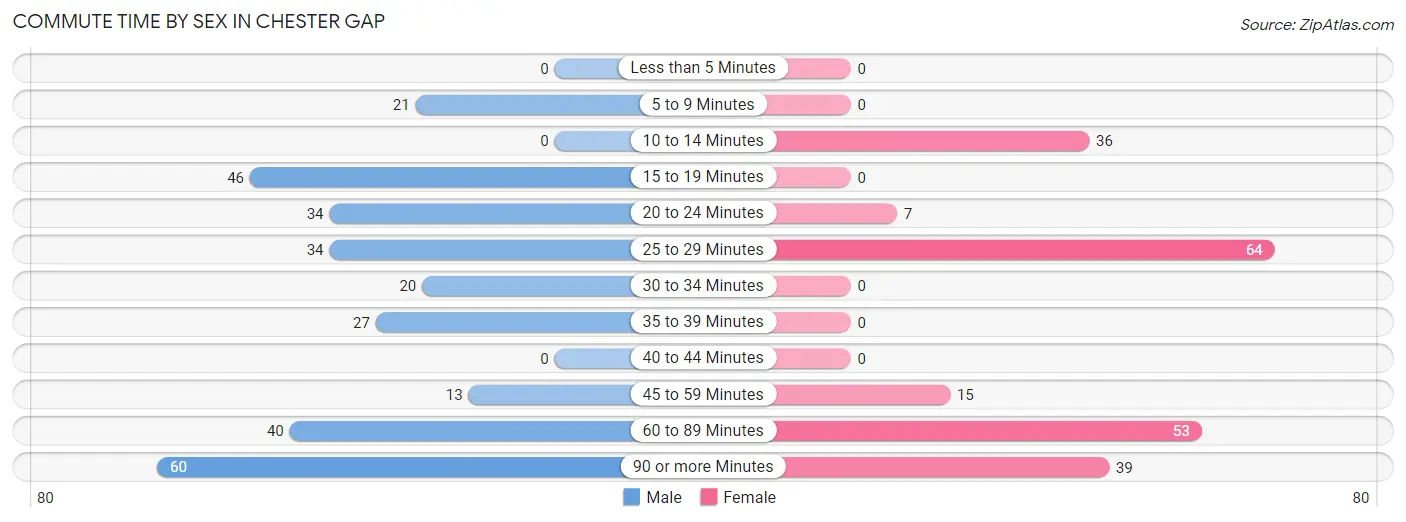
| Commute Time | Male | Female |
| Less than 5 Minutes | 0 (0.0%) | 0 (0.0%) |
| 5 to 9 Minutes | 21 (7.1%) | 0 (0.0%) |
| 10 to 14 Minutes | 0 (0.0%) | 36 (16.8%) |
| 15 to 19 Minutes | 46 (15.6%) | 0 (0.0%) |
| 20 to 24 Minutes | 34 (11.5%) | 7 (3.3%) |
| 25 to 29 Minutes | 34 (11.5%) | 64 (29.9%) |
| 30 to 34 Minutes | 20 (6.8%) | 0 (0.0%) |
| 35 to 39 Minutes | 27 (9.1%) | 0 (0.0%) |
| 40 to 44 Minutes | 0 (0.0%) | 0 (0.0%) |
| 45 to 59 Minutes | 13 (4.4%) | 15 (7.0%) |
| 60 to 89 Minutes | 40 (13.6%) | 53 (24.8%) |
| 90 or more Minutes | 60 (20.3%) | 39 (18.2%) |
Time of Departure to Work by Sex in Chester Gap
The most frequent times of departure to work in Chester Gap are 7:00 AM to 7:29 AM (85, 28.8%) for males and 7:30 AM to 7:59 AM (98, 45.8%) for females.
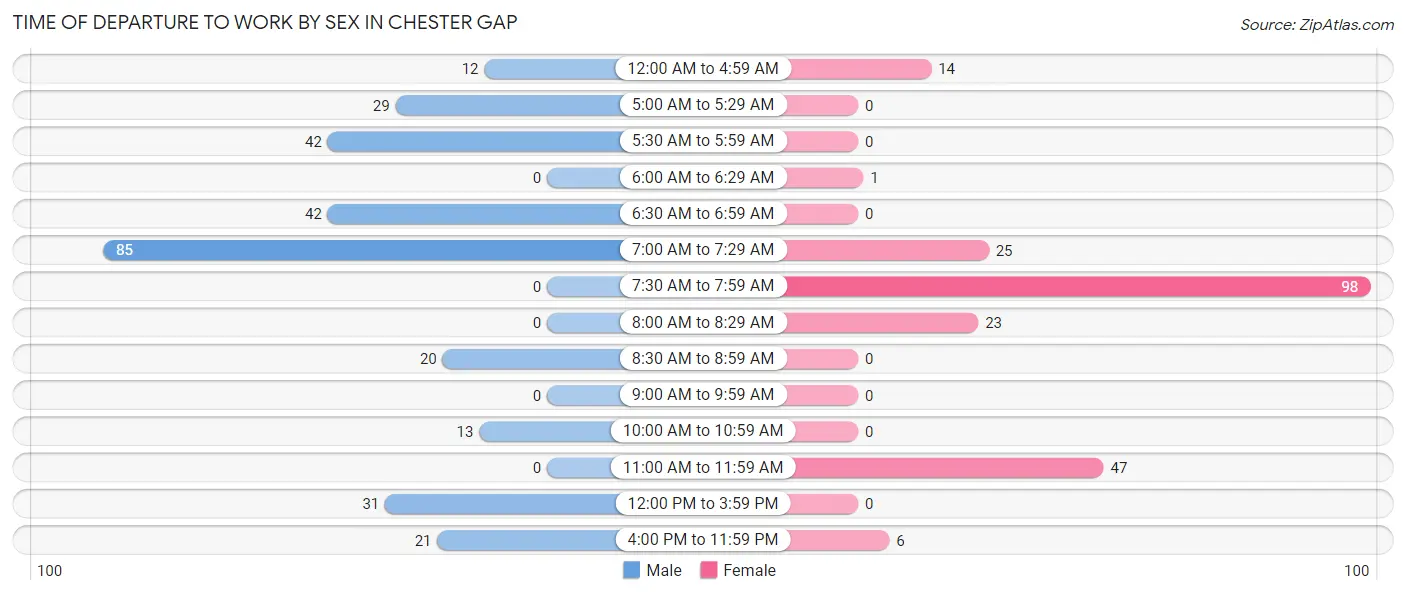
| Time of Departure | Male | Female |
| 12:00 AM to 4:59 AM | 12 (4.1%) | 14 (6.5%) |
| 5:00 AM to 5:29 AM | 29 (9.8%) | 0 (0.0%) |
| 5:30 AM to 5:59 AM | 42 (14.2%) | 0 (0.0%) |
| 6:00 AM to 6:29 AM | 0 (0.0%) | 1 (0.5%) |
| 6:30 AM to 6:59 AM | 42 (14.2%) | 0 (0.0%) |
| 7:00 AM to 7:29 AM | 85 (28.8%) | 25 (11.7%) |
| 7:30 AM to 7:59 AM | 0 (0.0%) | 98 (45.8%) |
| 8:00 AM to 8:29 AM | 0 (0.0%) | 23 (10.7%) |
| 8:30 AM to 8:59 AM | 20 (6.8%) | 0 (0.0%) |
| 9:00 AM to 9:59 AM | 0 (0.0%) | 0 (0.0%) |
| 10:00 AM to 10:59 AM | 13 (4.4%) | 0 (0.0%) |
| 11:00 AM to 11:59 AM | 0 (0.0%) | 47 (22.0%) |
| 12:00 PM to 3:59 PM | 31 (10.5%) | 0 (0.0%) |
| 4:00 PM to 11:59 PM | 21 (7.1%) | 6 (2.8%) |
| Total | 295 (100.0%) | 214 (100.0%) |
Housing Occupancy in Chester Gap
Occupancy by Ownership in Chester Gap
Of the total 295 dwellings in Chester Gap, owner-occupied units account for 215 (72.9%), while renter-occupied units make up 80 (27.1%).
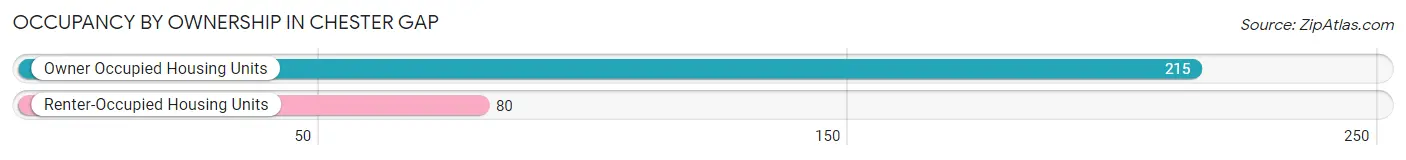
| Occupancy | # Housing Units | % Housing Units |
| Owner Occupied Housing Units | 215 | 72.9% |
| Renter-Occupied Housing Units | 80 | 27.1% |
| Total Occupied Housing Units | 295 | 100.0% |
Occupancy by Household Size in Chester Gap
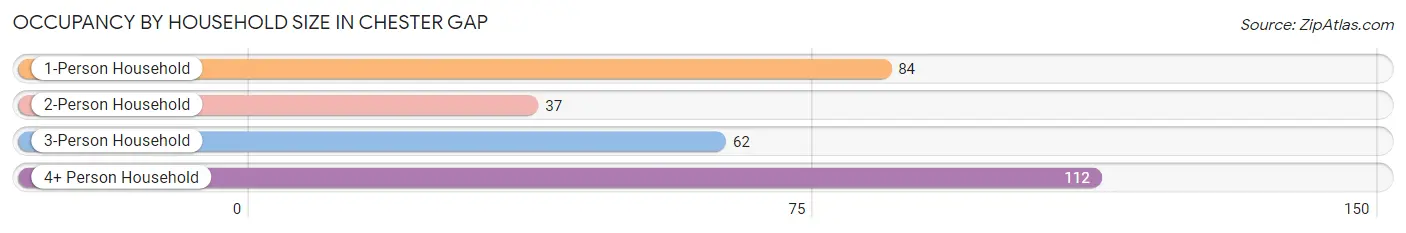
| Household Size | # Housing Units | % Housing Units |
| 1-Person Household | 84 | 28.5% |
| 2-Person Household | 37 | 12.5% |
| 3-Person Household | 62 | 21.0% |
| 4+ Person Household | 112 | 38.0% |
| Total Housing Units | 295 | 100.0% |
Occupancy by Ownership by Household Size in Chester Gap
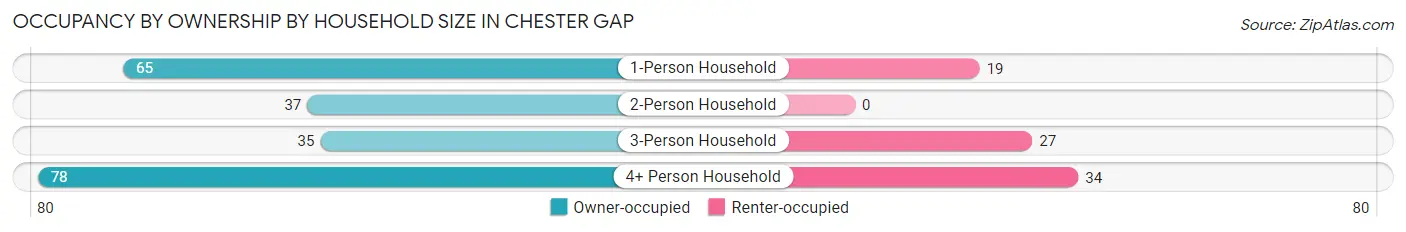
| Household Size | Owner-occupied | Renter-occupied |
| 1-Person Household | 65 (77.4%) | 19 (22.6%) |
| 2-Person Household | 37 (100.0%) | 0 (0.0%) |
| 3-Person Household | 35 (56.5%) | 27 (43.5%) |
| 4+ Person Household | 78 (69.6%) | 34 (30.4%) |
| Total Housing Units | 215 (72.9%) | 80 (27.1%) |
Occupancy by Educational Attainment in Chester Gap
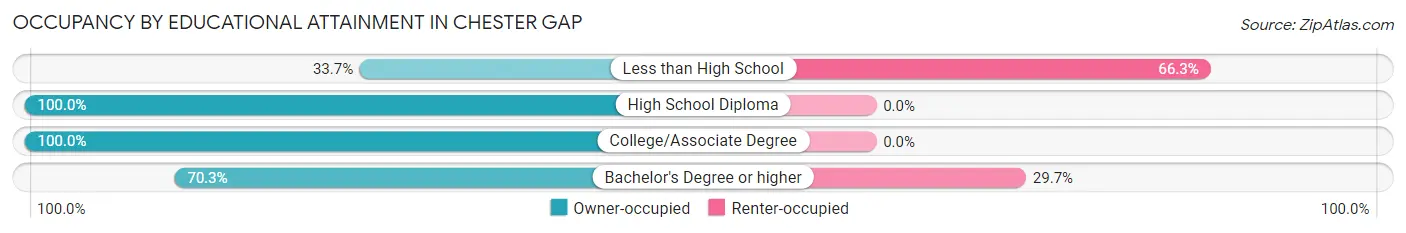
| Household Size | Owner-occupied | Renter-occupied |
| Less than High School | 31 (33.7%) | 61 (66.3%) |
| High School Diploma | 78 (100.0%) | 0 (0.0%) |
| College/Associate Degree | 61 (100.0%) | 0 (0.0%) |
| Bachelor's Degree or higher | 45 (70.3%) | 19 (29.7%) |
Occupancy by Age of Householder in Chester Gap
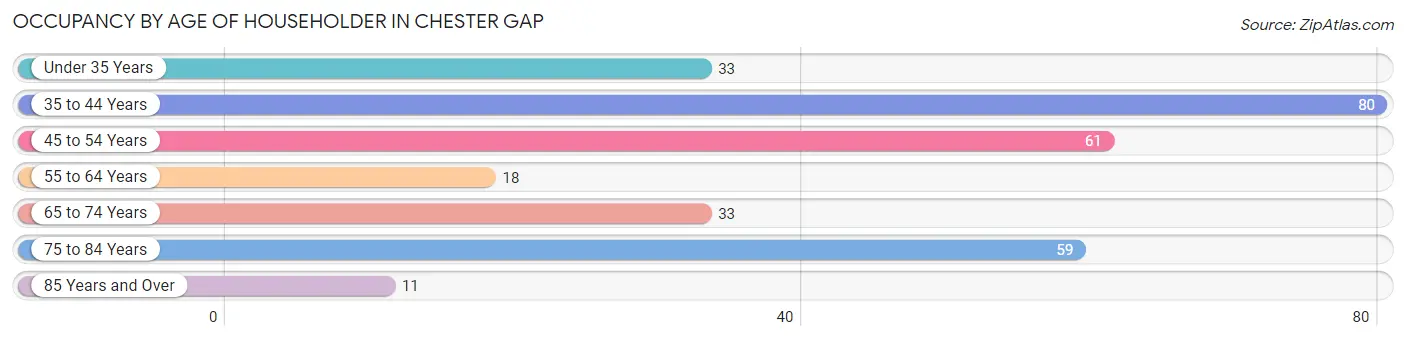
| Age Bracket | # Households | % Households |
| Under 35 Years | 33 | 11.2% |
| 35 to 44 Years | 80 | 27.1% |
| 45 to 54 Years | 61 | 20.7% |
| 55 to 64 Years | 18 | 6.1% |
| 65 to 74 Years | 33 | 11.2% |
| 75 to 84 Years | 59 | 20.0% |
| 85 Years and Over | 11 | 3.7% |
| Total | 295 | 100.0% |
Housing Finances in Chester Gap
Median Income by Occupancy in Chester Gap
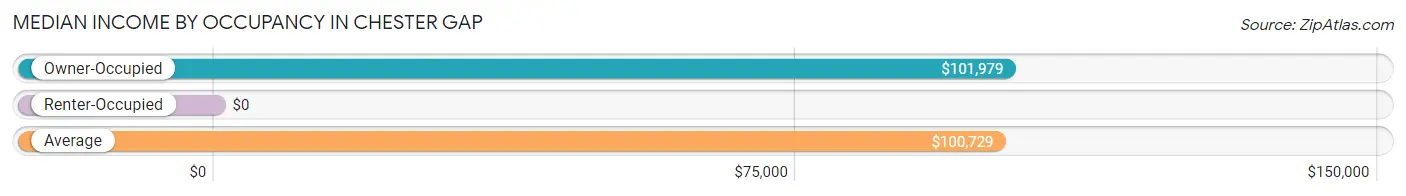
| Occupancy Type | # Households | Median Income |
| Owner-Occupied | 215 (72.9%) | $101,979 |
| Renter-Occupied | 80 (27.1%) | $0 |
| Average | 295 (100.0%) | $100,729 |
Occupancy by Householder Income Bracket in Chester Gap
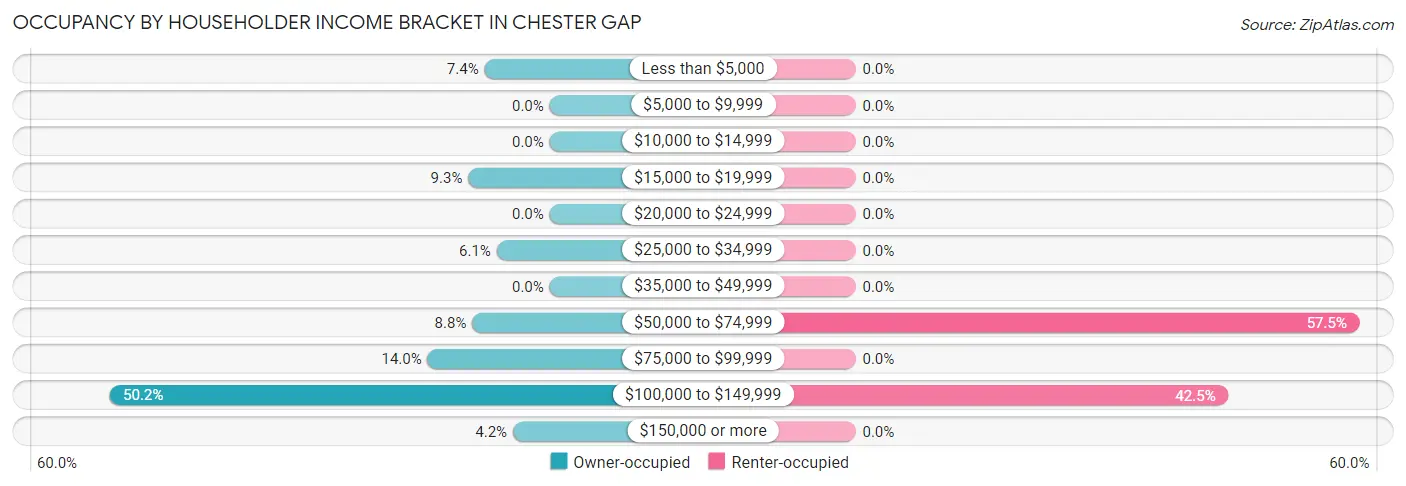
| Income Bracket | Owner-occupied | Renter-occupied |
| Less than $5,000 | 16 (7.4%) | 0 (0.0%) |
| $5,000 to $9,999 | 0 (0.0%) | 0 (0.0%) |
| $10,000 to $14,999 | 0 (0.0%) | 0 (0.0%) |
| $15,000 to $19,999 | 20 (9.3%) | 0 (0.0%) |
| $20,000 to $24,999 | 0 (0.0%) | 0 (0.0%) |
| $25,000 to $34,999 | 13 (6.0%) | 0 (0.0%) |
| $35,000 to $49,999 | 0 (0.0%) | 0 (0.0%) |
| $50,000 to $74,999 | 19 (8.8%) | 46 (57.5%) |
| $75,000 to $99,999 | 30 (14.0%) | 0 (0.0%) |
| $100,000 to $149,999 | 108 (50.2%) | 34 (42.5%) |
| $150,000 or more | 9 (4.2%) | 0 (0.0%) |
| Total | 215 (100.0%) | 80 (100.0%) |
Monthly Housing Cost Tiers in Chester Gap
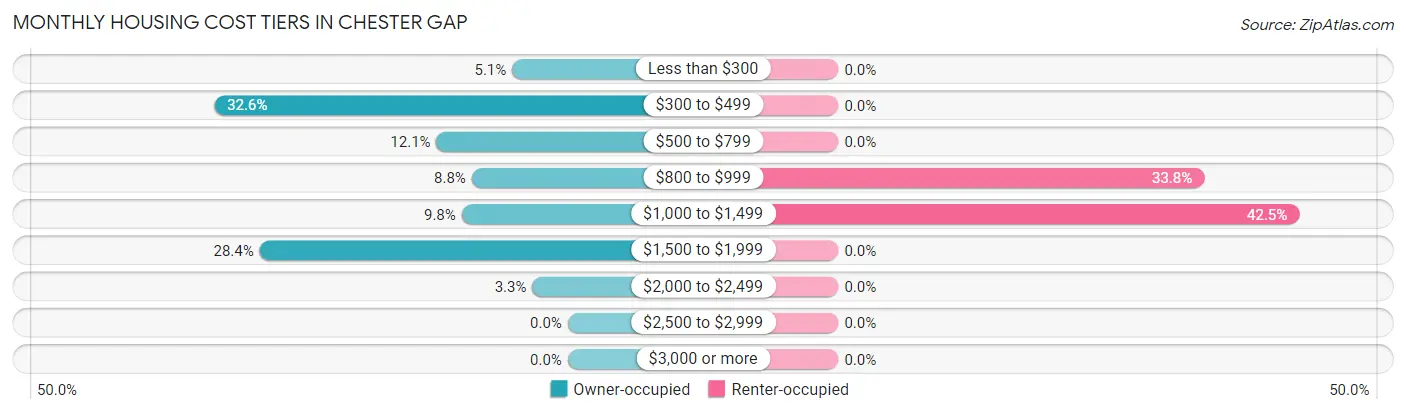
| Monthly Cost | Owner-occupied | Renter-occupied |
| Less than $300 | 11 (5.1%) | 0 (0.0%) |
| $300 to $499 | 70 (32.6%) | 0 (0.0%) |
| $500 to $799 | 26 (12.1%) | 0 (0.0%) |
| $800 to $999 | 19 (8.8%) | 27 (33.8%) |
| $1,000 to $1,499 | 21 (9.8%) | 34 (42.5%) |
| $1,500 to $1,999 | 61 (28.4%) | 0 (0.0%) |
| $2,000 to $2,499 | 7 (3.3%) | 0 (0.0%) |
| $2,500 to $2,999 | 0 (0.0%) | 0 (0.0%) |
| $3,000 or more | 0 (0.0%) | 0 (0.0%) |
| Total | 215 (100.0%) | 80 (100.0%) |
Physical Housing Characteristics in Chester Gap
Housing Structures in Chester Gap
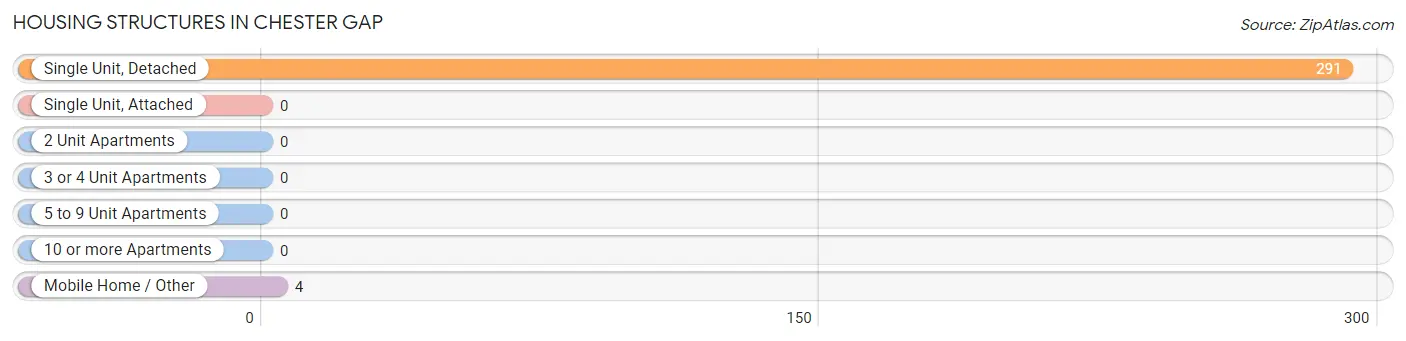
| Structure Type | # Housing Units | % Housing Units |
| Single Unit, Detached | 291 | 98.6% |
| Single Unit, Attached | 0 | 0.0% |
| 2 Unit Apartments | 0 | 0.0% |
| 3 or 4 Unit Apartments | 0 | 0.0% |
| 5 to 9 Unit Apartments | 0 | 0.0% |
| 10 or more Apartments | 0 | 0.0% |
| Mobile Home / Other | 4 | 1.4% |
| Total | 295 | 100.0% |
Housing Structures by Occupancy in Chester Gap
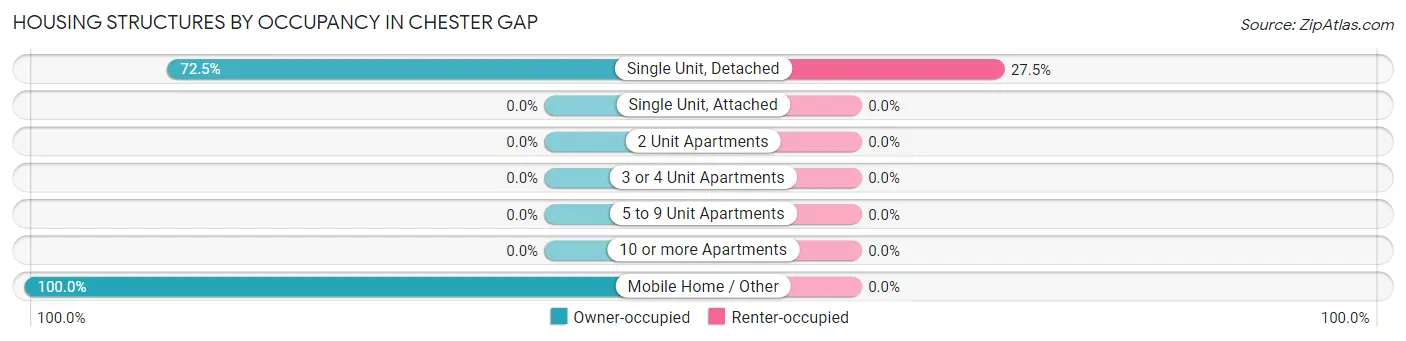
| Structure Type | Owner-occupied | Renter-occupied |
| Single Unit, Detached | 211 (72.5%) | 80 (27.5%) |
| Single Unit, Attached | 0 (0.0%) | 0 (0.0%) |
| 2 Unit Apartments | 0 (0.0%) | 0 (0.0%) |
| 3 or 4 Unit Apartments | 0 (0.0%) | 0 (0.0%) |
| 5 to 9 Unit Apartments | 0 (0.0%) | 0 (0.0%) |
| 10 or more Apartments | 0 (0.0%) | 0 (0.0%) |
| Mobile Home / Other | 4 (100.0%) | 0 (0.0%) |
| Total | 215 (72.9%) | 80 (27.1%) |
Housing Structures by Number of Rooms in Chester Gap
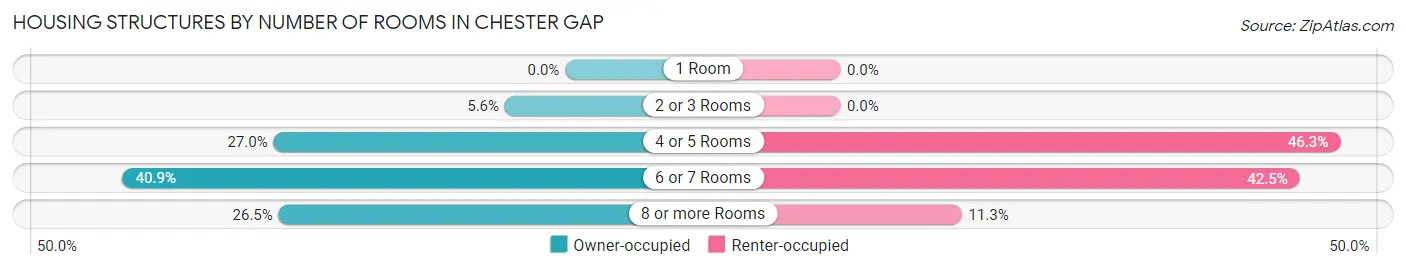
| Number of Rooms | Owner-occupied | Renter-occupied |
| 1 Room | 0 (0.0%) | 0 (0.0%) |
| 2 or 3 Rooms | 12 (5.6%) | 0 (0.0%) |
| 4 or 5 Rooms | 58 (27.0%) | 37 (46.3%) |
| 6 or 7 Rooms | 88 (40.9%) | 34 (42.5%) |
| 8 or more Rooms | 57 (26.5%) | 9 (11.3%) |
| Total | 215 (100.0%) | 80 (100.0%) |
Housing Structure by Heating Type in Chester Gap
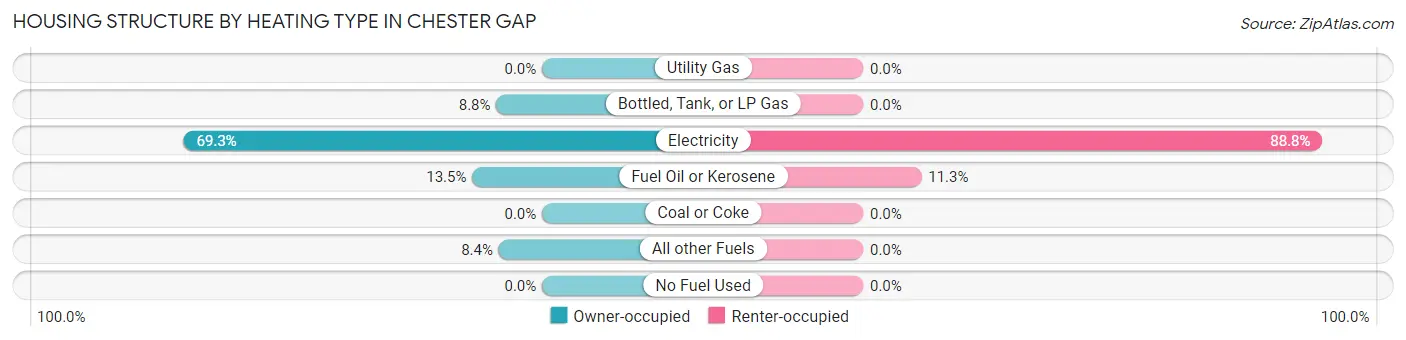
| Heating Type | Owner-occupied | Renter-occupied |
| Utility Gas | 0 (0.0%) | 0 (0.0%) |
| Bottled, Tank, or LP Gas | 19 (8.8%) | 0 (0.0%) |
| Electricity | 149 (69.3%) | 71 (88.7%) |
| Fuel Oil or Kerosene | 29 (13.5%) | 9 (11.3%) |
| Coal or Coke | 0 (0.0%) | 0 (0.0%) |
| All other Fuels | 18 (8.4%) | 0 (0.0%) |
| No Fuel Used | 0 (0.0%) | 0 (0.0%) |
| Total | 215 (100.0%) | 80 (100.0%) |
Household Vehicle Usage in Chester Gap
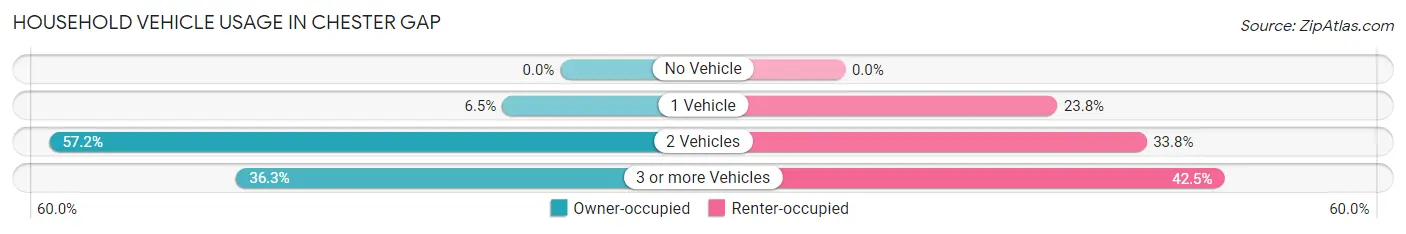
| Vehicles per Household | Owner-occupied | Renter-occupied |
| No Vehicle | 0 (0.0%) | 0 (0.0%) |
| 1 Vehicle | 14 (6.5%) | 19 (23.7%) |
| 2 Vehicles | 123 (57.2%) | 27 (33.8%) |
| 3 or more Vehicles | 78 (36.3%) | 34 (42.5%) |
| Total | 215 (100.0%) | 80 (100.0%) |
Real Estate & Mortgages in Chester Gap
Real Estate and Mortgage Overview in Chester Gap
| Characteristic | Without Mortgage | With Mortgage |
| Housing Units | 88 | 127 |
| Median Property Value | $209,400 | $220,200 |
| Median Household Income | - | - |
| Monthly Housing Costs | $386 | $0 |
| Real Estate Taxes | $1,409 | $16 |
Property Value by Mortgage Status in Chester Gap
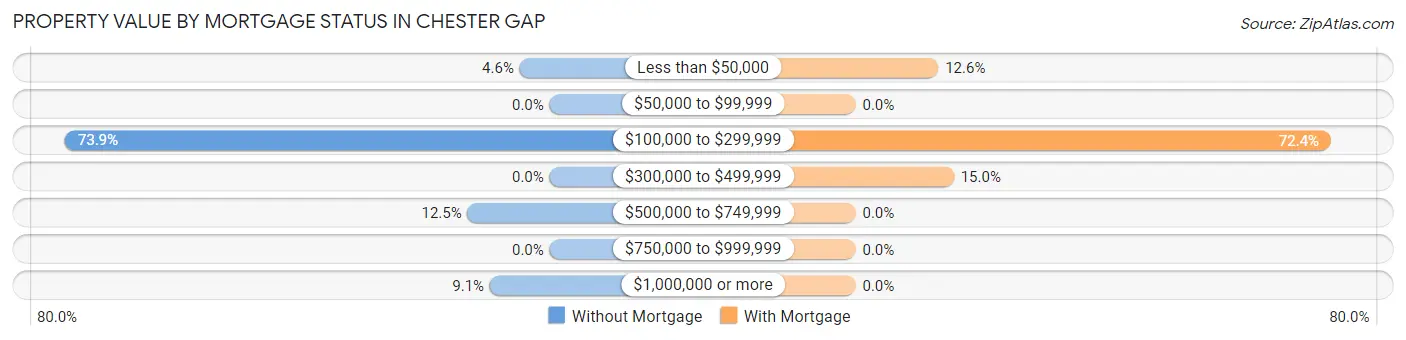
| Property Value | Without Mortgage | With Mortgage |
| Less than $50,000 | 4 (4.5%) | 16 (12.6%) |
| $50,000 to $99,999 | 0 (0.0%) | 0 (0.0%) |
| $100,000 to $299,999 | 65 (73.9%) | 92 (72.4%) |
| $300,000 to $499,999 | 0 (0.0%) | 19 (15.0%) |
| $500,000 to $749,999 | 11 (12.5%) | 0 (0.0%) |
| $750,000 to $999,999 | 0 (0.0%) | 0 (0.0%) |
| $1,000,000 or more | 8 (9.1%) | 0 (0.0%) |
| Total | 88 (100.0%) | 127 (100.0%) |
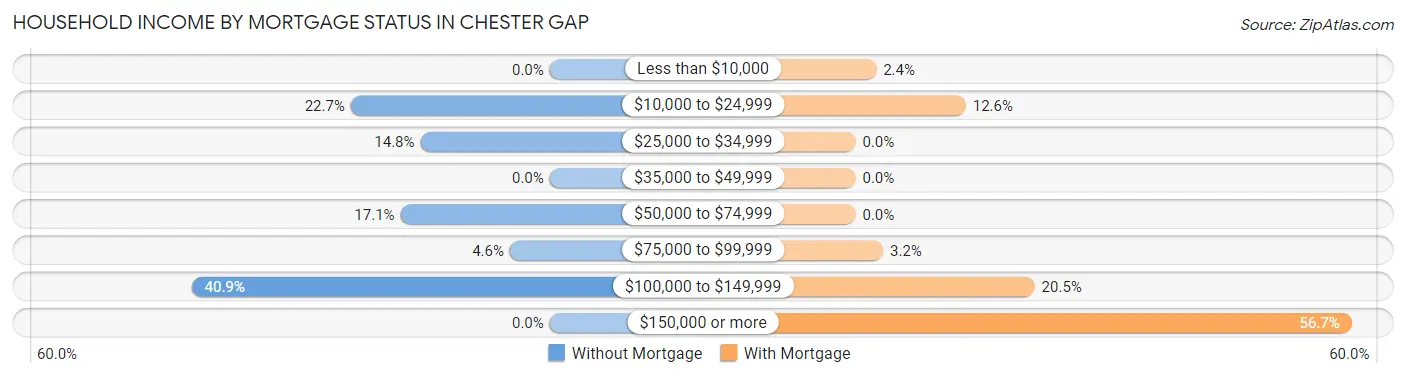
Household Income by Mortgage Status in Chester Gap
| Household Income | Without Mortgage | With Mortgage |
| Less than $10,000 | 0 (0.0%) | 3 (2.4%) |
| $10,000 to $24,999 | 20 (22.7%) | 16 (12.6%) |
| $25,000 to $34,999 | 13 (14.8%) | 0 (0.0%) |
| $35,000 to $49,999 | 0 (0.0%) | 0 (0.0%) |
| $50,000 to $74,999 | 15 (17.1%) | 0 (0.0%) |
| $75,000 to $99,999 | 4 (4.5%) | 4 (3.2%) |
| $100,000 to $149,999 | 36 (40.9%) | 26 (20.5%) |
| $150,000 or more | 0 (0.0%) | 72 (56.7%) |
| Total | 88 (100.0%) | 127 (100.0%) |
Property Value to Household Income Ratio in Chester Gap
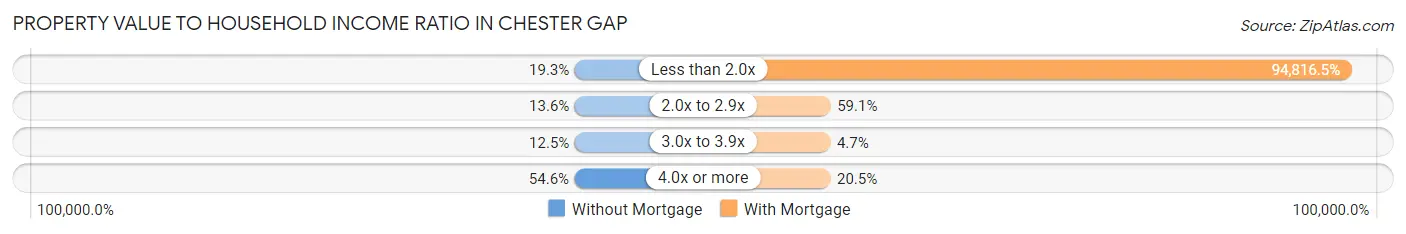
| Value-to-Income Ratio | Without Mortgage | With Mortgage |
| Less than 2.0x | 17 (19.3%) | 120,417 (94,816.5%) |
| 2.0x to 2.9x | 12 (13.6%) | 75 (59.1%) |
| 3.0x to 3.9x | 11 (12.5%) | 6 (4.7%) |
| 4.0x or more | 48 (54.5%) | 26 (20.5%) |
| Total | 88 (100.0%) | 127 (100.0%) |
Real Estate Taxes by Mortgage Status in Chester Gap
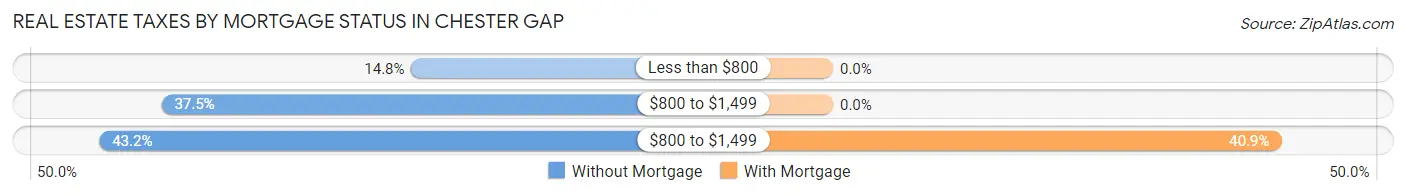
| Property Taxes | Without Mortgage | With Mortgage |
| Less than $800 | 13 (14.8%) | 0 (0.0%) |
| $800 to $1,499 | 33 (37.5%) | 0 (0.0%) |
| $800 to $1,499 | 38 (43.2%) | 52 (40.9%) |
| Total | 88 (100.0%) | 127 (100.0%) |
Health & Disability in Chester Gap
Health Insurance Coverage by Age in Chester Gap
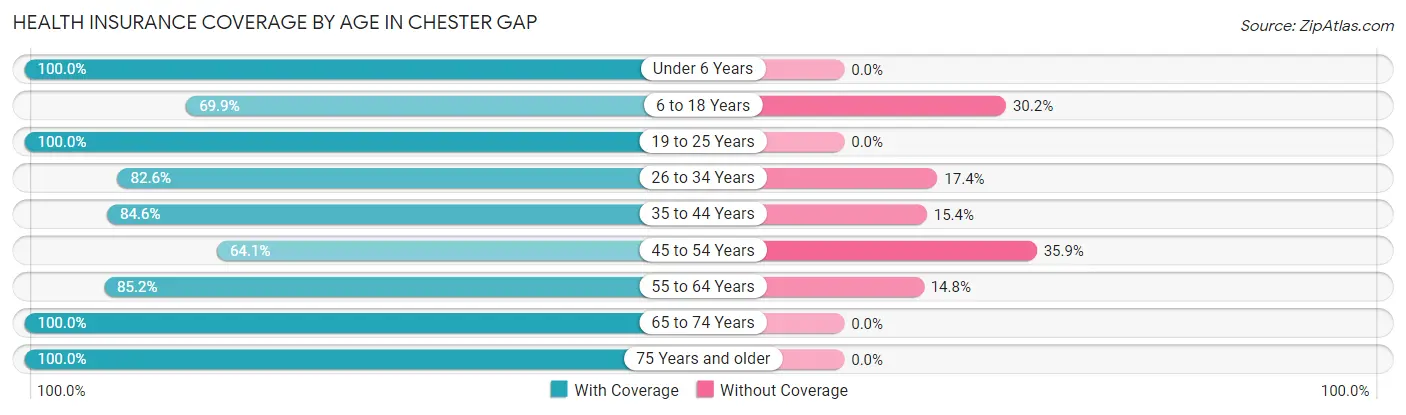
| Age Bracket | With Coverage | Without Coverage |
| Under 6 Years | 173 (100.0%) | 0 (0.0%) |
| 6 to 18 Years | 95 (69.9%) | 41 (30.1%) |
| 19 to 25 Years | 131 (100.0%) | 0 (0.0%) |
| 26 to 34 Years | 100 (82.6%) | 21 (17.4%) |
| 35 to 44 Years | 198 (84.6%) | 36 (15.4%) |
| 45 to 54 Years | 84 (64.1%) | 47 (35.9%) |
| 55 to 64 Years | 23 (85.2%) | 4 (14.8%) |
| 65 to 74 Years | 34 (100.0%) | 0 (0.0%) |
| 75 Years and older | 82 (100.0%) | 0 (0.0%) |
| Total | 920 (86.1%) | 149 (13.9%) |
Health Insurance Coverage by Citizenship Status in Chester Gap
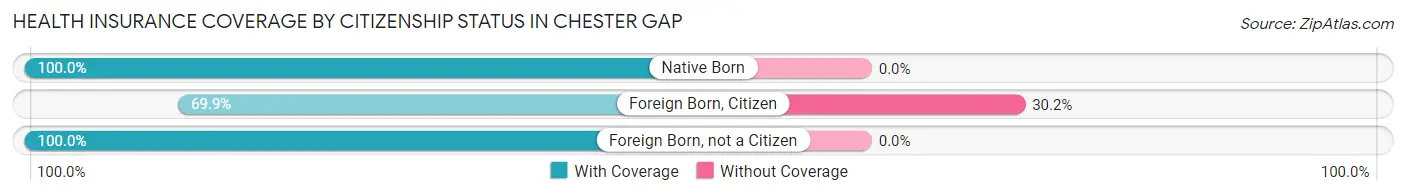
| Citizenship Status | With Coverage | Without Coverage |
| Native Born | 173 (100.0%) | 0 (0.0%) |
| Foreign Born, Citizen | 95 (69.9%) | 41 (30.1%) |
| Foreign Born, not a Citizen | 131 (100.0%) | 0 (0.0%) |
Health Insurance Coverage by Household Income in Chester Gap
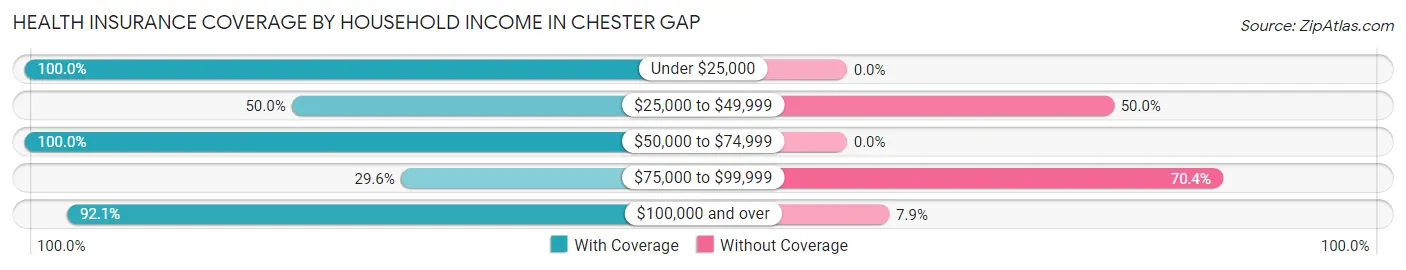
| Household Income | With Coverage | Without Coverage |
| Under $25,000 | 42 (100.0%) | 0 (0.0%) |
| $25,000 to $49,999 | 13 (50.0%) | 13 (50.0%) |
| $50,000 to $74,999 | 193 (100.0%) | 0 (0.0%) |
| $75,000 to $99,999 | 34 (29.6%) | 81 (70.4%) |
| $100,000 and over | 638 (92.1%) | 55 (7.9%) |
Public vs Private Health Insurance Coverage by Age in Chester Gap
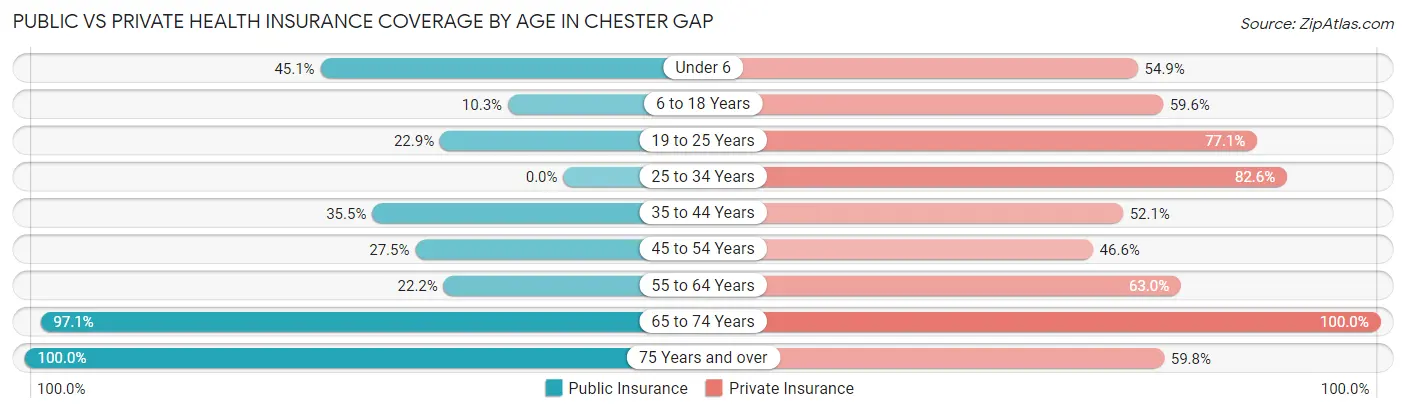
| Age Bracket | Public Insurance | Private Insurance |
| Under 6 | 78 (45.1%) | 95 (54.9%) |
| 6 to 18 Years | 14 (10.3%) | 81 (59.6%) |
| 19 to 25 Years | 30 (22.9%) | 101 (77.1%) |
| 25 to 34 Years | 0 (0.0%) | 100 (82.6%) |
| 35 to 44 Years | 83 (35.5%) | 122 (52.1%) |
| 45 to 54 Years | 36 (27.5%) | 61 (46.6%) |
| 55 to 64 Years | 6 (22.2%) | 17 (63.0%) |
| 65 to 74 Years | 33 (97.1%) | 34 (100.0%) |
| 75 Years and over | 82 (100.0%) | 49 (59.8%) |
| Total | 362 (33.9%) | 660 (61.7%) |
Disability Status by Sex by Age in Chester Gap
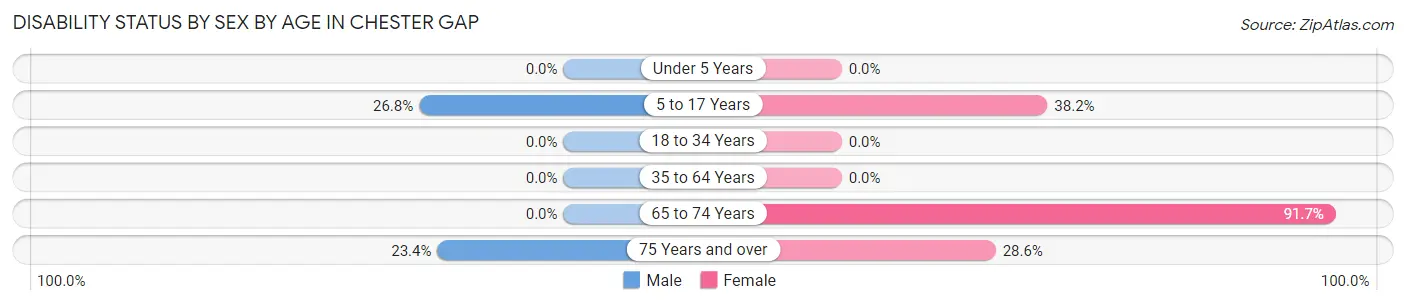
| Age Bracket | Male | Female |
| Under 5 Years | 0 (0.0%) | 0 (0.0%) |
| 5 to 17 Years | 30 (26.8%) | 29 (38.2%) |
| 18 to 34 Years | 0 (0.0%) | 0 (0.0%) |
| 35 to 64 Years | 0 (0.0%) | 0 (0.0%) |
| 65 to 74 Years | 0 (0.0%) | 11 (91.7%) |
| 75 Years and over | 11 (23.4%) | 10 (28.6%) |
Disability Class by Sex by Age in Chester Gap
Disability Class: Hearing Difficulty
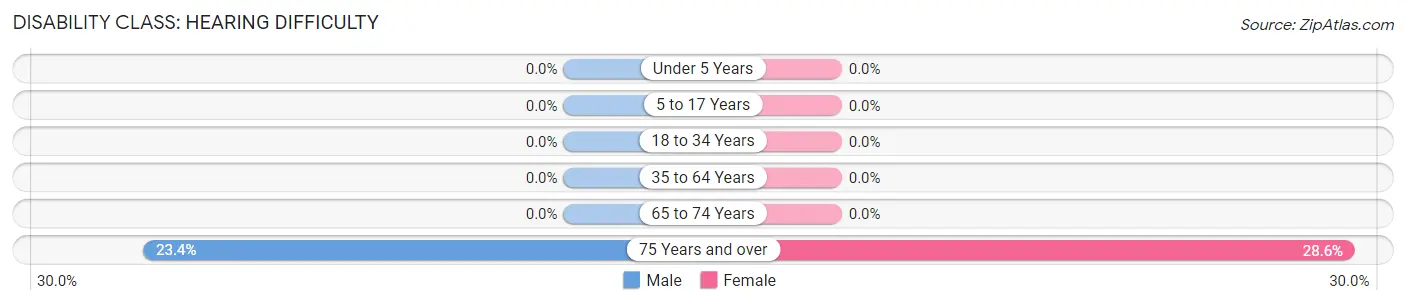
| Age Bracket | Male | Female |
| Under 5 Years | 0 (0.0%) | 0 (0.0%) |
| 5 to 17 Years | 0 (0.0%) | 0 (0.0%) |
| 18 to 34 Years | 0 (0.0%) | 0 (0.0%) |
| 35 to 64 Years | 0 (0.0%) | 0 (0.0%) |
| 65 to 74 Years | 0 (0.0%) | 0 (0.0%) |
| 75 Years and over | 11 (23.4%) | 10 (28.6%) |
Disability Class: Vision Difficulty
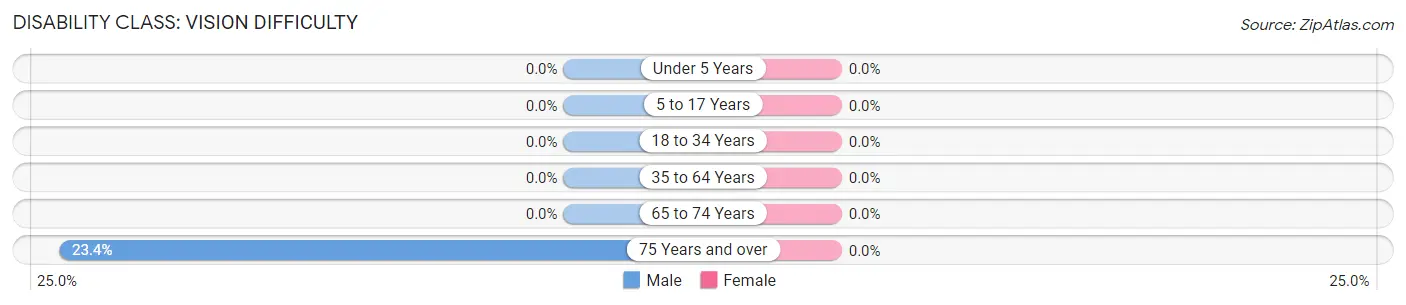
| Age Bracket | Male | Female |
| Under 5 Years | 0 (0.0%) | 0 (0.0%) |
| 5 to 17 Years | 0 (0.0%) | 0 (0.0%) |
| 18 to 34 Years | 0 (0.0%) | 0 (0.0%) |
| 35 to 64 Years | 0 (0.0%) | 0 (0.0%) |
| 65 to 74 Years | 0 (0.0%) | 0 (0.0%) |
| 75 Years and over | 11 (23.4%) | 0 (0.0%) |
Disability Class: Cognitive Difficulty
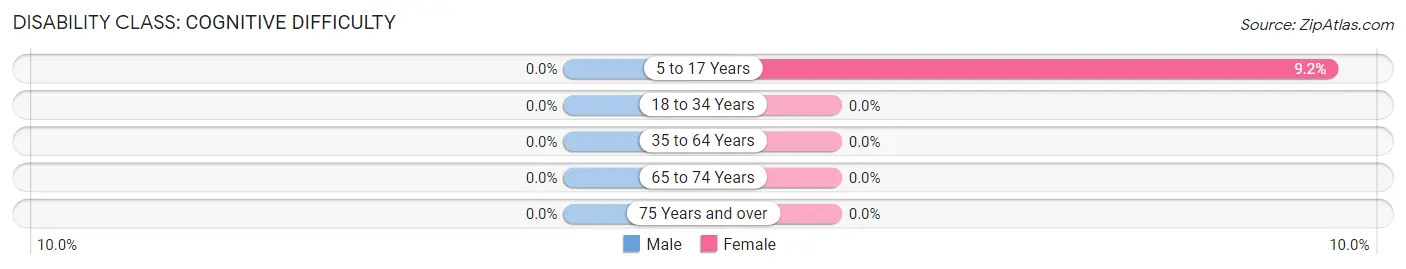
| Age Bracket | Male | Female |
| 5 to 17 Years | 0 (0.0%) | 7 (9.2%) |
| 18 to 34 Years | 0 (0.0%) | 0 (0.0%) |
| 35 to 64 Years | 0 (0.0%) | 0 (0.0%) |
| 65 to 74 Years | 0 (0.0%) | 0 (0.0%) |
| 75 Years and over | 0 (0.0%) | 0 (0.0%) |
Disability Class: Ambulatory Difficulty
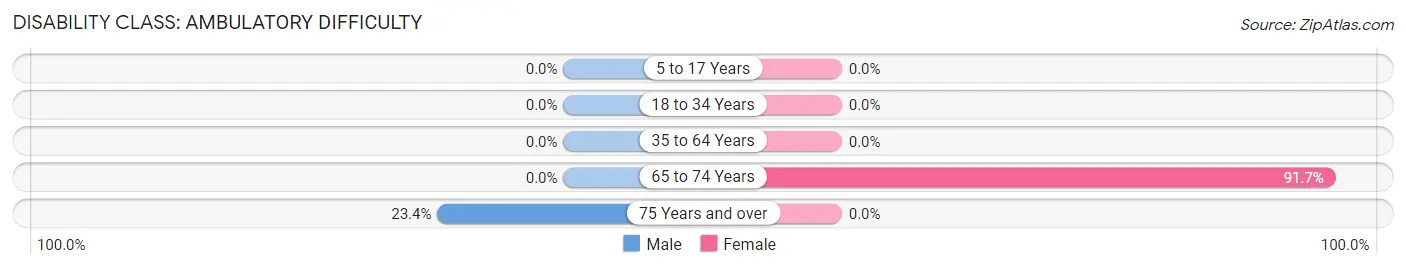
| Age Bracket | Male | Female |
| 5 to 17 Years | 0 (0.0%) | 0 (0.0%) |
| 18 to 34 Years | 0 (0.0%) | 0 (0.0%) |
| 35 to 64 Years | 0 (0.0%) | 0 (0.0%) |
| 65 to 74 Years | 0 (0.0%) | 11 (91.7%) |
| 75 Years and over | 11 (23.4%) | 0 (0.0%) |
Disability Class: Self-Care Difficulty
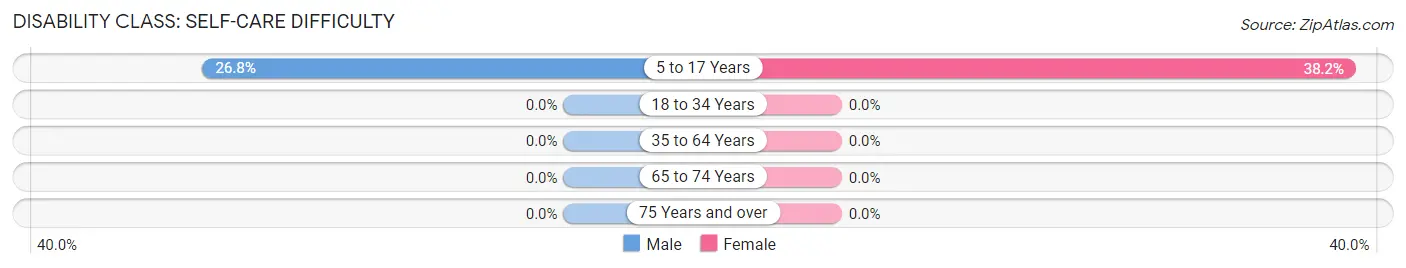
| Age Bracket | Male | Female |
| 5 to 17 Years | 30 (26.8%) | 29 (38.2%) |
| 18 to 34 Years | 0 (0.0%) | 0 (0.0%) |
| 35 to 64 Years | 0 (0.0%) | 0 (0.0%) |
| 65 to 74 Years | 0 (0.0%) | 0 (0.0%) |
| 75 Years and over | 0 (0.0%) | 0 (0.0%) |
Technology Access in Chester Gap
Computing Device Access in Chester Gap
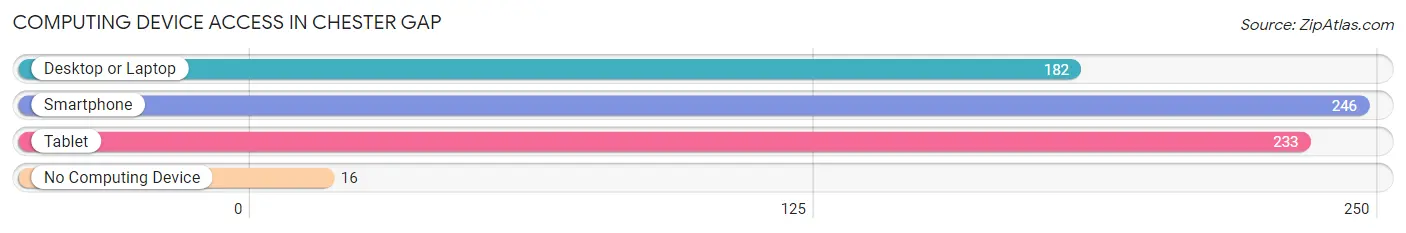
| Device Type | # Households | % Households |
| Desktop or Laptop | 182 | 61.7% |
| Smartphone | 246 | 83.4% |
| Tablet | 233 | 79.0% |
| No Computing Device | 16 | 5.4% |
| Total | 295 | 100.0% |
Internet Access in Chester Gap
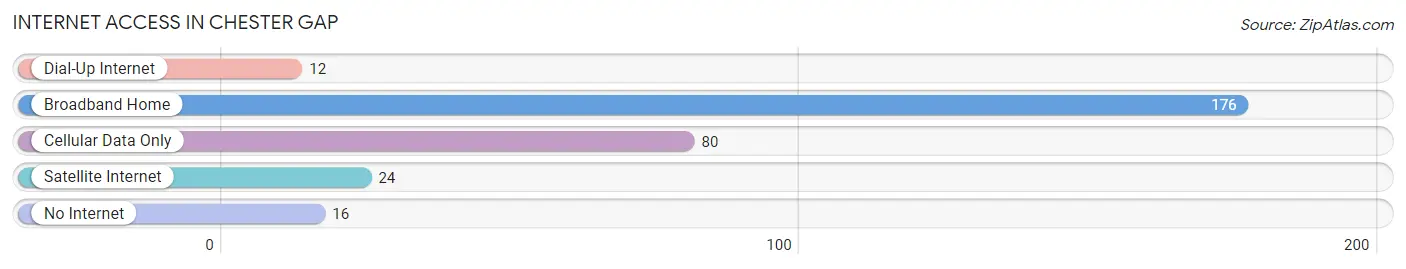
| Internet Type | # Households | % Households |
| Dial-Up Internet | 12 | 4.1% |
| Broadband Home | 176 | 59.7% |
| Cellular Data Only | 80 | 27.1% |
| Satellite Internet | 24 | 8.1% |
| No Internet | 16 | 5.4% |
| Total | 295 | 100.0% |
Chester Gap Summary
Chester Gap is a small unincorporated community located in Rappahannock County, Virginia. It is situated in the foothills of the Blue Ridge Mountains, approximately 50 miles west of Washington, D.C. The community is located along the banks of the Thornton River, a tributary of the Rappahannock River.
History
Chester Gap was first settled in the late 1700s by a group of German immigrants. The community was named after the nearby Chester Gap, a mountain pass that was used by Native Americans and early settlers to travel between the Shenandoah Valley and the Piedmont region of Virginia.
In the early 1800s, the community was home to a number of small farms and businesses. The area was also known for its iron ore deposits, which were mined and used to produce tools and weapons.
In the late 1800s, the community began to decline as the iron ore deposits were depleted and the local economy shifted away from agriculture. By the early 1900s, the population had dwindled to just a few dozen people.
Geography
Chester Gap is located in the foothills of the Blue Ridge Mountains, approximately 50 miles west of Washington, D.C. The community is situated along the banks of the Thornton River, a tributary of the Rappahannock River.
The area is characterized by rolling hills and valleys, with elevations ranging from 500 to 1,000 feet above sea level. The climate is temperate, with hot summers and cold winters.
Economy
The economy of Chester Gap is largely based on agriculture and tourism. The area is home to several small farms, which produce a variety of crops, including corn, soybeans, wheat, and hay.
The community is also a popular destination for outdoor recreation, such as fishing, hunting, and hiking. The nearby Shenandoah National Park and George Washington National Forest offer a variety of recreational activities, including camping, horseback riding, and mountain biking.
Demographics
As of the 2010 census, the population of Chester Gap was 545. The racial makeup of the community was 97.3% White, 0.7% African American, 0.2% Native American, 0.2% Asian, and 1.6% from other races.
The median household income in Chester Gap was $45,000, and the median family income was $50,000. The per capita income was $20,000. Approximately 8.5% of the population was below the poverty line.
Conclusion
Chester Gap is a small unincorporated community located in Rappahannock County, Virginia. It is situated in the foothills of the Blue Ridge Mountains, approximately 50 miles west of Washington, D.C. The community was first settled in the late 1700s by a group of German immigrants and was named after the nearby Chester Gap, a mountain pass that was used by Native Americans and early settlers to travel between the Shenandoah Valley and the Piedmont region of Virginia. The economy of Chester Gap is largely based on agriculture and tourism, and the area is home to several small farms and is a popular destination for outdoor recreation. As of the 2010 census, the population of Chester Gap was 545. The racial makeup of the community was 97.3% White, 0.7% African American, 0.2% Native American, 0.2% Asian, and 1.6% from other races. The median household income in Chester Gap was $45,000, and the median family income was $50,000.
Common Questions
What is Per Capita Income in Chester Gap?
Per Capita income in Chester Gap is $32,834.
What is the Median Family Income in Chester Gap?
Median Family Income in Chester Gap is $80,536.
What is the Median Household income in Chester Gap?
Median Household Income in Chester Gap is $100,729.
What is Income or Wage Gap in Chester Gap?
Income or Wage Gap in Chester Gap is 4.7%.
Women in Chester Gap earn 95.3 cents for every dollar earned by a man.
What is Inequality or Gini Index in Chester Gap?
Inequality or Gini Index in Chester Gap is 0.29.
What is the Total Population of Chester Gap?
Total Population of Chester Gap is 1,069.
What is the Total Male Population of Chester Gap?
Total Male Population of Chester Gap is 533.
What is the Total Female Population of Chester Gap?
Total Female Population of Chester Gap is 536.
What is the Ratio of Males per 100 Females in Chester Gap?
There are 99.44 Males per 100 Females in Chester Gap.
What is the Ratio of Females per 100 Males in Chester Gap?
There are 100.56 Females per 100 Males in Chester Gap.
What is the Median Population Age in Chester Gap?
Median Population Age in Chester Gap is 31.6 Years.
What is the Average Family Size in Chester Gap
Average Family Size in Chester Gap is 4.0 People.
What is the Average Household Size in Chester Gap
Average Household Size in Chester Gap is 3.6 People.
How Large is the Labor Force in Chester Gap?
There are 526 People in the Labor Forcein in Chester Gap.
What is the Percentage of People in the Labor Force in Chester Gap?
65.5% of People are in the Labor Force in Chester Gap.
What is the Unemployment Rate in Chester Gap?
Unemployment Rate in Chester Gap is 3.2%.