Phenix, VA Map & Demographics
Phenix Map
Phenix Overview
$24,812
PER CAPITA INCOME
$93,750
AVG FAMILY INCOME
$69,375
AVG HOUSEHOLD INCOME
29.3%
WAGE / INCOME GAP [ % ]
70.7¢/ $1
WAGE / INCOME GAP [ $ ]
0.44
INEQUALITY / GINI INDEX
437
TOTAL POPULATION
254
MALE POPULATION
183
FEMALE POPULATION
138.80
MALES / 100 FEMALES
72.05
FEMALES / 100 MALES
50.5
MEDIAN AGE
3.6
AVG FAMILY SIZE
3.3
AVG HOUSEHOLD SIZE
158
LABOR FORCE [ PEOPLE ]
47.0%
PERCENT IN LABOR FORCE
4.4%
UNEMPLOYMENT RATE
Phenix Zip Codes
Phenix Area Codes
Income in Phenix
Income Overview in Phenix
Per Capita Income in Phenix is $24,812, while median incomes of families and households are $93,750 and $69,375 respectively.
| Characteristic | Number | Measure |
| Per Capita Income | 437 | $24,812 |
| Median Family Income | 86 | $93,750 |
| Mean Family Income | 86 | $112,294 |
| Median Household Income | 131 | $69,375 |
| Mean Household Income | 131 | $83,898 |
| Income Deficit | 86 | $0 |
| Wage / Income Gap (%) | 437 | 29.27% |
| Wage / Income Gap ($) | 437 | 70.73¢ per $1 |
| Gini / Inequality Index | 437 | 0.44 |
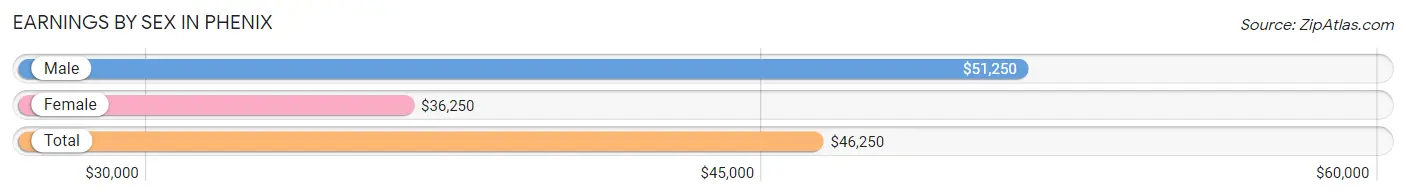
Earnings by Sex in Phenix
Average Earnings in Phenix are $46,250, $51,250 for men and $36,250 for women, a difference of 29.3%.
| Sex | Number | Average Earnings |
| Male | 92 (57.5%) | $51,250 |
| Female | 68 (42.5%) | $36,250 |
| Total | 160 (100.0%) | $46,250 |
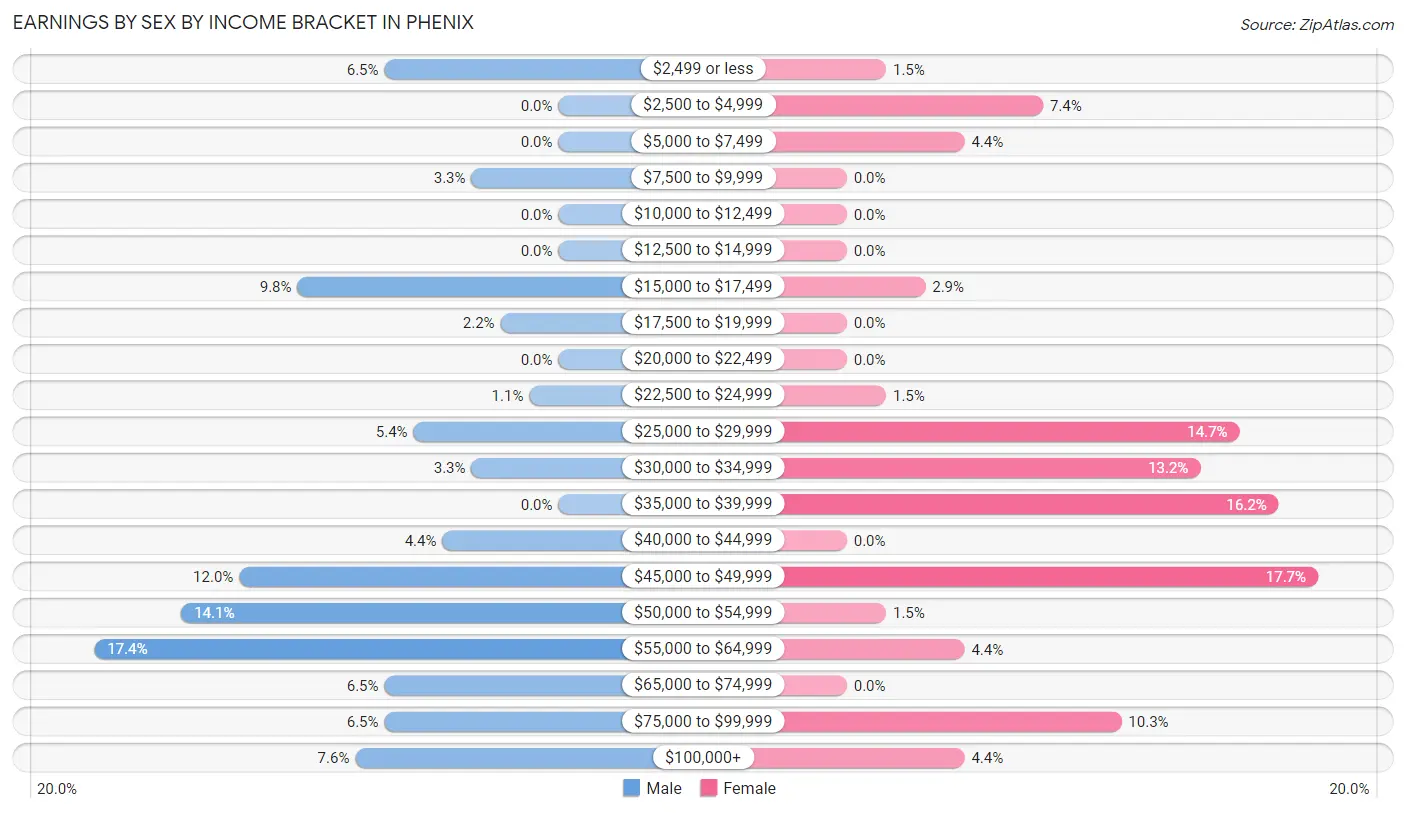
Earnings by Sex by Income Bracket in Phenix
The most common earnings brackets in Phenix are $55,000 to $64,999 for men (16 | 17.4%) and $45,000 to $49,999 for women (12 | 17.6%).
| Income | Male | Female |
| $2,499 or less | 6 (6.5%) | 1 (1.5%) |
| $2,500 to $4,999 | 0 (0.0%) | 5 (7.3%) |
| $5,000 to $7,499 | 0 (0.0%) | 3 (4.4%) |
| $7,500 to $9,999 | 3 (3.3%) | 0 (0.0%) |
| $10,000 to $12,499 | 0 (0.0%) | 0 (0.0%) |
| $12,500 to $14,999 | 0 (0.0%) | 0 (0.0%) |
| $15,000 to $17,499 | 9 (9.8%) | 2 (2.9%) |
| $17,500 to $19,999 | 2 (2.2%) | 0 (0.0%) |
| $20,000 to $22,499 | 0 (0.0%) | 0 (0.0%) |
| $22,500 to $24,999 | 1 (1.1%) | 1 (1.5%) |
| $25,000 to $29,999 | 5 (5.4%) | 10 (14.7%) |
| $30,000 to $34,999 | 3 (3.3%) | 9 (13.2%) |
| $35,000 to $39,999 | 0 (0.0%) | 11 (16.2%) |
| $40,000 to $44,999 | 4 (4.3%) | 0 (0.0%) |
| $45,000 to $49,999 | 11 (12.0%) | 12 (17.6%) |
| $50,000 to $54,999 | 13 (14.1%) | 1 (1.5%) |
| $55,000 to $64,999 | 16 (17.4%) | 3 (4.4%) |
| $65,000 to $74,999 | 6 (6.5%) | 0 (0.0%) |
| $75,000 to $99,999 | 6 (6.5%) | 7 (10.3%) |
| $100,000+ | 7 (7.6%) | 3 (4.4%) |
| Total | 92 (100.0%) | 68 (100.0%) |
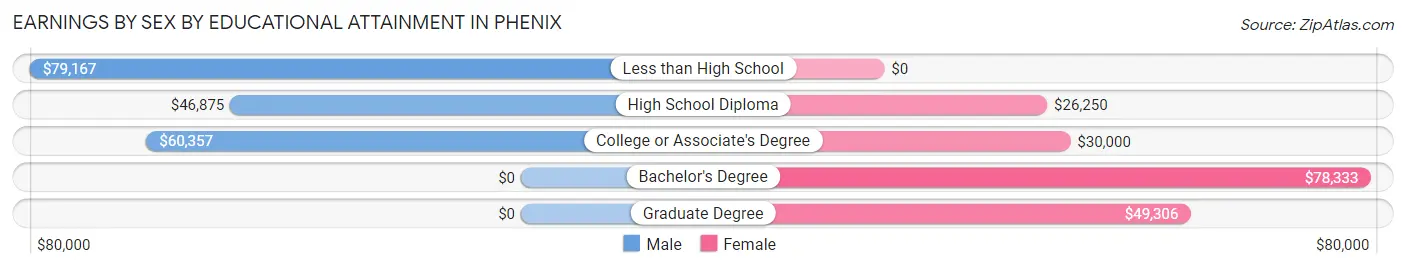
Earnings by Sex by Educational Attainment in Phenix
Average earnings in Phenix are $54,444 for men and $36,250 for women, a difference of 33.4%. Men with an educational attainment of less than high school enjoy the highest average annual earnings of $79,167, while those with high school diploma education earn the least with $46,875. Women with an educational attainment of bachelor's degree earn the most with the average annual earnings of $78,333, while those with high school diploma education have the smallest earnings of $26,250.
| Educational Attainment | Male Income | Female Income |
| Less than High School | $79,167 | $0 |
| High School Diploma | $46,875 | $26,250 |
| College or Associate's Degree | $60,357 | $30,000 |
| Bachelor's Degree | - | - |
| Graduate Degree | - | - |
| Total | $54,444 | $36,250 |
Family Income in Phenix
Family Income Brackets in Phenix
According to the Phenix family income data, there are 33 families falling into the $75,000 to $99,999 income range, which is the most common income bracket and makes up 38.4% of all families.
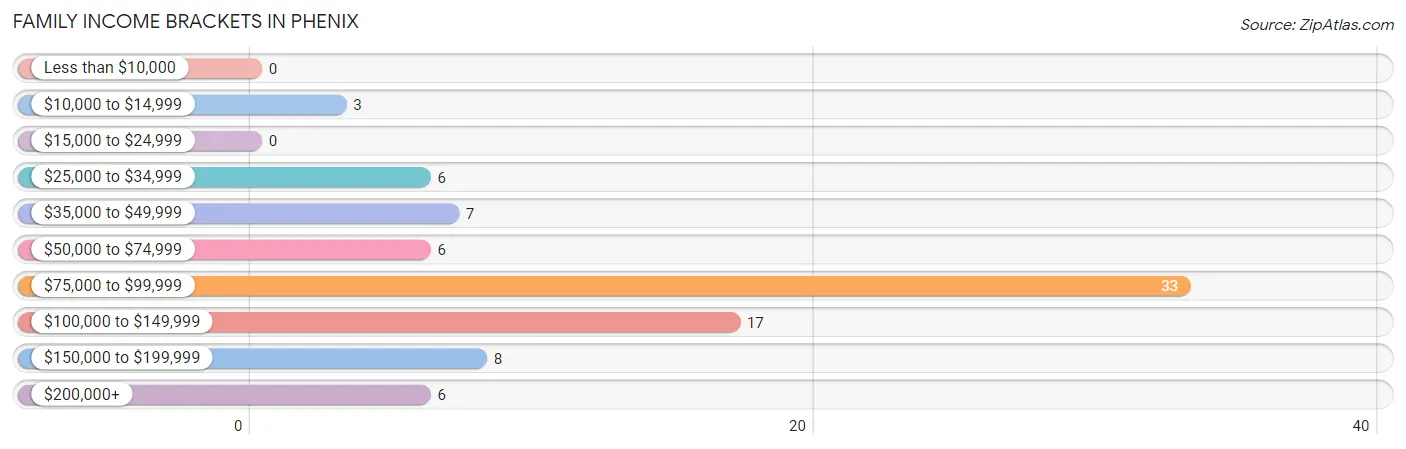
| Income Bracket | # Families | % Families |
| Less than $10,000 | 0 | 0.0% |
| $10,000 to $14,999 | 3 | 3.5% |
| $15,000 to $24,999 | 0 | 0.0% |
| $25,000 to $34,999 | 6 | 7.0% |
| $35,000 to $49,999 | 7 | 8.1% |
| $50,000 to $74,999 | 6 | 7.0% |
| $75,000 to $99,999 | 33 | 38.4% |
| $100,000 to $149,999 | 17 | 19.8% |
| $150,000 to $199,999 | 8 | 9.3% |
| $200,000+ | 6 | 7.0% |
Family Income by Famaliy Size in Phenix
4-person families (20 | 23.3%) account for the highest median family income in Phenix with $190,500 per family, while 4-person families (20 | 23.3%) have the highest median income of $47,625 per family member.
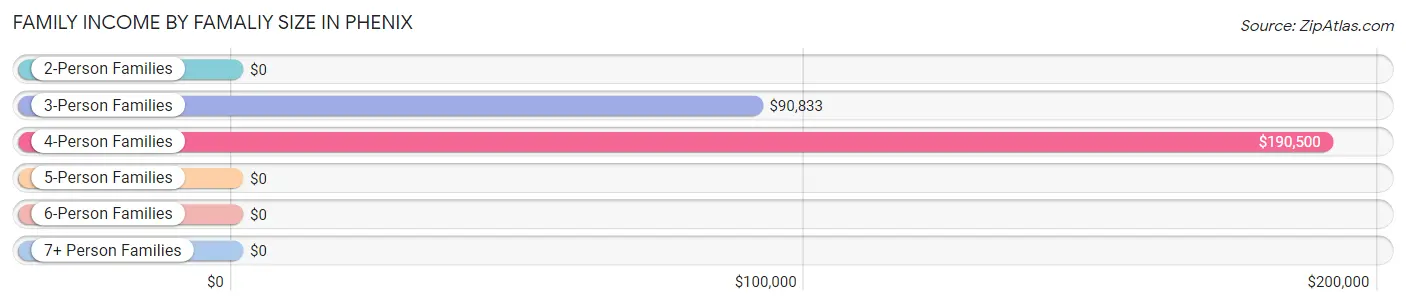
| Income Bracket | # Families | Median Income |
| 2-Person Families | 34 (39.5%) | $0 |
| 3-Person Families | 26 (30.2%) | $90,833 |
| 4-Person Families | 20 (23.3%) | $190,500 |
| 5-Person Families | 6 (7.0%) | $0 |
| 6-Person Families | 0 (0.0%) | $0 |
| 7+ Person Families | 0 (0.0%) | $0 |
| Total | 86 (100.0%) | $93,750 |
Family Income by Number of Earners in Phenix
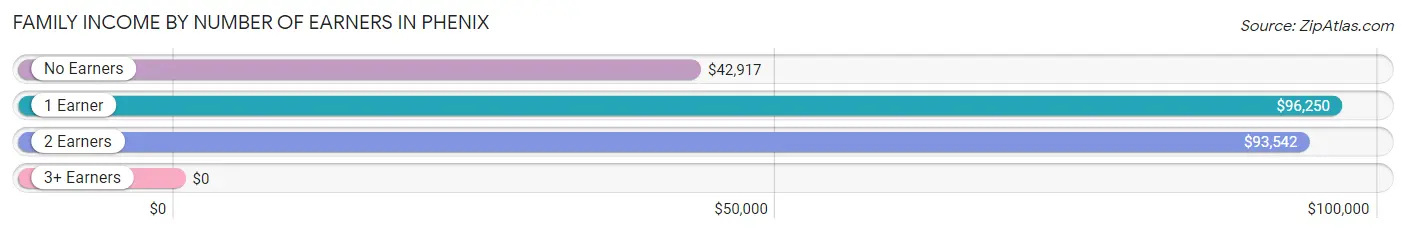
| Number of Earners | # Families | Median Income |
| No Earners | 11 (12.8%) | $42,917 |
| 1 Earner | 15 (17.4%) | $96,250 |
| 2 Earners | 53 (61.6%) | $93,542 |
| 3+ Earners | 7 (8.1%) | $0 |
| Total | 86 (100.0%) | $93,750 |
Household Income in Phenix
Household Income Brackets in Phenix
With 33 households falling in the category, the $75,000 to $99,999 income range is the most frequent in Phenix, accounting for 25.2% of all households. In contrast, only 3 households (2.3%) fall into the less than $10,000 income bracket, making it the least populous group.
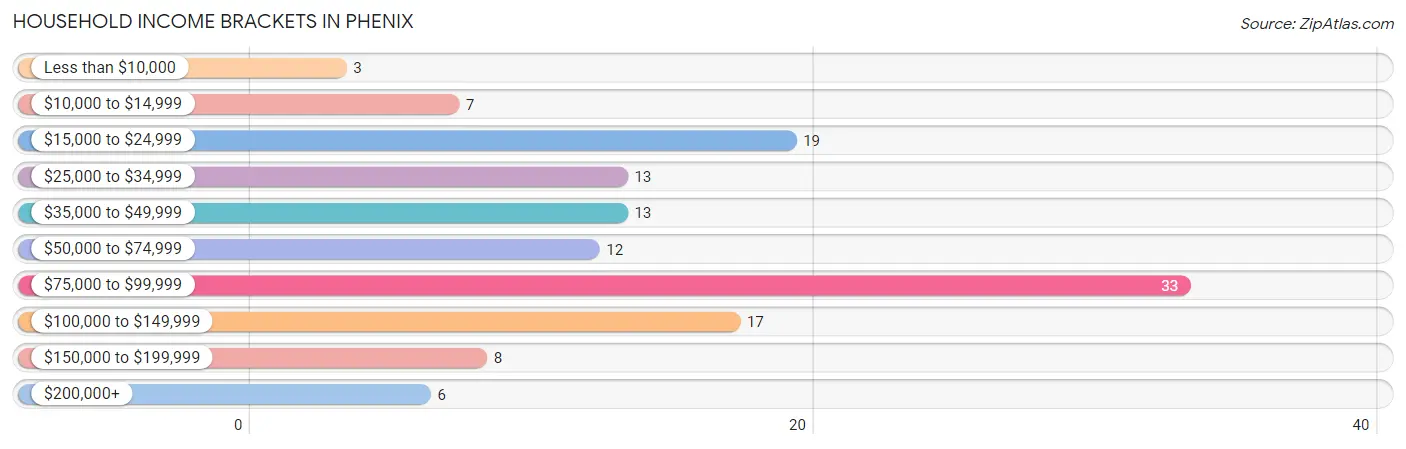
| Income Bracket | # Households | % Households |
| Less than $10,000 | 3 | 2.3% |
| $10,000 to $14,999 | 7 | 5.3% |
| $15,000 to $24,999 | 19 | 14.5% |
| $25,000 to $34,999 | 13 | 9.9% |
| $35,000 to $49,999 | 13 | 9.9% |
| $50,000 to $74,999 | 12 | 9.2% |
| $75,000 to $99,999 | 33 | 25.2% |
| $100,000 to $149,999 | 17 | 13.0% |
| $150,000 to $199,999 | 8 | 6.1% |
| $200,000+ | 6 | 4.6% |
Household Income by Householder Age in Phenix
The median household income in Phenix is $69,375, with the highest median household income of $95,833 found in the 45 to 64 years age bracket for the primary householder. A total of 40 households (30.5%) fall into this category.
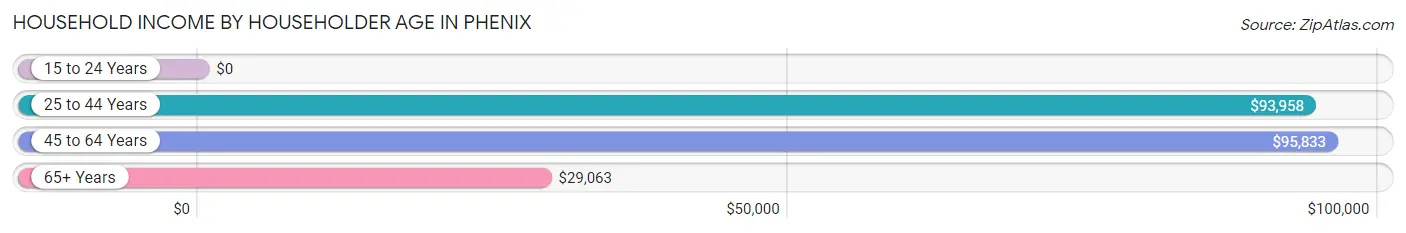
| Income Bracket | # Households | Median Income |
| 15 to 24 Years | 0 (0.0%) | $0 |
| 25 to 44 Years | 39 (29.8%) | $93,958 |
| 45 to 64 Years | 40 (30.5%) | $95,833 |
| 65+ Years | 52 (39.7%) | $29,063 |
| Total | 131 (100.0%) | $69,375 |
Poverty in Phenix
Income Below Poverty by Sex and Age in Phenix
With 32.3% poverty level for males and 10.9% for females among the residents of Phenix, 65 to 74 year old males and 65 to 74 year old females are the most vulnerable to poverty, with 80 males (80.8%) and 13 females (52.0%) in their respective age groups living below the poverty level.
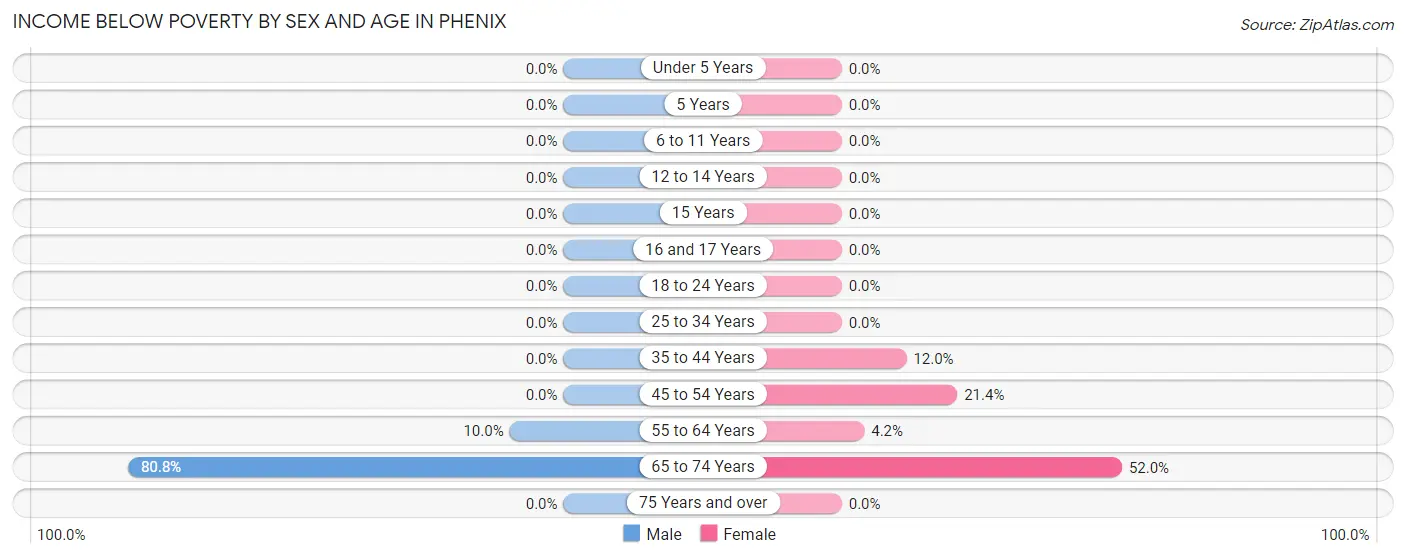
| Age Bracket | Male | Female |
| Under 5 Years | 0 (0.0%) | 0 (0.0%) |
| 5 Years | 0 (0.0%) | 0 (0.0%) |
| 6 to 11 Years | 0 (0.0%) | 0 (0.0%) |
| 12 to 14 Years | 0 (0.0%) | 0 (0.0%) |
| 15 Years | 0 (0.0%) | 0 (0.0%) |
| 16 and 17 Years | 0 (0.0%) | 0 (0.0%) |
| 18 to 24 Years | 0 (0.0%) | 0 (0.0%) |
| 25 to 34 Years | 0 (0.0%) | 0 (0.0%) |
| 35 to 44 Years | 0 (0.0%) | 3 (12.0%) |
| 45 to 54 Years | 0 (0.0%) | 3 (21.4%) |
| 55 to 64 Years | 2 (10.0%) | 1 (4.2%) |
| 65 to 74 Years | 80 (80.8%) | 13 (52.0%) |
| 75 Years and over | 0 (0.0%) | 0 (0.0%) |
| Total | 82 (32.3%) | 20 (10.9%) |
Income Above Poverty by Sex and Age in Phenix
According to the poverty statistics in Phenix, males aged under 5 years and females aged under 5 years are the age groups that are most secure financially, with 100.0% of males and 100.0% of females in these age groups living above the poverty line.
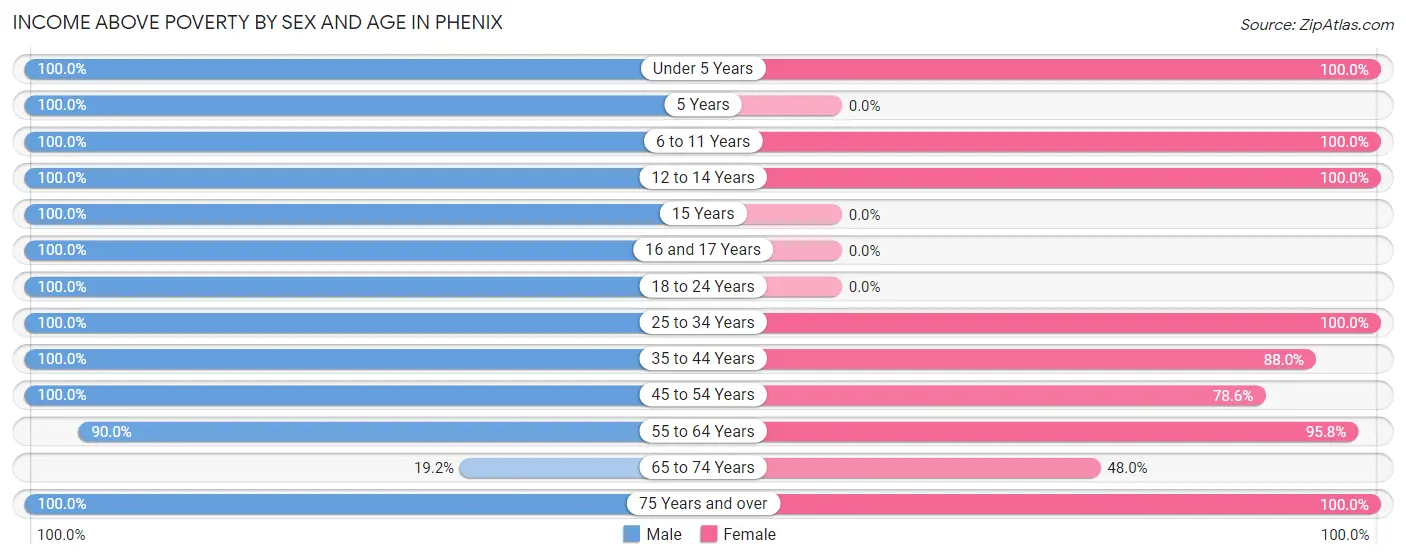
| Age Bracket | Male | Female |
| Under 5 Years | 24 (100.0%) | 10 (100.0%) |
| 5 Years | 1 (100.0%) | 0 (0.0%) |
| 6 to 11 Years | 18 (100.0%) | 27 (100.0%) |
| 12 to 14 Years | 3 (100.0%) | 15 (100.0%) |
| 15 Years | 3 (100.0%) | 0 (0.0%) |
| 16 and 17 Years | 13 (100.0%) | 0 (0.0%) |
| 18 to 24 Years | 19 (100.0%) | 0 (0.0%) |
| 25 to 34 Years | 10 (100.0%) | 15 (100.0%) |
| 35 to 44 Years | 29 (100.0%) | 22 (88.0%) |
| 45 to 54 Years | 14 (100.0%) | 11 (78.6%) |
| 55 to 64 Years | 18 (90.0%) | 23 (95.8%) |
| 65 to 74 Years | 19 (19.2%) | 12 (48.0%) |
| 75 Years and over | 1 (100.0%) | 28 (100.0%) |
| Total | 172 (67.7%) | 163 (89.1%) |
Income Below Poverty Among Married-Couple Families in Phenix
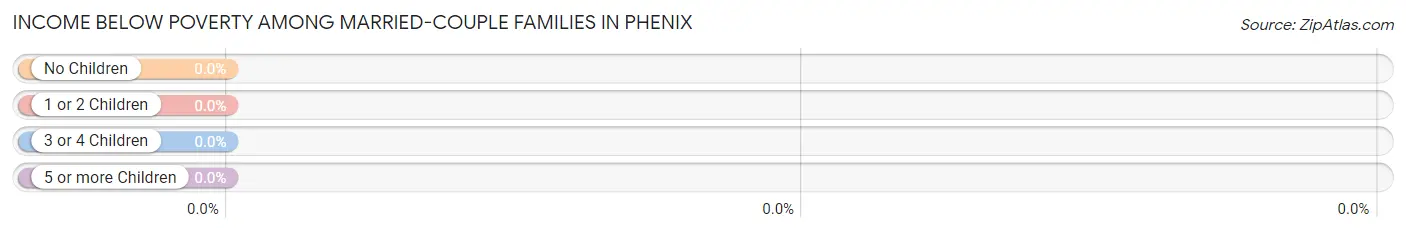
| Children | Above Poverty | Below Poverty |
| No Children | 37 (100.0%) | 0 (0.0%) |
| 1 or 2 Children | 33 (100.0%) | 0 (0.0%) |
| 3 or 4 Children | 6 (100.0%) | 0 (0.0%) |
| 5 or more Children | 0 (0.0%) | 0 (0.0%) |
| Total | 76 (100.0%) | 0 (0.0%) |
Income Below Poverty Among Single-Parent Households in Phenix
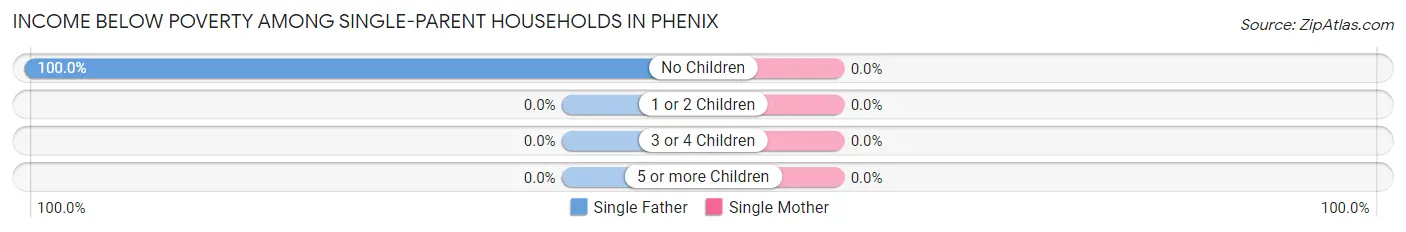
| Children | Single Father | Single Mother |
| No Children | 3 (100.0%) | 0 (0.0%) |
| 1 or 2 Children | 0 (0.0%) | 0 (0.0%) |
| 3 or 4 Children | 0 (0.0%) | 0 (0.0%) |
| 5 or more Children | 0 (0.0%) | 0 (0.0%) |
| Total | 3 (100.0%) | 0 (0.0%) |
Income Below Poverty Among Married-Couple vs Single-Parent Households in Phenix
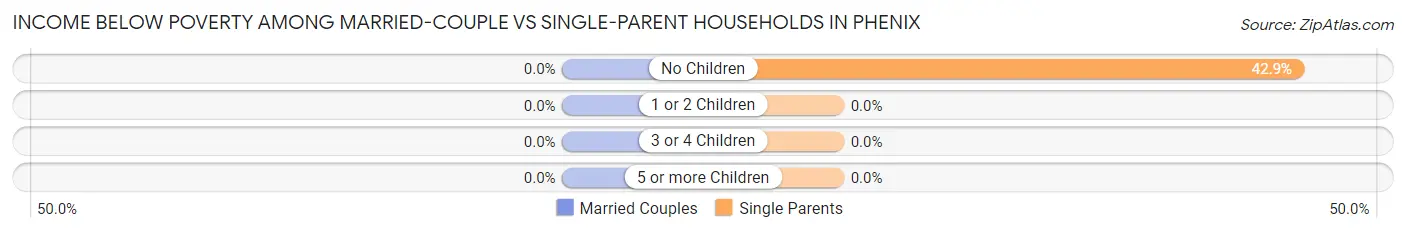
| Children | Married-Couple Families | Single-Parent Households |
| No Children | 0 (0.0%) | 3 (42.9%) |
| 1 or 2 Children | 0 (0.0%) | 0 (0.0%) |
| 3 or 4 Children | 0 (0.0%) | 0 (0.0%) |
| 5 or more Children | 0 (0.0%) | 0 (0.0%) |
| Total | 0 (0.0%) | 3 (30.0%) |
Race in Phenix
The most populous races in Phenix are White / Caucasian (302 | 69.1%), Black / African American (110 | 25.2%), and Two or more Races (25 | 5.7%).
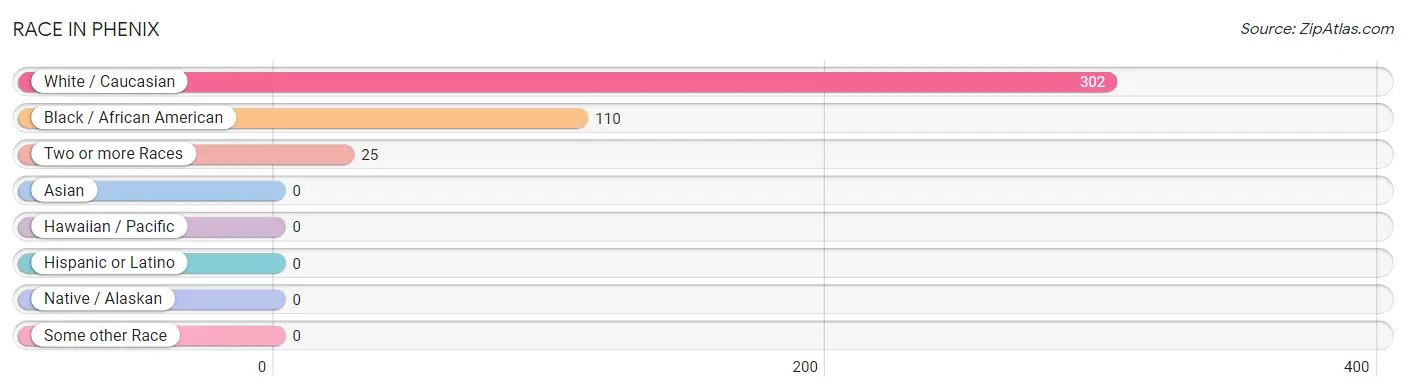
| Race | # Population | % Population |
| Asian | 0 | 0.0% |
| Black / African American | 110 | 25.2% |
| Hawaiian / Pacific | 0 | 0.0% |
| Hispanic or Latino | 0 | 0.0% |
| Native / Alaskan | 0 | 0.0% |
| White / Caucasian | 302 | 69.1% |
| Two or more Races | 25 | 5.7% |
| Some other Race | 0 | 0.0% |
| Total | 437 | 100.0% |
Ancestry in Phenix
The most populous ancestries reported in Phenix are English (95 | 21.7%), American (60 | 13.7%), Irish (26 | 5.9%), German (19 | 4.3%), and French (13 | 3.0%), together accounting for 48.7% of all Phenix residents.
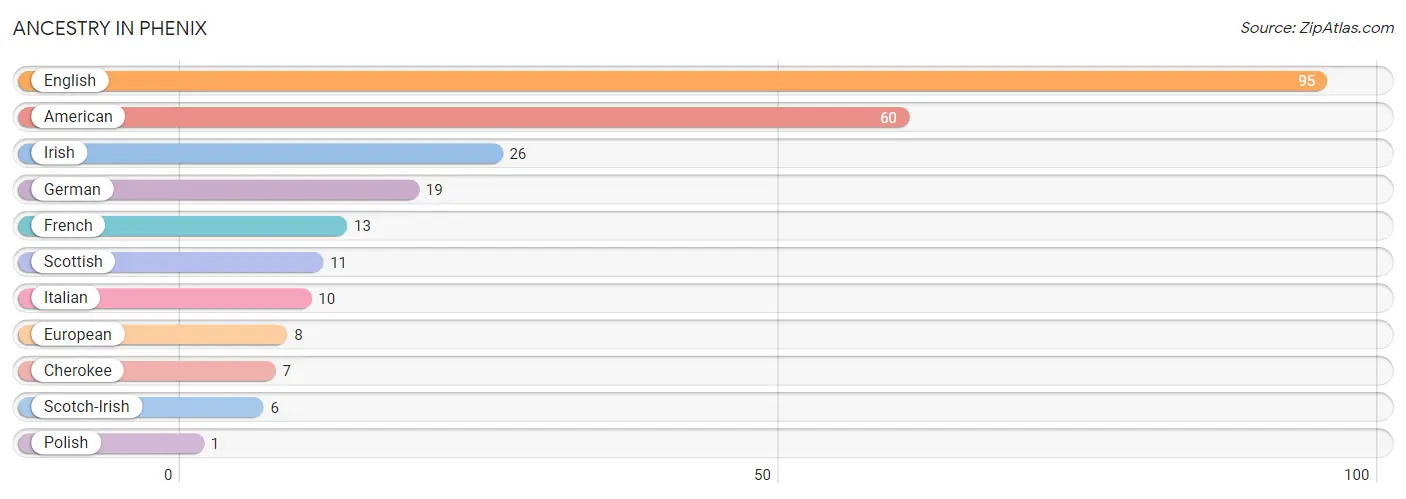
| Ancestry | # Population | % Population |
| American | 60 | 13.7% |
| Cherokee | 7 | 1.6% |
| English | 95 | 21.7% |
| European | 8 | 1.8% |
| French | 13 | 3.0% |
| German | 19 | 4.3% |
| Irish | 26 | 5.9% |
| Italian | 10 | 2.3% |
| Polish | 1 | 0.2% |
| Scotch-Irish | 6 | 1.4% |
| Scottish | 11 | 2.5% | View All 11 Rows |
Immigrants in Phenix

| Immigration Origin | # Population | % Population | View All 0 Rows |
Sex and Age in Phenix
Sex and Age in Phenix
The most populous age groups in Phenix are 65 to 69 Years (91 | 35.8%) for men and 5 to 9 Years (21 | 11.5%) for women.
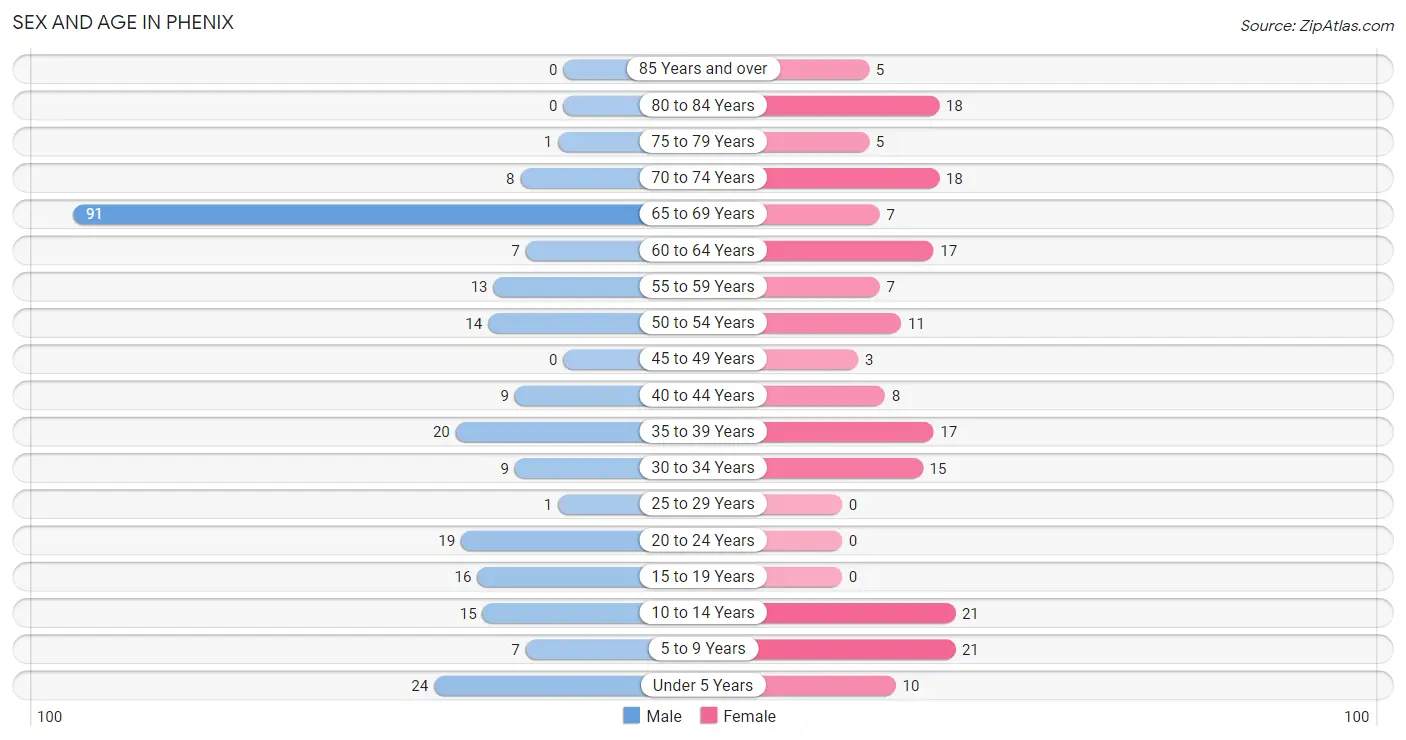
| Age Bracket | Male | Female |
| Under 5 Years | 24 (9.5%) | 10 (5.5%) |
| 5 to 9 Years | 7 (2.8%) | 21 (11.5%) |
| 10 to 14 Years | 15 (5.9%) | 21 (11.5%) |
| 15 to 19 Years | 16 (6.3%) | 0 (0.0%) |
| 20 to 24 Years | 19 (7.5%) | 0 (0.0%) |
| 25 to 29 Years | 1 (0.4%) | 0 (0.0%) |
| 30 to 34 Years | 9 (3.5%) | 15 (8.2%) |
| 35 to 39 Years | 20 (7.9%) | 17 (9.3%) |
| 40 to 44 Years | 9 (3.5%) | 8 (4.4%) |
| 45 to 49 Years | 0 (0.0%) | 3 (1.6%) |
| 50 to 54 Years | 14 (5.5%) | 11 (6.0%) |
| 55 to 59 Years | 13 (5.1%) | 7 (3.8%) |
| 60 to 64 Years | 7 (2.8%) | 17 (9.3%) |
| 65 to 69 Years | 91 (35.8%) | 7 (3.8%) |
| 70 to 74 Years | 8 (3.2%) | 18 (9.8%) |
| 75 to 79 Years | 1 (0.4%) | 5 (2.7%) |
| 80 to 84 Years | 0 (0.0%) | 18 (9.8%) |
| 85 Years and over | 0 (0.0%) | 5 (2.7%) |
| Total | 254 (100.0%) | 183 (100.0%) |
Families and Households in Phenix
Median Family Size in Phenix
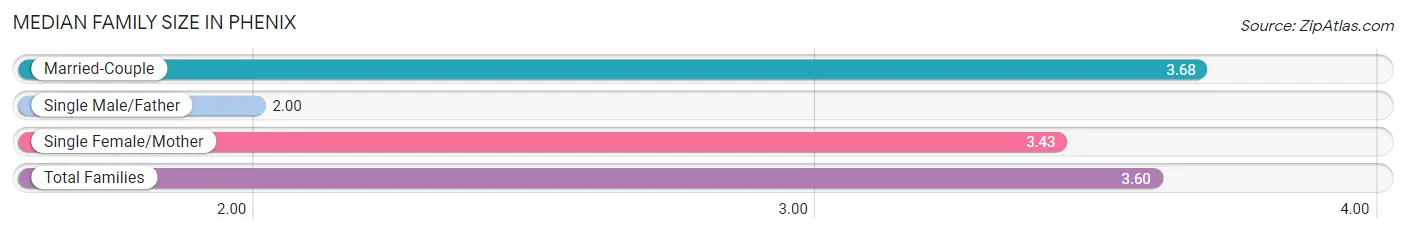
The median family size in Phenix is 3.60 persons per family, with married-couple families (76 | 88.4%) accounting for the largest median family size of 3.68 persons per family. On the other hand, single male/father families (3 | 3.5%) represent the smallest median family size with 2.00 persons per family.
| Family Type | # Families | Family Size |
| Married-Couple | 76 (88.4%) | 3.68 |
| Single Male/Father | 3 (3.5%) | 2.00 |
| Single Female/Mother | 7 (8.1%) | 3.43 |
| Total Families | 86 (100.0%) | 3.60 |
Median Household Size in Phenix
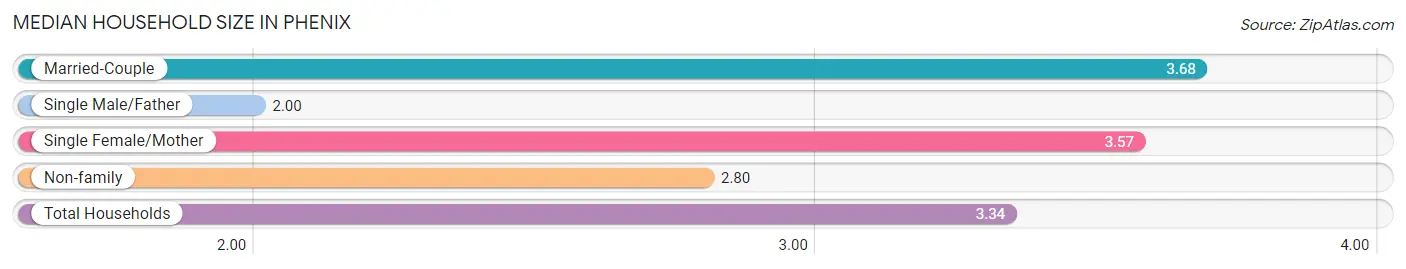
The median household size in Phenix is 3.34 persons per household, with married-couple households (76 | 58.0%) accounting for the largest median household size of 3.68 persons per household. single male/father households (3 | 2.3%) represent the smallest median household size with 2.00 persons per household.
| Household Type | # Households | Household Size |
| Married-Couple | 76 (58.0%) | 3.68 |
| Single Male/Father | 3 (2.3%) | 2.00 |
| Single Female/Mother | 7 (5.3%) | 3.57 |
| Non-family | 45 (34.4%) | 2.80 |
| Total Households | 131 (100.0%) | 3.34 |
Household Size by Marriage Status in Phenix
Out of a total of 131 households in Phenix, 86 (65.6%) are family households, while 45 (34.4%) are nonfamily households. The most numerous type of family households are 2-person households, comprising 34, and the most common type of nonfamily households are 1-person households, comprising 27.
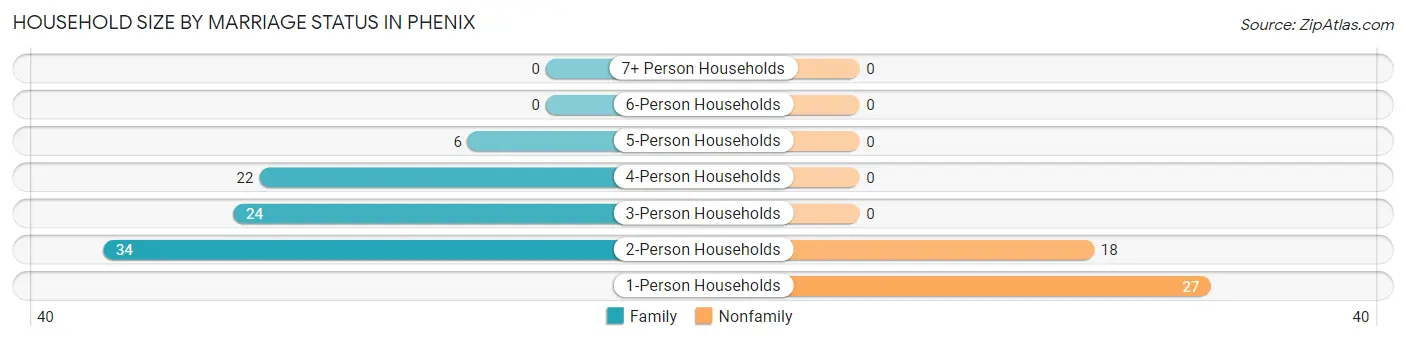
| Household Size | Family Households | Nonfamily Households |
| 1-Person Households | - | 27 (20.6%) |
| 2-Person Households | 34 (26.0%) | 18 (13.7%) |
| 3-Person Households | 24 (18.3%) | 0 (0.0%) |
| 4-Person Households | 22 (16.8%) | 0 (0.0%) |
| 5-Person Households | 6 (4.6%) | 0 (0.0%) |
| 6-Person Households | 0 (0.0%) | 0 (0.0%) |
| 7+ Person Households | 0 (0.0%) | 0 (0.0%) |
| Total | 86 (65.6%) | 45 (34.4%) |
Female Fertility in Phenix
Fertility by Age in Phenix
Average fertility rate in Phenix is 191.0 births per 1,000 women. Women in the age bracket of 20 to 34 years have the highest fertility rate with 333.0 births per 1,000 women. Women in the age bracket of 20 to 34 years acount for 55.6% of all women with births.
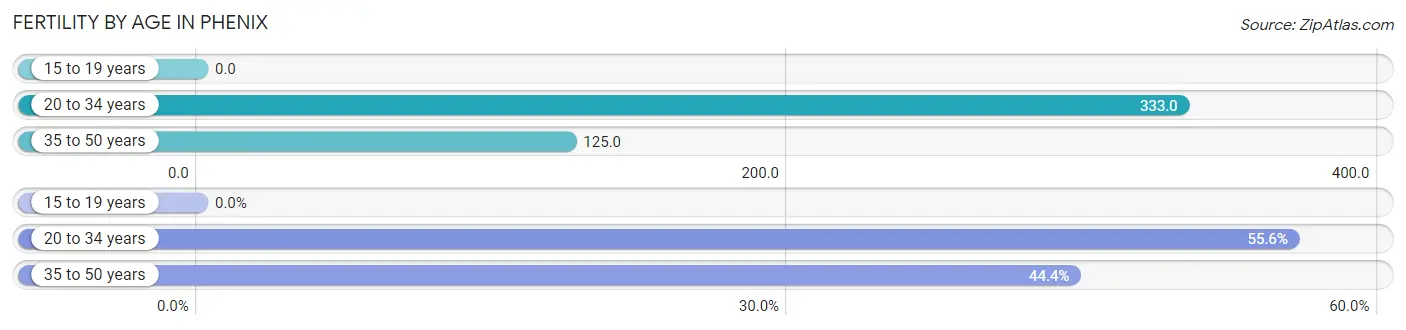
| Age Bracket | Women with Births | Births / 1,000 Women |
| 15 to 19 years | 0 (0.0%) | 0.0 |
| 20 to 34 years | 5 (55.6%) | 333.0 |
| 35 to 50 years | 4 (44.4%) | 125.0 |
| Total | 9 (100.0%) | 191.0 |
Fertility by Age by Marriage Status in Phenix
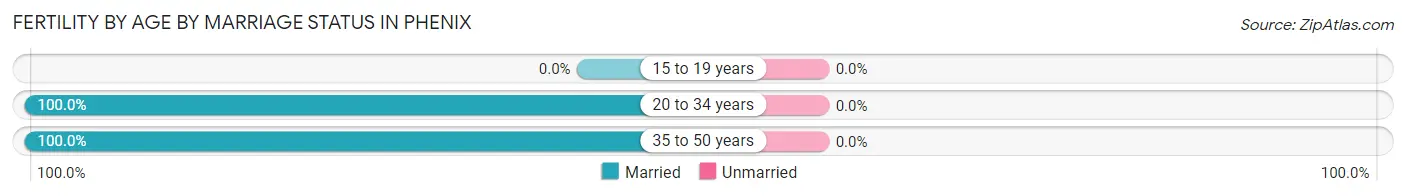
| Age Bracket | Married | Unmarried |
| 15 to 19 years | 0 (0.0%) | 0 (0.0%) |
| 20 to 34 years | 5 (100.0%) | 0 (0.0%) |
| 35 to 50 years | 4 (100.0%) | 0 (0.0%) |
| Total | 9 (100.0%) | 0 (0.0%) |
Fertility by Education in Phenix
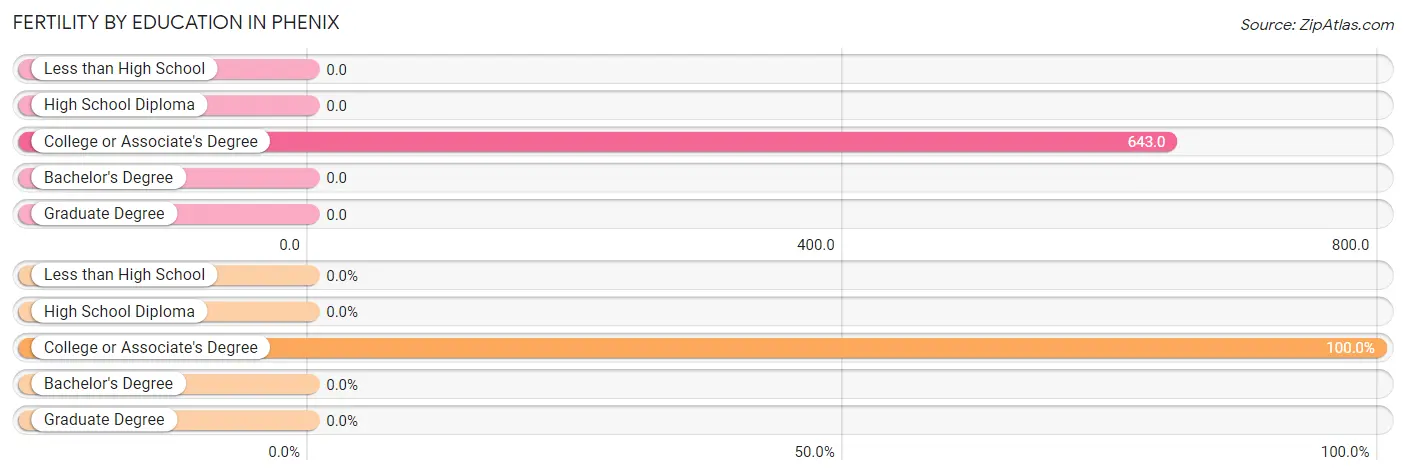
| Educational Attainment | Women with Births | Births / 1,000 Women |
| Less than High School | 0 (0.0%) | 0.0 |
| High School Diploma | 0 (0.0%) | 0.0 |
| College or Associate's Degree | 9 (100.0%) | 643.0 |
| Bachelor's Degree | 0 (0.0%) | 0.0 |
| Graduate Degree | 0 (0.0%) | 0.0 |
| Total | 9 (100.0%) | 191.0 |
Fertility by Education by Marriage Status in Phenix
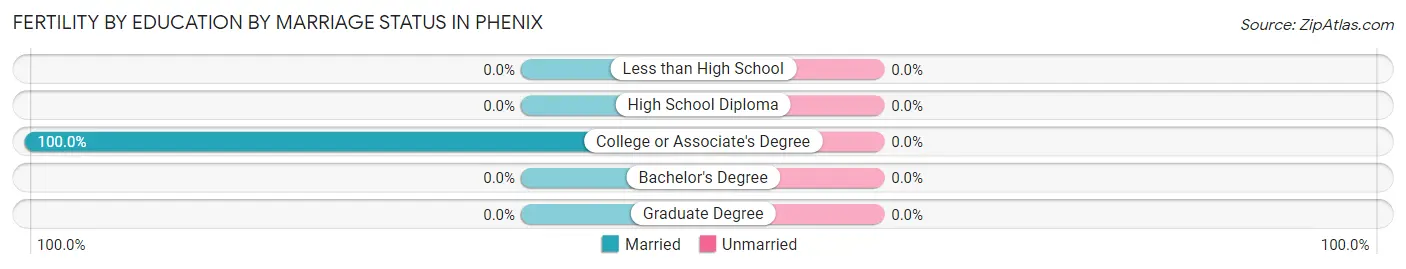
| Educational Attainment | Married | Unmarried |
| Less than High School | 0 (0.0%) | 0 (0.0%) |
| High School Diploma | 0 (0.0%) | 0 (0.0%) |
| College or Associate's Degree | 9 (100.0%) | 0 (0.0%) |
| Bachelor's Degree | 0 (0.0%) | 0 (0.0%) |
| Graduate Degree | 0 (0.0%) | 0 (0.0%) |
| Total | 9 (100.0%) | 0 (0.0%) |
Employment Characteristics in Phenix
Employment by Class of Employer in Phenix
Among the 149 employed individuals in Phenix, private company employees (86 | 57.7%), local government employees (23 | 15.4%), and self-employed (not incorporated) (13 | 8.7%) make up the most common classes of employment.
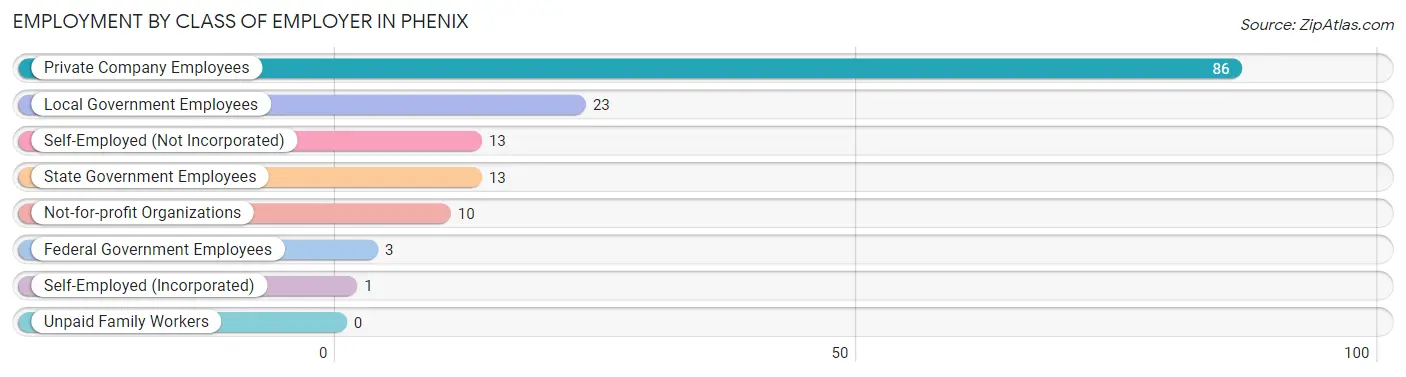
| Employer Class | # Employees | % Employees |
| Private Company Employees | 86 | 57.7% |
| Self-Employed (Incorporated) | 1 | 0.7% |
| Self-Employed (Not Incorporated) | 13 | 8.7% |
| Not-for-profit Organizations | 10 | 6.7% |
| Local Government Employees | 23 | 15.4% |
| State Government Employees | 13 | 8.7% |
| Federal Government Employees | 3 | 2.0% |
| Unpaid Family Workers | 0 | 0.0% |
| Total | 149 | 100.0% |
Employment Status by Age in Phenix
According to the labor force statistics for Phenix, out of the total population over 16 years of age (336), 47.0% or 158 individuals are in the labor force, with 4.4% or 7 of them unemployed. The age group with the highest labor force participation rate is 25 to 29 years, with 100.0% or 1 individuals in the labor force. Within the labor force, the 16 to 19 years age range has the highest percentage of unemployed individuals, with 100.0% or 7 of them being unemployed.
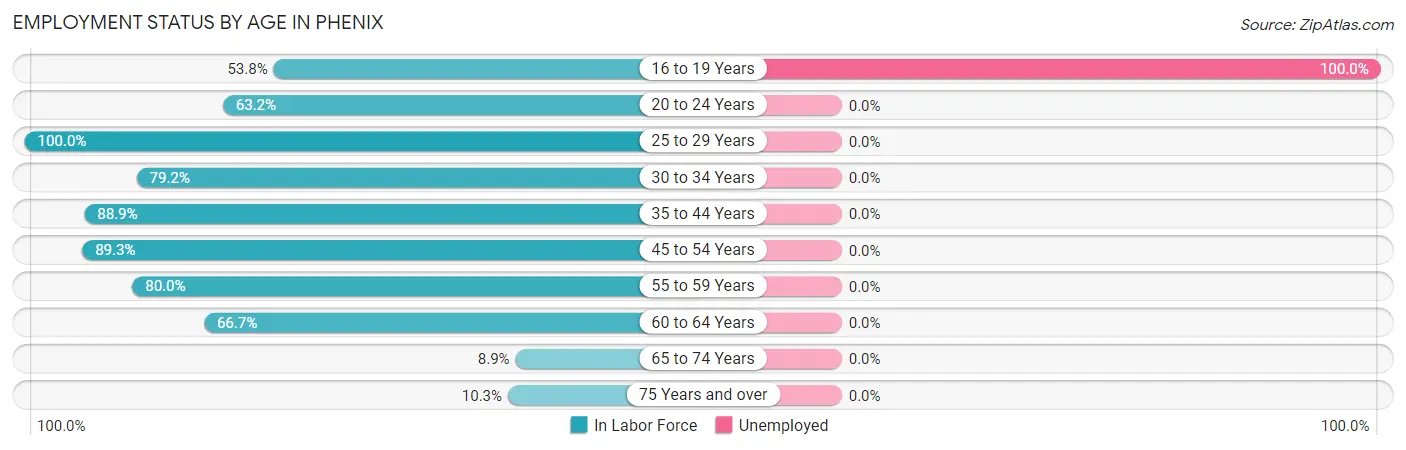
| Age Bracket | In Labor Force | Unemployed |
| 16 to 19 Years | 7 (53.8%) | 7 (100.0%) |
| 20 to 24 Years | 12 (63.2%) | 0 (0.0%) |
| 25 to 29 Years | 1 (100.0%) | 0 (0.0%) |
| 30 to 34 Years | 19 (79.2%) | 0 (0.0%) |
| 35 to 44 Years | 48 (88.9%) | 0 (0.0%) |
| 45 to 54 Years | 25 (89.3%) | 0 (0.0%) |
| 55 to 59 Years | 16 (80.0%) | 0 (0.0%) |
| 60 to 64 Years | 16 (66.7%) | 0 (0.0%) |
| 65 to 74 Years | 11 (8.9%) | 0 (0.0%) |
| 75 Years and over | 3 (10.3%) | 0 (0.0%) |
| Total | 158 (47.0%) | 7 (4.4%) |
Employment Status by Educational Attainment in Phenix
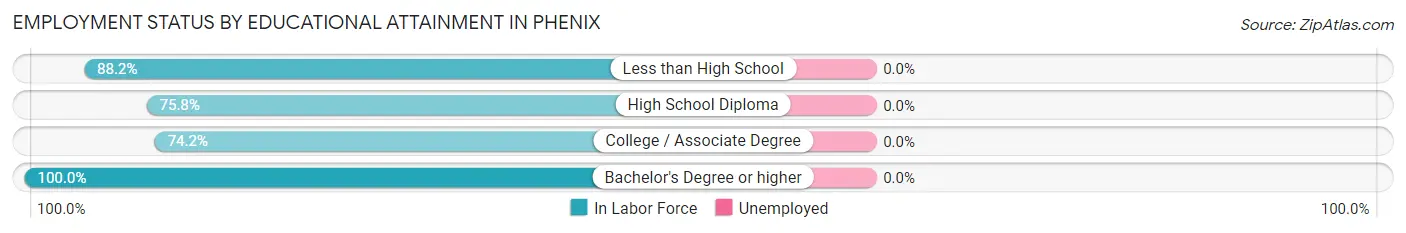
| Educational Attainment | In Labor Force | Unemployed |
| Less than High School | 15 (88.2%) | 0 (0.0%) |
| High School Diploma | 50 (75.8%) | 0 (0.0%) |
| College / Associate Degree | 23 (74.2%) | 0 (0.0%) |
| Bachelor's Degree or higher | 37 (100.0%) | 0 (0.0%) |
| Total | 125 (82.8%) | 0 (0.0%) |
Employment Occupations by Sex in Phenix
Management, Business, Science and Arts Occupations
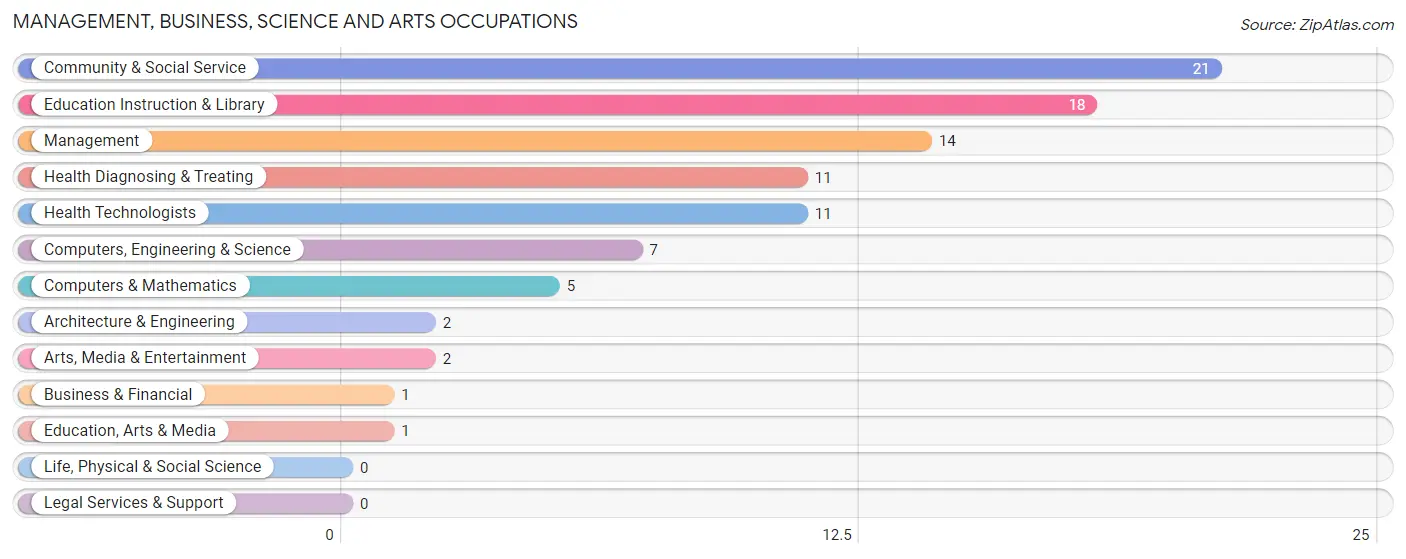
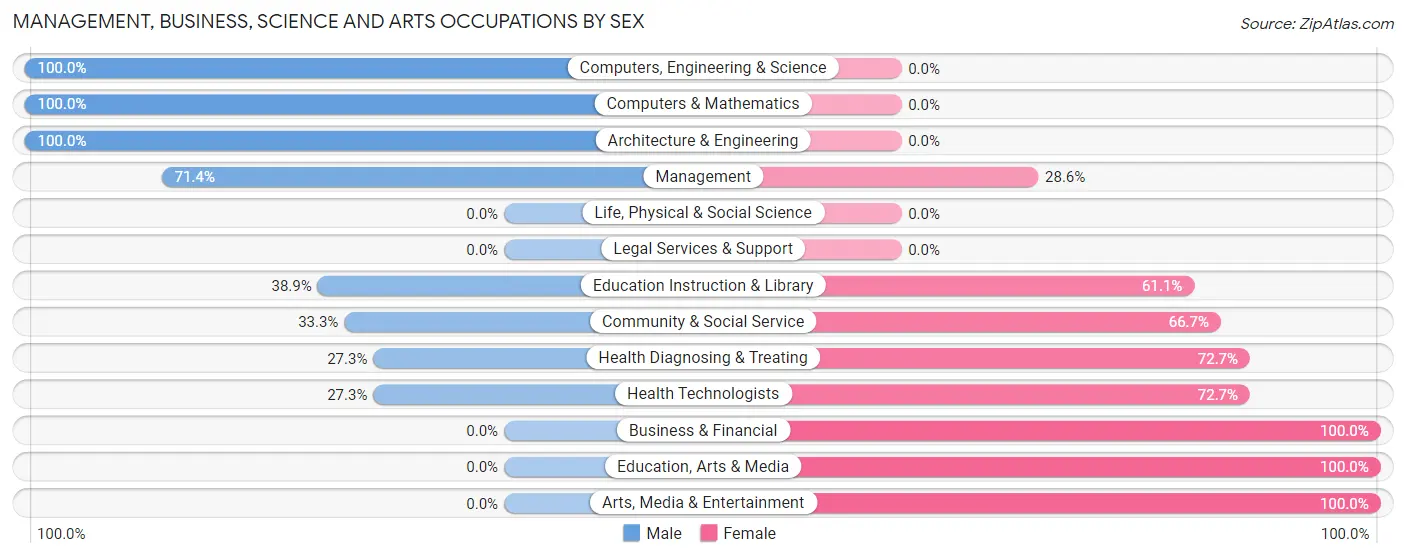
The most common Management, Business, Science and Arts occupations in Phenix are Community & Social Service (21 | 13.9%), Education Instruction & Library (18 | 11.9%), Management (14 | 9.3%), Health Diagnosing & Treating (11 | 7.3%), and Health Technologists (11 | 7.3%).
Management, Business, Science and Arts Occupations by Sex
Within the Management, Business, Science and Arts occupations in Phenix, the most male-oriented occupations are Computers, Engineering & Science (100.0%), Computers & Mathematics (100.0%), and Architecture & Engineering (100.0%), while the most female-oriented occupations are Business & Financial (100.0%), Education, Arts & Media (100.0%), and Arts, Media & Entertainment (100.0%).
| Occupation | Male | Female |
| Management | 10 (71.4%) | 4 (28.6%) |
| Business & Financial | 0 (0.0%) | 1 (100.0%) |
| Computers, Engineering & Science | 7 (100.0%) | 0 (0.0%) |
| Computers & Mathematics | 5 (100.0%) | 0 (0.0%) |
| Architecture & Engineering | 2 (100.0%) | 0 (0.0%) |
| Life, Physical & Social Science | 0 (0.0%) | 0 (0.0%) |
| Community & Social Service | 7 (33.3%) | 14 (66.7%) |
| Education, Arts & Media | 0 (0.0%) | 1 (100.0%) |
| Legal Services & Support | 0 (0.0%) | 0 (0.0%) |
| Education Instruction & Library | 7 (38.9%) | 11 (61.1%) |
| Arts, Media & Entertainment | 0 (0.0%) | 2 (100.0%) |
| Health Diagnosing & Treating | 3 (27.3%) | 8 (72.7%) |
| Health Technologists | 3 (27.3%) | 8 (72.7%) |
| Total (Category) | 27 (50.0%) | 27 (50.0%) |
| Total (Overall) | 86 (57.0%) | 65 (43.0%) |
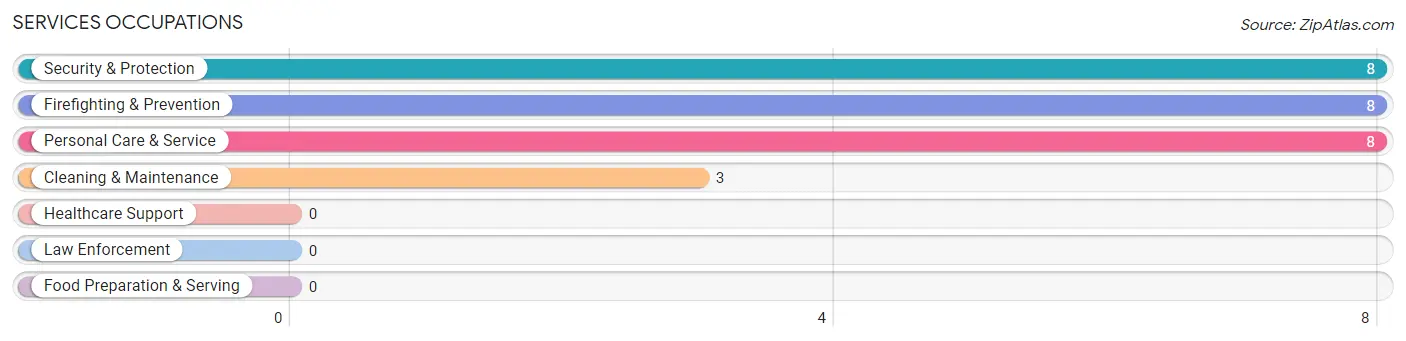
Services Occupations
The most common Services occupations in Phenix are Security & Protection (8 | 5.3%), Firefighting & Prevention (8 | 5.3%), Personal Care & Service (8 | 5.3%), and Cleaning & Maintenance (3 | 2.0%).
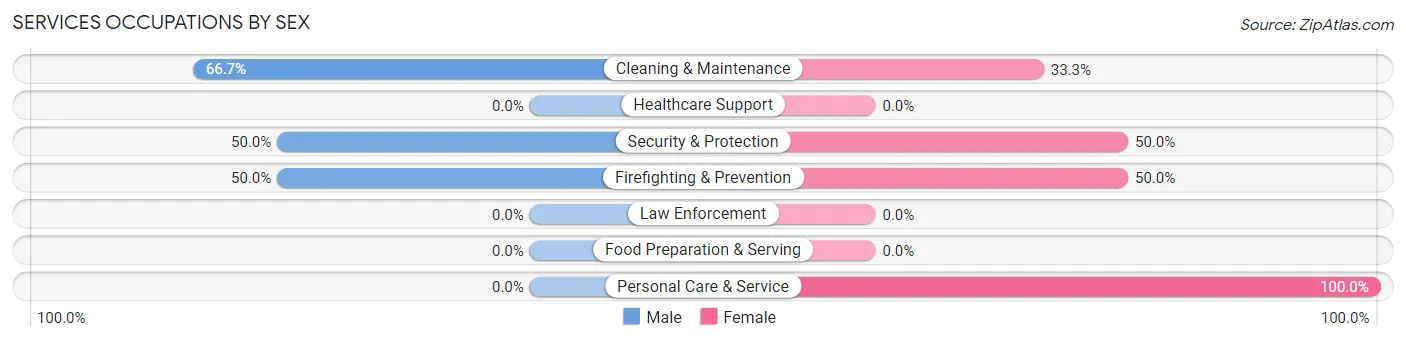
Services Occupations by Sex
Within the Services occupations in Phenix, the most male-oriented occupations are Cleaning & Maintenance (66.7%), Security & Protection (50.0%), and Firefighting & Prevention (50.0%), while the most female-oriented occupations are Personal Care & Service (100.0%), Security & Protection (50.0%), and Firefighting & Prevention (50.0%).
| Occupation | Male | Female |
| Healthcare Support | 0 (0.0%) | 0 (0.0%) |
| Security & Protection | 4 (50.0%) | 4 (50.0%) |
| Firefighting & Prevention | 4 (50.0%) | 4 (50.0%) |
| Law Enforcement | 0 (0.0%) | 0 (0.0%) |
| Food Preparation & Serving | 0 (0.0%) | 0 (0.0%) |
| Cleaning & Maintenance | 2 (66.7%) | 1 (33.3%) |
| Personal Care & Service | 0 (0.0%) | 8 (100.0%) |
| Total (Category) | 6 (31.6%) | 13 (68.4%) |
| Total (Overall) | 86 (57.0%) | 65 (43.0%) |
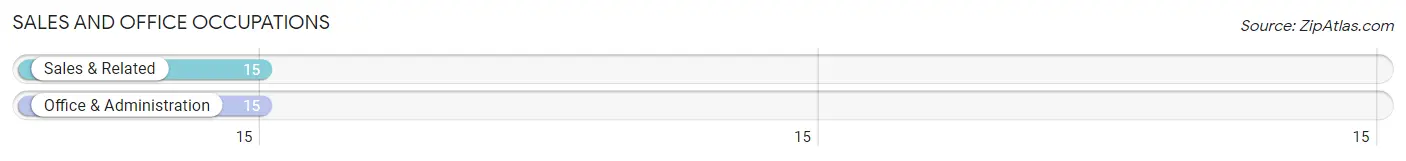
Sales and Office Occupations
The most common Sales and Office occupations in Phenix are Sales & Related (15 | 9.9%), and Office & Administration (15 | 9.9%).
Sales and Office Occupations by Sex
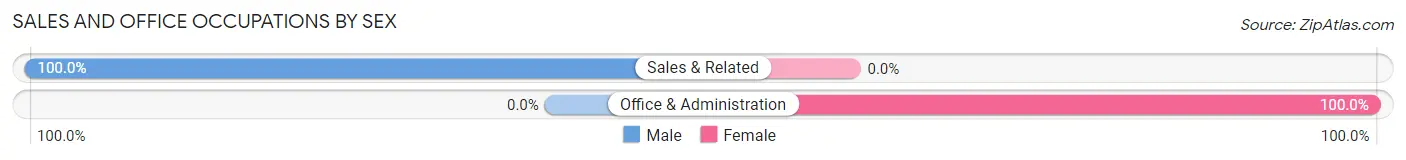
| Occupation | Male | Female |
| Sales & Related | 15 (100.0%) | 0 (0.0%) |
| Office & Administration | 0 (0.0%) | 15 (100.0%) |
| Total (Category) | 15 (50.0%) | 15 (50.0%) |
| Total (Overall) | 86 (57.0%) | 65 (43.0%) |
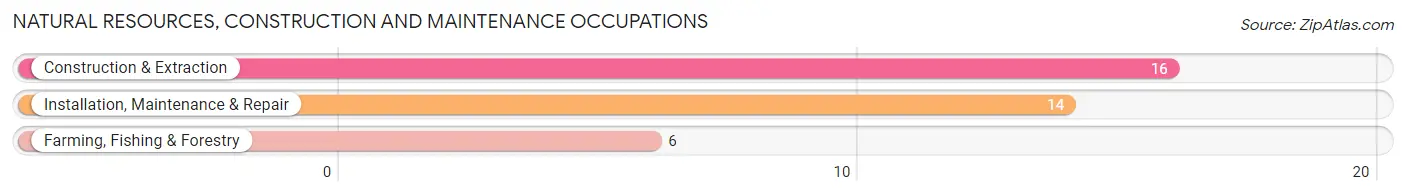
Natural Resources, Construction and Maintenance Occupations
The most common Natural Resources, Construction and Maintenance occupations in Phenix are Construction & Extraction (16 | 10.6%), Installation, Maintenance & Repair (14 | 9.3%), and Farming, Fishing & Forestry (6 | 4.0%).
Natural Resources, Construction and Maintenance Occupations by Sex
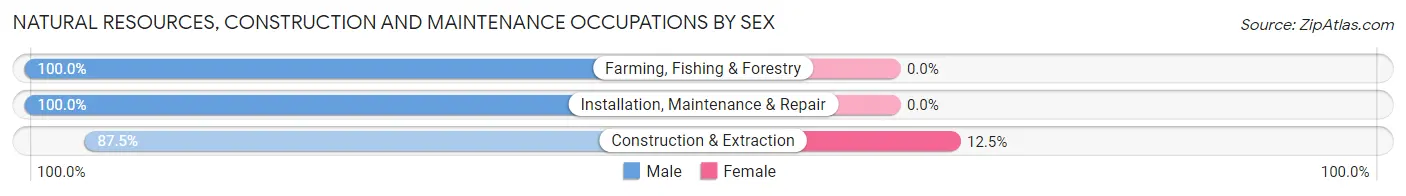
| Occupation | Male | Female |
| Farming, Fishing & Forestry | 6 (100.0%) | 0 (0.0%) |
| Construction & Extraction | 14 (87.5%) | 2 (12.5%) |
| Installation, Maintenance & Repair | 14 (100.0%) | 0 (0.0%) |
| Total (Category) | 34 (94.4%) | 2 (5.6%) |
| Total (Overall) | 86 (57.0%) | 65 (43.0%) |
Production, Transportation and Moving Occupations
The most common Production, Transportation and Moving occupations in Phenix are Transportation (7 | 4.6%), and Production (5 | 3.3%).
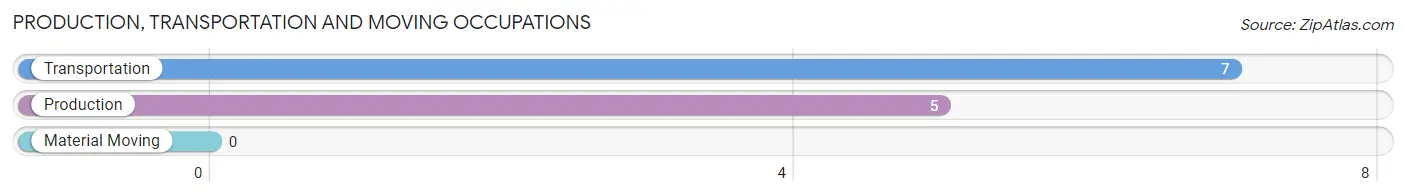
Production, Transportation and Moving Occupations by Sex
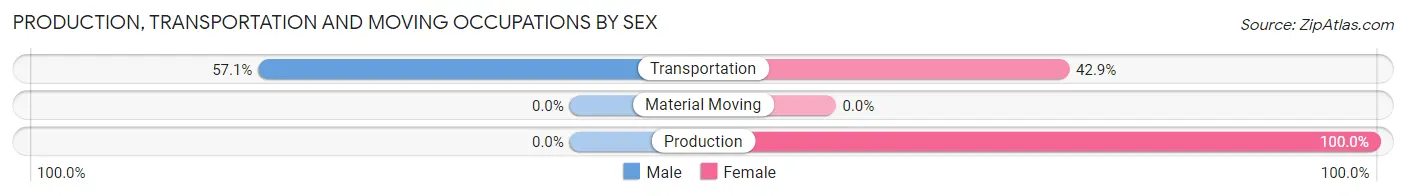
| Occupation | Male | Female |
| Production | 0 (0.0%) | 5 (100.0%) |
| Transportation | 4 (57.1%) | 3 (42.9%) |
| Material Moving | 0 (0.0%) | 0 (0.0%) |
| Total (Category) | 4 (33.3%) | 8 (66.7%) |
| Total (Overall) | 86 (57.0%) | 65 (43.0%) |
Employment Industries by Sex in Phenix
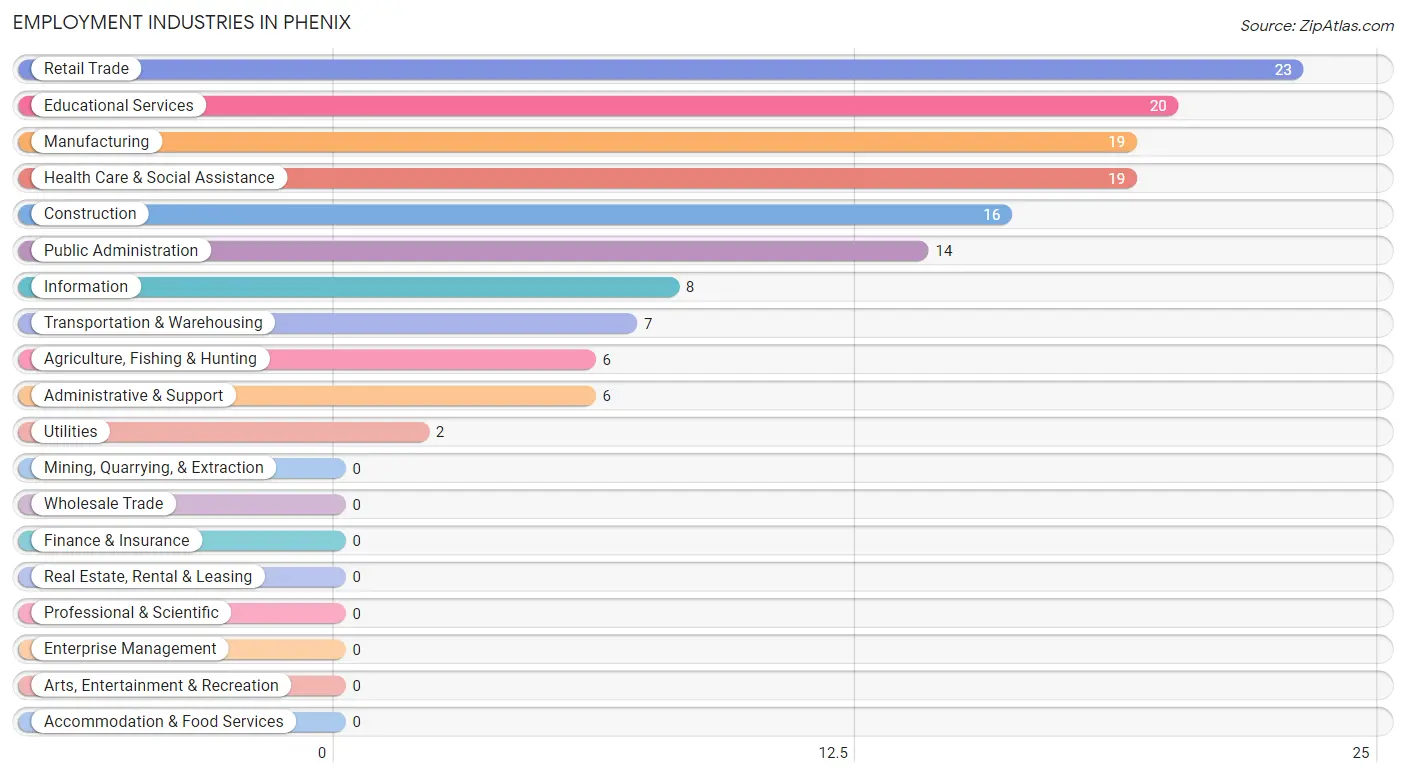
Employment Industries in Phenix
The major employment industries in Phenix include Retail Trade (23 | 15.2%), Educational Services (20 | 13.3%), Manufacturing (19 | 12.6%), Health Care & Social Assistance (19 | 12.6%), and Construction (16 | 10.6%).
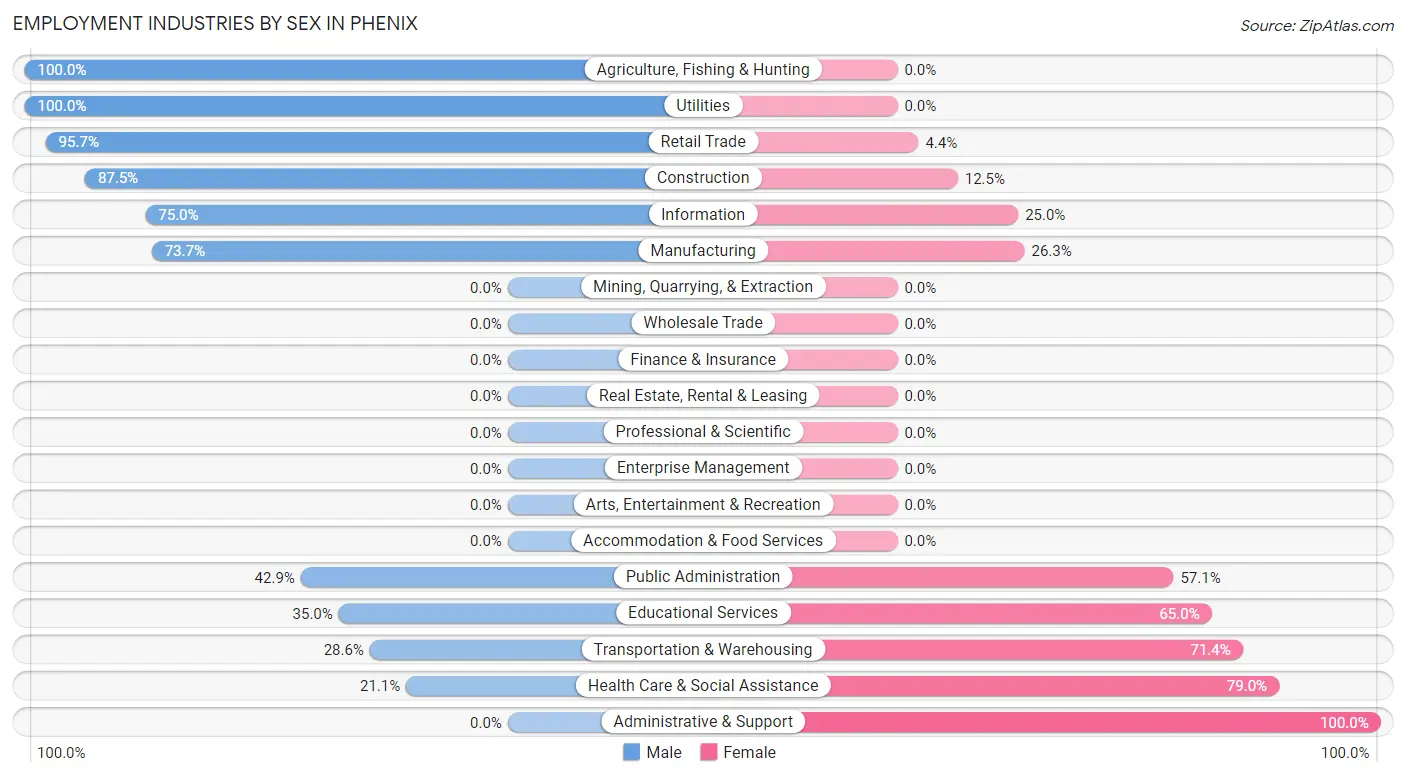
Employment Industries by Sex in Phenix
The Phenix industries that see more men than women are Agriculture, Fishing & Hunting (100.0%), Utilities (100.0%), and Retail Trade (95.7%), whereas the industries that tend to have a higher number of women are Administrative & Support (100.0%), Health Care & Social Assistance (78.9%), and Transportation & Warehousing (71.4%).
| Industry | Male | Female |
| Agriculture, Fishing & Hunting | 6 (100.0%) | 0 (0.0%) |
| Mining, Quarrying, & Extraction | 0 (0.0%) | 0 (0.0%) |
| Construction | 14 (87.5%) | 2 (12.5%) |
| Manufacturing | 14 (73.7%) | 5 (26.3%) |
| Wholesale Trade | 0 (0.0%) | 0 (0.0%) |
| Retail Trade | 22 (95.7%) | 1 (4.3%) |
| Transportation & Warehousing | 2 (28.6%) | 5 (71.4%) |
| Utilities | 2 (100.0%) | 0 (0.0%) |
| Information | 6 (75.0%) | 2 (25.0%) |
| Finance & Insurance | 0 (0.0%) | 0 (0.0%) |
| Real Estate, Rental & Leasing | 0 (0.0%) | 0 (0.0%) |
| Professional & Scientific | 0 (0.0%) | 0 (0.0%) |
| Enterprise Management | 0 (0.0%) | 0 (0.0%) |
| Administrative & Support | 0 (0.0%) | 6 (100.0%) |
| Educational Services | 7 (35.0%) | 13 (65.0%) |
| Health Care & Social Assistance | 4 (21.0%) | 15 (78.9%) |
| Arts, Entertainment & Recreation | 0 (0.0%) | 0 (0.0%) |
| Accommodation & Food Services | 0 (0.0%) | 0 (0.0%) |
| Public Administration | 6 (42.9%) | 8 (57.1%) |
| Total | 86 (57.0%) | 65 (43.0%) |
Education in Phenix
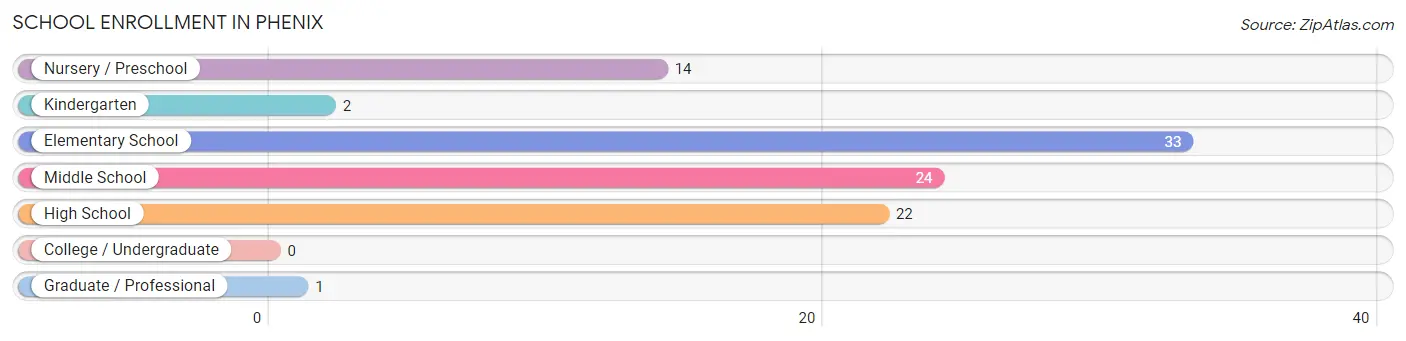
School Enrollment in Phenix
The most common levels of schooling among the 96 students in Phenix are elementary school (33 | 34.4%), middle school (24 | 25.0%), and high school (22 | 22.9%).
| School Level | # Students | % Students |
| Nursery / Preschool | 14 | 14.6% |
| Kindergarten | 2 | 2.1% |
| Elementary School | 33 | 34.4% |
| Middle School | 24 | 25.0% |
| High School | 22 | 22.9% |
| College / Undergraduate | 0 | 0.0% |
| Graduate / Professional | 1 | 1.0% |
| Total | 96 | 100.0% |
School Enrollment by Age by Funding Source in Phenix
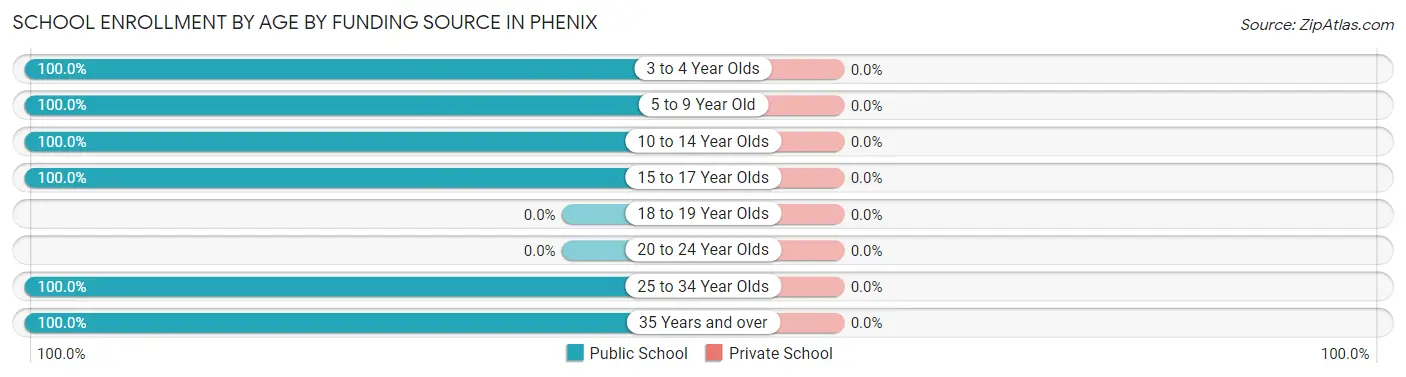
| Age Bracket | Public School | Private School |
| 3 to 4 Year Olds | 13 (100.0%) | 0 (0.0%) |
| 5 to 9 Year Old | 24 (100.0%) | 0 (0.0%) |
| 10 to 14 Year Olds | 36 (100.0%) | 0 (0.0%) |
| 15 to 17 Year Olds | 16 (100.0%) | 0 (0.0%) |
| 18 to 19 Year Olds | 0 (0.0%) | 0 (0.0%) |
| 20 to 24 Year Olds | 0 (0.0%) | 0 (0.0%) |
| 25 to 34 Year Olds | 1 (100.0%) | 0 (0.0%) |
| 35 Years and over | 6 (100.0%) | 0 (0.0%) |
| Total | 96 (100.0%) | 0 (0.0%) |
Educational Attainment by Field of Study in Phenix
Science & technology (10 | 20.0%), liberal arts & history (10 | 20.0%), education (9 | 18.0%), business (7 | 14.0%), and arts & humanities (5 | 10.0%) are the most common fields of study among 50 individuals in Phenix who have obtained a bachelor's degree or higher.
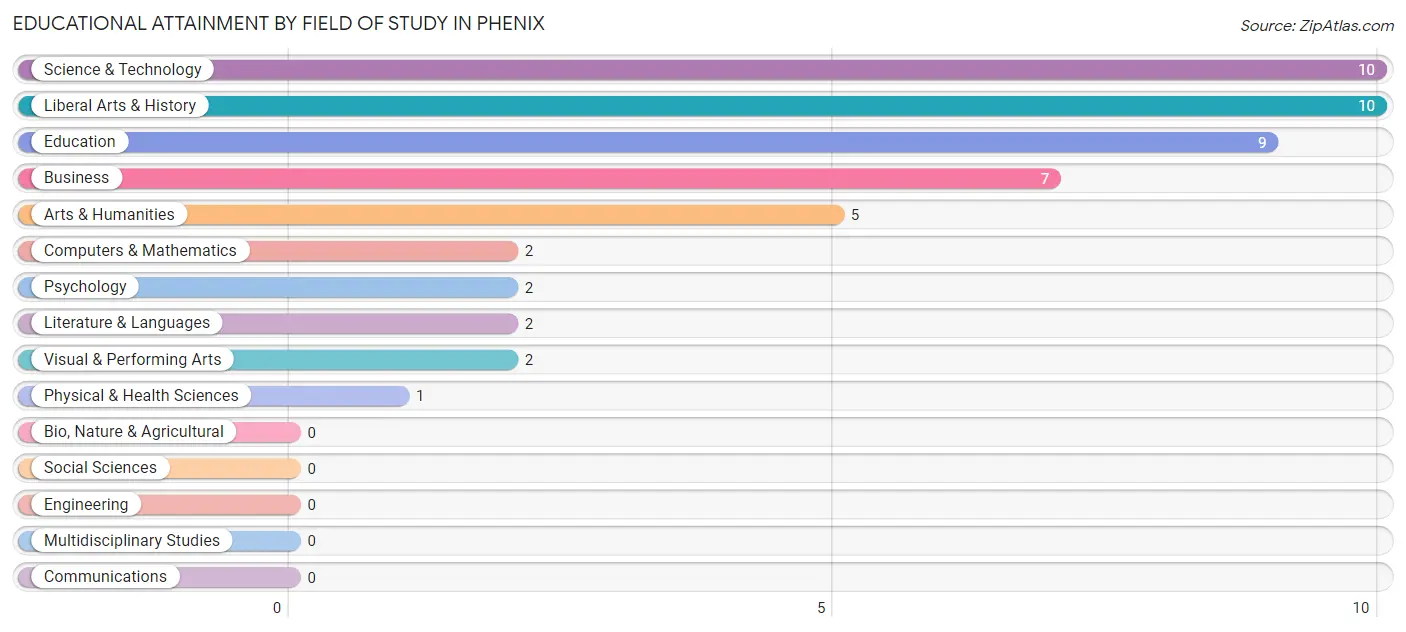
| Field of Study | # Graduates | % Graduates |
| Computers & Mathematics | 2 | 4.0% |
| Bio, Nature & Agricultural | 0 | 0.0% |
| Physical & Health Sciences | 1 | 2.0% |
| Psychology | 2 | 4.0% |
| Social Sciences | 0 | 0.0% |
| Engineering | 0 | 0.0% |
| Multidisciplinary Studies | 0 | 0.0% |
| Science & Technology | 10 | 20.0% |
| Business | 7 | 14.0% |
| Education | 9 | 18.0% |
| Literature & Languages | 2 | 4.0% |
| Liberal Arts & History | 10 | 20.0% |
| Visual & Performing Arts | 2 | 4.0% |
| Communications | 0 | 0.0% |
| Arts & Humanities | 5 | 10.0% |
| Total | 50 | 100.0% |
Transportation & Commute in Phenix
Vehicle Availability by Sex in Phenix
The most prevalent vehicle ownership categories in Phenix are males with 4 vehicles (29, accounting for 33.7%) and females with 4 vehicles (18, making up 46.0%).
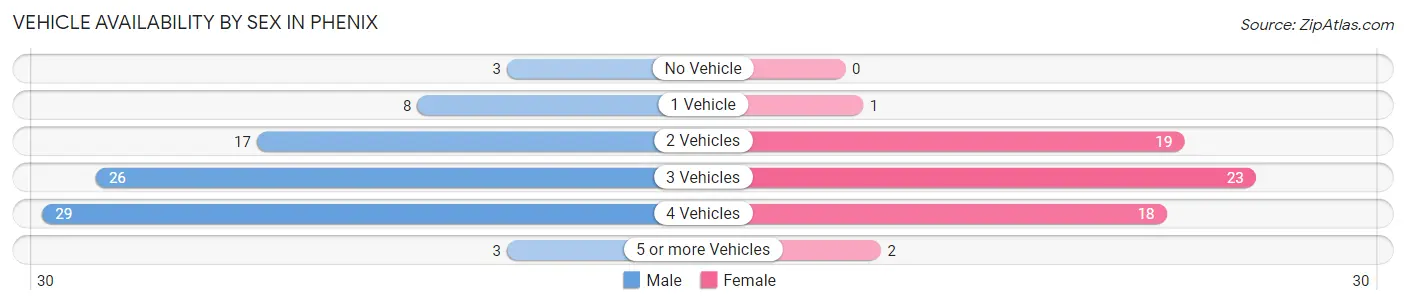
| Vehicles Available | Male | Female |
| No Vehicle | 3 (3.5%) | 0 (0.0%) |
| 1 Vehicle | 8 (9.3%) | 1 (1.6%) |
| 2 Vehicles | 17 (19.8%) | 19 (30.2%) |
| 3 Vehicles | 26 (30.2%) | 23 (36.5%) |
| 4 Vehicles | 29 (33.7%) | 18 (28.6%) |
| 5 or more Vehicles | 3 (3.5%) | 2 (3.2%) |
| Total | 86 (100.0%) | 63 (100.0%) |
Commute Time in Phenix
The most frequently occuring commute durations in Phenix are 45 to 59 minutes (43 commuters, 31.6%), 60 to 89 minutes (22 commuters, 16.2%), and 10 to 14 minutes (19 commuters, 14.0%).
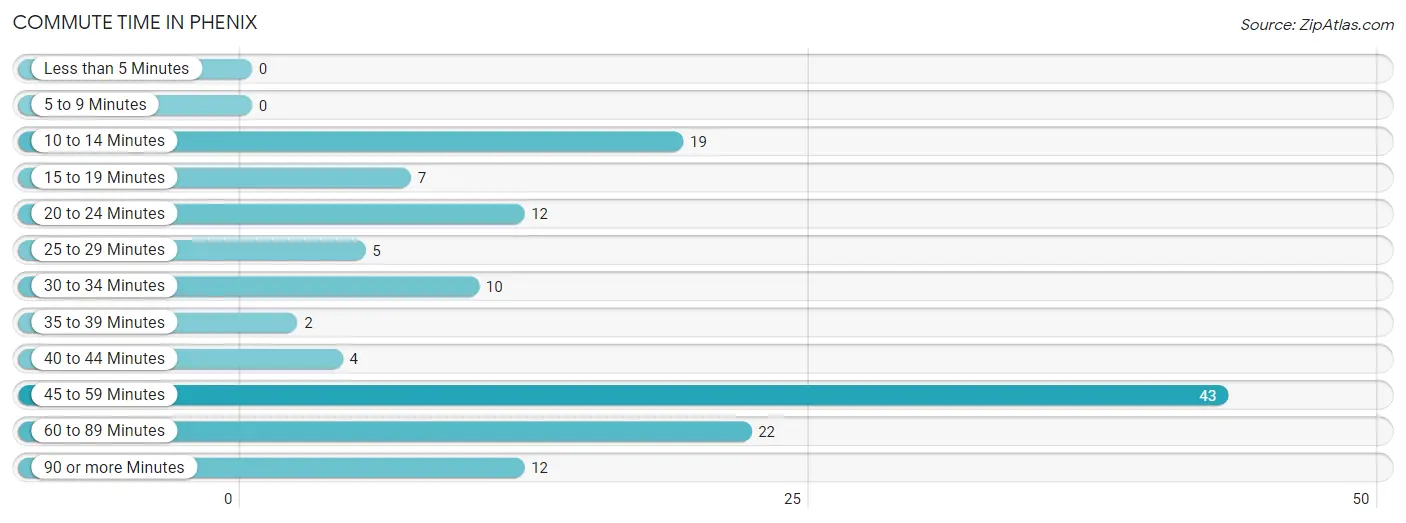
| Commute Time | # Commuters | % Commuters |
| Less than 5 Minutes | 0 | 0.0% |
| 5 to 9 Minutes | 0 | 0.0% |
| 10 to 14 Minutes | 19 | 14.0% |
| 15 to 19 Minutes | 7 | 5.1% |
| 20 to 24 Minutes | 12 | 8.8% |
| 25 to 29 Minutes | 5 | 3.7% |
| 30 to 34 Minutes | 10 | 7.3% |
| 35 to 39 Minutes | 2 | 1.5% |
| 40 to 44 Minutes | 4 | 2.9% |
| 45 to 59 Minutes | 43 | 31.6% |
| 60 to 89 Minutes | 22 | 16.2% |
| 90 or more Minutes | 12 | 8.8% |
Commute Time by Sex in Phenix
The most common commute times in Phenix are 45 to 59 minutes (20 commuters, 24.4%) for males and 45 to 59 minutes (23 commuters, 42.6%) for females.
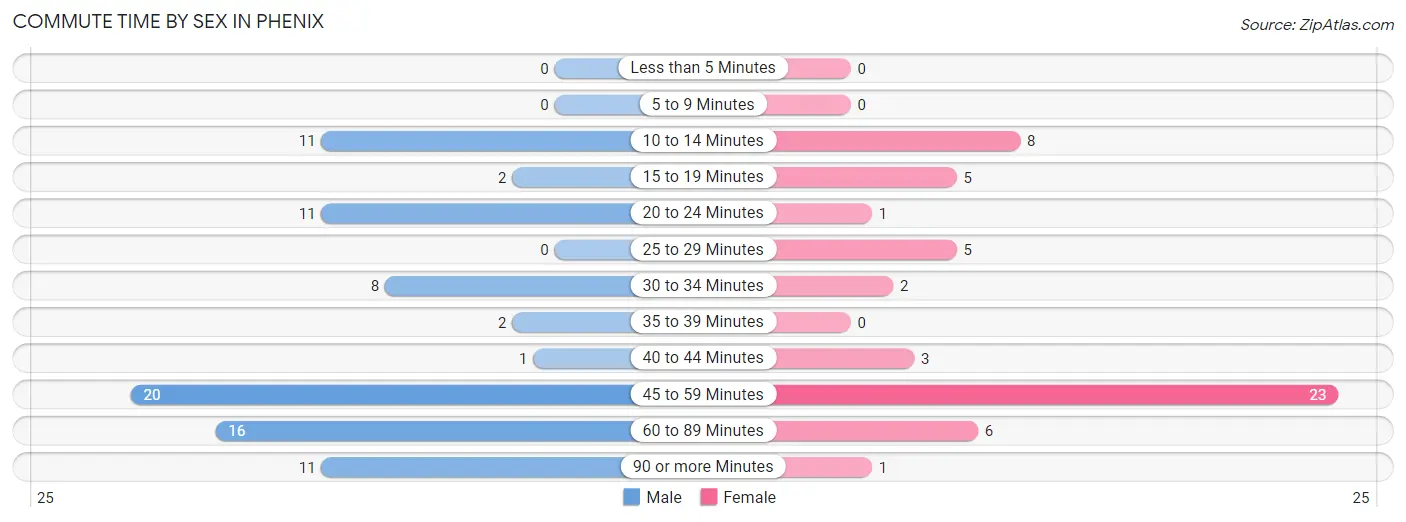
| Commute Time | Male | Female |
| Less than 5 Minutes | 0 (0.0%) | 0 (0.0%) |
| 5 to 9 Minutes | 0 (0.0%) | 0 (0.0%) |
| 10 to 14 Minutes | 11 (13.4%) | 8 (14.8%) |
| 15 to 19 Minutes | 2 (2.4%) | 5 (9.3%) |
| 20 to 24 Minutes | 11 (13.4%) | 1 (1.8%) |
| 25 to 29 Minutes | 0 (0.0%) | 5 (9.3%) |
| 30 to 34 Minutes | 8 (9.8%) | 2 (3.7%) |
| 35 to 39 Minutes | 2 (2.4%) | 0 (0.0%) |
| 40 to 44 Minutes | 1 (1.2%) | 3 (5.6%) |
| 45 to 59 Minutes | 20 (24.4%) | 23 (42.6%) |
| 60 to 89 Minutes | 16 (19.5%) | 6 (11.1%) |
| 90 or more Minutes | 11 (13.4%) | 1 (1.8%) |
Time of Departure to Work by Sex in Phenix
The most frequent times of departure to work in Phenix are 6:00 AM to 6:29 AM (19, 23.2%) for males and 7:00 AM to 7:29 AM (19, 35.2%) for females.
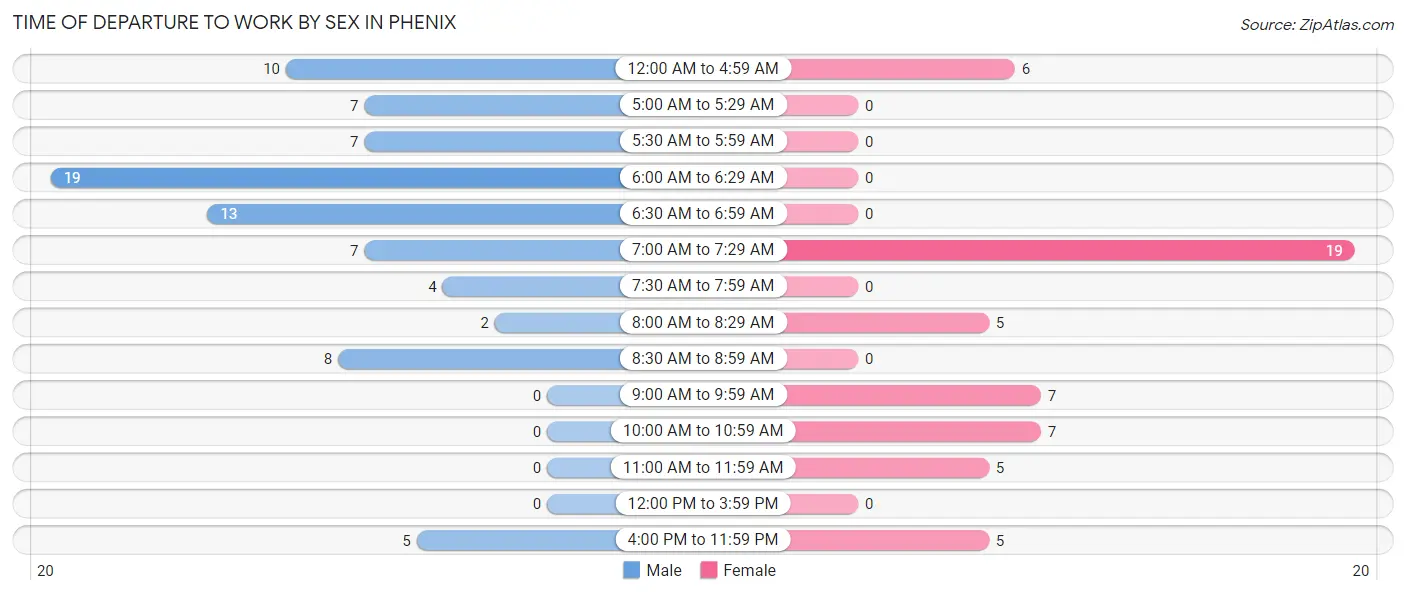
| Time of Departure | Male | Female |
| 12:00 AM to 4:59 AM | 10 (12.2%) | 6 (11.1%) |
| 5:00 AM to 5:29 AM | 7 (8.5%) | 0 (0.0%) |
| 5:30 AM to 5:59 AM | 7 (8.5%) | 0 (0.0%) |
| 6:00 AM to 6:29 AM | 19 (23.2%) | 0 (0.0%) |
| 6:30 AM to 6:59 AM | 13 (15.9%) | 0 (0.0%) |
| 7:00 AM to 7:29 AM | 7 (8.5%) | 19 (35.2%) |
| 7:30 AM to 7:59 AM | 4 (4.9%) | 0 (0.0%) |
| 8:00 AM to 8:29 AM | 2 (2.4%) | 5 (9.3%) |
| 8:30 AM to 8:59 AM | 8 (9.8%) | 0 (0.0%) |
| 9:00 AM to 9:59 AM | 0 (0.0%) | 7 (13.0%) |
| 10:00 AM to 10:59 AM | 0 (0.0%) | 7 (13.0%) |
| 11:00 AM to 11:59 AM | 0 (0.0%) | 5 (9.3%) |
| 12:00 PM to 3:59 PM | 0 (0.0%) | 0 (0.0%) |
| 4:00 PM to 11:59 PM | 5 (6.1%) | 5 (9.3%) |
| Total | 82 (100.0%) | 54 (100.0%) |
Housing Occupancy in Phenix
Occupancy by Ownership in Phenix
Of the total 131 dwellings in Phenix, owner-occupied units account for 113 (86.3%), while renter-occupied units make up 18 (13.7%).
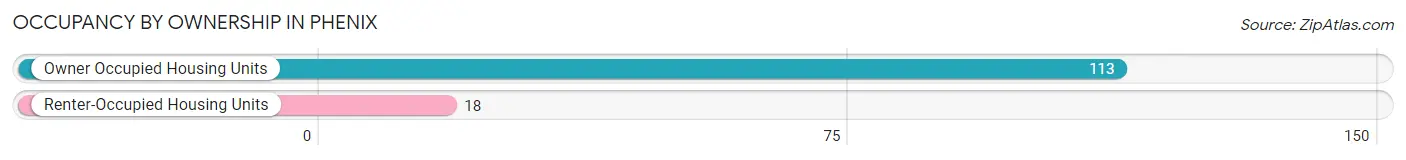
| Occupancy | # Housing Units | % Housing Units |
| Owner Occupied Housing Units | 113 | 86.3% |
| Renter-Occupied Housing Units | 18 | 13.7% |
| Total Occupied Housing Units | 131 | 100.0% |
Occupancy by Household Size in Phenix
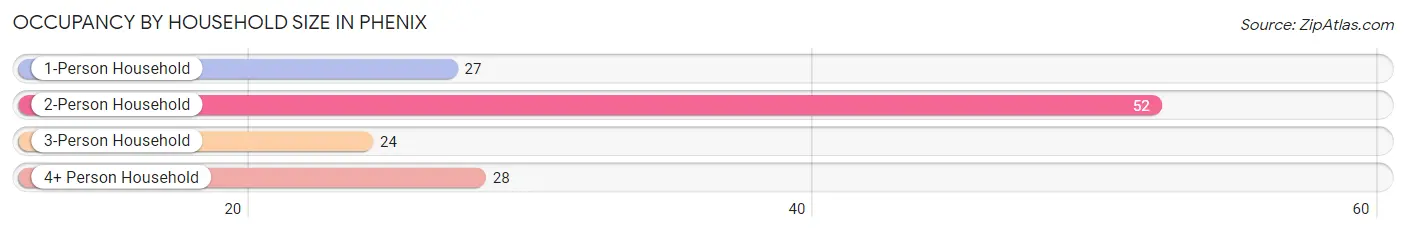
| Household Size | # Housing Units | % Housing Units |
| 1-Person Household | 27 | 20.6% |
| 2-Person Household | 52 | 39.7% |
| 3-Person Household | 24 | 18.3% |
| 4+ Person Household | 28 | 21.4% |
| Total Housing Units | 131 | 100.0% |
Occupancy by Ownership by Household Size in Phenix
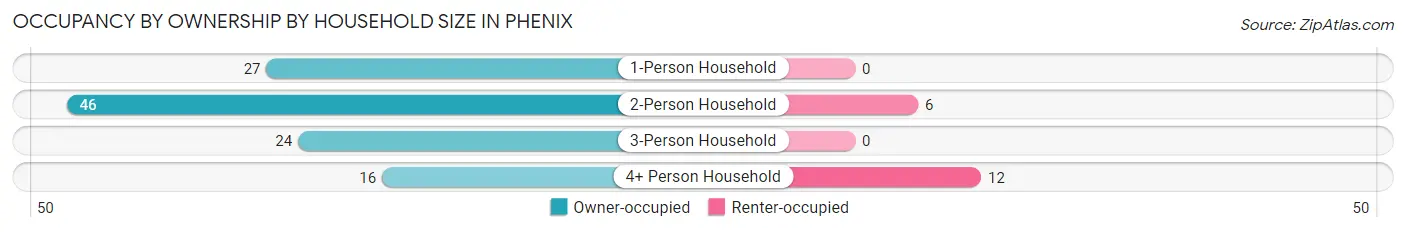
| Household Size | Owner-occupied | Renter-occupied |
| 1-Person Household | 27 (100.0%) | 0 (0.0%) |
| 2-Person Household | 46 (88.5%) | 6 (11.5%) |
| 3-Person Household | 24 (100.0%) | 0 (0.0%) |
| 4+ Person Household | 16 (57.1%) | 12 (42.9%) |
| Total Housing Units | 113 (86.3%) | 18 (13.7%) |
Occupancy by Educational Attainment in Phenix
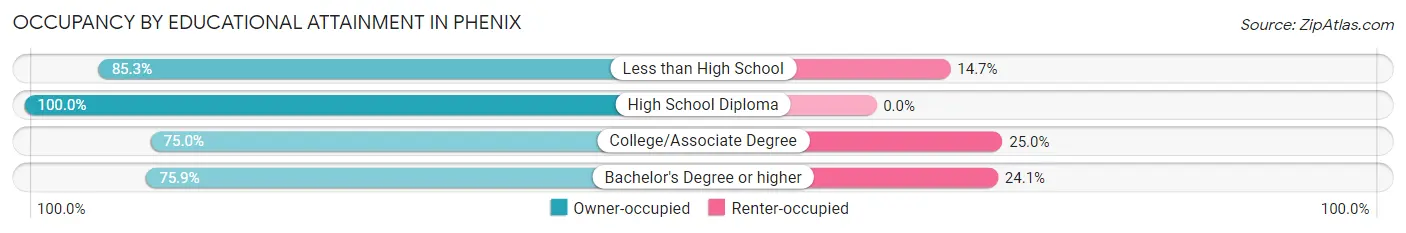
| Household Size | Owner-occupied | Renter-occupied |
| Less than High School | 29 (85.3%) | 5 (14.7%) |
| High School Diploma | 44 (100.0%) | 0 (0.0%) |
| College/Associate Degree | 18 (75.0%) | 6 (25.0%) |
| Bachelor's Degree or higher | 22 (75.9%) | 7 (24.1%) |
Occupancy by Age of Householder in Phenix
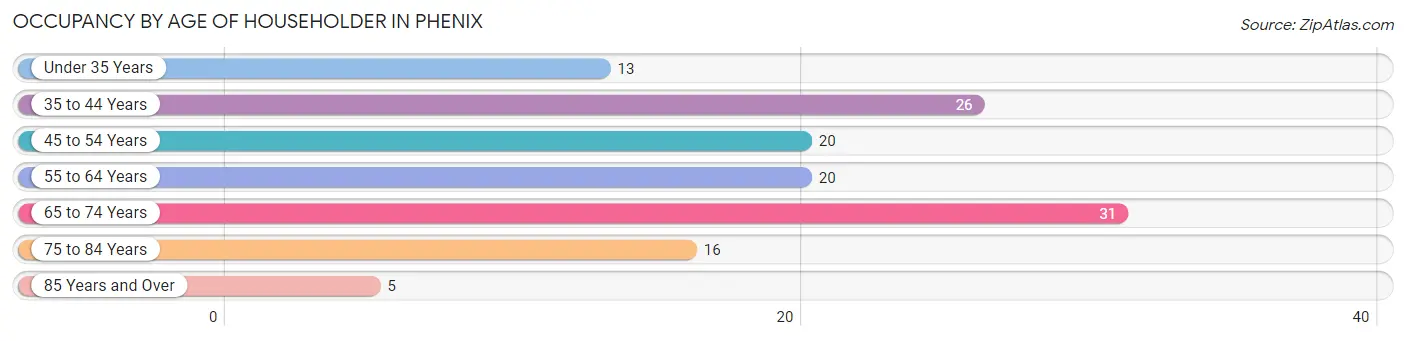
| Age Bracket | # Households | % Households |
| Under 35 Years | 13 | 9.9% |
| 35 to 44 Years | 26 | 19.9% |
| 45 to 54 Years | 20 | 15.3% |
| 55 to 64 Years | 20 | 15.3% |
| 65 to 74 Years | 31 | 23.7% |
| 75 to 84 Years | 16 | 12.2% |
| 85 Years and Over | 5 | 3.8% |
| Total | 131 | 100.0% |
Housing Finances in Phenix
Median Income by Occupancy in Phenix
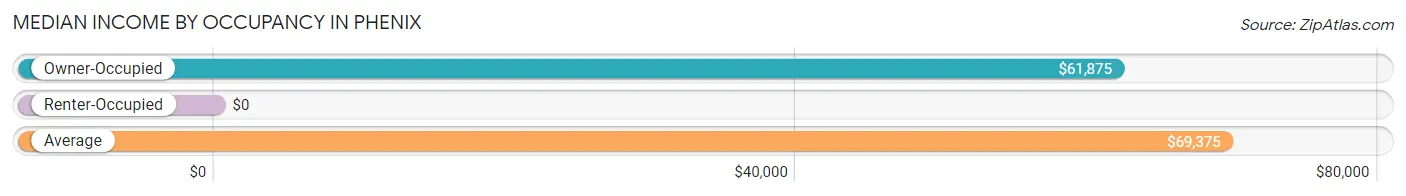
| Occupancy Type | # Households | Median Income |
| Owner-Occupied | 113 (86.3%) | $61,875 |
| Renter-Occupied | 18 (13.7%) | $0 |
| Average | 131 (100.0%) | $69,375 |
Occupancy by Householder Income Bracket in Phenix
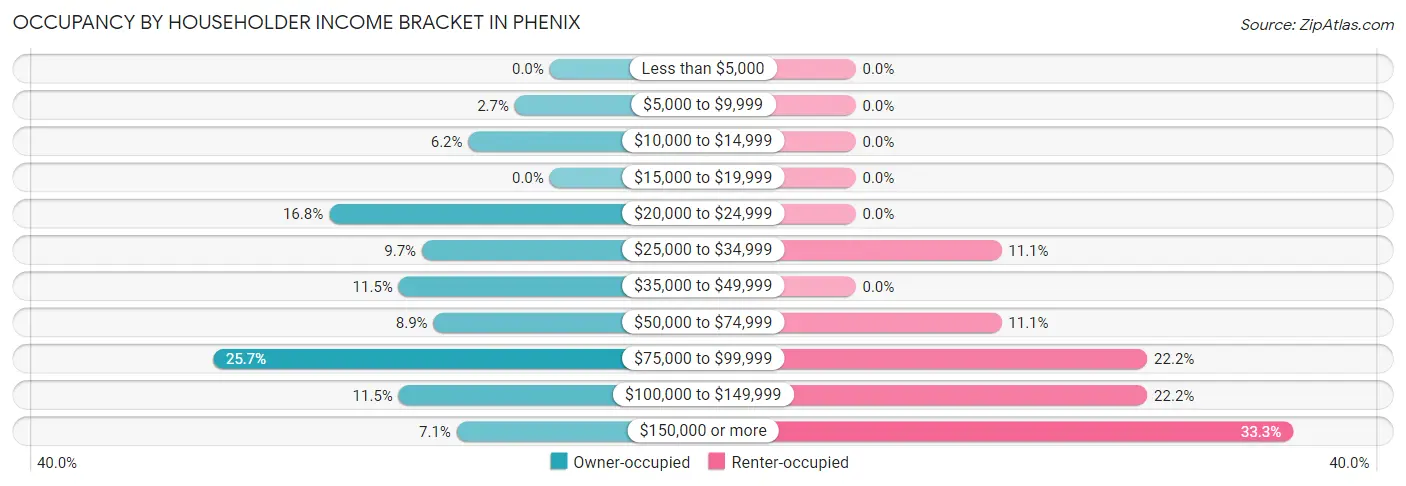
| Income Bracket | Owner-occupied | Renter-occupied |
| Less than $5,000 | 0 (0.0%) | 0 (0.0%) |
| $5,000 to $9,999 | 3 (2.6%) | 0 (0.0%) |
| $10,000 to $14,999 | 7 (6.2%) | 0 (0.0%) |
| $15,000 to $19,999 | 0 (0.0%) | 0 (0.0%) |
| $20,000 to $24,999 | 19 (16.8%) | 0 (0.0%) |
| $25,000 to $34,999 | 11 (9.7%) | 2 (11.1%) |
| $35,000 to $49,999 | 13 (11.5%) | 0 (0.0%) |
| $50,000 to $74,999 | 10 (8.8%) | 2 (11.1%) |
| $75,000 to $99,999 | 29 (25.7%) | 4 (22.2%) |
| $100,000 to $149,999 | 13 (11.5%) | 4 (22.2%) |
| $150,000 or more | 8 (7.1%) | 6 (33.3%) |
| Total | 113 (100.0%) | 18 (100.0%) |
Monthly Housing Cost Tiers in Phenix
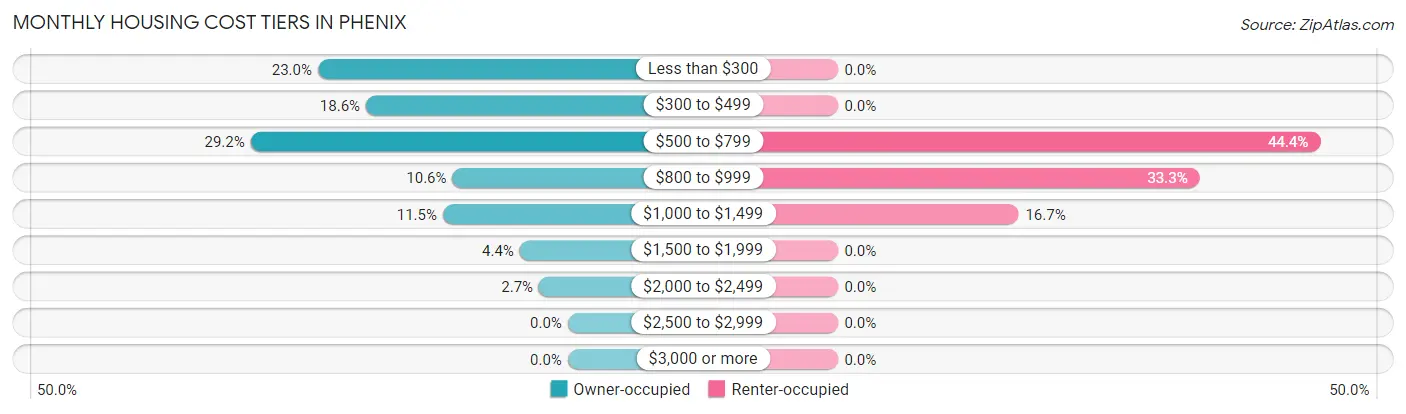
| Monthly Cost | Owner-occupied | Renter-occupied |
| Less than $300 | 26 (23.0%) | 0 (0.0%) |
| $300 to $499 | 21 (18.6%) | 0 (0.0%) |
| $500 to $799 | 33 (29.2%) | 8 (44.4%) |
| $800 to $999 | 12 (10.6%) | 6 (33.3%) |
| $1,000 to $1,499 | 13 (11.5%) | 3 (16.7%) |
| $1,500 to $1,999 | 5 (4.4%) | 0 (0.0%) |
| $2,000 to $2,499 | 3 (2.6%) | 0 (0.0%) |
| $2,500 to $2,999 | 0 (0.0%) | 0 (0.0%) |
| $3,000 or more | 0 (0.0%) | 0 (0.0%) |
| Total | 113 (100.0%) | 18 (100.0%) |
Physical Housing Characteristics in Phenix
Housing Structures in Phenix
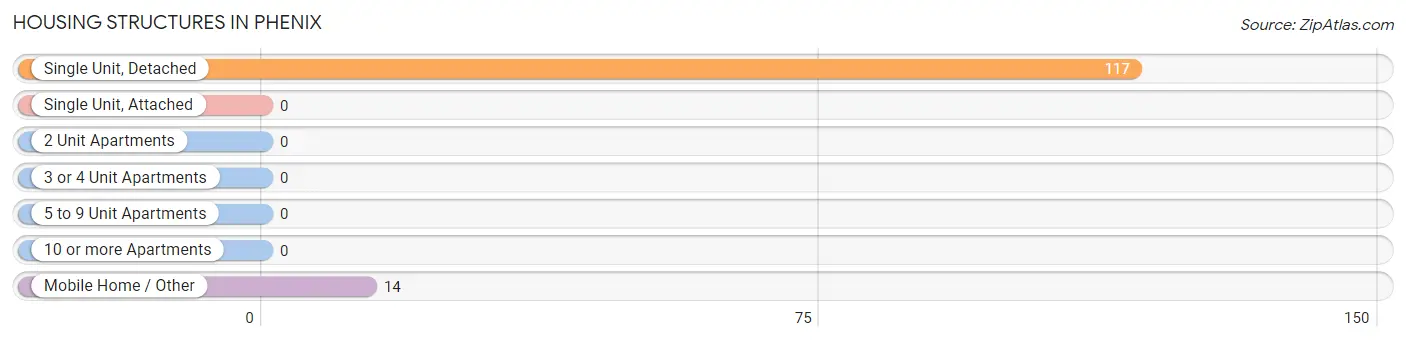
| Structure Type | # Housing Units | % Housing Units |
| Single Unit, Detached | 117 | 89.3% |
| Single Unit, Attached | 0 | 0.0% |
| 2 Unit Apartments | 0 | 0.0% |
| 3 or 4 Unit Apartments | 0 | 0.0% |
| 5 to 9 Unit Apartments | 0 | 0.0% |
| 10 or more Apartments | 0 | 0.0% |
| Mobile Home / Other | 14 | 10.7% |
| Total | 131 | 100.0% |
Housing Structures by Occupancy in Phenix
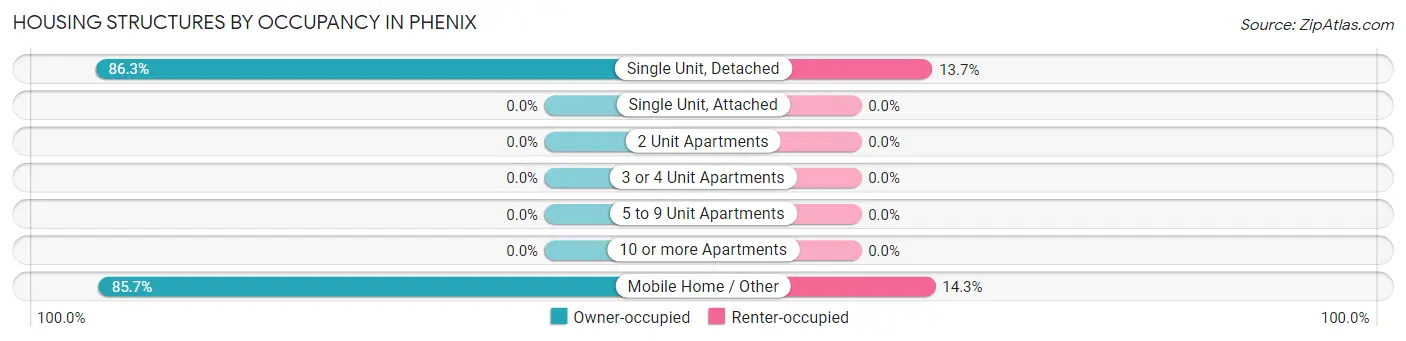
| Structure Type | Owner-occupied | Renter-occupied |
| Single Unit, Detached | 101 (86.3%) | 16 (13.7%) |
| Single Unit, Attached | 0 (0.0%) | 0 (0.0%) |
| 2 Unit Apartments | 0 (0.0%) | 0 (0.0%) |
| 3 or 4 Unit Apartments | 0 (0.0%) | 0 (0.0%) |
| 5 to 9 Unit Apartments | 0 (0.0%) | 0 (0.0%) |
| 10 or more Apartments | 0 (0.0%) | 0 (0.0%) |
| Mobile Home / Other | 12 (85.7%) | 2 (14.3%) |
| Total | 113 (86.3%) | 18 (13.7%) |
Housing Structures by Number of Rooms in Phenix
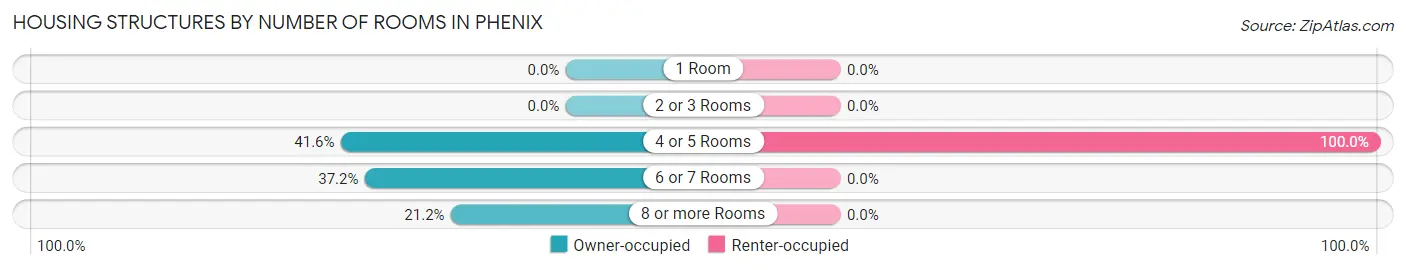
| Number of Rooms | Owner-occupied | Renter-occupied |
| 1 Room | 0 (0.0%) | 0 (0.0%) |
| 2 or 3 Rooms | 0 (0.0%) | 0 (0.0%) |
| 4 or 5 Rooms | 47 (41.6%) | 18 (100.0%) |
| 6 or 7 Rooms | 42 (37.2%) | 0 (0.0%) |
| 8 or more Rooms | 24 (21.2%) | 0 (0.0%) |
| Total | 113 (100.0%) | 18 (100.0%) |
Housing Structure by Heating Type in Phenix
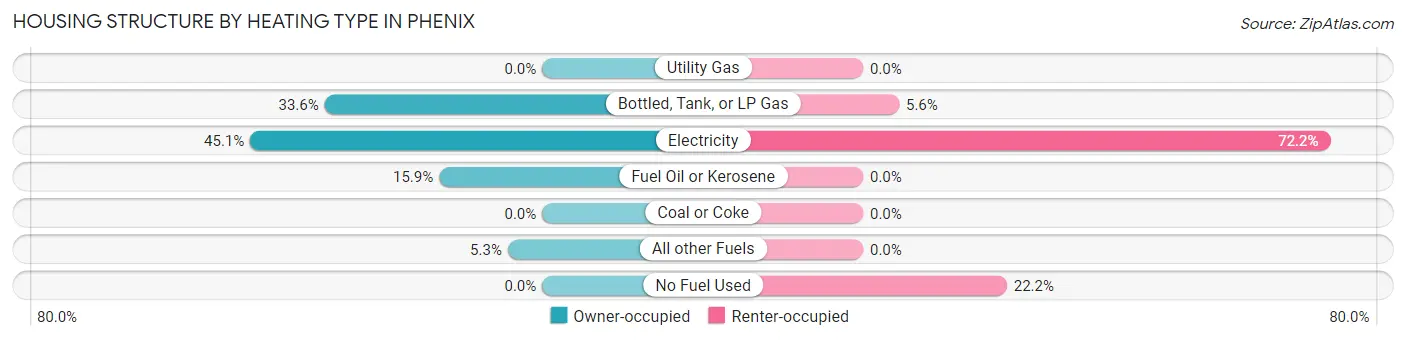
| Heating Type | Owner-occupied | Renter-occupied |
| Utility Gas | 0 (0.0%) | 0 (0.0%) |
| Bottled, Tank, or LP Gas | 38 (33.6%) | 1 (5.6%) |
| Electricity | 51 (45.1%) | 13 (72.2%) |
| Fuel Oil or Kerosene | 18 (15.9%) | 0 (0.0%) |
| Coal or Coke | 0 (0.0%) | 0 (0.0%) |
| All other Fuels | 6 (5.3%) | 0 (0.0%) |
| No Fuel Used | 0 (0.0%) | 4 (22.2%) |
| Total | 113 (100.0%) | 18 (100.0%) |
Household Vehicle Usage in Phenix
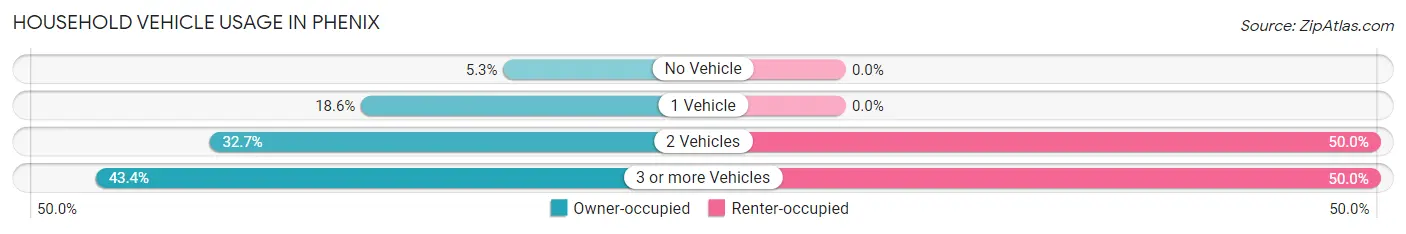
| Vehicles per Household | Owner-occupied | Renter-occupied |
| No Vehicle | 6 (5.3%) | 0 (0.0%) |
| 1 Vehicle | 21 (18.6%) | 0 (0.0%) |
| 2 Vehicles | 37 (32.7%) | 9 (50.0%) |
| 3 or more Vehicles | 49 (43.4%) | 9 (50.0%) |
| Total | 113 (100.0%) | 18 (100.0%) |
Real Estate & Mortgages in Phenix
Real Estate and Mortgage Overview in Phenix
| Characteristic | Without Mortgage | With Mortgage |
| Housing Units | 77 | 36 |
| Median Property Value | $101,000 | $0 |
| Median Household Income | $40,417 | $1 |
| Monthly Housing Costs | $385 | $0 |
| Real Estate Taxes | $584 | $0 |
Property Value by Mortgage Status in Phenix
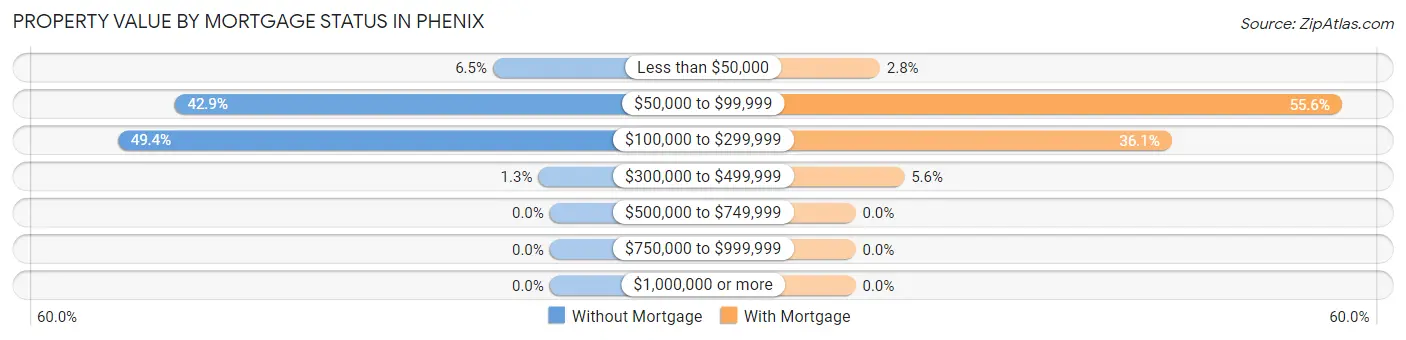
| Property Value | Without Mortgage | With Mortgage |
| Less than $50,000 | 5 (6.5%) | 1 (2.8%) |
| $50,000 to $99,999 | 33 (42.9%) | 20 (55.6%) |
| $100,000 to $299,999 | 38 (49.3%) | 13 (36.1%) |
| $300,000 to $499,999 | 1 (1.3%) | 2 (5.6%) |
| $500,000 to $749,999 | 0 (0.0%) | 0 (0.0%) |
| $750,000 to $999,999 | 0 (0.0%) | 0 (0.0%) |
| $1,000,000 or more | 0 (0.0%) | 0 (0.0%) |
| Total | 77 (100.0%) | 36 (100.0%) |
Household Income by Mortgage Status in Phenix
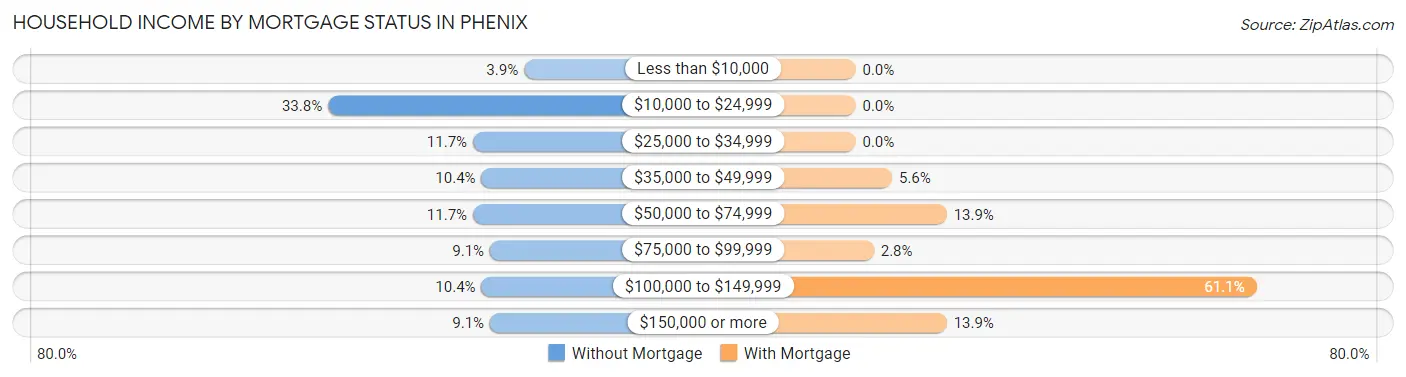
| Household Income | Without Mortgage | With Mortgage |
| Less than $10,000 | 3 (3.9%) | 0 (0.0%) |
| $10,000 to $24,999 | 26 (33.8%) | 0 (0.0%) |
| $25,000 to $34,999 | 9 (11.7%) | 0 (0.0%) |
| $35,000 to $49,999 | 8 (10.4%) | 2 (5.6%) |
| $50,000 to $74,999 | 9 (11.7%) | 5 (13.9%) |
| $75,000 to $99,999 | 7 (9.1%) | 1 (2.8%) |
| $100,000 to $149,999 | 8 (10.4%) | 22 (61.1%) |
| $150,000 or more | 7 (9.1%) | 5 (13.9%) |
| Total | 77 (100.0%) | 36 (100.0%) |
Property Value to Household Income Ratio in Phenix
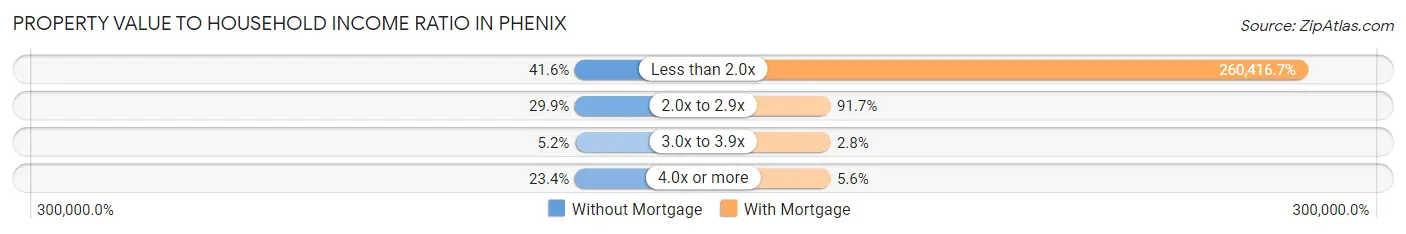
| Value-to-Income Ratio | Without Mortgage | With Mortgage |
| Less than 2.0x | 32 (41.6%) | 93,750 (260,416.7%) |
| 2.0x to 2.9x | 23 (29.9%) | 33 (91.7%) |
| 3.0x to 3.9x | 4 (5.2%) | 1 (2.8%) |
| 4.0x or more | 18 (23.4%) | 2 (5.6%) |
| Total | 77 (100.0%) | 36 (100.0%) |
Real Estate Taxes by Mortgage Status in Phenix
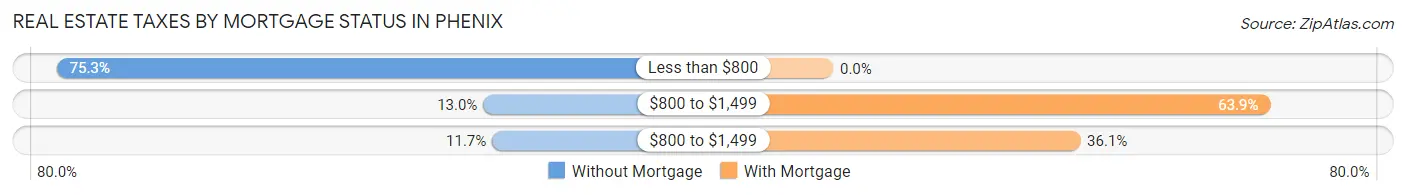
| Property Taxes | Without Mortgage | With Mortgage |
| Less than $800 | 58 (75.3%) | 0 (0.0%) |
| $800 to $1,499 | 10 (13.0%) | 23 (63.9%) |
| $800 to $1,499 | 9 (11.7%) | 13 (36.1%) |
| Total | 77 (100.0%) | 36 (100.0%) |
Health & Disability in Phenix
Health Insurance Coverage by Age in Phenix
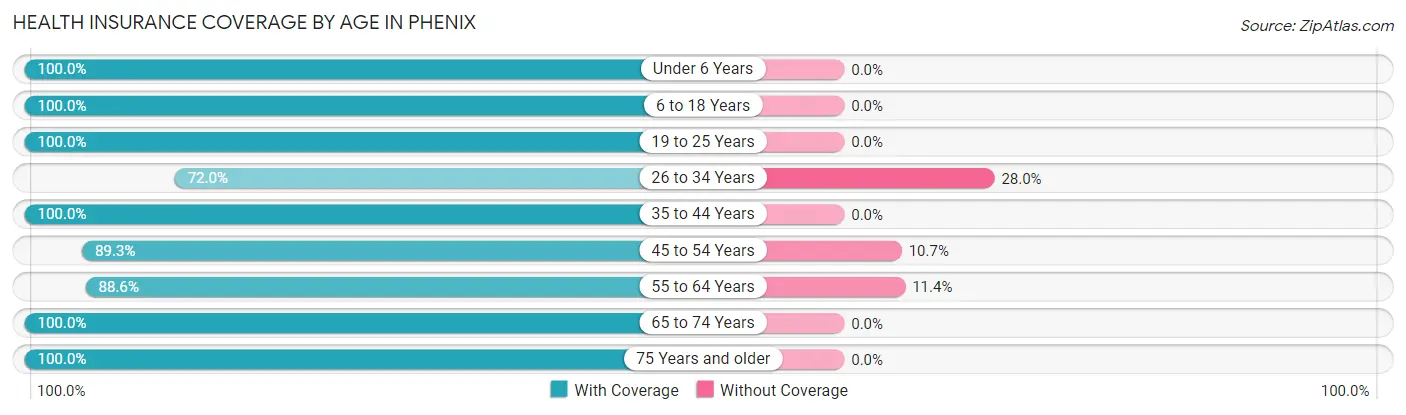
| Age Bracket | With Coverage | Without Coverage |
| Under 6 Years | 35 (100.0%) | 0 (0.0%) |
| 6 to 18 Years | 79 (100.0%) | 0 (0.0%) |
| 19 to 25 Years | 19 (100.0%) | 0 (0.0%) |
| 26 to 34 Years | 18 (72.0%) | 7 (28.0%) |
| 35 to 44 Years | 54 (100.0%) | 0 (0.0%) |
| 45 to 54 Years | 25 (89.3%) | 3 (10.7%) |
| 55 to 64 Years | 39 (88.6%) | 5 (11.4%) |
| 65 to 74 Years | 124 (100.0%) | 0 (0.0%) |
| 75 Years and older | 29 (100.0%) | 0 (0.0%) |
| Total | 422 (96.6%) | 15 (3.4%) |
Health Insurance Coverage by Citizenship Status in Phenix
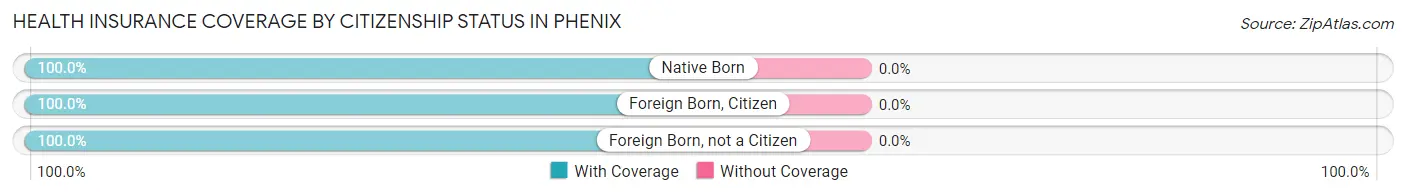
| Citizenship Status | With Coverage | Without Coverage |
| Native Born | 35 (100.0%) | 0 (0.0%) |
| Foreign Born, Citizen | 79 (100.0%) | 0 (0.0%) |
| Foreign Born, not a Citizen | 19 (100.0%) | 0 (0.0%) |
Health Insurance Coverage by Household Income in Phenix
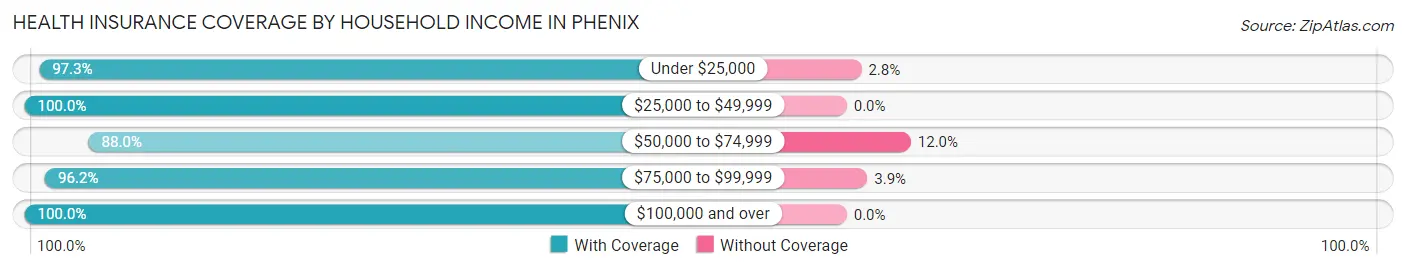
| Household Income | With Coverage | Without Coverage |
| Under $25,000 | 106 (97.3%) | 3 (2.8%) |
| $25,000 to $49,999 | 38 (100.0%) | 0 (0.0%) |
| $50,000 to $74,999 | 44 (88.0%) | 6 (12.0%) |
| $75,000 to $99,999 | 150 (96.2%) | 6 (3.8%) |
| $100,000 and over | 84 (100.0%) | 0 (0.0%) |
Public vs Private Health Insurance Coverage by Age in Phenix
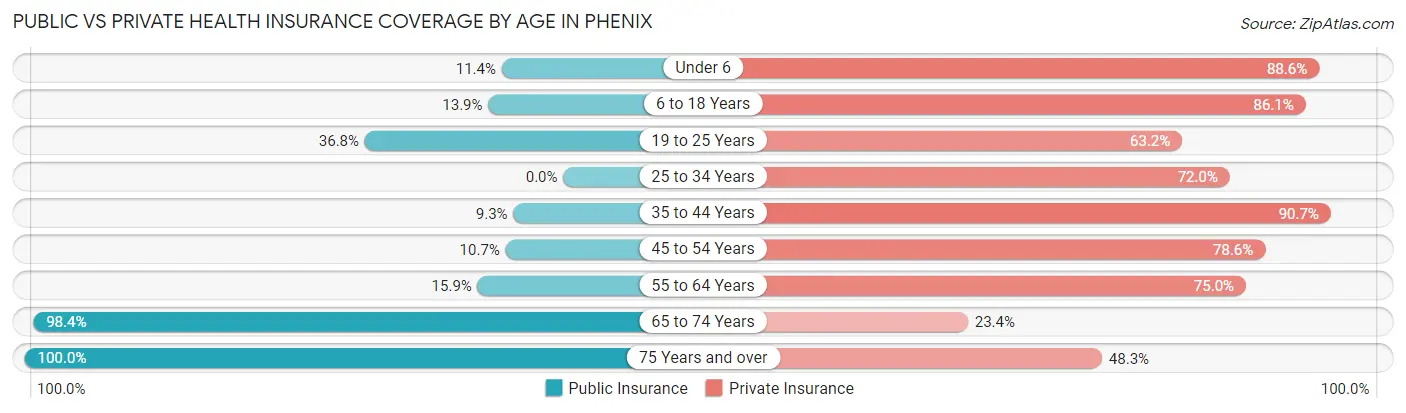
| Age Bracket | Public Insurance | Private Insurance |
| Under 6 | 4 (11.4%) | 31 (88.6%) |
| 6 to 18 Years | 11 (13.9%) | 68 (86.1%) |
| 19 to 25 Years | 7 (36.8%) | 12 (63.2%) |
| 25 to 34 Years | 0 (0.0%) | 18 (72.0%) |
| 35 to 44 Years | 5 (9.3%) | 49 (90.7%) |
| 45 to 54 Years | 3 (10.7%) | 22 (78.6%) |
| 55 to 64 Years | 7 (15.9%) | 33 (75.0%) |
| 65 to 74 Years | 122 (98.4%) | 29 (23.4%) |
| 75 Years and over | 29 (100.0%) | 14 (48.3%) |
| Total | 188 (43.0%) | 276 (63.2%) |
Disability Status by Sex by Age in Phenix
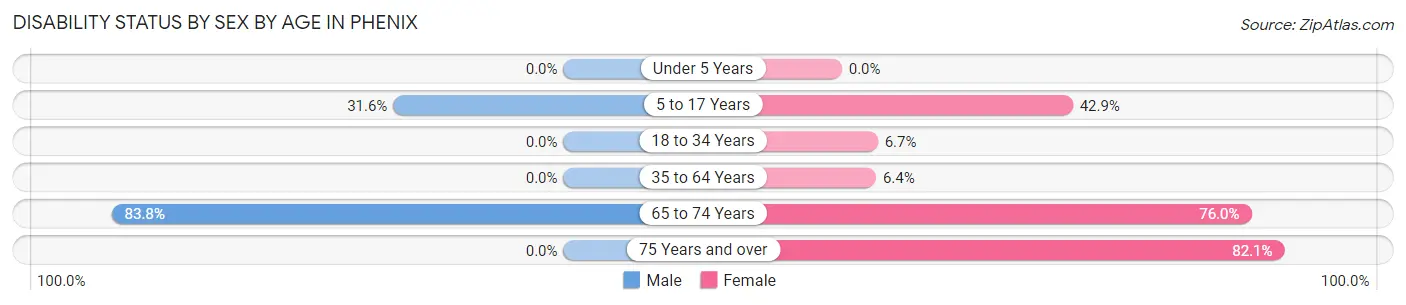
| Age Bracket | Male | Female |
| Under 5 Years | 0 (0.0%) | 0 (0.0%) |
| 5 to 17 Years | 12 (31.6%) | 18 (42.9%) |
| 18 to 34 Years | 0 (0.0%) | 1 (6.7%) |
| 35 to 64 Years | 0 (0.0%) | 4 (6.4%) |
| 65 to 74 Years | 83 (83.8%) | 19 (76.0%) |
| 75 Years and over | 0 (0.0%) | 23 (82.1%) |
Disability Class by Sex by Age in Phenix
Disability Class: Hearing Difficulty
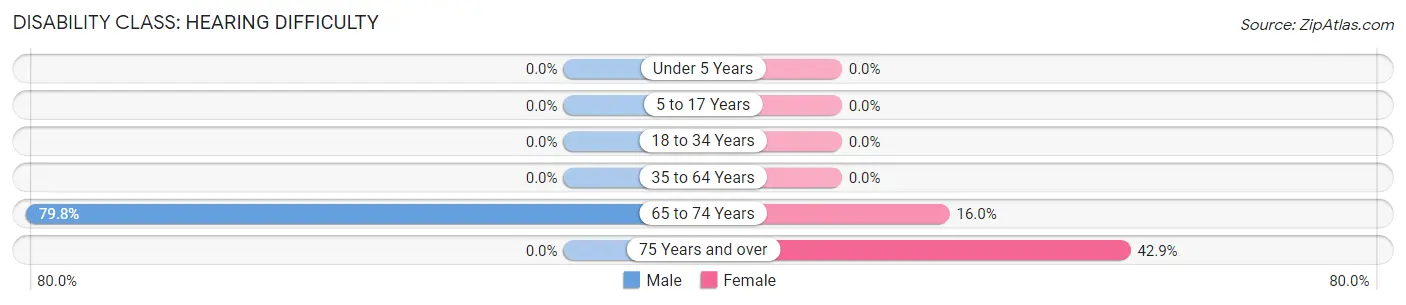
| Age Bracket | Male | Female |
| Under 5 Years | 0 (0.0%) | 0 (0.0%) |
| 5 to 17 Years | 0 (0.0%) | 0 (0.0%) |
| 18 to 34 Years | 0 (0.0%) | 0 (0.0%) |
| 35 to 64 Years | 0 (0.0%) | 0 (0.0%) |
| 65 to 74 Years | 79 (79.8%) | 4 (16.0%) |
| 75 Years and over | 0 (0.0%) | 12 (42.9%) |
Disability Class: Vision Difficulty
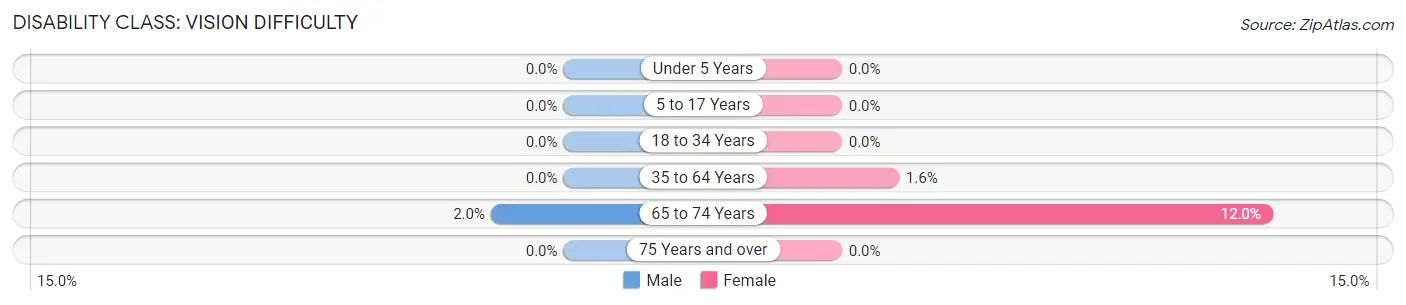
| Age Bracket | Male | Female |
| Under 5 Years | 0 (0.0%) | 0 (0.0%) |
| 5 to 17 Years | 0 (0.0%) | 0 (0.0%) |
| 18 to 34 Years | 0 (0.0%) | 0 (0.0%) |
| 35 to 64 Years | 0 (0.0%) | 1 (1.6%) |
| 65 to 74 Years | 2 (2.0%) | 3 (12.0%) |
| 75 Years and over | 0 (0.0%) | 0 (0.0%) |
Disability Class: Cognitive Difficulty
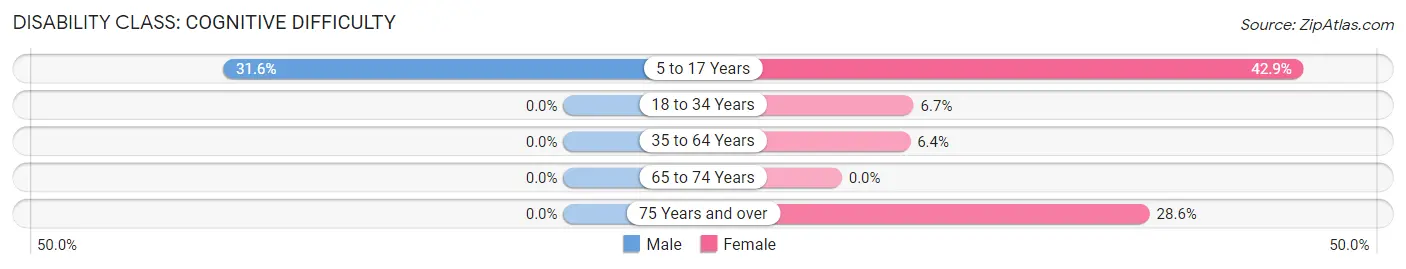
| Age Bracket | Male | Female |
| 5 to 17 Years | 12 (31.6%) | 18 (42.9%) |
| 18 to 34 Years | 0 (0.0%) | 1 (6.7%) |
| 35 to 64 Years | 0 (0.0%) | 4 (6.4%) |
| 65 to 74 Years | 0 (0.0%) | 0 (0.0%) |
| 75 Years and over | 0 (0.0%) | 8 (28.6%) |
Disability Class: Ambulatory Difficulty
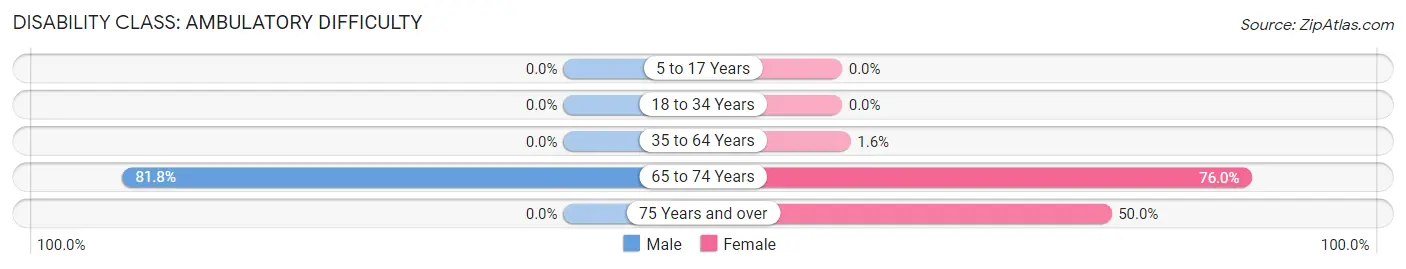
| Age Bracket | Male | Female |
| 5 to 17 Years | 0 (0.0%) | 0 (0.0%) |
| 18 to 34 Years | 0 (0.0%) | 0 (0.0%) |
| 35 to 64 Years | 0 (0.0%) | 1 (1.6%) |
| 65 to 74 Years | 81 (81.8%) | 19 (76.0%) |
| 75 Years and over | 0 (0.0%) | 14 (50.0%) |
Disability Class: Self-Care Difficulty
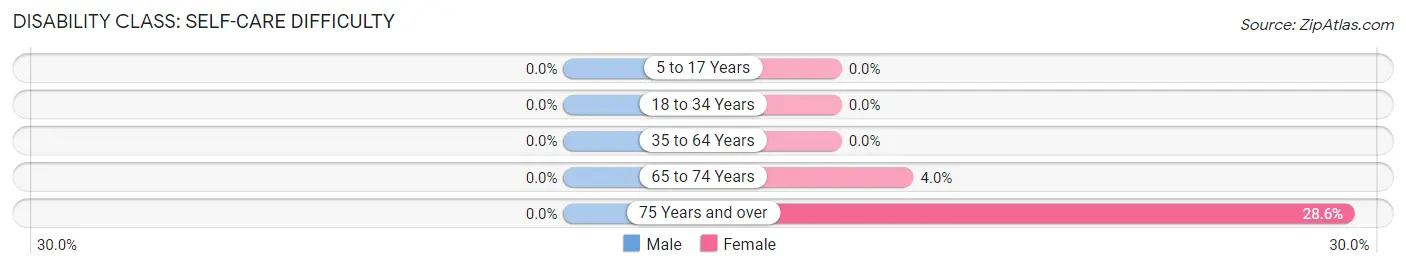
| Age Bracket | Male | Female |
| 5 to 17 Years | 0 (0.0%) | 0 (0.0%) |
| 18 to 34 Years | 0 (0.0%) | 0 (0.0%) |
| 35 to 64 Years | 0 (0.0%) | 0 (0.0%) |
| 65 to 74 Years | 0 (0.0%) | 1 (4.0%) |
| 75 Years and over | 0 (0.0%) | 8 (28.6%) |
Technology Access in Phenix
Computing Device Access in Phenix
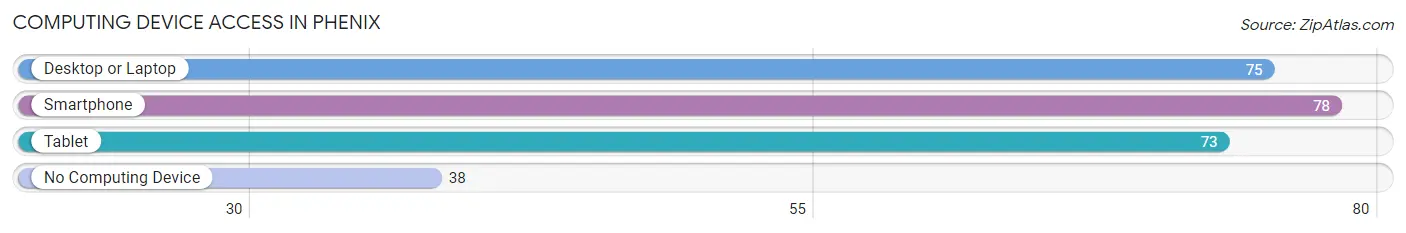
| Device Type | # Households | % Households |
| Desktop or Laptop | 75 | 57.3% |
| Smartphone | 78 | 59.5% |
| Tablet | 73 | 55.7% |
| No Computing Device | 38 | 29.0% |
| Total | 131 | 100.0% |
Internet Access in Phenix
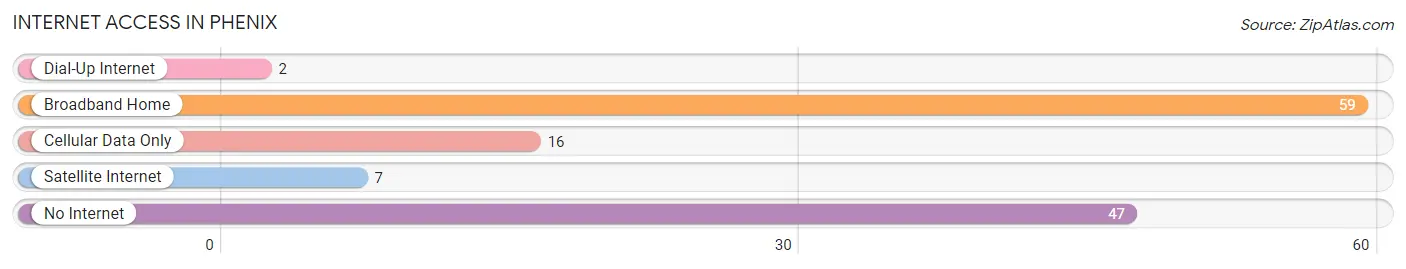
| Internet Type | # Households | % Households |
| Dial-Up Internet | 2 | 1.5% |
| Broadband Home | 59 | 45.0% |
| Cellular Data Only | 16 | 12.2% |
| Satellite Internet | 7 | 5.3% |
| No Internet | 47 | 35.9% |
| Total | 131 | 100.0% |
Phenix Summary
Phenix, Virginia is a small town located in Prince Edward County, Virginia. It is situated on the Appomattox River, about 25 miles south of the state capital of Richmond. The town was founded in 1820 and has a population of approximately 1,000 people.
History
Phenix was founded in 1820 by a group of settlers from North Carolina. The town was named after the Phenix Iron Works, which was established in the area in 1819. The iron works was the first of its kind in the state of Virginia and was a major source of employment for the town. The iron works was destroyed by fire in 1845, but the town continued to grow and prosper.
In the late 19th century, Phenix became a popular destination for tourists. The town was known for its mineral springs, which were believed to have healing properties. The town also had a number of hotels and resorts, which attracted visitors from all over the country.
In the early 20th century, Phenix was a major center for tobacco production. The town was home to several tobacco warehouses and factories, which employed many of the town’s residents. The town also had a number of stores and businesses, which served the needs of the local population.
Geography
Phenix is located in Prince Edward County, Virginia. The town is situated on the Appomattox River, about 25 miles south of the state capital of Richmond. The town is surrounded by rolling hills and farmland. The climate in Phenix is mild, with temperatures ranging from the mid-50s in the winter to the mid-80s in the summer.
Economy
The economy of Phenix is largely based on agriculture. The town is home to several farms, which produce a variety of crops, including corn, soybeans, wheat, and tobacco. The town also has a number of businesses, including restaurants, stores, and service providers.
Demographics
As of the 2010 census, the population of Phenix was 1,000. The racial makeup of the town was 95.2% White, 2.2% African American, 0.2% Native American, 0.2% Asian, 0.2% from other races, and 1.9% from two or more races. The median household income in Phenix was $37,500, and the median family income was $45,000. The per capita income in Phenix was $18,000.
Phenix is a small town with a rich history and a vibrant economy. The town is home to a diverse population and offers a variety of amenities and services. Phenix is a great place to live, work, and play.
Common Questions
What is Per Capita Income in Phenix?
Per Capita income in Phenix is $24,812.
What is the Median Family Income in Phenix?
Median Family Income in Phenix is $93,750.
What is the Median Household income in Phenix?
Median Household Income in Phenix is $69,375.
What is Income or Wage Gap in Phenix?
Income or Wage Gap in Phenix is 29.3%.
Women in Phenix earn 70.7 cents for every dollar earned by a man.
What is Inequality or Gini Index in Phenix?
Inequality or Gini Index in Phenix is 0.44.
What is the Total Population of Phenix?
Total Population of Phenix is 437.
What is the Total Male Population of Phenix?
Total Male Population of Phenix is 254.
What is the Total Female Population of Phenix?
Total Female Population of Phenix is 183.
What is the Ratio of Males per 100 Females in Phenix?
There are 138.80 Males per 100 Females in Phenix.
What is the Ratio of Females per 100 Males in Phenix?
There are 72.05 Females per 100 Males in Phenix.
What is the Median Population Age in Phenix?
Median Population Age in Phenix is 50.5 Years.
What is the Average Family Size in Phenix
Average Family Size in Phenix is 3.6 People.
What is the Average Household Size in Phenix
Average Household Size in Phenix is 3.3 People.
How Large is the Labor Force in Phenix?
There are 158 People in the Labor Forcein in Phenix.
What is the Percentage of People in the Labor Force in Phenix?
47.0% of People are in the Labor Force in Phenix.
What is the Unemployment Rate in Phenix?
Unemployment Rate in Phenix is 4.4%.