Zip Codes with the Highest Percentage of Population Employed in Security & Protection in Charlottesville, VA
RELATED REPORTS & OPTIONS
Security & Protection
Charlottesville
Compare Zip Codes
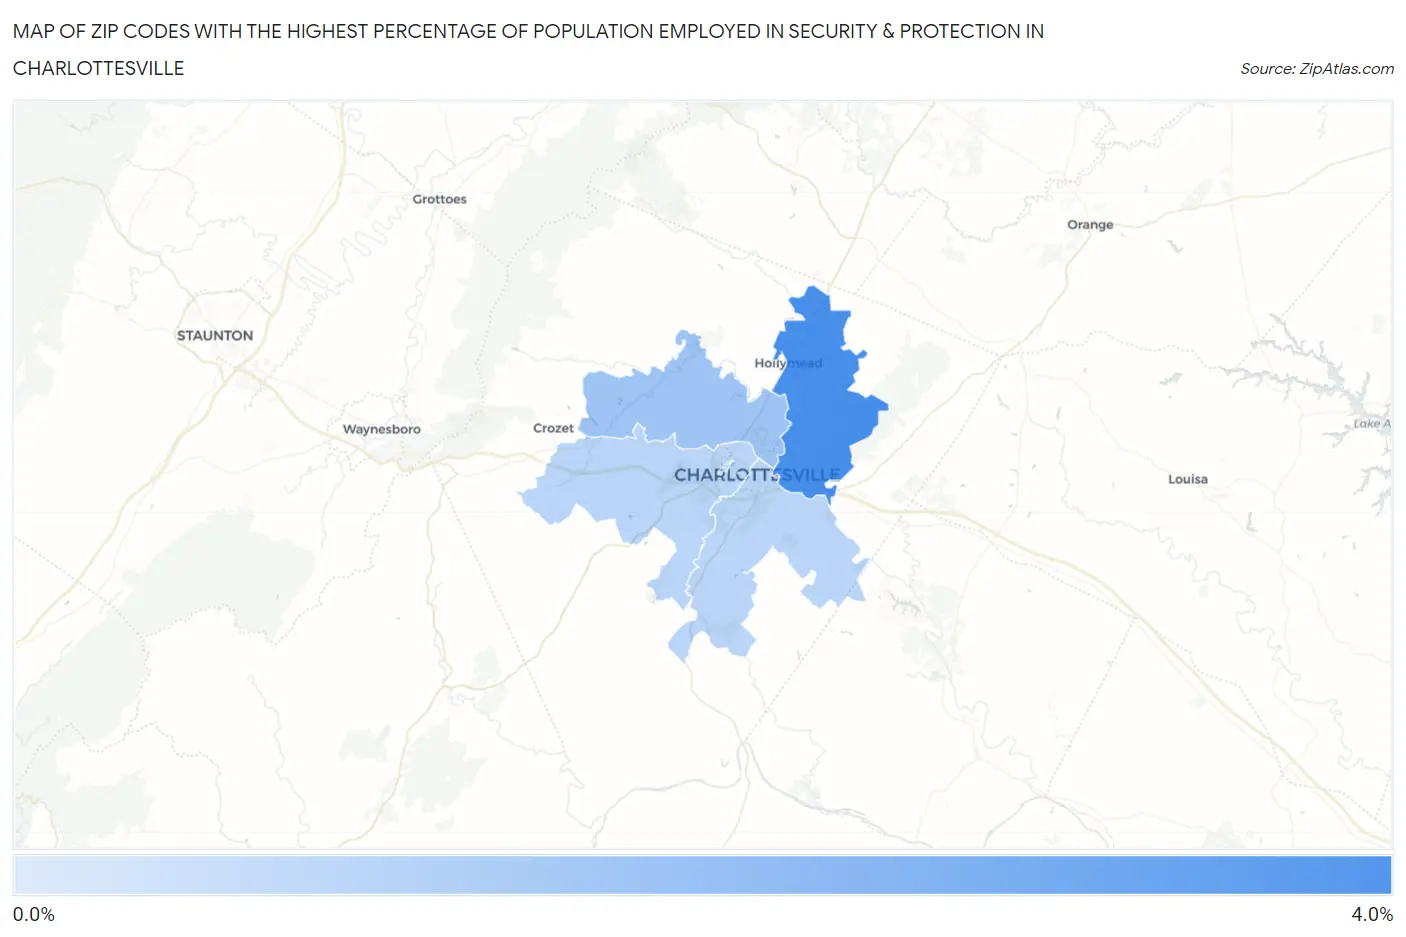
Map of Zip Codes with the Highest Percentage of Population Employed in Security & Protection in Charlottesville
0.66%
3.8%
Zip Codes with the Highest Percentage of Population Employed in Security & Protection in Charlottesville, VA
| Zip Code | % Employed | vs State | vs National | |
| 1. | 22911 | 3.8% | 2.7%(+1.08)#215 | 2.1%(+1.61)#5,003 |
| 2. | 22901 | 1.9% | 2.7%(-0.740)#449 | 2.1%(-0.206)#12,931 |
| 3. | 22903 | 1.4% | 2.7%(-1.29)#543 | 2.1%(-0.758)#17,020 |
| 4. | 22902 | 1.4% | 2.7%(-1.31)#546 | 2.1%(-0.775)#17,157 |
| 5. | 22904 | 0.66% | 2.7%(-2.02)#619 | 2.1%(-1.49)#22,319 |
1
Common Questions
What are the Top 3 Zip Codes with the Highest Percentage of Population Employed in Security & Protection in Charlottesville, VA?
Top 3 Zip Codes with the Highest Percentage of Population Employed in Security & Protection in Charlottesville, VA are:
What zip code has the Highest Percentage of Population Employed in Security & Protection in Charlottesville, VA?
22911 has the Highest Percentage of Population Employed in Security & Protection in Charlottesville, VA with 3.8%.
What is the Percentage of Population Employed in Security & Protection in Charlottesville, VA?
Percentage of Population Employed in Security & Protection in Charlottesville is 1.2%.
What is the Percentage of Population Employed in Security & Protection in Virginia?
Percentage of Population Employed in Security & Protection in Virginia is 2.7%.
What is the Percentage of Population Employed in Security & Protection in the United States?
Percentage of Population Employed in Security & Protection in the United States is 2.1%.