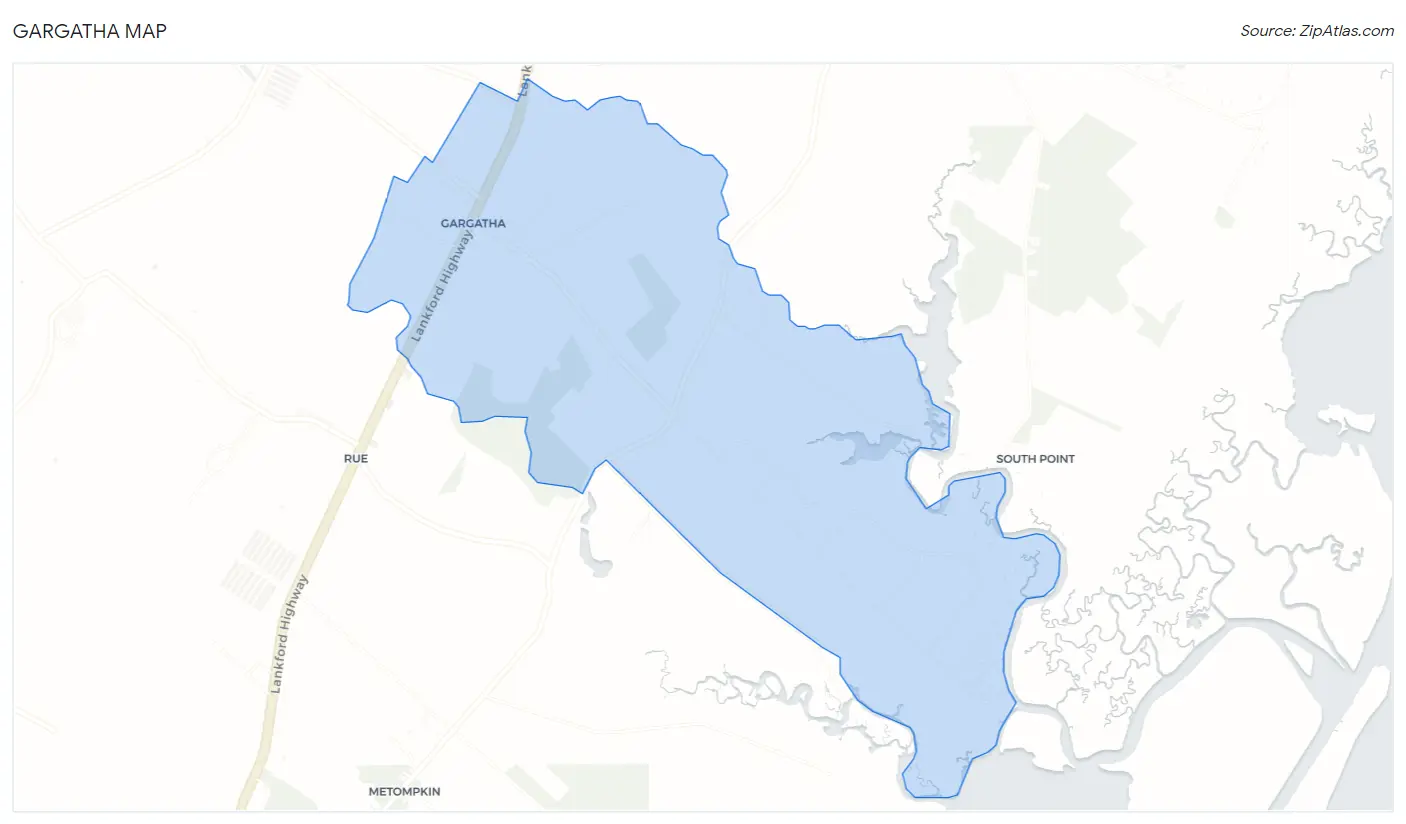
Gargatha, VA Map & Demographics
Gargatha Map
Gargatha Overview
$35,153
PER CAPITA INCOME
$79,375
AVG HOUSEHOLD INCOME
0.39
INEQUALITY / GINI INDEX
634
TOTAL POPULATION
292
MALE POPULATION
342
FEMALE POPULATION
85.38
MALES / 100 FEMALES
117.12
FEMALES / 100 MALES
49.7
MEDIAN AGE
3.0
AVG FAMILY SIZE
2.2
AVG HOUSEHOLD SIZE
324
LABOR FORCE [ PEOPLE ]
67.5%
PERCENT IN LABOR FORCE
Income in Gargatha
Income Overview in Gargatha
| Characteristic | Number | Measure |
| Per Capita Income | 634 | $35,153 |
| Median Family Income | 149 | $0 |
| Mean Family Income | 149 | $57,644 |
| Median Household Income | 290 | $79,375 |
| Mean Household Income | 290 | $77,341 |
| Income Deficit | 149 | $0 |
| Wage / Income Gap (%) | 634 | 0.00% |
| Wage / Income Gap ($) | 634 | 100.00¢ per $1 |
| Gini / Inequality Index | 634 | 0.39 |
Earnings by Sex in Gargatha
| Sex | Number | Average Earnings |
| Male | 98 (30.2%) | $0 |
| Female | 226 (69.8%) | $0 |
| Total | 324 (100.0%) | $0 |
Earnings by Sex by Income Bracket in Gargatha
The most common earnings brackets in Gargatha are $100,000+ for men (44 | 44.9%) and $75,000 to $99,999 for women (59 | 26.1%).
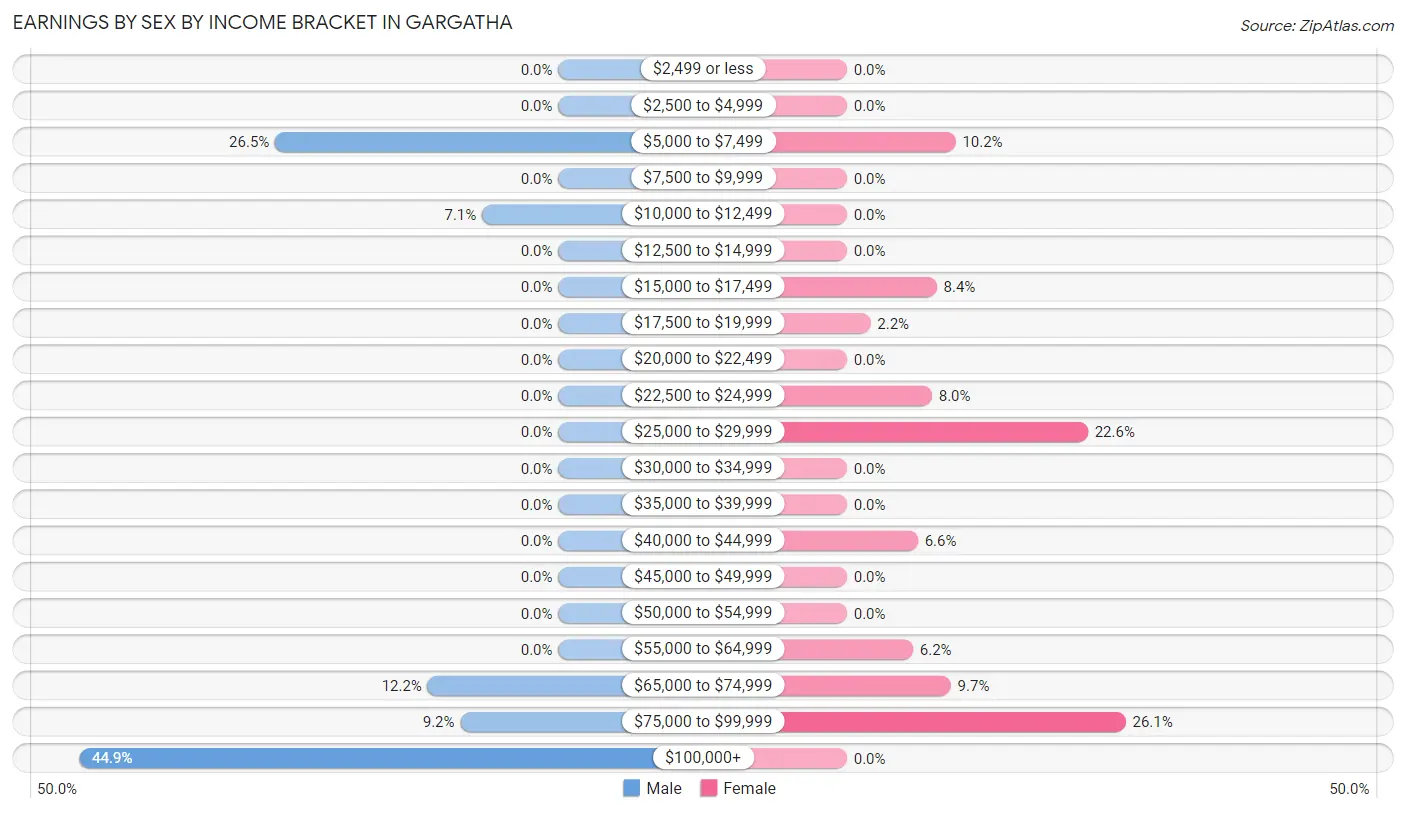
| Income | Male | Female |
| $2,499 or less | 0 (0.0%) | 0 (0.0%) |
| $2,500 to $4,999 | 0 (0.0%) | 0 (0.0%) |
| $5,000 to $7,499 | 26 (26.5%) | 23 (10.2%) |
| $7,500 to $9,999 | 0 (0.0%) | 0 (0.0%) |
| $10,000 to $12,499 | 7 (7.1%) | 0 (0.0%) |
| $12,500 to $14,999 | 0 (0.0%) | 0 (0.0%) |
| $15,000 to $17,499 | 0 (0.0%) | 19 (8.4%) |
| $17,500 to $19,999 | 0 (0.0%) | 5 (2.2%) |
| $20,000 to $22,499 | 0 (0.0%) | 0 (0.0%) |
| $22,500 to $24,999 | 0 (0.0%) | 18 (8.0%) |
| $25,000 to $29,999 | 0 (0.0%) | 51 (22.6%) |
| $30,000 to $34,999 | 0 (0.0%) | 0 (0.0%) |
| $35,000 to $39,999 | 0 (0.0%) | 0 (0.0%) |
| $40,000 to $44,999 | 0 (0.0%) | 15 (6.6%) |
| $45,000 to $49,999 | 0 (0.0%) | 0 (0.0%) |
| $50,000 to $54,999 | 0 (0.0%) | 0 (0.0%) |
| $55,000 to $64,999 | 0 (0.0%) | 14 (6.2%) |
| $65,000 to $74,999 | 12 (12.2%) | 22 (9.7%) |
| $75,000 to $99,999 | 9 (9.2%) | 59 (26.1%) |
| $100,000+ | 44 (44.9%) | 0 (0.0%) |
| Total | 98 (100.0%) | 226 (100.0%) |
Earnings by Sex by Educational Attainment in Gargatha
| Educational Attainment | Male Income | Female Income |
| Less than High School | - | - |
| High School Diploma | - | - |
| College or Associate's Degree | - | - |
| Bachelor's Degree | - | - |
| Graduate Degree | - | - |
| Total | - | - |
Family Income in Gargatha
Family Income Brackets in Gargatha
According to the Gargatha family income data, there are 51 families falling into the $25,000 to $34,999 income range, which is the most common income bracket and makes up 34.2% of all families.
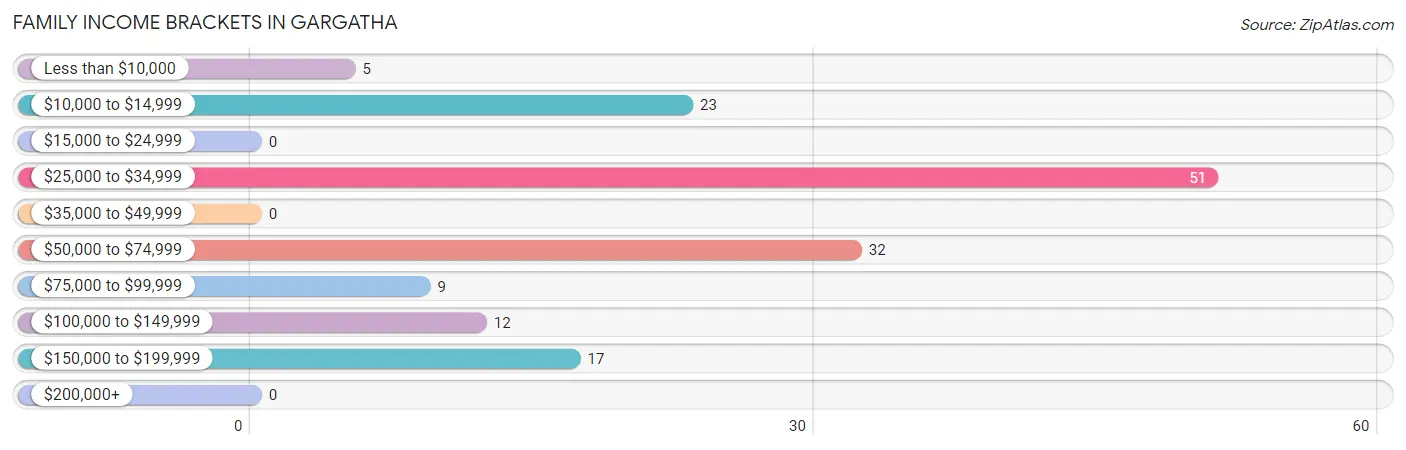
| Income Bracket | # Families | % Families |
| Less than $10,000 | 5 | 3.4% |
| $10,000 to $14,999 | 23 | 15.4% |
| $15,000 to $24,999 | 0 | 0.0% |
| $25,000 to $34,999 | 51 | 34.2% |
| $35,000 to $49,999 | 0 | 0.0% |
| $50,000 to $74,999 | 32 | 21.5% |
| $75,000 to $99,999 | 9 | 6.0% |
| $100,000 to $149,999 | 12 | 8.1% |
| $150,000 to $199,999 | 17 | 11.4% |
| $200,000+ | 0 | 0.0% |
Family Income by Famaliy Size in Gargatha
4-person families (34 | 22.8%) account for the highest median family income in Gargatha with $74,861 per family, while 4-person families (34 | 22.8%) have the highest median income of $18,715 per family member.
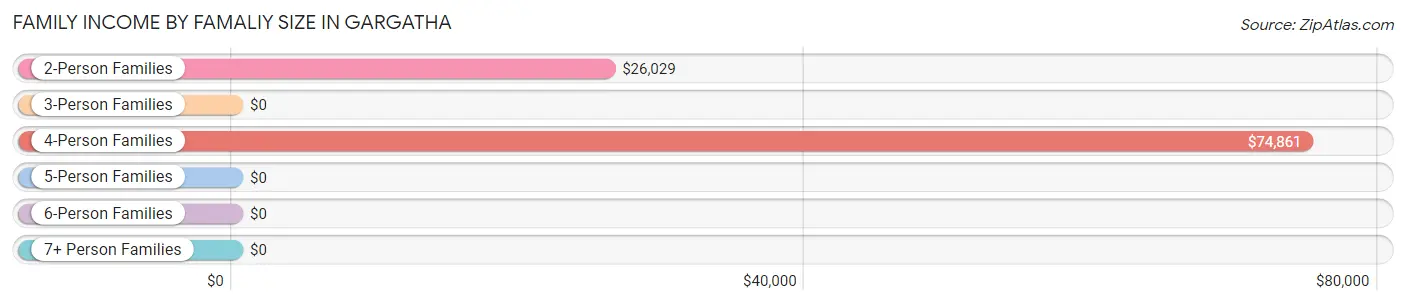
| Income Bracket | # Families | Median Income |
| 2-Person Families | 98 (65.8%) | $26,029 |
| 3-Person Families | 17 (11.4%) | $0 |
| 4-Person Families | 34 (22.8%) | $74,861 |
| 5-Person Families | 0 (0.0%) | $0 |
| 6-Person Families | 0 (0.0%) | $0 |
| 7+ Person Families | 0 (0.0%) | $0 |
| Total | 149 (100.0%) | $0 |
Family Income by Number of Earners in Gargatha
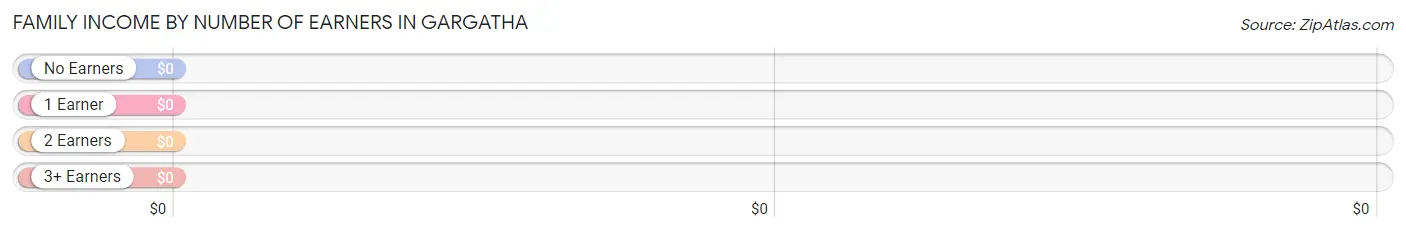
| Number of Earners | # Families | Median Income |
| No Earners | 5 (3.4%) | $0 |
| 1 Earner | 88 (59.1%) | $0 |
| 2 Earners | 52 (34.9%) | $0 |
| 3+ Earners | 4 (2.7%) | $0 |
| Total | 149 (100.0%) | $0 |
Household Income in Gargatha
Household Income Brackets in Gargatha
With 68 households falling in the category, the $75,000 to $99,999 income range is the most frequent in Gargatha, accounting for 23.4% of all households.
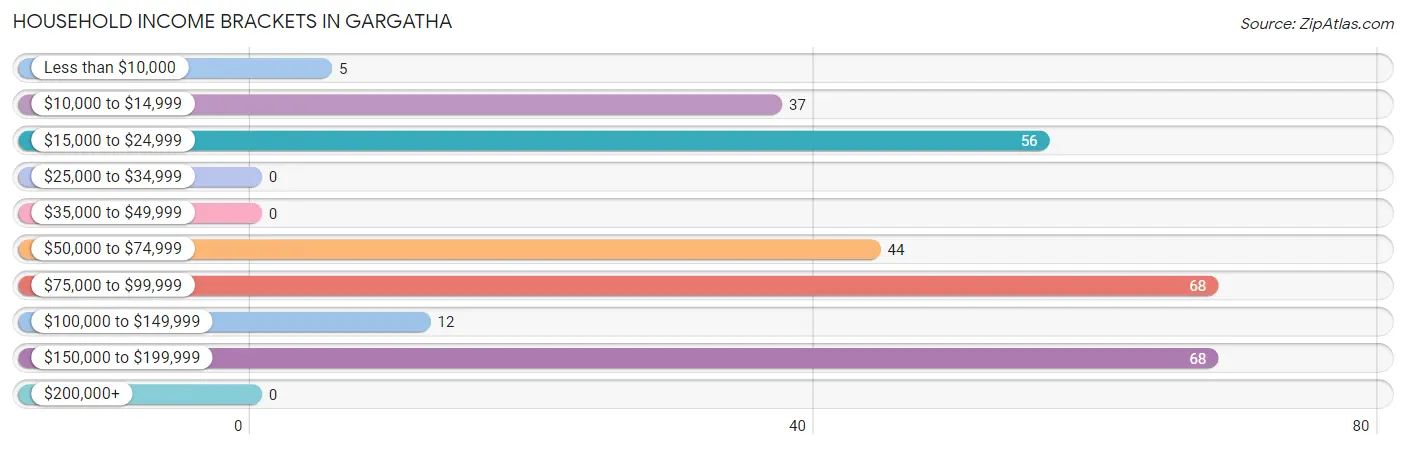
| Income Bracket | # Households | % Households |
| Less than $10,000 | 5 | 1.7% |
| $10,000 to $14,999 | 37 | 12.8% |
| $15,000 to $24,999 | 56 | 19.3% |
| $25,000 to $34,999 | 0 | 0.0% |
| $35,000 to $49,999 | 0 | 0.0% |
| $50,000 to $74,999 | 44 | 15.2% |
| $75,000 to $99,999 | 68 | 23.4% |
| $100,000 to $149,999 | 12 | 4.1% |
| $150,000 to $199,999 | 68 | 23.4% |
| $200,000+ | 0 | 0.0% |
Household Income by Householder Age in Gargatha
The median household income in Gargatha is $79,375, with the highest median household income of $111,563 found in the 25 to 44 years age bracket for the primary householder. A total of 43 households (14.8%) fall into this category.
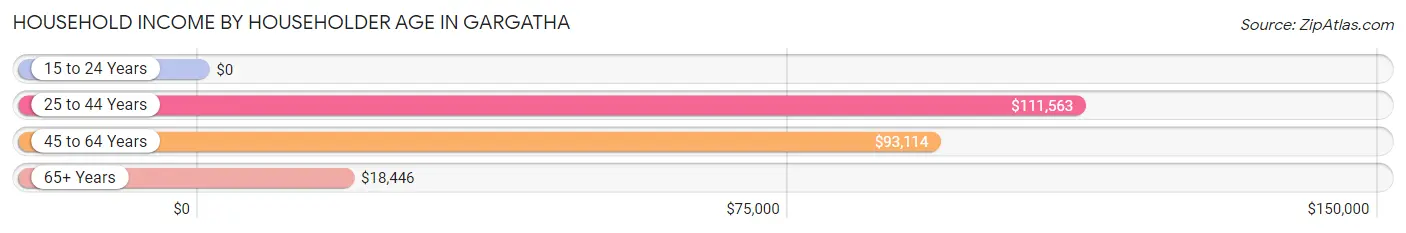
| Income Bracket | # Households | Median Income |
| 15 to 24 Years | 0 (0.0%) | $0 |
| 25 to 44 Years | 43 (14.8%) | $111,563 |
| 45 to 64 Years | 191 (65.9%) | $93,114 |
| 65+ Years | 56 (19.3%) | $18,446 |
| Total | 290 (100.0%) | $79,375 |
Poverty in Gargatha
Income Below Poverty by Sex and Age in Gargatha
With 11.6% poverty level for males and 8.2% for females among the residents of Gargatha, 55 to 64 year old males and 55 to 64 year old females are the most vulnerable to poverty, with 34 males (65.4%) and 23 females (45.1%) in their respective age groups living below the poverty level.
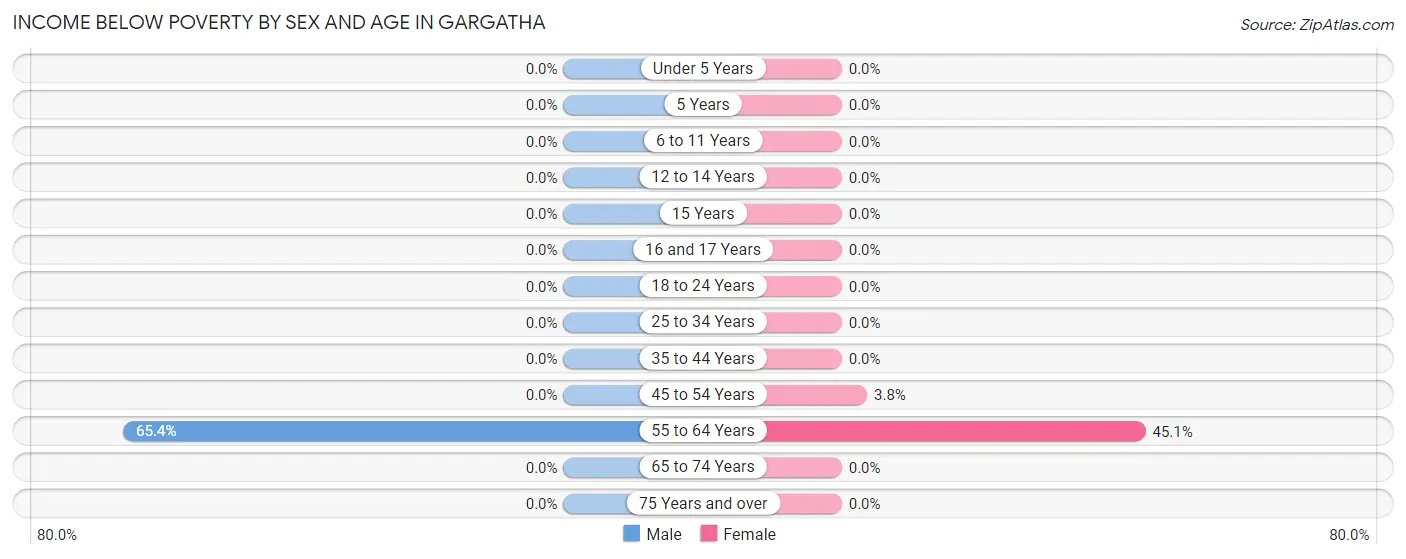
| Age Bracket | Male | Female |
| Under 5 Years | 0 (0.0%) | 0 (0.0%) |
| 5 Years | 0 (0.0%) | 0 (0.0%) |
| 6 to 11 Years | 0 (0.0%) | 0 (0.0%) |
| 12 to 14 Years | 0 (0.0%) | 0 (0.0%) |
| 15 Years | 0 (0.0%) | 0 (0.0%) |
| 16 and 17 Years | 0 (0.0%) | 0 (0.0%) |
| 18 to 24 Years | 0 (0.0%) | 0 (0.0%) |
| 25 to 34 Years | 0 (0.0%) | 0 (0.0%) |
| 35 to 44 Years | 0 (0.0%) | 0 (0.0%) |
| 45 to 54 Years | 0 (0.0%) | 5 (3.8%) |
| 55 to 64 Years | 34 (65.4%) | 23 (45.1%) |
| 65 to 74 Years | 0 (0.0%) | 0 (0.0%) |
| 75 Years and over | 0 (0.0%) | 0 (0.0%) |
| Total | 34 (11.6%) | 28 (8.2%) |
Income Above Poverty by Sex and Age in Gargatha
According to the poverty statistics in Gargatha, males aged under 5 years and females aged 6 to 11 years are the age groups that are most secure financially, with 100.0% of males and 100.0% of females in these age groups living above the poverty line.
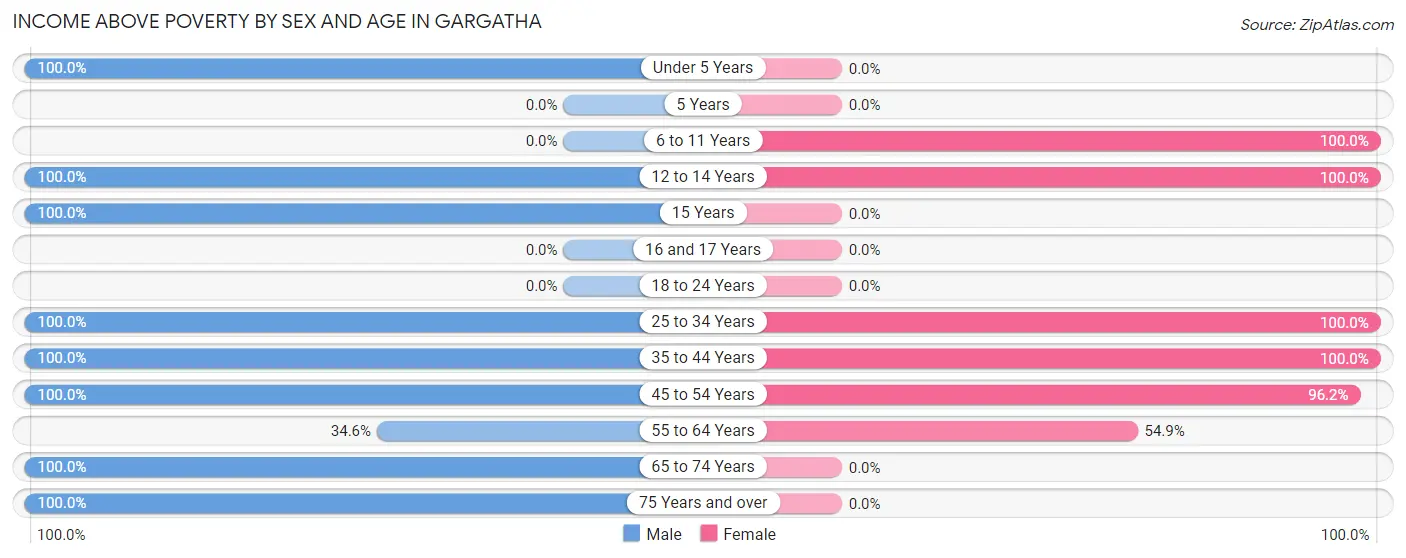
| Age Bracket | Male | Female |
| Under 5 Years | 21 (100.0%) | 0 (0.0%) |
| 5 Years | 0 (0.0%) | 0 (0.0%) |
| 6 to 11 Years | 0 (0.0%) | 61 (100.0%) |
| 12 to 14 Years | 6 (100.0%) | 50 (100.0%) |
| 15 Years | 16 (100.0%) | 0 (0.0%) |
| 16 and 17 Years | 0 (0.0%) | 0 (0.0%) |
| 18 to 24 Years | 0 (0.0%) | 0 (0.0%) |
| 25 to 34 Years | 9 (100.0%) | 22 (100.0%) |
| 35 to 44 Years | 56 (100.0%) | 25 (100.0%) |
| 45 to 54 Years | 12 (100.0%) | 128 (96.2%) |
| 55 to 64 Years | 18 (34.6%) | 28 (54.9%) |
| 65 to 74 Years | 106 (100.0%) | 0 (0.0%) |
| 75 Years and over | 14 (100.0%) | 0 (0.0%) |
| Total | 258 (88.4%) | 314 (91.8%) |
Income Below Poverty Among Married-Couple Families in Gargatha
The poverty statistics for married-couple families in Gargatha show that 35.0% or 28 of the total 80 families live below the poverty line. Families with no children have the highest poverty rate of 59.6%, comprising of 28 families. On the other hand, families with 1 or 2 children have the lowest poverty rate of 0.0%, which includes 0 families.
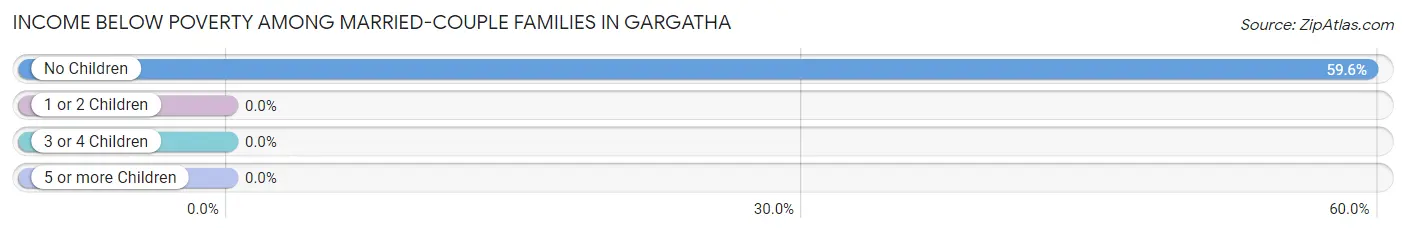
| Children | Above Poverty | Below Poverty |
| No Children | 19 (40.4%) | 28 (59.6%) |
| 1 or 2 Children | 33 (100.0%) | 0 (0.0%) |
| 3 or 4 Children | 0 (0.0%) | 0 (0.0%) |
| 5 or more Children | 0 (0.0%) | 0 (0.0%) |
| Total | 52 (65.0%) | 28 (35.0%) |
Income Below Poverty Among Single-Parent Households in Gargatha
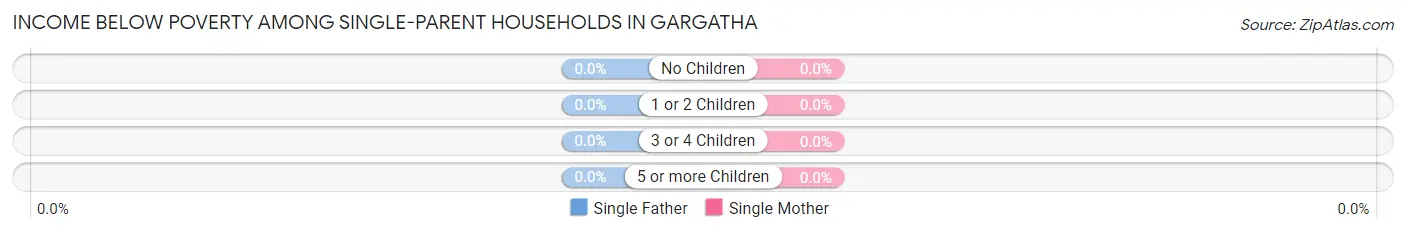
| Children | Single Father | Single Mother |
| No Children | 0 (0.0%) | 0 (0.0%) |
| 1 or 2 Children | 0 (0.0%) | 0 (0.0%) |
| 3 or 4 Children | 0 (0.0%) | 0 (0.0%) |
| 5 or more Children | 0 (0.0%) | 0 (0.0%) |
| Total | 0 (0.0%) | 0 (0.0%) |
Income Below Poverty Among Married-Couple vs Single-Parent Households in Gargatha
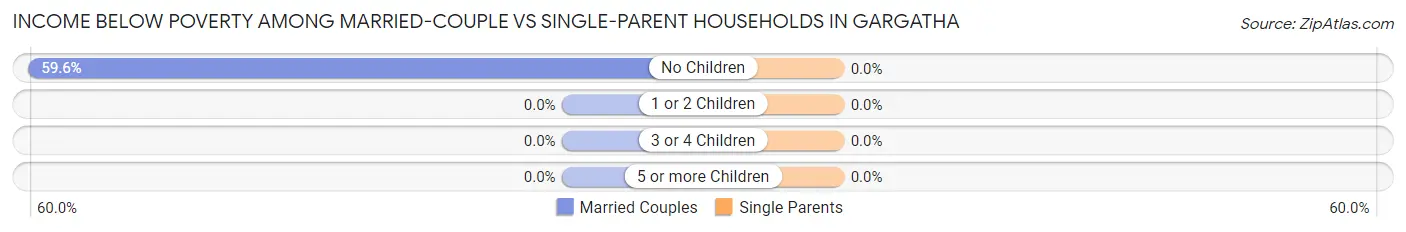
| Children | Married-Couple Families | Single-Parent Households |
| No Children | 28 (59.6%) | 0 (0.0%) |
| 1 or 2 Children | 0 (0.0%) | 0 (0.0%) |
| 3 or 4 Children | 0 (0.0%) | 0 (0.0%) |
| 5 or more Children | 0 (0.0%) | 0 (0.0%) |
| Total | 28 (35.0%) | 0 (0.0%) |
Race in Gargatha
The most populous races in Gargatha are Black / African American (275 | 43.4%), White / Caucasian (261 | 41.2%), and Two or more Races (98 | 15.5%).
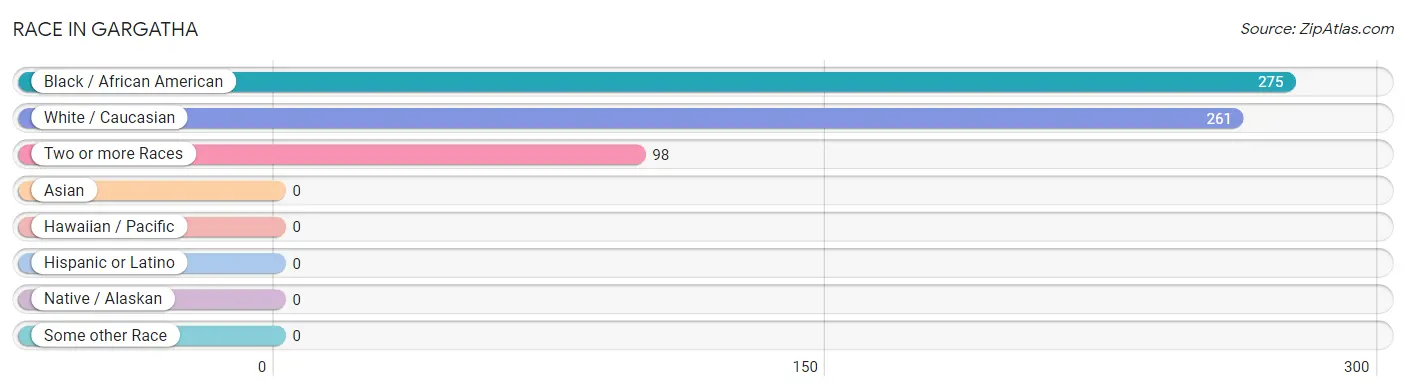
| Race | # Population | % Population |
| Asian | 0 | 0.0% |
| Black / African American | 275 | 43.4% |
| Hawaiian / Pacific | 0 | 0.0% |
| Hispanic or Latino | 0 | 0.0% |
| Native / Alaskan | 0 | 0.0% |
| White / Caucasian | 261 | 41.2% |
| Two or more Races | 98 | 15.5% |
| Some other Race | 0 | 0.0% |
| Total | 634 | 100.0% |
Ancestry in Gargatha
The most populous ancestries reported in Gargatha are American (323 | 50.9%), African (145 | 22.9%), Subsaharan African (145 | 22.9%), English (49 | 7.7%), and German (47 | 7.4%), together accounting for 111.8% of all Gargatha residents.
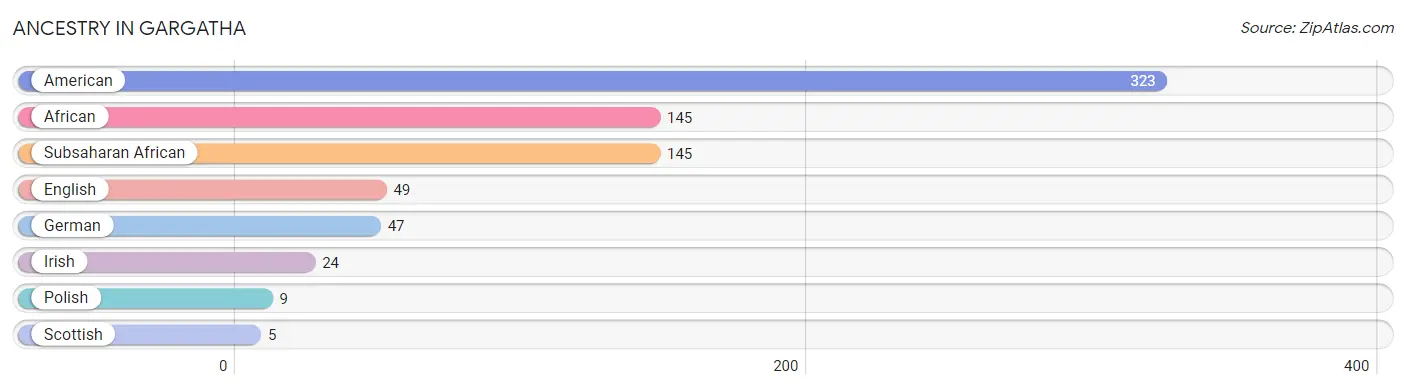
| Ancestry | # Population | % Population |
| African | 145 | 22.9% |
| American | 323 | 50.9% |
| English | 49 | 7.7% |
| German | 47 | 7.4% |
| Irish | 24 | 3.8% |
| Polish | 9 | 1.4% |
| Scottish | 5 | 0.8% |
| Subsaharan African | 145 | 22.9% | View All 8 Rows |
Immigrants in Gargatha

| Immigration Origin | # Population | % Population | View All 0 Rows |
Sex and Age in Gargatha
Sex and Age in Gargatha
The most populous age groups in Gargatha are 70 to 74 Years (69 | 23.6%) for men and 10 to 14 Years (111 | 32.5%) for women.
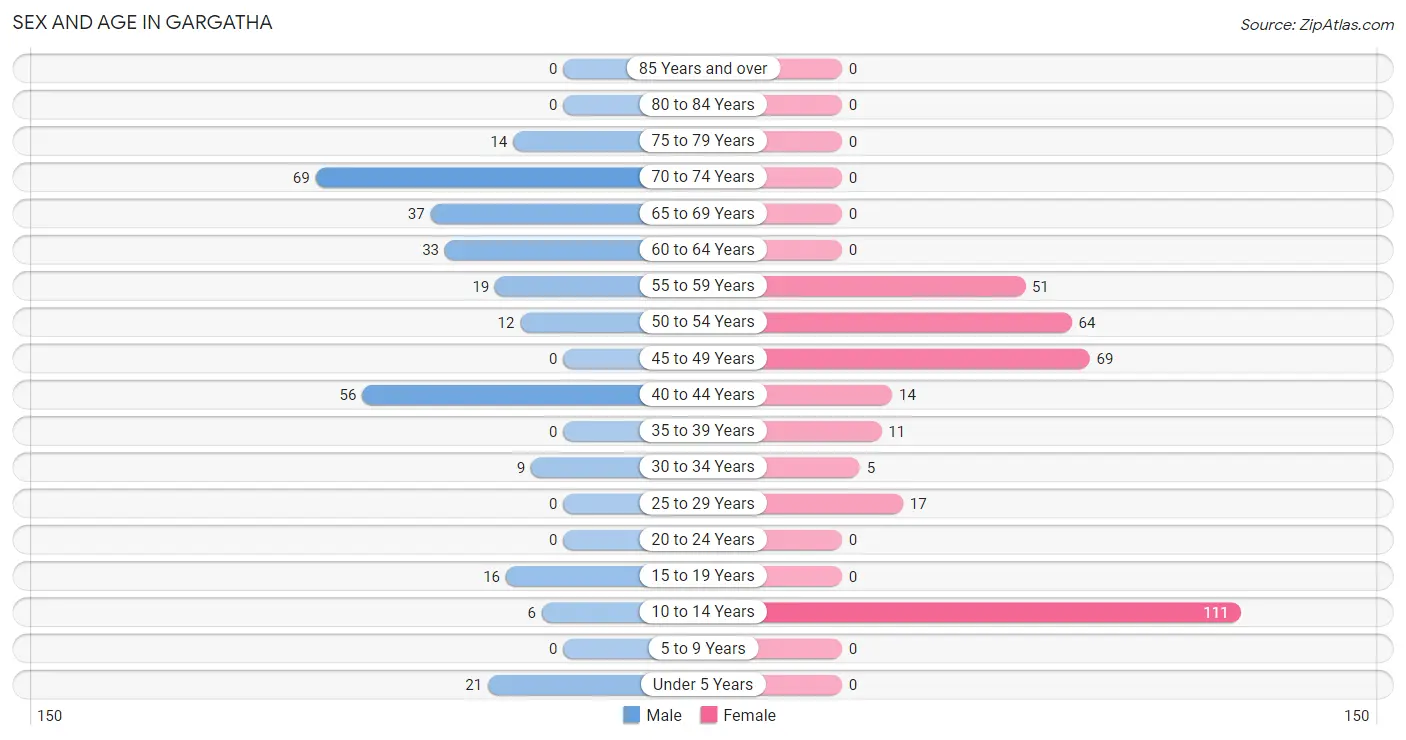
| Age Bracket | Male | Female |
| Under 5 Years | 21 (7.2%) | 0 (0.0%) |
| 5 to 9 Years | 0 (0.0%) | 0 (0.0%) |
| 10 to 14 Years | 6 (2.1%) | 111 (32.5%) |
| 15 to 19 Years | 16 (5.5%) | 0 (0.0%) |
| 20 to 24 Years | 0 (0.0%) | 0 (0.0%) |
| 25 to 29 Years | 0 (0.0%) | 17 (5.0%) |
| 30 to 34 Years | 9 (3.1%) | 5 (1.5%) |
| 35 to 39 Years | 0 (0.0%) | 11 (3.2%) |
| 40 to 44 Years | 56 (19.2%) | 14 (4.1%) |
| 45 to 49 Years | 0 (0.0%) | 69 (20.2%) |
| 50 to 54 Years | 12 (4.1%) | 64 (18.7%) |
| 55 to 59 Years | 19 (6.5%) | 51 (14.9%) |
| 60 to 64 Years | 33 (11.3%) | 0 (0.0%) |
| 65 to 69 Years | 37 (12.7%) | 0 (0.0%) |
| 70 to 74 Years | 69 (23.6%) | 0 (0.0%) |
| 75 to 79 Years | 14 (4.8%) | 0 (0.0%) |
| 80 to 84 Years | 0 (0.0%) | 0 (0.0%) |
| 85 Years and over | 0 (0.0%) | 0 (0.0%) |
| Total | 292 (100.0%) | 342 (100.0%) |
Families and Households in Gargatha
Median Family Size in Gargatha
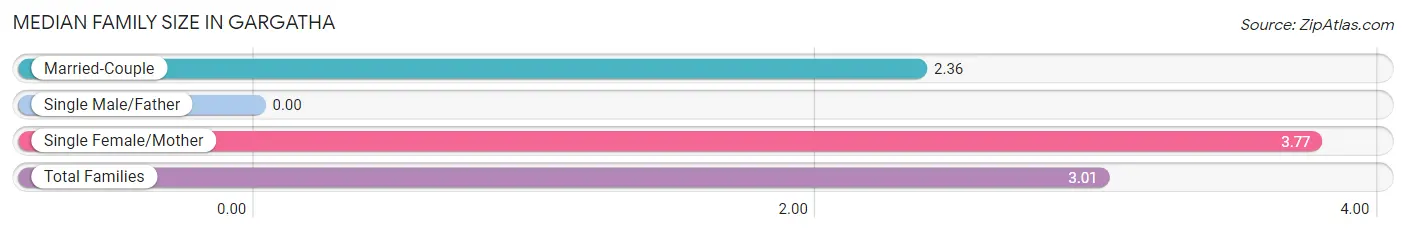
| Family Type | # Families | Family Size |
| Married-Couple | 80 (53.7%) | 2.36 |
| Single Male/Father | 0 (0.0%) | - |
| Single Female/Mother | 69 (46.3%) | 3.77 |
| Total Families | 149 (100.0%) | 3.01 |
Median Household Size in Gargatha
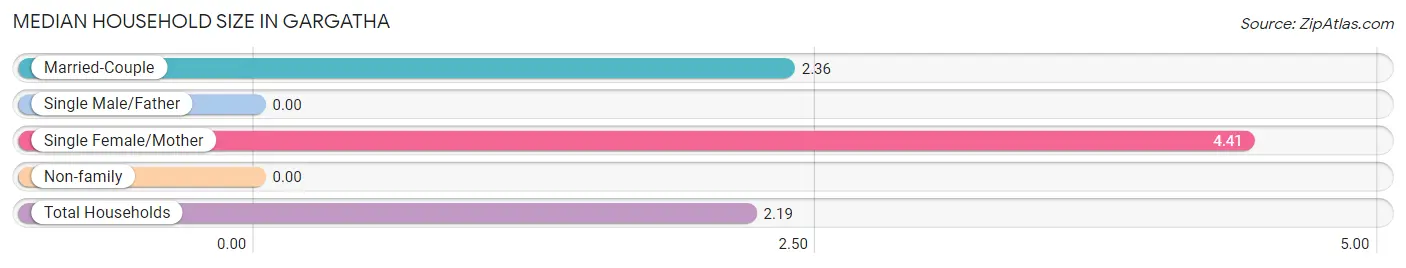
| Household Type | # Households | Household Size |
| Married-Couple | 80 (27.6%) | 2.36 |
| Single Male/Father | 0 (0.0%) | - |
| Single Female/Mother | 69 (23.8%) | 4.41 |
| Non-family | 141 (48.6%) | - |
| Total Households | 290 (100.0%) | 2.19 |
Household Size by Marriage Status in Gargatha
Out of a total of 290 households in Gargatha, 149 (51.4%) are family households, while 141 (48.6%) are nonfamily households. The most numerous type of family households are 3-person households, comprising 68, and the most common type of nonfamily households are 1-person households, comprising 141.
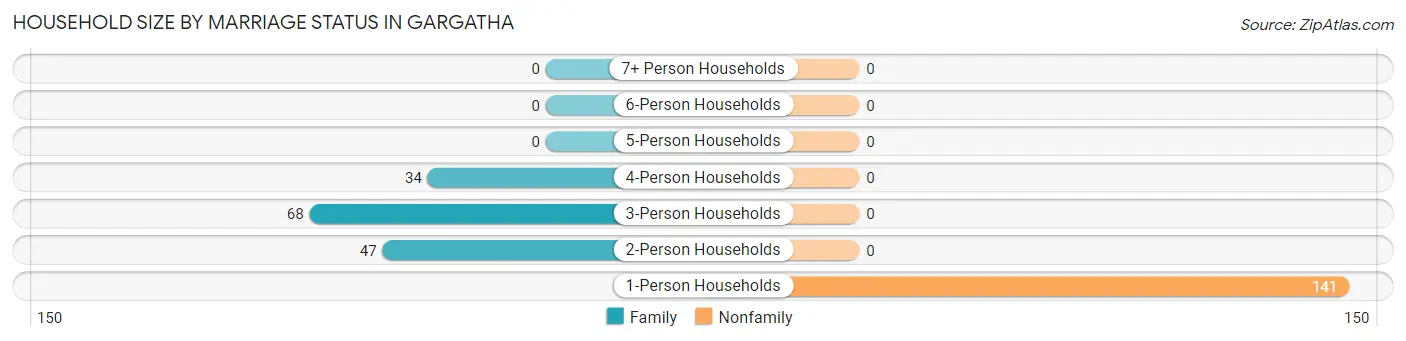
| Household Size | Family Households | Nonfamily Households |
| 1-Person Households | - | 141 (48.6%) |
| 2-Person Households | 47 (16.2%) | 0 (0.0%) |
| 3-Person Households | 68 (23.4%) | 0 (0.0%) |
| 4-Person Households | 34 (11.7%) | 0 (0.0%) |
| 5-Person Households | 0 (0.0%) | 0 (0.0%) |
| 6-Person Households | 0 (0.0%) | 0 (0.0%) |
| 7+ Person Households | 0 (0.0%) | 0 (0.0%) |
| Total | 149 (51.4%) | 141 (48.6%) |
Female Fertility in Gargatha
Fertility by Age in Gargatha
Average fertility rate in Gargatha is 95.0 births per 1,000 women. Women in the age bracket of 35 to 50 years have the highest fertility rate with 117.0 births per 1,000 women. Women in the age bracket of 35 to 50 years acount for 100.0% of all women with births.
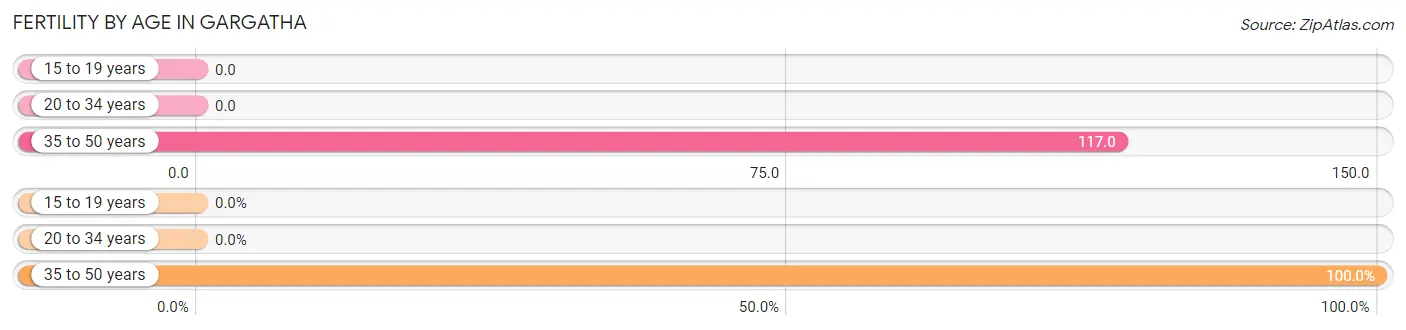
| Age Bracket | Women with Births | Births / 1,000 Women |
| 15 to 19 years | 0 (0.0%) | 0.0 |
| 20 to 34 years | 0 (0.0%) | 0.0 |
| 35 to 50 years | 11 (100.0%) | 117.0 |
| Total | 11 (100.0%) | 95.0 |
Fertility by Age by Marriage Status in Gargatha
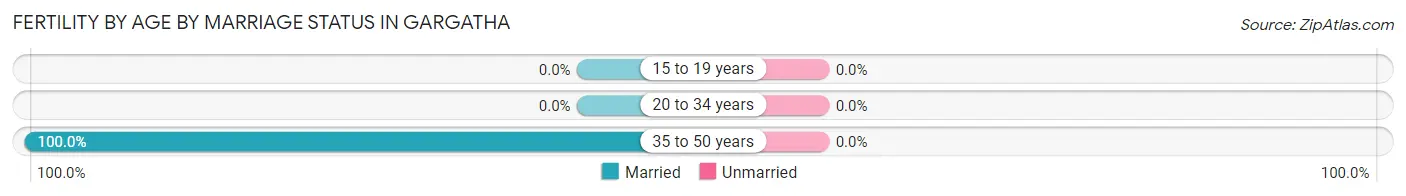
| Age Bracket | Married | Unmarried |
| 15 to 19 years | 0 (0.0%) | 0 (0.0%) |
| 20 to 34 years | 0 (0.0%) | 0 (0.0%) |
| 35 to 50 years | 11 (100.0%) | 0 (0.0%) |
| Total | 11 (100.0%) | 0 (0.0%) |
Fertility by Education in Gargatha
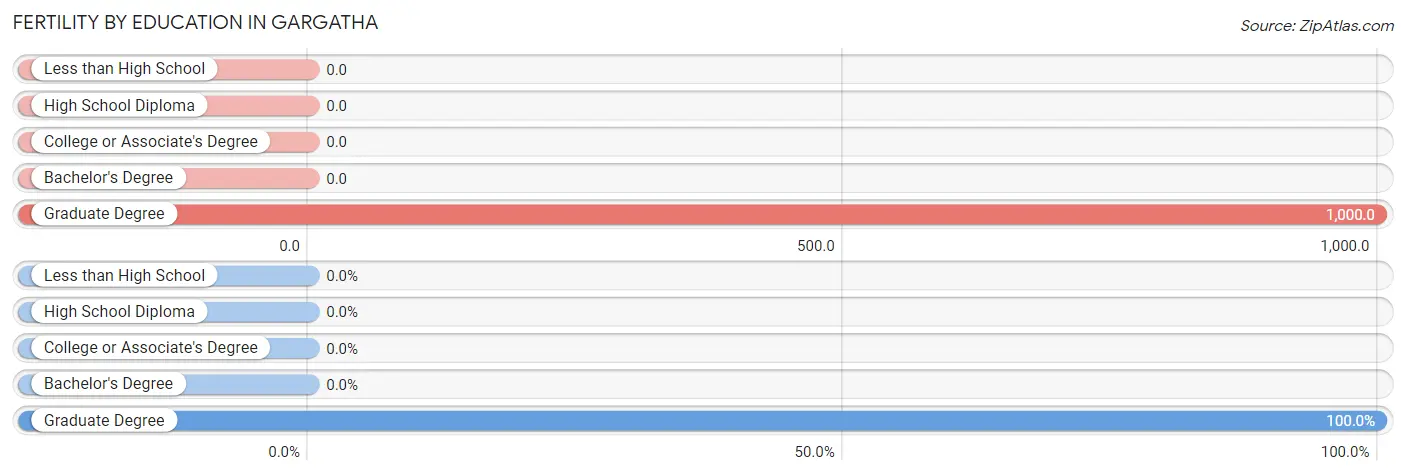
| Educational Attainment | Women with Births | Births / 1,000 Women |
| Less than High School | 0 (0.0%) | 0.0 |
| High School Diploma | 0 (0.0%) | 0.0 |
| College or Associate's Degree | 0 (0.0%) | 0.0 |
| Bachelor's Degree | 0 (0.0%) | 0.0 |
| Graduate Degree | 11 (100.0%) | 1,000.0 |
| Total | 11 (100.0%) | 95.0 |
Fertility by Education by Marriage Status in Gargatha
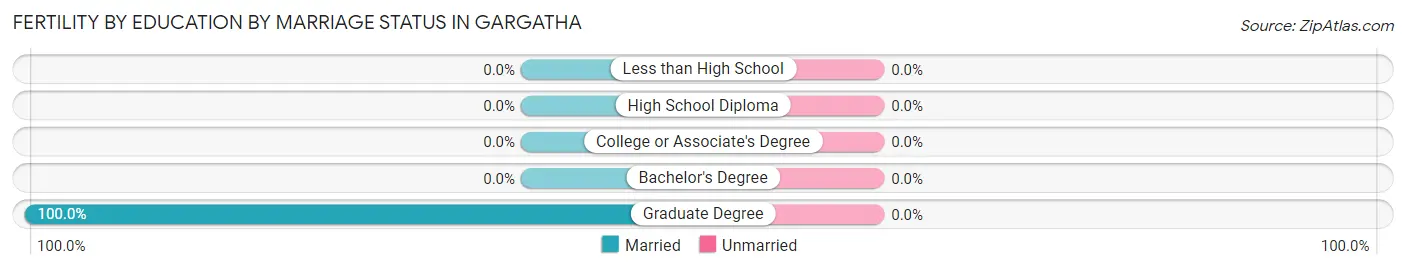
| Educational Attainment | Married | Unmarried |
| Less than High School | 0 (0.0%) | 0 (0.0%) |
| High School Diploma | 0 (0.0%) | 0 (0.0%) |
| College or Associate's Degree | 0 (0.0%) | 0 (0.0%) |
| Bachelor's Degree | 0 (0.0%) | 0 (0.0%) |
| Graduate Degree | 11 (100.0%) | 0 (0.0%) |
| Total | 11 (100.0%) | 0 (0.0%) |
Employment Characteristics in Gargatha
Employment by Class of Employer in Gargatha
Among the 324 employed individuals in Gargatha, private company employees (138 | 42.6%), not-for-profit organizations (99 | 30.6%), and local government employees (65 | 20.1%) make up the most common classes of employment.
| Employer Class | # Employees | % Employees |
| Private Company Employees | 138 | 42.6% |
| Self-Employed (Incorporated) | 0 | 0.0% |
| Self-Employed (Not Incorporated) | 0 | 0.0% |
| Not-for-profit Organizations | 99 | 30.6% |
| Local Government Employees | 65 | 20.1% |
| State Government Employees | 5 | 1.5% |
| Federal Government Employees | 17 | 5.2% |
| Unpaid Family Workers | 0 | 0.0% |
| Total | 324 | 100.0% |
Employment Status by Age in Gargatha
| Age Bracket | In Labor Force | Unemployed |
| 16 to 19 Years | 0 (0.0%) | 0 (0.0%) |
| 20 to 24 Years | 0 (0.0%) | 0 (0.0%) |
| 25 to 29 Years | 17 (100.0%) | 0 (0.0%) |
| 30 to 34 Years | 14 (100.0%) | 0 (0.0%) |
| 35 to 44 Years | 81 (100.0%) | 0 (0.0%) |
| 45 to 54 Years | 128 (88.3%) | 0 (0.0%) |
| 55 to 59 Years | 51 (72.9%) | 0 (0.0%) |
| 60 to 64 Years | 33 (100.0%) | 0 (0.0%) |
| 65 to 74 Years | 0 (0.0%) | 0 (0.0%) |
| 75 Years and over | 0 (0.0%) | 0 (0.0%) |
| Total | 324 (67.5%) | 0 (0.0%) |
Employment Status by Educational Attainment in Gargatha
| Educational Attainment | In Labor Force | Unemployed |
| Less than High School | 7 (100.0%) | 0 (0.0%) |
| High School Diploma | 191 (94.6%) | 0 (0.0%) |
| College / Associate Degree | 30 (63.8%) | 0 (0.0%) |
| Bachelor's Degree or higher | 96 (92.3%) | 0 (0.0%) |
| Total | 324 (90.0%) | 0 (0.0%) |
Employment Occupations by Sex in Gargatha
Management, Business, Science and Arts Occupations
The most common Management, Business, Science and Arts occupations in Gargatha are Management (120 | 37.0%), Community & Social Service (23 | 7.1%), Education, Arts & Media (12 | 3.7%), Education Instruction & Library (11 | 3.4%), and Health Diagnosing & Treating (4 | 1.2%).
Management, Business, Science and Arts Occupations by Sex
Within the Management, Business, Science and Arts occupations in Gargatha, the most male-oriented occupations are Education, Arts & Media (100.0%), Community & Social Service (52.2%), and Management (36.7%), while the most female-oriented occupations are Education Instruction & Library (100.0%), Health Diagnosing & Treating (100.0%), and Management (63.3%).
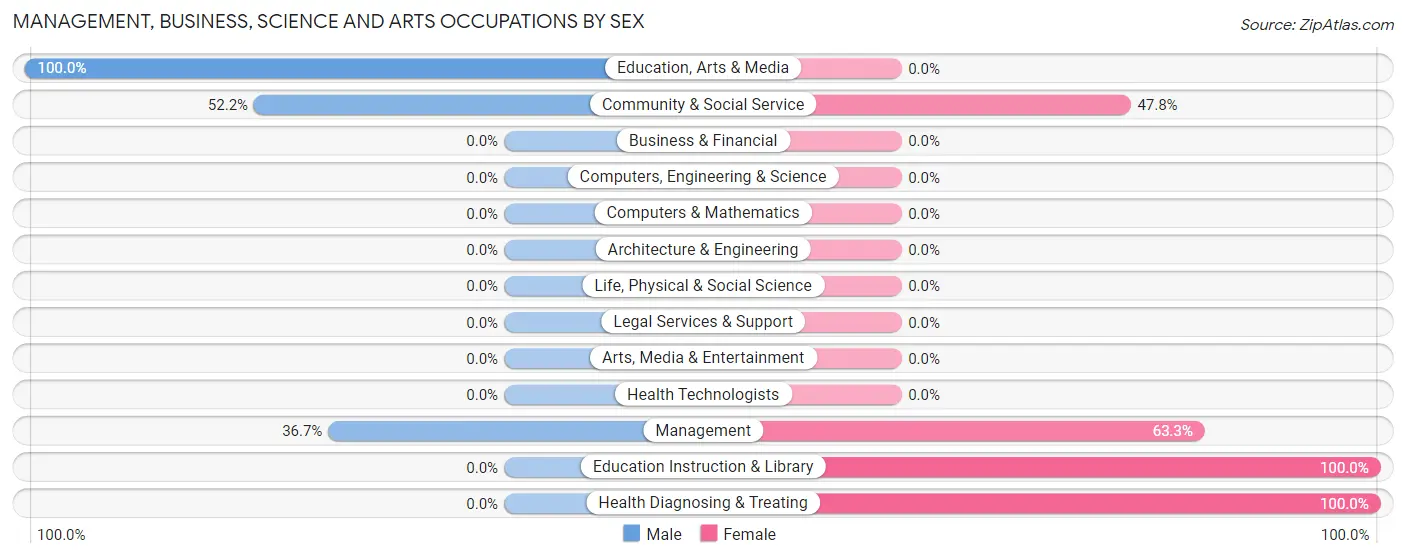
| Occupation | Male | Female |
| Management | 44 (36.7%) | 76 (63.3%) |
| Business & Financial | 0 (0.0%) | 0 (0.0%) |
| Computers, Engineering & Science | 0 (0.0%) | 0 (0.0%) |
| Computers & Mathematics | 0 (0.0%) | 0 (0.0%) |
| Architecture & Engineering | 0 (0.0%) | 0 (0.0%) |
| Life, Physical & Social Science | 0 (0.0%) | 0 (0.0%) |
| Community & Social Service | 12 (52.2%) | 11 (47.8%) |
| Education, Arts & Media | 12 (100.0%) | 0 (0.0%) |
| Legal Services & Support | 0 (0.0%) | 0 (0.0%) |
| Education Instruction & Library | 0 (0.0%) | 11 (100.0%) |
| Arts, Media & Entertainment | 0 (0.0%) | 0 (0.0%) |
| Health Diagnosing & Treating | 0 (0.0%) | 4 (100.0%) |
| Health Technologists | 0 (0.0%) | 0 (0.0%) |
| Total (Category) | 56 (38.1%) | 91 (61.9%) |
| Total (Overall) | 98 (30.2%) | 226 (69.8%) |
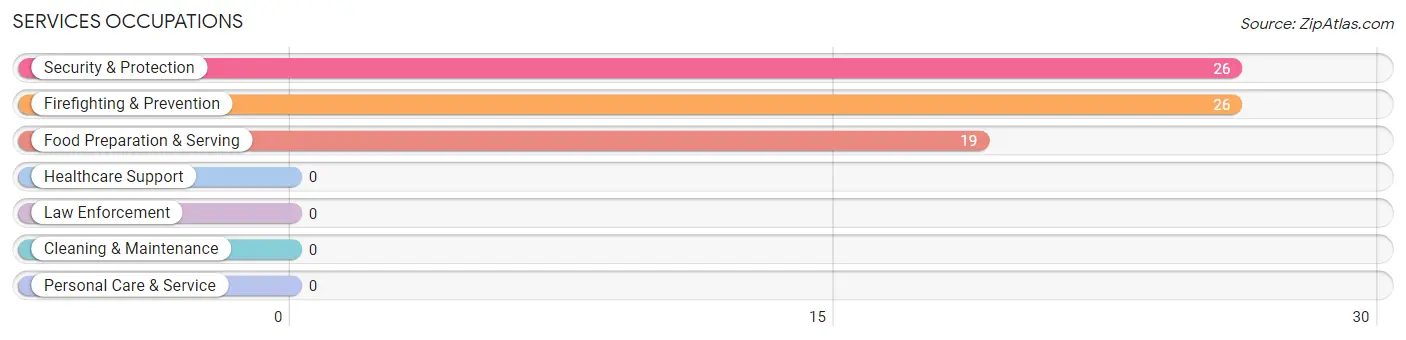
Services Occupations
The most common Services occupations in Gargatha are Security & Protection (26 | 8.0%), Firefighting & Prevention (26 | 8.0%), and Food Preparation & Serving (19 | 5.9%).
Services Occupations by Sex
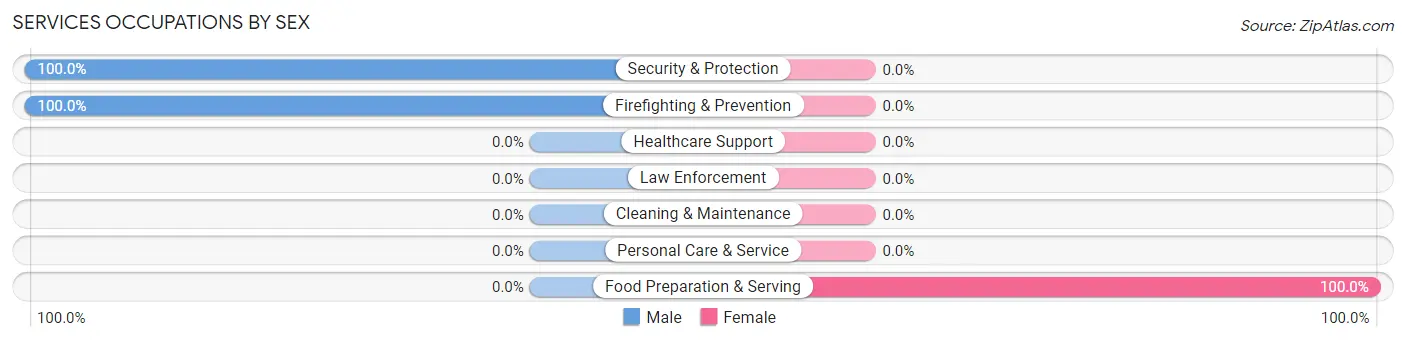
| Occupation | Male | Female |
| Healthcare Support | 0 (0.0%) | 0 (0.0%) |
| Security & Protection | 26 (100.0%) | 0 (0.0%) |
| Firefighting & Prevention | 26 (100.0%) | 0 (0.0%) |
| Law Enforcement | 0 (0.0%) | 0 (0.0%) |
| Food Preparation & Serving | 0 (0.0%) | 19 (100.0%) |
| Cleaning & Maintenance | 0 (0.0%) | 0 (0.0%) |
| Personal Care & Service | 0 (0.0%) | 0 (0.0%) |
| Total (Category) | 26 (57.8%) | 19 (42.2%) |
| Total (Overall) | 98 (30.2%) | 226 (69.8%) |
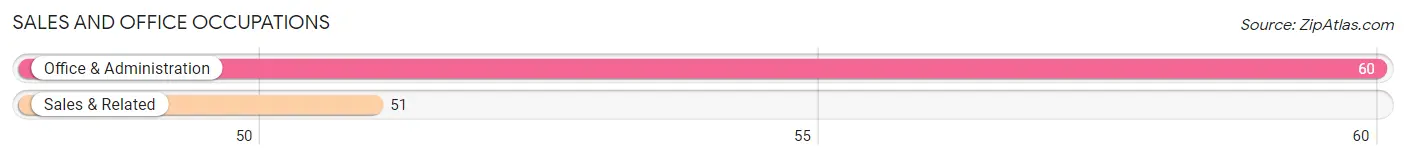
Sales and Office Occupations
The most common Sales and Office occupations in Gargatha are Office & Administration (60 | 18.5%), and Sales & Related (51 | 15.7%).
Sales and Office Occupations by Sex
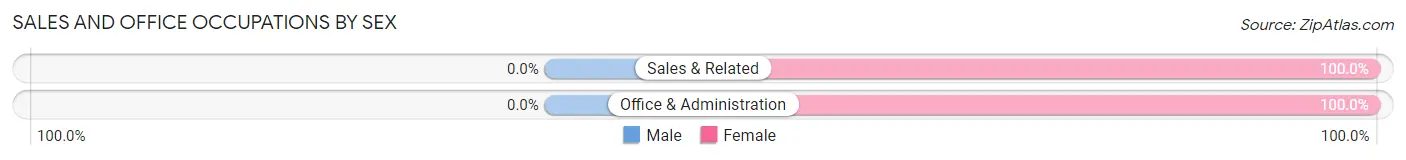
| Occupation | Male | Female |
| Sales & Related | 0 (0.0%) | 51 (100.0%) |
| Office & Administration | 0 (0.0%) | 60 (100.0%) |
| Total (Category) | 0 (0.0%) | 111 (100.0%) |
| Total (Overall) | 98 (30.2%) | 226 (69.8%) |
Natural Resources, Construction and Maintenance Occupations
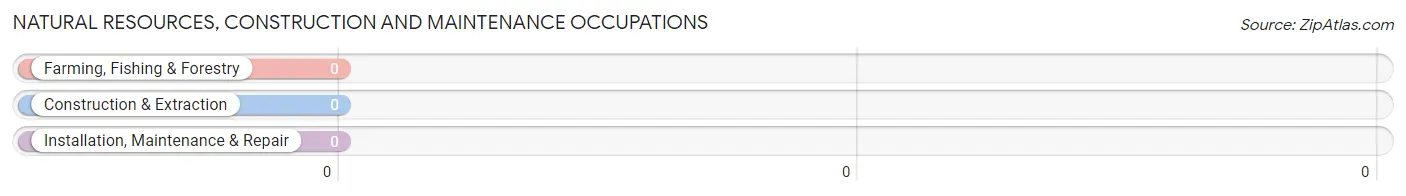
Natural Resources, Construction and Maintenance Occupations by Sex
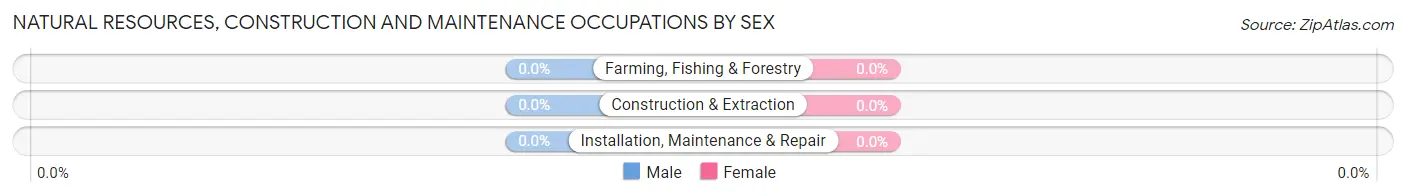
| Occupation | Male | Female |
| Farming, Fishing & Forestry | 0 (0.0%) | 0 (0.0%) |
| Construction & Extraction | 0 (0.0%) | 0 (0.0%) |
| Installation, Maintenance & Repair | 0 (0.0%) | 0 (0.0%) |
| Total (Category) | 0 (0.0%) | 0 (0.0%) |
| Total (Overall) | 98 (30.2%) | 226 (69.8%) |
Production, Transportation and Moving Occupations
The most common Production, Transportation and Moving occupations in Gargatha are Transportation (14 | 4.3%), and Production (7 | 2.2%).
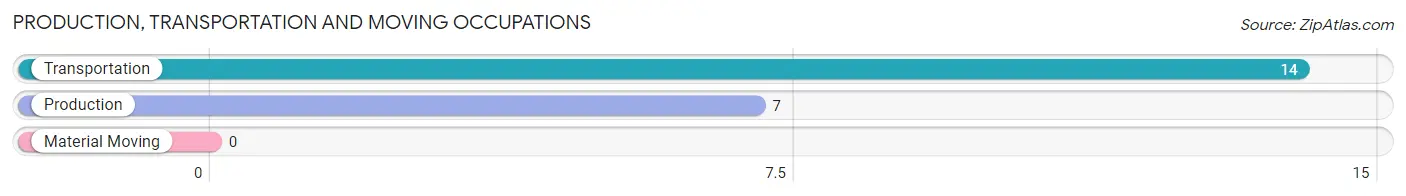
Production, Transportation and Moving Occupations by Sex
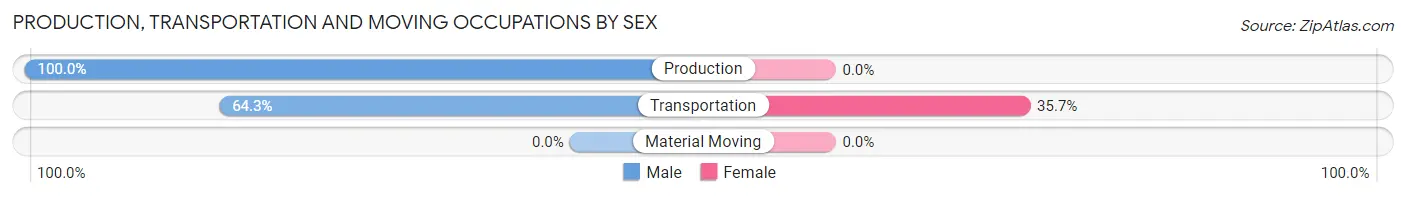
| Occupation | Male | Female |
| Production | 7 (100.0%) | 0 (0.0%) |
| Transportation | 9 (64.3%) | 5 (35.7%) |
| Material Moving | 0 (0.0%) | 0 (0.0%) |
| Total (Category) | 16 (76.2%) | 5 (23.8%) |
| Total (Overall) | 98 (30.2%) | 226 (69.8%) |
Employment Industries by Sex in Gargatha
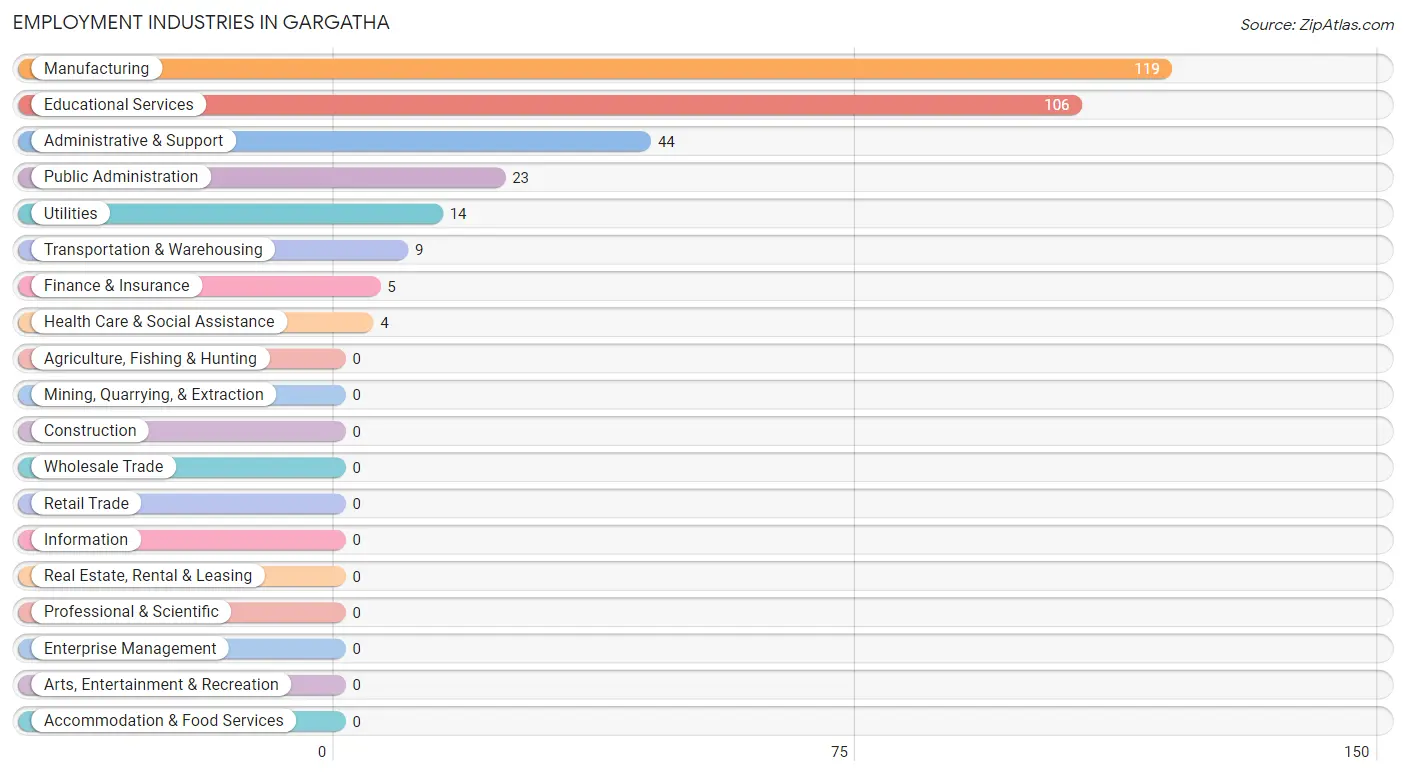
Employment Industries in Gargatha
The major employment industries in Gargatha include Manufacturing (119 | 36.7%), Educational Services (106 | 32.7%), Administrative & Support (44 | 13.6%), Public Administration (23 | 7.1%), and Utilities (14 | 4.3%).
Employment Industries by Sex in Gargatha
The Gargatha industries that see more men than women are Transportation & Warehousing (100.0%), Administrative & Support (59.1%), and Manufacturing (42.9%), whereas the industries that tend to have a higher number of women are Utilities (100.0%), Finance & Insurance (100.0%), and Health Care & Social Assistance (100.0%).
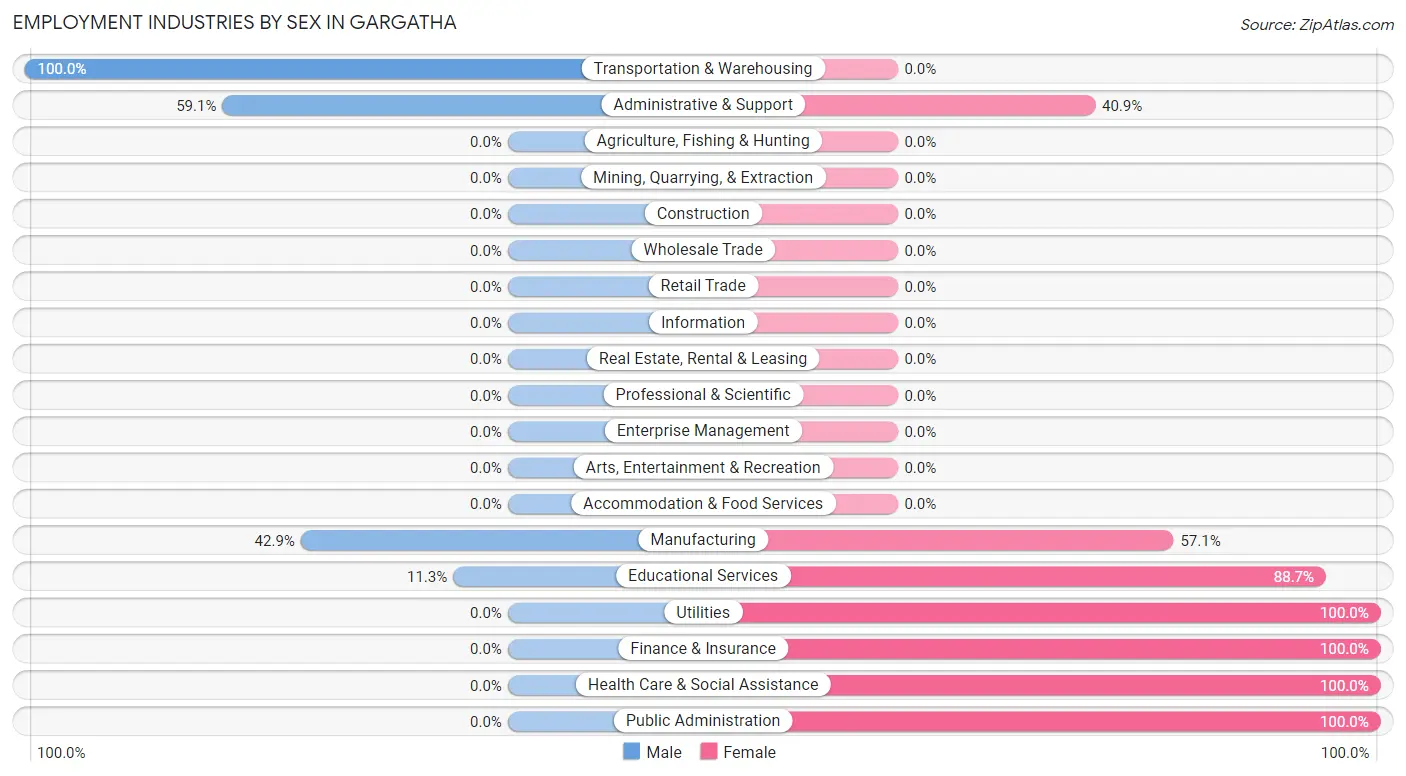
| Industry | Male | Female |
| Agriculture, Fishing & Hunting | 0 (0.0%) | 0 (0.0%) |
| Mining, Quarrying, & Extraction | 0 (0.0%) | 0 (0.0%) |
| Construction | 0 (0.0%) | 0 (0.0%) |
| Manufacturing | 51 (42.9%) | 68 (57.1%) |
| Wholesale Trade | 0 (0.0%) | 0 (0.0%) |
| Retail Trade | 0 (0.0%) | 0 (0.0%) |
| Transportation & Warehousing | 9 (100.0%) | 0 (0.0%) |
| Utilities | 0 (0.0%) | 14 (100.0%) |
| Information | 0 (0.0%) | 0 (0.0%) |
| Finance & Insurance | 0 (0.0%) | 5 (100.0%) |
| Real Estate, Rental & Leasing | 0 (0.0%) | 0 (0.0%) |
| Professional & Scientific | 0 (0.0%) | 0 (0.0%) |
| Enterprise Management | 0 (0.0%) | 0 (0.0%) |
| Administrative & Support | 26 (59.1%) | 18 (40.9%) |
| Educational Services | 12 (11.3%) | 94 (88.7%) |
| Health Care & Social Assistance | 0 (0.0%) | 4 (100.0%) |
| Arts, Entertainment & Recreation | 0 (0.0%) | 0 (0.0%) |
| Accommodation & Food Services | 0 (0.0%) | 0 (0.0%) |
| Public Administration | 0 (0.0%) | 23 (100.0%) |
| Total | 98 (30.2%) | 226 (69.8%) |
Education in Gargatha
School Enrollment in Gargatha
The most common levels of schooling among the 140 students in Gargatha are middle school (117 | 83.6%), high school (16 | 11.4%), and nursery / preschool (7 | 5.0%).
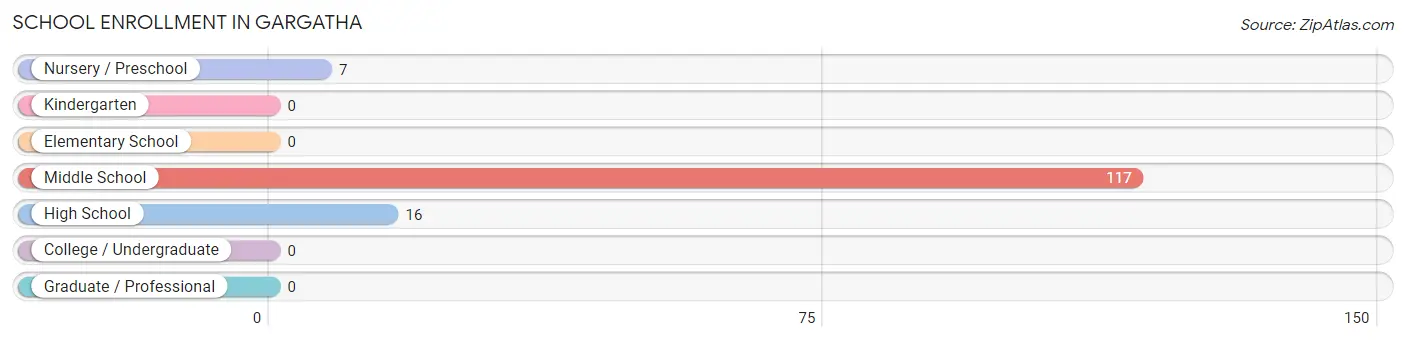
| School Level | # Students | % Students |
| Nursery / Preschool | 7 | 5.0% |
| Kindergarten | 0 | 0.0% |
| Elementary School | 0 | 0.0% |
| Middle School | 117 | 83.6% |
| High School | 16 | 11.4% |
| College / Undergraduate | 0 | 0.0% |
| Graduate / Professional | 0 | 0.0% |
| Total | 140 | 100.0% |
School Enrollment by Age by Funding Source in Gargatha
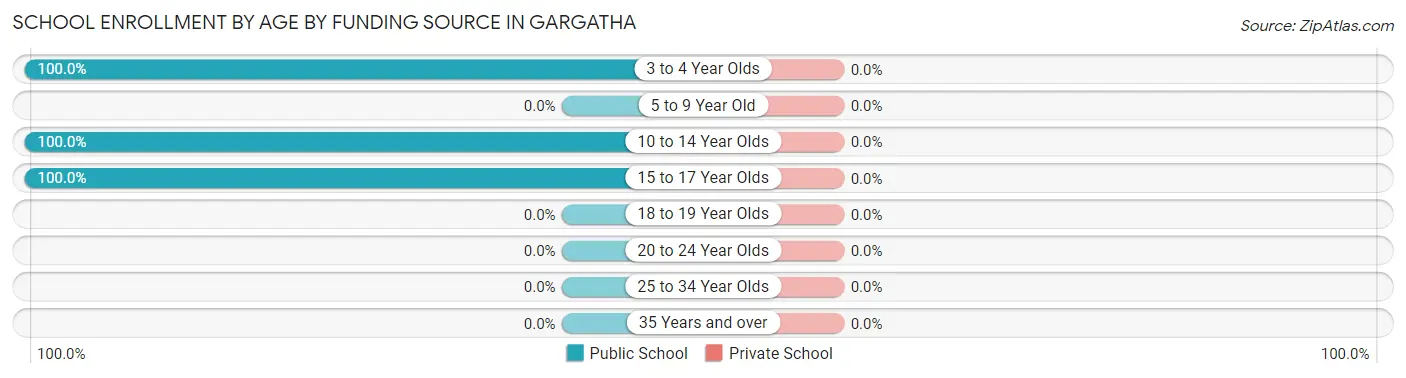
| Age Bracket | Public School | Private School |
| 3 to 4 Year Olds | 7 (100.0%) | 0 (0.0%) |
| 5 to 9 Year Old | 0 (0.0%) | 0 (0.0%) |
| 10 to 14 Year Olds | 117 (100.0%) | 0 (0.0%) |
| 15 to 17 Year Olds | 16 (100.0%) | 0 (0.0%) |
| 18 to 19 Year Olds | 0 (0.0%) | 0 (0.0%) |
| 20 to 24 Year Olds | 0 (0.0%) | 0 (0.0%) |
| 25 to 34 Year Olds | 0 (0.0%) | 0 (0.0%) |
| 35 Years and over | 0 (0.0%) | 0 (0.0%) |
| Total | 140 (100.0%) | 0 (0.0%) |
Educational Attainment by Field of Study in Gargatha
Education (87 | 49.4%), psychology (59 | 33.5%), arts & humanities (22 | 12.5%), and business (8 | 4.5%) are the most common fields of study among 176 individuals in Gargatha who have obtained a bachelor's degree or higher.
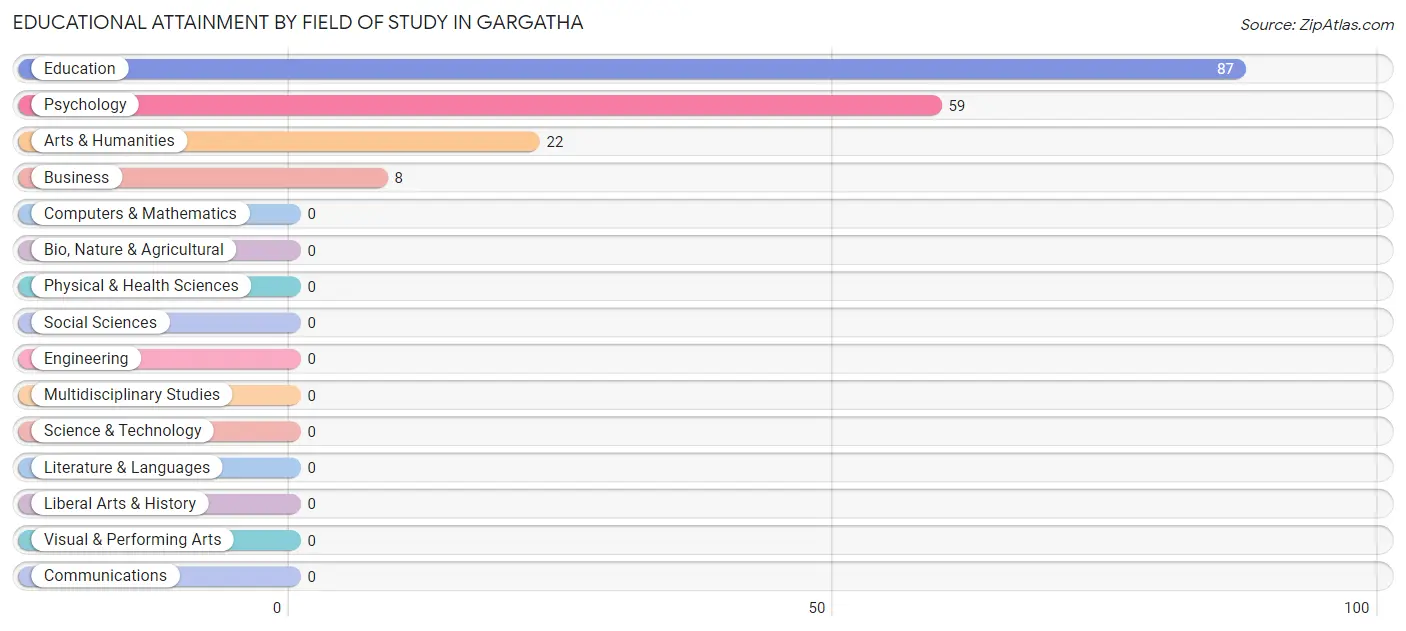
| Field of Study | # Graduates | % Graduates |
| Computers & Mathematics | 0 | 0.0% |
| Bio, Nature & Agricultural | 0 | 0.0% |
| Physical & Health Sciences | 0 | 0.0% |
| Psychology | 59 | 33.5% |
| Social Sciences | 0 | 0.0% |
| Engineering | 0 | 0.0% |
| Multidisciplinary Studies | 0 | 0.0% |
| Science & Technology | 0 | 0.0% |
| Business | 8 | 4.5% |
| Education | 87 | 49.4% |
| Literature & Languages | 0 | 0.0% |
| Liberal Arts & History | 0 | 0.0% |
| Visual & Performing Arts | 0 | 0.0% |
| Communications | 0 | 0.0% |
| Arts & Humanities | 22 | 12.5% |
| Total | 176 | 100.0% |
Transportation & Commute in Gargatha
Vehicle Availability by Sex in Gargatha
The most prevalent vehicle ownership categories in Gargatha are males with 4 vehicles (51, accounting for 52.0%) and females with 4 vehicles (60, making up 22.6%).
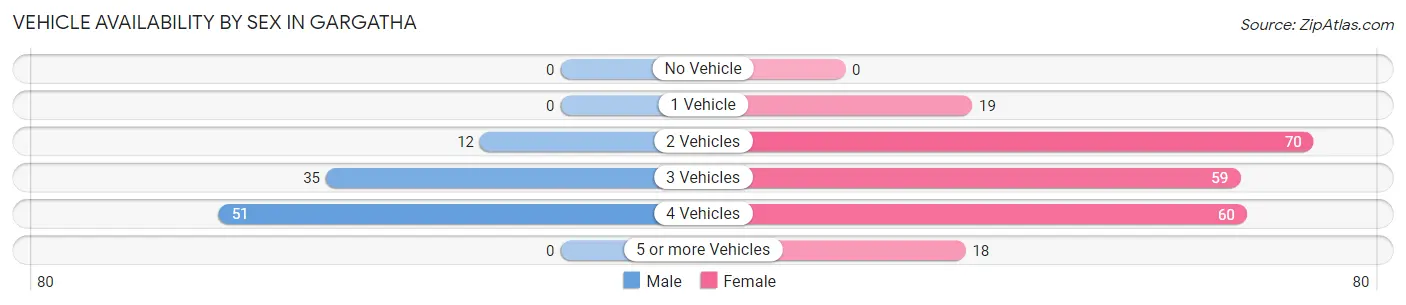
| Vehicles Available | Male | Female |
| No Vehicle | 0 (0.0%) | 0 (0.0%) |
| 1 Vehicle | 0 (0.0%) | 19 (8.4%) |
| 2 Vehicles | 12 (12.2%) | 70 (31.0%) |
| 3 Vehicles | 35 (35.7%) | 59 (26.1%) |
| 4 Vehicles | 51 (52.0%) | 60 (26.6%) |
| 5 or more Vehicles | 0 (0.0%) | 18 (8.0%) |
| Total | 98 (100.0%) | 226 (100.0%) |
Commute Time in Gargatha
The most frequently occuring commute durations in Gargatha are 10 to 14 minutes (67 commuters, 21.0%), 60 to 89 minutes (59 commuters, 18.5%), and 25 to 29 minutes (51 commuters, 16.0%).
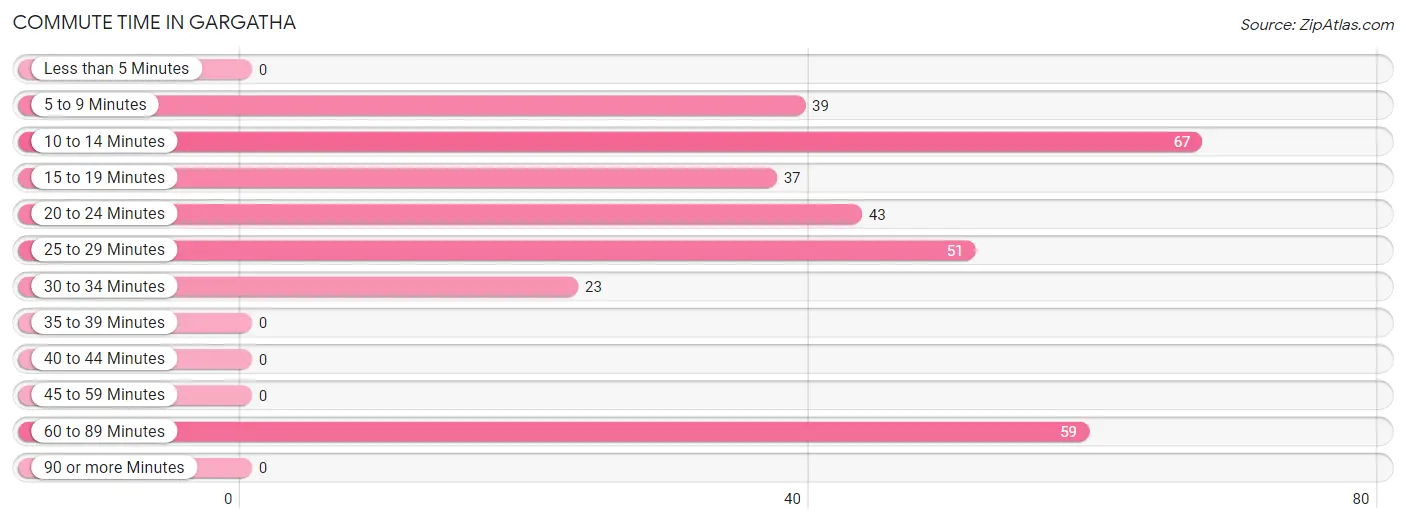
| Commute Time | # Commuters | % Commuters |
| Less than 5 Minutes | 0 | 0.0% |
| 5 to 9 Minutes | 39 | 12.2% |
| 10 to 14 Minutes | 67 | 21.0% |
| 15 to 19 Minutes | 37 | 11.6% |
| 20 to 24 Minutes | 43 | 13.5% |
| 25 to 29 Minutes | 51 | 16.0% |
| 30 to 34 Minutes | 23 | 7.2% |
| 35 to 39 Minutes | 0 | 0.0% |
| 40 to 44 Minutes | 0 | 0.0% |
| 45 to 59 Minutes | 0 | 0.0% |
| 60 to 89 Minutes | 59 | 18.5% |
| 90 or more Minutes | 0 | 0.0% |
Commute Time by Sex in Gargatha
The most common commute times in Gargatha are 10 to 14 minutes (44 commuters, 44.9%) for males and 60 to 89 minutes (59 commuters, 26.7%) for females.
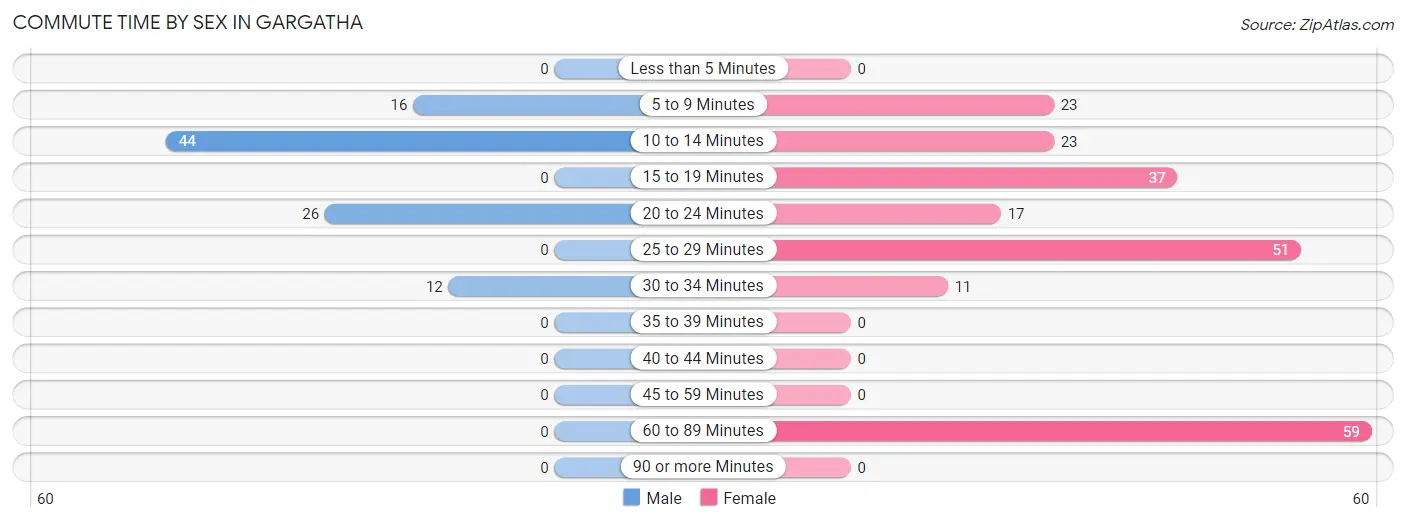
| Commute Time | Male | Female |
| Less than 5 Minutes | 0 (0.0%) | 0 (0.0%) |
| 5 to 9 Minutes | 16 (16.3%) | 23 (10.4%) |
| 10 to 14 Minutes | 44 (44.9%) | 23 (10.4%) |
| 15 to 19 Minutes | 0 (0.0%) | 37 (16.7%) |
| 20 to 24 Minutes | 26 (26.5%) | 17 (7.7%) |
| 25 to 29 Minutes | 0 (0.0%) | 51 (23.1%) |
| 30 to 34 Minutes | 12 (12.2%) | 11 (5.0%) |
| 35 to 39 Minutes | 0 (0.0%) | 0 (0.0%) |
| 40 to 44 Minutes | 0 (0.0%) | 0 (0.0%) |
| 45 to 59 Minutes | 0 (0.0%) | 0 (0.0%) |
| 60 to 89 Minutes | 0 (0.0%) | 59 (26.7%) |
| 90 or more Minutes | 0 (0.0%) | 0 (0.0%) |
Time of Departure to Work by Sex in Gargatha
The most frequent times of departure to work in Gargatha are 12:00 PM to 3:59 PM (44, 44.9%) for males and 6:30 AM to 6:59 AM (78, 35.3%) for females.
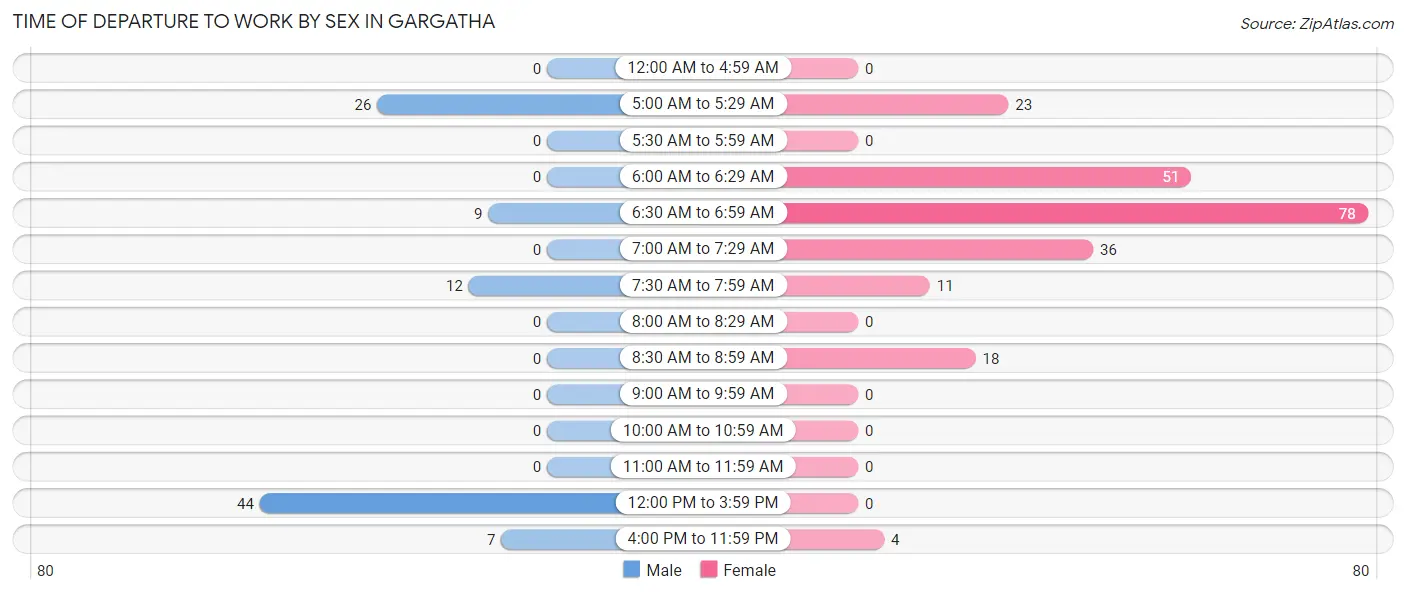
| Time of Departure | Male | Female |
| 12:00 AM to 4:59 AM | 0 (0.0%) | 0 (0.0%) |
| 5:00 AM to 5:29 AM | 26 (26.5%) | 23 (10.4%) |
| 5:30 AM to 5:59 AM | 0 (0.0%) | 0 (0.0%) |
| 6:00 AM to 6:29 AM | 0 (0.0%) | 51 (23.1%) |
| 6:30 AM to 6:59 AM | 9 (9.2%) | 78 (35.3%) |
| 7:00 AM to 7:29 AM | 0 (0.0%) | 36 (16.3%) |
| 7:30 AM to 7:59 AM | 12 (12.2%) | 11 (5.0%) |
| 8:00 AM to 8:29 AM | 0 (0.0%) | 0 (0.0%) |
| 8:30 AM to 8:59 AM | 0 (0.0%) | 18 (8.1%) |
| 9:00 AM to 9:59 AM | 0 (0.0%) | 0 (0.0%) |
| 10:00 AM to 10:59 AM | 0 (0.0%) | 0 (0.0%) |
| 11:00 AM to 11:59 AM | 0 (0.0%) | 0 (0.0%) |
| 12:00 PM to 3:59 PM | 44 (44.9%) | 0 (0.0%) |
| 4:00 PM to 11:59 PM | 7 (7.1%) | 4 (1.8%) |
| Total | 98 (100.0%) | 221 (100.0%) |
Housing Occupancy in Gargatha
Occupancy by Ownership in Gargatha
Of the total 290 dwellings in Gargatha, owner-occupied units account for 257 (88.6%), while renter-occupied units make up 33 (11.4%).
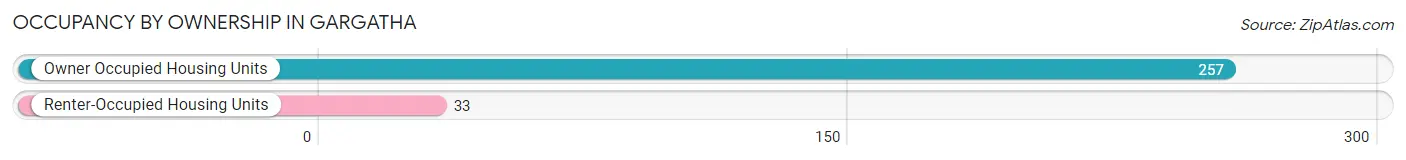
| Occupancy | # Housing Units | % Housing Units |
| Owner Occupied Housing Units | 257 | 88.6% |
| Renter-Occupied Housing Units | 33 | 11.4% |
| Total Occupied Housing Units | 290 | 100.0% |
Occupancy by Household Size in Gargatha
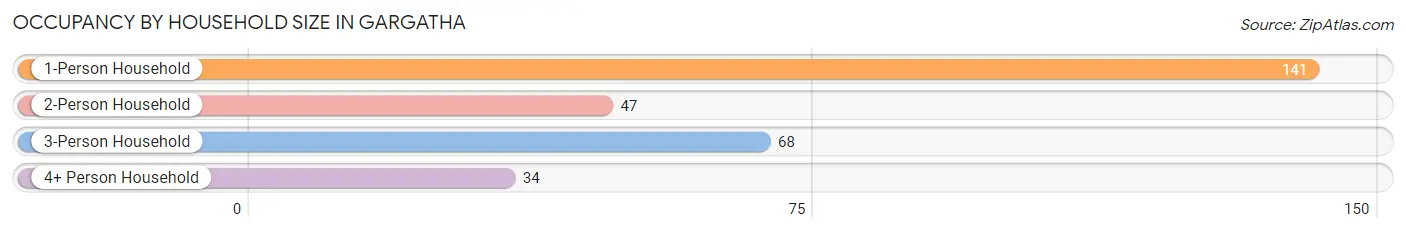
| Household Size | # Housing Units | % Housing Units |
| 1-Person Household | 141 | 48.6% |
| 2-Person Household | 47 | 16.2% |
| 3-Person Household | 68 | 23.4% |
| 4+ Person Household | 34 | 11.7% |
| Total Housing Units | 290 | 100.0% |
Occupancy by Ownership by Household Size in Gargatha
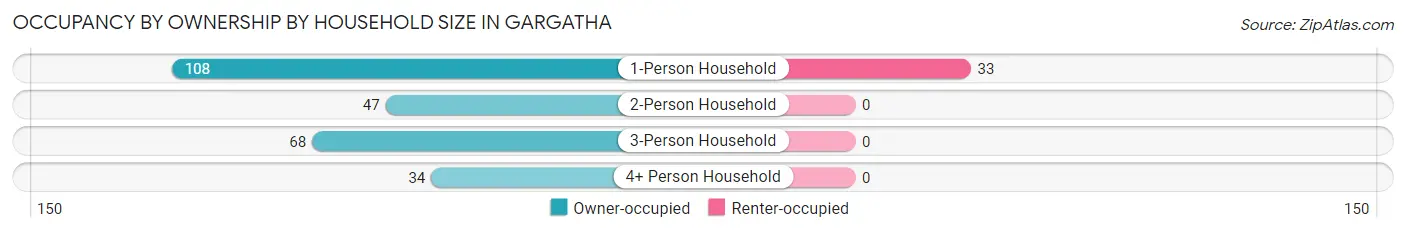
| Household Size | Owner-occupied | Renter-occupied |
| 1-Person Household | 108 (76.6%) | 33 (23.4%) |
| 2-Person Household | 47 (100.0%) | 0 (0.0%) |
| 3-Person Household | 68 (100.0%) | 0 (0.0%) |
| 4+ Person Household | 34 (100.0%) | 0 (0.0%) |
| Total Housing Units | 257 (88.6%) | 33 (11.4%) |
Occupancy by Educational Attainment in Gargatha
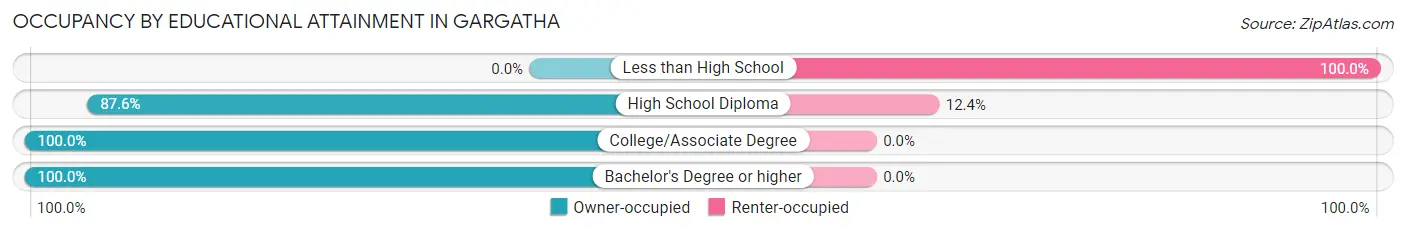
| Household Size | Owner-occupied | Renter-occupied |
| Less than High School | 0 (0.0%) | 14 (100.0%) |
| High School Diploma | 134 (87.6%) | 19 (12.4%) |
| College/Associate Degree | 38 (100.0%) | 0 (0.0%) |
| Bachelor's Degree or higher | 85 (100.0%) | 0 (0.0%) |
Occupancy by Age of Householder in Gargatha
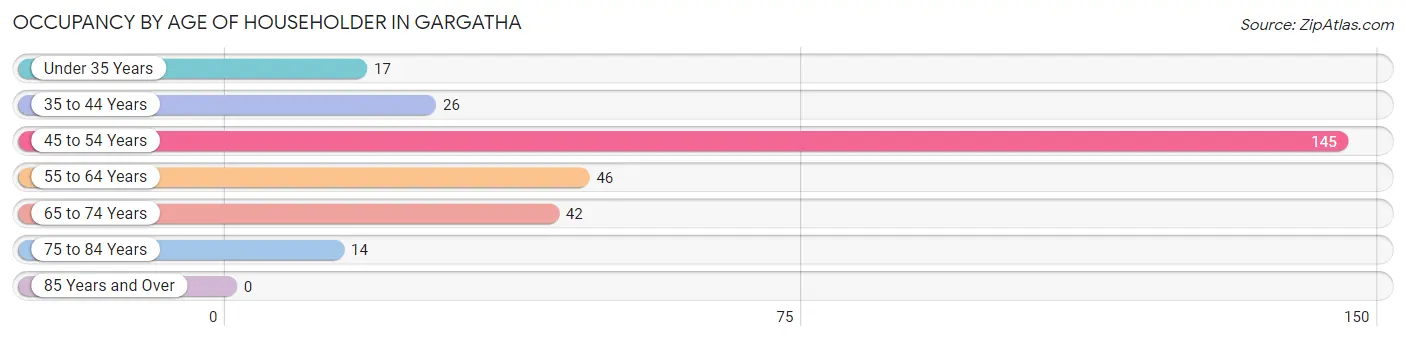
| Age Bracket | # Households | % Households |
| Under 35 Years | 17 | 5.9% |
| 35 to 44 Years | 26 | 9.0% |
| 45 to 54 Years | 145 | 50.0% |
| 55 to 64 Years | 46 | 15.9% |
| 65 to 74 Years | 42 | 14.5% |
| 75 to 84 Years | 14 | 4.8% |
| 85 Years and Over | 0 | 0.0% |
| Total | 290 | 100.0% |
Housing Finances in Gargatha
Median Income by Occupancy in Gargatha
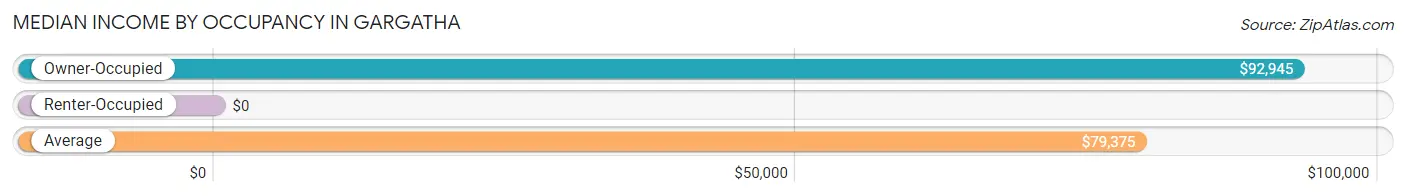
| Occupancy Type | # Households | Median Income |
| Owner-Occupied | 257 (88.6%) | $92,945 |
| Renter-Occupied | 33 (11.4%) | $0 |
| Average | 290 (100.0%) | $79,375 |
Occupancy by Householder Income Bracket in Gargatha
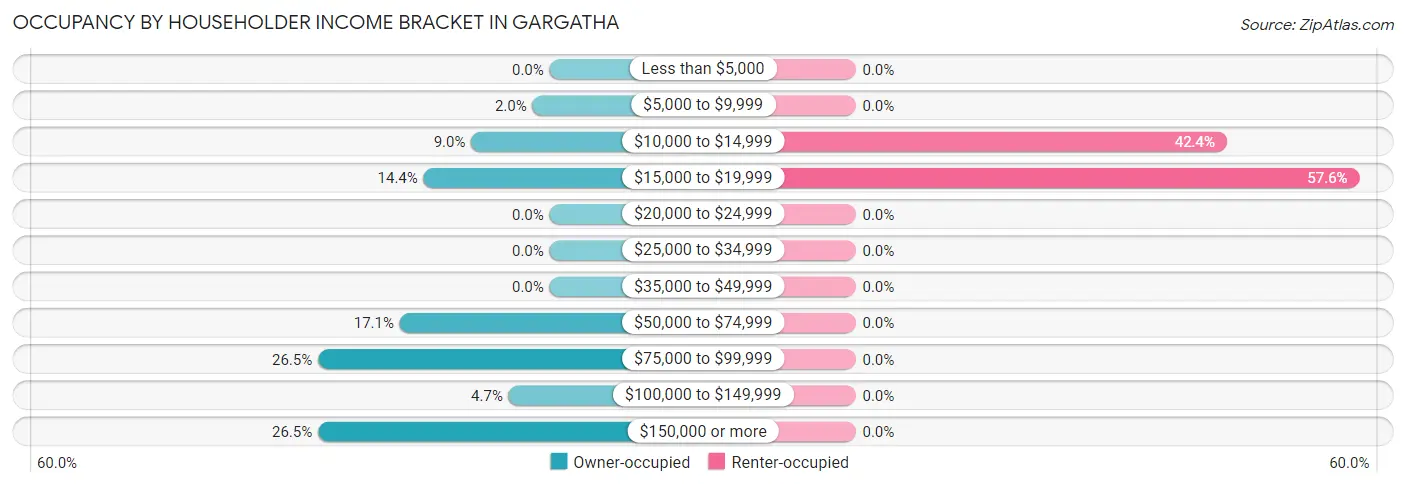
| Income Bracket | Owner-occupied | Renter-occupied |
| Less than $5,000 | 0 (0.0%) | 0 (0.0%) |
| $5,000 to $9,999 | 5 (1.9%) | 0 (0.0%) |
| $10,000 to $14,999 | 23 (8.9%) | 14 (42.4%) |
| $15,000 to $19,999 | 37 (14.4%) | 19 (57.6%) |
| $20,000 to $24,999 | 0 (0.0%) | 0 (0.0%) |
| $25,000 to $34,999 | 0 (0.0%) | 0 (0.0%) |
| $35,000 to $49,999 | 0 (0.0%) | 0 (0.0%) |
| $50,000 to $74,999 | 44 (17.1%) | 0 (0.0%) |
| $75,000 to $99,999 | 68 (26.5%) | 0 (0.0%) |
| $100,000 to $149,999 | 12 (4.7%) | 0 (0.0%) |
| $150,000 or more | 68 (26.5%) | 0 (0.0%) |
| Total | 257 (100.0%) | 33 (100.0%) |
Monthly Housing Cost Tiers in Gargatha
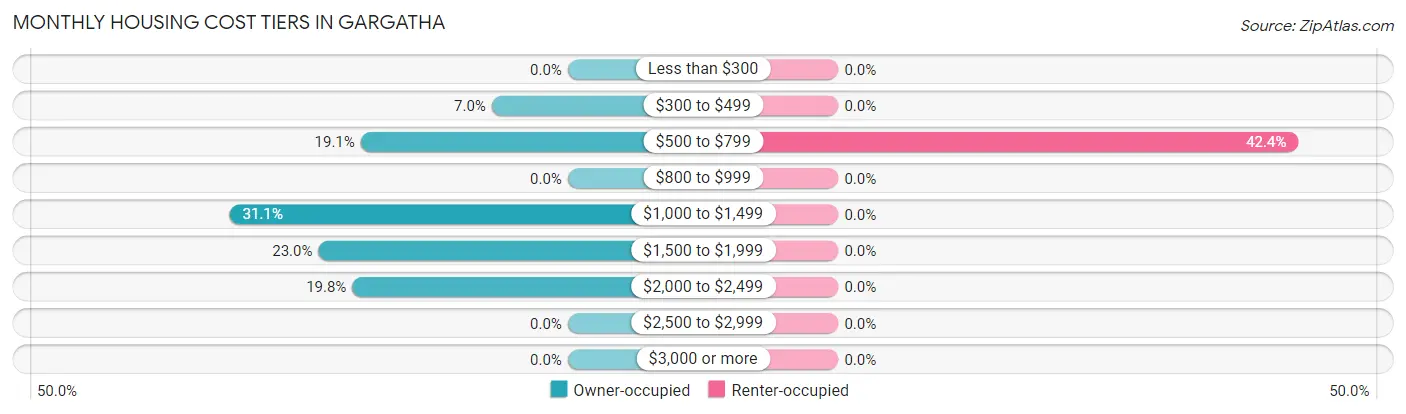
| Monthly Cost | Owner-occupied | Renter-occupied |
| Less than $300 | 0 (0.0%) | 0 (0.0%) |
| $300 to $499 | 18 (7.0%) | 0 (0.0%) |
| $500 to $799 | 49 (19.1%) | 14 (42.4%) |
| $800 to $999 | 0 (0.0%) | 0 (0.0%) |
| $1,000 to $1,499 | 80 (31.1%) | 0 (0.0%) |
| $1,500 to $1,999 | 59 (23.0%) | 0 (0.0%) |
| $2,000 to $2,499 | 51 (19.8%) | 0 (0.0%) |
| $2,500 to $2,999 | 0 (0.0%) | 0 (0.0%) |
| $3,000 or more | 0 (0.0%) | 0 (0.0%) |
| Total | 257 (100.0%) | 33 (100.0%) |
Physical Housing Characteristics in Gargatha
Housing Structures in Gargatha
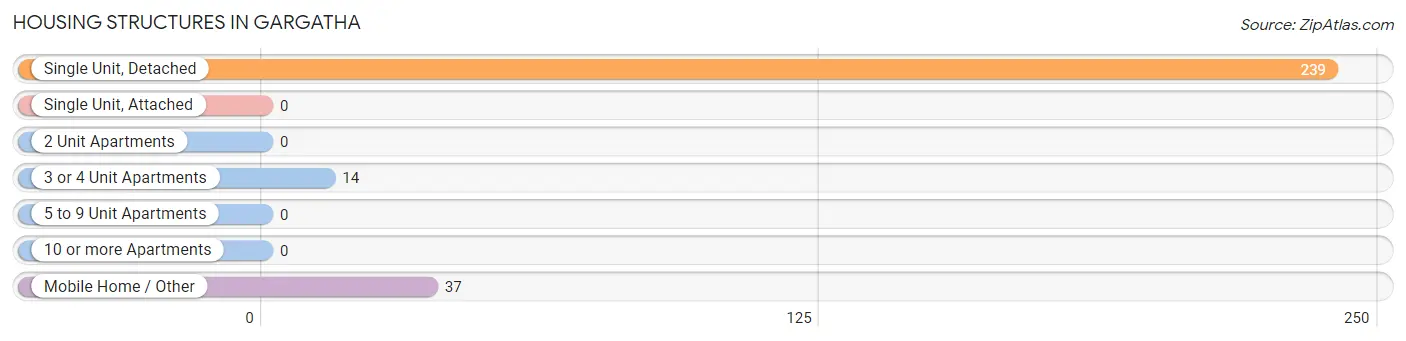
| Structure Type | # Housing Units | % Housing Units |
| Single Unit, Detached | 239 | 82.4% |
| Single Unit, Attached | 0 | 0.0% |
| 2 Unit Apartments | 0 | 0.0% |
| 3 or 4 Unit Apartments | 14 | 4.8% |
| 5 to 9 Unit Apartments | 0 | 0.0% |
| 10 or more Apartments | 0 | 0.0% |
| Mobile Home / Other | 37 | 12.8% |
| Total | 290 | 100.0% |
Housing Structures by Occupancy in Gargatha
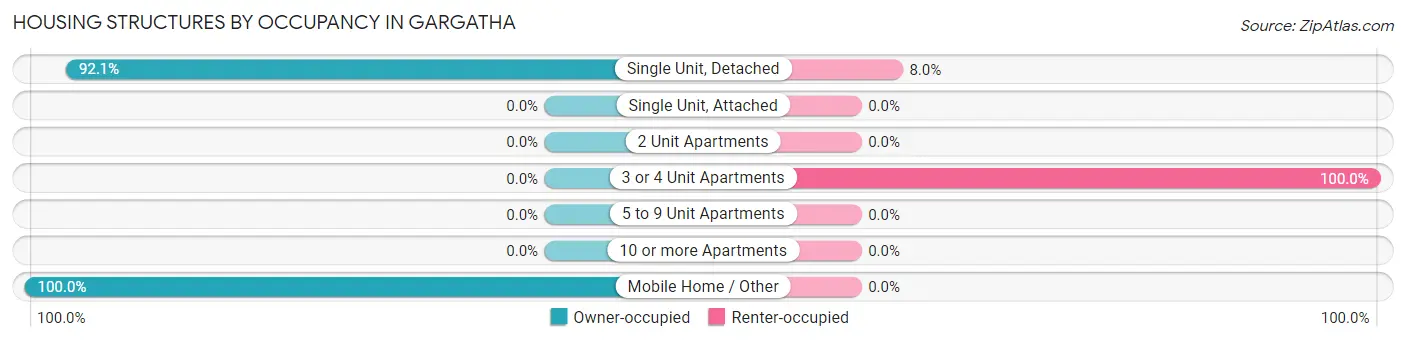
| Structure Type | Owner-occupied | Renter-occupied |
| Single Unit, Detached | 220 (92.0%) | 19 (8.0%) |
| Single Unit, Attached | 0 (0.0%) | 0 (0.0%) |
| 2 Unit Apartments | 0 (0.0%) | 0 (0.0%) |
| 3 or 4 Unit Apartments | 0 (0.0%) | 14 (100.0%) |
| 5 to 9 Unit Apartments | 0 (0.0%) | 0 (0.0%) |
| 10 or more Apartments | 0 (0.0%) | 0 (0.0%) |
| Mobile Home / Other | 37 (100.0%) | 0 (0.0%) |
| Total | 257 (88.6%) | 33 (11.4%) |
Housing Structures by Number of Rooms in Gargatha
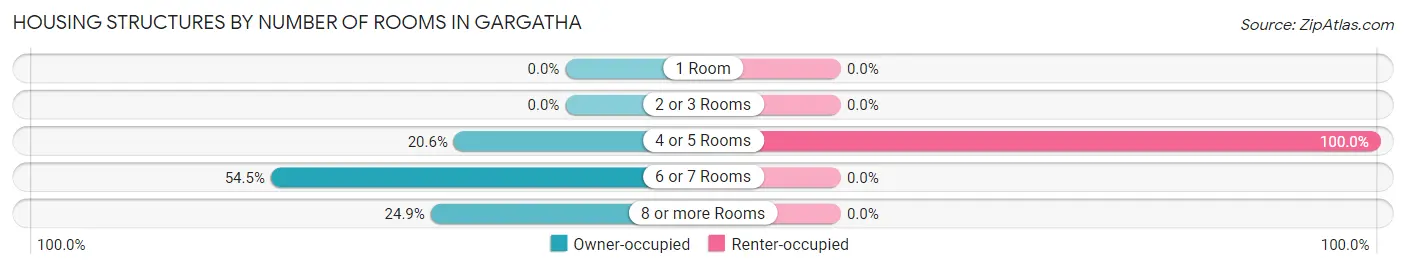
| Number of Rooms | Owner-occupied | Renter-occupied |
| 1 Room | 0 (0.0%) | 0 (0.0%) |
| 2 or 3 Rooms | 0 (0.0%) | 0 (0.0%) |
| 4 or 5 Rooms | 53 (20.6%) | 33 (100.0%) |
| 6 or 7 Rooms | 140 (54.5%) | 0 (0.0%) |
| 8 or more Rooms | 64 (24.9%) | 0 (0.0%) |
| Total | 257 (100.0%) | 33 (100.0%) |
Housing Structure by Heating Type in Gargatha
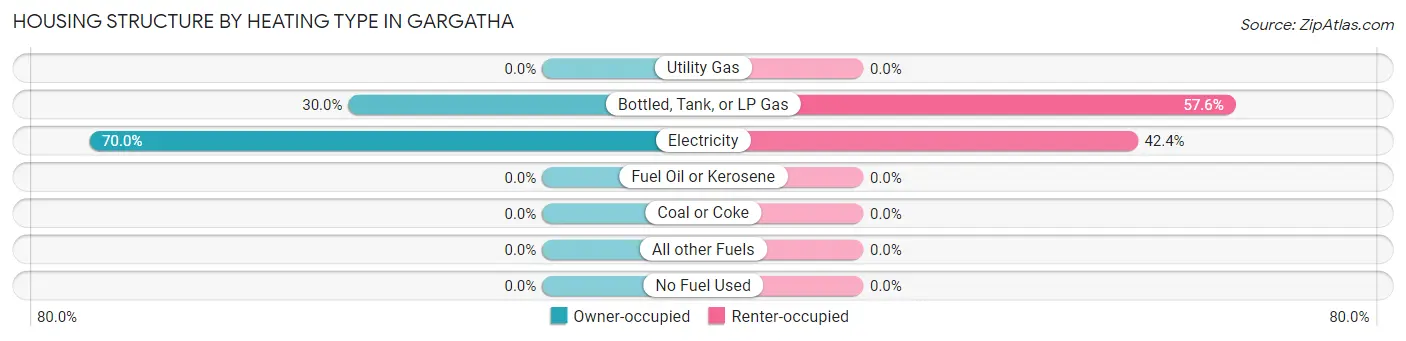
| Heating Type | Owner-occupied | Renter-occupied |
| Utility Gas | 0 (0.0%) | 0 (0.0%) |
| Bottled, Tank, or LP Gas | 77 (30.0%) | 19 (57.6%) |
| Electricity | 180 (70.0%) | 14 (42.4%) |
| Fuel Oil or Kerosene | 0 (0.0%) | 0 (0.0%) |
| Coal or Coke | 0 (0.0%) | 0 (0.0%) |
| All other Fuels | 0 (0.0%) | 0 (0.0%) |
| No Fuel Used | 0 (0.0%) | 0 (0.0%) |
| Total | 257 (100.0%) | 33 (100.0%) |
Household Vehicle Usage in Gargatha
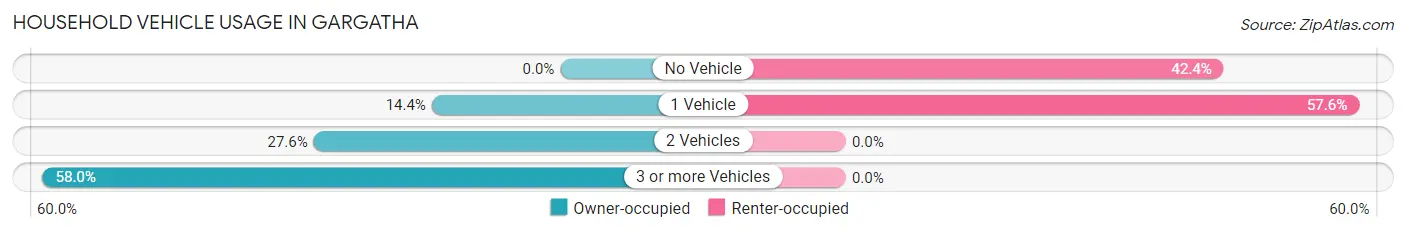
| Vehicles per Household | Owner-occupied | Renter-occupied |
| No Vehicle | 0 (0.0%) | 14 (42.4%) |
| 1 Vehicle | 37 (14.4%) | 19 (57.6%) |
| 2 Vehicles | 71 (27.6%) | 0 (0.0%) |
| 3 or more Vehicles | 149 (58.0%) | 0 (0.0%) |
| Total | 257 (100.0%) | 33 (100.0%) |
Real Estate & Mortgages in Gargatha
Real Estate and Mortgage Overview in Gargatha
| Characteristic | Without Mortgage | With Mortgage |
| Housing Units | 30 | 227 |
| Median Property Value | - | - |
| Median Household Income | - | - |
| Monthly Housing Costs | - | - |
| Real Estate Taxes | - | - |
Property Value by Mortgage Status in Gargatha
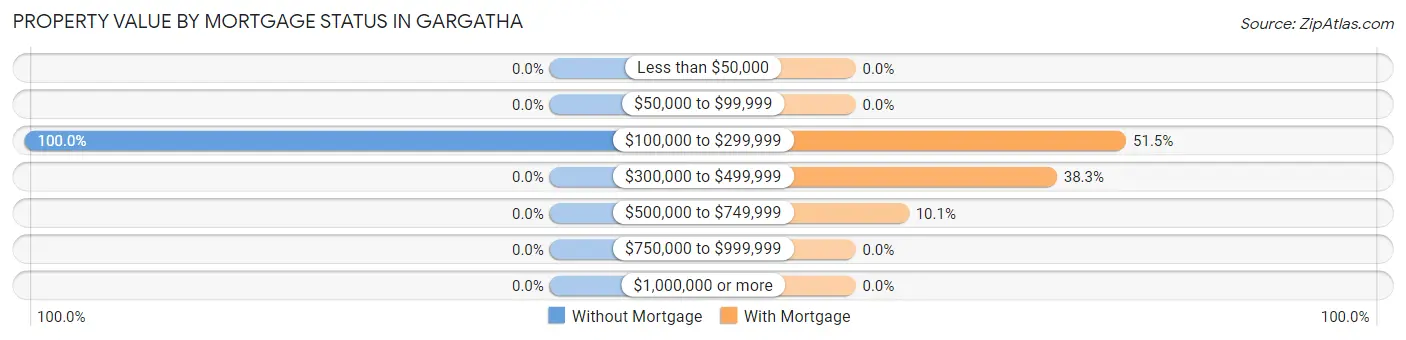
| Property Value | Without Mortgage | With Mortgage |
| Less than $50,000 | 0 (0.0%) | 0 (0.0%) |
| $50,000 to $99,999 | 0 (0.0%) | 0 (0.0%) |
| $100,000 to $299,999 | 30 (100.0%) | 117 (51.5%) |
| $300,000 to $499,999 | 0 (0.0%) | 87 (38.3%) |
| $500,000 to $749,999 | 0 (0.0%) | 23 (10.1%) |
| $750,000 to $999,999 | 0 (0.0%) | 0 (0.0%) |
| $1,000,000 or more | 0 (0.0%) | 0 (0.0%) |
| Total | 30 (100.0%) | 227 (100.0%) |
Household Income by Mortgage Status in Gargatha
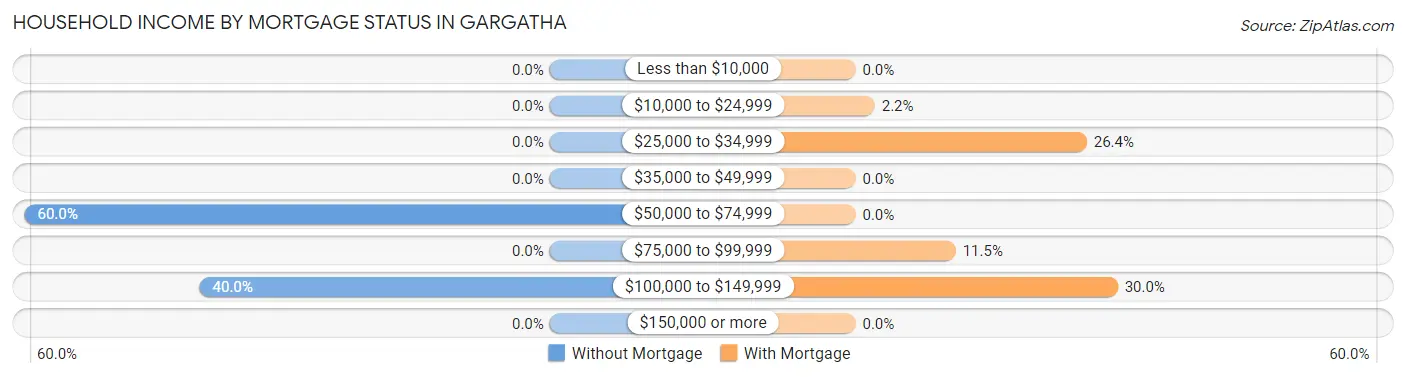
| Household Income | Without Mortgage | With Mortgage |
| Less than $10,000 | 0 (0.0%) | 0 (0.0%) |
| $10,000 to $24,999 | 0 (0.0%) | 5 (2.2%) |
| $25,000 to $34,999 | 0 (0.0%) | 60 (26.4%) |
| $35,000 to $49,999 | 0 (0.0%) | 0 (0.0%) |
| $50,000 to $74,999 | 18 (60.0%) | 0 (0.0%) |
| $75,000 to $99,999 | 0 (0.0%) | 26 (11.5%) |
| $100,000 to $149,999 | 12 (40.0%) | 68 (30.0%) |
| $150,000 or more | 0 (0.0%) | 0 (0.0%) |
| Total | 30 (100.0%) | 227 (100.0%) |
Property Value to Household Income Ratio in Gargatha
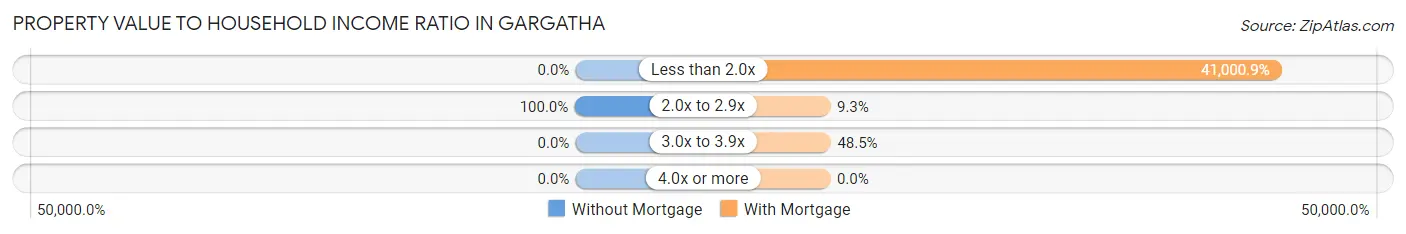
| Value-to-Income Ratio | Without Mortgage | With Mortgage |
| Less than 2.0x | 0 (0.0%) | 93,072 (41,000.9%) |
| 2.0x to 2.9x | 30 (100.0%) | 21 (9.2%) |
| 3.0x to 3.9x | 0 (0.0%) | 110 (48.5%) |
| 4.0x or more | 0 (0.0%) | 0 (0.0%) |
| Total | 30 (100.0%) | 227 (100.0%) |
Real Estate Taxes by Mortgage Status in Gargatha
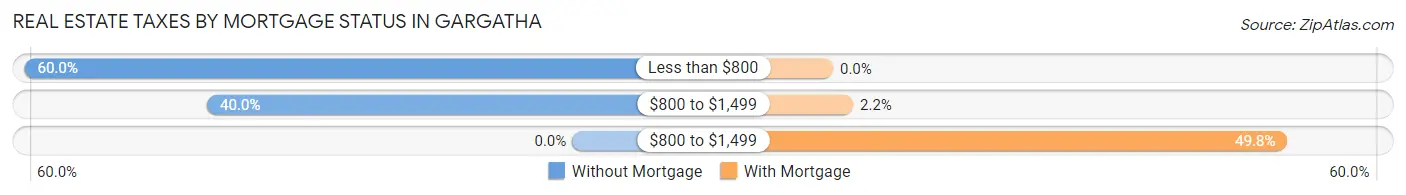
| Property Taxes | Without Mortgage | With Mortgage |
| Less than $800 | 18 (60.0%) | 0 (0.0%) |
| $800 to $1,499 | 12 (40.0%) | 5 (2.2%) |
| $800 to $1,499 | 0 (0.0%) | 113 (49.8%) |
| Total | 30 (100.0%) | 227 (100.0%) |
Health & Disability in Gargatha
Health Insurance Coverage by Age in Gargatha
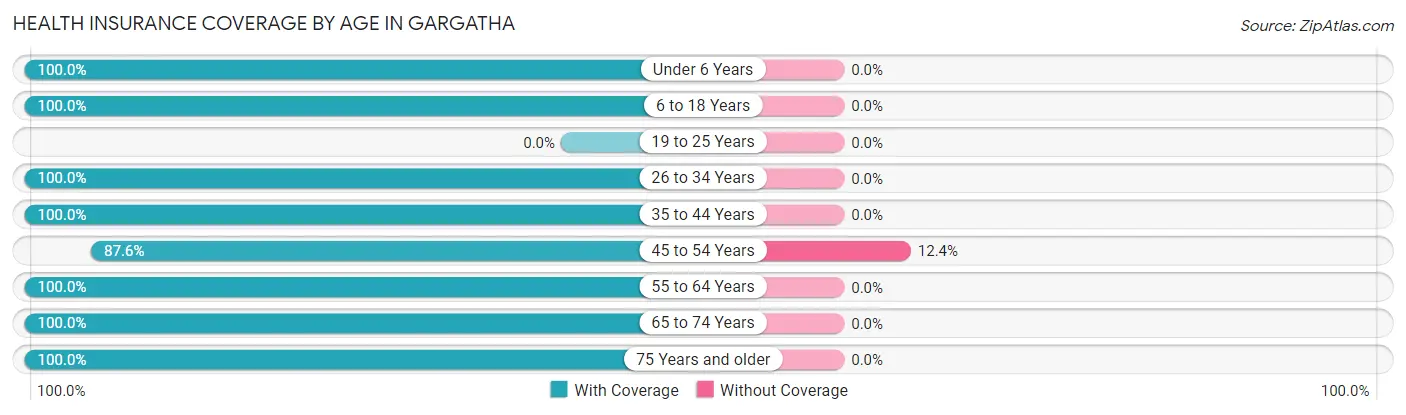
| Age Bracket | With Coverage | Without Coverage |
| Under 6 Years | 21 (100.0%) | 0 (0.0%) |
| 6 to 18 Years | 133 (100.0%) | 0 (0.0%) |
| 19 to 25 Years | 0 (0.0%) | 0 (0.0%) |
| 26 to 34 Years | 31 (100.0%) | 0 (0.0%) |
| 35 to 44 Years | 81 (100.0%) | 0 (0.0%) |
| 45 to 54 Years | 127 (87.6%) | 18 (12.4%) |
| 55 to 64 Years | 103 (100.0%) | 0 (0.0%) |
| 65 to 74 Years | 106 (100.0%) | 0 (0.0%) |
| 75 Years and older | 14 (100.0%) | 0 (0.0%) |
| Total | 616 (97.2%) | 18 (2.8%) |
Health Insurance Coverage by Citizenship Status in Gargatha
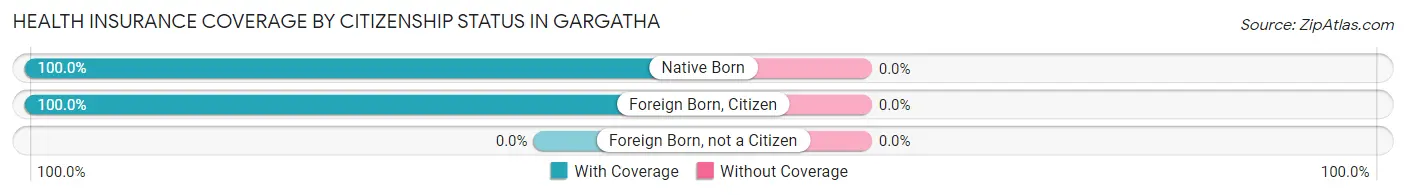
| Citizenship Status | With Coverage | Without Coverage |
| Native Born | 21 (100.0%) | 0 (0.0%) |
| Foreign Born, Citizen | 133 (100.0%) | 0 (0.0%) |
| Foreign Born, not a Citizen | 0 (0.0%) | 0 (0.0%) |
Health Insurance Coverage by Household Income in Gargatha
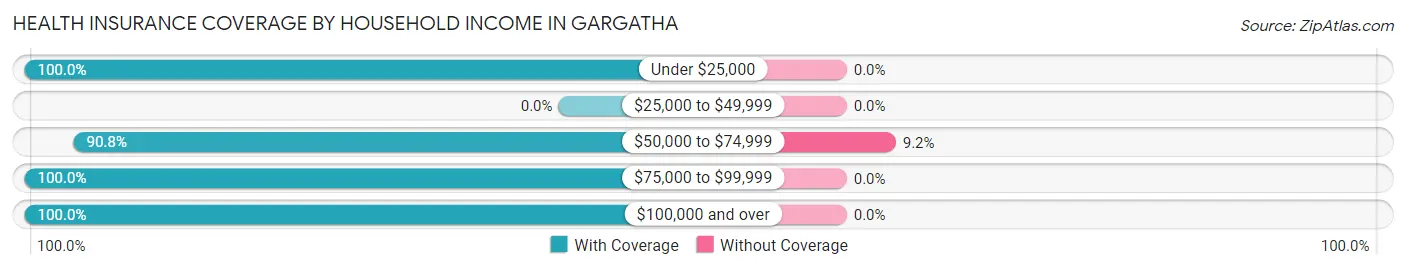
| Household Income | With Coverage | Without Coverage |
| Under $25,000 | 132 (100.0%) | 0 (0.0%) |
| $25,000 to $49,999 | 0 (0.0%) | 0 (0.0%) |
| $50,000 to $74,999 | 178 (90.8%) | 18 (9.2%) |
| $75,000 to $99,999 | 91 (100.0%) | 0 (0.0%) |
| $100,000 and over | 215 (100.0%) | 0 (0.0%) |
Public vs Private Health Insurance Coverage by Age in Gargatha
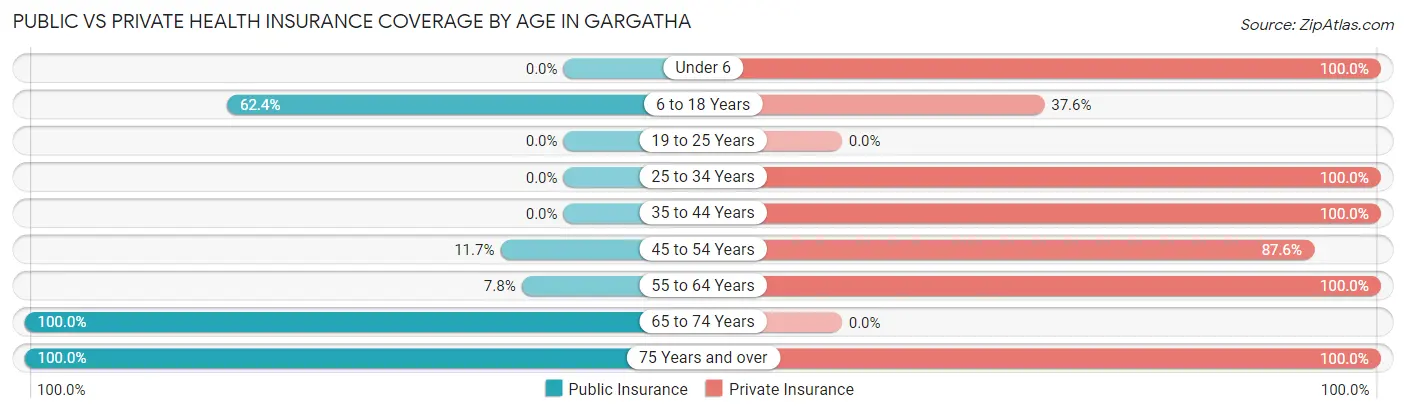
| Age Bracket | Public Insurance | Private Insurance |
| Under 6 | 0 (0.0%) | 21 (100.0%) |
| 6 to 18 Years | 83 (62.4%) | 50 (37.6%) |
| 19 to 25 Years | 0 (0.0%) | 0 (0.0%) |
| 25 to 34 Years | 0 (0.0%) | 31 (100.0%) |
| 35 to 44 Years | 0 (0.0%) | 81 (100.0%) |
| 45 to 54 Years | 17 (11.7%) | 127 (87.6%) |
| 55 to 64 Years | 8 (7.8%) | 103 (100.0%) |
| 65 to 74 Years | 106 (100.0%) | 0 (0.0%) |
| 75 Years and over | 14 (100.0%) | 14 (100.0%) |
| Total | 228 (36.0%) | 427 (67.3%) |
Disability Status by Sex by Age in Gargatha
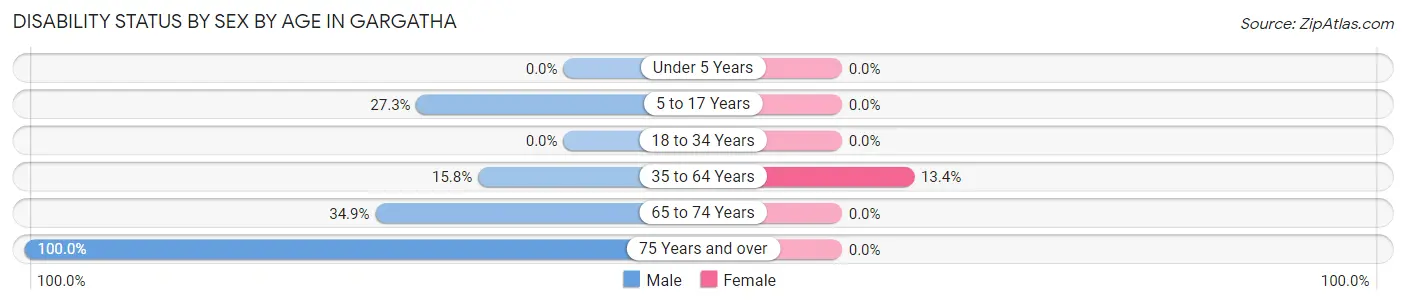
| Age Bracket | Male | Female |
| Under 5 Years | 0 (0.0%) | 0 (0.0%) |
| 5 to 17 Years | 6 (27.3%) | 0 (0.0%) |
| 18 to 34 Years | 0 (0.0%) | 0 (0.0%) |
| 35 to 64 Years | 19 (15.8%) | 28 (13.4%) |
| 65 to 74 Years | 37 (34.9%) | 0 (0.0%) |
| 75 Years and over | 14 (100.0%) | 0 (0.0%) |
Disability Class by Sex by Age in Gargatha
Disability Class: Hearing Difficulty

| Age Bracket | Male | Female |
| Under 5 Years | 0 (0.0%) | 0 (0.0%) |
| 5 to 17 Years | 0 (0.0%) | 0 (0.0%) |
| 18 to 34 Years | 0 (0.0%) | 0 (0.0%) |
| 35 to 64 Years | 0 (0.0%) | 23 (11.0%) |
| 65 to 74 Years | 0 (0.0%) | 0 (0.0%) |
| 75 Years and over | 0 (0.0%) | 0 (0.0%) |
Disability Class: Vision Difficulty
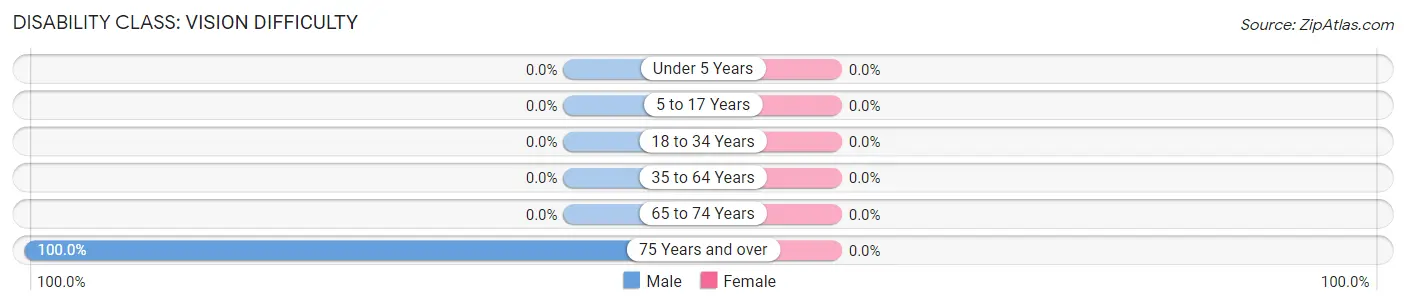
| Age Bracket | Male | Female |
| Under 5 Years | 0 (0.0%) | 0 (0.0%) |
| 5 to 17 Years | 0 (0.0%) | 0 (0.0%) |
| 18 to 34 Years | 0 (0.0%) | 0 (0.0%) |
| 35 to 64 Years | 0 (0.0%) | 0 (0.0%) |
| 65 to 74 Years | 0 (0.0%) | 0 (0.0%) |
| 75 Years and over | 14 (100.0%) | 0 (0.0%) |
Disability Class: Cognitive Difficulty
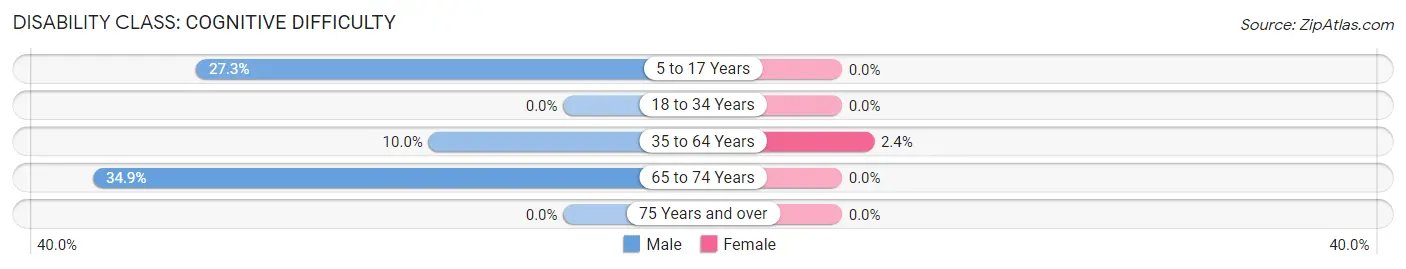
| Age Bracket | Male | Female |
| 5 to 17 Years | 6 (27.3%) | 0 (0.0%) |
| 18 to 34 Years | 0 (0.0%) | 0 (0.0%) |
| 35 to 64 Years | 12 (10.0%) | 5 (2.4%) |
| 65 to 74 Years | 37 (34.9%) | 0 (0.0%) |
| 75 Years and over | 0 (0.0%) | 0 (0.0%) |
Disability Class: Ambulatory Difficulty
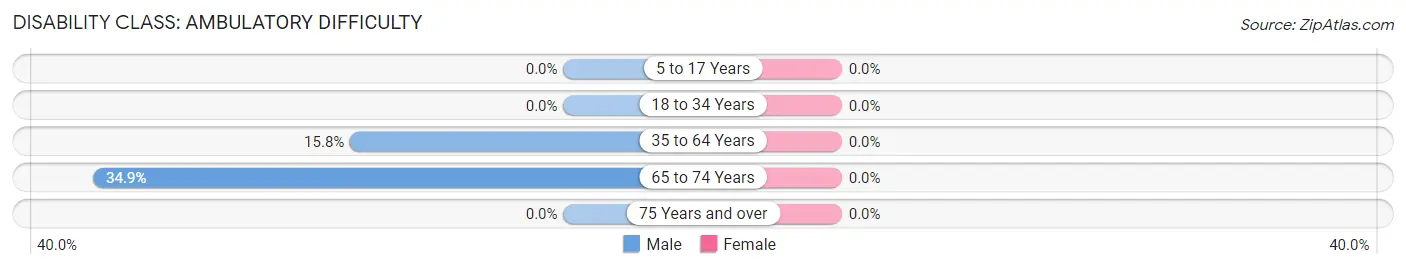
| Age Bracket | Male | Female |
| 5 to 17 Years | 0 (0.0%) | 0 (0.0%) |
| 18 to 34 Years | 0 (0.0%) | 0 (0.0%) |
| 35 to 64 Years | 19 (15.8%) | 0 (0.0%) |
| 65 to 74 Years | 37 (34.9%) | 0 (0.0%) |
| 75 Years and over | 0 (0.0%) | 0 (0.0%) |
Disability Class: Self-Care Difficulty
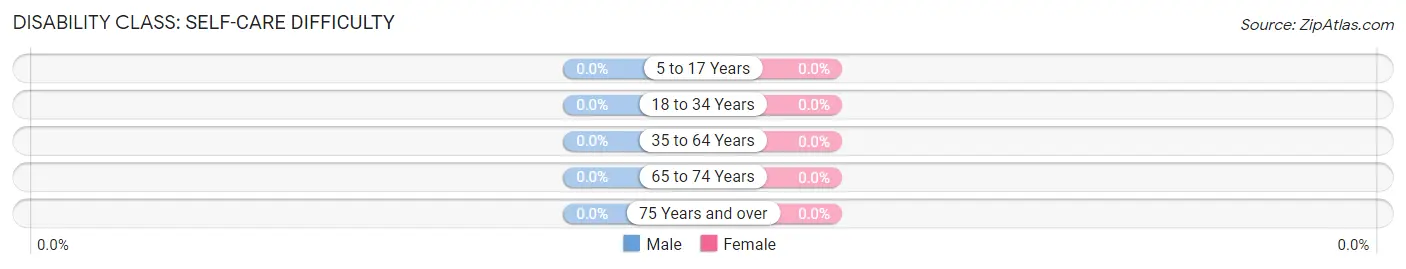
| Age Bracket | Male | Female |
| 5 to 17 Years | 0 (0.0%) | 0 (0.0%) |
| 18 to 34 Years | 0 (0.0%) | 0 (0.0%) |
| 35 to 64 Years | 0 (0.0%) | 0 (0.0%) |
| 65 to 74 Years | 0 (0.0%) | 0 (0.0%) |
| 75 Years and over | 0 (0.0%) | 0 (0.0%) |
Technology Access in Gargatha
Computing Device Access in Gargatha
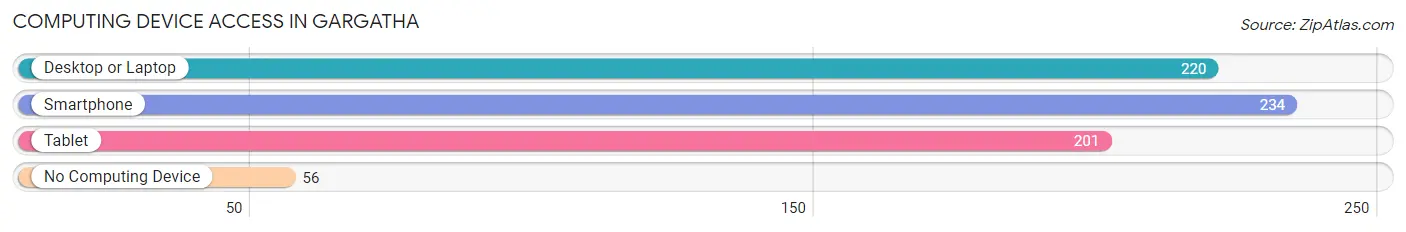
| Device Type | # Households | % Households |
| Desktop or Laptop | 220 | 75.9% |
| Smartphone | 234 | 80.7% |
| Tablet | 201 | 69.3% |
| No Computing Device | 56 | 19.3% |
| Total | 290 | 100.0% |
Internet Access in Gargatha
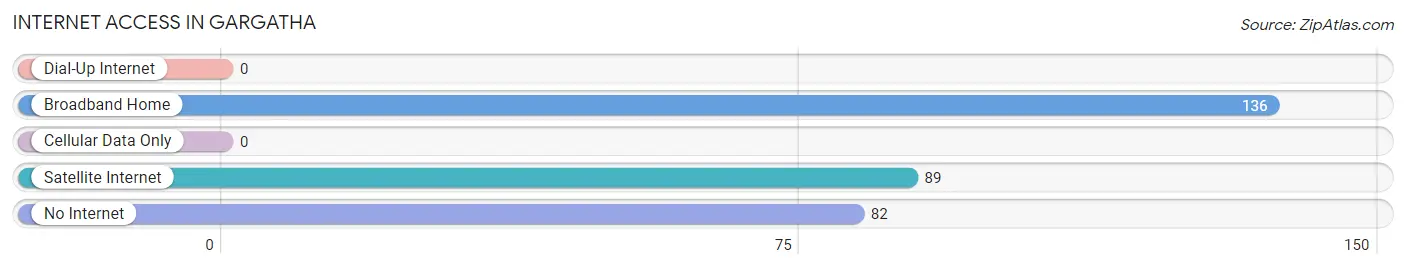
| Internet Type | # Households | % Households |
| Dial-Up Internet | 0 | 0.0% |
| Broadband Home | 136 | 46.9% |
| Cellular Data Only | 0 | 0.0% |
| Satellite Internet | 89 | 30.7% |
| No Internet | 82 | 28.3% |
| Total | 290 | 100.0% |
Gargatha Summary
Gargatha is an unincorporated community located in Accomack County, Virginia. It is situated on the Eastern Shore of Virginia, approximately 20 miles south of the Chesapeake Bay Bridge-Tunnel. The community is bordered by the towns of Painter, Bloxom, and Onancock.
History
Gargatha was first settled in the early 1700s by English colonists. The community was named after the nearby Gargatha Creek, which was named after the Native American tribe that once lived in the area. The first post office in the area was established in 1845.
In the late 1800s, the community was a thriving agricultural center. The area was known for its production of corn, wheat, and other crops. In the early 1900s, the community began to decline as the railroad bypassed the area.
Geography
Gargatha is located in Accomack County, Virginia. It is situated on the Eastern Shore of Virginia, approximately 20 miles south of the Chesapeake Bay Bridge-Tunnel. The community is bordered by the towns of Painter, Bloxom, and Onancock.
The area is mostly flat, with some rolling hills. The climate is mild, with temperatures ranging from the mid-30s in the winter to the mid-80s in the summer.
Economy
Gargatha is a rural community with a small population. The economy is largely based on agriculture, with corn, wheat, and other crops being grown in the area. There are also some small businesses in the area, including a few restaurants and convenience stores.
Demographics
As of the 2010 census, the population of Gargatha was 1,072. The racial makeup of the community was 94.3% White, 3.2% African American, 0.7% Native American, 0.3% Asian, and 1.5% from other races. The median household income was $37,917, and the median family income was $45,000.
Conclusion
Gargatha is a small, rural community located in Accomack County, Virginia. It has a long history of agricultural production, and the economy is still largely based on agriculture. The population is mostly White, with a small percentage of African Americans, Native Americans, and other races. The median household income is slightly below the national average.
Common Questions
What is Per Capita Income in Gargatha?
Per Capita income in Gargatha is $35,153.
What is the Median Household income in Gargatha?
Median Household Income in Gargatha is $79,375.
What is Inequality or Gini Index in Gargatha?
Inequality or Gini Index in Gargatha is 0.39.
What is the Total Population of Gargatha?
Total Population of Gargatha is 634.
What is the Total Male Population of Gargatha?
Total Male Population of Gargatha is 292.
What is the Total Female Population of Gargatha?
Total Female Population of Gargatha is 342.
What is the Ratio of Males per 100 Females in Gargatha?
There are 85.38 Males per 100 Females in Gargatha.
What is the Ratio of Females per 100 Males in Gargatha?
There are 117.12 Females per 100 Males in Gargatha.
What is the Median Population Age in Gargatha?
Median Population Age in Gargatha is 49.7 Years.
What is the Average Family Size in Gargatha
Average Family Size in Gargatha is 3.0 People.
What is the Average Household Size in Gargatha
Average Household Size in Gargatha is 2.2 People.
How Large is the Labor Force in Gargatha?
There are 324 People in the Labor Forcein in Gargatha.
What is the Percentage of People in the Labor Force in Gargatha?
67.5% of People are in the Labor Force in Gargatha.