University Center, VA Map & Demographics
University Center Map
University Center Overview
$45,129
PER CAPITA INCOME
$118,514
AVG FAMILY INCOME
$106,461
AVG HOUSEHOLD INCOME
10.1%
WAGE / INCOME GAP [ % ]
89.9¢/ $1
WAGE / INCOME GAP [ $ ]
0.41
INEQUALITY / GINI INDEX
4,223
TOTAL POPULATION
1,965
MALE POPULATION
2,258
FEMALE POPULATION
87.02
MALES / 100 FEMALES
114.91
FEMALES / 100 MALES
31.6
MEDIAN AGE
3.0
AVG FAMILY SIZE
2.4
AVG HOUSEHOLD SIZE
2,588
LABOR FORCE [ PEOPLE ]
76.4%
PERCENT IN LABOR FORCE
4.9%
UNEMPLOYMENT RATE
Income in University Center
Income Overview in University Center
Per Capita Income in University Center is $45,129, while median incomes of families and households are $118,514 and $106,461 respectively.
| Characteristic | Number | Measure |
| Per Capita Income | 4,223 | $45,129 |
| Median Family Income | 863 | $118,514 |
| Mean Family Income | 863 | $128,960 |
| Median Household Income | 1,771 | $106,461 |
| Mean Household Income | 1,771 | $106,628 |
| Income Deficit | 863 | $0 |
| Wage / Income Gap (%) | 4,223 | 10.14% |
| Wage / Income Gap ($) | 4,223 | 89.86¢ per $1 |
| Gini / Inequality Index | 4,223 | 0.41 |
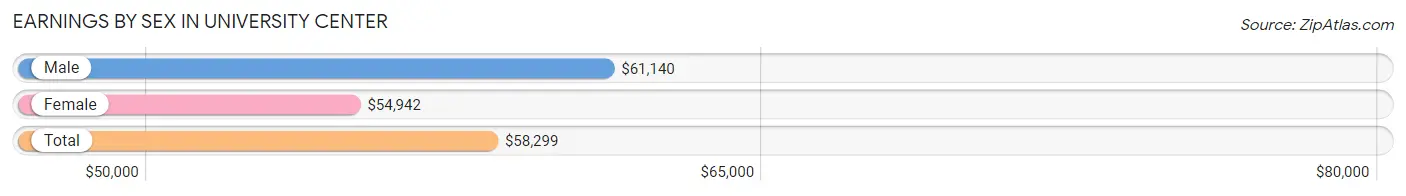
Earnings by Sex in University Center
Average Earnings in University Center are $58,299, $61,140 for men and $54,942 for women, a difference of 10.1%.
| Sex | Number | Average Earnings |
| Male | 1,445 (56.5%) | $61,140 |
| Female | 1,112 (43.5%) | $54,942 |
| Total | 2,557 (100.0%) | $58,299 |
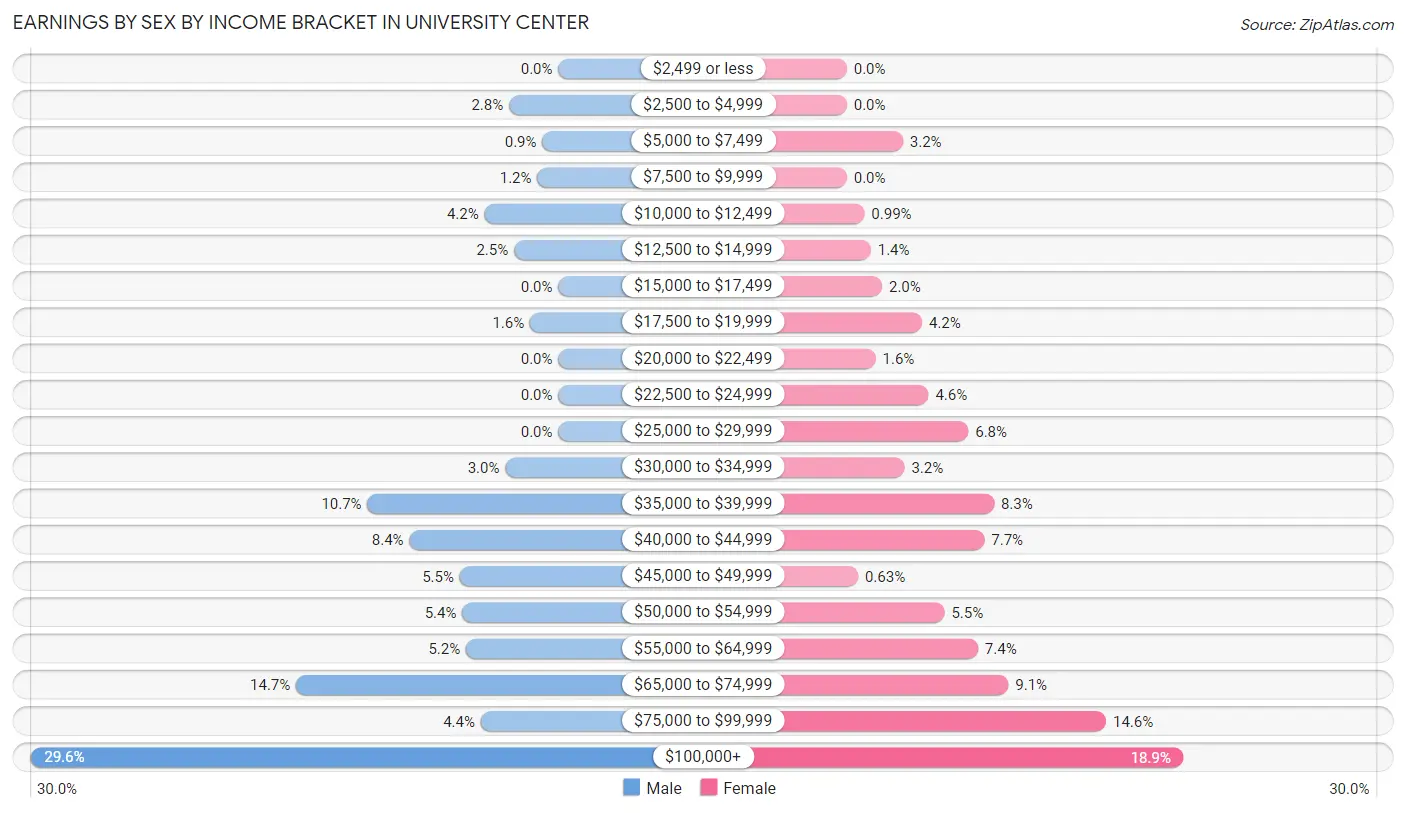
Earnings by Sex by Income Bracket in University Center
The most common earnings brackets in University Center are $100,000+ for men (428 | 29.6%) and $100,000+ for women (210 | 18.9%).
| Income | Male | Female |
| $2,499 or less | 0 (0.0%) | 0 (0.0%) |
| $2,500 to $4,999 | 40 (2.8%) | 0 (0.0%) |
| $5,000 to $7,499 | 13 (0.9%) | 35 (3.2%) |
| $7,500 to $9,999 | 17 (1.2%) | 0 (0.0%) |
| $10,000 to $12,499 | 60 (4.2%) | 11 (1.0%) |
| $12,500 to $14,999 | 36 (2.5%) | 15 (1.3%) |
| $15,000 to $17,499 | 0 (0.0%) | 22 (2.0%) |
| $17,500 to $19,999 | 23 (1.6%) | 47 (4.2%) |
| $20,000 to $22,499 | 0 (0.0%) | 18 (1.6%) |
| $22,500 to $24,999 | 0 (0.0%) | 51 (4.6%) |
| $25,000 to $29,999 | 0 (0.0%) | 76 (6.8%) |
| $30,000 to $34,999 | 43 (3.0%) | 36 (3.2%) |
| $35,000 to $39,999 | 155 (10.7%) | 92 (8.3%) |
| $40,000 to $44,999 | 121 (8.4%) | 86 (7.7%) |
| $45,000 to $49,999 | 80 (5.5%) | 7 (0.6%) |
| $50,000 to $54,999 | 78 (5.4%) | 61 (5.5%) |
| $55,000 to $64,999 | 75 (5.2%) | 82 (7.4%) |
| $65,000 to $74,999 | 213 (14.7%) | 101 (9.1%) |
| $75,000 to $99,999 | 63 (4.4%) | 162 (14.6%) |
| $100,000+ | 428 (29.6%) | 210 (18.9%) |
| Total | 1,445 (100.0%) | 1,112 (100.0%) |
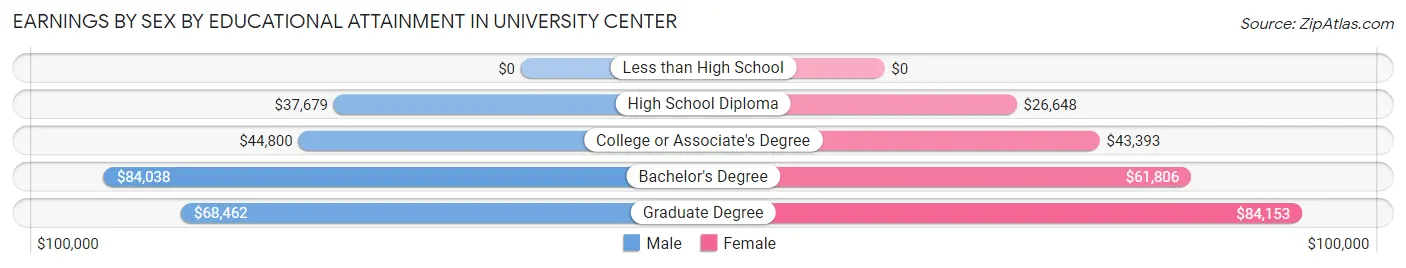
Earnings by Sex by Educational Attainment in University Center
Average earnings in University Center are $61,654 for men and $54,971 for women, a difference of 10.8%. Men with an educational attainment of bachelor's degree enjoy the highest average annual earnings of $84,038, while those with high school diploma education earn the least with $37,679. Women with an educational attainment of graduate degree earn the most with the average annual earnings of $84,153, while those with high school diploma education have the smallest earnings of $26,648.
| Educational Attainment | Male Income | Female Income |
| Less than High School | - | - |
| High School Diploma | $37,679 | $26,648 |
| College or Associate's Degree | $44,800 | $43,393 |
| Bachelor's Degree | $84,038 | $61,806 |
| Graduate Degree | $68,462 | $84,153 |
| Total | $61,654 | $54,971 |
Family Income in University Center
Family Income Brackets in University Center
According to the University Center family income data, there are 333 families falling into the $100,000 to $149,999 income range, which is the most common income bracket and makes up 38.6% of all families.
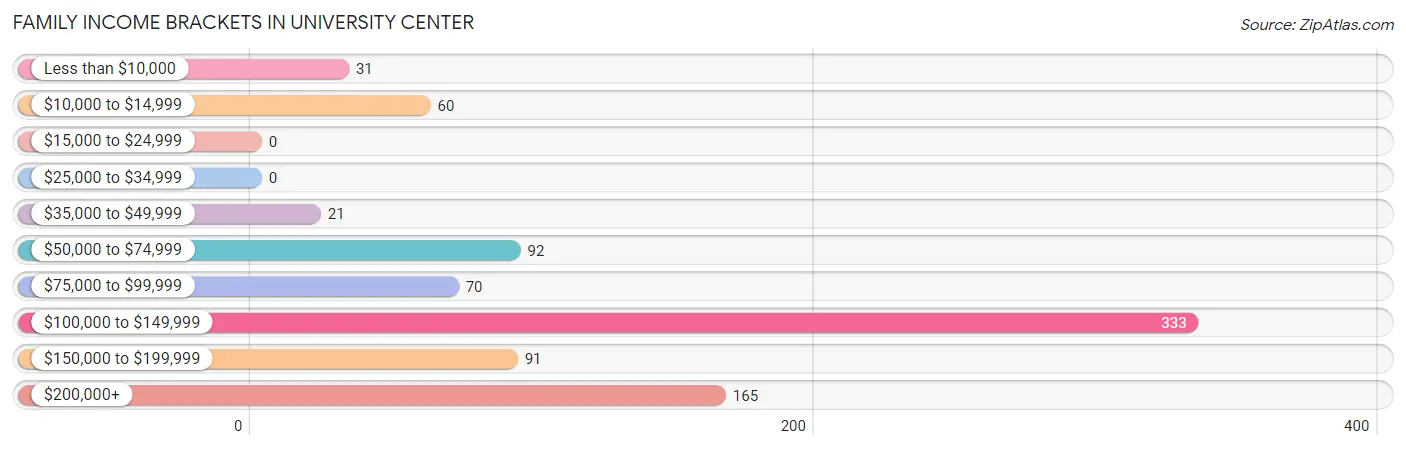
| Income Bracket | # Families | % Families |
| Less than $10,000 | 31 | 3.6% |
| $10,000 to $14,999 | 60 | 7.0% |
| $15,000 to $24,999 | 0 | 0.0% |
| $25,000 to $34,999 | 0 | 0.0% |
| $35,000 to $49,999 | 21 | 2.4% |
| $50,000 to $74,999 | 92 | 10.7% |
| $75,000 to $99,999 | 70 | 8.1% |
| $100,000 to $149,999 | 333 | 38.6% |
| $150,000 to $199,999 | 91 | 10.5% |
| $200,000+ | 165 | 19.1% |
Family Income by Famaliy Size in University Center
3-person families (302 | 35.0%) account for the highest median family income in University Center with $142,600 per family, while 3-person families (302 | 35.0%) have the highest median income of $47,533 per family member.
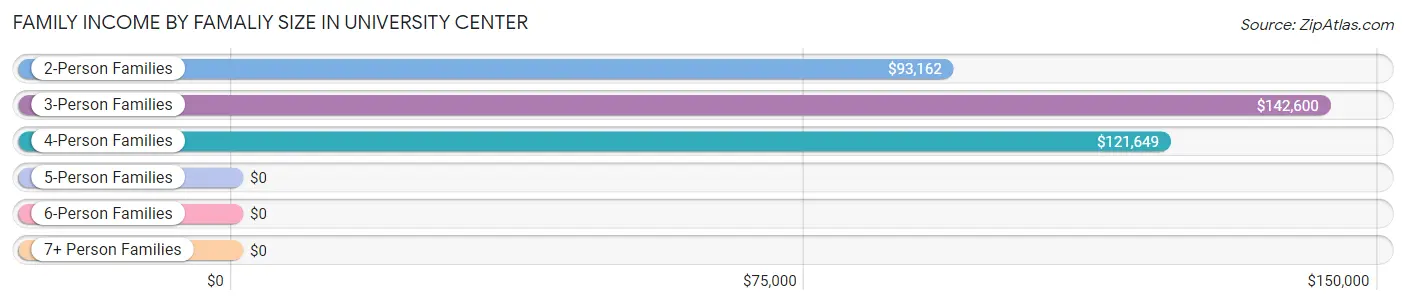
| Income Bracket | # Families | Median Income |
| 2-Person Families | 331 (38.4%) | $93,162 |
| 3-Person Families | 302 (35.0%) | $142,600 |
| 4-Person Families | 162 (18.8%) | $121,649 |
| 5-Person Families | 68 (7.9%) | $0 |
| 6-Person Families | 0 (0.0%) | $0 |
| 7+ Person Families | 0 (0.0%) | $0 |
| Total | 863 (100.0%) | $118,514 |
Family Income by Number of Earners in University Center
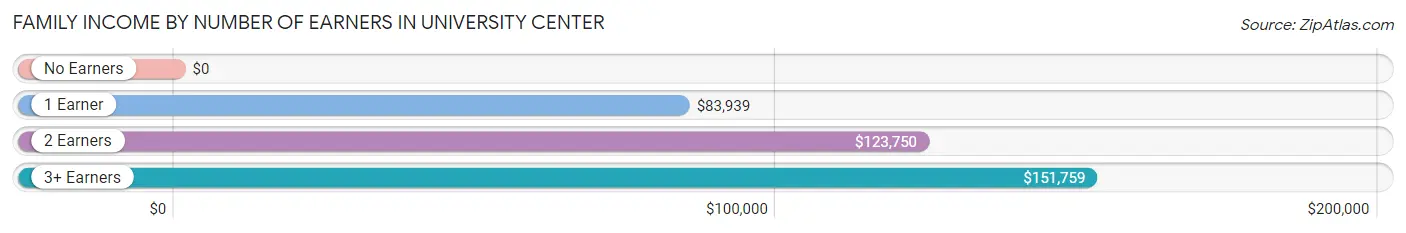
| Number of Earners | # Families | Median Income |
| No Earners | 40 (4.6%) | $0 |
| 1 Earner | 354 (41.0%) | $83,939 |
| 2 Earners | 405 (46.9%) | $123,750 |
| 3+ Earners | 64 (7.4%) | $151,759 |
| Total | 863 (100.0%) | $118,514 |
Household Income in University Center
Household Income Brackets in University Center
With 512 households falling in the category, the $100,000 to $149,999 income range is the most frequent in University Center, accounting for 28.9% of all households. In contrast, only 41 households (2.3%) fall into the $15,000 to $24,999 income bracket, making it the least populous group.
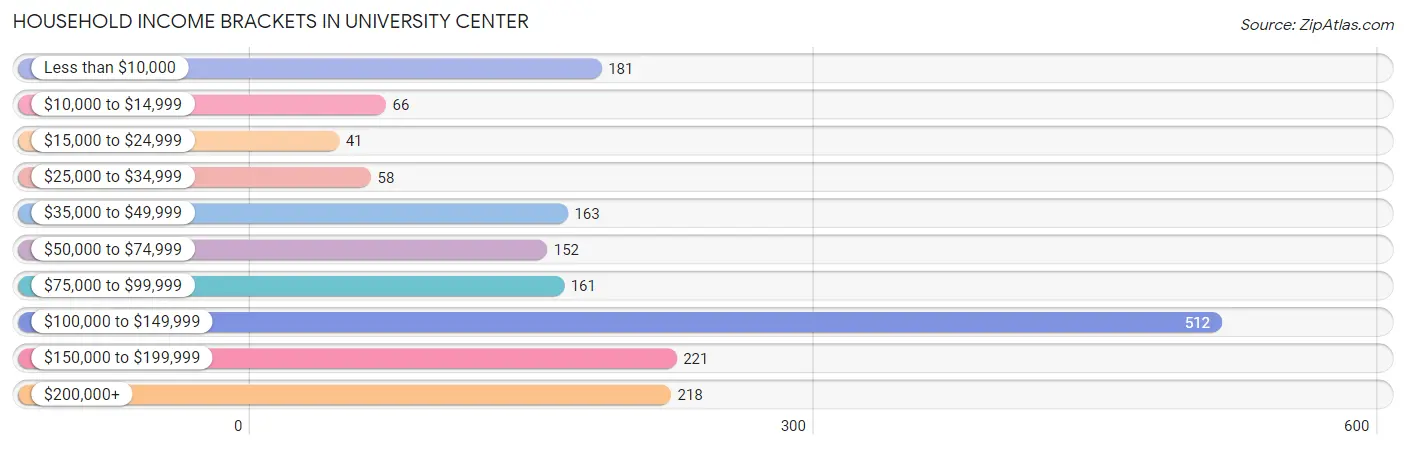
| Income Bracket | # Households | % Households |
| Less than $10,000 | 181 | 10.2% |
| $10,000 to $14,999 | 66 | 3.7% |
| $15,000 to $24,999 | 41 | 2.3% |
| $25,000 to $34,999 | 58 | 3.3% |
| $35,000 to $49,999 | 163 | 9.2% |
| $50,000 to $74,999 | 152 | 8.6% |
| $75,000 to $99,999 | 161 | 9.1% |
| $100,000 to $149,999 | 512 | 28.9% |
| $150,000 to $199,999 | 221 | 12.5% |
| $200,000+ | 218 | 12.3% |
Household Income by Householder Age in University Center
The median household income in University Center is $106,461, with the highest median household income of $118,797 found in the 45 to 64 years age bracket for the primary householder. A total of 355 households (20.1%) fall into this category. Meanwhile, the 15 to 24 years age bracket for the primary householder has the lowest median household income of $0, with 83 households (4.7%) in this group.
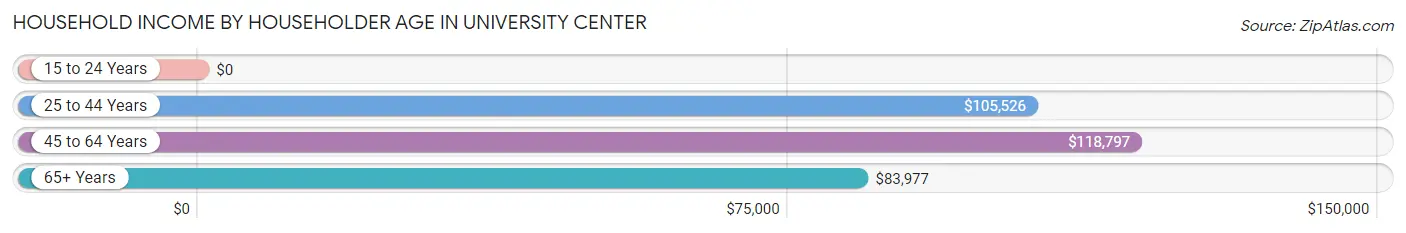
| Income Bracket | # Households | Median Income |
| 15 to 24 Years | 83 (4.7%) | $0 |
| 25 to 44 Years | 1,196 (67.5%) | $105,526 |
| 45 to 64 Years | 355 (20.1%) | $118,797 |
| 65+ Years | 137 (7.7%) | $83,977 |
| Total | 1,771 (100.0%) | $106,461 |
Poverty in University Center
Income Below Poverty by Sex and Age in University Center
With 5.5% poverty level for males and 23.3% for females among the residents of University Center, 25 to 34 year old males and under 5 year old females are the most vulnerable to poverty, with 100 males (12.2%) and 57 females (55.9%) in their respective age groups living below the poverty level.
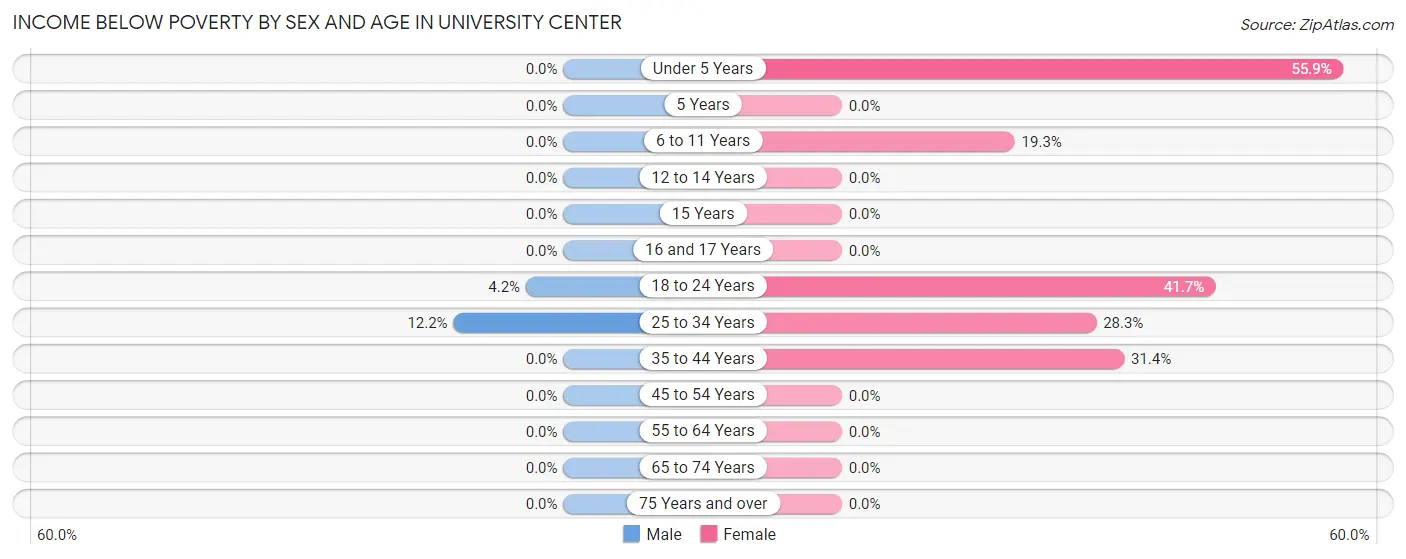
| Age Bracket | Male | Female |
| Under 5 Years | 0 (0.0%) | 57 (55.9%) |
| 5 Years | 0 (0.0%) | 0 (0.0%) |
| 6 to 11 Years | 0 (0.0%) | 31 (19.3%) |
| 12 to 14 Years | 0 (0.0%) | 0 (0.0%) |
| 15 Years | 0 (0.0%) | 0 (0.0%) |
| 16 and 17 Years | 0 (0.0%) | 0 (0.0%) |
| 18 to 24 Years | 5 (4.2%) | 105 (41.7%) |
| 25 to 34 Years | 100 (12.2%) | 230 (28.3%) |
| 35 to 44 Years | 0 (0.0%) | 88 (31.4%) |
| 45 to 54 Years | 0 (0.0%) | 0 (0.0%) |
| 55 to 64 Years | 0 (0.0%) | 0 (0.0%) |
| 65 to 74 Years | 0 (0.0%) | 0 (0.0%) |
| 75 Years and over | 0 (0.0%) | 0 (0.0%) |
| Total | 105 (5.5%) | 511 (23.3%) |
Income Above Poverty by Sex and Age in University Center
According to the poverty statistics in University Center, males aged under 5 years and females aged 5 years are the age groups that are most secure financially, with 100.0% of males and 100.0% of females in these age groups living above the poverty line.
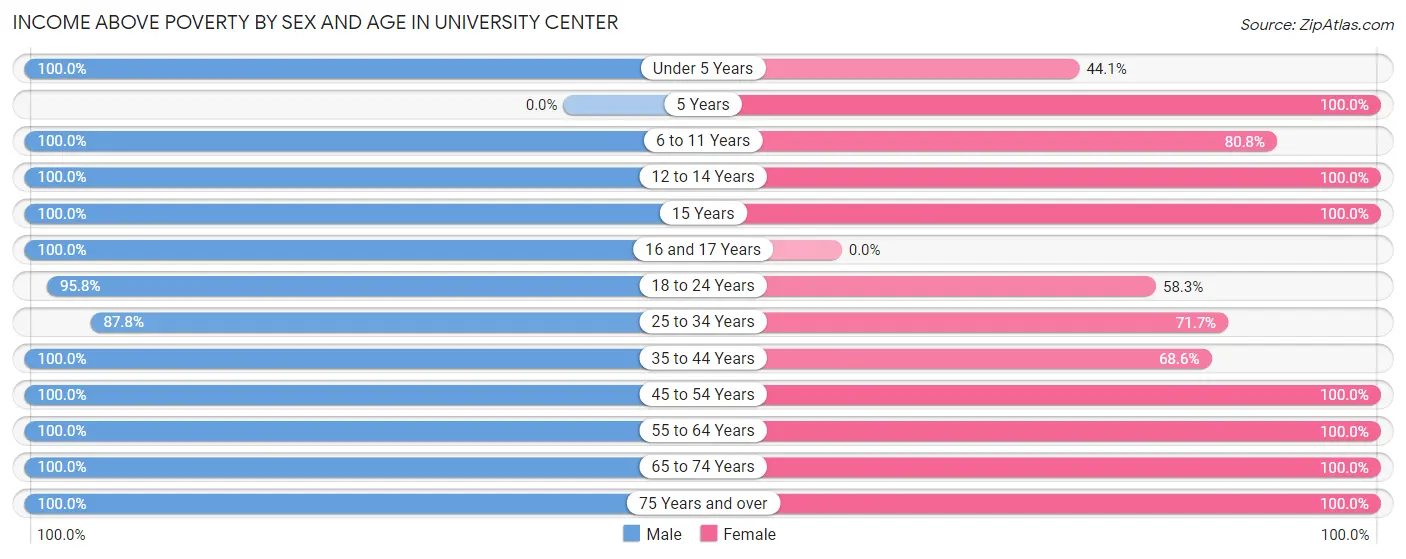
| Age Bracket | Male | Female |
| Under 5 Years | 156 (100.0%) | 45 (44.1%) |
| 5 Years | 0 (0.0%) | 53 (100.0%) |
| 6 to 11 Years | 150 (100.0%) | 130 (80.7%) |
| 12 to 14 Years | 61 (100.0%) | 2 (100.0%) |
| 15 Years | 24 (100.0%) | 9 (100.0%) |
| 16 and 17 Years | 6 (100.0%) | 0 (0.0%) |
| 18 to 24 Years | 115 (95.8%) | 147 (58.3%) |
| 25 to 34 Years | 717 (87.8%) | 582 (71.7%) |
| 35 to 44 Years | 250 (100.0%) | 192 (68.6%) |
| 45 to 54 Years | 152 (100.0%) | 189 (100.0%) |
| 55 to 64 Years | 90 (100.0%) | 134 (100.0%) |
| 65 to 74 Years | 81 (100.0%) | 136 (100.0%) |
| 75 Years and over | 9 (100.0%) | 59 (100.0%) |
| Total | 1,811 (94.5%) | 1,678 (76.7%) |
Income Below Poverty Among Married-Couple Families in University Center
The poverty statistics for married-couple families in University Center show that 9.1% or 60 of the total 662 families live below the poverty line. Families with 1 or 2 children have the highest poverty rate of 14.3%, comprising of 60 families. On the other hand, families with no children have the lowest poverty rate of 0.0%, which includes 0 families.
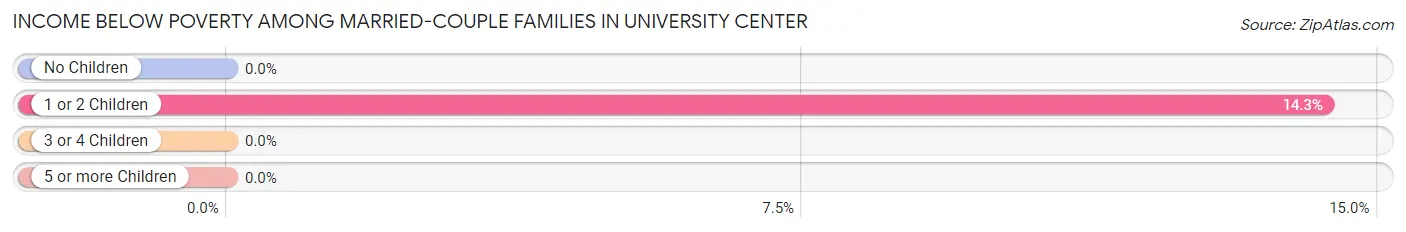
| Children | Above Poverty | Below Poverty |
| No Children | 243 (100.0%) | 0 (0.0%) |
| 1 or 2 Children | 359 (85.7%) | 60 (14.3%) |
| 3 or 4 Children | 0 (0.0%) | 0 (0.0%) |
| 5 or more Children | 0 (0.0%) | 0 (0.0%) |
| Total | 602 (90.9%) | 60 (9.1%) |
Income Below Poverty Among Single-Parent Households in University Center
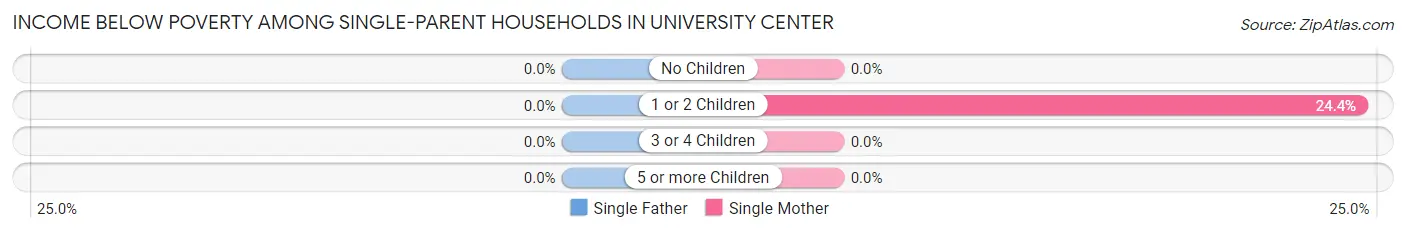
| Children | Single Father | Single Mother |
| No Children | 0 (0.0%) | 0 (0.0%) |
| 1 or 2 Children | 0 (0.0%) | 31 (24.4%) |
| 3 or 4 Children | 0 (0.0%) | 0 (0.0%) |
| 5 or more Children | 0 (0.0%) | 0 (0.0%) |
| Total | 0 (0.0%) | 31 (20.0%) |
Income Below Poverty Among Married-Couple vs Single-Parent Households in University Center
The poverty data for University Center shows that 60 of the married-couple family households (9.1%) and 31 of the single-parent households (15.4%) are living below the poverty level. Within the married-couple family households, those with 1 or 2 children have the highest poverty rate, with 60 households (14.3%) falling below the poverty line. Among the single-parent households, those with 1 or 2 children have the highest poverty rate, with 31 household (24.4%) living below poverty.
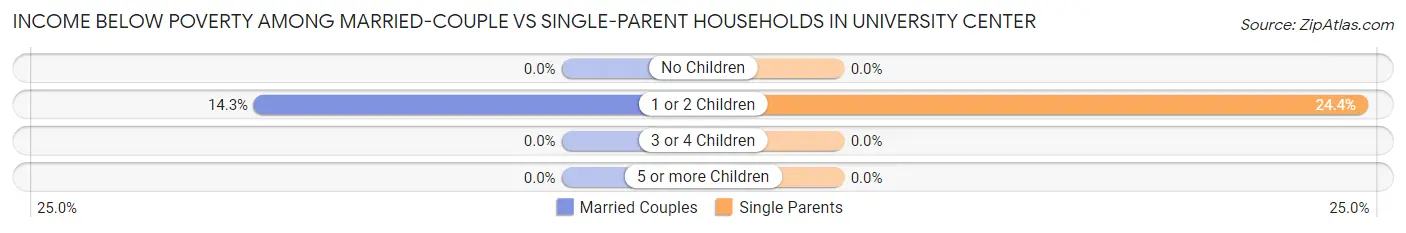
| Children | Married-Couple Families | Single-Parent Households |
| No Children | 0 (0.0%) | 0 (0.0%) |
| 1 or 2 Children | 60 (14.3%) | 31 (24.4%) |
| 3 or 4 Children | 0 (0.0%) | 0 (0.0%) |
| 5 or more Children | 0 (0.0%) | 0 (0.0%) |
| Total | 60 (9.1%) | 31 (15.4%) |
Race in University Center
The most populous races in University Center are White / Caucasian (1,858 | 44.0%), Hispanic or Latino (1,227 | 29.1%), and Asian (883 | 20.9%).
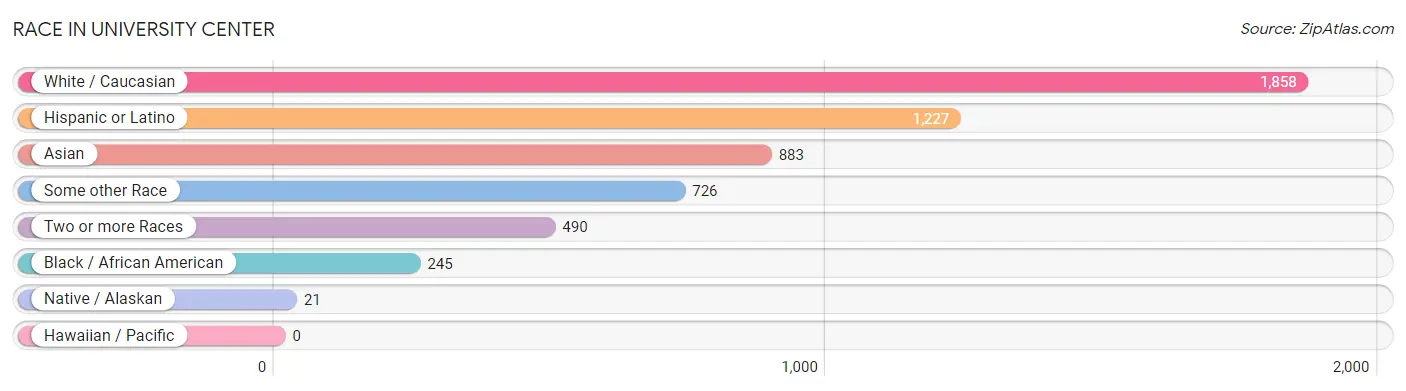
| Race | # Population | % Population |
| Asian | 883 | 20.9% |
| Black / African American | 245 | 5.8% |
| Hawaiian / Pacific | 0 | 0.0% |
| Hispanic or Latino | 1,227 | 29.1% |
| Native / Alaskan | 21 | 0.5% |
| White / Caucasian | 1,858 | 44.0% |
| Two or more Races | 490 | 11.6% |
| Some other Race | 726 | 17.2% |
| Total | 4,223 | 100.0% |
Ancestry in University Center
The most populous ancestries reported in University Center are Central American (597 | 14.1%), American (418 | 9.9%), Salvadoran (414 | 9.8%), Sri Lankan (414 | 9.8%), and Irish (390 | 9.2%), together accounting for 52.9% of all University Center residents.
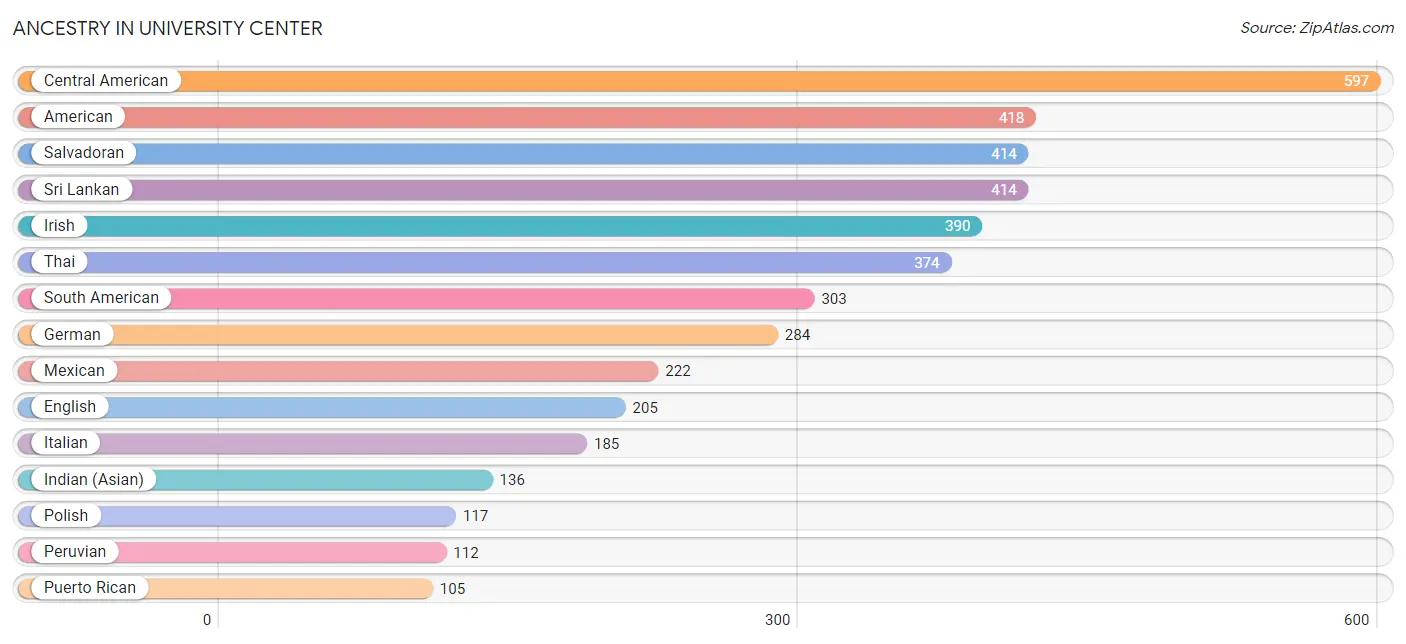
| Ancestry | # Population | % Population |
| African | 22 | 0.5% |
| American | 418 | 9.9% |
| Bolivian | 67 | 1.6% |
| British | 27 | 0.6% |
| Burmese | 21 | 0.5% |
| Central American | 597 | 14.1% |
| Central American Indian | 22 | 0.5% |
| Cherokee | 61 | 1.4% |
| Colombian | 96 | 2.3% |
| Eastern European | 61 | 1.4% |
| Ecuadorian | 19 | 0.4% |
| English | 205 | 4.9% |
| European | 35 | 0.8% |
| French | 3 | 0.1% |
| French Canadian | 42 | 1.0% |
| German | 284 | 6.7% |
| Guatemalan | 97 | 2.3% |
| Honduran | 86 | 2.0% |
| Indian (Asian) | 136 | 3.2% |
| Irish | 390 | 9.2% |
| Italian | 185 | 4.4% |
| Korean | 33 | 0.8% |
| Lithuanian | 23 | 0.5% |
| Macedonian | 13 | 0.3% |
| Mexican | 222 | 5.3% |
| Nigerian | 10 | 0.2% |
| Northern European | 6 | 0.1% |
| Peruvian | 112 | 2.6% |
| Polish | 117 | 2.8% |
| Puerto Rican | 105 | 2.5% |
| Romanian | 45 | 1.1% |
| Russian | 30 | 0.7% |
| Salvadoran | 414 | 9.8% |
| Scandinavian | 21 | 0.5% |
| Scotch-Irish | 5 | 0.1% |
| Scottish | 64 | 1.5% |
| Serbian | 12 | 0.3% |
| South American | 303 | 7.2% |
| Sri Lankan | 414 | 9.8% |
| Subsaharan African | 32 | 0.8% |
| Swedish | 38 | 0.9% |
| Thai | 374 | 8.9% |
| Ukrainian | 28 | 0.7% |
| Uruguayan | 9 | 0.2% |
| Welsh | 14 | 0.3% | View All 45 Rows |
Immigrants in University Center
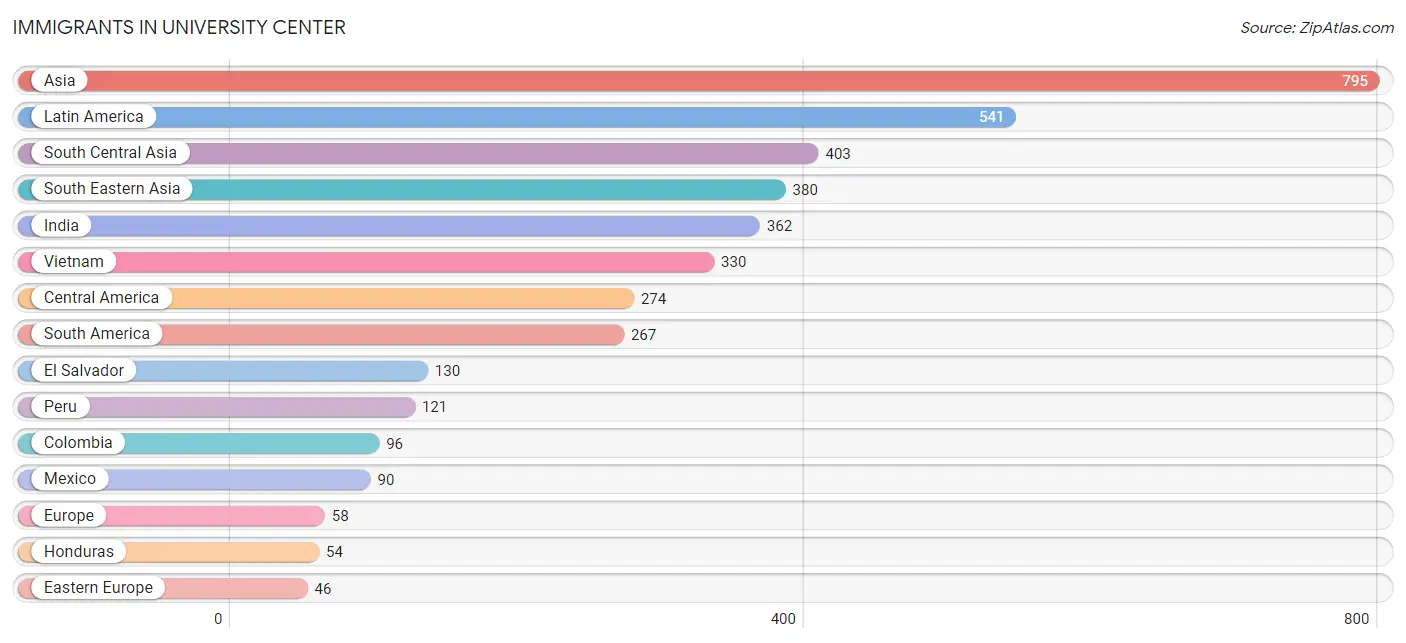
The most numerous immigrant groups reported in University Center came from Asia (795 | 18.8%), Latin America (541 | 12.8%), South Central Asia (403 | 9.5%), South Eastern Asia (380 | 9.0%), and India (362 | 8.6%), together accounting for 58.8% of all University Center residents.
| Immigration Origin | # Population | % Population |
| Africa | 29 | 0.7% |
| Asia | 795 | 18.8% |
| Bolivia | 30 | 0.7% |
| Canada | 17 | 0.4% |
| Central America | 274 | 6.5% |
| China | 6 | 0.1% |
| Colombia | 96 | 2.3% |
| Eastern Africa | 19 | 0.4% |
| Eastern Asia | 12 | 0.3% |
| Eastern Europe | 46 | 1.1% |
| Ecuador | 19 | 0.4% |
| El Salvador | 130 | 3.1% |
| Ethiopia | 19 | 0.4% |
| Europe | 58 | 1.4% |
| Germany | 6 | 0.1% |
| Honduras | 54 | 1.3% |
| Hong Kong | 6 | 0.1% |
| India | 362 | 8.6% |
| Korea | 6 | 0.1% |
| Latin America | 541 | 12.8% |
| Malaysia | 17 | 0.4% |
| Mexico | 90 | 2.1% |
| Nigeria | 10 | 0.2% |
| North Macedonia | 13 | 0.3% |
| Northern Europe | 6 | 0.1% |
| Pakistan | 41 | 1.0% |
| Peru | 121 | 2.9% |
| Philippines | 33 | 0.8% |
| Romania | 21 | 0.5% |
| Serbia | 12 | 0.3% |
| South America | 267 | 6.3% |
| South Central Asia | 403 | 9.5% |
| South Eastern Asia | 380 | 9.0% |
| Uruguay | 1 | 0.0% |
| Vietnam | 330 | 7.8% |
| Western Africa | 10 | 0.2% |
| Western Europe | 6 | 0.1% | View All 37 Rows |
Sex and Age in University Center
Sex and Age in University Center
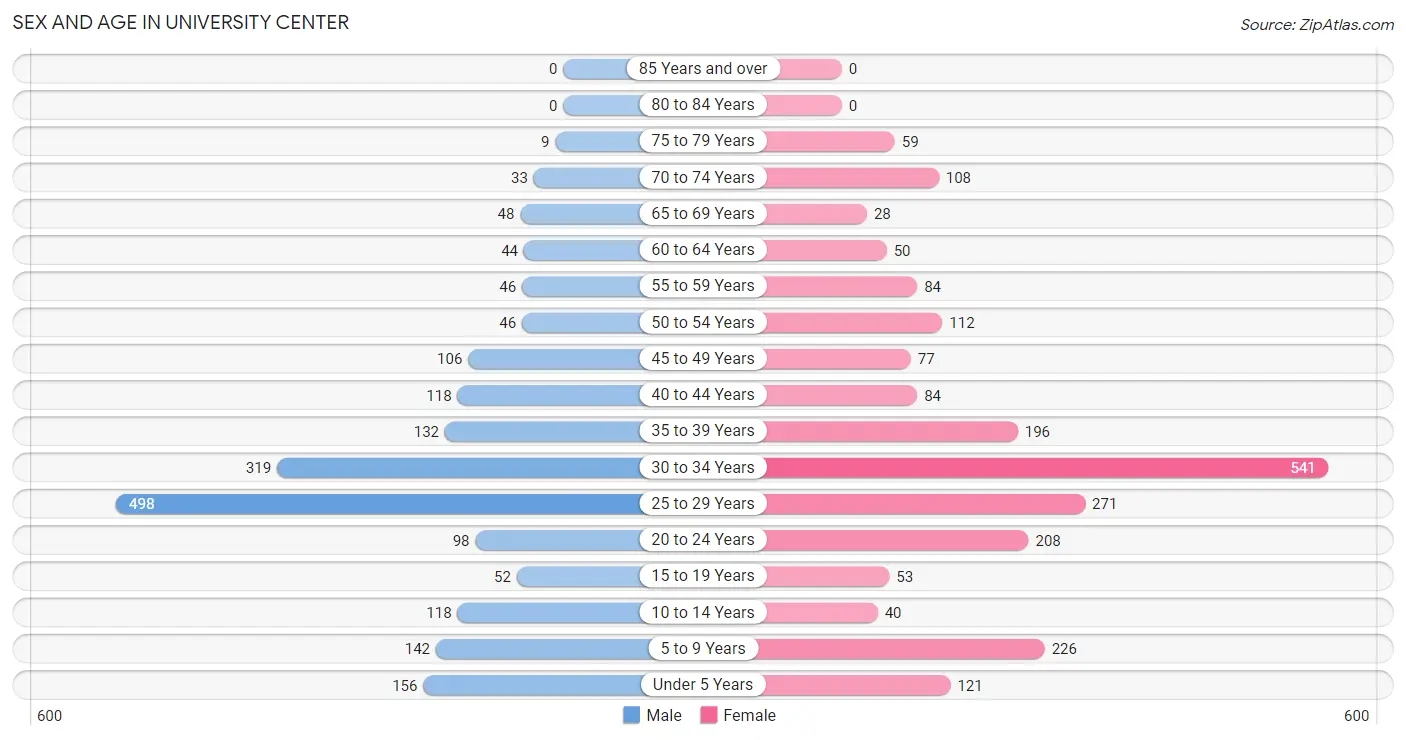
The most populous age groups in University Center are 25 to 29 Years (498 | 25.3%) for men and 30 to 34 Years (541 | 24.0%) for women.
| Age Bracket | Male | Female |
| Under 5 Years | 156 (7.9%) | 121 (5.4%) |
| 5 to 9 Years | 142 (7.2%) | 226 (10.0%) |
| 10 to 14 Years | 118 (6.0%) | 40 (1.8%) |
| 15 to 19 Years | 52 (2.6%) | 53 (2.4%) |
| 20 to 24 Years | 98 (5.0%) | 208 (9.2%) |
| 25 to 29 Years | 498 (25.3%) | 271 (12.0%) |
| 30 to 34 Years | 319 (16.2%) | 541 (24.0%) |
| 35 to 39 Years | 132 (6.7%) | 196 (8.7%) |
| 40 to 44 Years | 118 (6.0%) | 84 (3.7%) |
| 45 to 49 Years | 106 (5.4%) | 77 (3.4%) |
| 50 to 54 Years | 46 (2.3%) | 112 (5.0%) |
| 55 to 59 Years | 46 (2.3%) | 84 (3.7%) |
| 60 to 64 Years | 44 (2.2%) | 50 (2.2%) |
| 65 to 69 Years | 48 (2.4%) | 28 (1.2%) |
| 70 to 74 Years | 33 (1.7%) | 108 (4.8%) |
| 75 to 79 Years | 9 (0.5%) | 59 (2.6%) |
| 80 to 84 Years | 0 (0.0%) | 0 (0.0%) |
| 85 Years and over | 0 (0.0%) | 0 (0.0%) |
| Total | 1,965 (100.0%) | 2,258 (100.0%) |
Families and Households in University Center
Median Family Size in University Center
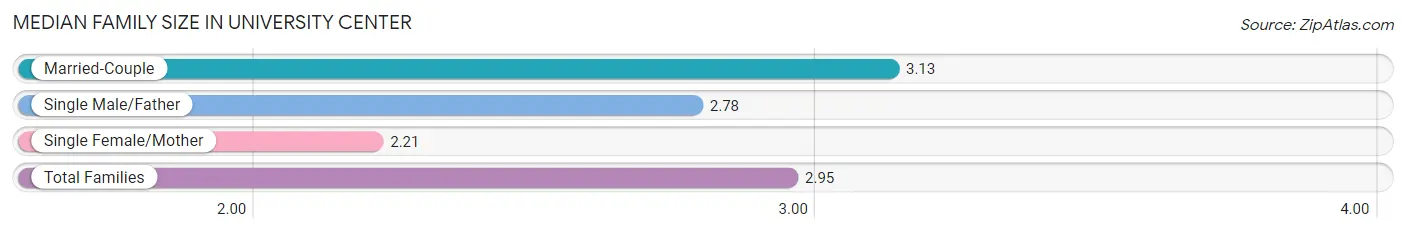
The median family size in University Center is 2.95 persons per family, with married-couple families (662 | 76.7%) accounting for the largest median family size of 3.13 persons per family. On the other hand, single female/mother families (155 | 18.0%) represent the smallest median family size with 2.21 persons per family.
| Family Type | # Families | Family Size |
| Married-Couple | 662 (76.7%) | 3.13 |
| Single Male/Father | 46 (5.3%) | 2.78 |
| Single Female/Mother | 155 (18.0%) | 2.21 |
| Total Families | 863 (100.0%) | 2.95 |
Median Household Size in University Center
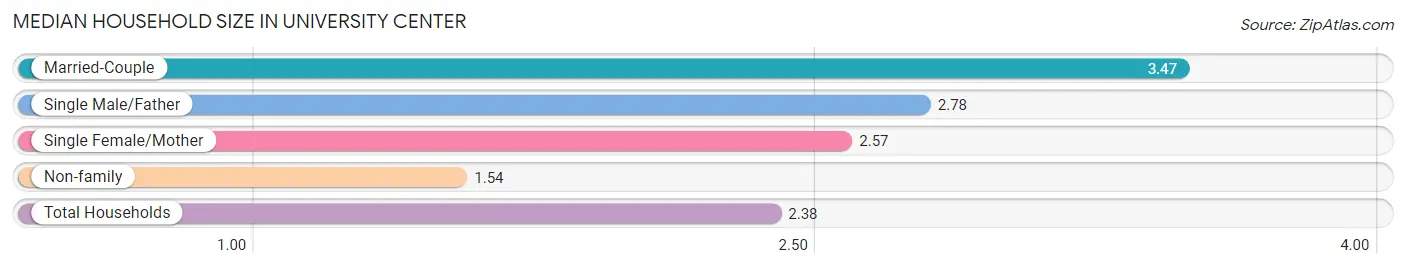
The median household size in University Center is 2.38 persons per household, with married-couple households (662 | 37.4%) accounting for the largest median household size of 3.47 persons per household. non-family households (908 | 51.3%) represent the smallest median household size with 1.54 persons per household.
| Household Type | # Households | Household Size |
| Married-Couple | 662 (37.4%) | 3.47 |
| Single Male/Father | 46 (2.6%) | 2.78 |
| Single Female/Mother | 155 (8.7%) | 2.57 |
| Non-family | 908 (51.3%) | 1.54 |
| Total Households | 1,771 (100.0%) | 2.38 |
Household Size by Marriage Status in University Center
Out of a total of 1,771 households in University Center, 863 (48.7%) are family households, while 908 (51.3%) are nonfamily households. The most numerous type of family households are 2-person households, comprising 281, and the most common type of nonfamily households are 1-person households, comprising 535.
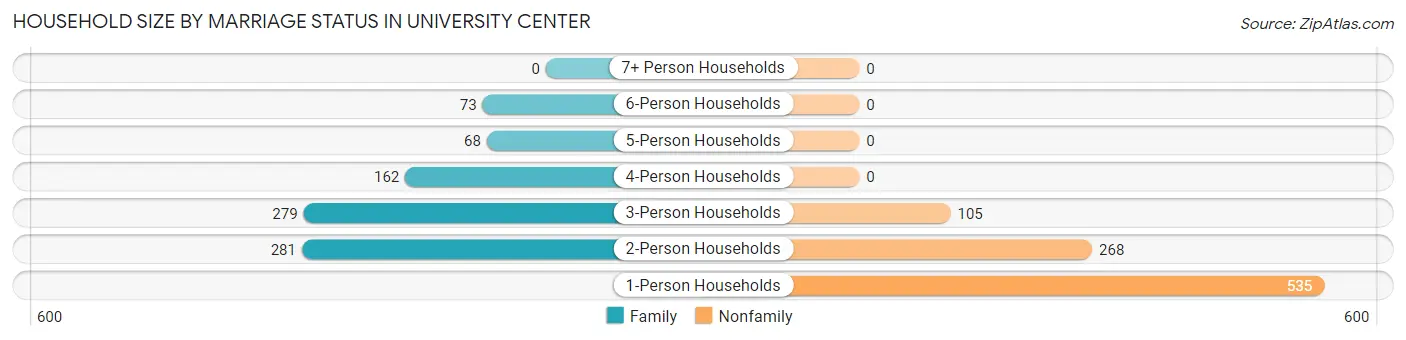
| Household Size | Family Households | Nonfamily Households |
| 1-Person Households | - | 535 (30.2%) |
| 2-Person Households | 281 (15.9%) | 268 (15.1%) |
| 3-Person Households | 279 (15.8%) | 105 (5.9%) |
| 4-Person Households | 162 (9.1%) | 0 (0.0%) |
| 5-Person Households | 68 (3.8%) | 0 (0.0%) |
| 6-Person Households | 73 (4.1%) | 0 (0.0%) |
| 7+ Person Households | 0 (0.0%) | 0 (0.0%) |
| Total | 863 (48.7%) | 908 (51.3%) |
Female Fertility in University Center
Fertility by Age in University Center
Average fertility rate in University Center is 44.0 births per 1,000 women. Women in the age bracket of 20 to 34 years have the highest fertility rate with 64.0 births per 1,000 women. Women in the age bracket of 20 to 34 years acount for 100.0% of all women with births.
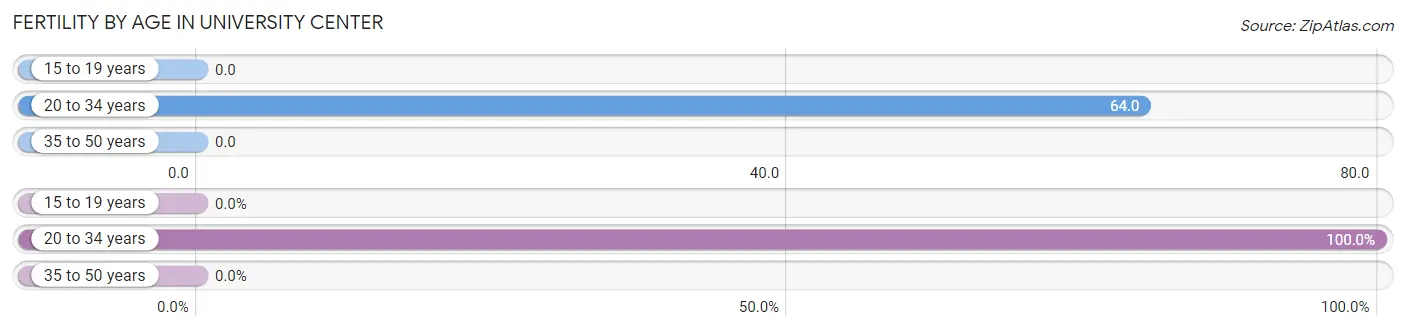
| Age Bracket | Women with Births | Births / 1,000 Women |
| 15 to 19 years | 0 (0.0%) | 0.0 |
| 20 to 34 years | 65 (100.0%) | 64.0 |
| 35 to 50 years | 0 (0.0%) | 0.0 |
| Total | 65 (100.0%) | 44.0 |
Fertility by Age by Marriage Status in University Center
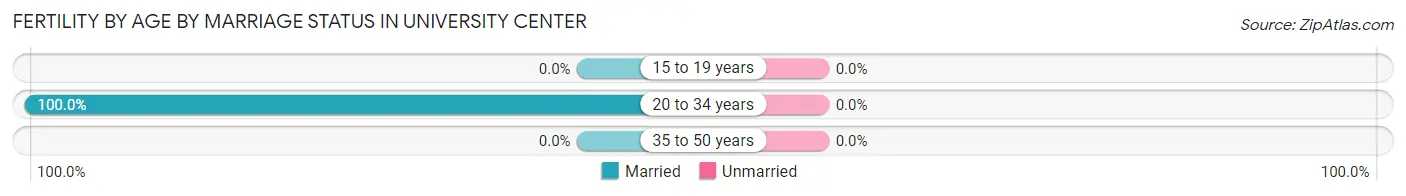
| Age Bracket | Married | Unmarried |
| 15 to 19 years | 0 (0.0%) | 0 (0.0%) |
| 20 to 34 years | 65 (100.0%) | 0 (0.0%) |
| 35 to 50 years | 0 (0.0%) | 0 (0.0%) |
| Total | 65 (100.0%) | 0 (0.0%) |
Fertility by Education in University Center
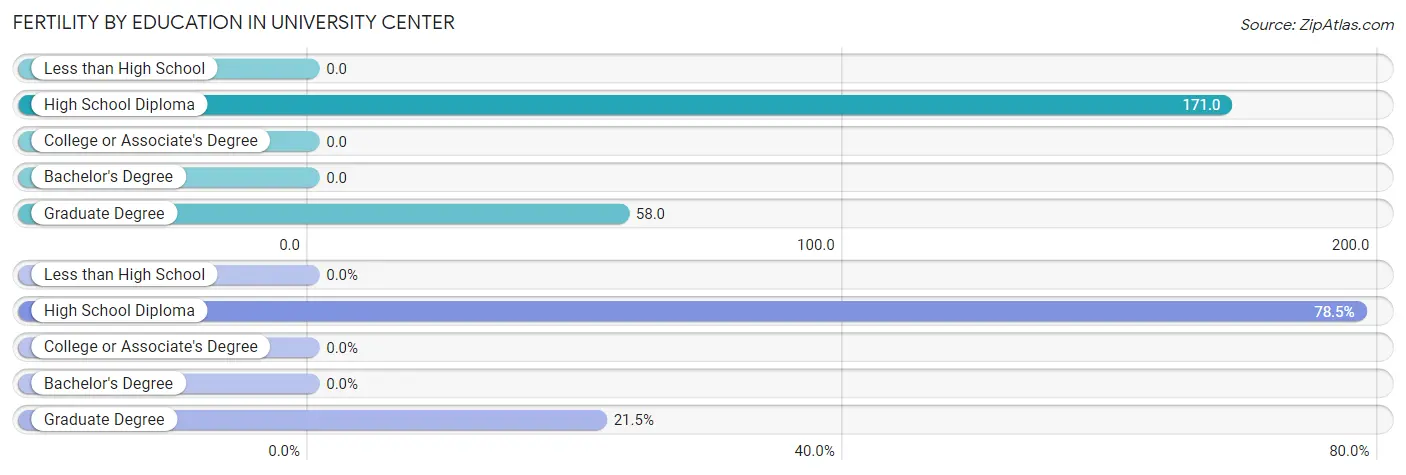
| Educational Attainment | Women with Births | Births / 1,000 Women |
| Less than High School | 0 (0.0%) | 0.0 |
| High School Diploma | 51 (78.5%) | 171.0 |
| College or Associate's Degree | 0 (0.0%) | 0.0 |
| Bachelor's Degree | 0 (0.0%) | 0.0 |
| Graduate Degree | 14 (21.5%) | 58.0 |
| Total | 65 (100.0%) | 44.0 |
Fertility by Education by Marriage Status in University Center
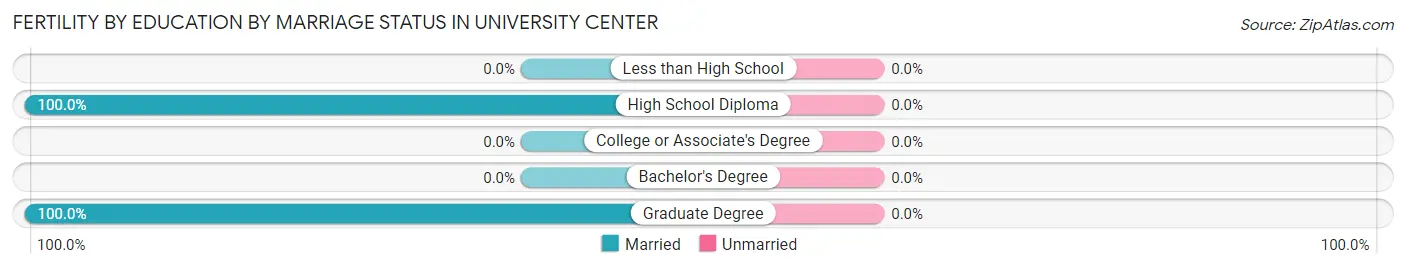
| Educational Attainment | Married | Unmarried |
| Less than High School | 0 (0.0%) | 0 (0.0%) |
| High School Diploma | 51 (100.0%) | 0 (0.0%) |
| College or Associate's Degree | 0 (0.0%) | 0 (0.0%) |
| Bachelor's Degree | 0 (0.0%) | 0 (0.0%) |
| Graduate Degree | 14 (100.0%) | 0 (0.0%) |
| Total | 65 (100.0%) | 0 (0.0%) |
Employment Characteristics in University Center
Employment by Class of Employer in University Center
Among the 2,452 employed individuals in University Center, private company employees (1,865 | 76.1%), not-for-profit organizations (170 | 6.9%), and self-employed (not incorporated) (166 | 6.8%) make up the most common classes of employment.
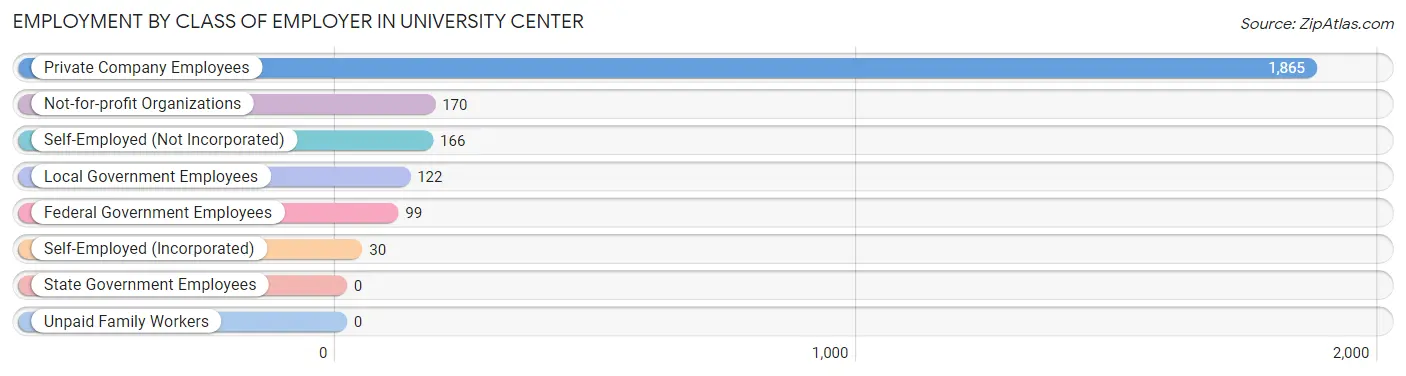
| Employer Class | # Employees | % Employees |
| Private Company Employees | 1,865 | 76.1% |
| Self-Employed (Incorporated) | 30 | 1.2% |
| Self-Employed (Not Incorporated) | 166 | 6.8% |
| Not-for-profit Organizations | 170 | 6.9% |
| Local Government Employees | 122 | 5.0% |
| State Government Employees | 0 | 0.0% |
| Federal Government Employees | 99 | 4.0% |
| Unpaid Family Workers | 0 | 0.0% |
| Total | 2,452 | 100.0% |
Employment Status by Age in University Center
According to the labor force statistics for University Center, out of the total population over 16 years of age (3,387), 76.4% or 2,588 individuals are in the labor force, with 4.9% or 127 of them unemployed. The age group with the highest labor force participation rate is 45 to 54 years, with 100.0% or 341 individuals in the labor force. Within the labor force, the 30 to 34 years age range has the highest percentage of unemployed individuals, with 15.3% or 116 of them being unemployed.
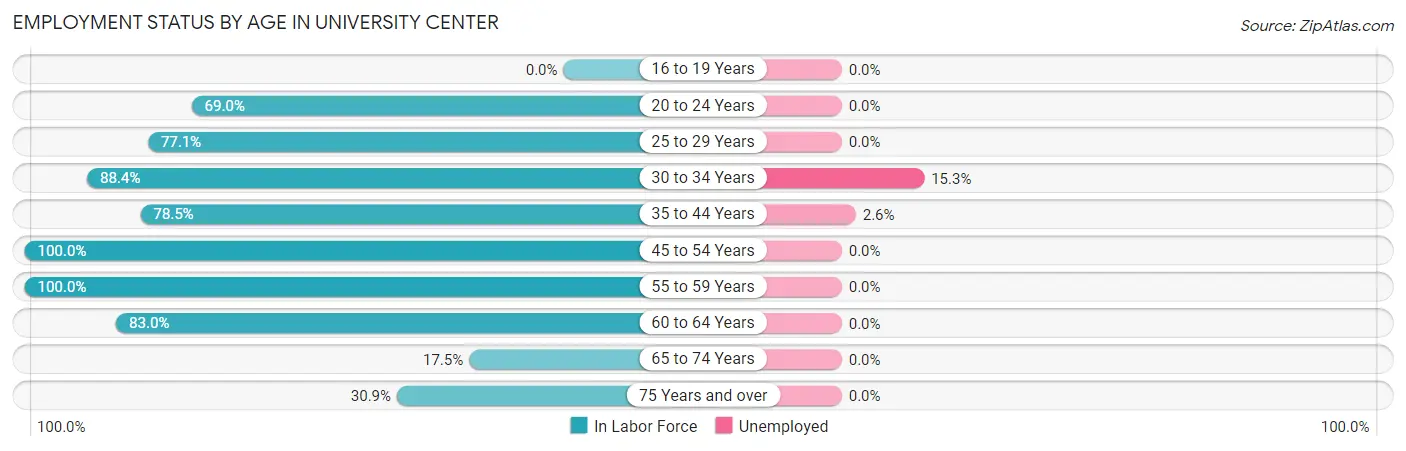
| Age Bracket | In Labor Force | Unemployed |
| 16 to 19 Years | 0 (0.0%) | 0 (0.0%) |
| 20 to 24 Years | 211 (69.0%) | 0 (0.0%) |
| 25 to 29 Years | 593 (77.1%) | 0 (0.0%) |
| 30 to 34 Years | 760 (88.4%) | 116 (15.3%) |
| 35 to 44 Years | 416 (78.5%) | 11 (2.6%) |
| 45 to 54 Years | 341 (100.0%) | 0 (0.0%) |
| 55 to 59 Years | 130 (100.0%) | 0 (0.0%) |
| 60 to 64 Years | 78 (83.0%) | 0 (0.0%) |
| 65 to 74 Years | 38 (17.5%) | 0 (0.0%) |
| 75 Years and over | 21 (30.9%) | 0 (0.0%) |
| Total | 2,588 (76.4%) | 127 (4.9%) |
Employment Status by Educational Attainment in University Center
According to labor force statistics for University Center, 85.1% of individuals (2,318) out of the total population between 25 and 64 years of age (2,724) are in the labor force, with 5.5% or 127 of them being unemployed. The group with the highest labor force participation rate are those with the educational attainment of college / associate degree, with 97.4% or 721 individuals in the labor force. Within the labor force, individuals with bachelor's degree or higher education have the highest percentage of unemployment, with 7.6% or 95 of them being unemployed.
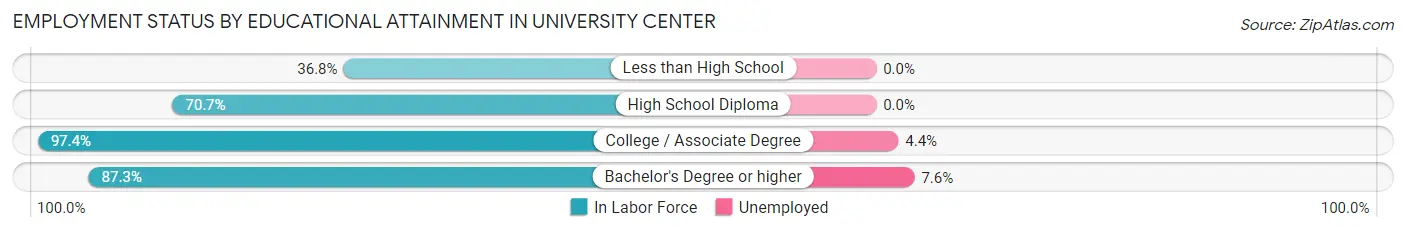
| Educational Attainment | In Labor Force | Unemployed |
| Less than High School | 46 (36.8%) | 0 (0.0%) |
| High School Diploma | 306 (70.7%) | 0 (0.0%) |
| College / Associate Degree | 721 (97.4%) | 33 (4.4%) |
| Bachelor's Degree or higher | 1,245 (87.3%) | 108 (7.6%) |
| Total | 2,318 (85.1%) | 150 (5.5%) |
Employment Occupations by Sex in University Center
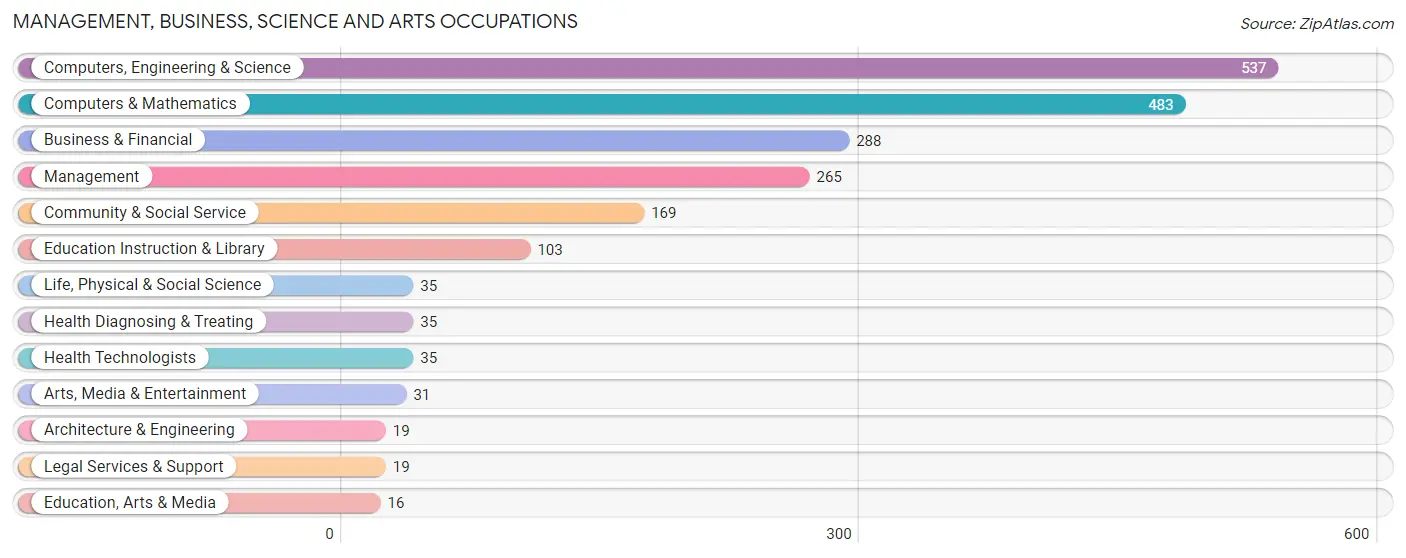
Management, Business, Science and Arts Occupations
The most common Management, Business, Science and Arts occupations in University Center are Computers, Engineering & Science (537 | 21.8%), Computers & Mathematics (483 | 19.6%), Business & Financial (288 | 11.7%), Management (265 | 10.8%), and Community & Social Service (169 | 6.9%).
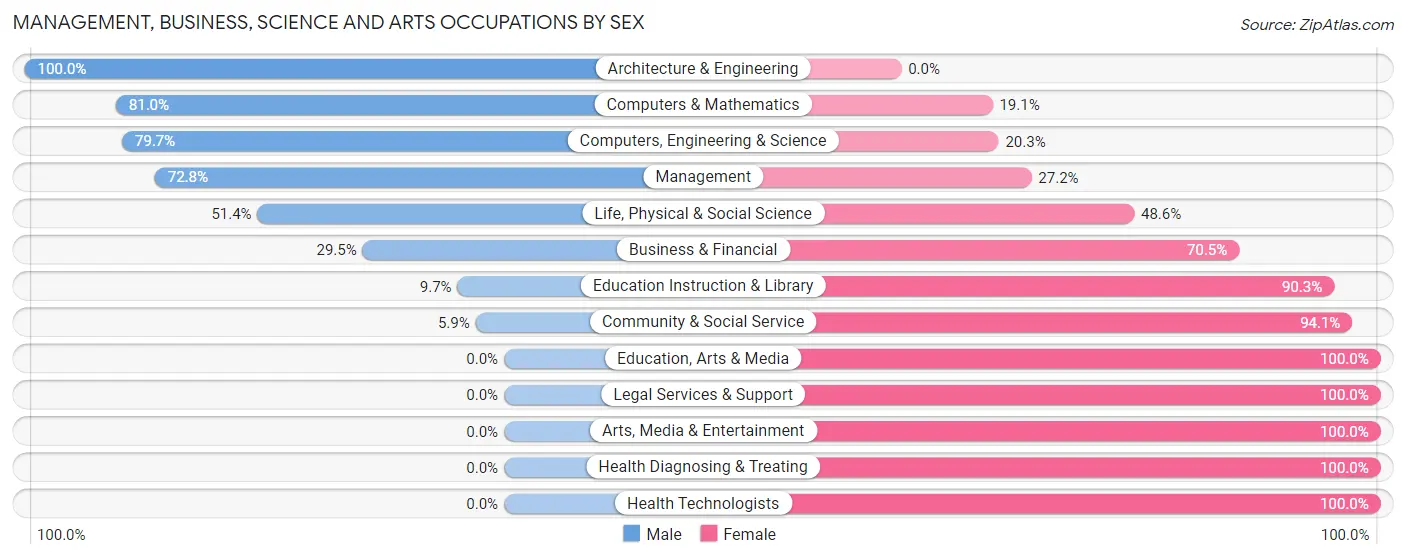
Management, Business, Science and Arts Occupations by Sex
Within the Management, Business, Science and Arts occupations in University Center, the most male-oriented occupations are Architecture & Engineering (100.0%), Computers & Mathematics (80.9%), and Computers, Engineering & Science (79.7%), while the most female-oriented occupations are Education, Arts & Media (100.0%), Legal Services & Support (100.0%), and Arts, Media & Entertainment (100.0%).
| Occupation | Male | Female |
| Management | 193 (72.8%) | 72 (27.2%) |
| Business & Financial | 85 (29.5%) | 203 (70.5%) |
| Computers, Engineering & Science | 428 (79.7%) | 109 (20.3%) |
| Computers & Mathematics | 391 (80.9%) | 92 (19.1%) |
| Architecture & Engineering | 19 (100.0%) | 0 (0.0%) |
| Life, Physical & Social Science | 18 (51.4%) | 17 (48.6%) |
| Community & Social Service | 10 (5.9%) | 159 (94.1%) |
| Education, Arts & Media | 0 (0.0%) | 16 (100.0%) |
| Legal Services & Support | 0 (0.0%) | 19 (100.0%) |
| Education Instruction & Library | 10 (9.7%) | 93 (90.3%) |
| Arts, Media & Entertainment | 0 (0.0%) | 31 (100.0%) |
| Health Diagnosing & Treating | 0 (0.0%) | 35 (100.0%) |
| Health Technologists | 0 (0.0%) | 35 (100.0%) |
| Total (Category) | 716 (55.3%) | 578 (44.7%) |
| Total (Overall) | 1,395 (56.7%) | 1,066 (43.3%) |
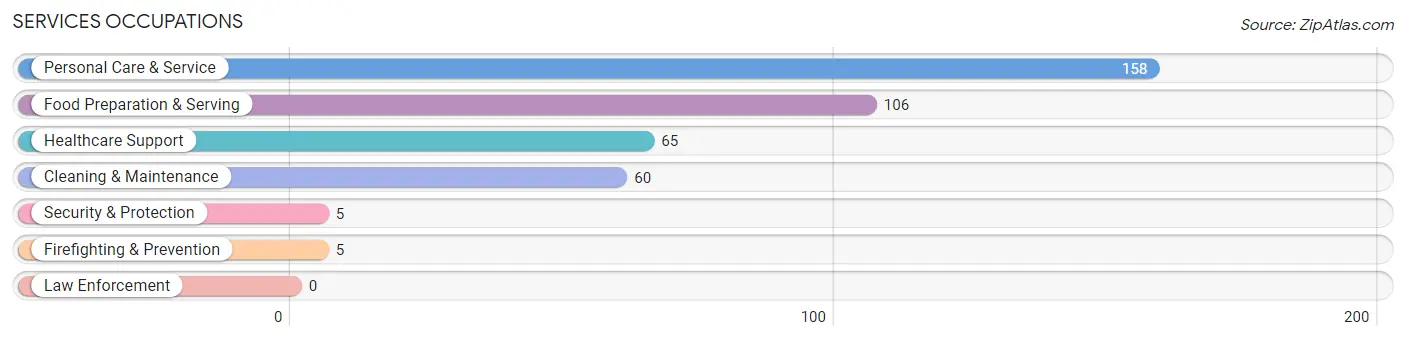
Services Occupations
The most common Services occupations in University Center are Personal Care & Service (158 | 6.4%), Food Preparation & Serving (106 | 4.3%), Healthcare Support (65 | 2.6%), Cleaning & Maintenance (60 | 2.4%), and Security & Protection (5 | 0.2%).
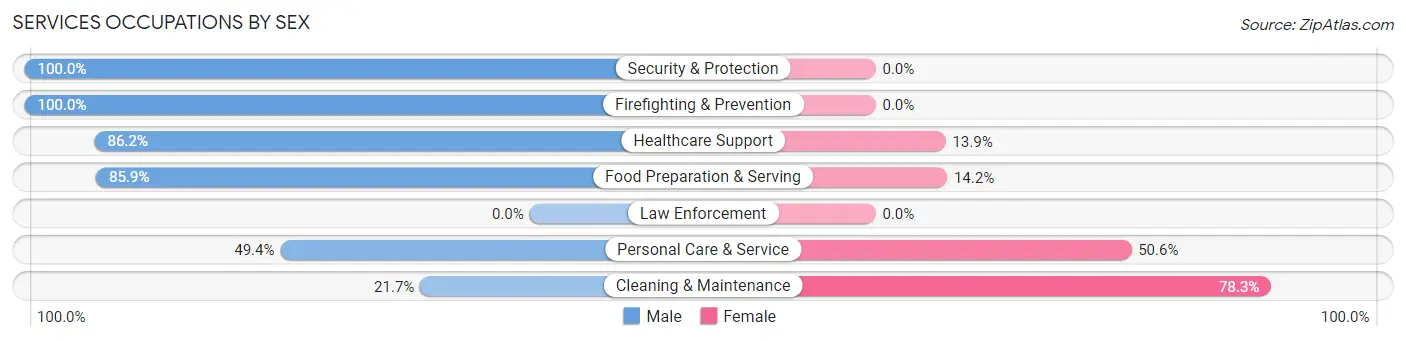
Services Occupations by Sex
Within the Services occupations in University Center, the most male-oriented occupations are Security & Protection (100.0%), Firefighting & Prevention (100.0%), and Healthcare Support (86.2%), while the most female-oriented occupations are Cleaning & Maintenance (78.3%), Personal Care & Service (50.6%), and Food Preparation & Serving (14.1%).
| Occupation | Male | Female |
| Healthcare Support | 56 (86.2%) | 9 (13.9%) |
| Security & Protection | 5 (100.0%) | 0 (0.0%) |
| Firefighting & Prevention | 5 (100.0%) | 0 (0.0%) |
| Law Enforcement | 0 (0.0%) | 0 (0.0%) |
| Food Preparation & Serving | 91 (85.9%) | 15 (14.1%) |
| Cleaning & Maintenance | 13 (21.7%) | 47 (78.3%) |
| Personal Care & Service | 78 (49.4%) | 80 (50.6%) |
| Total (Category) | 243 (61.7%) | 151 (38.3%) |
| Total (Overall) | 1,395 (56.7%) | 1,066 (43.3%) |
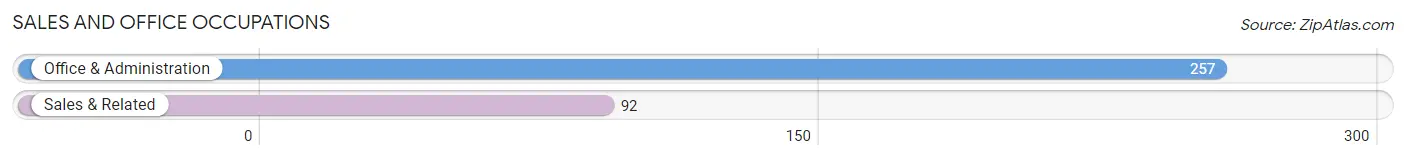
Sales and Office Occupations
The most common Sales and Office occupations in University Center are Office & Administration (257 | 10.4%), and Sales & Related (92 | 3.7%).
Sales and Office Occupations by Sex
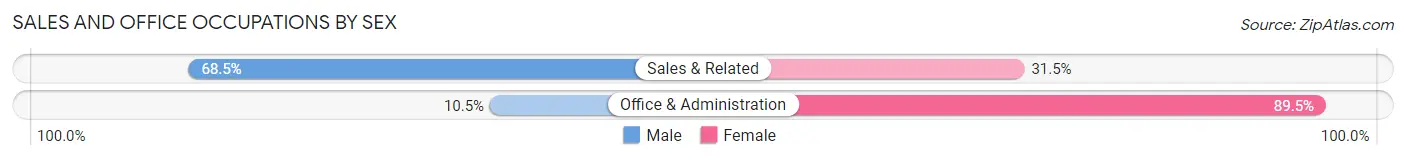
| Occupation | Male | Female |
| Sales & Related | 63 (68.5%) | 29 (31.5%) |
| Office & Administration | 27 (10.5%) | 230 (89.5%) |
| Total (Category) | 90 (25.8%) | 259 (74.2%) |
| Total (Overall) | 1,395 (56.7%) | 1,066 (43.3%) |
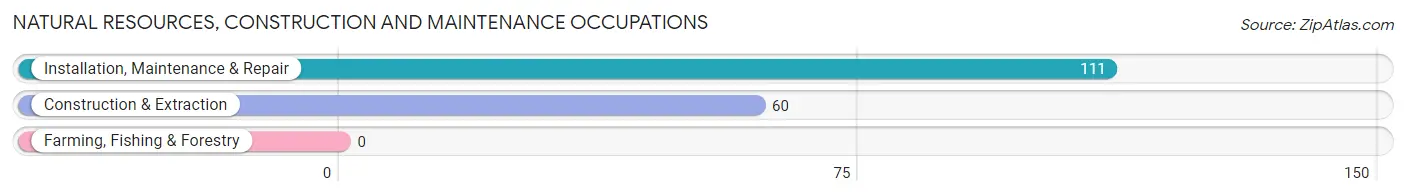
Natural Resources, Construction and Maintenance Occupations
The most common Natural Resources, Construction and Maintenance occupations in University Center are Installation, Maintenance & Repair (111 | 4.5%), and Construction & Extraction (60 | 2.4%).
Natural Resources, Construction and Maintenance Occupations by Sex
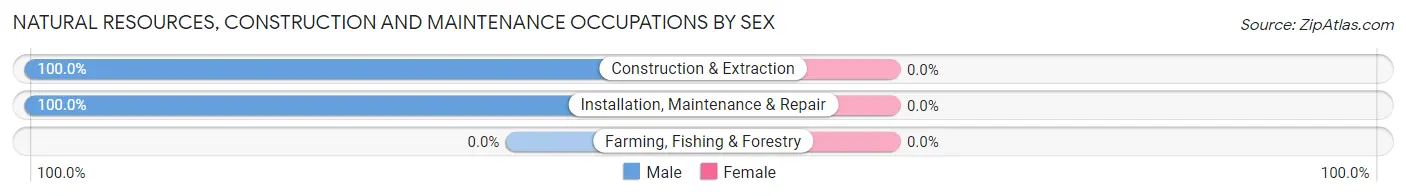
| Occupation | Male | Female |
| Farming, Fishing & Forestry | 0 (0.0%) | 0 (0.0%) |
| Construction & Extraction | 60 (100.0%) | 0 (0.0%) |
| Installation, Maintenance & Repair | 111 (100.0%) | 0 (0.0%) |
| Total (Category) | 171 (100.0%) | 0 (0.0%) |
| Total (Overall) | 1,395 (56.7%) | 1,066 (43.3%) |
Production, Transportation and Moving Occupations
The most common Production, Transportation and Moving occupations in University Center are Transportation (122 | 5.0%), Material Moving (97 | 3.9%), and Production (34 | 1.4%).
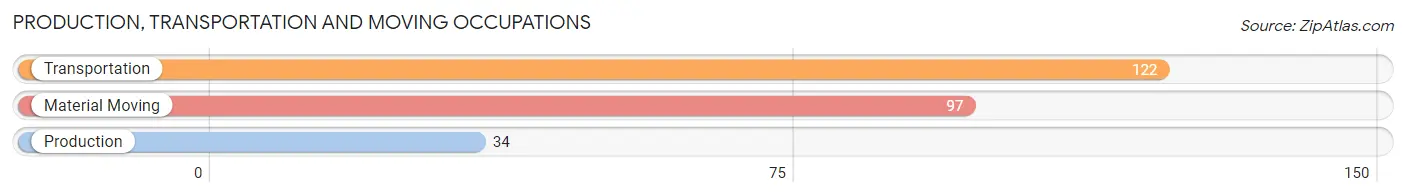
Production, Transportation and Moving Occupations by Sex
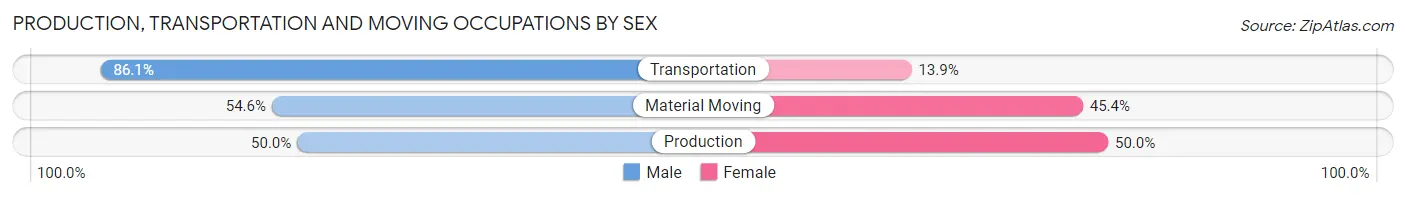
| Occupation | Male | Female |
| Production | 17 (50.0%) | 17 (50.0%) |
| Transportation | 105 (86.1%) | 17 (13.9%) |
| Material Moving | 53 (54.6%) | 44 (45.4%) |
| Total (Category) | 175 (69.2%) | 78 (30.8%) |
| Total (Overall) | 1,395 (56.7%) | 1,066 (43.3%) |
Employment Industries by Sex in University Center
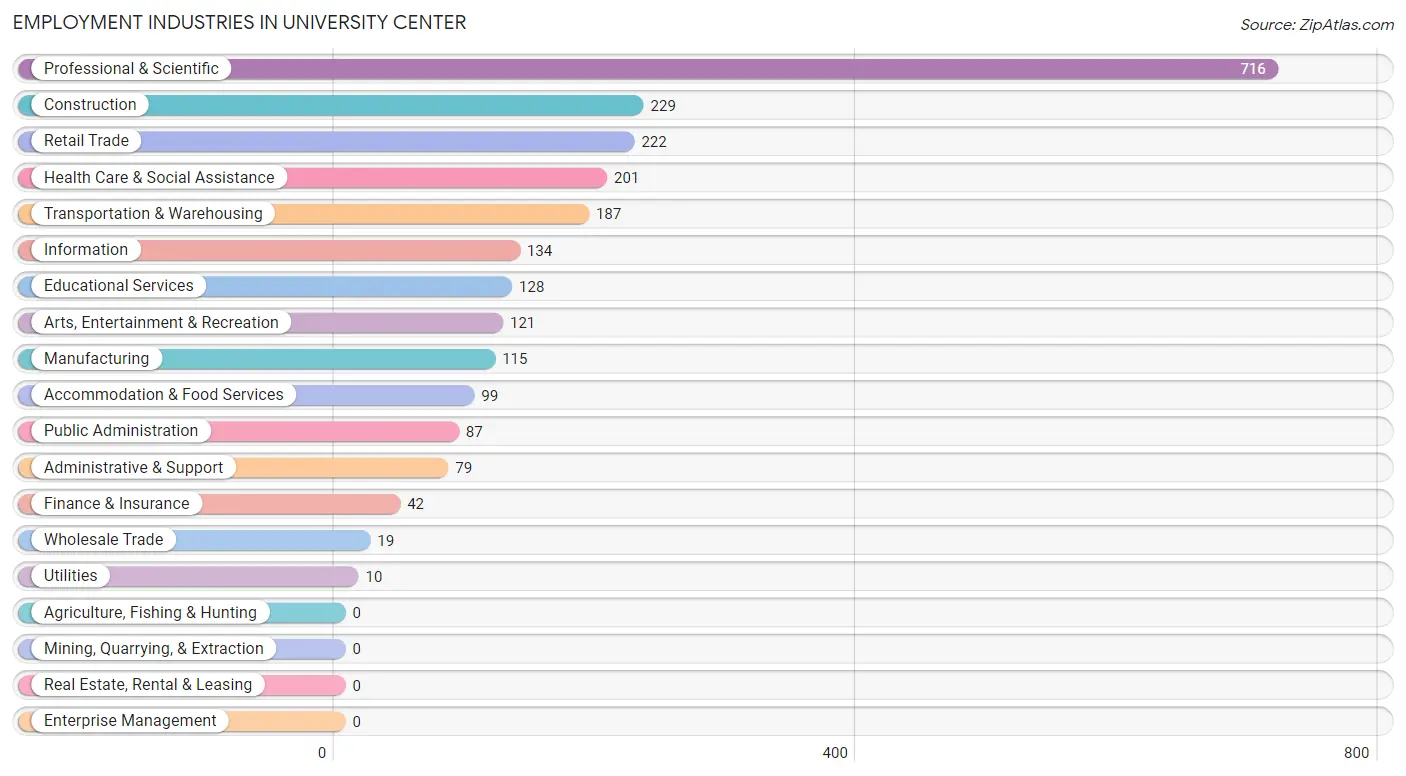
Employment Industries in University Center
The major employment industries in University Center include Professional & Scientific (716 | 29.1%), Construction (229 | 9.3%), Retail Trade (222 | 9.0%), Health Care & Social Assistance (201 | 8.2%), and Transportation & Warehousing (187 | 7.6%).
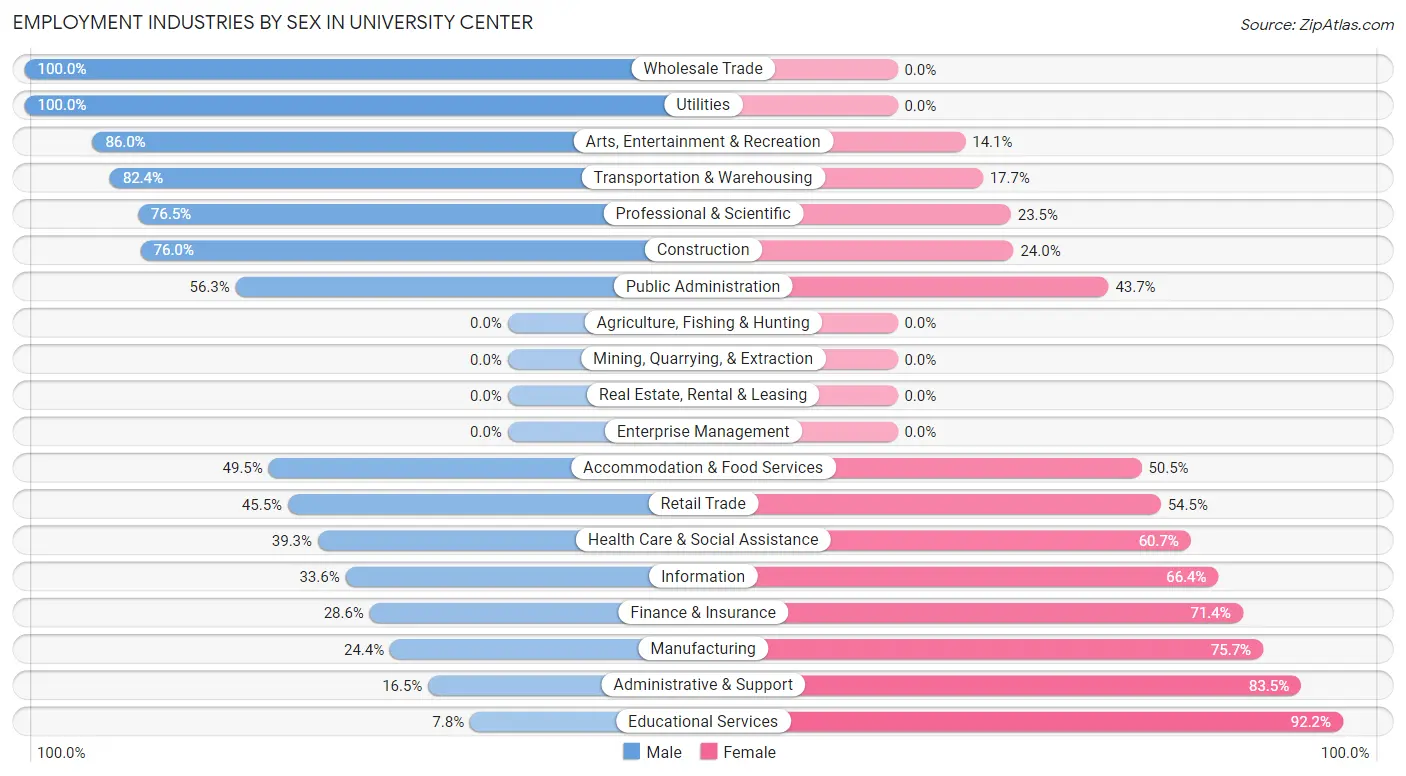
Employment Industries by Sex in University Center
The University Center industries that see more men than women are Wholesale Trade (100.0%), Utilities (100.0%), and Arts, Entertainment & Recreation (86.0%), whereas the industries that tend to have a higher number of women are Educational Services (92.2%), Administrative & Support (83.5%), and Manufacturing (75.6%).
| Industry | Male | Female |
| Agriculture, Fishing & Hunting | 0 (0.0%) | 0 (0.0%) |
| Mining, Quarrying, & Extraction | 0 (0.0%) | 0 (0.0%) |
| Construction | 174 (76.0%) | 55 (24.0%) |
| Manufacturing | 28 (24.3%) | 87 (75.6%) |
| Wholesale Trade | 19 (100.0%) | 0 (0.0%) |
| Retail Trade | 101 (45.5%) | 121 (54.5%) |
| Transportation & Warehousing | 154 (82.4%) | 33 (17.6%) |
| Utilities | 10 (100.0%) | 0 (0.0%) |
| Information | 45 (33.6%) | 89 (66.4%) |
| Finance & Insurance | 12 (28.6%) | 30 (71.4%) |
| Real Estate, Rental & Leasing | 0 (0.0%) | 0 (0.0%) |
| Professional & Scientific | 548 (76.5%) | 168 (23.5%) |
| Enterprise Management | 0 (0.0%) | 0 (0.0%) |
| Administrative & Support | 13 (16.5%) | 66 (83.5%) |
| Educational Services | 10 (7.8%) | 118 (92.2%) |
| Health Care & Social Assistance | 79 (39.3%) | 122 (60.7%) |
| Arts, Entertainment & Recreation | 104 (86.0%) | 17 (14.1%) |
| Accommodation & Food Services | 49 (49.5%) | 50 (50.5%) |
| Public Administration | 49 (56.3%) | 38 (43.7%) |
| Total | 1,395 (56.7%) | 1,066 (43.3%) |
Education in University Center
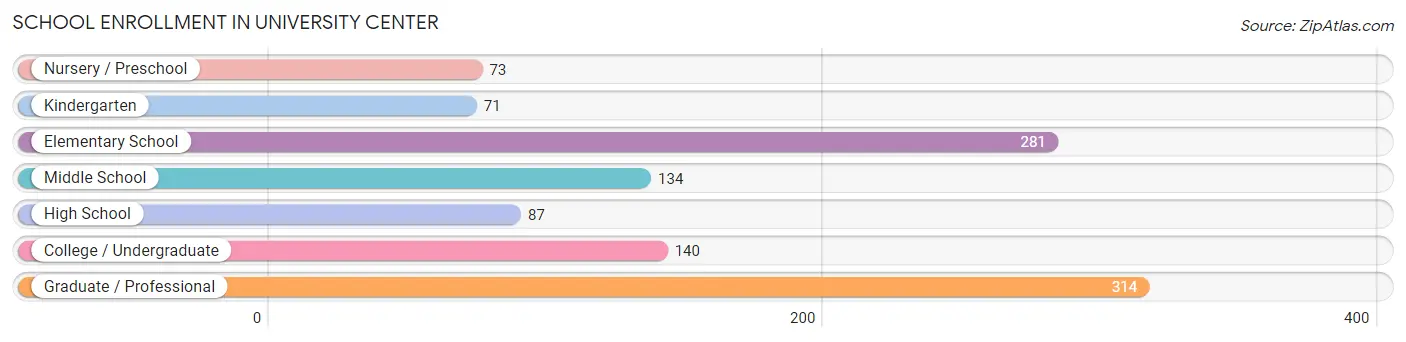
School Enrollment in University Center
The most common levels of schooling among the 1,100 students in University Center are graduate / professional (314 | 28.5%), elementary school (281 | 25.6%), and college / undergraduate (140 | 12.7%).
| School Level | # Students | % Students |
| Nursery / Preschool | 73 | 6.6% |
| Kindergarten | 71 | 6.5% |
| Elementary School | 281 | 25.6% |
| Middle School | 134 | 12.2% |
| High School | 87 | 7.9% |
| College / Undergraduate | 140 | 12.7% |
| Graduate / Professional | 314 | 28.5% |
| Total | 1,100 | 100.0% |
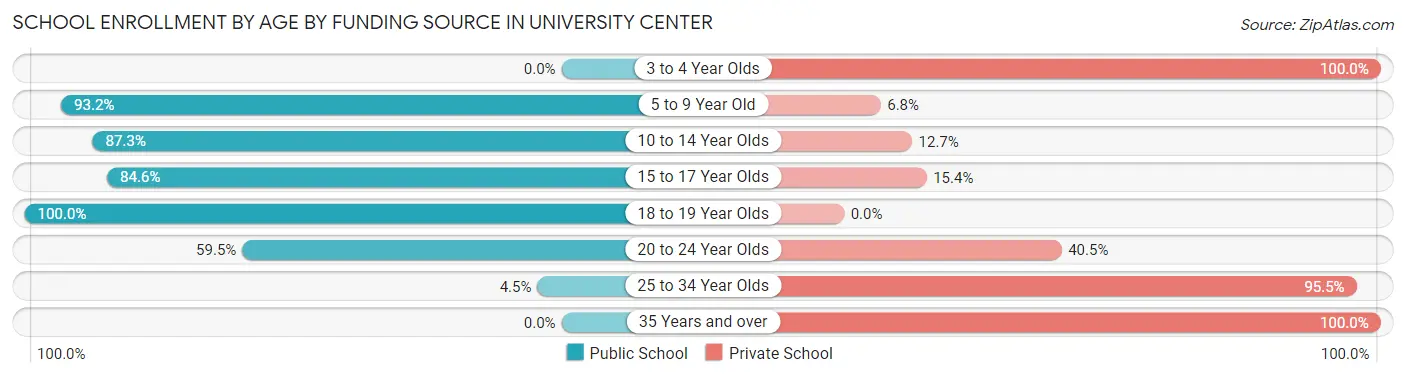
School Enrollment by Age by Funding Source in University Center
Out of a total of 1,100 students who are enrolled in schools in University Center, 453 (41.2%) attend a private institution, while the remaining 647 (58.8%) are enrolled in public schools. The age group of 3 to 4 year olds has the highest likelihood of being enrolled in private schools, with 49 (100.0% in the age bracket) enrolled. Conversely, the age group of 18 to 19 year olds has the lowest likelihood of being enrolled in a private school, with 66 (100.0% in the age bracket) attending a public institution.
| Age Bracket | Public School | Private School |
| 3 to 4 Year Olds | 0 (0.0%) | 49 (100.0%) |
| 5 to 9 Year Old | 328 (93.2%) | 24 (6.8%) |
| 10 to 14 Year Olds | 138 (87.3%) | 20 (12.7%) |
| 15 to 17 Year Olds | 33 (84.6%) | 6 (15.4%) |
| 18 to 19 Year Olds | 66 (100.0%) | 0 (0.0%) |
| 20 to 24 Year Olds | 69 (59.5%) | 47 (40.5%) |
| 25 to 34 Year Olds | 13 (4.5%) | 276 (95.5%) |
| 35 Years and over | 0 (0.0%) | 31 (100.0%) |
| Total | 647 (58.8%) | 453 (41.2%) |
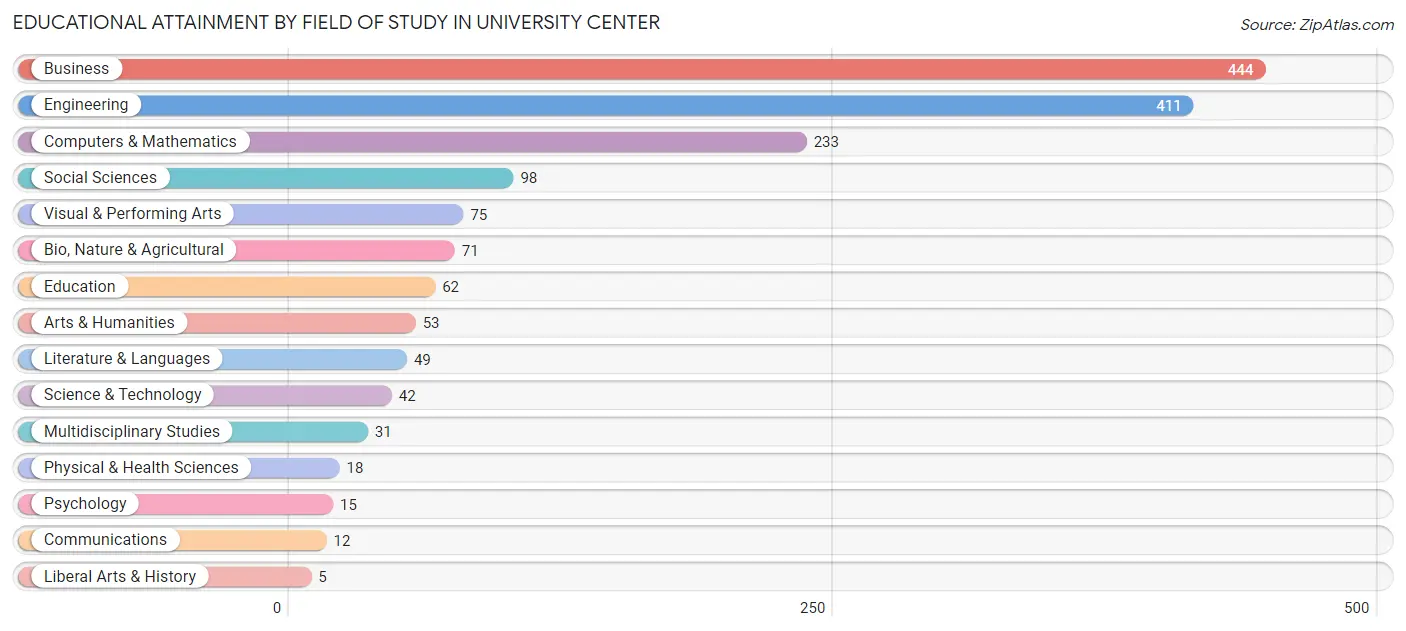
Educational Attainment by Field of Study in University Center
Business (444 | 27.4%), engineering (411 | 25.4%), computers & mathematics (233 | 14.4%), social sciences (98 | 6.0%), and visual & performing arts (75 | 4.6%) are the most common fields of study among 1,619 individuals in University Center who have obtained a bachelor's degree or higher.
| Field of Study | # Graduates | % Graduates |
| Computers & Mathematics | 233 | 14.4% |
| Bio, Nature & Agricultural | 71 | 4.4% |
| Physical & Health Sciences | 18 | 1.1% |
| Psychology | 15 | 0.9% |
| Social Sciences | 98 | 6.0% |
| Engineering | 411 | 25.4% |
| Multidisciplinary Studies | 31 | 1.9% |
| Science & Technology | 42 | 2.6% |
| Business | 444 | 27.4% |
| Education | 62 | 3.8% |
| Literature & Languages | 49 | 3.0% |
| Liberal Arts & History | 5 | 0.3% |
| Visual & Performing Arts | 75 | 4.6% |
| Communications | 12 | 0.7% |
| Arts & Humanities | 53 | 3.3% |
| Total | 1,619 | 100.0% |
Transportation & Commute in University Center
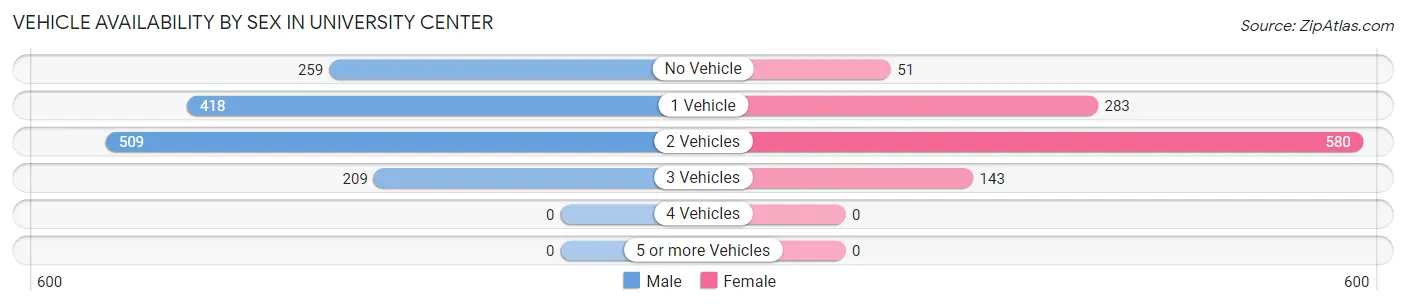
Vehicle Availability by Sex in University Center
The most prevalent vehicle ownership categories in University Center are males with 2 vehicles (509, accounting for 36.5%) and females with 2 vehicles (580, making up 48.2%).
| Vehicles Available | Male | Female |
| No Vehicle | 259 (18.6%) | 51 (4.8%) |
| 1 Vehicle | 418 (30.0%) | 283 (26.8%) |
| 2 Vehicles | 509 (36.5%) | 580 (54.9%) |
| 3 Vehicles | 209 (15.0%) | 143 (13.5%) |
| 4 Vehicles | 0 (0.0%) | 0 (0.0%) |
| 5 or more Vehicles | 0 (0.0%) | 0 (0.0%) |
| Total | 1,395 (100.0%) | 1,057 (100.0%) |
Commute Time in University Center
The most frequently occuring commute durations in University Center are 15 to 19 minutes (457 commuters, 22.4%), 5 to 9 minutes (361 commuters, 17.7%), and 10 to 14 minutes (359 commuters, 17.6%).
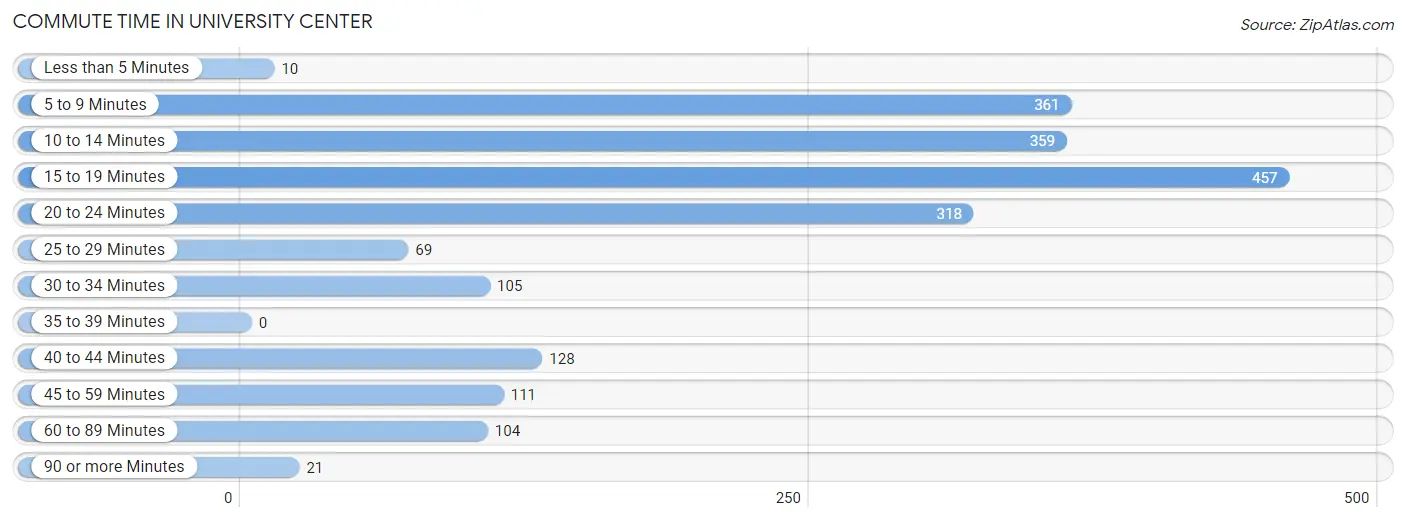
| Commute Time | # Commuters | % Commuters |
| Less than 5 Minutes | 10 | 0.5% |
| 5 to 9 Minutes | 361 | 17.7% |
| 10 to 14 Minutes | 359 | 17.6% |
| 15 to 19 Minutes | 457 | 22.4% |
| 20 to 24 Minutes | 318 | 15.6% |
| 25 to 29 Minutes | 69 | 3.4% |
| 30 to 34 Minutes | 105 | 5.1% |
| 35 to 39 Minutes | 0 | 0.0% |
| 40 to 44 Minutes | 128 | 6.3% |
| 45 to 59 Minutes | 111 | 5.4% |
| 60 to 89 Minutes | 104 | 5.1% |
| 90 or more Minutes | 21 | 1.0% |
Commute Time by Sex in University Center
The most common commute times in University Center are 15 to 19 minutes (330 commuters, 30.2%) for males and 10 to 14 minutes (205 commuters, 21.5%) for females.
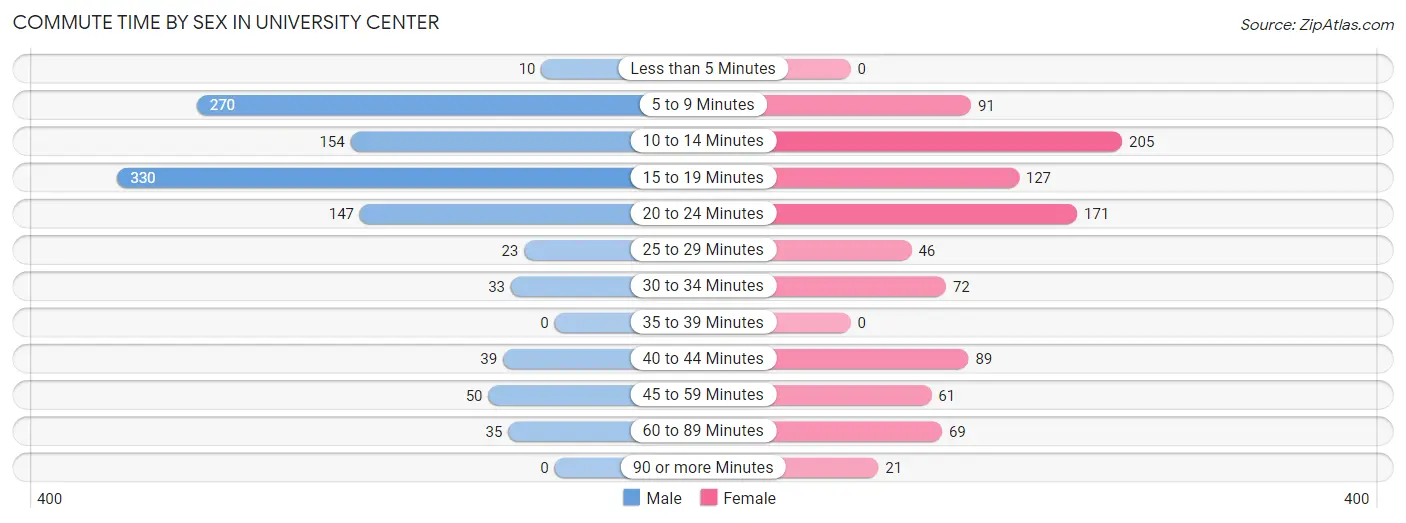
| Commute Time | Male | Female |
| Less than 5 Minutes | 10 (0.9%) | 0 (0.0%) |
| 5 to 9 Minutes | 270 (24.7%) | 91 (9.6%) |
| 10 to 14 Minutes | 154 (14.1%) | 205 (21.5%) |
| 15 to 19 Minutes | 330 (30.2%) | 127 (13.3%) |
| 20 to 24 Minutes | 147 (13.5%) | 171 (18.0%) |
| 25 to 29 Minutes | 23 (2.1%) | 46 (4.8%) |
| 30 to 34 Minutes | 33 (3.0%) | 72 (7.6%) |
| 35 to 39 Minutes | 0 (0.0%) | 0 (0.0%) |
| 40 to 44 Minutes | 39 (3.6%) | 89 (9.3%) |
| 45 to 59 Minutes | 50 (4.6%) | 61 (6.4%) |
| 60 to 89 Minutes | 35 (3.2%) | 69 (7.2%) |
| 90 or more Minutes | 0 (0.0%) | 21 (2.2%) |
Time of Departure to Work by Sex in University Center
The most frequent times of departure to work in University Center are 9:00 AM to 9:59 AM (192, 17.6%) for males and 9:00 AM to 9:59 AM (195, 20.5%) for females.
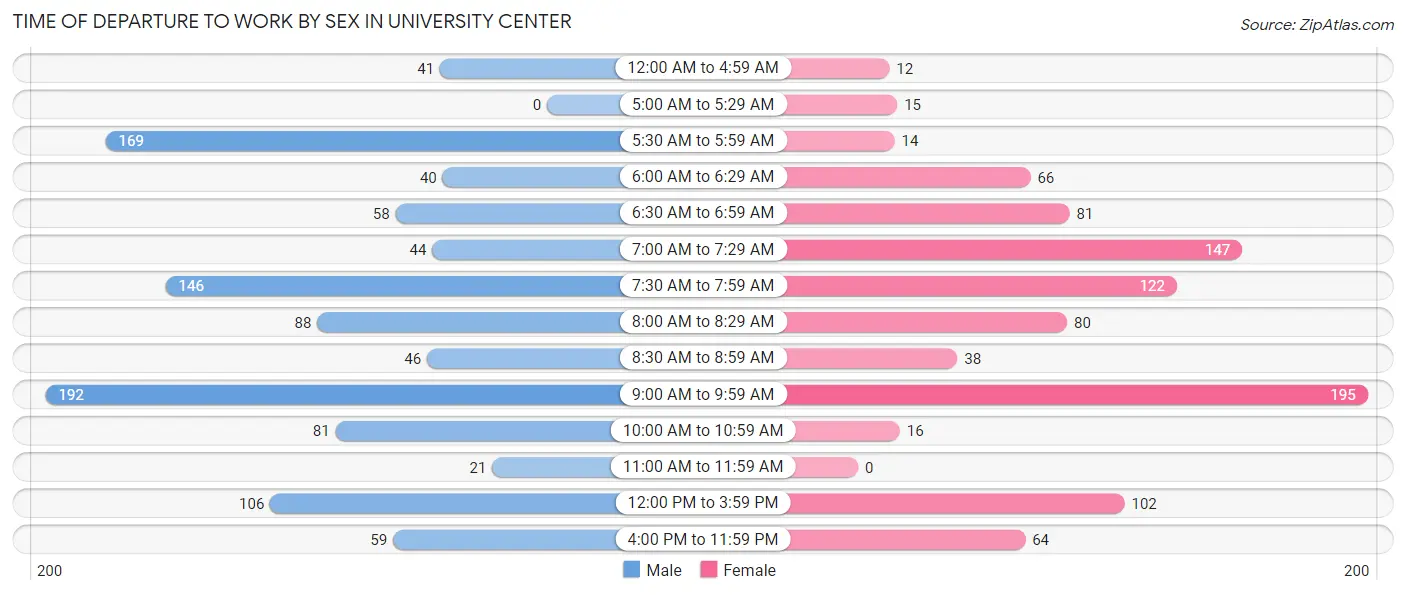
| Time of Departure | Male | Female |
| 12:00 AM to 4:59 AM | 41 (3.8%) | 12 (1.3%) |
| 5:00 AM to 5:29 AM | 0 (0.0%) | 15 (1.6%) |
| 5:30 AM to 5:59 AM | 169 (15.5%) | 14 (1.5%) |
| 6:00 AM to 6:29 AM | 40 (3.7%) | 66 (6.9%) |
| 6:30 AM to 6:59 AM | 58 (5.3%) | 81 (8.5%) |
| 7:00 AM to 7:29 AM | 44 (4.0%) | 147 (15.4%) |
| 7:30 AM to 7:59 AM | 146 (13.4%) | 122 (12.8%) |
| 8:00 AM to 8:29 AM | 88 (8.1%) | 80 (8.4%) |
| 8:30 AM to 8:59 AM | 46 (4.2%) | 38 (4.0%) |
| 9:00 AM to 9:59 AM | 192 (17.6%) | 195 (20.5%) |
| 10:00 AM to 10:59 AM | 81 (7.4%) | 16 (1.7%) |
| 11:00 AM to 11:59 AM | 21 (1.9%) | 0 (0.0%) |
| 12:00 PM to 3:59 PM | 106 (9.7%) | 102 (10.7%) |
| 4:00 PM to 11:59 PM | 59 (5.4%) | 64 (6.7%) |
| Total | 1,091 (100.0%) | 952 (100.0%) |
Housing Occupancy in University Center
Occupancy by Ownership in University Center
Of the total 1,771 dwellings in University Center, owner-occupied units account for 529 (29.9%), while renter-occupied units make up 1,242 (70.1%).
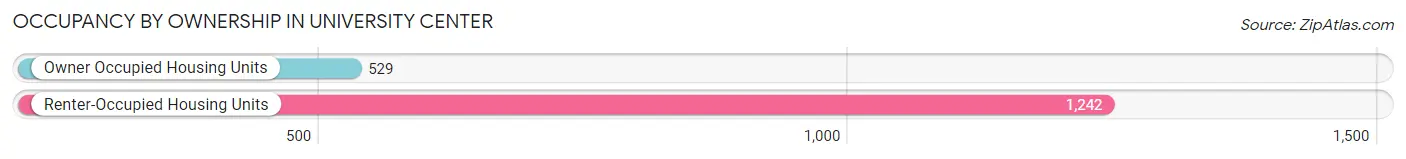
| Occupancy | # Housing Units | % Housing Units |
| Owner Occupied Housing Units | 529 | 29.9% |
| Renter-Occupied Housing Units | 1,242 | 70.1% |
| Total Occupied Housing Units | 1,771 | 100.0% |
Occupancy by Household Size in University Center
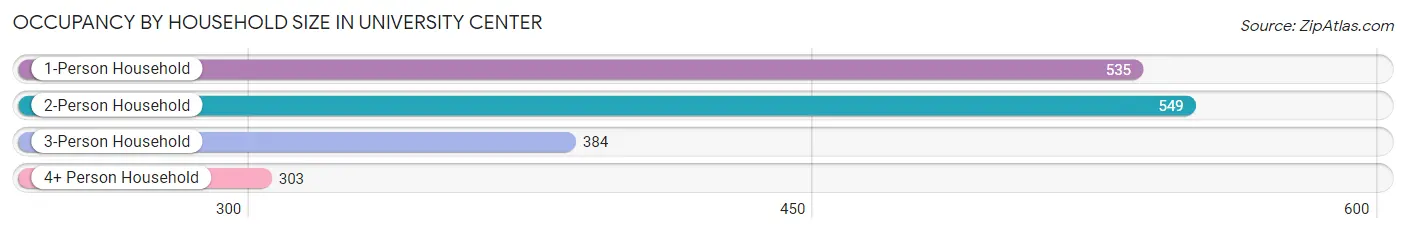
| Household Size | # Housing Units | % Housing Units |
| 1-Person Household | 535 | 30.2% |
| 2-Person Household | 549 | 31.0% |
| 3-Person Household | 384 | 21.7% |
| 4+ Person Household | 303 | 17.1% |
| Total Housing Units | 1,771 | 100.0% |
Occupancy by Ownership by Household Size in University Center
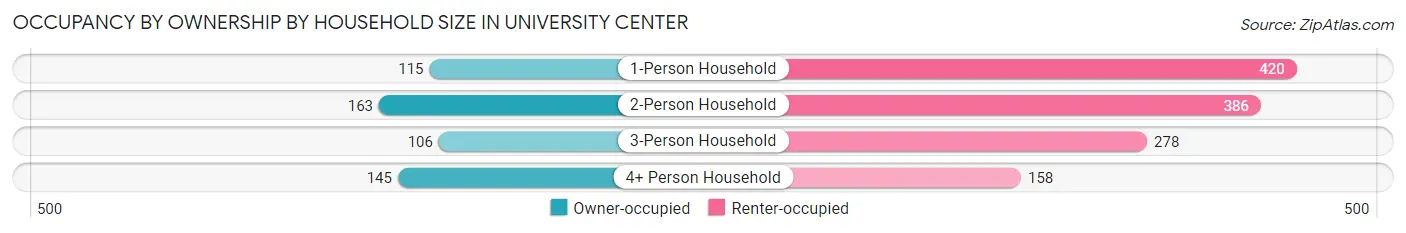
| Household Size | Owner-occupied | Renter-occupied |
| 1-Person Household | 115 (21.5%) | 420 (78.5%) |
| 2-Person Household | 163 (29.7%) | 386 (70.3%) |
| 3-Person Household | 106 (27.6%) | 278 (72.4%) |
| 4+ Person Household | 145 (47.8%) | 158 (52.1%) |
| Total Housing Units | 529 (29.9%) | 1,242 (70.1%) |
Occupancy by Educational Attainment in University Center
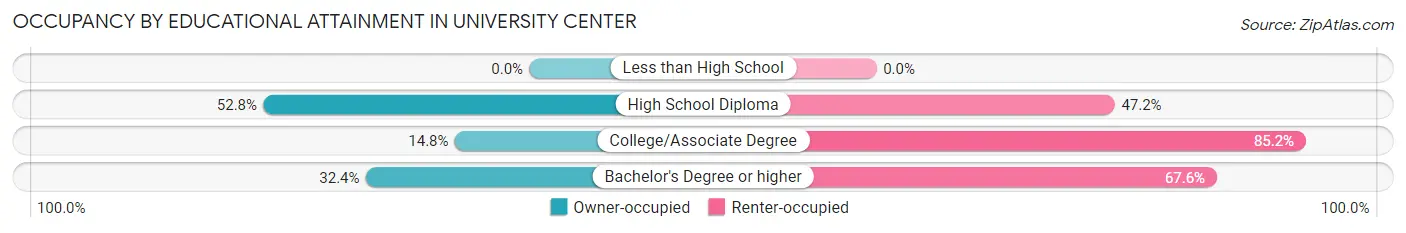
| Household Size | Owner-occupied | Renter-occupied |
| Less than High School | 0 (0.0%) | 0 (0.0%) |
| High School Diploma | 86 (52.8%) | 77 (47.2%) |
| College/Associate Degree | 66 (14.8%) | 380 (85.2%) |
| Bachelor's Degree or higher | 377 (32.4%) | 785 (67.6%) |
Occupancy by Age of Householder in University Center
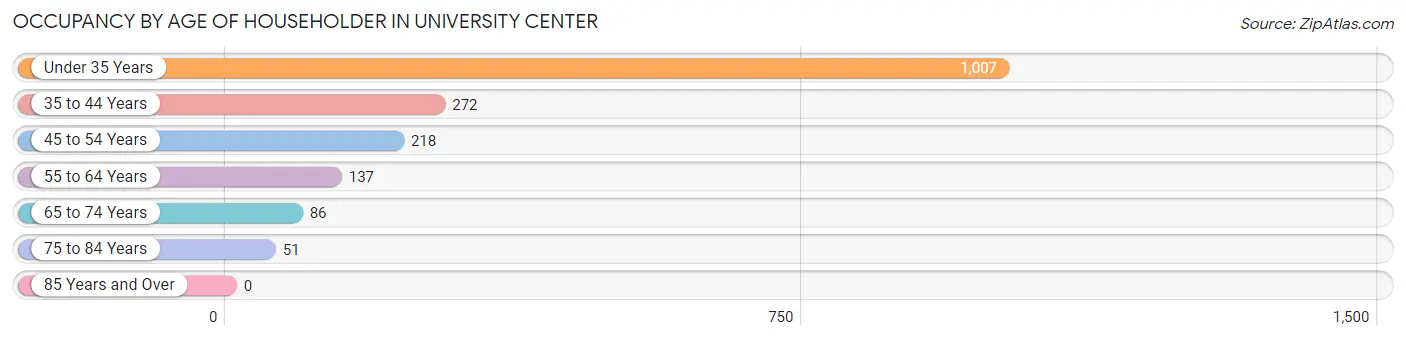
| Age Bracket | # Households | % Households |
| Under 35 Years | 1,007 | 56.9% |
| 35 to 44 Years | 272 | 15.4% |
| 45 to 54 Years | 218 | 12.3% |
| 55 to 64 Years | 137 | 7.7% |
| 65 to 74 Years | 86 | 4.9% |
| 75 to 84 Years | 51 | 2.9% |
| 85 Years and Over | 0 | 0.0% |
| Total | 1,771 | 100.0% |
Housing Finances in University Center
Median Income by Occupancy in University Center
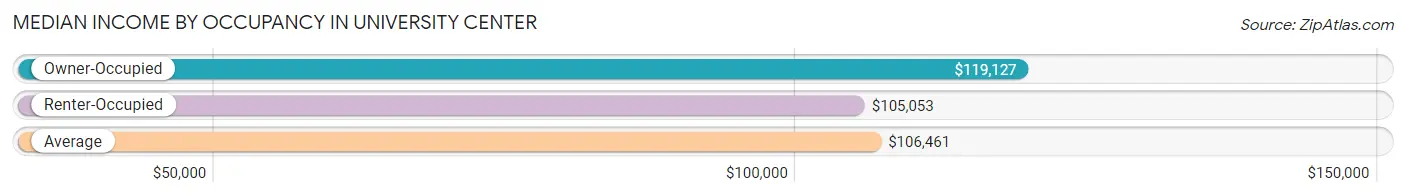
| Occupancy Type | # Households | Median Income |
| Owner-Occupied | 529 (29.9%) | $119,127 |
| Renter-Occupied | 1,242 (70.1%) | $105,053 |
| Average | 1,771 (100.0%) | $106,461 |
Occupancy by Householder Income Bracket in University Center
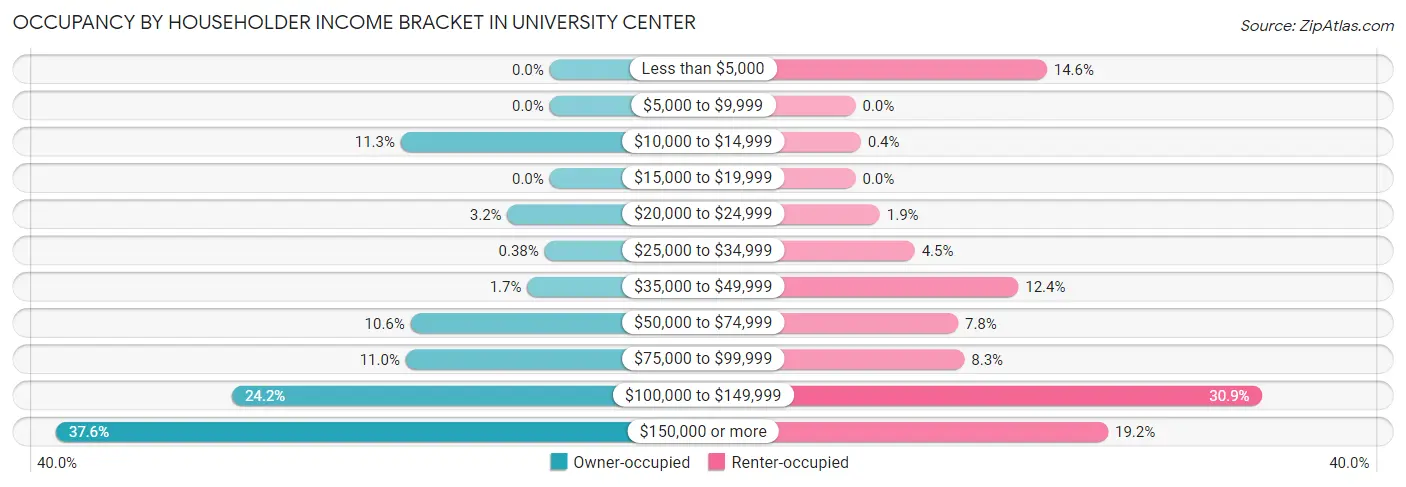
| Income Bracket | Owner-occupied | Renter-occupied |
| Less than $5,000 | 0 (0.0%) | 181 (14.6%) |
| $5,000 to $9,999 | 0 (0.0%) | 0 (0.0%) |
| $10,000 to $14,999 | 60 (11.3%) | 5 (0.4%) |
| $15,000 to $19,999 | 0 (0.0%) | 0 (0.0%) |
| $20,000 to $24,999 | 17 (3.2%) | 23 (1.8%) |
| $25,000 to $34,999 | 2 (0.4%) | 56 (4.5%) |
| $35,000 to $49,999 | 9 (1.7%) | 154 (12.4%) |
| $50,000 to $74,999 | 56 (10.6%) | 97 (7.8%) |
| $75,000 to $99,999 | 58 (11.0%) | 103 (8.3%) |
| $100,000 to $149,999 | 128 (24.2%) | 384 (30.9%) |
| $150,000 or more | 199 (37.6%) | 239 (19.2%) |
| Total | 529 (100.0%) | 1,242 (100.0%) |
Monthly Housing Cost Tiers in University Center
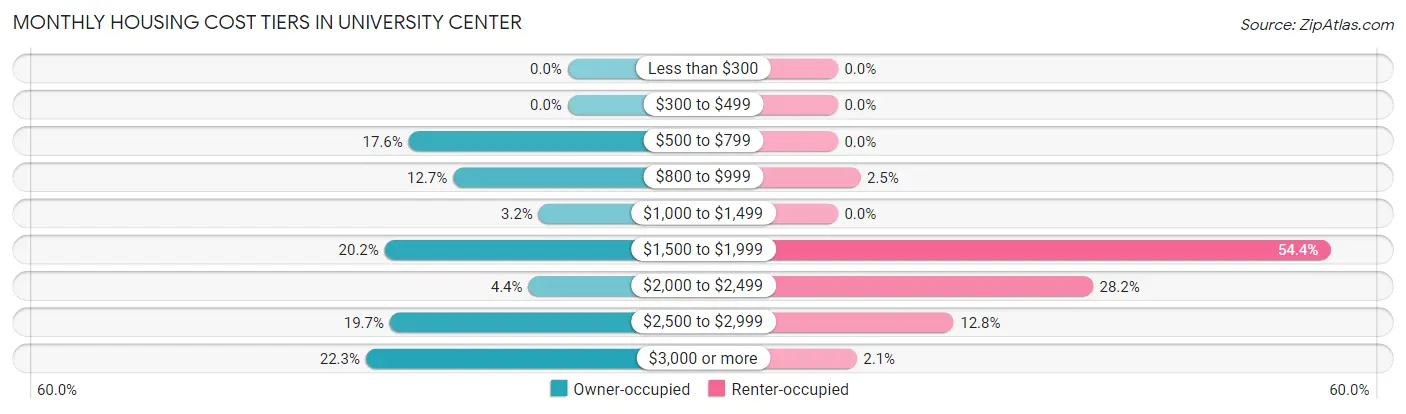
| Monthly Cost | Owner-occupied | Renter-occupied |
| Less than $300 | 0 (0.0%) | 0 (0.0%) |
| $300 to $499 | 0 (0.0%) | 0 (0.0%) |
| $500 to $799 | 93 (17.6%) | 0 (0.0%) |
| $800 to $999 | 67 (12.7%) | 31 (2.5%) |
| $1,000 to $1,499 | 17 (3.2%) | 0 (0.0%) |
| $1,500 to $1,999 | 107 (20.2%) | 676 (54.4%) |
| $2,000 to $2,499 | 23 (4.3%) | 350 (28.2%) |
| $2,500 to $2,999 | 104 (19.7%) | 159 (12.8%) |
| $3,000 or more | 118 (22.3%) | 26 (2.1%) |
| Total | 529 (100.0%) | 1,242 (100.0%) |
Physical Housing Characteristics in University Center
Housing Structures in University Center
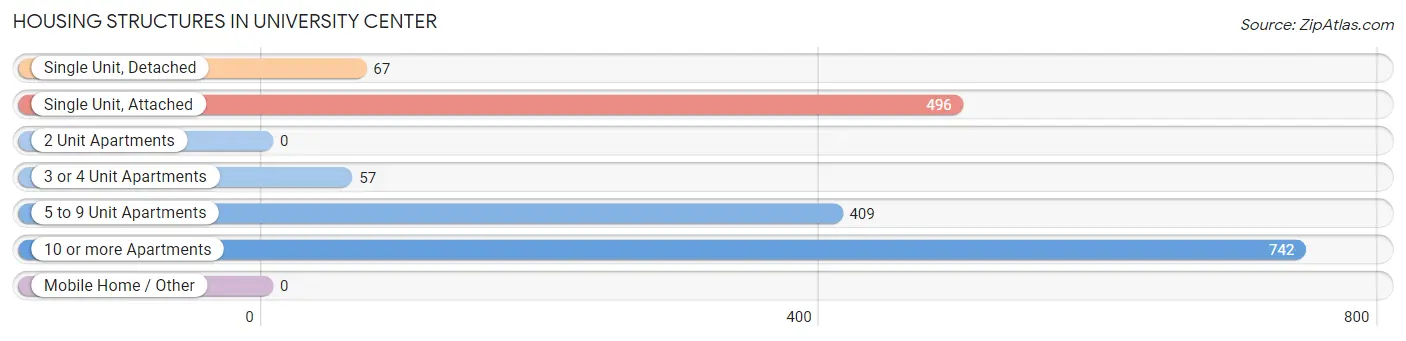
| Structure Type | # Housing Units | % Housing Units |
| Single Unit, Detached | 67 | 3.8% |
| Single Unit, Attached | 496 | 28.0% |
| 2 Unit Apartments | 0 | 0.0% |
| 3 or 4 Unit Apartments | 57 | 3.2% |
| 5 to 9 Unit Apartments | 409 | 23.1% |
| 10 or more Apartments | 742 | 41.9% |
| Mobile Home / Other | 0 | 0.0% |
| Total | 1,771 | 100.0% |
Housing Structures by Occupancy in University Center
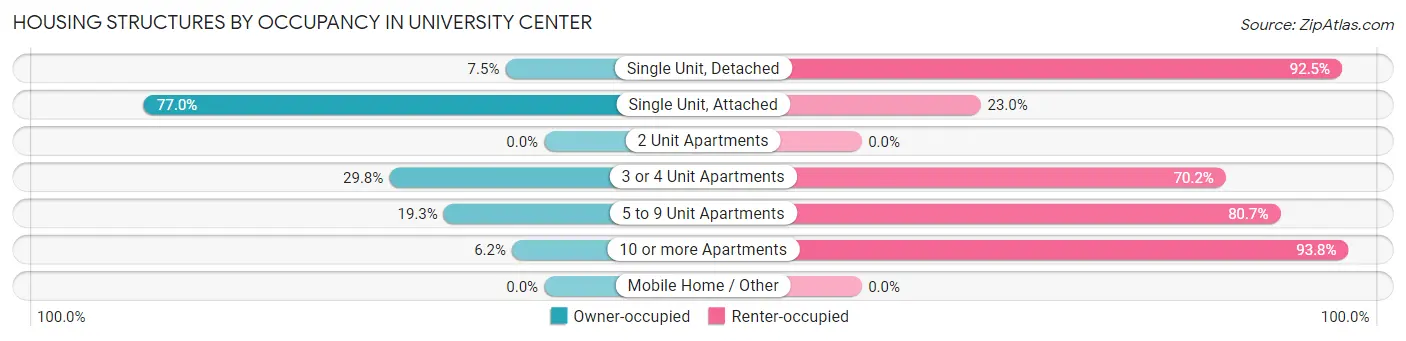
| Structure Type | Owner-occupied | Renter-occupied |
| Single Unit, Detached | 5 (7.5%) | 62 (92.5%) |
| Single Unit, Attached | 382 (77.0%) | 114 (23.0%) |
| 2 Unit Apartments | 0 (0.0%) | 0 (0.0%) |
| 3 or 4 Unit Apartments | 17 (29.8%) | 40 (70.2%) |
| 5 to 9 Unit Apartments | 79 (19.3%) | 330 (80.7%) |
| 10 or more Apartments | 46 (6.2%) | 696 (93.8%) |
| Mobile Home / Other | 0 (0.0%) | 0 (0.0%) |
| Total | 529 (29.9%) | 1,242 (70.1%) |
Housing Structures by Number of Rooms in University Center
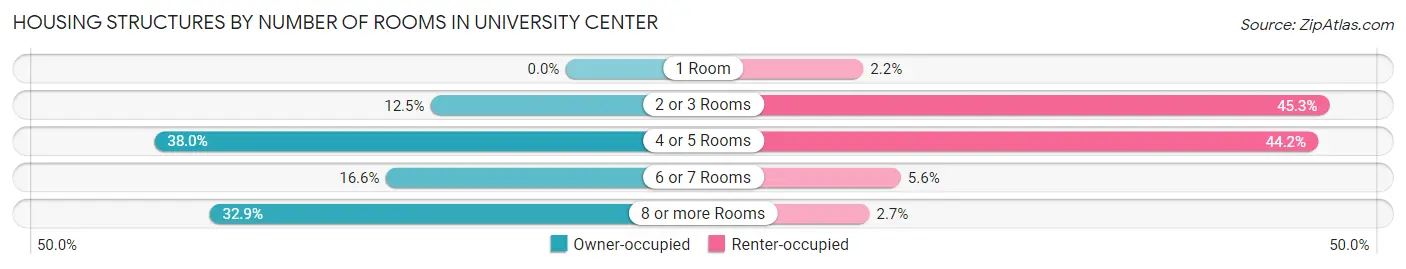
| Number of Rooms | Owner-occupied | Renter-occupied |
| 1 Room | 0 (0.0%) | 27 (2.2%) |
| 2 or 3 Rooms | 66 (12.5%) | 562 (45.3%) |
| 4 or 5 Rooms | 201 (38.0%) | 549 (44.2%) |
| 6 or 7 Rooms | 88 (16.6%) | 70 (5.6%) |
| 8 or more Rooms | 174 (32.9%) | 34 (2.7%) |
| Total | 529 (100.0%) | 1,242 (100.0%) |
Housing Structure by Heating Type in University Center
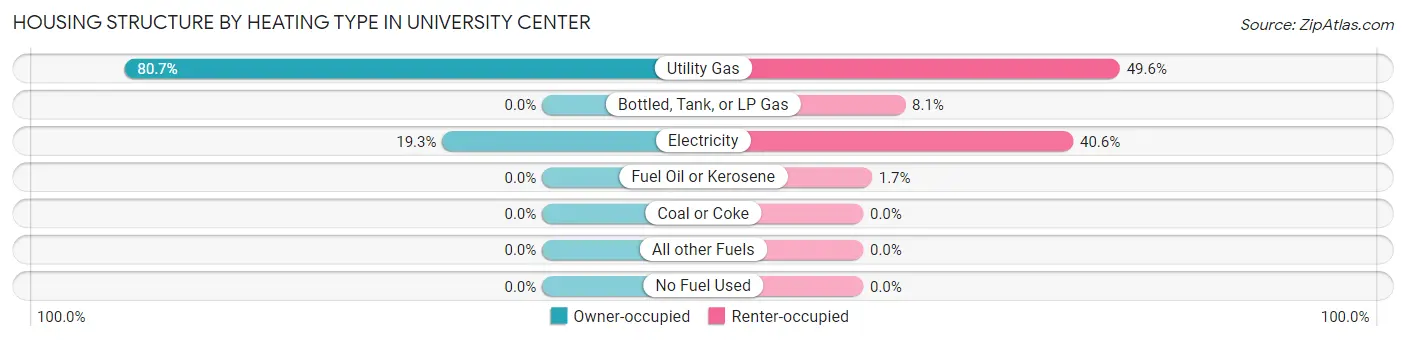
| Heating Type | Owner-occupied | Renter-occupied |
| Utility Gas | 427 (80.7%) | 616 (49.6%) |
| Bottled, Tank, or LP Gas | 0 (0.0%) | 101 (8.1%) |
| Electricity | 102 (19.3%) | 504 (40.6%) |
| Fuel Oil or Kerosene | 0 (0.0%) | 21 (1.7%) |
| Coal or Coke | 0 (0.0%) | 0 (0.0%) |
| All other Fuels | 0 (0.0%) | 0 (0.0%) |
| No Fuel Used | 0 (0.0%) | 0 (0.0%) |
| Total | 529 (100.0%) | 1,242 (100.0%) |
Household Vehicle Usage in University Center
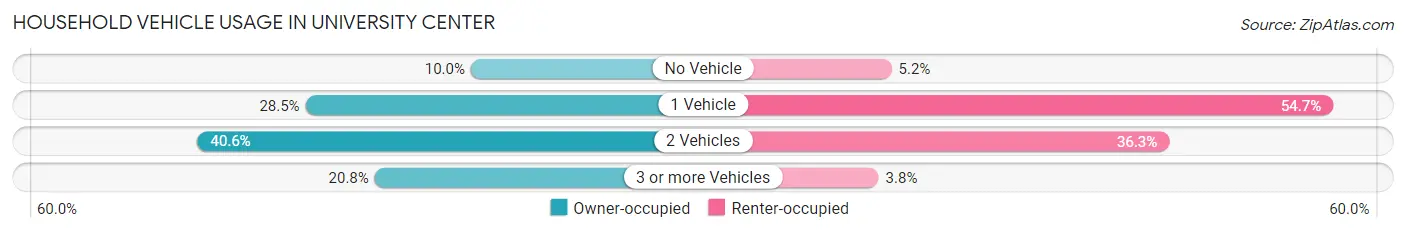
| Vehicles per Household | Owner-occupied | Renter-occupied |
| No Vehicle | 53 (10.0%) | 65 (5.2%) |
| 1 Vehicle | 151 (28.5%) | 679 (54.7%) |
| 2 Vehicles | 215 (40.6%) | 451 (36.3%) |
| 3 or more Vehicles | 110 (20.8%) | 47 (3.8%) |
| Total | 529 (100.0%) | 1,242 (100.0%) |
Real Estate & Mortgages in University Center
Real Estate and Mortgage Overview in University Center
| Characteristic | Without Mortgage | With Mortgage |
| Housing Units | 169 | 360 |
| Median Property Value | $418,300 | $450,000 |
| Median Household Income | $117,571 | $171 |
| Monthly Housing Costs | $770 | $118 |
| Real Estate Taxes | $4,448 | $2 |
Property Value by Mortgage Status in University Center
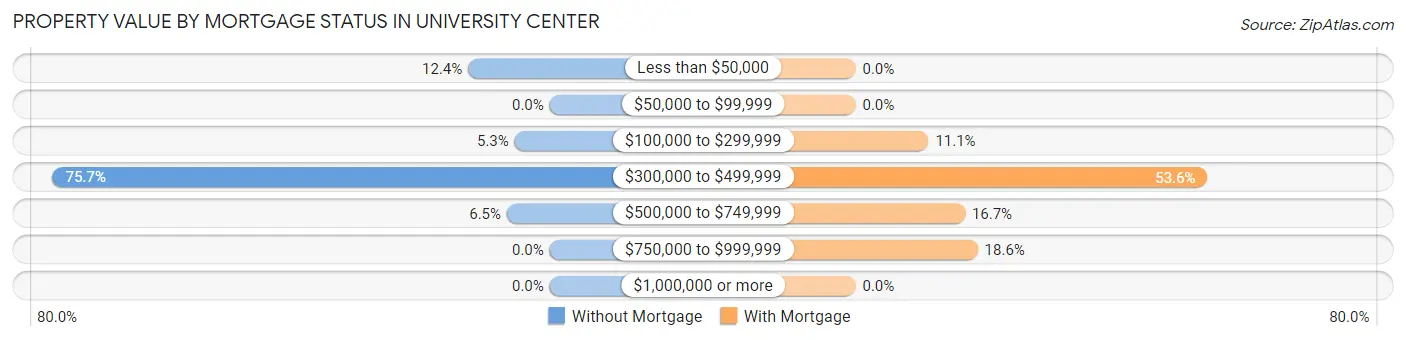
| Property Value | Without Mortgage | With Mortgage |
| Less than $50,000 | 21 (12.4%) | 0 (0.0%) |
| $50,000 to $99,999 | 0 (0.0%) | 0 (0.0%) |
| $100,000 to $299,999 | 9 (5.3%) | 40 (11.1%) |
| $300,000 to $499,999 | 128 (75.7%) | 193 (53.6%) |
| $500,000 to $749,999 | 11 (6.5%) | 60 (16.7%) |
| $750,000 to $999,999 | 0 (0.0%) | 67 (18.6%) |
| $1,000,000 or more | 0 (0.0%) | 0 (0.0%) |
| Total | 169 (100.0%) | 360 (100.0%) |
Household Income by Mortgage Status in University Center
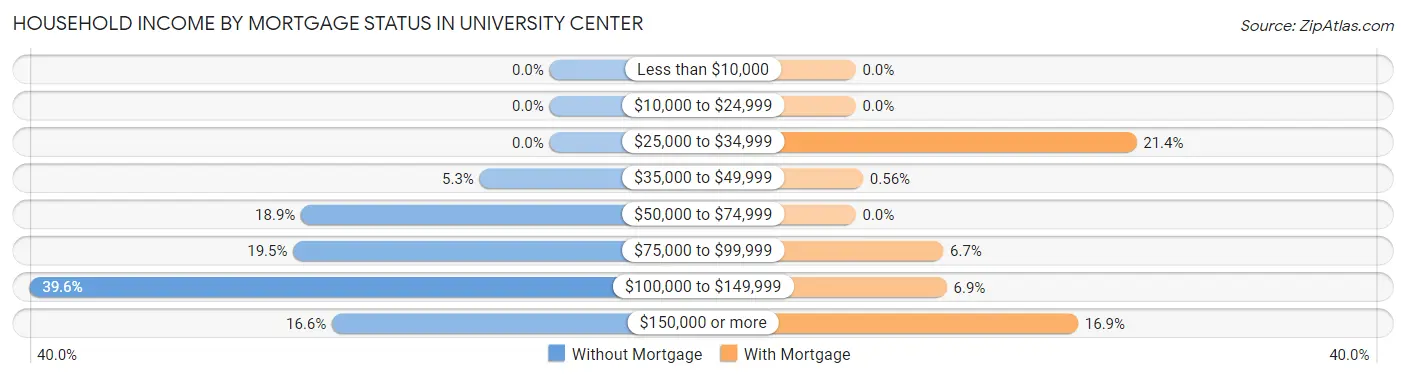
| Household Income | Without Mortgage | With Mortgage |
| Less than $10,000 | 0 (0.0%) | 0 (0.0%) |
| $10,000 to $24,999 | 0 (0.0%) | 0 (0.0%) |
| $25,000 to $34,999 | 0 (0.0%) | 77 (21.4%) |
| $35,000 to $49,999 | 9 (5.3%) | 2 (0.6%) |
| $50,000 to $74,999 | 32 (18.9%) | 0 (0.0%) |
| $75,000 to $99,999 | 33 (19.5%) | 24 (6.7%) |
| $100,000 to $149,999 | 67 (39.6%) | 25 (6.9%) |
| $150,000 or more | 28 (16.6%) | 61 (16.9%) |
| Total | 169 (100.0%) | 360 (100.0%) |
Property Value to Household Income Ratio in University Center
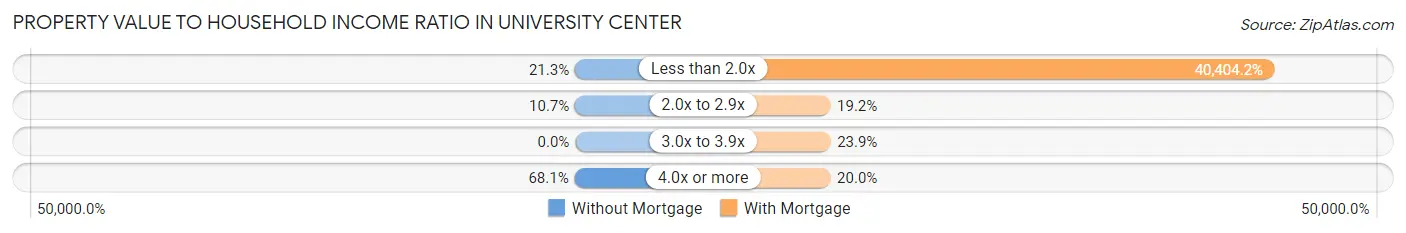
| Value-to-Income Ratio | Without Mortgage | With Mortgage |
| Less than 2.0x | 36 (21.3%) | 145,455 (40,404.2%) |
| 2.0x to 2.9x | 18 (10.6%) | 69 (19.2%) |
| 3.0x to 3.9x | 0 (0.0%) | 86 (23.9%) |
| 4.0x or more | 115 (68.0%) | 72 (20.0%) |
| Total | 169 (100.0%) | 360 (100.0%) |
Real Estate Taxes by Mortgage Status in University Center
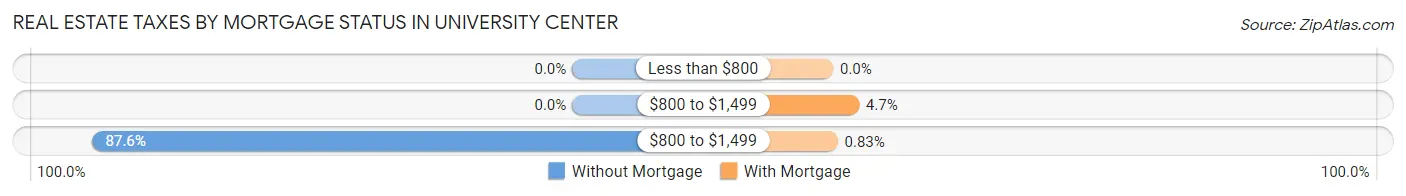
| Property Taxes | Without Mortgage | With Mortgage |
| Less than $800 | 0 (0.0%) | 0 (0.0%) |
| $800 to $1,499 | 0 (0.0%) | 17 (4.7%) |
| $800 to $1,499 | 148 (87.6%) | 3 (0.8%) |
| Total | 169 (100.0%) | 360 (100.0%) |
Health & Disability in University Center
Health Insurance Coverage by Age in University Center
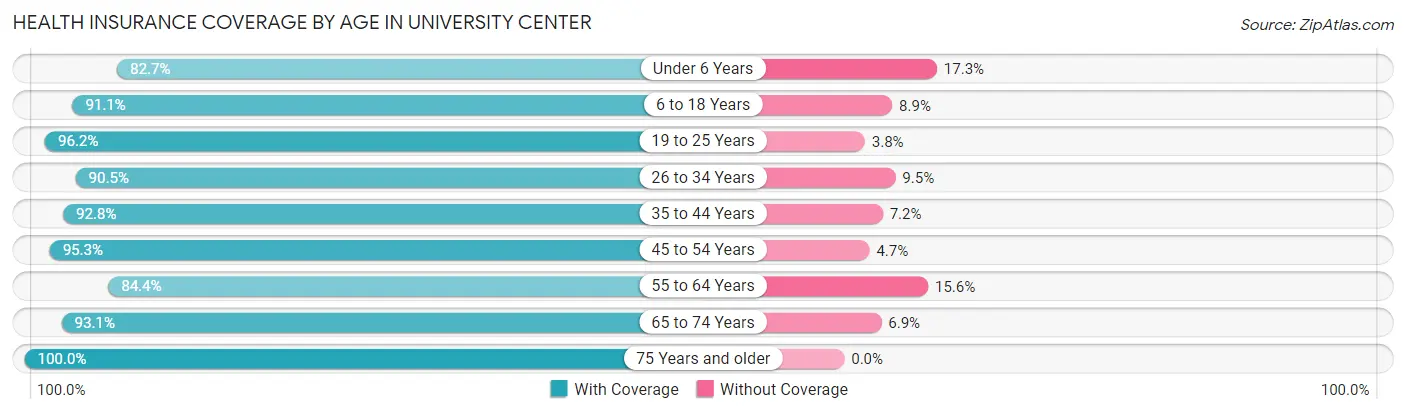
| Age Bracket | With Coverage | Without Coverage |
| Under 6 Years | 273 (82.7%) | 57 (17.3%) |
| 6 to 18 Years | 510 (91.1%) | 50 (8.9%) |
| 19 to 25 Years | 577 (96.2%) | 23 (3.8%) |
| 26 to 34 Years | 1,224 (90.5%) | 129 (9.5%) |
| 35 to 44 Years | 492 (92.8%) | 38 (7.2%) |
| 45 to 54 Years | 325 (95.3%) | 16 (4.7%) |
| 55 to 64 Years | 189 (84.4%) | 35 (15.6%) |
| 65 to 74 Years | 202 (93.1%) | 15 (6.9%) |
| 75 Years and older | 68 (100.0%) | 0 (0.0%) |
| Total | 3,860 (91.4%) | 363 (8.6%) |
Health Insurance Coverage by Citizenship Status in University Center
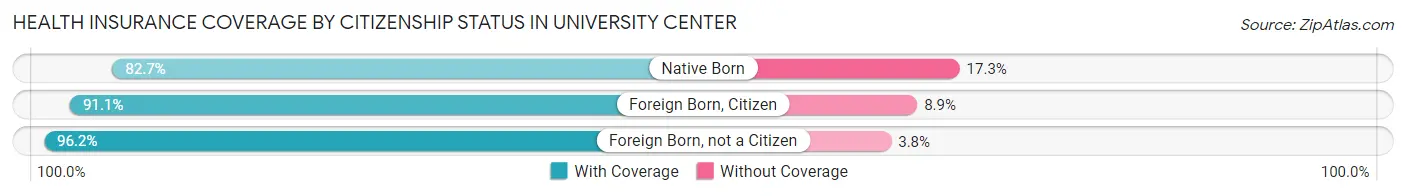
| Citizenship Status | With Coverage | Without Coverage |
| Native Born | 273 (82.7%) | 57 (17.3%) |
| Foreign Born, Citizen | 510 (91.1%) | 50 (8.9%) |
| Foreign Born, not a Citizen | 577 (96.2%) | 23 (3.8%) |
Health Insurance Coverage by Household Income in University Center
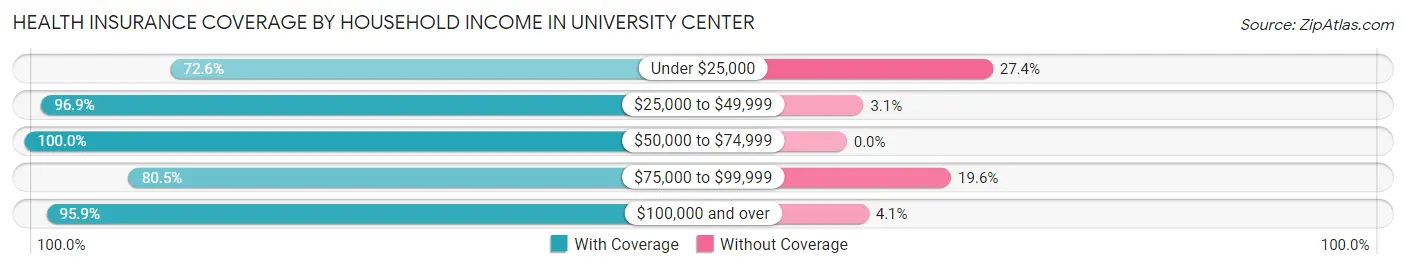
| Household Income | With Coverage | Without Coverage |
| Under $25,000 | 478 (72.6%) | 180 (27.4%) |
| $25,000 to $49,999 | 309 (96.9%) | 10 (3.1%) |
| $50,000 to $74,999 | 214 (100.0%) | 0 (0.0%) |
| $75,000 to $99,999 | 251 (80.4%) | 61 (19.6%) |
| $100,000 and over | 2,608 (95.9%) | 112 (4.1%) |
Public vs Private Health Insurance Coverage by Age in University Center
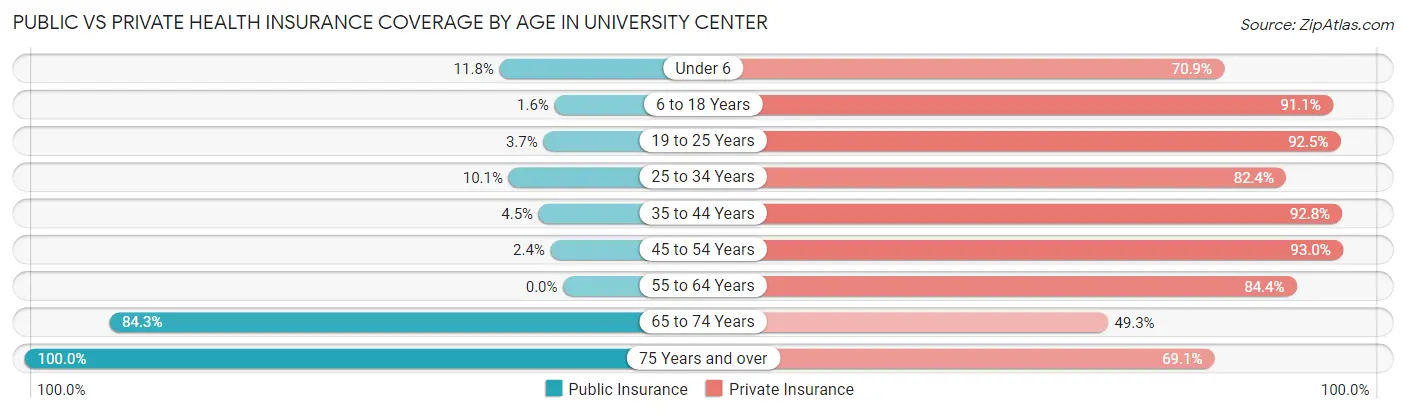
| Age Bracket | Public Insurance | Private Insurance |
| Under 6 | 39 (11.8%) | 234 (70.9%) |
| 6 to 18 Years | 9 (1.6%) | 510 (91.1%) |
| 19 to 25 Years | 22 (3.7%) | 555 (92.5%) |
| 25 to 34 Years | 137 (10.1%) | 1,115 (82.4%) |
| 35 to 44 Years | 24 (4.5%) | 492 (92.8%) |
| 45 to 54 Years | 8 (2.4%) | 317 (93.0%) |
| 55 to 64 Years | 0 (0.0%) | 189 (84.4%) |
| 65 to 74 Years | 183 (84.3%) | 107 (49.3%) |
| 75 Years and over | 68 (100.0%) | 47 (69.1%) |
| Total | 490 (11.6%) | 3,566 (84.4%) |
Disability Status by Sex by Age in University Center
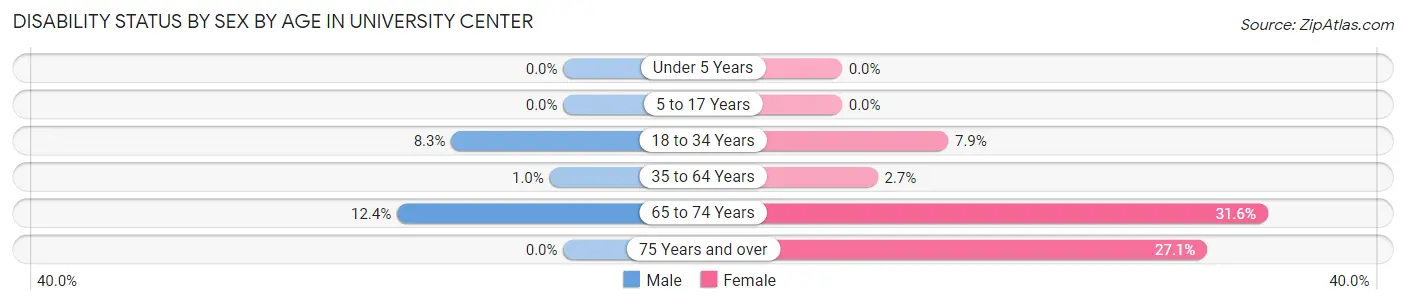
| Age Bracket | Male | Female |
| Under 5 Years | 0 (0.0%) | 0 (0.0%) |
| 5 to 17 Years | 0 (0.0%) | 0 (0.0%) |
| 18 to 34 Years | 78 (8.3%) | 84 (7.9%) |
| 35 to 64 Years | 5 (1.0%) | 16 (2.6%) |
| 65 to 74 Years | 10 (12.3%) | 43 (31.6%) |
| 75 Years and over | 0 (0.0%) | 16 (27.1%) |
Disability Class by Sex by Age in University Center
Disability Class: Hearing Difficulty
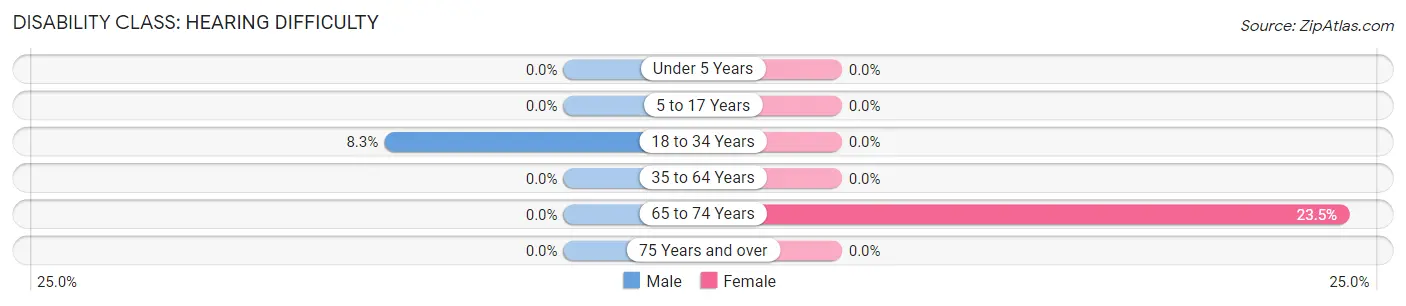
| Age Bracket | Male | Female |
| Under 5 Years | 0 (0.0%) | 0 (0.0%) |
| 5 to 17 Years | 0 (0.0%) | 0 (0.0%) |
| 18 to 34 Years | 78 (8.3%) | 0 (0.0%) |
| 35 to 64 Years | 0 (0.0%) | 0 (0.0%) |
| 65 to 74 Years | 0 (0.0%) | 32 (23.5%) |
| 75 Years and over | 0 (0.0%) | 0 (0.0%) |
Disability Class: Vision Difficulty
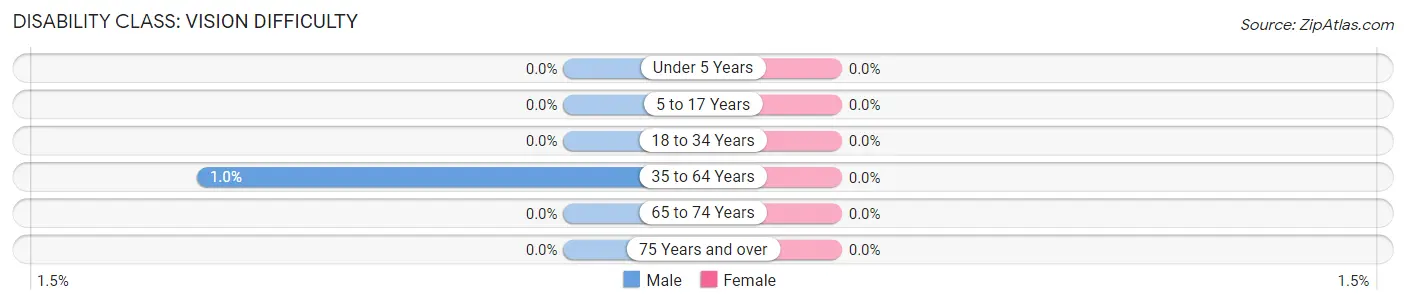
| Age Bracket | Male | Female |
| Under 5 Years | 0 (0.0%) | 0 (0.0%) |
| 5 to 17 Years | 0 (0.0%) | 0 (0.0%) |
| 18 to 34 Years | 0 (0.0%) | 0 (0.0%) |
| 35 to 64 Years | 5 (1.0%) | 0 (0.0%) |
| 65 to 74 Years | 0 (0.0%) | 0 (0.0%) |
| 75 Years and over | 0 (0.0%) | 0 (0.0%) |
Disability Class: Cognitive Difficulty
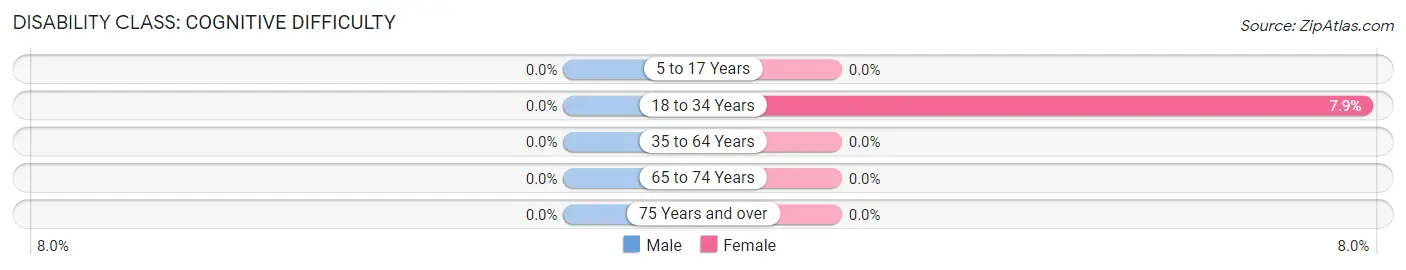
| Age Bracket | Male | Female |
| 5 to 17 Years | 0 (0.0%) | 0 (0.0%) |
| 18 to 34 Years | 0 (0.0%) | 84 (7.9%) |
| 35 to 64 Years | 0 (0.0%) | 0 (0.0%) |
| 65 to 74 Years | 0 (0.0%) | 0 (0.0%) |
| 75 Years and over | 0 (0.0%) | 0 (0.0%) |
Disability Class: Ambulatory Difficulty
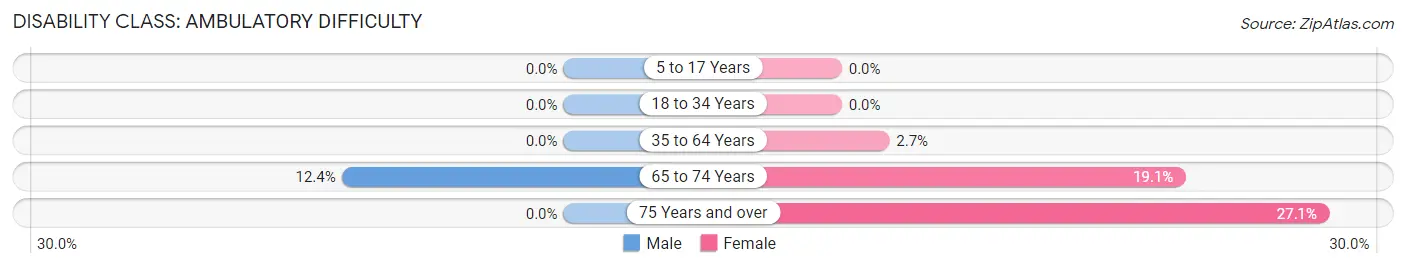
| Age Bracket | Male | Female |
| 5 to 17 Years | 0 (0.0%) | 0 (0.0%) |
| 18 to 34 Years | 0 (0.0%) | 0 (0.0%) |
| 35 to 64 Years | 0 (0.0%) | 16 (2.6%) |
| 65 to 74 Years | 10 (12.3%) | 26 (19.1%) |
| 75 Years and over | 0 (0.0%) | 16 (27.1%) |
Disability Class: Self-Care Difficulty
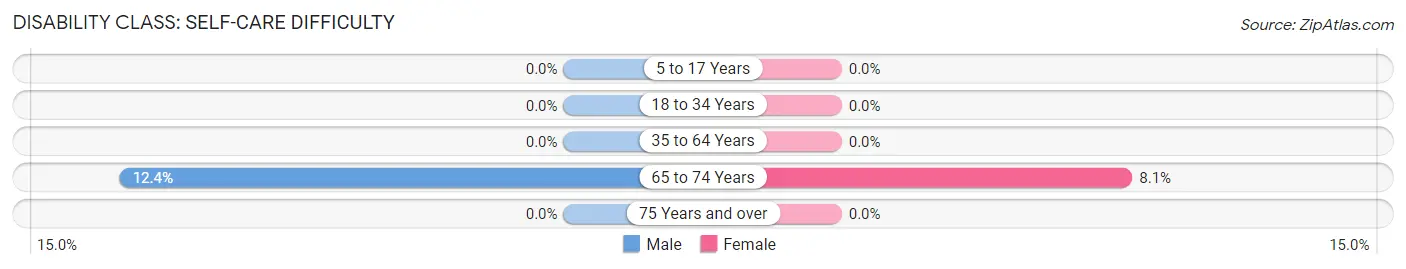
| Age Bracket | Male | Female |
| 5 to 17 Years | 0 (0.0%) | 0 (0.0%) |
| 18 to 34 Years | 0 (0.0%) | 0 (0.0%) |
| 35 to 64 Years | 0 (0.0%) | 0 (0.0%) |
| 65 to 74 Years | 10 (12.3%) | 11 (8.1%) |
| 75 Years and over | 0 (0.0%) | 0 (0.0%) |
Technology Access in University Center
Computing Device Access in University Center
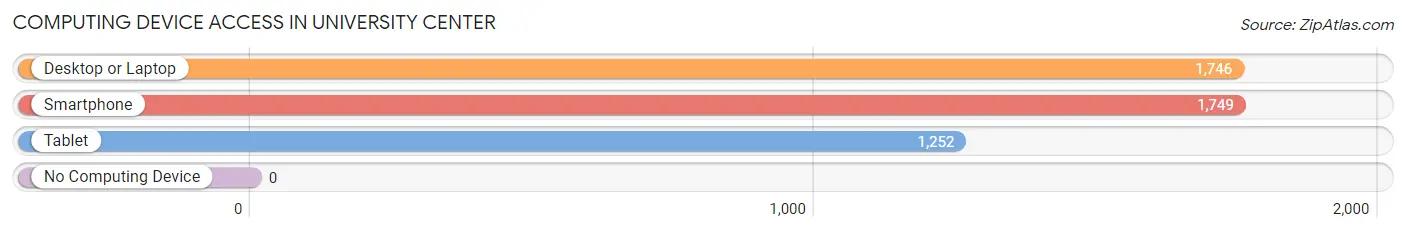
| Device Type | # Households | % Households |
| Desktop or Laptop | 1,746 | 98.6% |
| Smartphone | 1,749 | 98.8% |
| Tablet | 1,252 | 70.7% |
| No Computing Device | 0 | 0.0% |
| Total | 1,771 | 100.0% |
Internet Access in University Center
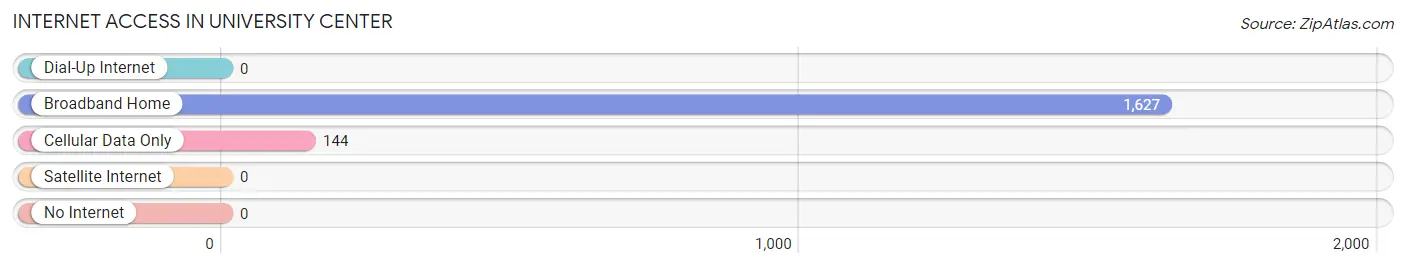
| Internet Type | # Households | % Households |
| Dial-Up Internet | 0 | 0.0% |
| Broadband Home | 1,627 | 91.9% |
| Cellular Data Only | 144 | 8.1% |
| Satellite Internet | 0 | 0.0% |
| No Internet | 0 | 0.0% |
| Total | 1,771 | 100.0% |
University Center Summary
University Center, Virginia is a small unincorporated community located in the northern part of Fairfax County, Virginia. It is situated between the towns of Herndon and Reston, and is part of the Washington Metropolitan Area. The community is home to a diverse population of approximately 1,000 people, and is known for its close-knit community and small-town charm.
History
University Center, Virginia was originally part of the Fairfax County land grant given to Thomas Fairfax, 6th Lord Fairfax of Cameron in 1745. The area was first settled in the late 1700s by a group of Quakers, who established a small farming community. In the early 1800s, the area was known as “The Crossroads” due to its location at the intersection of two major roads. In 1845, the area was renamed “University Center” after the establishment of the University of Virginia in nearby Charlottesville.
The area remained largely rural until the 1950s, when the population began to grow rapidly due to the expansion of the Washington Metropolitan Area. In the 1960s, the area was annexed by the Town of Herndon, and in the 1970s, the area was annexed by the Town of Reston. Today, University Center is an unincorporated community within Fairfax County.
Geography
University Center is located in the northern part of Fairfax County, Virginia. It is situated between the towns of Herndon and Reston, and is part of the Washington Metropolitan Area. The community is bordered by the Dulles Toll Road to the north, the Fairfax County Parkway to the east, and the Dulles Access Road to the south. The area is characterized by rolling hills and wooded areas, and is home to a variety of wildlife.
Economy
University Center is home to a diverse economy, with a variety of businesses and industries. The area is home to several technology companies, including Oracle, Microsoft, and Amazon. The area is also home to a number of government contractors, including Northrop Grumman and Lockheed Martin. Additionally, the area is home to a number of retail stores, restaurants, and other businesses.
Demographics
As of the 2010 census, University Center had a population of approximately 1,000 people. The population is diverse, with a variety of racial and ethnic backgrounds. The median household income is $90,000, and the median home value is $400,000. The area is served by the Fairfax County Public Schools system.
University Center is a small, close-knit community with a unique history and culture. The area is home to a diverse population and a variety of businesses and industries. The area is known for its small-town charm and close proximity to the Washington Metropolitan Area.
Common Questions
What is Per Capita Income in University Center?
Per Capita income in University Center is $45,129.
What is the Median Family Income in University Center?
Median Family Income in University Center is $118,514.
What is the Median Household income in University Center?
Median Household Income in University Center is $106,461.
What is Income or Wage Gap in University Center?
Income or Wage Gap in University Center is 10.1%.
Women in University Center earn 89.9 cents for every dollar earned by a man.
What is Inequality or Gini Index in University Center?
Inequality or Gini Index in University Center is 0.41.
What is the Total Population of University Center?
Total Population of University Center is 4,223.
What is the Total Male Population of University Center?
Total Male Population of University Center is 1,965.
What is the Total Female Population of University Center?
Total Female Population of University Center is 2,258.
What is the Ratio of Males per 100 Females in University Center?
There are 87.02 Males per 100 Females in University Center.
What is the Ratio of Females per 100 Males in University Center?
There are 114.91 Females per 100 Males in University Center.
What is the Median Population Age in University Center?
Median Population Age in University Center is 31.6 Years.
What is the Average Family Size in University Center
Average Family Size in University Center is 3.0 People.
What is the Average Household Size in University Center
Average Household Size in University Center is 2.4 People.
How Large is the Labor Force in University Center?
There are 2,588 People in the Labor Forcein in University Center.
What is the Percentage of People in the Labor Force in University Center?
76.4% of People are in the Labor Force in University Center.
What is the Unemployment Rate in University Center?
Unemployment Rate in University Center is 4.9%.