New Church, VA Map & Demographics
New Church Map
New Church Overview
$11,621
PER CAPITA INCOME
$20,794
AVG FAMILY INCOME
0.36
INEQUALITY / GINI INDEX
487
TOTAL POPULATION
157
MALE POPULATION
330
FEMALE POPULATION
47.58
MALES / 100 FEMALES
210.19
FEMALES / 100 MALES
50.6
MEDIAN AGE
2.1
AVG FAMILY SIZE
2.2
AVG HOUSEHOLD SIZE
257
LABOR FORCE [ PEOPLE ]
62.4%
PERCENT IN LABOR FORCE
New Church Zip Codes
New Church Area Codes
Income in New Church
Income Overview in New Church
| Characteristic | Number | Measure |
| Per Capita Income | 487 | $11,621 |
| Median Family Income | 157 | $20,794 |
| Mean Family Income | 157 | $12,057 |
| Median Household Income | 202 | $0 |
| Mean Household Income | 202 | $32,903 |
| Income Deficit | 157 | $0 |
| Wage / Income Gap (%) | 487 | 0.00% |
| Wage / Income Gap ($) | 487 | 100.00¢ per $1 |
| Gini / Inequality Index | 487 | 0.36 |
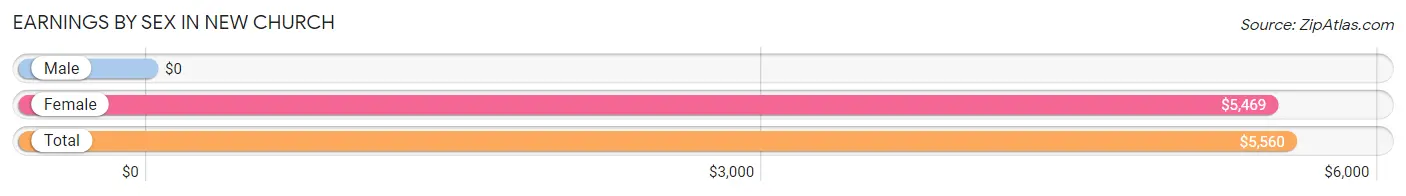
Earnings by Sex in New Church
| Sex | Number | Average Earnings |
| Male | 121 (43.7%) | $0 |
| Female | 156 (56.3%) | $5,469 |
| Total | 277 (100.0%) | $5,560 |
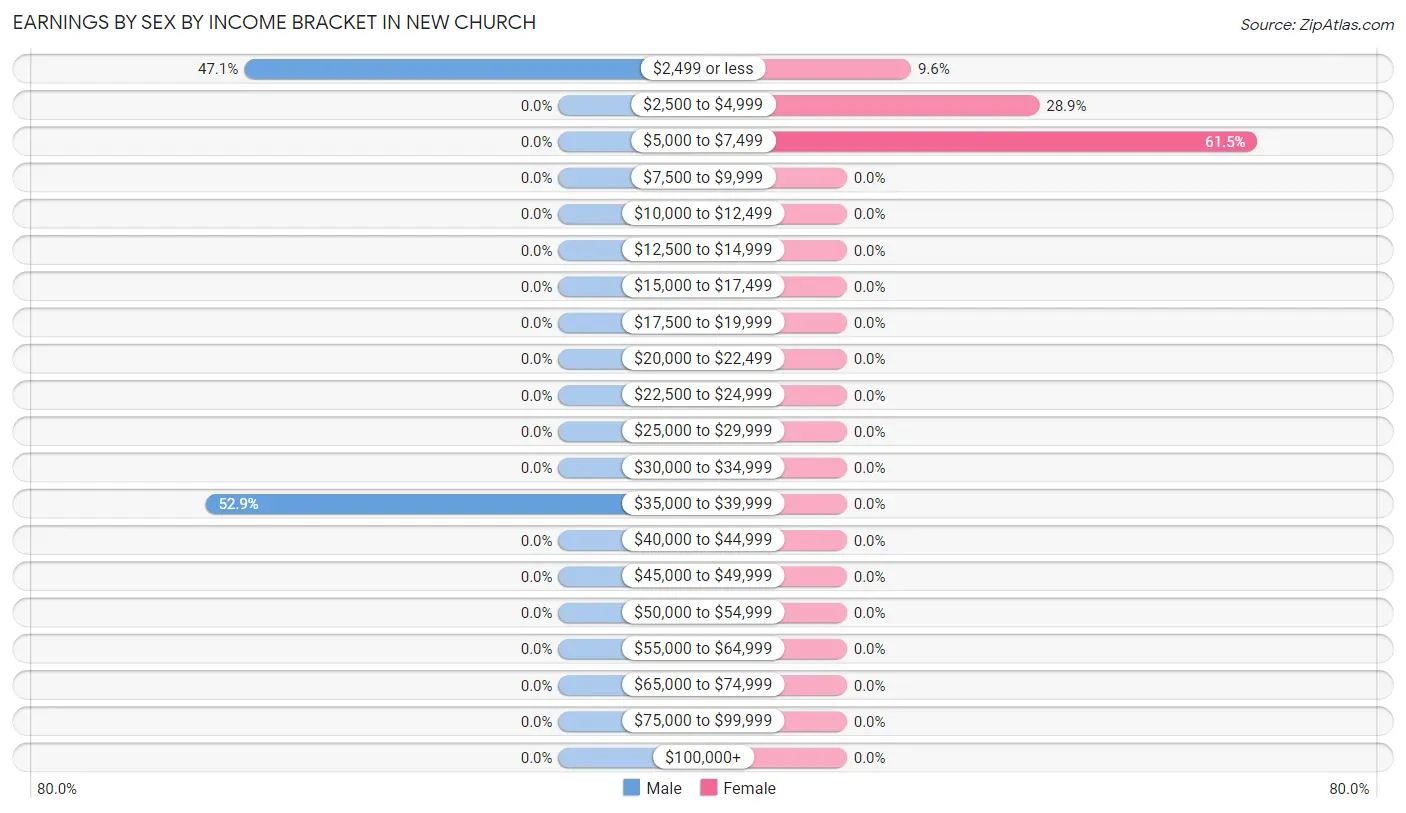
Earnings by Sex by Income Bracket in New Church
The most common earnings brackets in New Church are $35,000 to $39,999 for men (64 | 52.9%) and $5,000 to $7,499 for women (96 | 61.5%).
| Income | Male | Female |
| $2,499 or less | 57 (47.1%) | 15 (9.6%) |
| $2,500 to $4,999 | 0 (0.0%) | 45 (28.8%) |
| $5,000 to $7,499 | 0 (0.0%) | 96 (61.5%) |
| $7,500 to $9,999 | 0 (0.0%) | 0 (0.0%) |
| $10,000 to $12,499 | 0 (0.0%) | 0 (0.0%) |
| $12,500 to $14,999 | 0 (0.0%) | 0 (0.0%) |
| $15,000 to $17,499 | 0 (0.0%) | 0 (0.0%) |
| $17,500 to $19,999 | 0 (0.0%) | 0 (0.0%) |
| $20,000 to $22,499 | 0 (0.0%) | 0 (0.0%) |
| $22,500 to $24,999 | 0 (0.0%) | 0 (0.0%) |
| $25,000 to $29,999 | 0 (0.0%) | 0 (0.0%) |
| $30,000 to $34,999 | 0 (0.0%) | 0 (0.0%) |
| $35,000 to $39,999 | 64 (52.9%) | 0 (0.0%) |
| $40,000 to $44,999 | 0 (0.0%) | 0 (0.0%) |
| $45,000 to $49,999 | 0 (0.0%) | 0 (0.0%) |
| $50,000 to $54,999 | 0 (0.0%) | 0 (0.0%) |
| $55,000 to $64,999 | 0 (0.0%) | 0 (0.0%) |
| $65,000 to $74,999 | 0 (0.0%) | 0 (0.0%) |
| $75,000 to $99,999 | 0 (0.0%) | 0 (0.0%) |
| $100,000+ | 0 (0.0%) | 0 (0.0%) |
| Total | 121 (100.0%) | 156 (100.0%) |
Earnings by Sex by Educational Attainment in New Church
| Educational Attainment | Male Income | Female Income |
| Less than High School | - | - |
| High School Diploma | - | - |
| College or Associate's Degree | - | - |
| Bachelor's Degree | - | - |
| Graduate Degree | - | - |
| Total | - | - |
Family Income in New Church
Family Income Brackets in New Church
According to the New Church family income data, there are 107 families falling into the $15,000 to $24,999 income range, which is the most common income bracket and makes up 68.1% of all families.
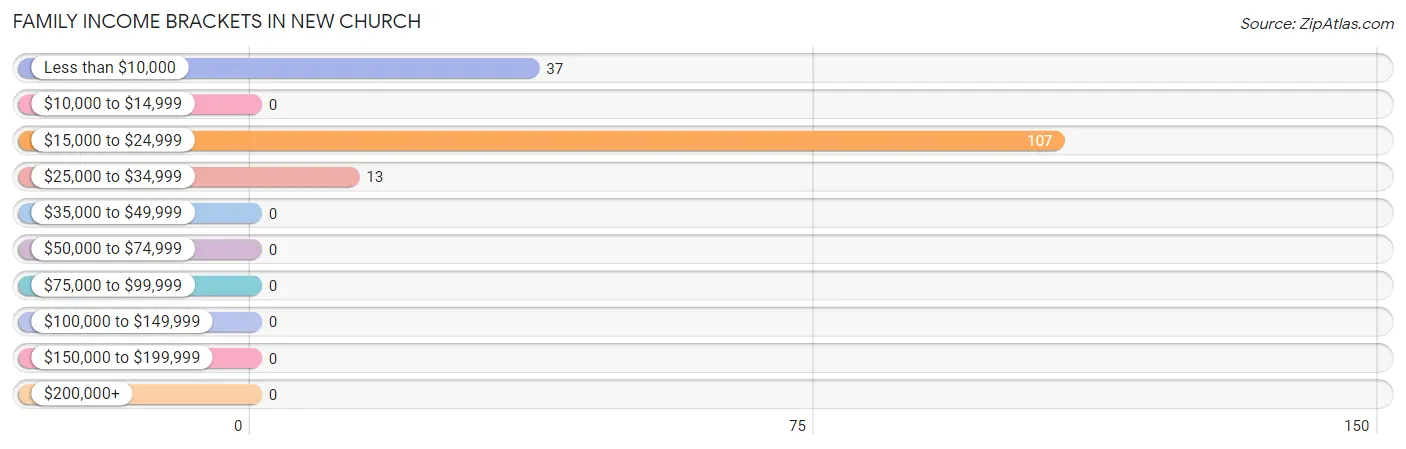
| Income Bracket | # Families | % Families |
| Less than $10,000 | 37 | 23.6% |
| $10,000 to $14,999 | 0 | 0.0% |
| $15,000 to $24,999 | 107 | 68.2% |
| $25,000 to $34,999 | 13 | 8.3% |
| $35,000 to $49,999 | 0 | 0.0% |
| $50,000 to $74,999 | 0 | 0.0% |
| $75,000 to $99,999 | 0 | 0.0% |
| $100,000 to $149,999 | 0 | 0.0% |
| $150,000 to $199,999 | 0 | 0.0% |
| $200,000+ | 0 | 0.0% |
Family Income by Famaliy Size in New Church
| Income Bracket | # Families | Median Income |
| 2-Person Families | 50 (31.9%) | $0 |
| 3-Person Families | 107 (68.1%) | $0 |
| 4-Person Families | 0 (0.0%) | $0 |
| 5-Person Families | 0 (0.0%) | $0 |
| 6-Person Families | 0 (0.0%) | $0 |
| 7+ Person Families | 0 (0.0%) | $0 |
| Total | 157 (100.0%) | $20,794 |
Family Income by Number of Earners in New Church
| Number of Earners | # Families | Median Income |
| No Earners | 24 (15.3%) | $0 |
| 1 Earner | 0 (0.0%) | $0 |
| 2 Earners | 133 (84.7%) | $0 |
| 3+ Earners | 0 (0.0%) | $0 |
| Total | 157 (100.0%) | $20,794 |
Household Income in New Church
Household Income Brackets in New Church
With 96 households falling in the category, the $50,000 to $74,999 income range is the most frequent in New Church, accounting for 47.5% of all households.
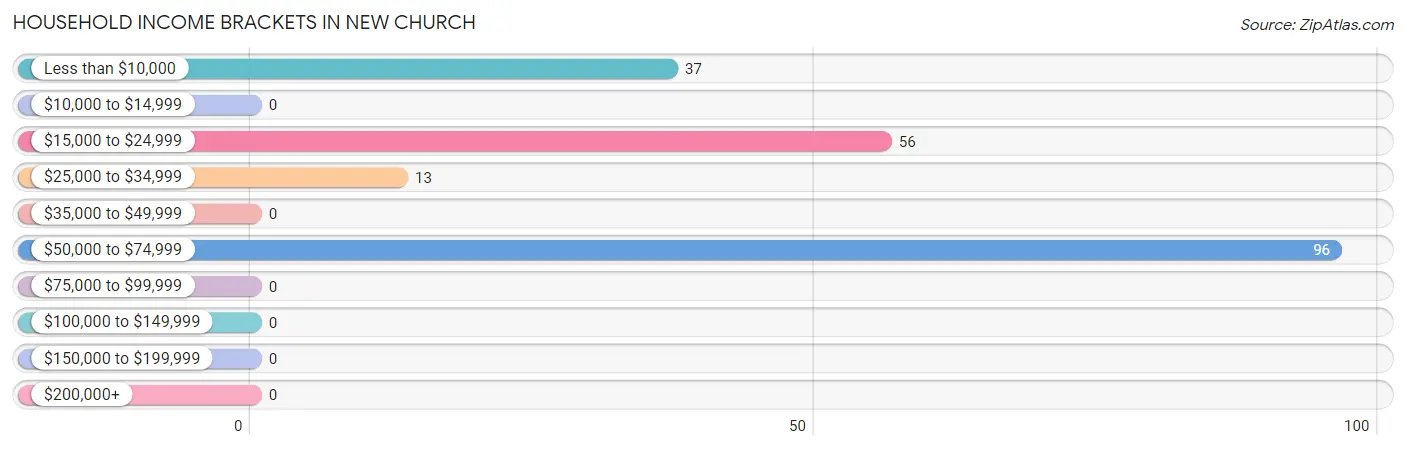
| Income Bracket | # Households | % Households |
| Less than $10,000 | 37 | 18.3% |
| $10,000 to $14,999 | 0 | 0.0% |
| $15,000 to $24,999 | 56 | 27.7% |
| $25,000 to $34,999 | 13 | 6.4% |
| $35,000 to $49,999 | 0 | 0.0% |
| $50,000 to $74,999 | 96 | 47.5% |
| $75,000 to $99,999 | 0 | 0.0% |
| $100,000 to $149,999 | 0 | 0.0% |
| $150,000 to $199,999 | 0 | 0.0% |
| $200,000+ | 0 | 0.0% |
Household Income by Householder Age in New Church
The median household income in New Church is $0, with the highest median household income of $60,456 found in the 45 to 64 years age bracket for the primary householder. A total of 157 households (77.7%) fall into this category.
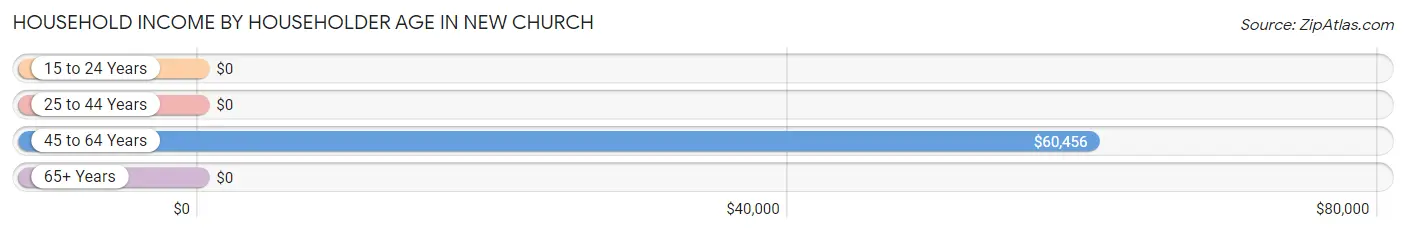
| Income Bracket | # Households | Median Income |
| 15 to 24 Years | 0 (0.0%) | $0 |
| 25 to 44 Years | 0 (0.0%) | $0 |
| 45 to 64 Years | 157 (77.7%) | $60,456 |
| 65+ Years | 45 (22.3%) | $0 |
| Total | 202 (100.0%) | $0 |
Poverty in New Church
Income Below Poverty by Sex and Age in New Church
With 51.0% poverty level for males and 82.1% for females among the residents of New Church, 18 to 24 year old males and under 5 year old females are the most vulnerable to poverty, with 20 males (100.0%) and 12 females (100.0%) in their respective age groups living below the poverty level.
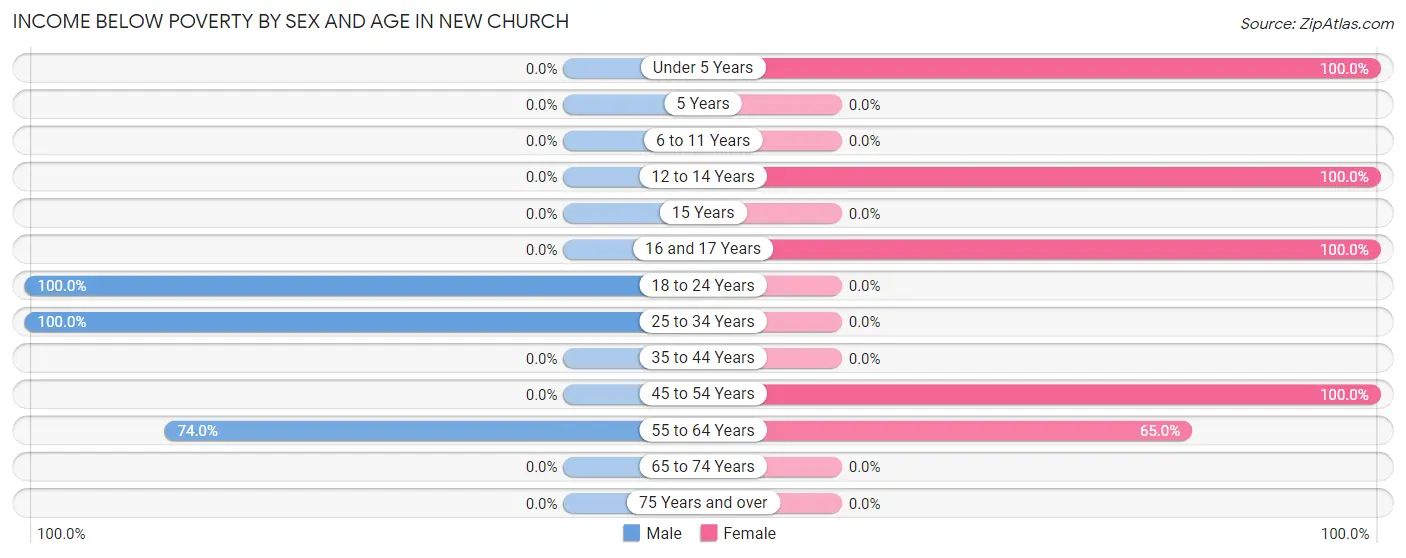
| Age Bracket | Male | Female |
| Under 5 Years | 0 (0.0%) | 12 (100.0%) |
| 5 Years | 0 (0.0%) | 0 (0.0%) |
| 6 to 11 Years | 0 (0.0%) | 0 (0.0%) |
| 12 to 14 Years | 0 (0.0%) | 63 (100.0%) |
| 15 Years | 0 (0.0%) | 0 (0.0%) |
| 16 and 17 Years | 0 (0.0%) | 45 (100.0%) |
| 18 to 24 Years | 20 (100.0%) | 0 (0.0%) |
| 25 to 34 Years | 23 (100.0%) | 0 (0.0%) |
| 35 to 44 Years | 0 (0.0%) | 0 (0.0%) |
| 45 to 54 Years | 0 (0.0%) | 125 (100.0%) |
| 55 to 64 Years | 37 (74.0%) | 26 (65.0%) |
| 65 to 74 Years | 0 (0.0%) | 0 (0.0%) |
| 75 Years and over | 0 (0.0%) | 0 (0.0%) |
| Total | 80 (51.0%) | 271 (82.1%) |
Income Above Poverty by Sex and Age in New Church
According to the poverty statistics in New Church, males aged 45 to 54 years and females aged 65 to 74 years are the age groups that are most secure financially, with 100.0% of males and 100.0% of females in these age groups living above the poverty line.
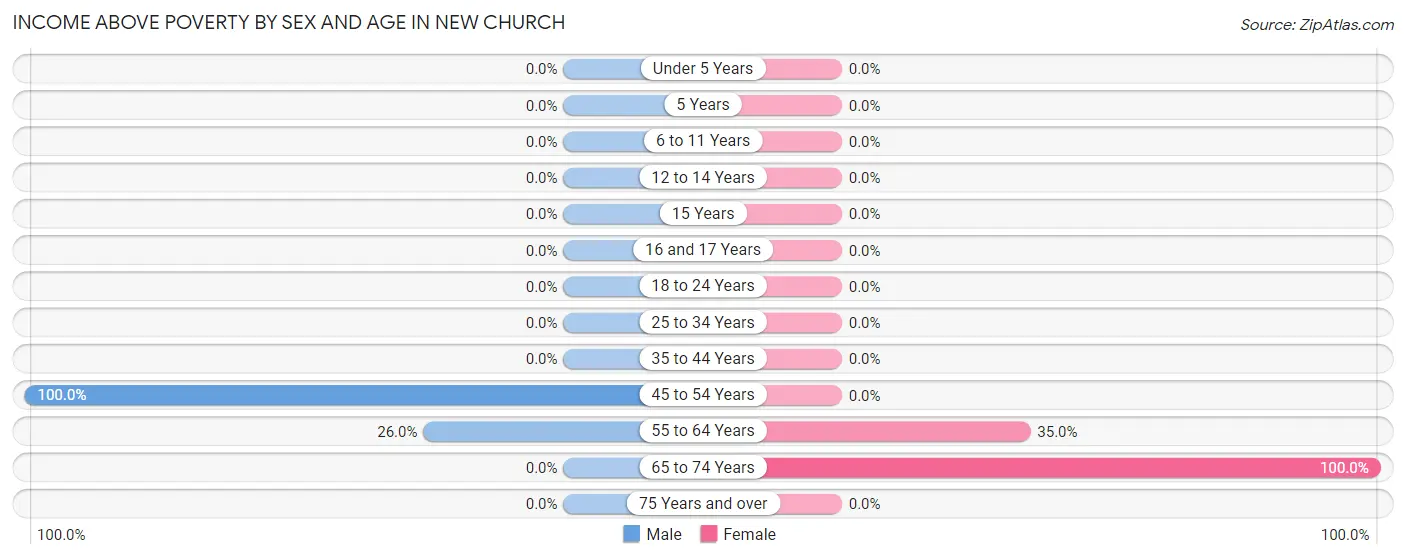
| Age Bracket | Male | Female |
| Under 5 Years | 0 (0.0%) | 0 (0.0%) |
| 5 Years | 0 (0.0%) | 0 (0.0%) |
| 6 to 11 Years | 0 (0.0%) | 0 (0.0%) |
| 12 to 14 Years | 0 (0.0%) | 0 (0.0%) |
| 15 Years | 0 (0.0%) | 0 (0.0%) |
| 16 and 17 Years | 0 (0.0%) | 0 (0.0%) |
| 18 to 24 Years | 0 (0.0%) | 0 (0.0%) |
| 25 to 34 Years | 0 (0.0%) | 0 (0.0%) |
| 35 to 44 Years | 0 (0.0%) | 0 (0.0%) |
| 45 to 54 Years | 64 (100.0%) | 0 (0.0%) |
| 55 to 64 Years | 13 (26.0%) | 14 (35.0%) |
| 65 to 74 Years | 0 (0.0%) | 45 (100.0%) |
| 75 Years and over | 0 (0.0%) | 0 (0.0%) |
| Total | 77 (49.0%) | 59 (17.9%) |
Income Below Poverty Among Married-Couple Families in New Church
The poverty statistics for married-couple families in New Church show that 74.0% or 37 of the total 50 families live below the poverty line. Families with no children have the highest poverty rate of 74.0%, comprising of 37 families. On the other hand, families with no children have the lowest poverty rate of 74.0%, which includes 37 families.
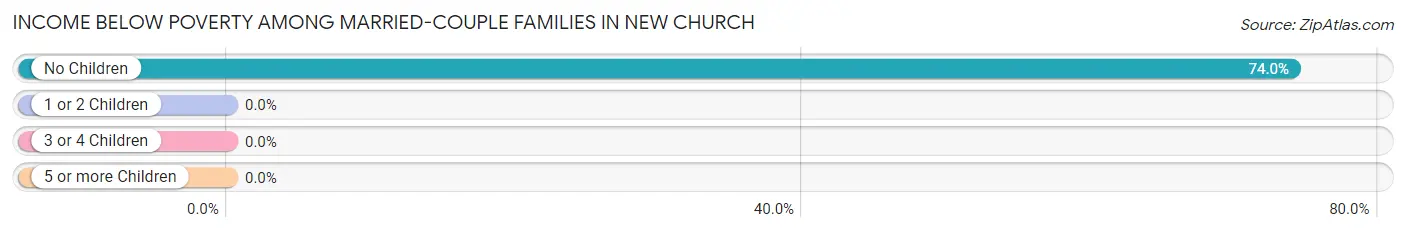
| Children | Above Poverty | Below Poverty |
| No Children | 13 (26.0%) | 37 (74.0%) |
| 1 or 2 Children | 0 (0.0%) | 0 (0.0%) |
| 3 or 4 Children | 0 (0.0%) | 0 (0.0%) |
| 5 or more Children | 0 (0.0%) | 0 (0.0%) |
| Total | 13 (26.0%) | 37 (74.0%) |
Income Below Poverty Among Single-Parent Households in New Church
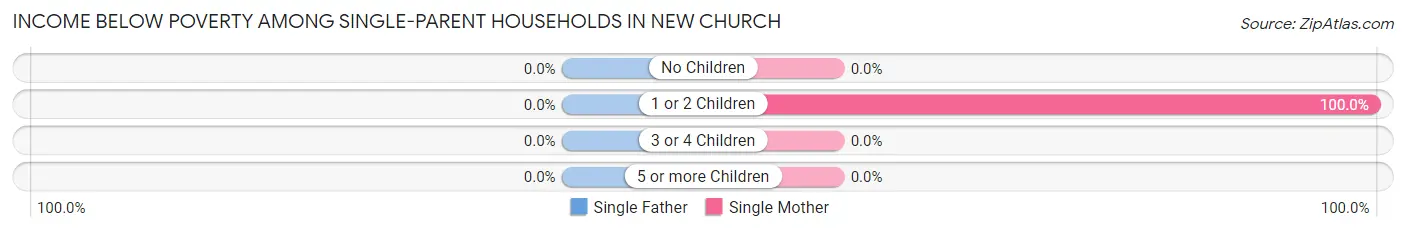
| Children | Single Father | Single Mother |
| No Children | 0 (0.0%) | 0 (0.0%) |
| 1 or 2 Children | 0 (0.0%) | 107 (100.0%) |
| 3 or 4 Children | 0 (0.0%) | 0 (0.0%) |
| 5 or more Children | 0 (0.0%) | 0 (0.0%) |
| Total | 0 (0.0%) | 107 (100.0%) |
Income Below Poverty Among Married-Couple vs Single-Parent Households in New Church
The poverty data for New Church shows that 37 of the married-couple family households (74.0%) and 107 of the single-parent households (100.0%) are living below the poverty level. Within the married-couple family households, those with no children have the highest poverty rate, with 37 households (74.0%) falling below the poverty line. Among the single-parent households, those with 1 or 2 children have the highest poverty rate, with 107 household (100.0%) living below poverty.
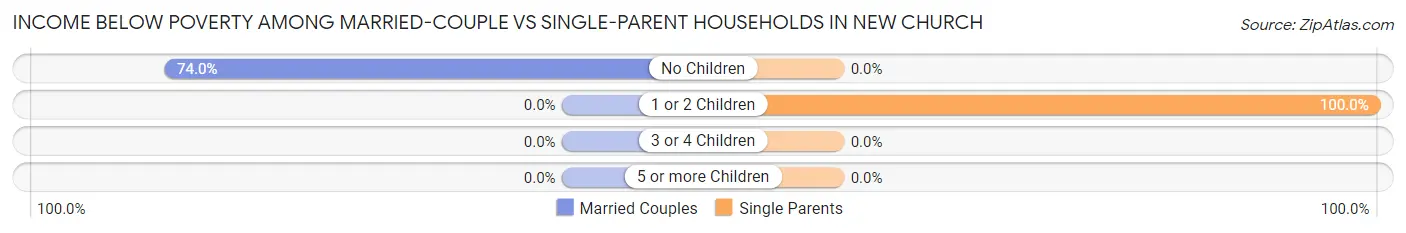
| Children | Married-Couple Families | Single-Parent Households |
| No Children | 37 (74.0%) | 0 (0.0%) |
| 1 or 2 Children | 0 (0.0%) | 107 (100.0%) |
| 3 or 4 Children | 0 (0.0%) | 0 (0.0%) |
| 5 or more Children | 0 (0.0%) | 0 (0.0%) |
| Total | 37 (74.0%) | 107 (100.0%) |
Race in New Church
The most populous races in New Church are White / Caucasian (375 | 77.0%), Black / African American (60 | 12.3%), and Asian (52 | 10.7%).
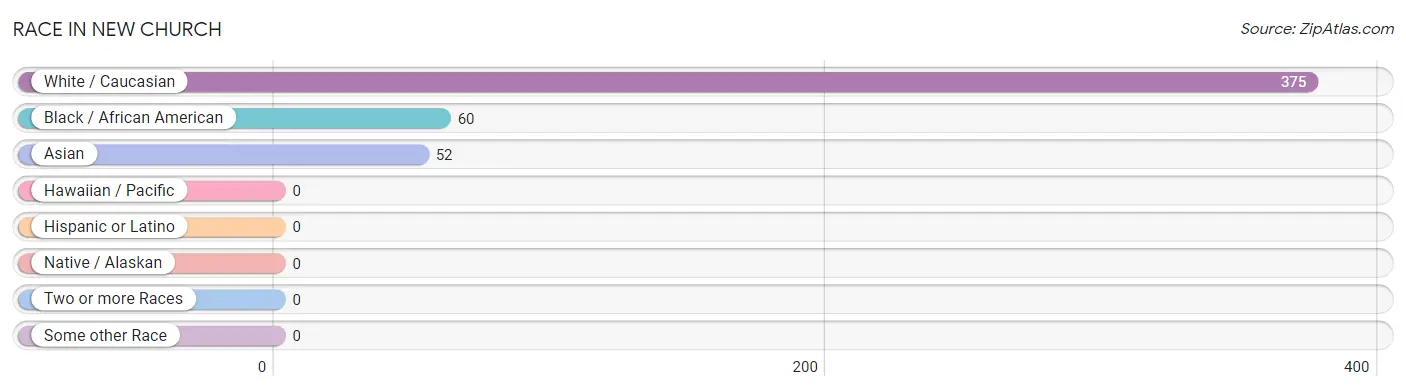
| Race | # Population | % Population |
| Asian | 52 | 10.7% |
| Black / African American | 60 | 12.3% |
| Hawaiian / Pacific | 0 | 0.0% |
| Hispanic or Latino | 0 | 0.0% |
| Native / Alaskan | 0 | 0.0% |
| White / Caucasian | 375 | 77.0% |
| Two or more Races | 0 | 0.0% |
| Some other Race | 0 | 0.0% |
| Total | 487 | 100.0% |
Ancestry in New Church
The most populous ancestries reported in New Church are American (268 | 55.0%), Irish (70 | 14.4%), Indian (Asian) (52 | 10.7%), German (45 | 9.2%), and English (23 | 4.7%), together accounting for 94.0% of all New Church residents.
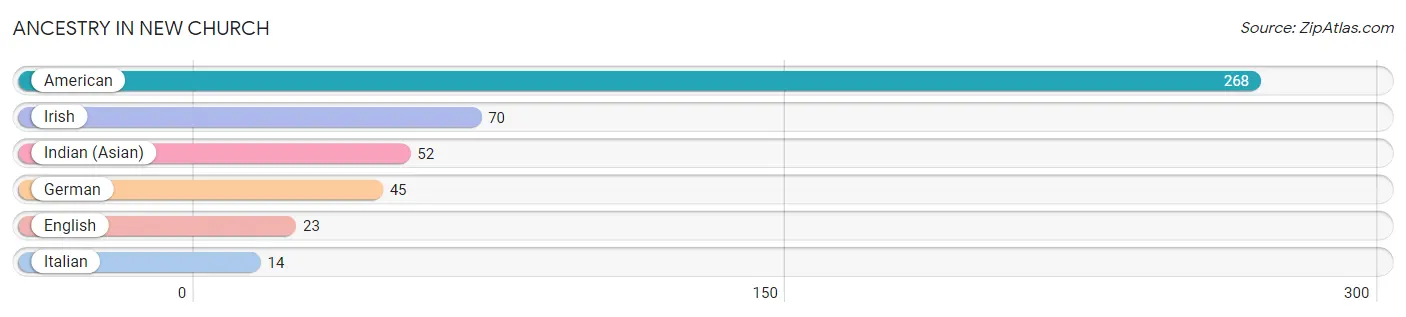
| Ancestry | # Population | % Population |
| American | 268 | 55.0% |
| English | 23 | 4.7% |
| German | 45 | 9.2% |
| Indian (Asian) | 52 | 10.7% |
| Irish | 70 | 14.4% |
| Italian | 14 | 2.9% | View All 6 Rows |
Immigrants in New Church
The most numerous immigrant groups reported in New Church came from Asia (52 | 10.7%), South Eastern Asia (37 | 7.6%), Vietnam (37 | 7.6%), China (15 | 3.1%), and Eastern Asia (15 | 3.1%), together accounting for 32.0% of all New Church residents.
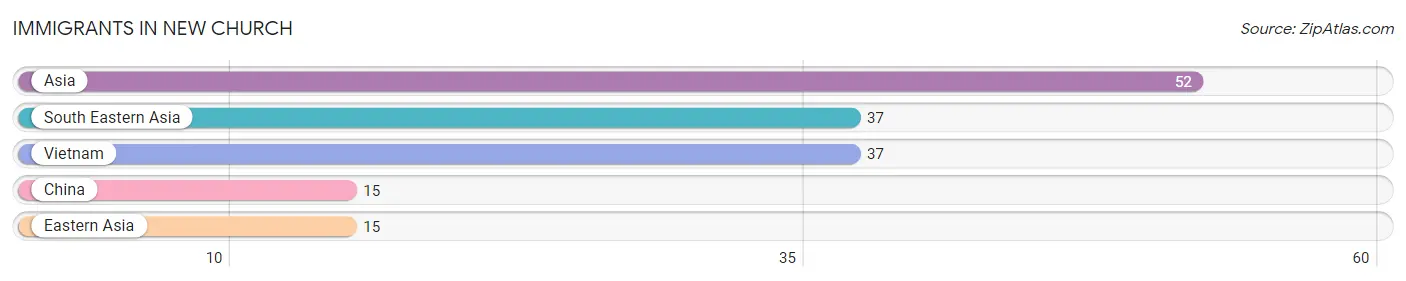
| Immigration Origin | # Population | % Population |
| Asia | 52 | 10.7% |
| China | 15 | 3.1% |
| Eastern Asia | 15 | 3.1% |
| South Eastern Asia | 37 | 7.6% |
| Vietnam | 37 | 7.6% | View All 5 Rows |
Sex and Age in New Church
Sex and Age in New Church
The most populous age groups in New Church are 45 to 49 Years (64 | 40.8%) for men and 50 to 54 Years (125 | 37.9%) for women.
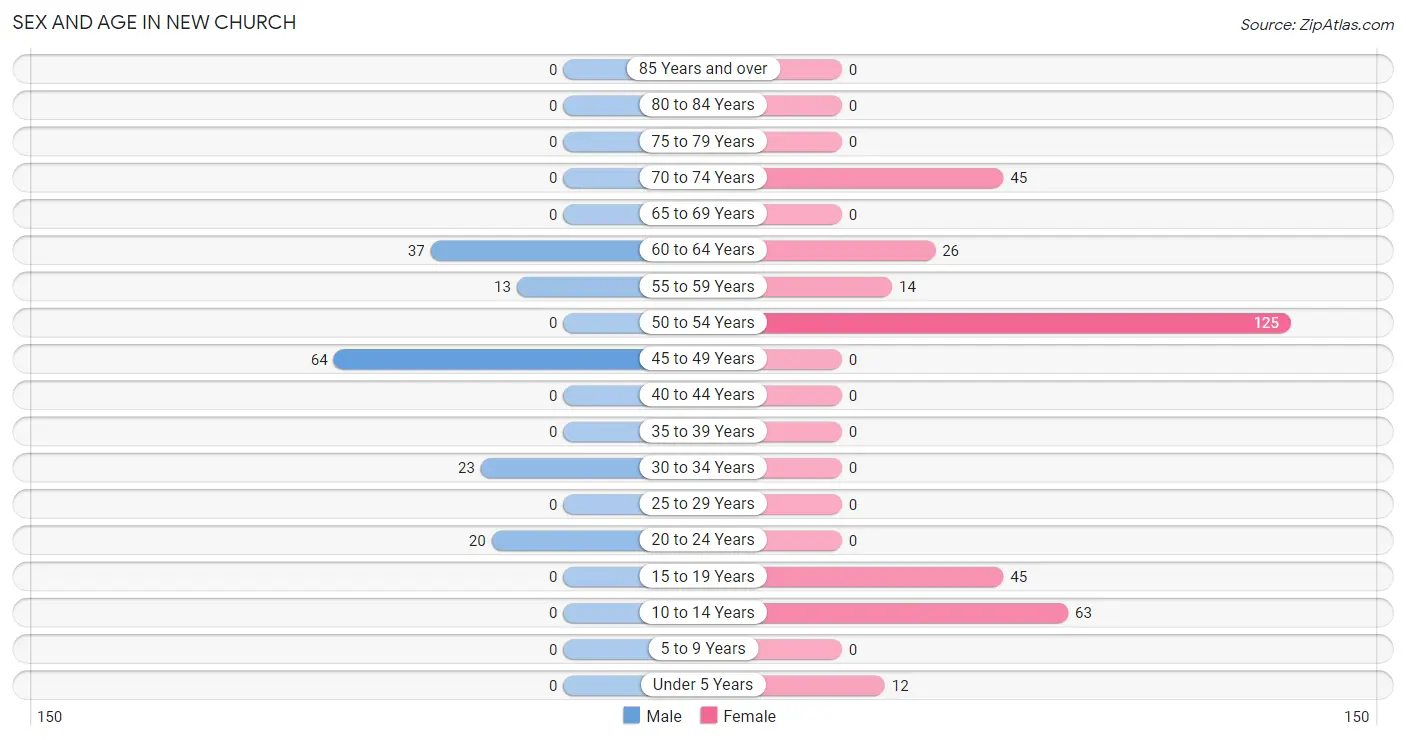
| Age Bracket | Male | Female |
| Under 5 Years | 0 (0.0%) | 12 (3.6%) |
| 5 to 9 Years | 0 (0.0%) | 0 (0.0%) |
| 10 to 14 Years | 0 (0.0%) | 63 (19.1%) |
| 15 to 19 Years | 0 (0.0%) | 45 (13.6%) |
| 20 to 24 Years | 20 (12.7%) | 0 (0.0%) |
| 25 to 29 Years | 0 (0.0%) | 0 (0.0%) |
| 30 to 34 Years | 23 (14.6%) | 0 (0.0%) |
| 35 to 39 Years | 0 (0.0%) | 0 (0.0%) |
| 40 to 44 Years | 0 (0.0%) | 0 (0.0%) |
| 45 to 49 Years | 64 (40.8%) | 0 (0.0%) |
| 50 to 54 Years | 0 (0.0%) | 125 (37.9%) |
| 55 to 59 Years | 13 (8.3%) | 14 (4.2%) |
| 60 to 64 Years | 37 (23.6%) | 26 (7.9%) |
| 65 to 69 Years | 0 (0.0%) | 0 (0.0%) |
| 70 to 74 Years | 0 (0.0%) | 45 (13.6%) |
| 75 to 79 Years | 0 (0.0%) | 0 (0.0%) |
| 80 to 84 Years | 0 (0.0%) | 0 (0.0%) |
| 85 Years and over | 0 (0.0%) | 0 (0.0%) |
| Total | 157 (100.0%) | 330 (100.0%) |
Families and Households in New Church
Median Family Size in New Church
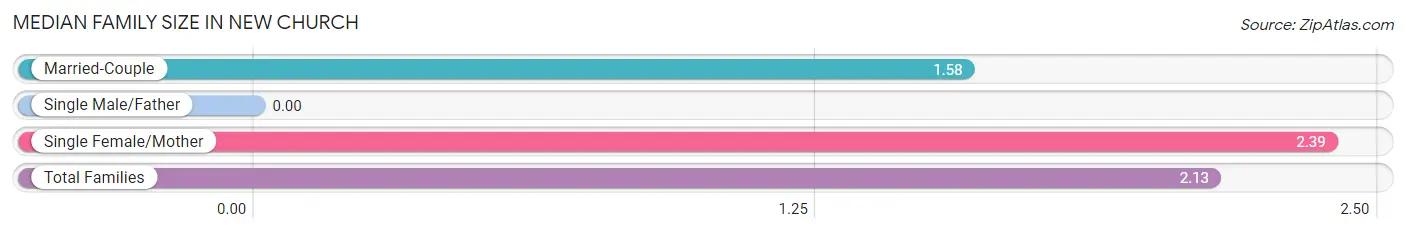
| Family Type | # Families | Family Size |
| Married-Couple | 50 (31.9%) | 1.58 |
| Single Male/Father | 0 (0.0%) | - |
| Single Female/Mother | 107 (68.1%) | 2.39 |
| Total Families | 157 (100.0%) | 2.13 |
Median Household Size in New Church
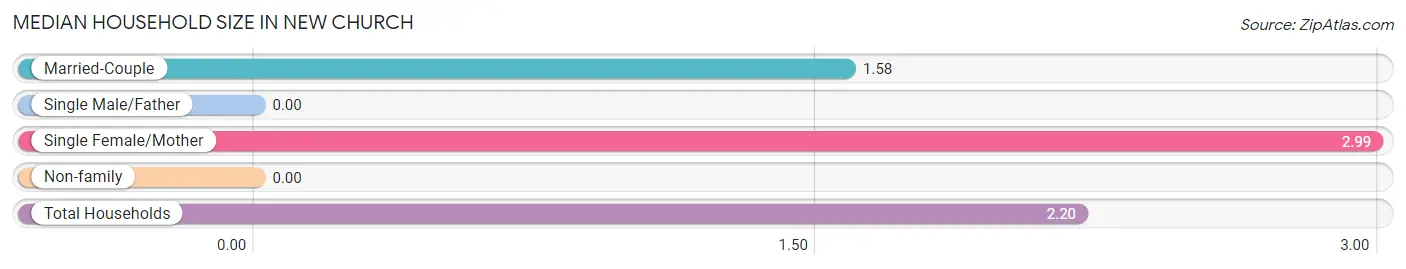
| Household Type | # Households | Household Size |
| Married-Couple | 50 (24.7%) | 1.58 |
| Single Male/Father | 0 (0.0%) | - |
| Single Female/Mother | 107 (53.0%) | 2.99 |
| Non-family | 45 (22.3%) | - |
| Total Households | 202 (100.0%) | 2.20 |
Household Size by Marriage Status in New Church
Out of a total of 202 households in New Church, 157 (77.7%) are family households, while 45 (22.3%) are nonfamily households. The most numerous type of family households are 4-person households, comprising 96, and the most common type of nonfamily households are 1-person households, comprising 45.
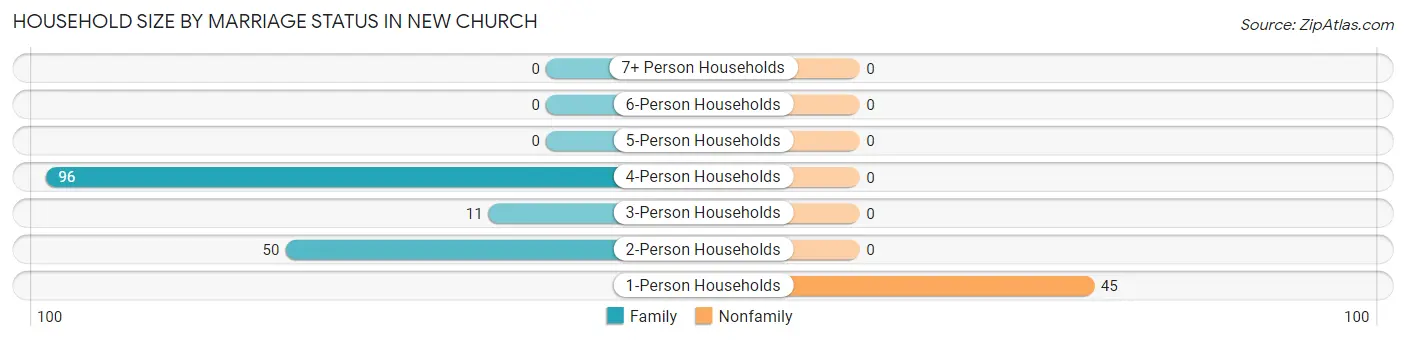
| Household Size | Family Households | Nonfamily Households |
| 1-Person Households | - | 45 (22.3%) |
| 2-Person Households | 50 (24.7%) | 0 (0.0%) |
| 3-Person Households | 11 (5.4%) | 0 (0.0%) |
| 4-Person Households | 96 (47.5%) | 0 (0.0%) |
| 5-Person Households | 0 (0.0%) | 0 (0.0%) |
| 6-Person Households | 0 (0.0%) | 0 (0.0%) |
| 7+ Person Households | 0 (0.0%) | 0 (0.0%) |
| Total | 157 (77.7%) | 45 (22.3%) |
Female Fertility in New Church
Fertility by Age in New Church
| Age Bracket | Women with Births | Births / 1,000 Women |
| 15 to 19 years | 0 (0.0%) | 0.0 |
| 20 to 34 years | 0 (0.0%) | 0.0 |
| 35 to 50 years | 0 (0.0%) | 0.0 |
| Total | 0 (0.0%) | 0.0 |
Fertility by Age by Marriage Status in New Church
| Age Bracket | Married | Unmarried |
| 15 to 19 years | 0 (0.0%) | 0 (0.0%) |
| 20 to 34 years | 0 (0.0%) | 0 (0.0%) |
| 35 to 50 years | 0 (0.0%) | 0 (0.0%) |
| Total | 0 (0.0%) | 0 (0.0%) |
Fertility by Education in New Church
| Educational Attainment | Women with Births | Births / 1,000 Women |
| Less than High School | 0 (0.0%) | 0.0 |
| High School Diploma | 0 (0.0%) | 0.0 |
| College or Associate's Degree | 0 (0.0%) | 0.0 |
| Bachelor's Degree | 0 (0.0%) | 0.0 |
| Graduate Degree | 0 (0.0%) | 0.0 |
| Total | 0 (0.0%) | 0.0 |
Fertility by Education by Marriage Status in New Church
| Educational Attainment | Married | Unmarried |
| Less than High School | 0 (0.0%) | 0 (0.0%) |
| High School Diploma | 0 (0.0%) | 0 (0.0%) |
| College or Associate's Degree | 0 (0.0%) | 0 (0.0%) |
| Bachelor's Degree | 0 (0.0%) | 0 (0.0%) |
| Graduate Degree | 0 (0.0%) | 0 (0.0%) |
| Total | 0 (0.0%) | 0 (0.0%) |
Employment Characteristics in New Church
Employment by Class of Employer in New Church
Among the 257 employed individuals in New Church, private company employees (205 | 79.8%), and self-employed (not incorporated) (52 | 20.2%) make up the most common classes of employment.
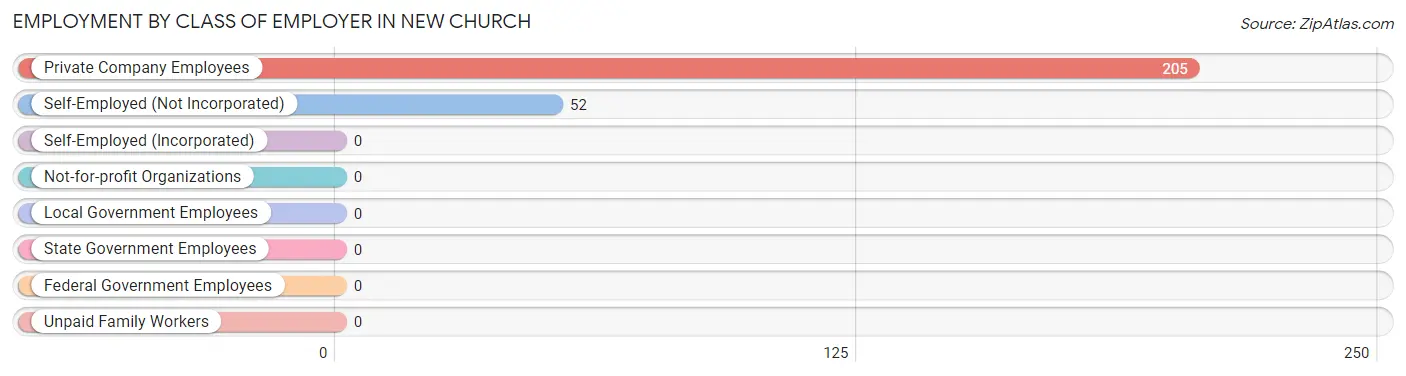
| Employer Class | # Employees | % Employees |
| Private Company Employees | 205 | 79.8% |
| Self-Employed (Incorporated) | 0 | 0.0% |
| Self-Employed (Not Incorporated) | 52 | 20.2% |
| Not-for-profit Organizations | 0 | 0.0% |
| Local Government Employees | 0 | 0.0% |
| State Government Employees | 0 | 0.0% |
| Federal Government Employees | 0 | 0.0% |
| Unpaid Family Workers | 0 | 0.0% |
| Total | 257 | 100.0% |
Employment Status by Age in New Church
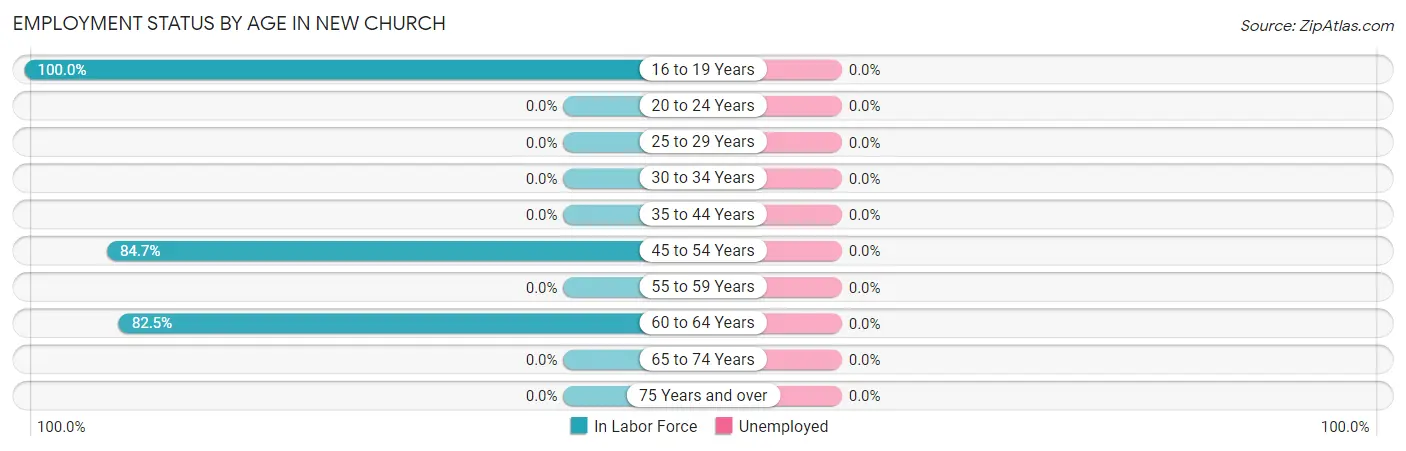
| Age Bracket | In Labor Force | Unemployed |
| 16 to 19 Years | 45 (100.0%) | 0 (0.0%) |
| 20 to 24 Years | 0 (0.0%) | 0 (0.0%) |
| 25 to 29 Years | 0 (0.0%) | 0 (0.0%) |
| 30 to 34 Years | 0 (0.0%) | 0 (0.0%) |
| 35 to 44 Years | 0 (0.0%) | 0 (0.0%) |
| 45 to 54 Years | 160 (84.7%) | 0 (0.0%) |
| 55 to 59 Years | 0 (0.0%) | 0 (0.0%) |
| 60 to 64 Years | 52 (82.5%) | 0 (0.0%) |
| 65 to 74 Years | 0 (0.0%) | 0 (0.0%) |
| 75 Years and over | 0 (0.0%) | 0 (0.0%) |
| Total | 257 (62.4%) | 0 (0.0%) |
Employment Status by Educational Attainment in New Church
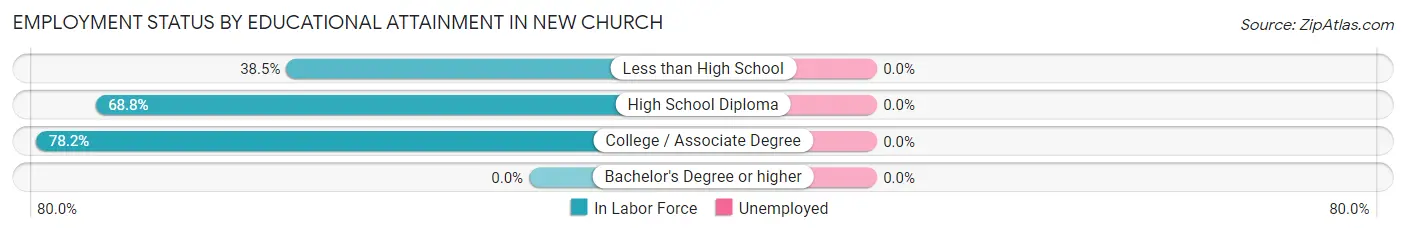
| Educational Attainment | In Labor Force | Unemployed |
| Less than High School | 15 (38.5%) | 0 (0.0%) |
| High School Diploma | 64 (68.8%) | 0 (0.0%) |
| College / Associate Degree | 133 (78.2%) | 0 (0.0%) |
| Bachelor's Degree or higher | 0 (0.0%) | 0 (0.0%) |
| Total | 212 (70.2%) | 0 (0.0%) |
Employment Occupations by Sex in New Church
Management, Business, Science and Arts Occupations
The most common Management, Business, Science and Arts occupations in New Church are , and Management (52 | 20.2%).
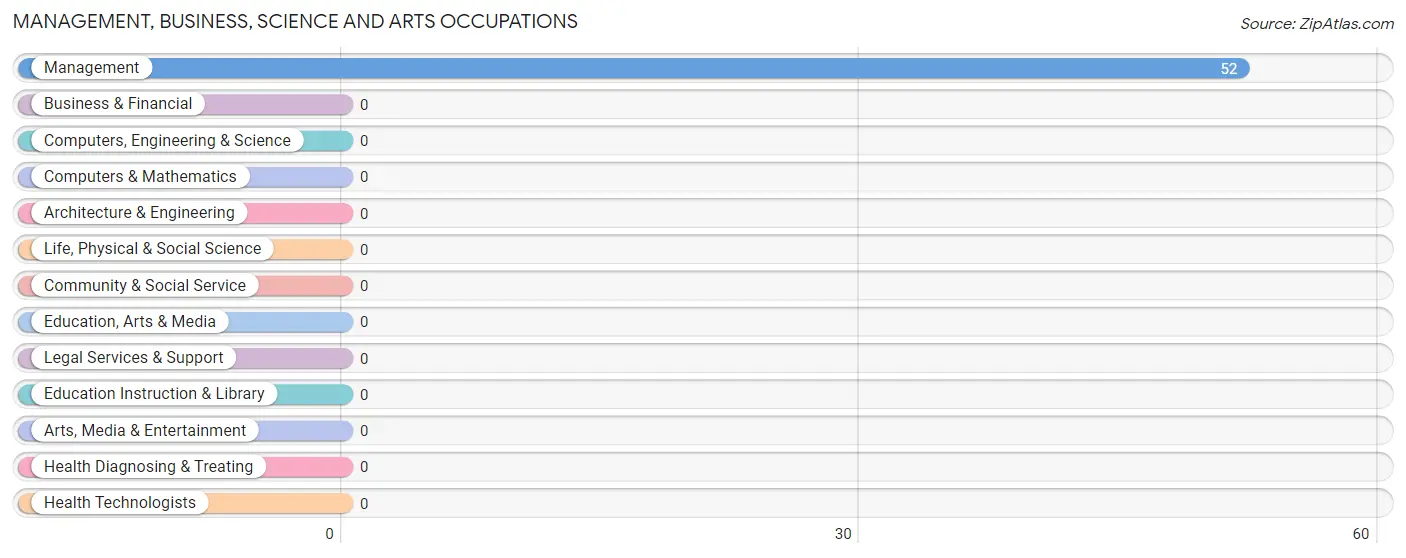
Management, Business, Science and Arts Occupations by Sex
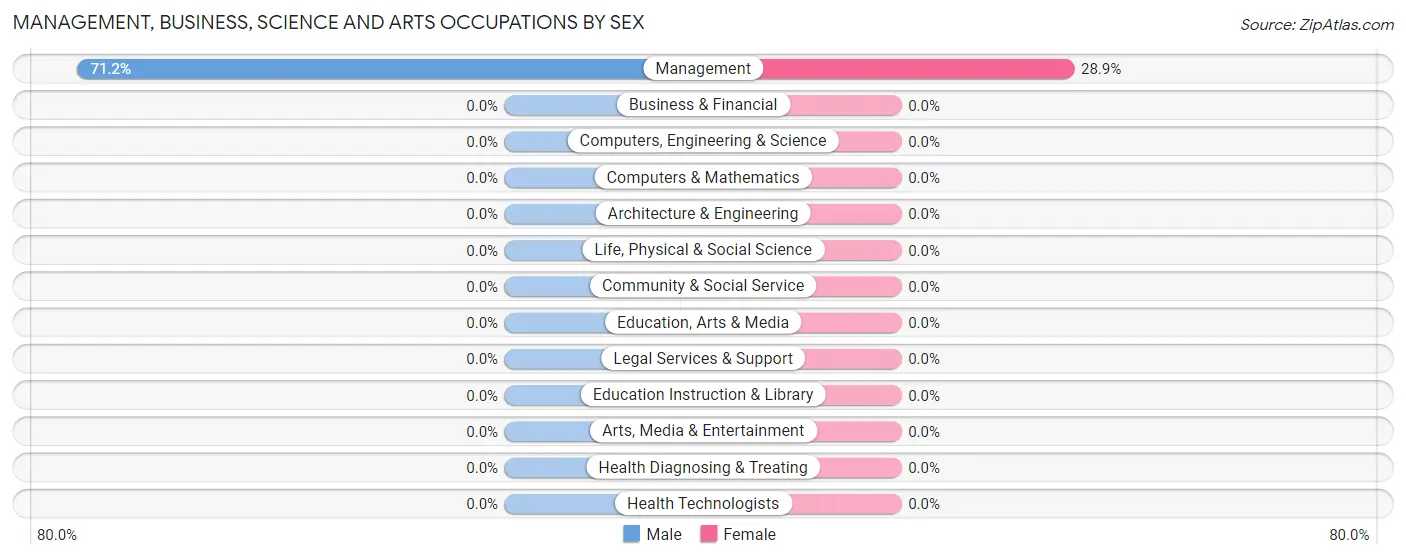
| Occupation | Male | Female |
| Management | 37 (71.2%) | 15 (28.8%) |
| Business & Financial | 0 (0.0%) | 0 (0.0%) |
| Computers, Engineering & Science | 0 (0.0%) | 0 (0.0%) |
| Computers & Mathematics | 0 (0.0%) | 0 (0.0%) |
| Architecture & Engineering | 0 (0.0%) | 0 (0.0%) |
| Life, Physical & Social Science | 0 (0.0%) | 0 (0.0%) |
| Community & Social Service | 0 (0.0%) | 0 (0.0%) |
| Education, Arts & Media | 0 (0.0%) | 0 (0.0%) |
| Legal Services & Support | 0 (0.0%) | 0 (0.0%) |
| Education Instruction & Library | 0 (0.0%) | 0 (0.0%) |
| Arts, Media & Entertainment | 0 (0.0%) | 0 (0.0%) |
| Health Diagnosing & Treating | 0 (0.0%) | 0 (0.0%) |
| Health Technologists | 0 (0.0%) | 0 (0.0%) |
| Total (Category) | 37 (71.2%) | 15 (28.8%) |
| Total (Overall) | 101 (39.3%) | 156 (60.7%) |
Services Occupations
The most common Services occupations in New Church are , and Food Preparation & Serving (96 | 37.3%).
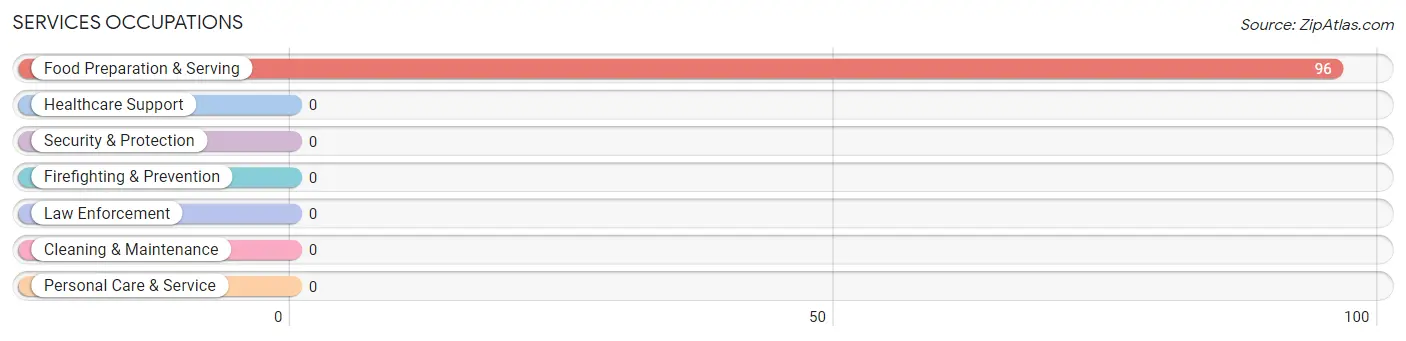
Services Occupations by Sex
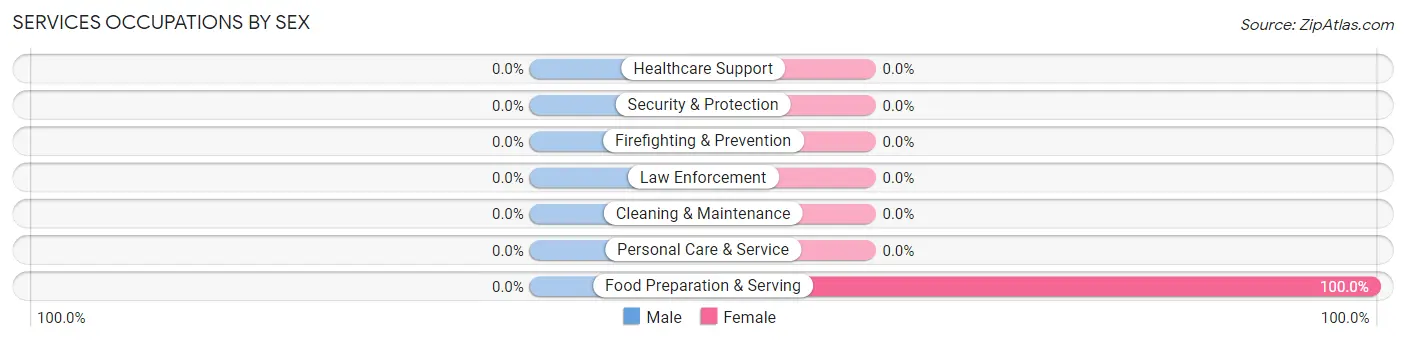
| Occupation | Male | Female |
| Healthcare Support | 0 (0.0%) | 0 (0.0%) |
| Security & Protection | 0 (0.0%) | 0 (0.0%) |
| Firefighting & Prevention | 0 (0.0%) | 0 (0.0%) |
| Law Enforcement | 0 (0.0%) | 0 (0.0%) |
| Food Preparation & Serving | 0 (0.0%) | 96 (100.0%) |
| Cleaning & Maintenance | 0 (0.0%) | 0 (0.0%) |
| Personal Care & Service | 0 (0.0%) | 0 (0.0%) |
| Total (Category) | 0 (0.0%) | 96 (100.0%) |
| Total (Overall) | 101 (39.3%) | 156 (60.7%) |
Sales and Office Occupations
The most common Sales and Office occupations in New Church are , and Sales & Related (45 | 17.5%).
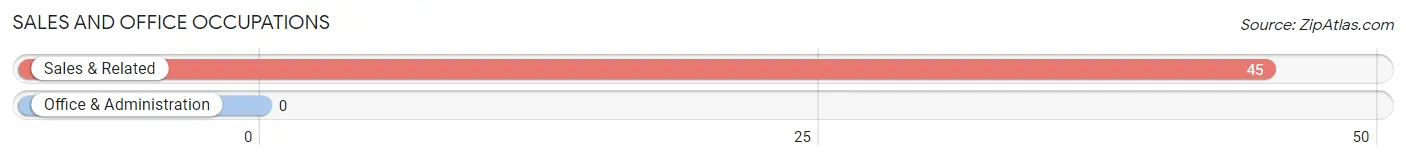
Sales and Office Occupations by Sex
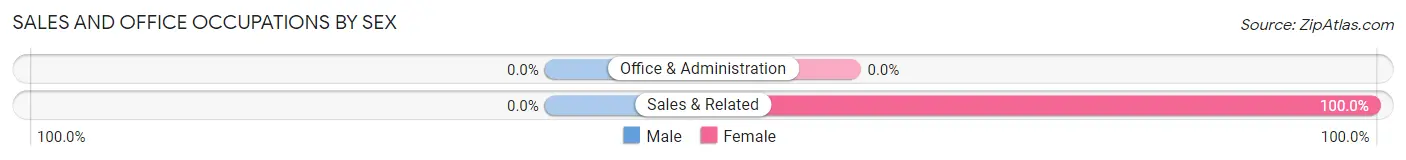
| Occupation | Male | Female |
| Sales & Related | 0 (0.0%) | 45 (100.0%) |
| Office & Administration | 0 (0.0%) | 0 (0.0%) |
| Total (Category) | 0 (0.0%) | 45 (100.0%) |
| Total (Overall) | 101 (39.3%) | 156 (60.7%) |
Natural Resources, Construction and Maintenance Occupations
The most common Natural Resources, Construction and Maintenance occupations in New Church are , and Construction & Extraction (64 | 24.9%).
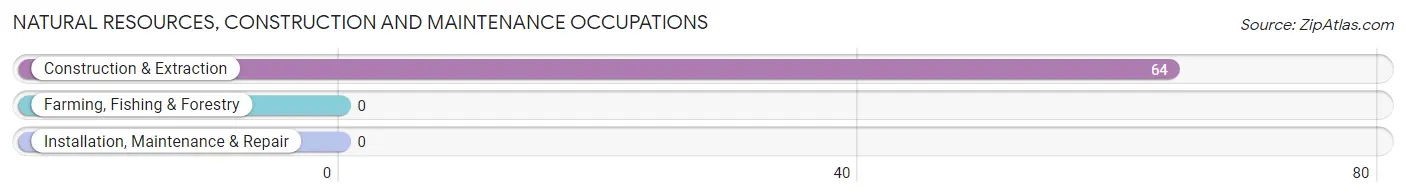
Natural Resources, Construction and Maintenance Occupations by Sex

| Occupation | Male | Female |
| Farming, Fishing & Forestry | 0 (0.0%) | 0 (0.0%) |
| Construction & Extraction | 64 (100.0%) | 0 (0.0%) |
| Installation, Maintenance & Repair | 0 (0.0%) | 0 (0.0%) |
| Total (Category) | 64 (100.0%) | 0 (0.0%) |
| Total (Overall) | 101 (39.3%) | 156 (60.7%) |
Production, Transportation and Moving Occupations
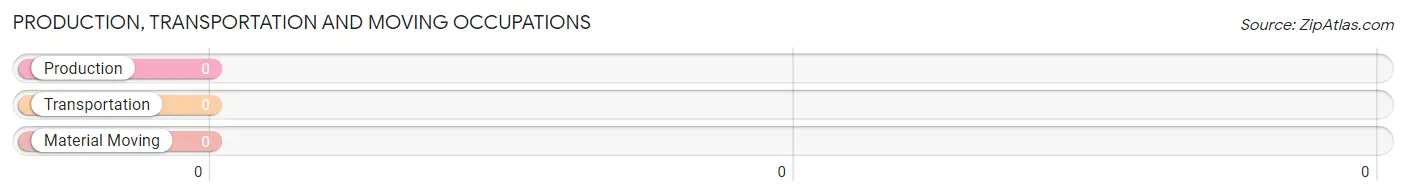
Production, Transportation and Moving Occupations by Sex
| Occupation | Male | Female |
| Production | 0 (0.0%) | 0 (0.0%) |
| Transportation | 0 (0.0%) | 0 (0.0%) |
| Material Moving | 0 (0.0%) | 0 (0.0%) |
| Total (Category) | 0 (0.0%) | 0 (0.0%) |
| Total (Overall) | 101 (39.3%) | 156 (60.7%) |
Employment Industries by Sex in New Church
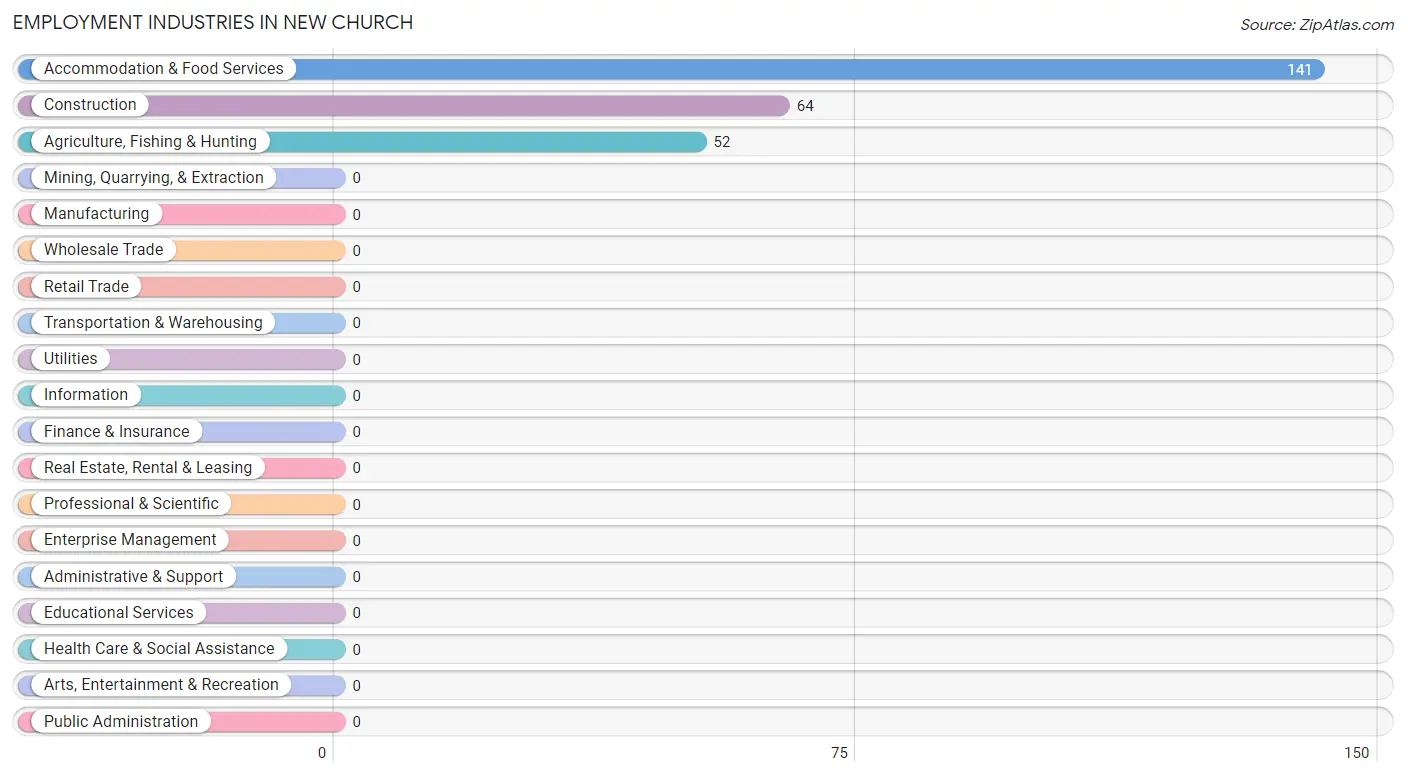
Employment Industries in New Church
The major employment industries in New Church include Accommodation & Food Services (141 | 54.9%), Construction (64 | 24.9%), and Agriculture, Fishing & Hunting (52 | 20.2%).
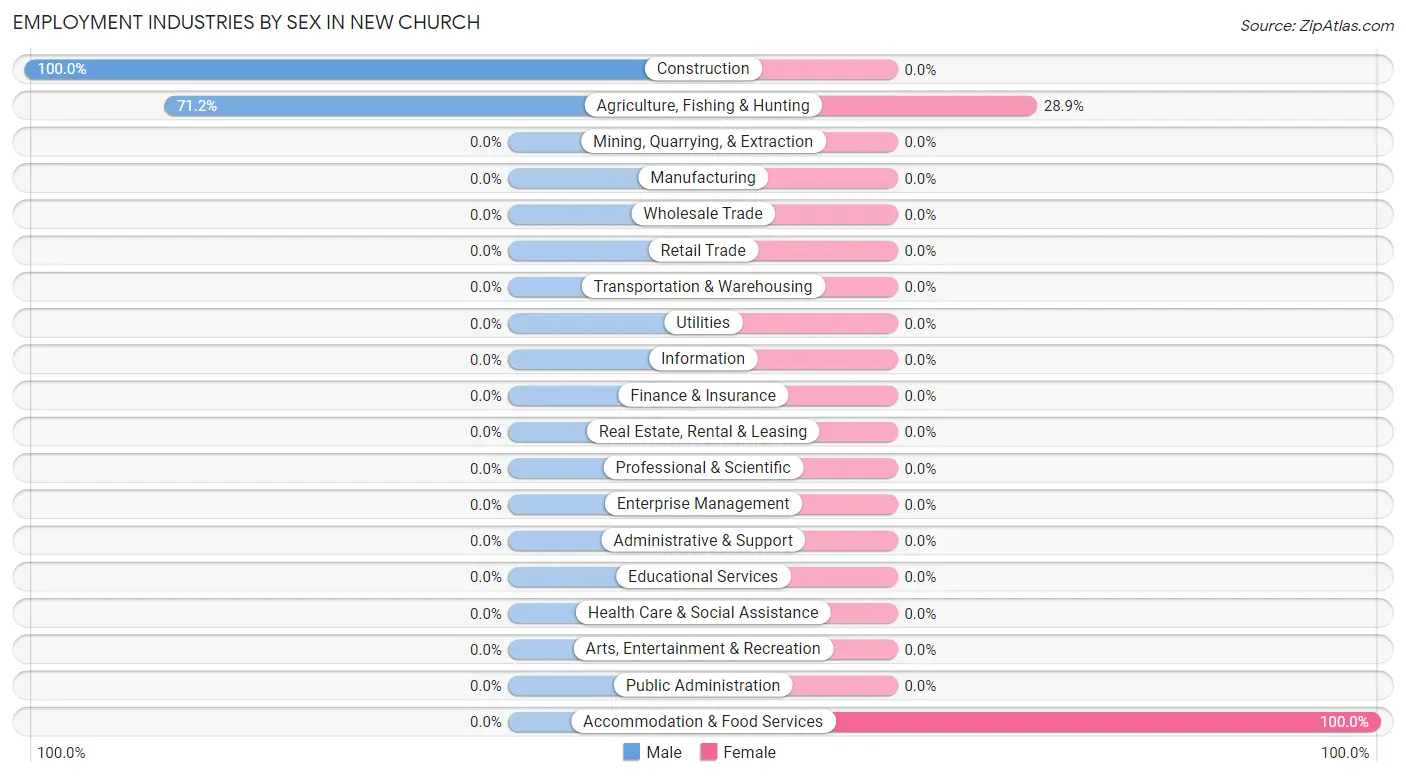
Employment Industries by Sex in New Church
The New Church industries that see more men than women are Construction (100.0%), and Agriculture, Fishing & Hunting (71.2%), whereas the industries that tend to have a higher number of women are Accommodation & Food Services (100.0%), and Agriculture, Fishing & Hunting (28.8%).
| Industry | Male | Female |
| Agriculture, Fishing & Hunting | 37 (71.2%) | 15 (28.8%) |
| Mining, Quarrying, & Extraction | 0 (0.0%) | 0 (0.0%) |
| Construction | 64 (100.0%) | 0 (0.0%) |
| Manufacturing | 0 (0.0%) | 0 (0.0%) |
| Wholesale Trade | 0 (0.0%) | 0 (0.0%) |
| Retail Trade | 0 (0.0%) | 0 (0.0%) |
| Transportation & Warehousing | 0 (0.0%) | 0 (0.0%) |
| Utilities | 0 (0.0%) | 0 (0.0%) |
| Information | 0 (0.0%) | 0 (0.0%) |
| Finance & Insurance | 0 (0.0%) | 0 (0.0%) |
| Real Estate, Rental & Leasing | 0 (0.0%) | 0 (0.0%) |
| Professional & Scientific | 0 (0.0%) | 0 (0.0%) |
| Enterprise Management | 0 (0.0%) | 0 (0.0%) |
| Administrative & Support | 0 (0.0%) | 0 (0.0%) |
| Educational Services | 0 (0.0%) | 0 (0.0%) |
| Health Care & Social Assistance | 0 (0.0%) | 0 (0.0%) |
| Arts, Entertainment & Recreation | 0 (0.0%) | 0 (0.0%) |
| Accommodation & Food Services | 0 (0.0%) | 141 (100.0%) |
| Public Administration | 0 (0.0%) | 0 (0.0%) |
| Total | 101 (39.3%) | 156 (60.7%) |
Education in New Church
School Enrollment in New Church
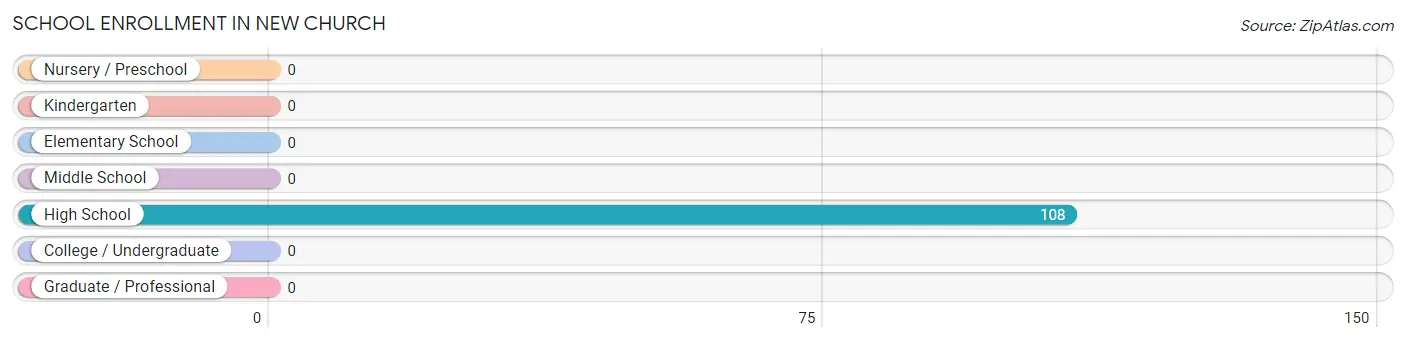
| School Level | # Students | % Students |
| Nursery / Preschool | 0 | 0.0% |
| Kindergarten | 0 | 0.0% |
| Elementary School | 0 | 0.0% |
| Middle School | 0 | 0.0% |
| High School | 108 | 100.0% |
| College / Undergraduate | 0 | 0.0% |
| Graduate / Professional | 0 | 0.0% |
| Total | 108 | 100.0% |
School Enrollment by Age by Funding Source in New Church
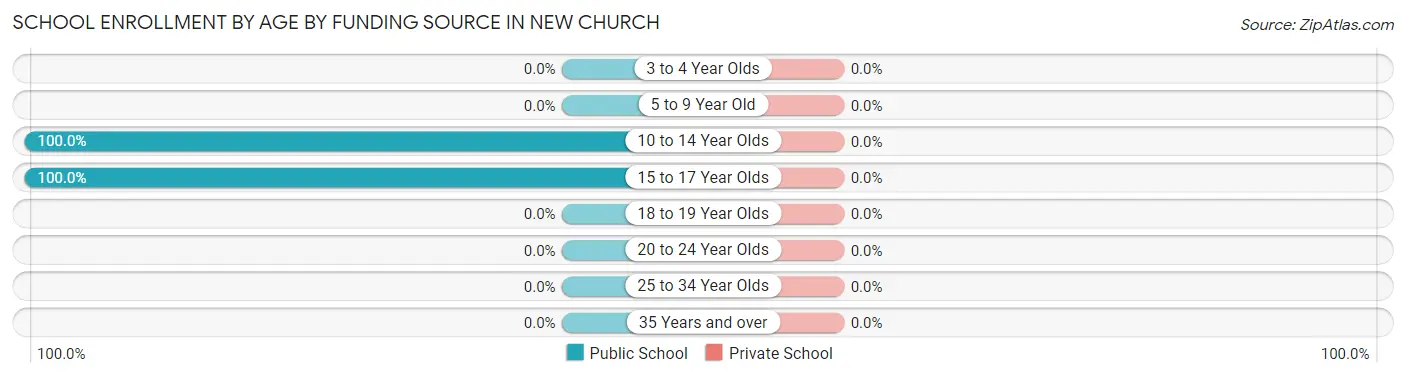
| Age Bracket | Public School | Private School |
| 3 to 4 Year Olds | 0 (0.0%) | 0 (0.0%) |
| 5 to 9 Year Old | 0 (0.0%) | 0 (0.0%) |
| 10 to 14 Year Olds | 63 (100.0%) | 0 (0.0%) |
| 15 to 17 Year Olds | 45 (100.0%) | 0 (0.0%) |
| 18 to 19 Year Olds | 0 (0.0%) | 0 (0.0%) |
| 20 to 24 Year Olds | 0 (0.0%) | 0 (0.0%) |
| 25 to 34 Year Olds | 0 (0.0%) | 0 (0.0%) |
| 35 Years and over | 0 (0.0%) | 0 (0.0%) |
| Total | 108 (100.0%) | 0 (0.0%) |
Educational Attainment by Field of Study in New Church
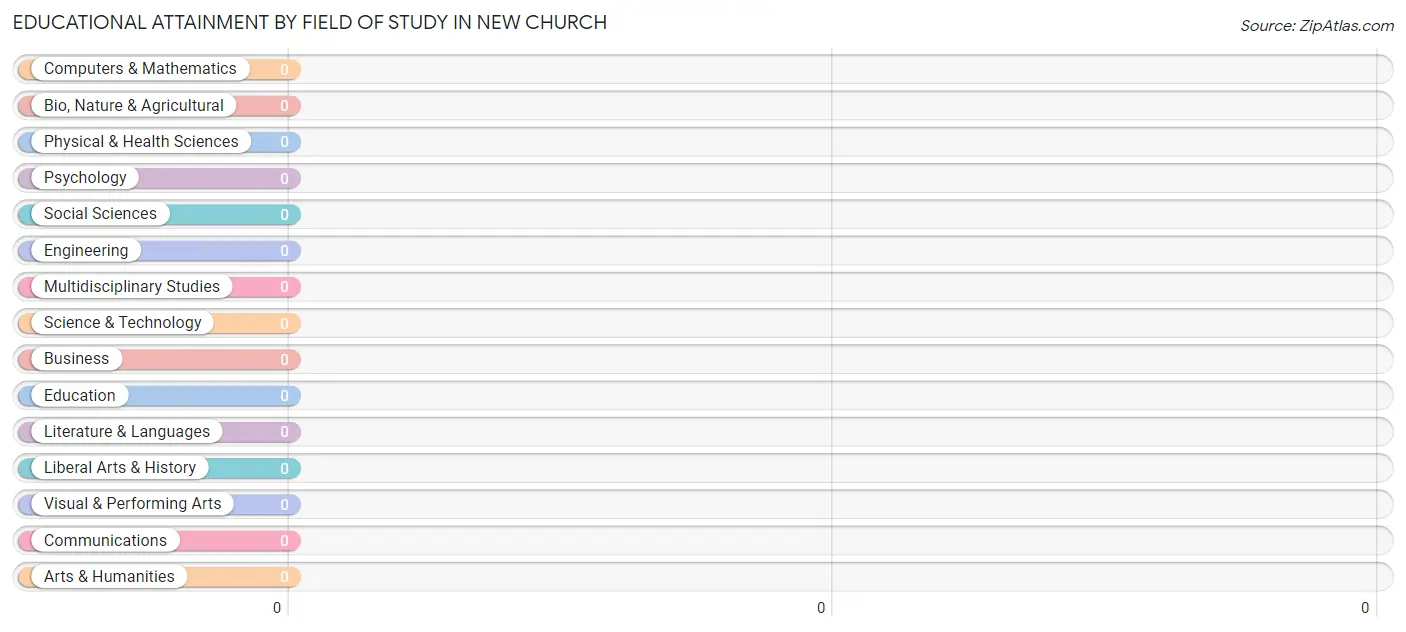
| Field of Study | # Graduates | % Graduates |
| Computers & Mathematics | 0 | 0.0% |
| Bio, Nature & Agricultural | 0 | 0.0% |
| Physical & Health Sciences | 0 | 0.0% |
| Psychology | 0 | 0.0% |
| Social Sciences | 0 | 0.0% |
| Engineering | 0 | 0.0% |
| Multidisciplinary Studies | 0 | 0.0% |
| Science & Technology | 0 | 0.0% |
| Business | 0 | 0.0% |
| Education | 0 | 0.0% |
| Literature & Languages | 0 | 0.0% |
| Liberal Arts & History | 0 | 0.0% |
| Visual & Performing Arts | 0 | 0.0% |
| Communications | 0 | 0.0% |
| Arts & Humanities | 0 | 0.0% |
| Total | 0 | 0.0% |
Transportation & Commute in New Church
Vehicle Availability by Sex in New Church
The most prevalent vehicle ownership categories in New Church are males with 3 vehicles (101, accounting for 100.0%) and females with 3 vehicles (156, making up 64.7%).
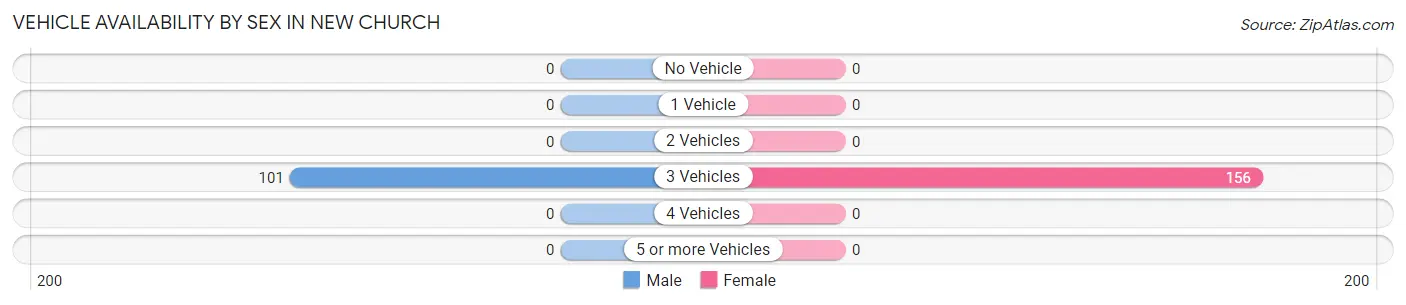
| Vehicles Available | Male | Female |
| No Vehicle | 0 (0.0%) | 0 (0.0%) |
| 1 Vehicle | 0 (0.0%) | 0 (0.0%) |
| 2 Vehicles | 0 (0.0%) | 0 (0.0%) |
| 3 Vehicles | 101 (100.0%) | 156 (100.0%) |
| 4 Vehicles | 0 (0.0%) | 0 (0.0%) |
| 5 or more Vehicles | 0 (0.0%) | 0 (0.0%) |
| Total | 101 (100.0%) | 156 (100.0%) |
Commute Time in New Church
The most frequently occuring commute durations in New Church are 15 to 19 minutes (64 commuters, 58.7%), 20 to 24 minutes (45 commuters, 41.3%), and less than 5 minutes (0 commuters, 0.0%).
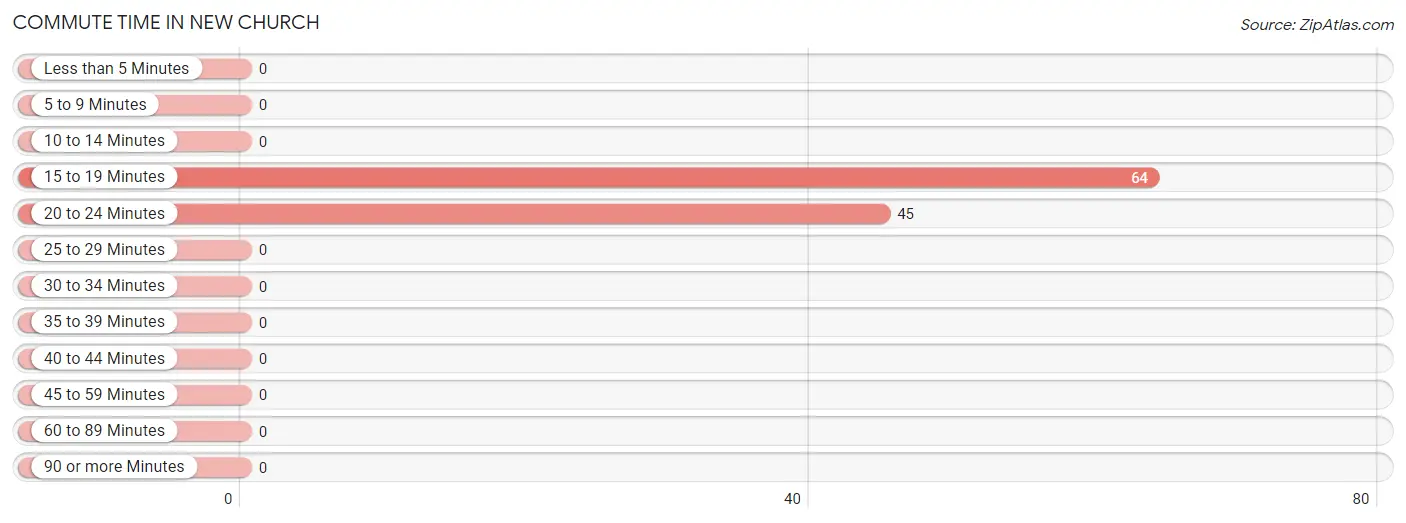
| Commute Time | # Commuters | % Commuters |
| Less than 5 Minutes | 0 | 0.0% |
| 5 to 9 Minutes | 0 | 0.0% |
| 10 to 14 Minutes | 0 | 0.0% |
| 15 to 19 Minutes | 64 | 58.7% |
| 20 to 24 Minutes | 45 | 41.3% |
| 25 to 29 Minutes | 0 | 0.0% |
| 30 to 34 Minutes | 0 | 0.0% |
| 35 to 39 Minutes | 0 | 0.0% |
| 40 to 44 Minutes | 0 | 0.0% |
| 45 to 59 Minutes | 0 | 0.0% |
| 60 to 89 Minutes | 0 | 0.0% |
| 90 or more Minutes | 0 | 0.0% |
Commute Time by Sex in New Church
The most common commute times in New Church are 15 to 19 minutes (64 commuters, 100.0%) for males and 20 to 24 minutes (45 commuters, 100.0%) for females.
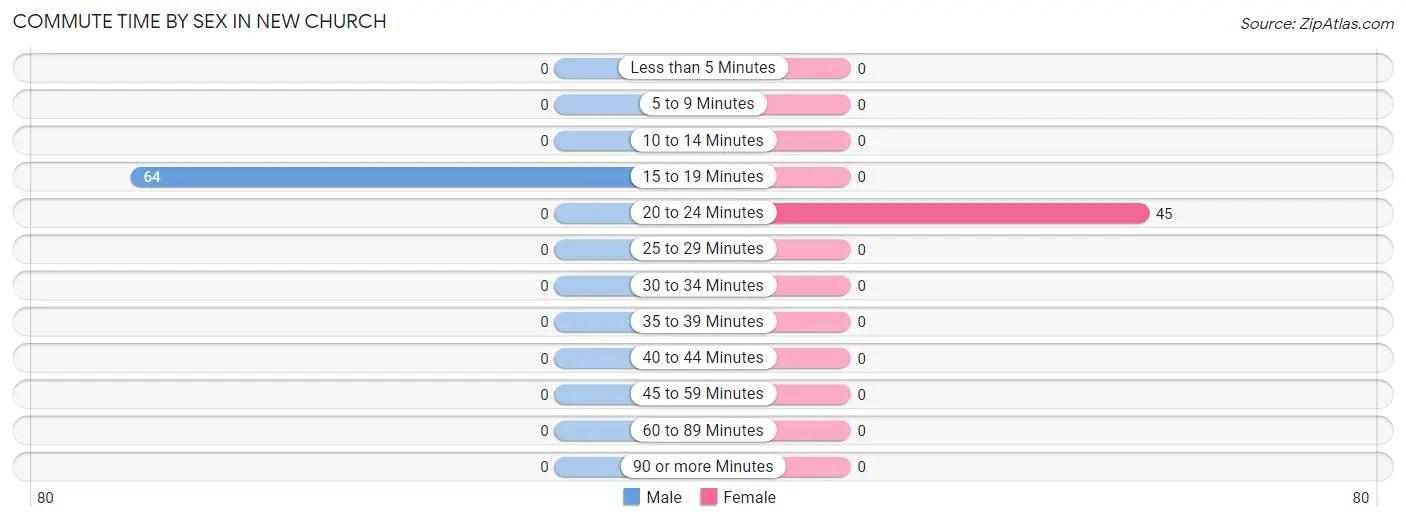
| Commute Time | Male | Female |
| Less than 5 Minutes | 0 (0.0%) | 0 (0.0%) |
| 5 to 9 Minutes | 0 (0.0%) | 0 (0.0%) |
| 10 to 14 Minutes | 0 (0.0%) | 0 (0.0%) |
| 15 to 19 Minutes | 64 (100.0%) | 0 (0.0%) |
| 20 to 24 Minutes | 0 (0.0%) | 45 (100.0%) |
| 25 to 29 Minutes | 0 (0.0%) | 0 (0.0%) |
| 30 to 34 Minutes | 0 (0.0%) | 0 (0.0%) |
| 35 to 39 Minutes | 0 (0.0%) | 0 (0.0%) |
| 40 to 44 Minutes | 0 (0.0%) | 0 (0.0%) |
| 45 to 59 Minutes | 0 (0.0%) | 0 (0.0%) |
| 60 to 89 Minutes | 0 (0.0%) | 0 (0.0%) |
| 90 or more Minutes | 0 (0.0%) | 0 (0.0%) |
Time of Departure to Work by Sex in New Church
The most frequent times of departure to work in New Church are 12:00 PM to 3:59 PM (64, 100.0%) for males and 8:30 AM to 8:59 AM (45, 100.0%) for females.
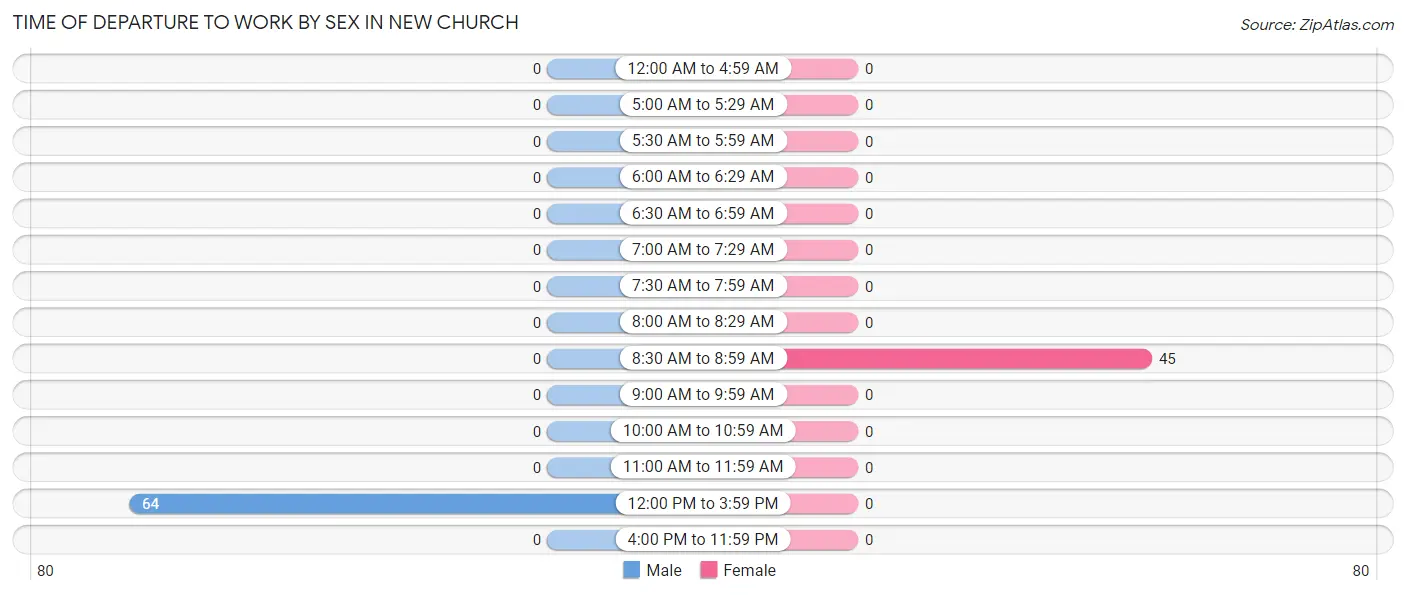
| Time of Departure | Male | Female |
| 12:00 AM to 4:59 AM | 0 (0.0%) | 0 (0.0%) |
| 5:00 AM to 5:29 AM | 0 (0.0%) | 0 (0.0%) |
| 5:30 AM to 5:59 AM | 0 (0.0%) | 0 (0.0%) |
| 6:00 AM to 6:29 AM | 0 (0.0%) | 0 (0.0%) |
| 6:30 AM to 6:59 AM | 0 (0.0%) | 0 (0.0%) |
| 7:00 AM to 7:29 AM | 0 (0.0%) | 0 (0.0%) |
| 7:30 AM to 7:59 AM | 0 (0.0%) | 0 (0.0%) |
| 8:00 AM to 8:29 AM | 0 (0.0%) | 0 (0.0%) |
| 8:30 AM to 8:59 AM | 0 (0.0%) | 45 (100.0%) |
| 9:00 AM to 9:59 AM | 0 (0.0%) | 0 (0.0%) |
| 10:00 AM to 10:59 AM | 0 (0.0%) | 0 (0.0%) |
| 11:00 AM to 11:59 AM | 0 (0.0%) | 0 (0.0%) |
| 12:00 PM to 3:59 PM | 64 (100.0%) | 0 (0.0%) |
| 4:00 PM to 11:59 PM | 0 (0.0%) | 0 (0.0%) |
| Total | 64 (100.0%) | 45 (100.0%) |
Housing Occupancy in New Church
Occupancy by Ownership in New Church
Of the total 202 dwellings in New Church, owner-occupied units account for 157 (77.7%), while renter-occupied units make up 45 (22.3%).
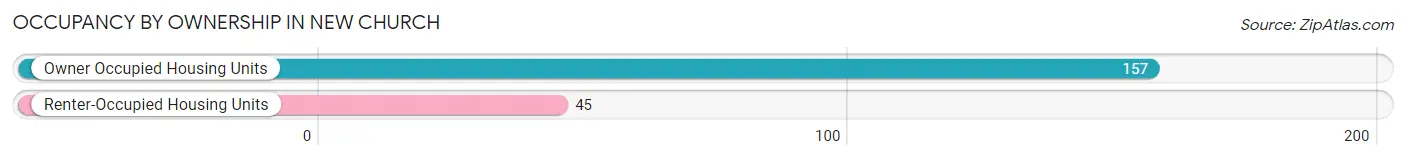
| Occupancy | # Housing Units | % Housing Units |
| Owner Occupied Housing Units | 157 | 77.7% |
| Renter-Occupied Housing Units | 45 | 22.3% |
| Total Occupied Housing Units | 202 | 100.0% |
Occupancy by Household Size in New Church
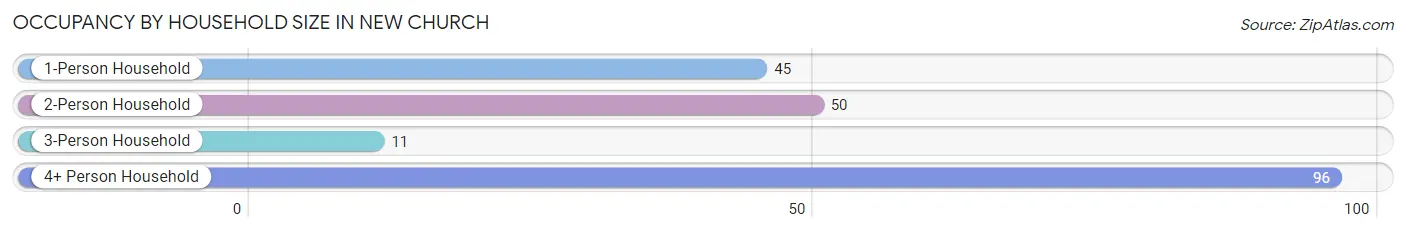
| Household Size | # Housing Units | % Housing Units |
| 1-Person Household | 45 | 22.3% |
| 2-Person Household | 50 | 24.7% |
| 3-Person Household | 11 | 5.4% |
| 4+ Person Household | 96 | 47.5% |
| Total Housing Units | 202 | 100.0% |
Occupancy by Ownership by Household Size in New Church
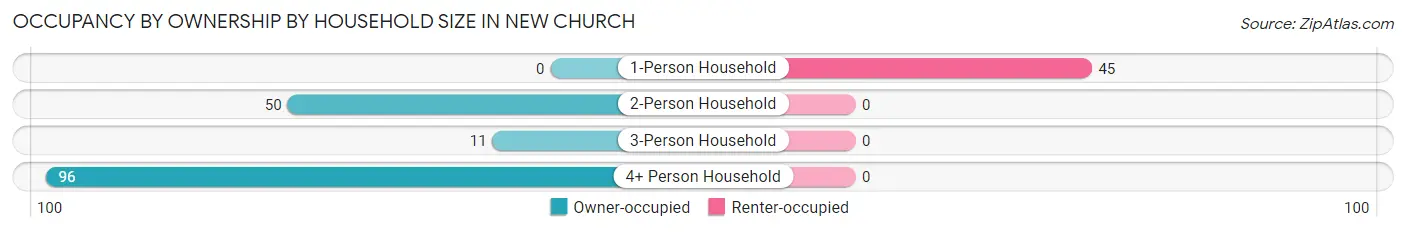
| Household Size | Owner-occupied | Renter-occupied |
| 1-Person Household | 0 (0.0%) | 45 (100.0%) |
| 2-Person Household | 50 (100.0%) | 0 (0.0%) |
| 3-Person Household | 11 (100.0%) | 0 (0.0%) |
| 4+ Person Household | 96 (100.0%) | 0 (0.0%) |
| Total Housing Units | 157 (77.7%) | 45 (22.3%) |
Occupancy by Educational Attainment in New Church
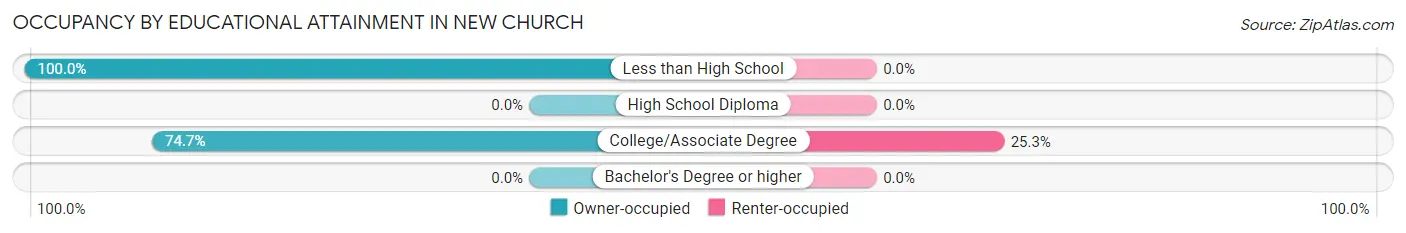
| Household Size | Owner-occupied | Renter-occupied |
| Less than High School | 24 (100.0%) | 0 (0.0%) |
| High School Diploma | 0 (0.0%) | 0 (0.0%) |
| College/Associate Degree | 133 (74.7%) | 45 (25.3%) |
| Bachelor's Degree or higher | 0 (0.0%) | 0 (0.0%) |
Occupancy by Age of Householder in New Church
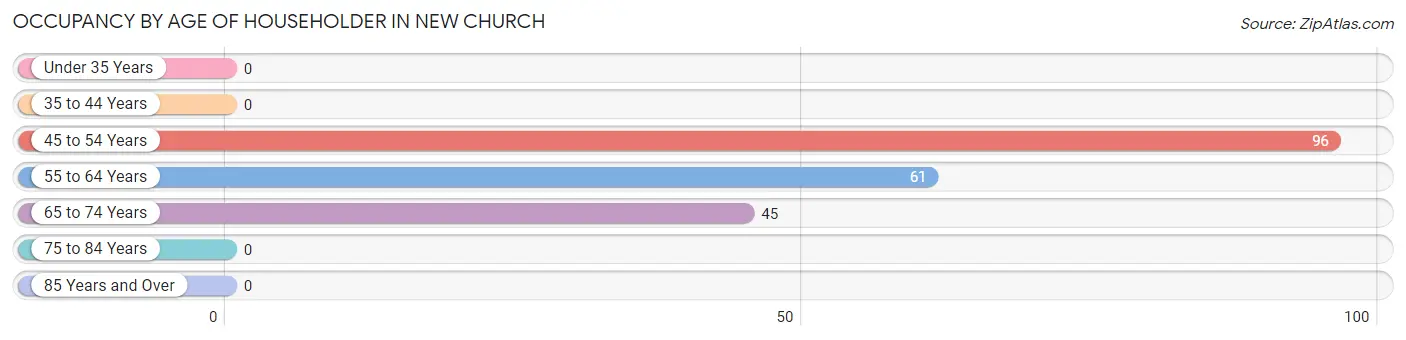
| Age Bracket | # Households | % Households |
| Under 35 Years | 0 | 0.0% |
| 35 to 44 Years | 0 | 0.0% |
| 45 to 54 Years | 96 | 47.5% |
| 55 to 64 Years | 61 | 30.2% |
| 65 to 74 Years | 45 | 22.3% |
| 75 to 84 Years | 0 | 0.0% |
| 85 Years and Over | 0 | 0.0% |
| Total | 202 | 100.0% |
Housing Finances in New Church
Median Income by Occupancy in New Church
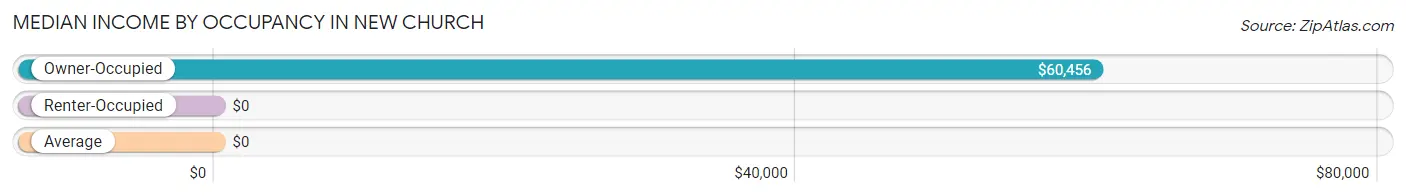
| Occupancy Type | # Households | Median Income |
| Owner-Occupied | 157 (77.7%) | $60,456 |
| Renter-Occupied | 45 (22.3%) | $0 |
| Average | 202 (100.0%) | $0 |
Occupancy by Householder Income Bracket in New Church
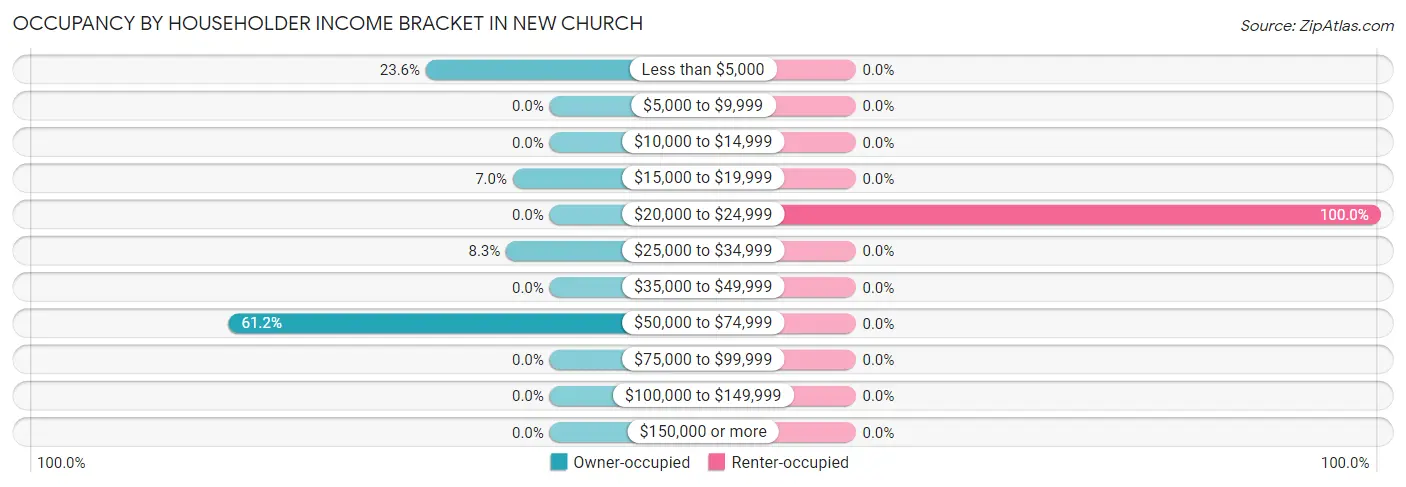
| Income Bracket | Owner-occupied | Renter-occupied |
| Less than $5,000 | 37 (23.6%) | 0 (0.0%) |
| $5,000 to $9,999 | 0 (0.0%) | 0 (0.0%) |
| $10,000 to $14,999 | 0 (0.0%) | 0 (0.0%) |
| $15,000 to $19,999 | 11 (7.0%) | 0 (0.0%) |
| $20,000 to $24,999 | 0 (0.0%) | 45 (100.0%) |
| $25,000 to $34,999 | 13 (8.3%) | 0 (0.0%) |
| $35,000 to $49,999 | 0 (0.0%) | 0 (0.0%) |
| $50,000 to $74,999 | 96 (61.2%) | 0 (0.0%) |
| $75,000 to $99,999 | 0 (0.0%) | 0 (0.0%) |
| $100,000 to $149,999 | 0 (0.0%) | 0 (0.0%) |
| $150,000 or more | 0 (0.0%) | 0 (0.0%) |
| Total | 157 (100.0%) | 45 (100.0%) |
Monthly Housing Cost Tiers in New Church
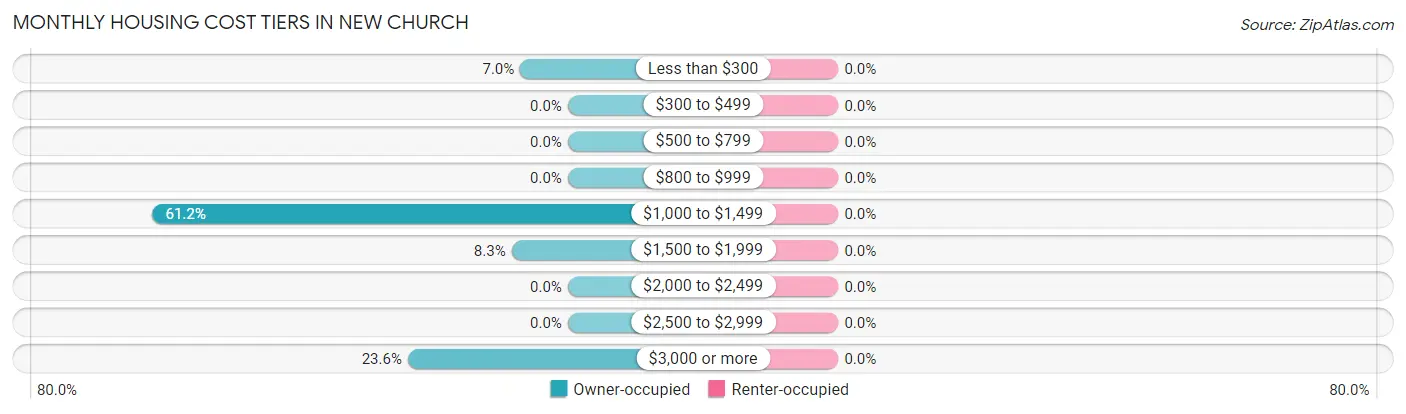
| Monthly Cost | Owner-occupied | Renter-occupied |
| Less than $300 | 11 (7.0%) | 0 (0.0%) |
| $300 to $499 | 0 (0.0%) | 0 (0.0%) |
| $500 to $799 | 0 (0.0%) | 0 (0.0%) |
| $800 to $999 | 0 (0.0%) | 0 (0.0%) |
| $1,000 to $1,499 | 96 (61.2%) | 0 (0.0%) |
| $1,500 to $1,999 | 13 (8.3%) | 0 (0.0%) |
| $2,000 to $2,499 | 0 (0.0%) | 0 (0.0%) |
| $2,500 to $2,999 | 0 (0.0%) | 0 (0.0%) |
| $3,000 or more | 37 (23.6%) | 0 (0.0%) |
| Total | 157 (100.0%) | 45 (100.0%) |
Physical Housing Characteristics in New Church
Housing Structures in New Church
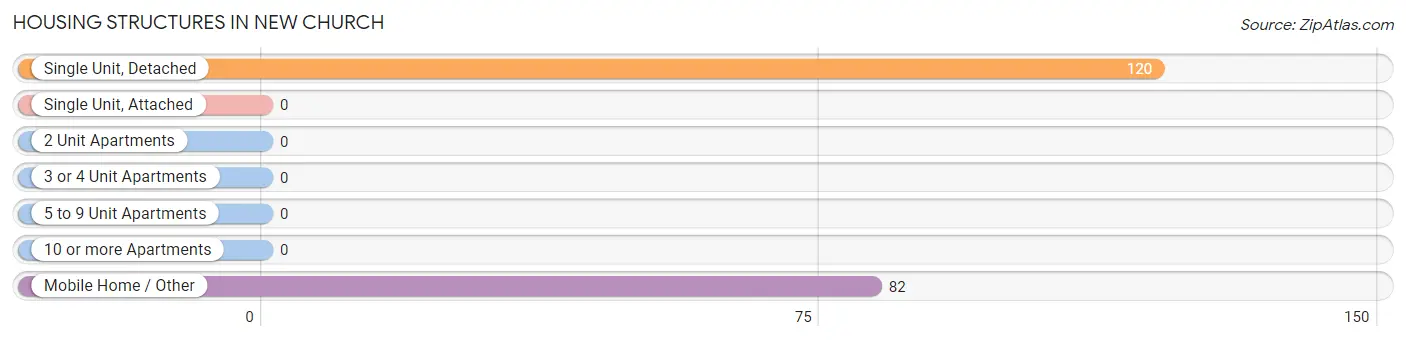
| Structure Type | # Housing Units | % Housing Units |
| Single Unit, Detached | 120 | 59.4% |
| Single Unit, Attached | 0 | 0.0% |
| 2 Unit Apartments | 0 | 0.0% |
| 3 or 4 Unit Apartments | 0 | 0.0% |
| 5 to 9 Unit Apartments | 0 | 0.0% |
| 10 or more Apartments | 0 | 0.0% |
| Mobile Home / Other | 82 | 40.6% |
| Total | 202 | 100.0% |
Housing Structures by Occupancy in New Church
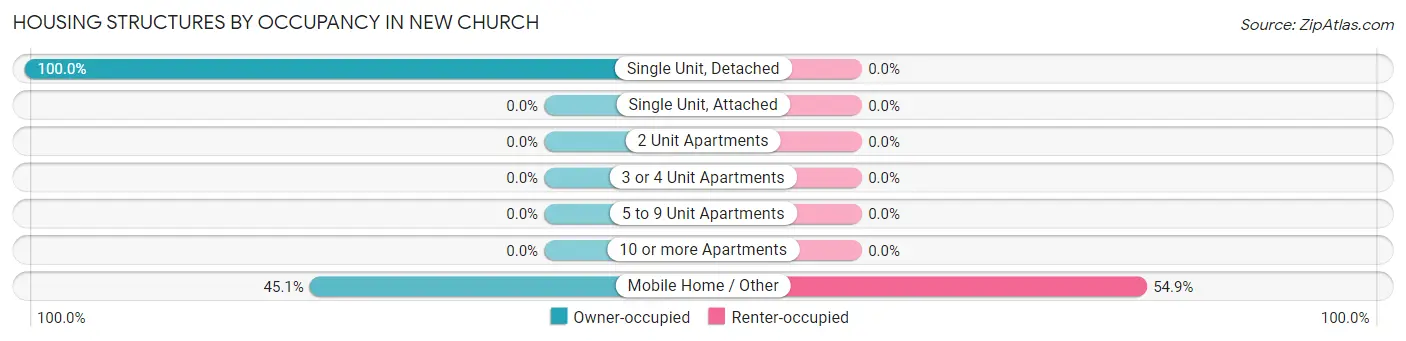
| Structure Type | Owner-occupied | Renter-occupied |
| Single Unit, Detached | 120 (100.0%) | 0 (0.0%) |
| Single Unit, Attached | 0 (0.0%) | 0 (0.0%) |
| 2 Unit Apartments | 0 (0.0%) | 0 (0.0%) |
| 3 or 4 Unit Apartments | 0 (0.0%) | 0 (0.0%) |
| 5 to 9 Unit Apartments | 0 (0.0%) | 0 (0.0%) |
| 10 or more Apartments | 0 (0.0%) | 0 (0.0%) |
| Mobile Home / Other | 37 (45.1%) | 45 (54.9%) |
| Total | 157 (77.7%) | 45 (22.3%) |
Housing Structures by Number of Rooms in New Church
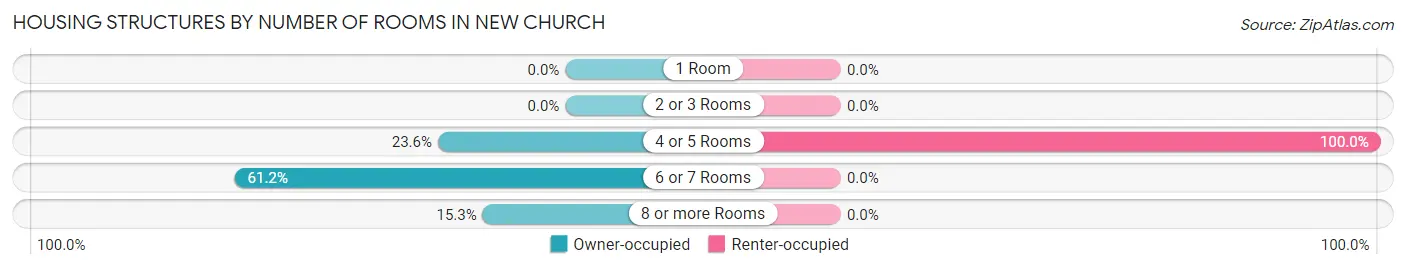
| Number of Rooms | Owner-occupied | Renter-occupied |
| 1 Room | 0 (0.0%) | 0 (0.0%) |
| 2 or 3 Rooms | 0 (0.0%) | 0 (0.0%) |
| 4 or 5 Rooms | 37 (23.6%) | 45 (100.0%) |
| 6 or 7 Rooms | 96 (61.2%) | 0 (0.0%) |
| 8 or more Rooms | 24 (15.3%) | 0 (0.0%) |
| Total | 157 (100.0%) | 45 (100.0%) |
Housing Structure by Heating Type in New Church
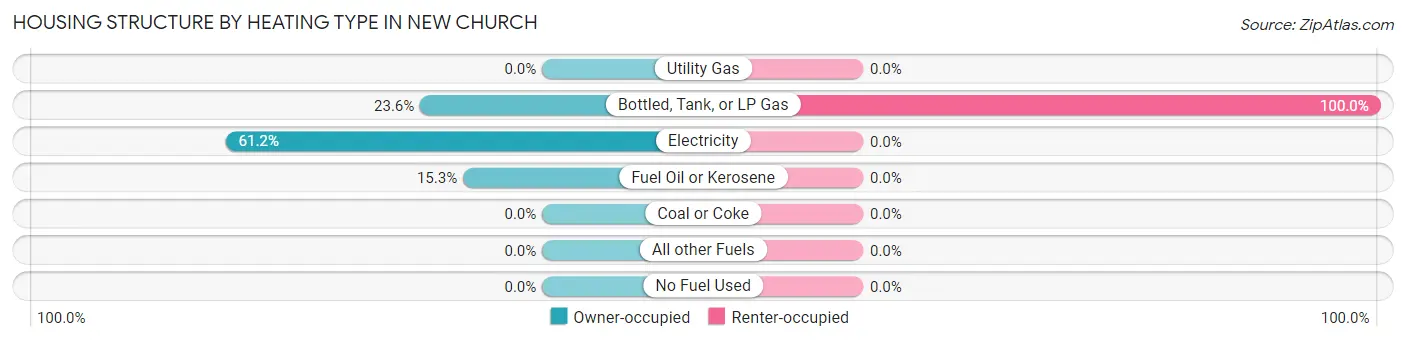
| Heating Type | Owner-occupied | Renter-occupied |
| Utility Gas | 0 (0.0%) | 0 (0.0%) |
| Bottled, Tank, or LP Gas | 37 (23.6%) | 45 (100.0%) |
| Electricity | 96 (61.2%) | 0 (0.0%) |
| Fuel Oil or Kerosene | 24 (15.3%) | 0 (0.0%) |
| Coal or Coke | 0 (0.0%) | 0 (0.0%) |
| All other Fuels | 0 (0.0%) | 0 (0.0%) |
| No Fuel Used | 0 (0.0%) | 0 (0.0%) |
| Total | 157 (100.0%) | 45 (100.0%) |
Household Vehicle Usage in New Church
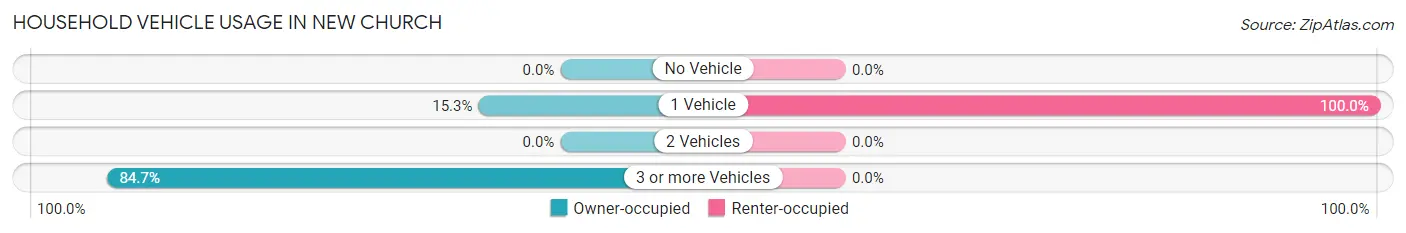
| Vehicles per Household | Owner-occupied | Renter-occupied |
| No Vehicle | 0 (0.0%) | 0 (0.0%) |
| 1 Vehicle | 24 (15.3%) | 45 (100.0%) |
| 2 Vehicles | 0 (0.0%) | 0 (0.0%) |
| 3 or more Vehicles | 133 (84.7%) | 0 (0.0%) |
| Total | 157 (100.0%) | 45 (100.0%) |
Real Estate & Mortgages in New Church
Real Estate and Mortgage Overview in New Church
| Characteristic | Without Mortgage | With Mortgage |
| Housing Units | 11 | 146 |
| Median Property Value | - | - |
| Median Household Income | - | - |
| Monthly Housing Costs | - | - |
| Real Estate Taxes | - | - |
Property Value by Mortgage Status in New Church
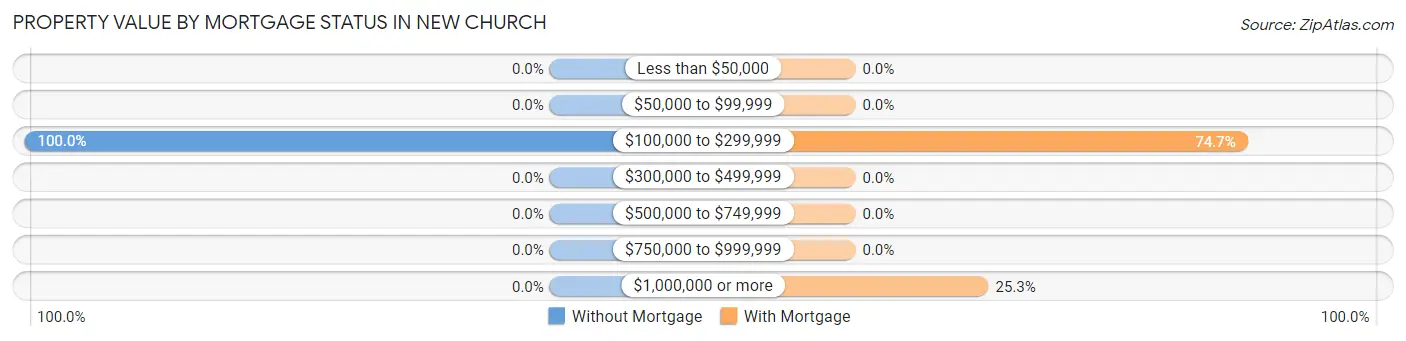
| Property Value | Without Mortgage | With Mortgage |
| Less than $50,000 | 0 (0.0%) | 0 (0.0%) |
| $50,000 to $99,999 | 0 (0.0%) | 0 (0.0%) |
| $100,000 to $299,999 | 11 (100.0%) | 109 (74.7%) |
| $300,000 to $499,999 | 0 (0.0%) | 0 (0.0%) |
| $500,000 to $749,999 | 0 (0.0%) | 0 (0.0%) |
| $750,000 to $999,999 | 0 (0.0%) | 0 (0.0%) |
| $1,000,000 or more | 0 (0.0%) | 37 (25.3%) |
| Total | 11 (100.0%) | 146 (100.0%) |
Household Income by Mortgage Status in New Church
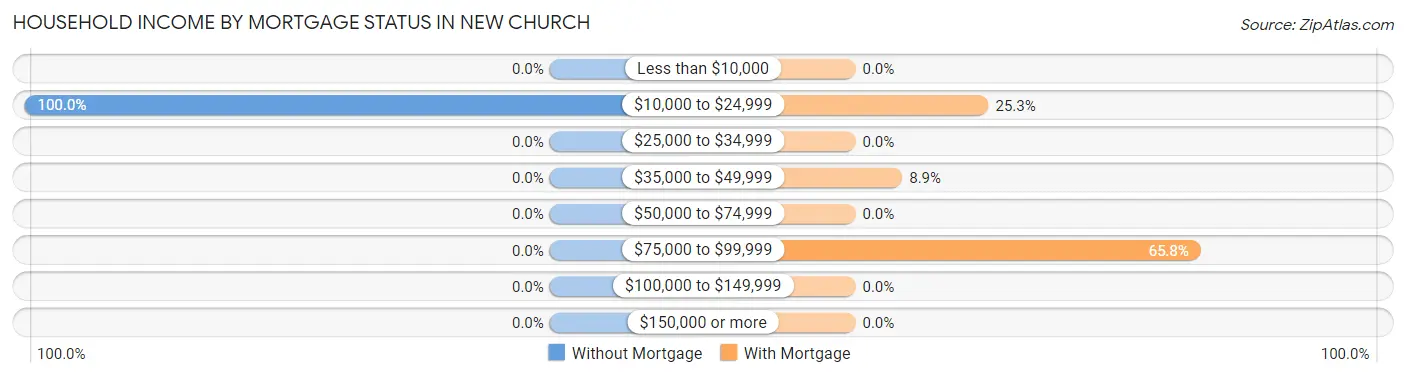
| Household Income | Without Mortgage | With Mortgage |
| Less than $10,000 | 0 (0.0%) | 0 (0.0%) |
| $10,000 to $24,999 | 11 (100.0%) | 37 (25.3%) |
| $25,000 to $34,999 | 0 (0.0%) | 0 (0.0%) |
| $35,000 to $49,999 | 0 (0.0%) | 13 (8.9%) |
| $50,000 to $74,999 | 0 (0.0%) | 0 (0.0%) |
| $75,000 to $99,999 | 0 (0.0%) | 96 (65.7%) |
| $100,000 to $149,999 | 0 (0.0%) | 0 (0.0%) |
| $150,000 or more | 0 (0.0%) | 0 (0.0%) |
| Total | 11 (100.0%) | 146 (100.0%) |
Property Value to Household Income Ratio in New Church
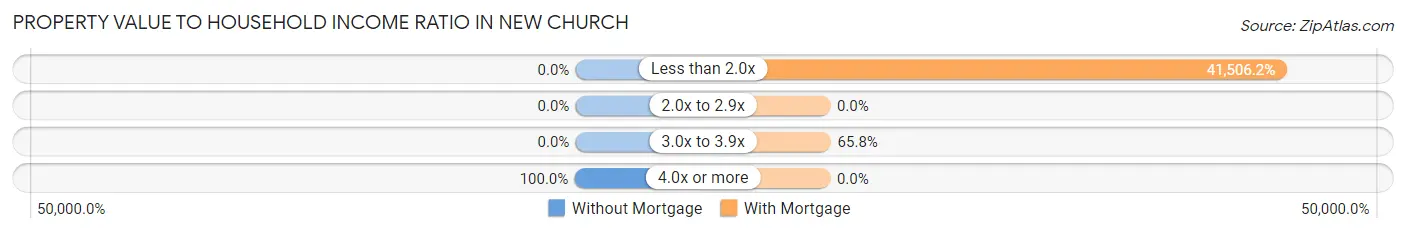
| Value-to-Income Ratio | Without Mortgage | With Mortgage |
| Less than 2.0x | 0 (0.0%) | 60,599 (41,506.2%) |
| 2.0x to 2.9x | 0 (0.0%) | 0 (0.0%) |
| 3.0x to 3.9x | 0 (0.0%) | 96 (65.7%) |
| 4.0x or more | 11 (100.0%) | 0 (0.0%) |
| Total | 11 (100.0%) | 146 (100.0%) |
Real Estate Taxes by Mortgage Status in New Church
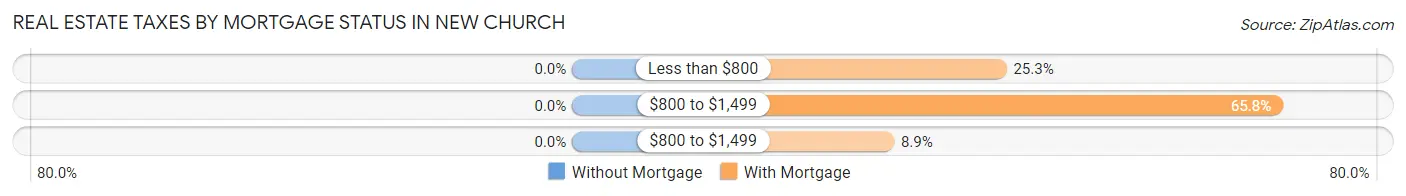
| Property Taxes | Without Mortgage | With Mortgage |
| Less than $800 | 0 (0.0%) | 37 (25.3%) |
| $800 to $1,499 | 0 (0.0%) | 96 (65.7%) |
| $800 to $1,499 | 0 (0.0%) | 13 (8.9%) |
| Total | 11 (100.0%) | 146 (100.0%) |
Health & Disability in New Church
Health Insurance Coverage by Age in New Church
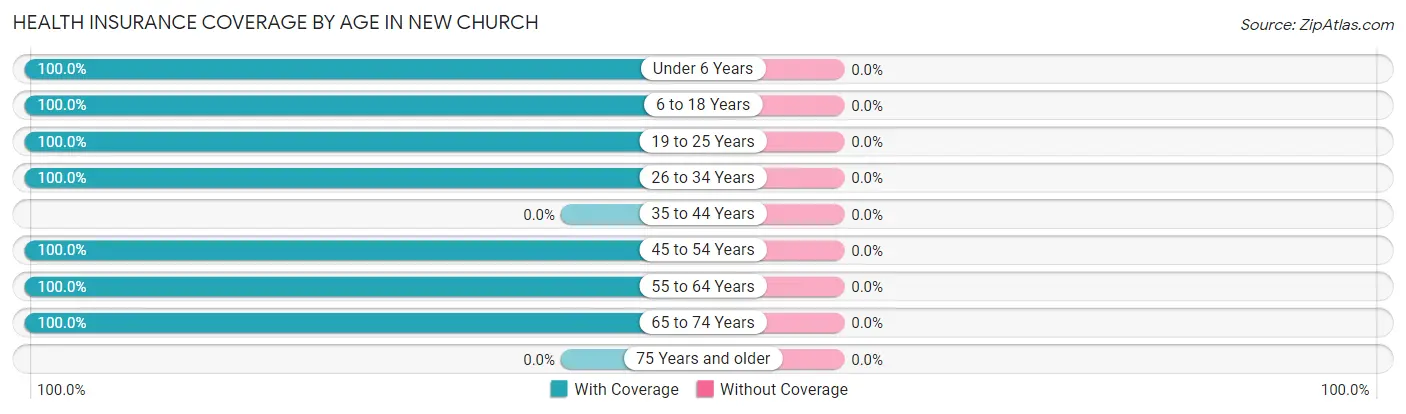
| Age Bracket | With Coverage | Without Coverage |
| Under 6 Years | 12 (100.0%) | 0 (0.0%) |
| 6 to 18 Years | 108 (100.0%) | 0 (0.0%) |
| 19 to 25 Years | 20 (100.0%) | 0 (0.0%) |
| 26 to 34 Years | 23 (100.0%) | 0 (0.0%) |
| 35 to 44 Years | 0 (0.0%) | 0 (0.0%) |
| 45 to 54 Years | 189 (100.0%) | 0 (0.0%) |
| 55 to 64 Years | 90 (100.0%) | 0 (0.0%) |
| 65 to 74 Years | 45 (100.0%) | 0 (0.0%) |
| 75 Years and older | 0 (0.0%) | 0 (0.0%) |
| Total | 487 (100.0%) | 0 (0.0%) |
Health Insurance Coverage by Citizenship Status in New Church
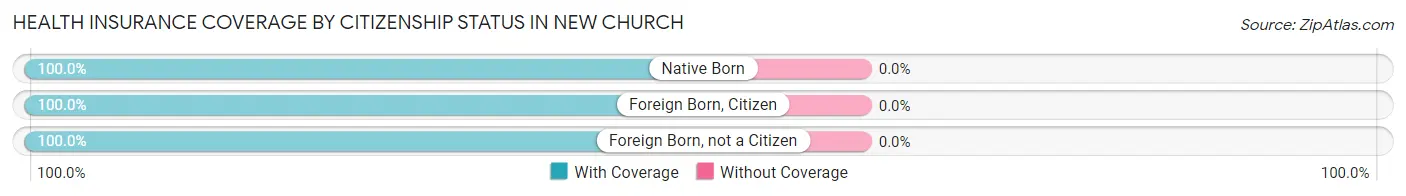
| Citizenship Status | With Coverage | Without Coverage |
| Native Born | 12 (100.0%) | 0 (0.0%) |
| Foreign Born, Citizen | 108 (100.0%) | 0 (0.0%) |
| Foreign Born, not a Citizen | 20 (100.0%) | 0 (0.0%) |
Health Insurance Coverage by Household Income in New Church
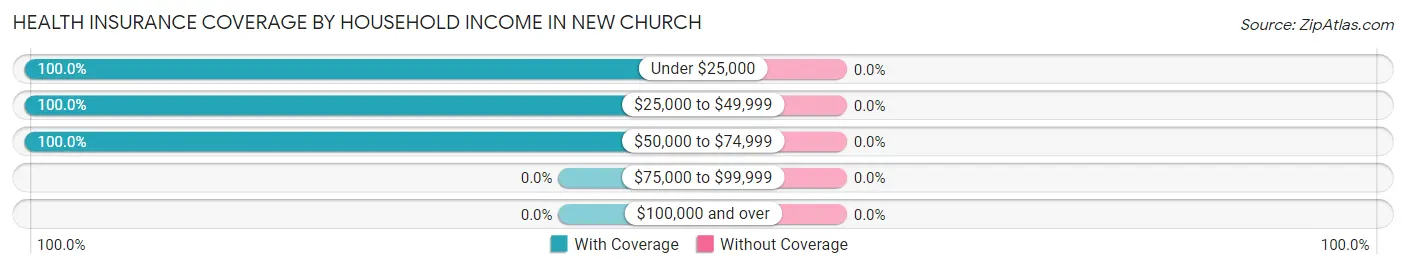
| Household Income | With Coverage | Without Coverage |
| Under $25,000 | 149 (100.0%) | 0 (0.0%) |
| $25,000 to $49,999 | 27 (100.0%) | 0 (0.0%) |
| $50,000 to $74,999 | 268 (100.0%) | 0 (0.0%) |
| $75,000 to $99,999 | 0 (0.0%) | 0 (0.0%) |
| $100,000 and over | 0 (0.0%) | 0 (0.0%) |
Public vs Private Health Insurance Coverage by Age in New Church
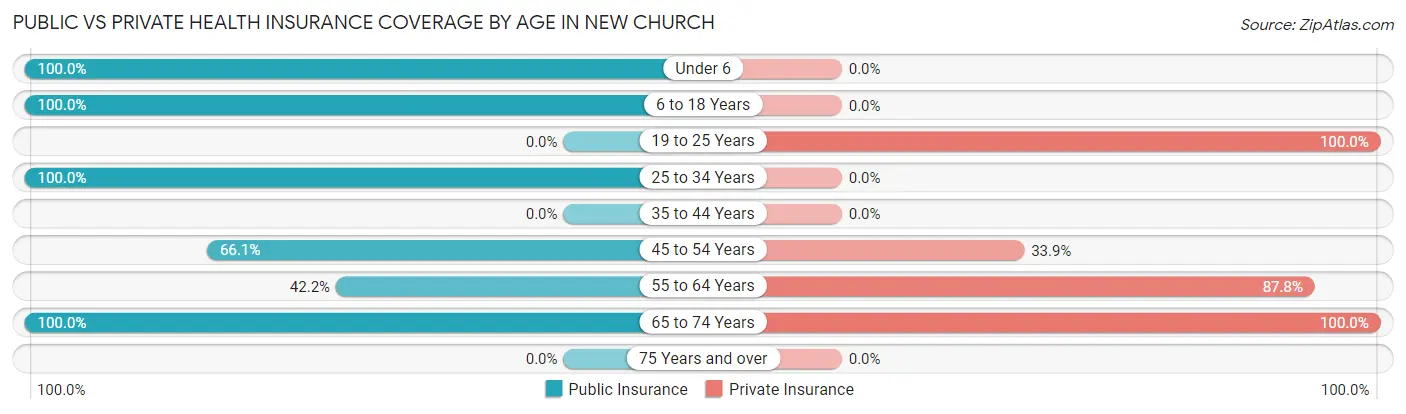
| Age Bracket | Public Insurance | Private Insurance |
| Under 6 | 12 (100.0%) | 0 (0.0%) |
| 6 to 18 Years | 108 (100.0%) | 0 (0.0%) |
| 19 to 25 Years | 0 (0.0%) | 20 (100.0%) |
| 25 to 34 Years | 23 (100.0%) | 0 (0.0%) |
| 35 to 44 Years | 0 (0.0%) | 0 (0.0%) |
| 45 to 54 Years | 125 (66.1%) | 64 (33.9%) |
| 55 to 64 Years | 38 (42.2%) | 79 (87.8%) |
| 65 to 74 Years | 45 (100.0%) | 45 (100.0%) |
| 75 Years and over | 0 (0.0%) | 0 (0.0%) |
| Total | 351 (72.1%) | 208 (42.7%) |
Disability Status by Sex by Age in New Church
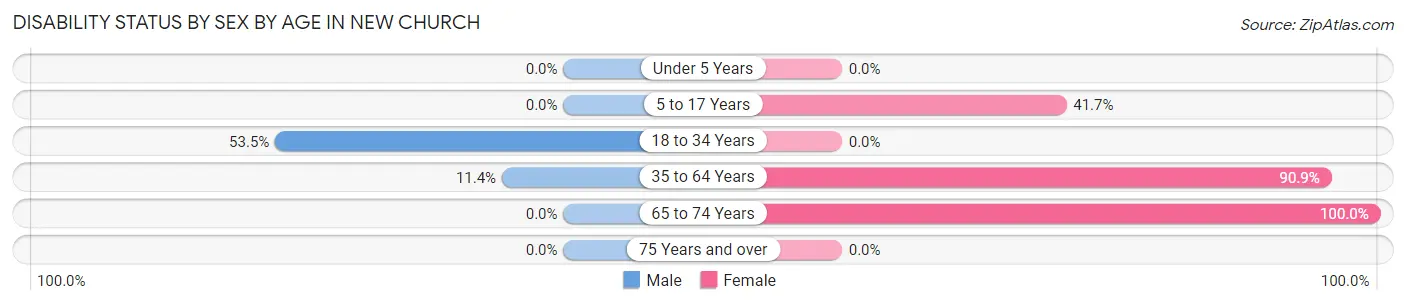
| Age Bracket | Male | Female |
| Under 5 Years | 0 (0.0%) | 0 (0.0%) |
| 5 to 17 Years | 0 (0.0%) | 45 (41.7%) |
| 18 to 34 Years | 23 (53.5%) | 0 (0.0%) |
| 35 to 64 Years | 13 (11.4%) | 150 (90.9%) |
| 65 to 74 Years | 0 (0.0%) | 45 (100.0%) |
| 75 Years and over | 0 (0.0%) | 0 (0.0%) |
Disability Class by Sex by Age in New Church
Disability Class: Hearing Difficulty
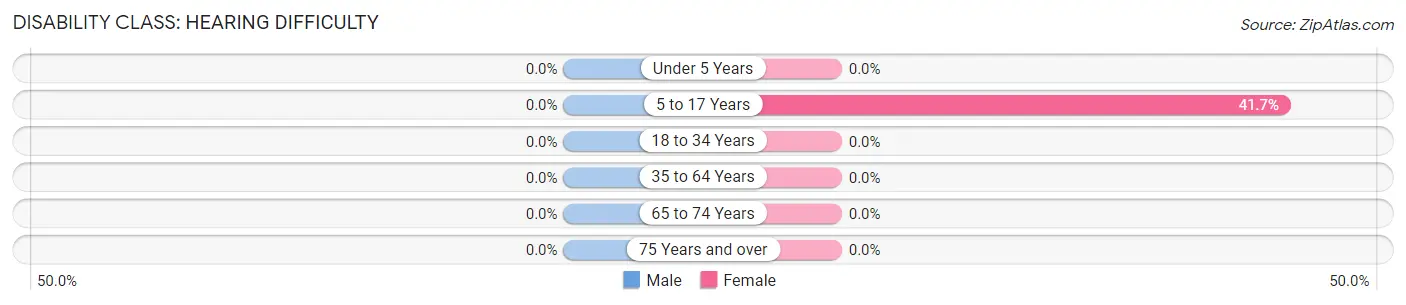
| Age Bracket | Male | Female |
| Under 5 Years | 0 (0.0%) | 0 (0.0%) |
| 5 to 17 Years | 0 (0.0%) | 45 (41.7%) |
| 18 to 34 Years | 0 (0.0%) | 0 (0.0%) |
| 35 to 64 Years | 0 (0.0%) | 0 (0.0%) |
| 65 to 74 Years | 0 (0.0%) | 0 (0.0%) |
| 75 Years and over | 0 (0.0%) | 0 (0.0%) |
Disability Class: Vision Difficulty
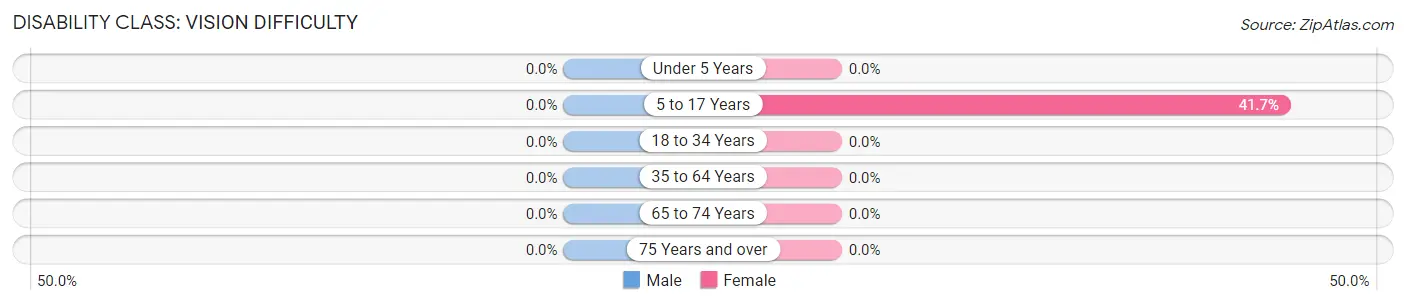
| Age Bracket | Male | Female |
| Under 5 Years | 0 (0.0%) | 0 (0.0%) |
| 5 to 17 Years | 0 (0.0%) | 45 (41.7%) |
| 18 to 34 Years | 0 (0.0%) | 0 (0.0%) |
| 35 to 64 Years | 0 (0.0%) | 0 (0.0%) |
| 65 to 74 Years | 0 (0.0%) | 0 (0.0%) |
| 75 Years and over | 0 (0.0%) | 0 (0.0%) |
Disability Class: Cognitive Difficulty
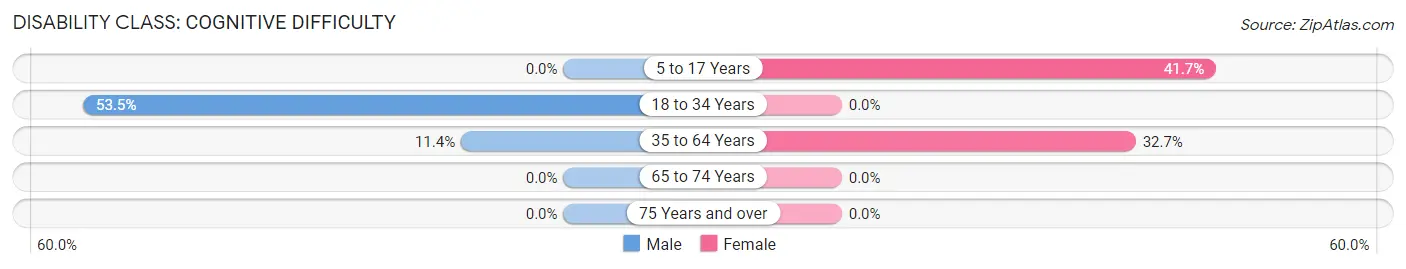
| Age Bracket | Male | Female |
| 5 to 17 Years | 0 (0.0%) | 45 (41.7%) |
| 18 to 34 Years | 23 (53.5%) | 0 (0.0%) |
| 35 to 64 Years | 13 (11.4%) | 54 (32.7%) |
| 65 to 74 Years | 0 (0.0%) | 0 (0.0%) |
| 75 Years and over | 0 (0.0%) | 0 (0.0%) |
Disability Class: Ambulatory Difficulty
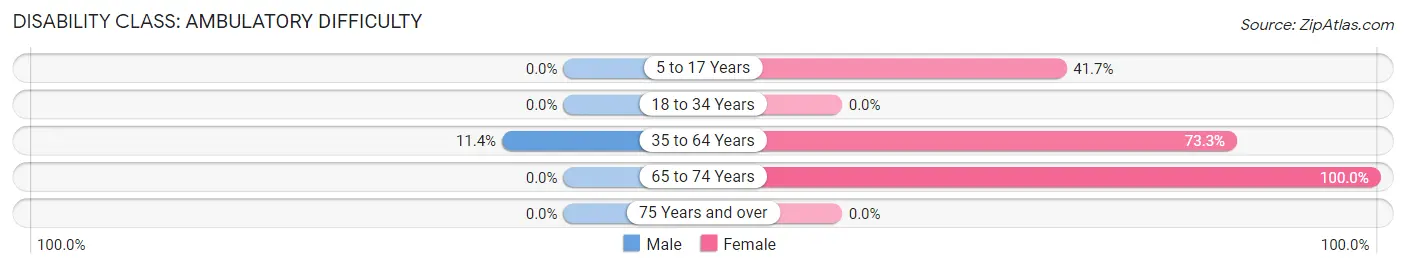
| Age Bracket | Male | Female |
| 5 to 17 Years | 0 (0.0%) | 45 (41.7%) |
| 18 to 34 Years | 0 (0.0%) | 0 (0.0%) |
| 35 to 64 Years | 13 (11.4%) | 121 (73.3%) |
| 65 to 74 Years | 0 (0.0%) | 45 (100.0%) |
| 75 Years and over | 0 (0.0%) | 0 (0.0%) |
Disability Class: Self-Care Difficulty
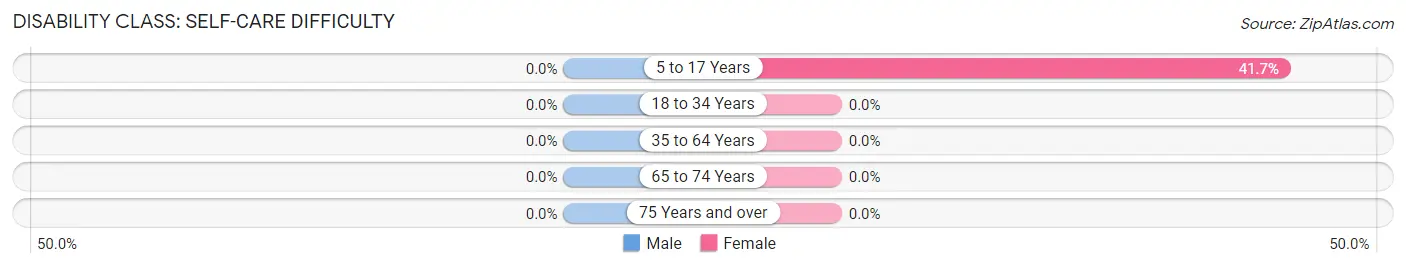
| Age Bracket | Male | Female |
| 5 to 17 Years | 0 (0.0%) | 45 (41.7%) |
| 18 to 34 Years | 0 (0.0%) | 0 (0.0%) |
| 35 to 64 Years | 0 (0.0%) | 0 (0.0%) |
| 65 to 74 Years | 0 (0.0%) | 0 (0.0%) |
| 75 Years and over | 0 (0.0%) | 0 (0.0%) |
Technology Access in New Church
Computing Device Access in New Church
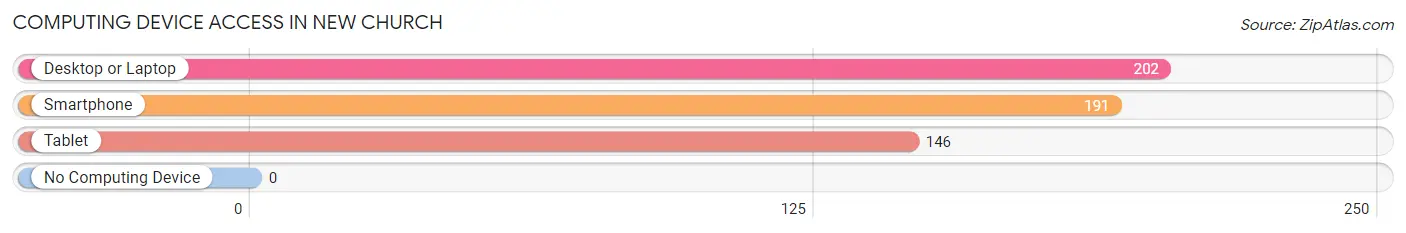
| Device Type | # Households | % Households |
| Desktop or Laptop | 202 | 100.0% |
| Smartphone | 191 | 94.6% |
| Tablet | 146 | 72.3% |
| No Computing Device | 0 | 0.0% |
| Total | 202 | 100.0% |
Internet Access in New Church
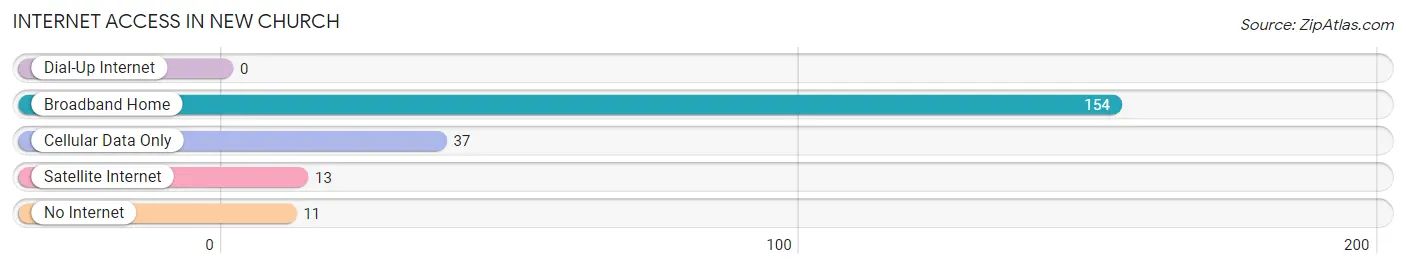
| Internet Type | # Households | % Households |
| Dial-Up Internet | 0 | 0.0% |
| Broadband Home | 154 | 76.2% |
| Cellular Data Only | 37 | 18.3% |
| Satellite Internet | 13 | 6.4% |
| No Internet | 11 | 5.4% |
| Total | 202 | 100.0% |
New Church Summary
Church, Virginia is a small town located in the northern part of the state, in the Shenandoah Valley. It is situated in the foothills of the Blue Ridge Mountains, and is part of the Winchester, Virginia metropolitan area. The town has a population of approximately 1,500 people, and is home to a variety of businesses, including a winery, a brewery, and a number of restaurants.
History
Church, Virginia was founded in 1790 by a group of settlers from Pennsylvania. The town was named after the Church of England, which was the official religion of the area at the time. The town was originally a farming community, and the settlers grew a variety of crops, including wheat, corn, and tobacco.
In the early 19th century, the town began to grow and develop. The first school was established in 1820, and the first post office was opened in 1825. The town was also home to a number of churches, including the Church of the Brethren, the Methodist Episcopal Church, and the Presbyterian Church.
In the late 19th century, the town began to experience a period of growth and prosperity. The railroad arrived in 1881, and the town was connected to the rest of the state. This allowed for the growth of industry and commerce, and the town began to attract new businesses and residents.
Geography
Church, Virginia is located in the northern part of the state, in the Shenandoah Valley. The town is situated in the foothills of the Blue Ridge Mountains, and is part of the Winchester, Virginia metropolitan area. The town is located near the intersection of Interstate 81 and US Route 11.
The town is situated on the banks of the Shenandoah River, and is surrounded by rolling hills and farmland. The town is located in a temperate climate, with hot summers and cold winters. The average annual temperature is around 55 degrees Fahrenheit.
Economy
Church, Virginia is a small town with a diverse economy. The town is home to a variety of businesses, including a winery, a brewery, and a number of restaurants. The town is also home to a number of small businesses, including a hardware store, a grocery store, and a number of antique shops.
The town is also home to a number of manufacturing companies, including a furniture factory and a printing company. The town is also home to a number of agricultural businesses, including a dairy farm and a number of fruit and vegetable farms.
Demographics
As of the 2010 census, the population of Church, Virginia was 1,500 people. The town is predominantly white, with a small African American population. The median household income is around $50,000, and the median home value is around $150,000. The town is home to a number of churches, including the Church of the Brethren, the Methodist Episcopal Church, and the Presbyterian Church.
Common Questions
What is Per Capita Income in New Church?
Per Capita income in New Church is $11,621.
What is the Median Family Income in New Church?
Median Family Income in New Church is $20,794.
What is Inequality or Gini Index in New Church?
Inequality or Gini Index in New Church is 0.36.
What is the Total Population of New Church?
Total Population of New Church is 487.
What is the Total Male Population of New Church?
Total Male Population of New Church is 157.
What is the Total Female Population of New Church?
Total Female Population of New Church is 330.
What is the Ratio of Males per 100 Females in New Church?
There are 47.58 Males per 100 Females in New Church.
What is the Ratio of Females per 100 Males in New Church?
There are 210.19 Females per 100 Males in New Church.
What is the Median Population Age in New Church?
Median Population Age in New Church is 50.6 Years.
What is the Average Family Size in New Church
Average Family Size in New Church is 2.1 People.
What is the Average Household Size in New Church
Average Household Size in New Church is 2.2 People.
How Large is the Labor Force in New Church?
There are 257 People in the Labor Forcein in New Church.
What is the Percentage of People in the Labor Force in New Church?
62.4% of People are in the Labor Force in New Church.