Cities with the Highest Female Poverty Level in Delaware
RELATED REPORTS & OPTIONS
Highest Poverty | Female
Delaware
Compare Cities
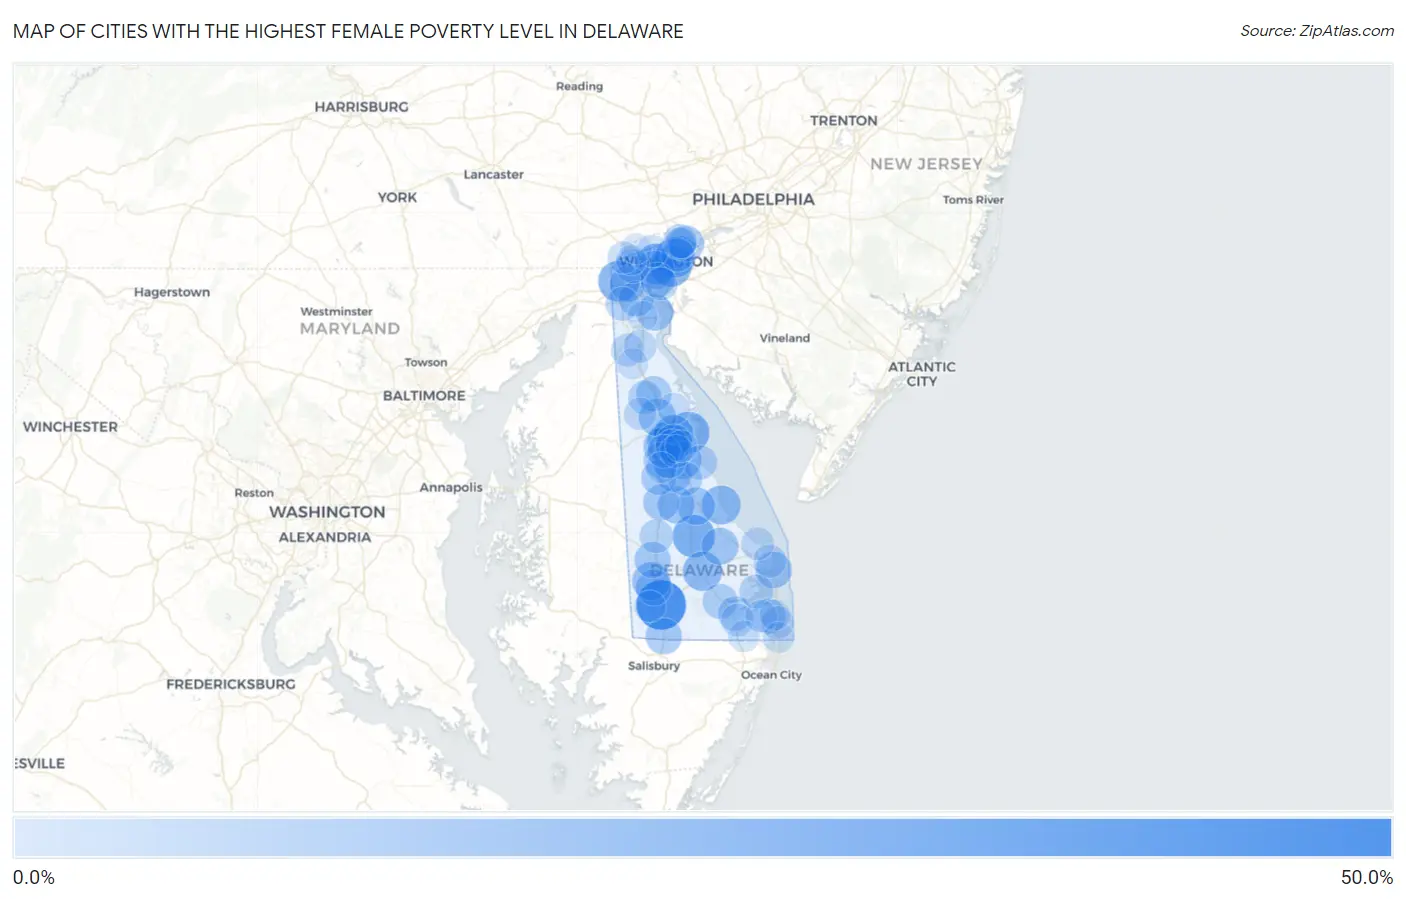
Map of Cities with the Highest Female Poverty Level in Delaware
0.0%
50.0%
Cities with the Highest Female Poverty Level in Delaware
| City | Female Poverty | vs State | vs National | |
| 1. | Laurel | 45.9% | 12.2%(+33.7)#1 | 13.7%(+32.2)#1,457 |
| 2. | Ellendale | 28.5% | 12.2%(+16.3)#2 | 13.7%(+14.8)#4,618 |
| 3. | Little Creek | 26.2% | 12.2%(+14.0)#3 | 13.7%(+12.5)#5,436 |
| 4. | Newark | 25.4% | 12.2%(+13.2)#4 | 13.7%(+11.7)#5,784 |
| 5. | Wilmington | 25.1% | 12.2%(+12.9)#5 | 13.7%(+11.4)#5,906 |
| 6. | Elsmere | 24.4% | 12.2%(+12.2)#6 | 13.7%(+10.7)#6,264 |
| 7. | Edgemoor | 24.2% | 12.2%(+12.0)#7 | 13.7%(+10.5)#6,332 |
| 8. | Rodney Village | 24.0% | 12.2%(+11.8)#8 | 13.7%(+10.3)#6,422 |
| 9. | Dover | 22.9% | 12.2%(+10.7)#9 | 13.7%(+9.16)#7,033 |
| 10. | Georgetown | 21.3% | 12.2%(+9.08)#10 | 13.7%(+7.59)#7,932 |
| 11. | Slaughter Beach | 20.7% | 12.2%(+8.47)#11 | 13.7%(+6.97)#8,297 |
| 12. | Newport | 18.7% | 12.2%(+6.52)#12 | 13.7%(+5.03)#9,704 |
| 13. | Seaford | 18.5% | 12.2%(+6.30)#13 | 13.7%(+4.81)#9,863 |
| 14. | Wyoming | 18.1% | 12.2%(+5.94)#14 | 13.7%(+4.44)#10,116 |
| 15. | Milford | 17.3% | 12.2%(+5.06)#15 | 13.7%(+3.57)#10,762 |
| 16. | Magnolia | 17.2% | 12.2%(+4.98)#16 | 13.7%(+3.49)#10,833 |
| 17. | Cheswold | 17.1% | 12.2%(+4.92)#17 | 13.7%(+3.42)#10,885 |
| 18. | Milton | 15.8% | 12.2%(+3.57)#18 | 13.7%(+2.07)#12,043 |
| 19. | Houston | 15.5% | 12.2%(+3.34)#19 | 13.7%(+1.84)#12,241 |
| 20. | Kent Acres | 15.1% | 12.2%(+2.86)#20 | 13.7%(+1.36)#12,692 |
| 21. | Dewey Beach | 14.7% | 12.2%(+2.53)#21 | 13.7%(+1.04)#12,985 |
| 22. | Delaware City | 14.7% | 12.2%(+2.51)#22 | 13.7%(+1.02)#13,000 |
| 23. | Delmar | 14.1% | 12.2%(+1.89)#23 | 13.7%(+0.391)#13,566 |
| 24. | Blades | 13.9% | 12.2%(+1.72)#24 | 13.7%(+0.222)#13,728 |
| 25. | Harrington | 13.7% | 12.2%(+1.54)#25 | 13.7%(+0.050)#13,891 |
| 26. | Bridgeville | 13.7% | 12.2%(+1.54)#26 | 13.7%(+0.046)#13,893 |
| 27. | Riverview | 13.7% | 12.2%(+1.48)#27 | 13.7%(-0.019)#13,967 |
| 28. | Claymont | 13.1% | 12.2%(+0.860)#28 | 13.7%(-0.636)#14,555 |
| 29. | Woodside | 12.8% | 12.2%(+0.578)#29 | 13.7%(-0.917)#14,866 |
| 30. | Brookside | 12.4% | 12.2%(+0.220)#30 | 13.7%(-1.27)#15,213 |
| 31. | Bear | 12.0% | 12.2%(-0.215)#31 | 13.7%(-1.71)#15,685 |
| 32. | Smyrna | 11.7% | 12.2%(-0.503)#32 | 13.7%(-2.00)#15,993 |
| 33. | Felton | 11.4% | 12.2%(-0.819)#33 | 13.7%(-2.31)#16,354 |
| 34. | Wilmington Manor | 11.1% | 12.2%(-1.10)#34 | 13.7%(-2.60)#16,705 |
| 35. | Millsboro | 10.9% | 12.2%(-1.29)#35 | 13.7%(-2.78)#16,867 |
| 36. | Ocean View | 10.9% | 12.2%(-1.30)#36 | 13.7%(-2.79)#16,880 |
| 37. | Dagsboro | 10.4% | 12.2%(-1.82)#37 | 13.7%(-3.32)#17,483 |
| 38. | Bowers | 9.5% | 12.2%(-2.70)#38 | 13.7%(-4.20)#18,523 |
| 39. | Frederica | 9.4% | 12.2%(-2.77)#39 | 13.7%(-4.27)#18,605 |
| 40. | Woodside East | 9.3% | 12.2%(-2.86)#40 | 13.7%(-4.36)#18,722 |
| 41. | Arden | 9.1% | 12.2%(-3.09)#41 | 13.7%(-4.58)#18,992 |
| 42. | Pike Creek Valley | 9.0% | 12.2%(-3.25)#42 | 13.7%(-4.75)#19,197 |
| 43. | Highland Acres | 8.9% | 12.2%(-3.34)#43 | 13.7%(-4.83)#19,291 |
| 44. | Clayton | 8.9% | 12.2%(-3.34)#44 | 13.7%(-4.83)#19,292 |
| 45. | Long Neck | 8.5% | 12.2%(-3.66)#45 | 13.7%(-5.15)#19,676 |
| 46. | Glasgow | 8.4% | 12.2%(-3.78)#46 | 13.7%(-5.27)#19,814 |
| 47. | Greenwood | 8.4% | 12.2%(-3.79)#47 | 13.7%(-5.29)#19,824 |
| 48. | Bellefonte | 7.1% | 12.2%(-5.07)#48 | 13.7%(-6.57)#21,352 |
| 49. | Camden | 6.6% | 12.2%(-5.57)#49 | 13.7%(-7.06)#21,966 |
| 50. | Middletown | 6.6% | 12.2%(-5.59)#50 | 13.7%(-7.08)#21,992 |
| 51. | Rehoboth Beach | 6.3% | 12.2%(-5.86)#51 | 13.7%(-7.36)#22,330 |
| 52. | South Bethany | 6.2% | 12.2%(-5.98)#52 | 13.7%(-7.48)#22,483 |
| 53. | New Castle | 6.0% | 12.2%(-6.16)#53 | 13.7%(-7.65)#22,698 |
| 54. | Lewes | 6.0% | 12.2%(-6.21)#54 | 13.7%(-7.70)#22,756 |
| 55. | Frankford | 6.0% | 12.2%(-6.21)#55 | 13.7%(-7.71)#22,762 |
| 56. | Rising Sun Lebanon | 5.9% | 12.2%(-6.30)#56 | 13.7%(-7.80)#22,863 |
| 57. | Odessa | 5.9% | 12.2%(-6.35)#57 | 13.7%(-7.85)#22,945 |
| 58. | Millville | 5.0% | 12.2%(-7.20)#58 | 13.7%(-8.69)#23,997 |
| 59. | Kenton | 4.8% | 12.2%(-7.38)#59 | 13.7%(-8.87)#24,232 |
| 60. | North Star | 4.5% | 12.2%(-7.68)#60 | 13.7%(-9.17)#24,568 |
| 61. | Ardencroft | 3.9% | 12.2%(-8.32)#61 | 13.7%(-9.82)#25,350 |
| 62. | Greenville | 3.7% | 12.2%(-8.46)#62 | 13.7%(-9.95)#25,486 |
| 63. | Leipsic | 3.7% | 12.2%(-8.55)#63 | 13.7%(-10.0)#25,577 |
| 64. | Dover Base Housing | 3.6% | 12.2%(-8.57)#64 | 13.7%(-10.1)#25,606 |
| 65. | Bethel | 3.3% | 12.2%(-8.87)#65 | 13.7%(-10.4)#25,936 |
| 66. | Lincoln | 3.0% | 12.2%(-9.20)#66 | 13.7%(-10.7)#26,288 |
| 67. | Selbyville | 2.9% | 12.2%(-9.31)#67 | 13.7%(-10.8)#26,395 |
| 68. | Ardentown | 2.6% | 12.2%(-9.60)#68 | 13.7%(-11.1)#26,677 |
| 69. | Viola | 2.3% | 12.2%(-9.93)#69 | 13.7%(-11.4)#27,000 |
| 70. | Townsend | 2.1% | 12.2%(-10.1)#70 | 13.7%(-11.6)#27,125 |
| 71. | Fenwick Island | 2.1% | 12.2%(-10.1)#71 | 13.7%(-11.6)#27,140 |
| 72. | Bethany Beach | 2.1% | 12.2%(-10.1)#72 | 13.7%(-11.6)#27,187 |
| 73. | Hockessin | 1.9% | 12.2%(-10.3)#73 | 13.7%(-11.8)#27,336 |
| 74. | Pike Creek | 1.3% | 12.2%(-10.9)#74 | 13.7%(-12.4)#27,680 |
| 75. | St Georges | 0.32% | 12.2%(-11.9)#75 | 13.7%(-13.4)#28,069 |
1
Common Questions
What are the Top 10 Cities with the Highest Female Poverty Level in Delaware?
Top 10 Cities with the Highest Female Poverty Level in Delaware are:
#1
45.9%
#2
28.5%
#3
26.2%
#4
25.4%
#5
25.1%
#6
24.4%
#7
24.2%
#8
24.0%
#9
22.9%
#10
21.3%
What city has the Highest Female Poverty Level in Delaware?
Laurel has the Highest Female Poverty Level in Delaware with 45.9%.
What is the Poverty Level Among Females in the State of Delaware?
Poverty Level Among Females in Delaware is 12.2%.
What is the Poverty Level Among Females in the United States?
Poverty Level Among Females in the United States is 13.7%.