Cities with the Highest Female Poverty Level in Maryland
RELATED REPORTS & OPTIONS
Highest Poverty | Female
Maryland
Compare Cities
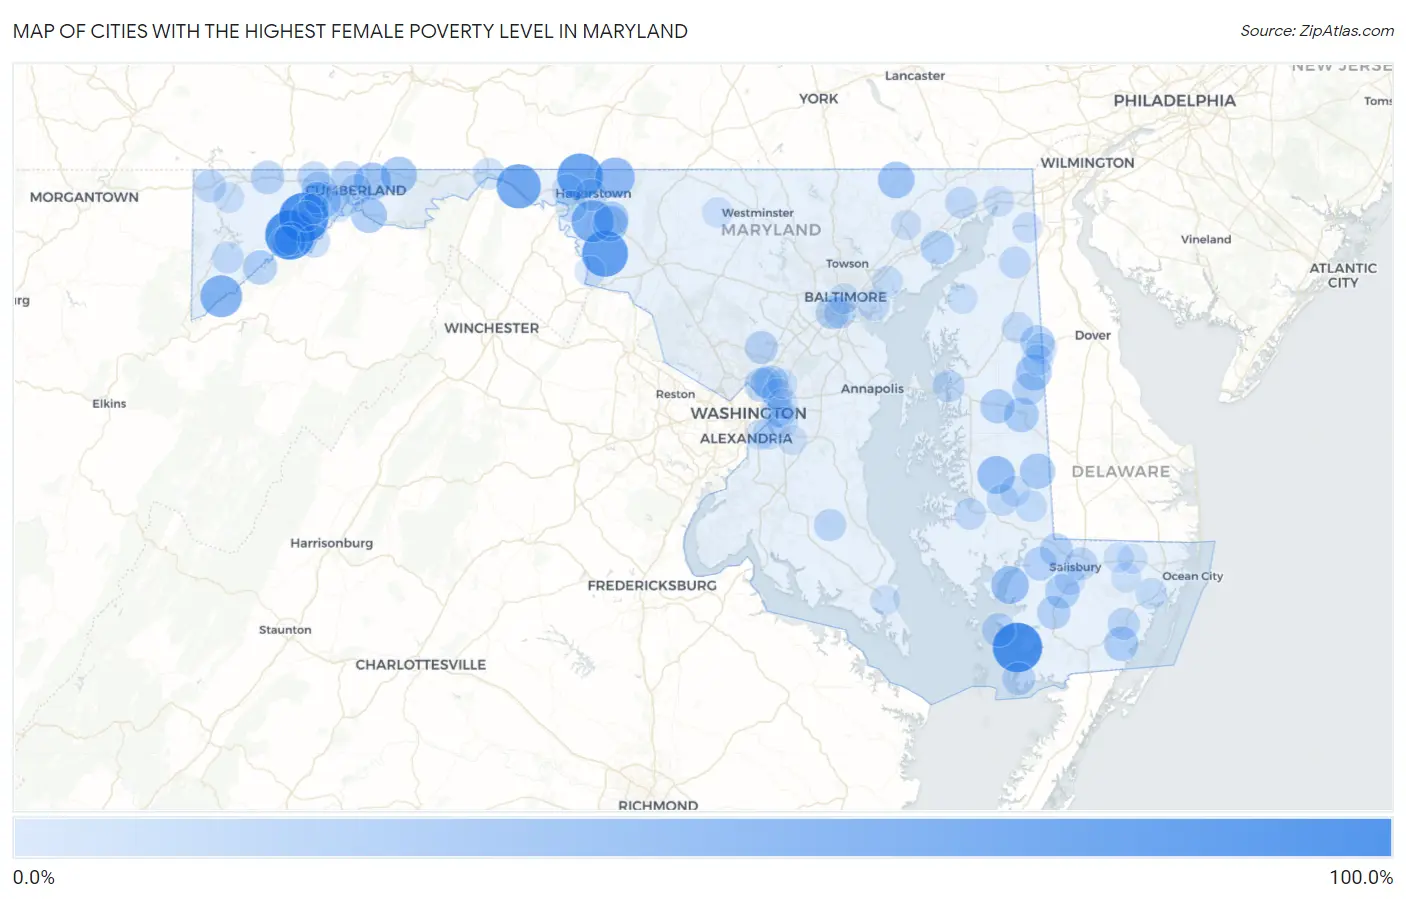
Map of Cities with the Highest Female Poverty Level in Maryland
0.0%
100.0%
Cities with the Highest Female Poverty Level in Maryland
| City | Female Poverty | vs State | vs National | |
| 1. | Franklin | 100.0% | 10.2%(+89.8)#1 | 13.7%(+86.3)#25 |
| 2. | Detmold | 100.0% | 10.2%(+89.8)#2 | 13.7%(+86.3)#45 |
| 3. | Frenchtown Rumbly | 100.0% | 10.2%(+89.8)#3 | 13.7%(+86.3)#139 |
| 4. | Rohrersville | 84.9% | 10.2%(+74.7)#4 | 13.7%(+71.2)#217 |
| 5. | Cearfoss | 82.5% | 10.2%(+72.3)#5 | 13.7%(+68.8)#237 |
| 6. | Pecktonville | 76.7% | 10.2%(+66.5)#6 | 13.7%(+63.0)#296 |
| 7. | Breathedsville | 66.9% | 10.2%(+56.7)#7 | 13.7%(+53.2)#461 |
| 8. | Gorman | 66.0% | 10.2%(+55.7)#8 | 13.7%(+52.3)#481 |
| 9. | Leitersburg | 57.1% | 10.2%(+46.9)#9 | 13.7%(+43.4)#766 |
| 10. | Choptank | 48.8% | 10.2%(+38.6)#10 | 13.7%(+35.1)#1,273 |
| 11. | Bivalve | 48.2% | 10.2%(+38.0)#11 | 13.7%(+34.5)#1,310 |
| 12. | Pleasant Grove | 45.3% | 10.2%(+35.1)#12 | 13.7%(+31.6)#1,505 |
| 13. | Pylesville | 44.0% | 10.2%(+33.7)#13 | 13.7%(+30.3)#1,637 |
| 14. | Vale Summit | 43.9% | 10.2%(+33.7)#14 | 13.7%(+30.2)#1,638 |
| 15. | Flintstone | 43.5% | 10.2%(+33.3)#15 | 13.7%(+29.8)#1,683 |
| 16. | Mapleville | 40.3% | 10.2%(+30.1)#16 | 13.7%(+26.6)#2,059 |
| 17. | Goldsboro | 40.2% | 10.2%(+30.0)#17 | 13.7%(+26.5)#2,068 |
| 18. | Spring Gap | 40.0% | 10.2%(+29.8)#18 | 13.7%(+26.3)#2,117 |
| 19. | Federalsburg | 38.2% | 10.2%(+27.9)#19 | 13.7%(+24.5)#2,342 |
| 20. | San Mar | 36.0% | 10.2%(+25.8)#20 | 13.7%(+22.3)#2,721 |
| 21. | West Denton | 35.7% | 10.2%(+25.5)#21 | 13.7%(+22.0)#2,800 |
| 22. | Eden | 34.9% | 10.2%(+24.7)#22 | 13.7%(+21.3)#2,954 |
| 23. | Hillsboro | 34.8% | 10.2%(+24.6)#23 | 13.7%(+21.1)#2,991 |
| 24. | Girdletree | 34.7% | 10.2%(+24.4)#24 | 13.7%(+21.0)#3,012 |
| 25. | Templeville | 34.3% | 10.2%(+24.1)#25 | 13.7%(+20.6)#3,091 |
| 26. | Kitzmiller | 34.3% | 10.2%(+24.1)#26 | 13.7%(+20.6)#3,094 |
| 27. | College Park | 32.9% | 10.2%(+22.7)#27 | 13.7%(+19.2)#3,391 |
| 28. | Frostburg | 32.8% | 10.2%(+22.6)#28 | 13.7%(+19.1)#3,407 |
| 29. | Langley Park | 32.3% | 10.2%(+22.1)#29 | 13.7%(+18.6)#3,535 |
| 30. | Perryman | 32.0% | 10.2%(+21.7)#30 | 13.7%(+18.3)#3,622 |
| 31. | Deal Island | 31.4% | 10.2%(+21.1)#31 | 13.7%(+17.7)#3,748 |
| 32. | Quantico | 31.1% | 10.2%(+20.9)#32 | 13.7%(+17.4)#3,812 |
| 33. | Grantsville | 31.0% | 10.2%(+20.8)#33 | 13.7%(+17.3)#3,852 |
| 34. | Lansdowne | 31.0% | 10.2%(+20.8)#34 | 13.7%(+17.3)#3,854 |
| 35. | Princess Anne | 30.7% | 10.2%(+20.5)#35 | 13.7%(+17.0)#3,924 |
| 36. | Luke | 30.4% | 10.2%(+20.2)#36 | 13.7%(+16.7)#4,016 |
| 37. | Hebron | 30.2% | 10.2%(+20.0)#37 | 13.7%(+16.5)#4,084 |
| 38. | Spencerville | 29.0% | 10.2%(+18.8)#38 | 13.7%(+15.3)#4,434 |
| 39. | Westernport | 28.8% | 10.2%(+18.5)#39 | 13.7%(+15.1)#4,504 |
| 40. | Crisfield | 28.7% | 10.2%(+18.5)#40 | 13.7%(+15.0)#4,514 |
| 41. | Corriganville | 27.6% | 10.2%(+17.3)#41 | 13.7%(+13.9)#4,936 |
| 42. | Greensboro | 27.4% | 10.2%(+17.1)#42 | 13.7%(+13.7)#5,001 |
| 43. | Salisbury | 26.7% | 10.2%(+16.4)#43 | 13.7%(+13.0)#5,280 |
| 44. | Dawson | 26.5% | 10.2%(+16.2)#44 | 13.7%(+12.8)#5,351 |
| 45. | Friendsville | 25.8% | 10.2%(+15.6)#45 | 13.7%(+12.1)#5,590 |
| 46. | Queenstown | 25.7% | 10.2%(+15.5)#46 | 13.7%(+12.0)#5,647 |
| 47. | Snow Hill | 25.7% | 10.2%(+15.4)#47 | 13.7%(+12.0)#5,676 |
| 48. | Benedict | 25.6% | 10.2%(+15.4)#48 | 13.7%(+11.9)#5,686 |
| 49. | Finzel | 25.2% | 10.2%(+15.0)#49 | 13.7%(+11.5)#5,875 |
| 50. | Baltimore Highlands | 25.0% | 10.2%(+14.7)#50 | 13.7%(+11.3)#6,000 |
| 51. | Hagerstown | 24.7% | 10.2%(+14.4)#51 | 13.7%(+11.0)#6,140 |
| 52. | Fairmount Heights | 24.6% | 10.2%(+14.3)#52 | 13.7%(+10.9)#6,188 |
| 53. | Port Deposit | 24.3% | 10.2%(+14.0)#53 | 13.7%(+10.6)#6,325 |
| 54. | East New Market | 24.2% | 10.2%(+14.0)#54 | 13.7%(+10.5)#6,328 |
| 55. | Cecilton | 24.0% | 10.2%(+13.8)#55 | 13.7%(+10.3)#6,442 |
| 56. | Cambridge | 23.6% | 10.2%(+13.4)#56 | 13.7%(+9.93)#6,629 |
| 57. | Cumberland | 23.6% | 10.2%(+13.4)#57 | 13.7%(+9.92)#6,635 |
| 58. | Deer Park | 23.6% | 10.2%(+13.4)#58 | 13.7%(+9.90)#6,647 |
| 59. | Adelphi | 23.6% | 10.2%(+13.3)#59 | 13.7%(+9.86)#6,665 |
| 60. | Ten Mile Creek | 23.3% | 10.2%(+13.1)#60 | 13.7%(+9.59)#6,813 |
| 61. | Dundalk | 23.2% | 10.2%(+13.0)#61 | 13.7%(+9.49)#6,860 |
| 62. | Cresaptown | 23.1% | 10.2%(+12.9)#62 | 13.7%(+9.40)#6,916 |
| 63. | Hancock | 23.1% | 10.2%(+12.9)#63 | 13.7%(+9.39)#6,920 |
| 64. | Brookview | 22.7% | 10.2%(+12.5)#64 | 13.7%(+9.03)#7,121 |
| 65. | Marlow Heights | 22.7% | 10.2%(+12.5)#65 | 13.7%(+9.01)#7,127 |
| 66. | Wilson Conococheague | 22.7% | 10.2%(+12.5)#66 | 13.7%(+8.98)#7,148 |
| 67. | Marydel | 22.4% | 10.2%(+12.2)#67 | 13.7%(+8.75)#7,270 |
| 68. | Williamsport | 22.0% | 10.2%(+11.8)#68 | 13.7%(+8.34)#7,506 |
| 69. | Shaft | 21.9% | 10.2%(+11.7)#69 | 13.7%(+8.24)#7,558 |
| 70. | Sudlersville | 21.8% | 10.2%(+11.6)#70 | 13.7%(+8.08)#7,633 |
| 71. | Newark | 21.3% | 10.2%(+11.1)#71 | 13.7%(+7.59)#7,925 |
| 72. | Henderson | 21.3% | 10.2%(+11.0)#72 | 13.7%(+7.58)#7,940 |
| 73. | Seat Pleasant | 20.9% | 10.2%(+10.6)#73 | 13.7%(+7.17)#8,175 |
| 74. | Middle River | 20.5% | 10.2%(+10.2)#74 | 13.7%(+6.77)#8,435 |
| 75. | Baltimore | 20.5% | 10.2%(+10.2)#75 | 13.7%(+6.76)#8,440 |
| 76. | District Heights | 20.3% | 10.2%(+10.0)#76 | 13.7%(+6.57)#8,583 |
| 77. | East Riverdale | 20.0% | 10.2%(+9.82)#77 | 13.7%(+6.35)#8,716 |
| 78. | Accident | 19.5% | 10.2%(+9.26)#78 | 13.7%(+5.79)#9,129 |
| 79. | Hurlock | 19.3% | 10.2%(+9.08)#79 | 13.7%(+5.61)#9,257 |
| 80. | Midland | 19.3% | 10.2%(+9.08)#80 | 13.7%(+5.60)#9,258 |
| 81. | North East | 18.9% | 10.2%(+8.65)#81 | 13.7%(+5.18)#9,573 |
| 82. | Dargan | 18.8% | 10.2%(+8.60)#82 | 13.7%(+5.12)#9,616 |
| 83. | Landover | 18.4% | 10.2%(+8.19)#83 | 13.7%(+4.72)#9,917 |
| 84. | Union Bridge | 18.4% | 10.2%(+8.17)#84 | 13.7%(+4.70)#9,925 |
| 85. | Lonaconing | 18.3% | 10.2%(+8.09)#85 | 13.7%(+4.62)#9,972 |
| 86. | Crumpton | 18.3% | 10.2%(+8.06)#86 | 13.7%(+4.59)#10,000 |
| 87. | Chesapeake City | 18.3% | 10.2%(+8.06)#87 | 13.7%(+4.59)#10,001 |
| 88. | Fruitland | 18.2% | 10.2%(+7.95)#88 | 13.7%(+4.48)#10,072 |
| 89. | Glassmanor | 18.2% | 10.2%(+7.92)#89 | 13.7%(+4.45)#10,110 |
| 90. | Bel Air | 18.0% | 10.2%(+7.78)#90 | 13.7%(+4.31)#10,206 |
| 91. | Flower Hill | 17.9% | 10.2%(+7.68)#91 | 13.7%(+4.21)#10,282 |
| 92. | Butlertown | 17.6% | 10.2%(+7.36)#92 | 13.7%(+3.88)#10,509 |
| 93. | Powellville | 17.2% | 10.2%(+7.01)#93 | 13.7%(+3.54)#10,786 |
| 94. | Willards | 17.2% | 10.2%(+6.94)#94 | 13.7%(+3.46)#10,856 |
| 95. | Bloomington | 17.1% | 10.2%(+6.92)#95 | 13.7%(+3.44)#10,871 |
| 96. | Potomac Park | 17.0% | 10.2%(+6.82)#96 | 13.7%(+3.35)#10,957 |
| 97. | Pittsville | 17.0% | 10.2%(+6.79)#97 | 13.7%(+3.32)#10,982 |
| 98. | Lexington Park | 16.9% | 10.2%(+6.67)#98 | 13.7%(+3.19)#11,088 |
| 99. | Melwood | 16.9% | 10.2%(+6.66)#99 | 13.7%(+3.19)#11,094 |
| 100. | Greenbelt | 16.9% | 10.2%(+6.64)#100 | 13.7%(+3.17)#11,112 |
Common Questions
What are the Top 10 Cities with the Highest Female Poverty Level in Maryland?
Top 10 Cities with the Highest Female Poverty Level in Maryland are:
#1
100.0%
#2
100.0%
#3
100.0%
#4
84.9%
#5
82.5%
#6
76.7%
#7
66.9%
#8
66.0%
#9
57.1%
#10
48.8%
What city has the Highest Female Poverty Level in Maryland?
Franklin has the Highest Female Poverty Level in Maryland with 100.0%.
What is the Poverty Level Among Females in the State of Maryland?
Poverty Level Among Females in Maryland is 10.2%.
What is the Poverty Level Among Females in the United States?
Poverty Level Among Females in the United States is 13.7%.