Zip Codes with the Highest Percentage of Population Employed in Arts, Entertainment & Recreation in Acton, MA
RELATED REPORTS & OPTIONS
Arts, Entertainment & Recreation
Acton
Compare Zip Codes
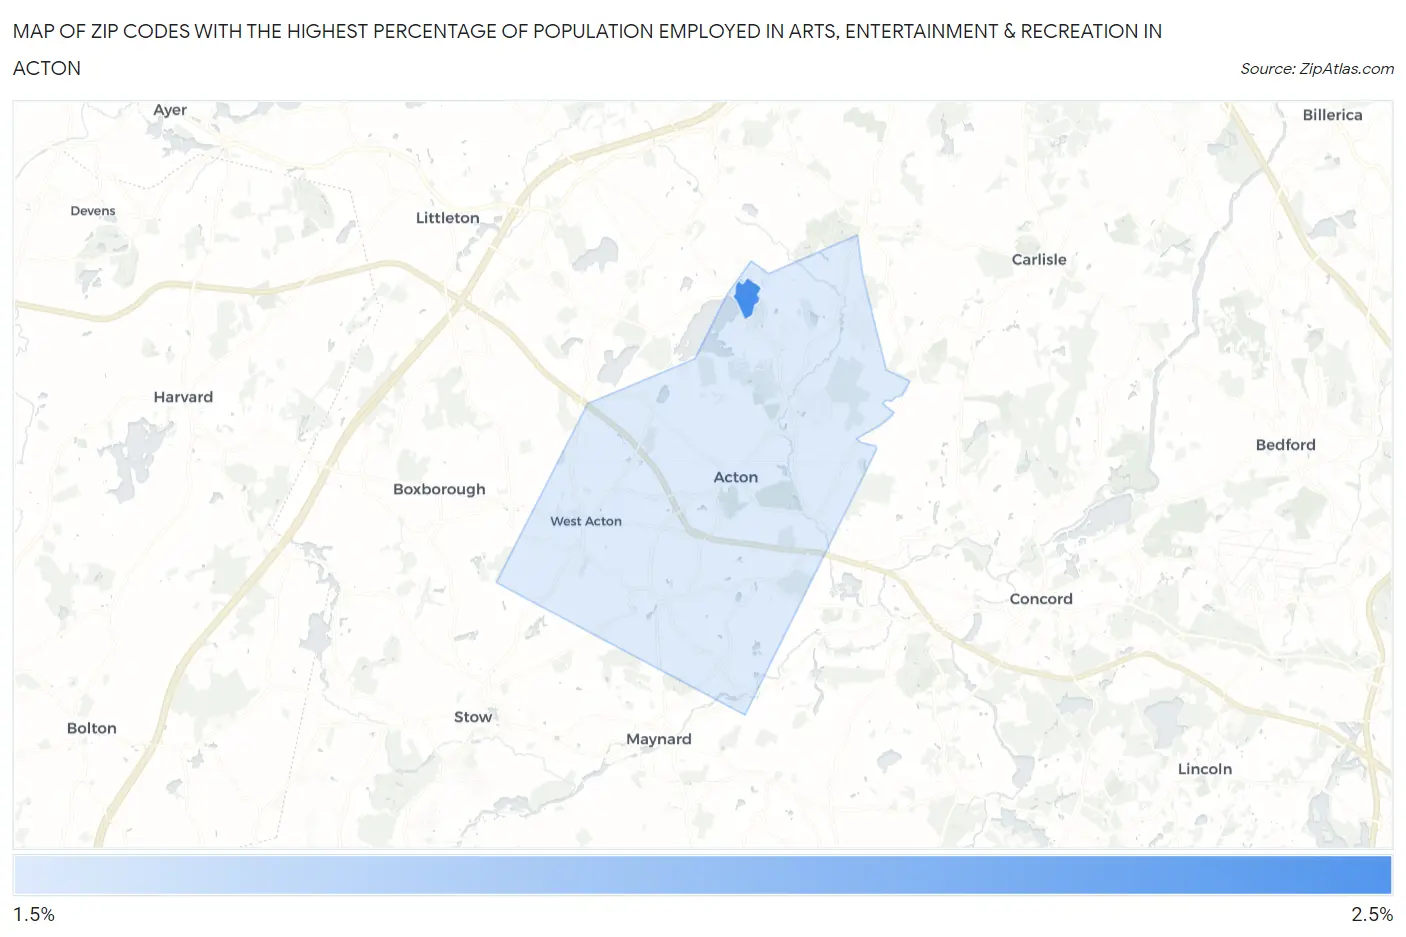
Map of Zip Codes with the Highest Percentage of Population Employed in Arts, Entertainment & Recreation in Acton
1.6%
2.3%
Zip Codes with the Highest Percentage of Population Employed in Arts, Entertainment & Recreation in Acton, MA
| Zip Code | % Employed | vs State | vs National | |
| 1. | 01718 | 2.3% | 2.0%(+0.348)#190 | 2.1%(+0.243)#8,002 |
| 2. | 01720 | 1.6% | 2.0%(-0.357)#293 | 2.1%(-0.462)#12,294 |
1
Common Questions
What are the Top Zip Codes with the Highest Percentage of Population Employed in Arts, Entertainment & Recreation in Acton, MA?
Top Zip Codes with the Highest Percentage of Population Employed in Arts, Entertainment & Recreation in Acton, MA are:
What zip code has the Highest Percentage of Population Employed in Arts, Entertainment & Recreation in Acton, MA?
01718 has the Highest Percentage of Population Employed in Arts, Entertainment & Recreation in Acton, MA with 2.3%.
What is the Percentage of Population Employed in Arts, Entertainment & Recreation in Massachusetts?
Percentage of Population Employed in Arts, Entertainment & Recreation in Massachusetts is 2.0%.
What is the Percentage of Population Employed in Arts, Entertainment & Recreation in the United States?
Percentage of Population Employed in Arts, Entertainment & Recreation in the United States is 2.1%.