Schuyler, NE Map & Demographics
Schuyler Map
Schuyler Overview
$25,687
PER CAPITA INCOME
$71,231
AVG FAMILY INCOME
$71,275
AVG HOUSEHOLD INCOME
5.4%
WAGE / INCOME GAP [ % ]
94.6¢/ $1
WAGE / INCOME GAP [ $ ]
0.37
INEQUALITY / GINI INDEX
6,516
TOTAL POPULATION
3,638
MALE POPULATION
2,878
FEMALE POPULATION
126.41
MALES / 100 FEMALES
79.11
FEMALES / 100 MALES
33.5
MEDIAN AGE
3.4
AVG FAMILY SIZE
3.3
AVG HOUSEHOLD SIZE
3,388
LABOR FORCE [ PEOPLE ]
74.7%
PERCENT IN LABOR FORCE
2.0%
UNEMPLOYMENT RATE
Schuyler Zip Codes
Schuyler Area Codes
Income in Schuyler
Income Overview in Schuyler
Per Capita Income in Schuyler is $25,687, while median incomes of families and households are $71,231 and $71,275 respectively.
| Characteristic | Number | Measure |
| Per Capita Income | 6,516 | $25,687 |
| Median Family Income | 1,595 | $71,231 |
| Mean Family Income | 1,595 | $79,807 |
| Median Household Income | 1,990 | $71,275 |
| Mean Household Income | 1,990 | $85,239 |
| Income Deficit | 1,595 | $0 |
| Wage / Income Gap (%) | 6,516 | 5.36% |
| Wage / Income Gap ($) | 6,516 | 94.64¢ per $1 |
| Gini / Inequality Index | 6,516 | 0.37 |
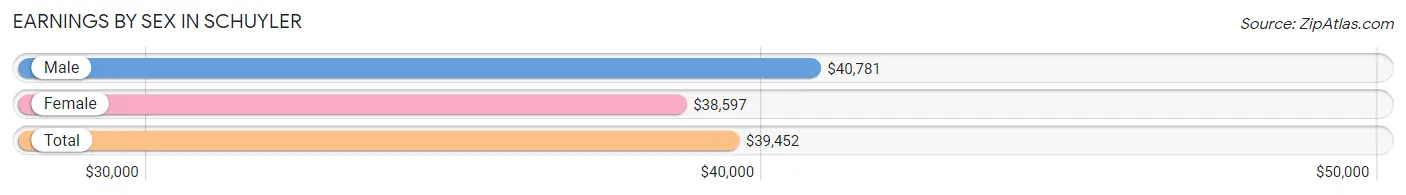
Earnings by Sex in Schuyler
Average Earnings in Schuyler are $39,452, $40,781 for men and $38,597 for women, a difference of 5.4%.
| Sex | Number | Average Earnings |
| Male | 2,204 (62.7%) | $40,781 |
| Female | 1,311 (37.3%) | $38,597 |
| Total | 3,515 (100.0%) | $39,452 |
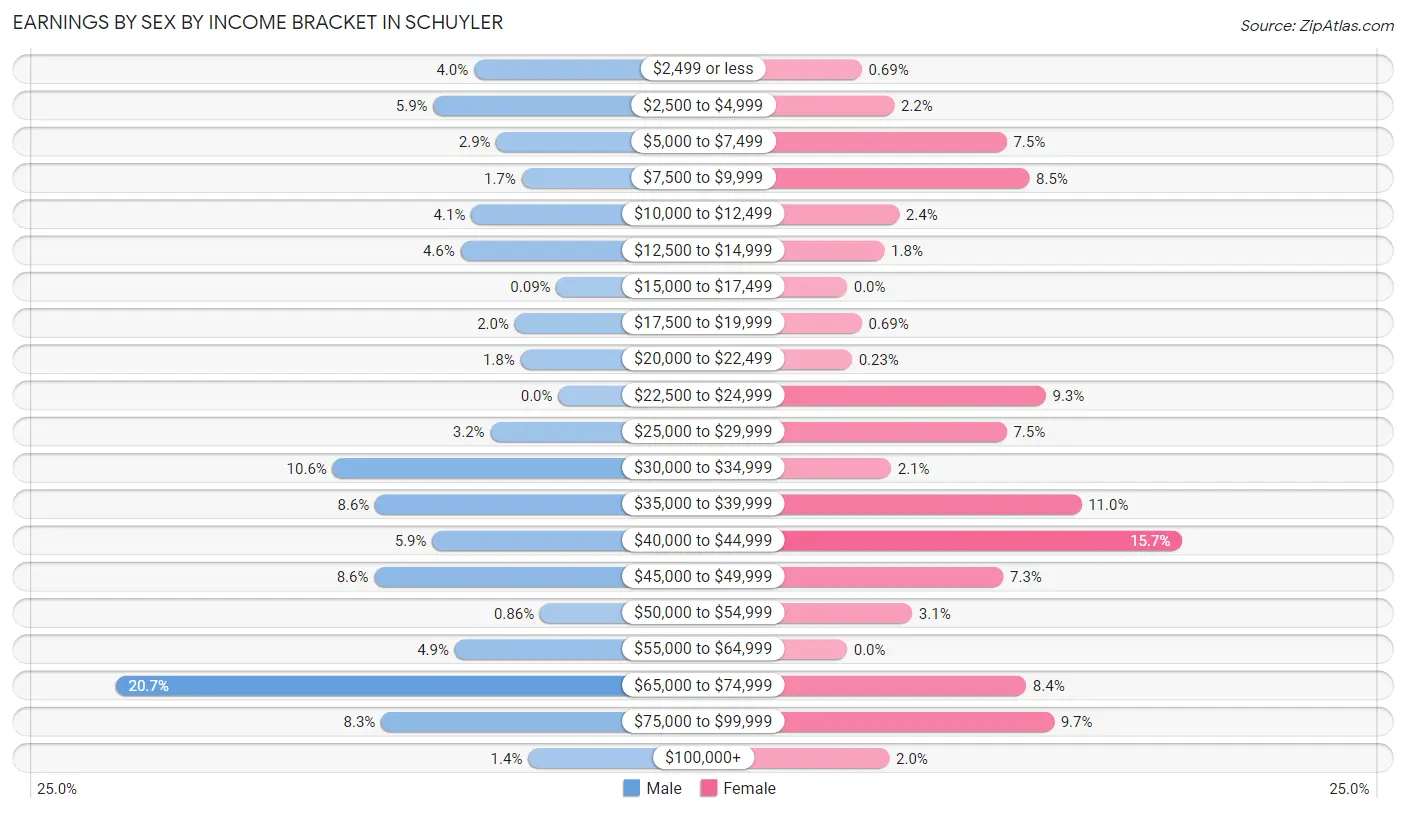
Earnings by Sex by Income Bracket in Schuyler
The most common earnings brackets in Schuyler are $65,000 to $74,999 for men (457 | 20.7%) and $40,000 to $44,999 for women (206 | 15.7%).
| Income | Male | Female |
| $2,499 or less | 87 (4.0%) | 9 (0.7%) |
| $2,500 to $4,999 | 129 (5.9%) | 29 (2.2%) |
| $5,000 to $7,499 | 64 (2.9%) | 98 (7.5%) |
| $7,500 to $9,999 | 38 (1.7%) | 112 (8.5%) |
| $10,000 to $12,499 | 90 (4.1%) | 32 (2.4%) |
| $12,500 to $14,999 | 101 (4.6%) | 23 (1.8%) |
| $15,000 to $17,499 | 2 (0.1%) | 0 (0.0%) |
| $17,500 to $19,999 | 45 (2.0%) | 9 (0.7%) |
| $20,000 to $22,499 | 39 (1.8%) | 3 (0.2%) |
| $22,500 to $24,999 | 0 (0.0%) | 122 (9.3%) |
| $25,000 to $29,999 | 70 (3.2%) | 98 (7.5%) |
| $30,000 to $34,999 | 233 (10.6%) | 27 (2.1%) |
| $35,000 to $39,999 | 189 (8.6%) | 144 (11.0%) |
| $40,000 to $44,999 | 130 (5.9%) | 206 (15.7%) |
| $45,000 to $49,999 | 190 (8.6%) | 96 (7.3%) |
| $50,000 to $54,999 | 19 (0.9%) | 40 (3.0%) |
| $55,000 to $64,999 | 107 (4.9%) | 0 (0.0%) |
| $65,000 to $74,999 | 457 (20.7%) | 110 (8.4%) |
| $75,000 to $99,999 | 183 (8.3%) | 127 (9.7%) |
| $100,000+ | 31 (1.4%) | 26 (2.0%) |
| Total | 2,204 (100.0%) | 1,311 (100.0%) |
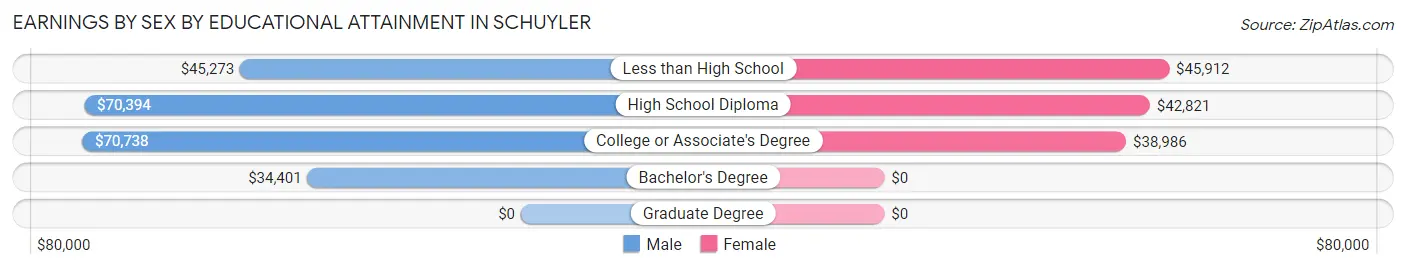
Earnings by Sex by Educational Attainment in Schuyler
Average earnings in Schuyler are $47,148 for men and $42,348 for women, a difference of 10.2%. Men with an educational attainment of college or associate's degree enjoy the highest average annual earnings of $70,738, while those with bachelor's degree education earn the least with $34,401. Women with an educational attainment of less than high school earn the most with the average annual earnings of $45,912, while those with college or associate's degree education have the smallest earnings of $38,986.
| Educational Attainment | Male Income | Female Income |
| Less than High School | $45,273 | $45,912 |
| High School Diploma | $70,394 | $42,821 |
| College or Associate's Degree | $70,738 | $38,986 |
| Bachelor's Degree | $34,401 | $0 |
| Graduate Degree | - | - |
| Total | $47,148 | $42,348 |
Family Income in Schuyler
Family Income Brackets in Schuyler
According to the Schuyler family income data, there are 530 families falling into the $50,000 to $74,999 income range, which is the most common income bracket and makes up 33.2% of all families.
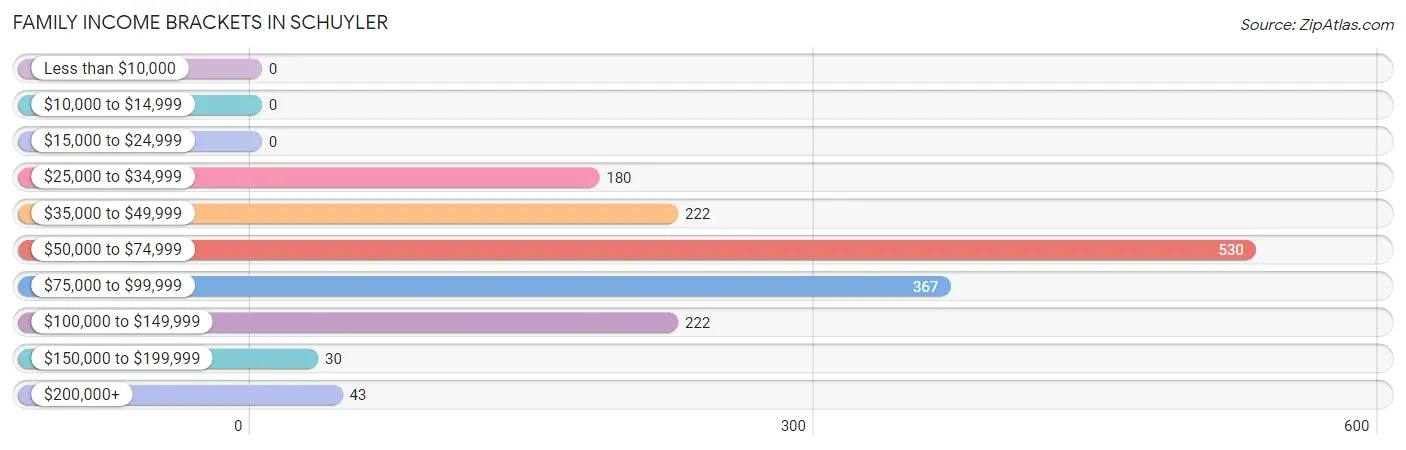
| Income Bracket | # Families | % Families |
| Less than $10,000 | 0 | 0.0% |
| $10,000 to $14,999 | 0 | 0.0% |
| $15,000 to $24,999 | 0 | 0.0% |
| $25,000 to $34,999 | 180 | 11.3% |
| $35,000 to $49,999 | 222 | 13.9% |
| $50,000 to $74,999 | 530 | 33.2% |
| $75,000 to $99,999 | 367 | 23.0% |
| $100,000 to $149,999 | 222 | 13.9% |
| $150,000 to $199,999 | 30 | 1.9% |
| $200,000+ | 43 | 2.7% |
Family Income by Famaliy Size in Schuyler
4-person families (310 | 19.4%) account for the highest median family income in Schuyler with $79,299 per family, while 2-person families (377 | 23.6%) have the highest median income of $30,903 per family member.
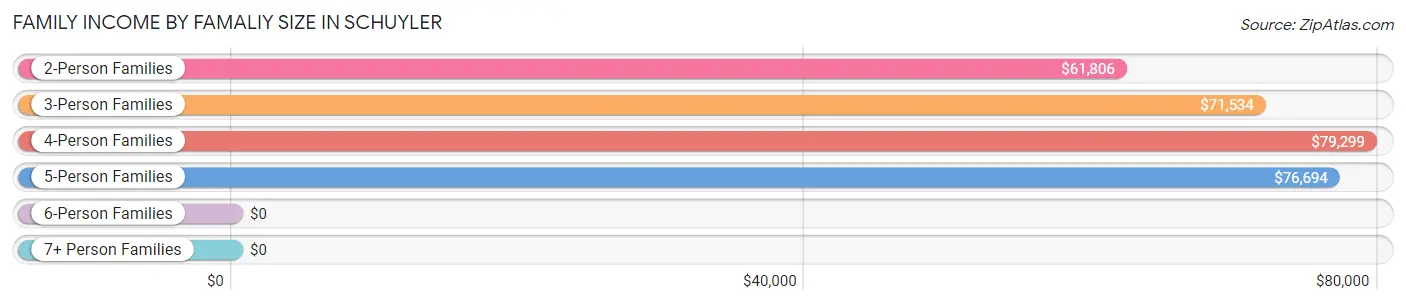
| Income Bracket | # Families | Median Income |
| 2-Person Families | 377 (23.6%) | $61,806 |
| 3-Person Families | 560 (35.1%) | $71,534 |
| 4-Person Families | 310 (19.4%) | $79,299 |
| 5-Person Families | 158 (9.9%) | $76,694 |
| 6-Person Families | 181 (11.4%) | $0 |
| 7+ Person Families | 9 (0.6%) | $0 |
| Total | 1,595 (100.0%) | $71,231 |
Family Income by Number of Earners in Schuyler
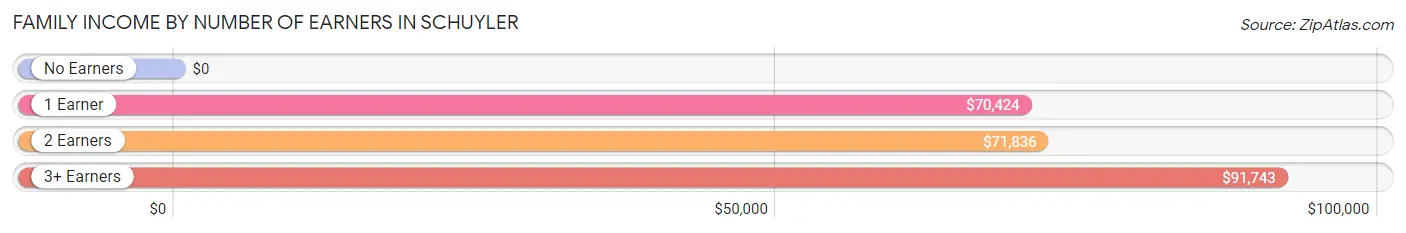
| Number of Earners | # Families | Median Income |
| No Earners | 0 (0.0%) | $0 |
| 1 Earner | 579 (36.3%) | $70,424 |
| 2 Earners | 831 (52.1%) | $71,836 |
| 3+ Earners | 185 (11.6%) | $91,743 |
| Total | 1,595 (100.0%) | $71,231 |
Household Income in Schuyler
Household Income Brackets in Schuyler
With 507 households falling in the category, the $50,000 to $74,999 income range is the most frequent in Schuyler, accounting for 25.5% of all households.
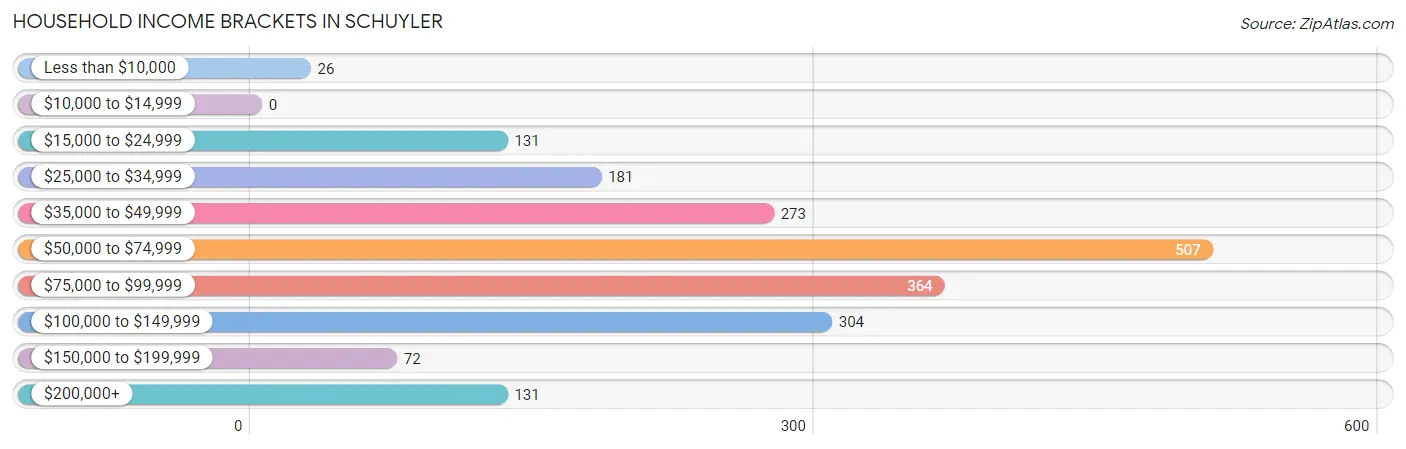
| Income Bracket | # Households | % Households |
| Less than $10,000 | 26 | 1.3% |
| $10,000 to $14,999 | 0 | 0.0% |
| $15,000 to $24,999 | 131 | 6.6% |
| $25,000 to $34,999 | 181 | 9.1% |
| $35,000 to $49,999 | 273 | 13.7% |
| $50,000 to $74,999 | 507 | 25.5% |
| $75,000 to $99,999 | 364 | 18.3% |
| $100,000 to $149,999 | 304 | 15.3% |
| $150,000 to $199,999 | 72 | 3.6% |
| $200,000+ | 131 | 6.6% |
Household Income by Householder Age in Schuyler
The median household income in Schuyler is $71,275, with the highest median household income of $72,478 found in the 45 to 64 years age bracket for the primary householder. A total of 1,203 households (60.5%) fall into this category. Meanwhile, the 15 to 24 years age bracket for the primary householder has the lowest median household income of $0, with 135 households (6.8%) in this group.
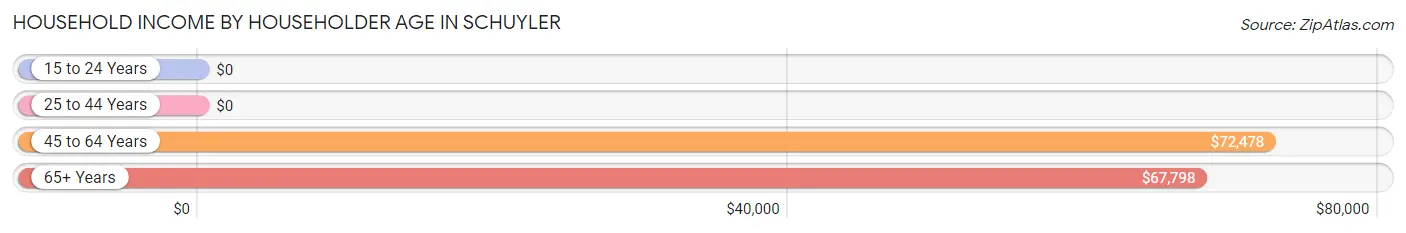
| Income Bracket | # Households | Median Income |
| 15 to 24 Years | 135 (6.8%) | $0 |
| 25 to 44 Years | 407 (20.4%) | $0 |
| 45 to 64 Years | 1,203 (60.5%) | $72,478 |
| 65+ Years | 245 (12.3%) | $67,798 |
| Total | 1,990 (100.0%) | $71,275 |
Poverty in Schuyler
Income Below Poverty by Sex and Age in Schuyler
With 12.9% poverty level for males and 8.6% for females among the residents of Schuyler, 6 to 11 year old males and 45 to 54 year old females are the most vulnerable to poverty, with 126 males (52.5%) and 119 females (29.9%) in their respective age groups living below the poverty level.
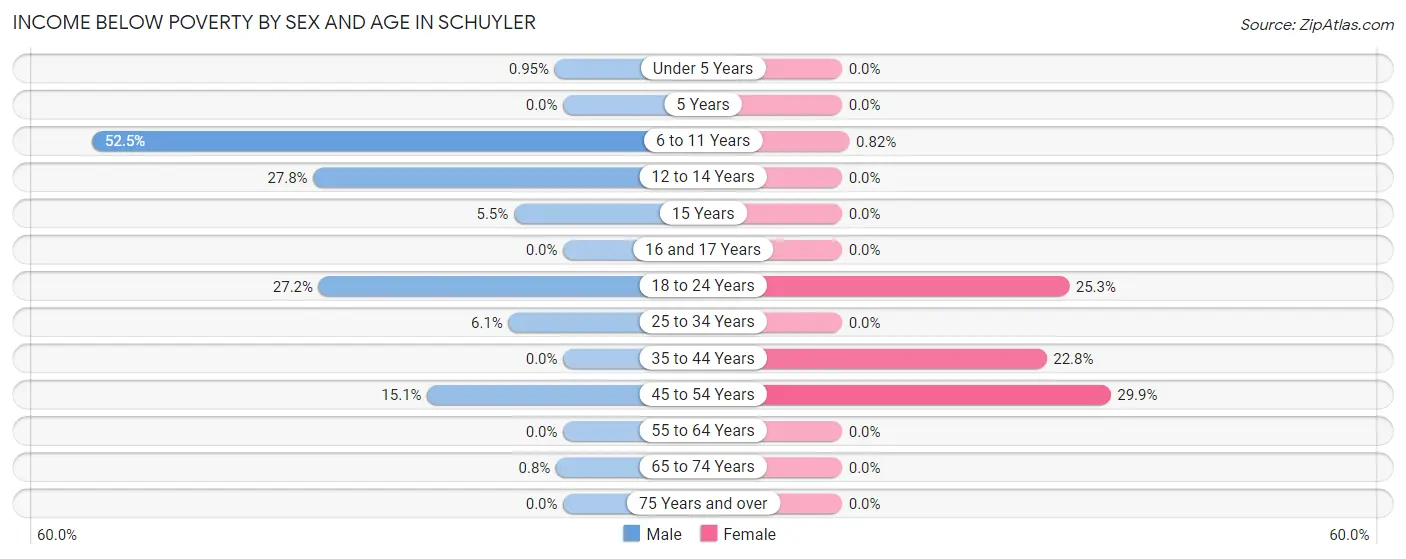
| Age Bracket | Male | Female |
| Under 5 Years | 2 (0.9%) | 0 (0.0%) |
| 5 Years | 0 (0.0%) | 0 (0.0%) |
| 6 to 11 Years | 126 (52.5%) | 4 (0.8%) |
| 12 to 14 Years | 64 (27.8%) | 0 (0.0%) |
| 15 Years | 4 (5.5%) | 0 (0.0%) |
| 16 and 17 Years | 0 (0.0%) | 0 (0.0%) |
| 18 to 24 Years | 110 (27.2%) | 45 (25.3%) |
| 25 to 34 Years | 22 (6.1%) | 0 (0.0%) |
| 35 to 44 Years | 0 (0.0%) | 79 (22.8%) |
| 45 to 54 Years | 121 (15.1%) | 119 (29.9%) |
| 55 to 64 Years | 0 (0.0%) | 0 (0.0%) |
| 65 to 74 Years | 2 (0.8%) | 0 (0.0%) |
| 75 Years and over | 0 (0.0%) | 0 (0.0%) |
| Total | 451 (12.9%) | 247 (8.6%) |
Income Above Poverty by Sex and Age in Schuyler
According to the poverty statistics in Schuyler, males aged 5 years and females aged under 5 years are the age groups that are most secure financially, with 100.0% of males and 100.0% of females in these age groups living above the poverty line.
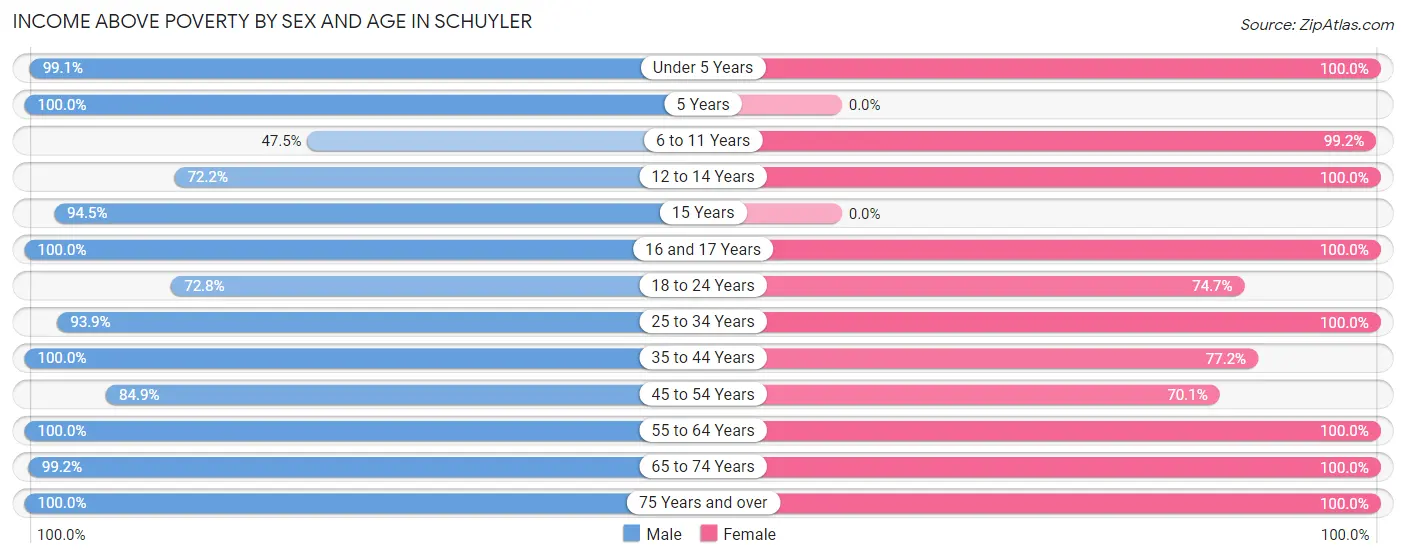
| Age Bracket | Male | Female |
| Under 5 Years | 208 (99.1%) | 331 (100.0%) |
| 5 Years | 60 (100.0%) | 0 (0.0%) |
| 6 to 11 Years | 114 (47.5%) | 482 (99.2%) |
| 12 to 14 Years | 166 (72.2%) | 213 (100.0%) |
| 15 Years | 69 (94.5%) | 0 (0.0%) |
| 16 and 17 Years | 176 (100.0%) | 8 (100.0%) |
| 18 to 24 Years | 294 (72.8%) | 133 (74.7%) |
| 25 to 34 Years | 339 (93.9%) | 324 (100.0%) |
| 35 to 44 Years | 236 (100.0%) | 268 (77.2%) |
| 45 to 54 Years | 678 (84.9%) | 279 (70.1%) |
| 55 to 64 Years | 397 (100.0%) | 364 (100.0%) |
| 65 to 74 Years | 247 (99.2%) | 179 (100.0%) |
| 75 Years and over | 60 (100.0%) | 27 (100.0%) |
| Total | 3,044 (87.1%) | 2,608 (91.3%) |
Income Below Poverty Among Married-Couple Families in Schuyler
The poverty statistics for married-couple families in Schuyler show that 11.7% or 121 of the total 1,035 families live below the poverty line. Families with 3 or 4 children have the highest poverty rate of 43.2%, comprising of 121 families. On the other hand, families with no children have the lowest poverty rate of 0.0%, which includes 0 families.
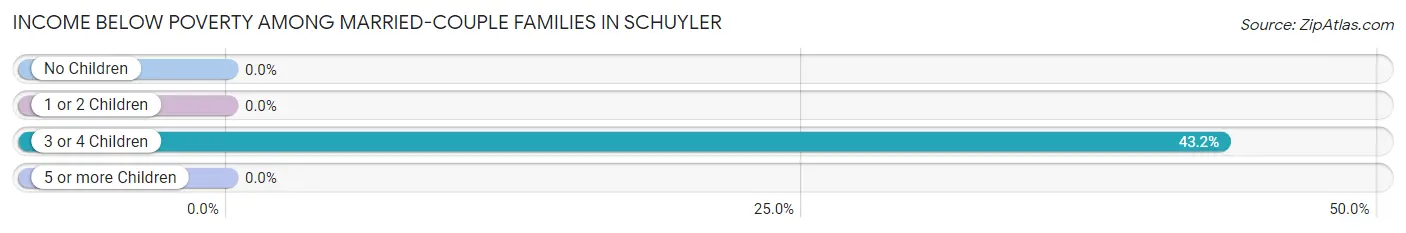
| Children | Above Poverty | Below Poverty |
| No Children | 566 (100.0%) | 0 (0.0%) |
| 1 or 2 Children | 189 (100.0%) | 0 (0.0%) |
| 3 or 4 Children | 159 (56.8%) | 121 (43.2%) |
| 5 or more Children | 0 (0.0%) | 0 (0.0%) |
| Total | 914 (88.3%) | 121 (11.7%) |
Income Below Poverty Among Single-Parent Households in Schuyler
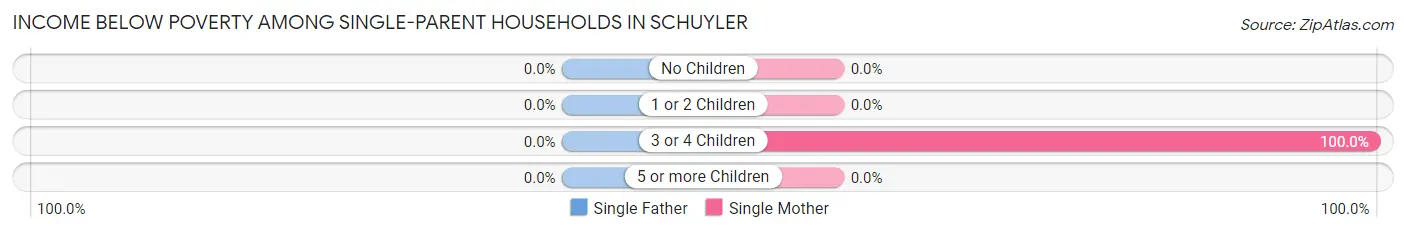
| Children | Single Father | Single Mother |
| No Children | 0 (0.0%) | 0 (0.0%) |
| 1 or 2 Children | 0 (0.0%) | 0 (0.0%) |
| 3 or 4 Children | 0 (0.0%) | 6 (100.0%) |
| 5 or more Children | 0 (0.0%) | 0 (0.0%) |
| Total | 0 (0.0%) | 6 (3.2%) |
Income Below Poverty Among Married-Couple vs Single-Parent Households in Schuyler
The poverty data for Schuyler shows that 121 of the married-couple family households (11.7%) and 6 of the single-parent households (1.1%) are living below the poverty level. Within the married-couple family households, those with 3 or 4 children have the highest poverty rate, with 121 households (43.2%) falling below the poverty line. Among the single-parent households, those with 3 or 4 children have the highest poverty rate, with 6 household (40.0%) living below poverty.
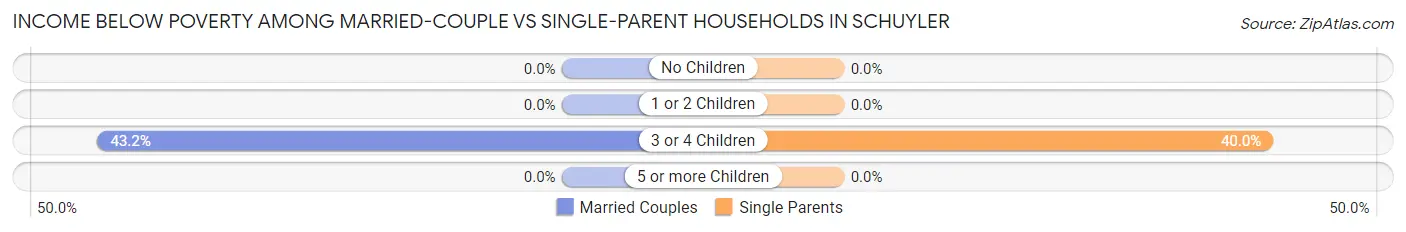
| Children | Married-Couple Families | Single-Parent Households |
| No Children | 0 (0.0%) | 0 (0.0%) |
| 1 or 2 Children | 0 (0.0%) | 0 (0.0%) |
| 3 or 4 Children | 121 (43.2%) | 6 (40.0%) |
| 5 or more Children | 0 (0.0%) | 0 (0.0%) |
| Total | 121 (11.7%) | 6 (1.1%) |
Race in Schuyler
The most populous races in Schuyler are Hispanic or Latino (4,640 | 71.2%), White / Caucasian (2,953 | 45.3%), and Two or more Races (1,402 | 21.5%).
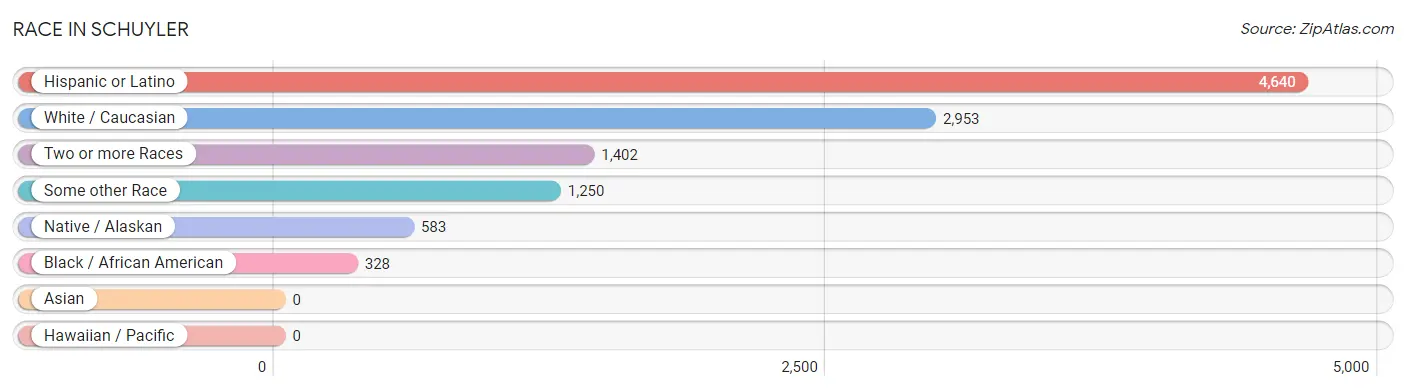
| Race | # Population | % Population |
| Asian | 0 | 0.0% |
| Black / African American | 328 | 5.0% |
| Hawaiian / Pacific | 0 | 0.0% |
| Hispanic or Latino | 4,640 | 71.2% |
| Native / Alaskan | 583 | 8.9% |
| White / Caucasian | 2,953 | 45.3% |
| Two or more Races | 1,402 | 21.5% |
| Some other Race | 1,250 | 19.2% |
| Total | 6,516 | 100.0% |
Ancestry in Schuyler
The most populous ancestries reported in Schuyler are Mexican (2,844 | 43.6%), Central American (1,193 | 18.3%), Guatemalan (1,151 | 17.7%), German (377 | 5.8%), and Subsaharan African (328 | 5.0%), together accounting for 90.4% of all Schuyler residents.
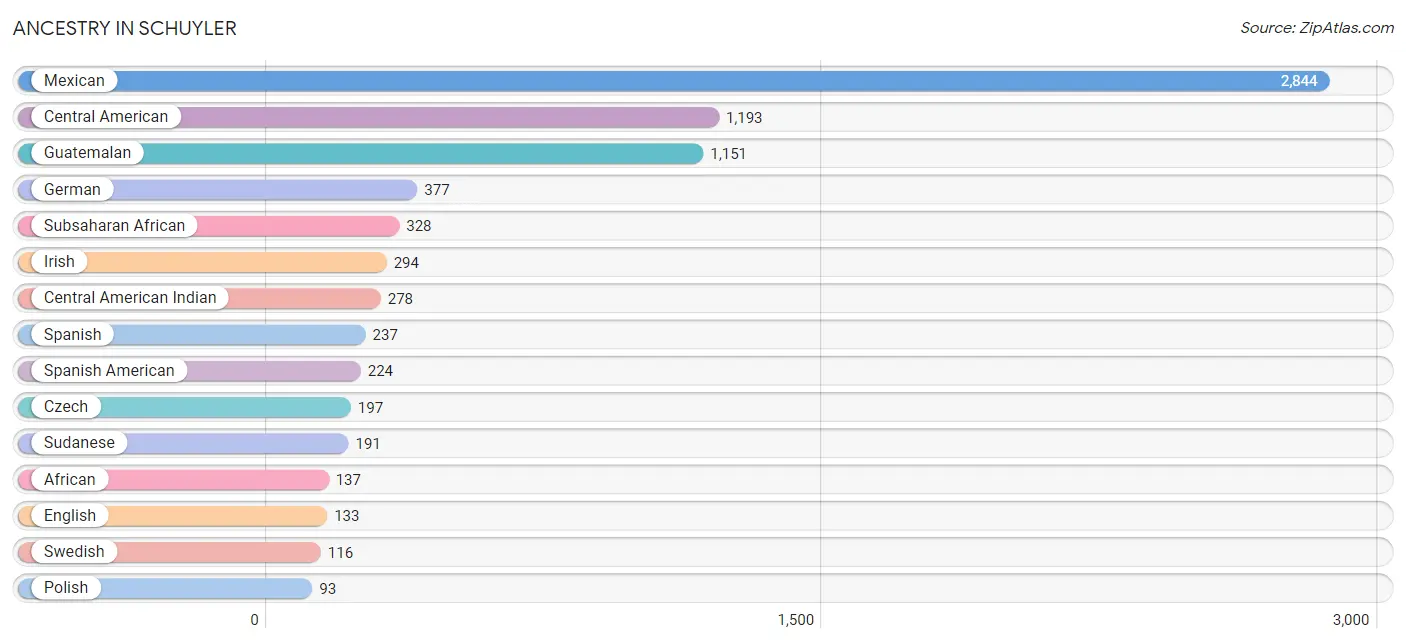
| Ancestry | # Population | % Population |
| African | 137 | 2.1% |
| American | 17 | 0.3% |
| Apache | 39 | 0.6% |
| Central American | 1,193 | 18.3% |
| Central American Indian | 278 | 4.3% |
| Cuban | 23 | 0.4% |
| Czech | 197 | 3.0% |
| Czechoslovakian | 19 | 0.3% |
| Danish | 13 | 0.2% |
| Dutch | 33 | 0.5% |
| English | 133 | 2.0% |
| German | 377 | 5.8% |
| Guatemalan | 1,151 | 17.7% |
| Irish | 294 | 4.5% |
| Korean | 64 | 1.0% |
| Mexican | 2,844 | 43.6% |
| Mexican American Indian | 10 | 0.2% |
| Norwegian | 17 | 0.3% |
| Polish | 93 | 1.4% |
| Salvadoran | 42 | 0.6% |
| Sioux | 47 | 0.7% |
| Slovak | 17 | 0.3% |
| Spaniard | 39 | 0.6% |
| Spanish | 237 | 3.6% |
| Spanish American | 224 | 3.4% |
| Subsaharan African | 328 | 5.0% |
| Sudanese | 191 | 2.9% |
| Swedish | 116 | 1.8% |
| Welsh | 47 | 0.7% | View All 29 Rows |
Immigrants in Schuyler
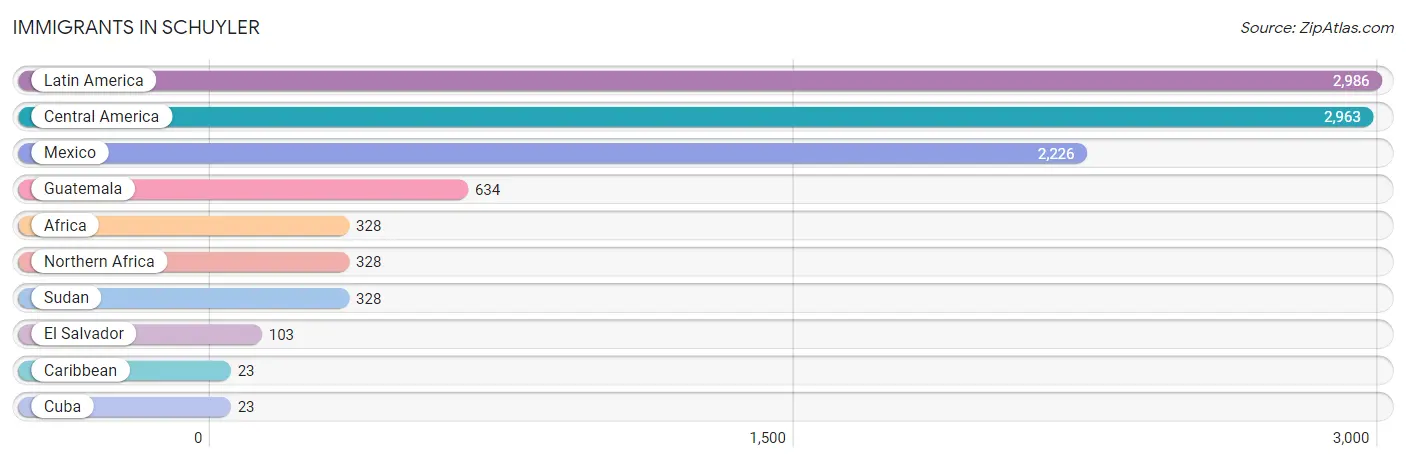
The most numerous immigrant groups reported in Schuyler came from Latin America (2,986 | 45.8%), Central America (2,963 | 45.5%), Mexico (2,226 | 34.2%), Guatemala (634 | 9.7%), and Africa (328 | 5.0%), together accounting for 140.2% of all Schuyler residents.
| Immigration Origin | # Population | % Population |
| Africa | 328 | 5.0% |
| Caribbean | 23 | 0.4% |
| Central America | 2,963 | 45.5% |
| Cuba | 23 | 0.4% |
| El Salvador | 103 | 1.6% |
| Guatemala | 634 | 9.7% |
| Latin America | 2,986 | 45.8% |
| Mexico | 2,226 | 34.2% |
| Northern Africa | 328 | 5.0% |
| Sudan | 328 | 5.0% | View All 10 Rows |
Sex and Age in Schuyler
Sex and Age in Schuyler
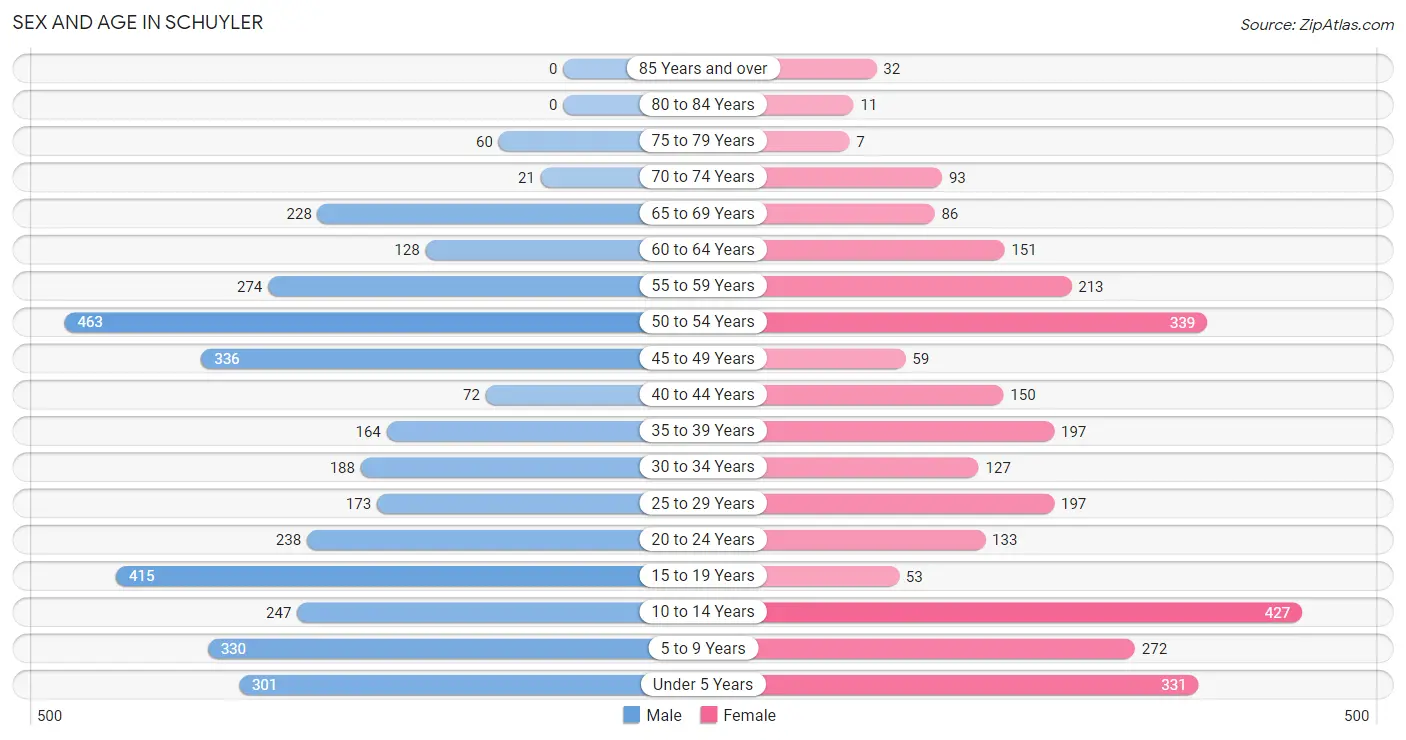
The most populous age groups in Schuyler are 50 to 54 Years (463 | 12.7%) for men and 10 to 14 Years (427 | 14.8%) for women.
| Age Bracket | Male | Female |
| Under 5 Years | 301 (8.3%) | 331 (11.5%) |
| 5 to 9 Years | 330 (9.1%) | 272 (9.5%) |
| 10 to 14 Years | 247 (6.8%) | 427 (14.8%) |
| 15 to 19 Years | 415 (11.4%) | 53 (1.8%) |
| 20 to 24 Years | 238 (6.5%) | 133 (4.6%) |
| 25 to 29 Years | 173 (4.8%) | 197 (6.9%) |
| 30 to 34 Years | 188 (5.2%) | 127 (4.4%) |
| 35 to 39 Years | 164 (4.5%) | 197 (6.9%) |
| 40 to 44 Years | 72 (2.0%) | 150 (5.2%) |
| 45 to 49 Years | 336 (9.2%) | 59 (2.1%) |
| 50 to 54 Years | 463 (12.7%) | 339 (11.8%) |
| 55 to 59 Years | 274 (7.5%) | 213 (7.4%) |
| 60 to 64 Years | 128 (3.5%) | 151 (5.2%) |
| 65 to 69 Years | 228 (6.3%) | 86 (3.0%) |
| 70 to 74 Years | 21 (0.6%) | 93 (3.2%) |
| 75 to 79 Years | 60 (1.7%) | 7 (0.2%) |
| 80 to 84 Years | 0 (0.0%) | 11 (0.4%) |
| 85 Years and over | 0 (0.0%) | 32 (1.1%) |
| Total | 3,638 (100.0%) | 2,878 (100.0%) |
Families and Households in Schuyler
Median Family Size in Schuyler
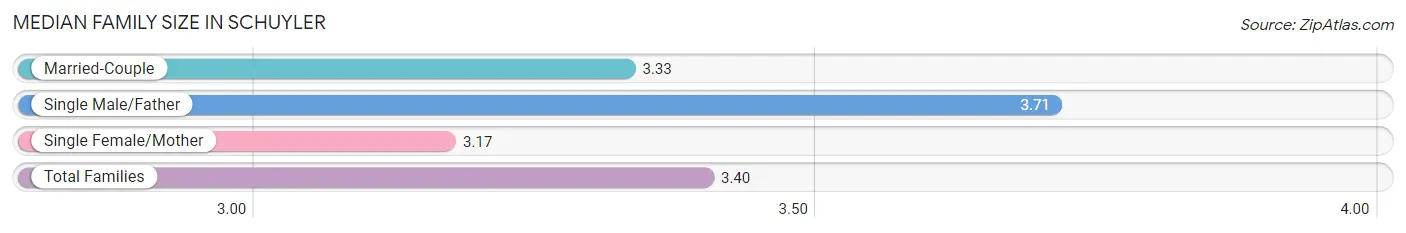
The median family size in Schuyler is 3.40 persons per family, with single male/father families (374 | 23.4%) accounting for the largest median family size of 3.71 persons per family. On the other hand, single female/mother families (186 | 11.7%) represent the smallest median family size with 3.17 persons per family.
| Family Type | # Families | Family Size |
| Married-Couple | 1,035 (64.9%) | 3.33 |
| Single Male/Father | 374 (23.4%) | 3.71 |
| Single Female/Mother | 186 (11.7%) | 3.17 |
| Total Families | 1,595 (100.0%) | 3.40 |
Median Household Size in Schuyler
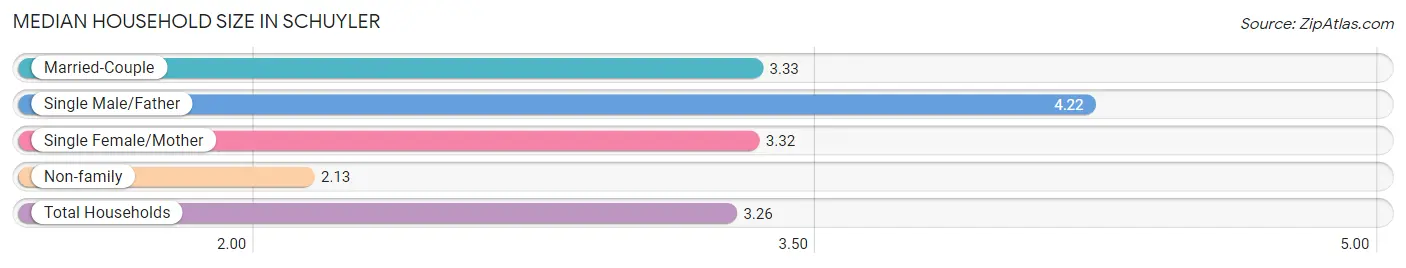
The median household size in Schuyler is 3.26 persons per household, with single male/father households (374 | 18.8%) accounting for the largest median household size of 4.22 persons per household. non-family households (395 | 19.9%) represent the smallest median household size with 2.13 persons per household.
| Household Type | # Households | Household Size |
| Married-Couple | 1,035 (52.0%) | 3.33 |
| Single Male/Father | 374 (18.8%) | 4.22 |
| Single Female/Mother | 186 (9.3%) | 3.32 |
| Non-family | 395 (19.9%) | 2.13 |
| Total Households | 1,990 (100.0%) | 3.26 |
Household Size by Marriage Status in Schuyler
Out of a total of 1,990 households in Schuyler, 1,595 (80.1%) are family households, while 395 (19.9%) are nonfamily households. The most numerous type of family households are 4-person households, comprising 482, and the most common type of nonfamily households are 1-person households, comprising 171.
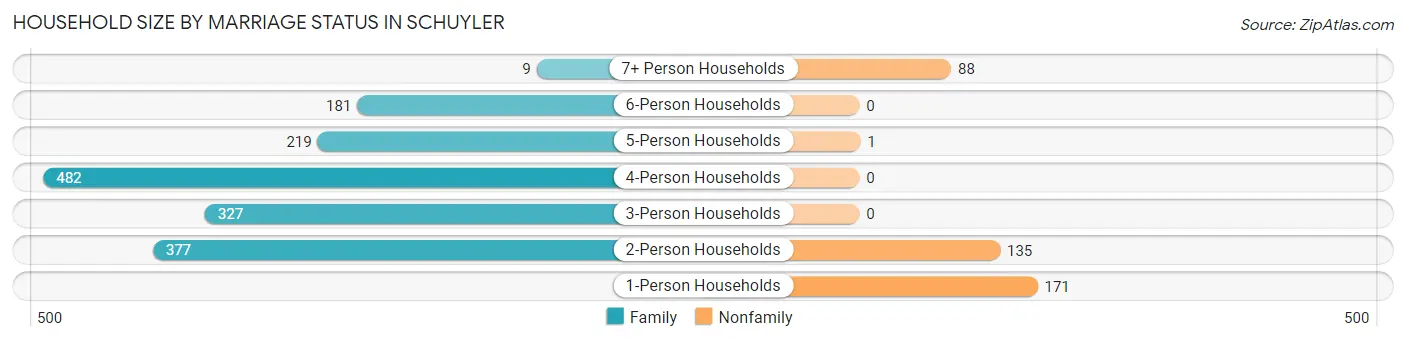
| Household Size | Family Households | Nonfamily Households |
| 1-Person Households | - | 171 (8.6%) |
| 2-Person Households | 377 (18.9%) | 135 (6.8%) |
| 3-Person Households | 327 (16.4%) | 0 (0.0%) |
| 4-Person Households | 482 (24.2%) | 0 (0.0%) |
| 5-Person Households | 219 (11.0%) | 1 (0.1%) |
| 6-Person Households | 181 (9.1%) | 0 (0.0%) |
| 7+ Person Households | 9 (0.4%) | 88 (4.4%) |
| Total | 1,595 (80.1%) | 395 (19.9%) |
Female Fertility in Schuyler
Fertility by Age in Schuyler
Average fertility rate in Schuyler is 156.0 births per 1,000 women. Women in the age bracket of 20 to 34 years have the highest fertility rate with 271.0 births per 1,000 women. Women in the age bracket of 20 to 34 years acount for 67.8% of all women with births.
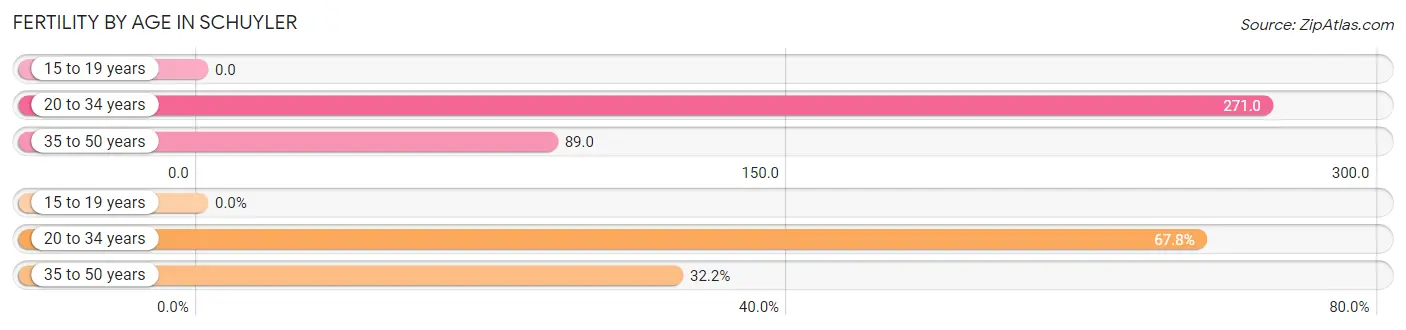
| Age Bracket | Women with Births | Births / 1,000 Women |
| 15 to 19 years | 0 (0.0%) | 0.0 |
| 20 to 34 years | 124 (67.8%) | 271.0 |
| 35 to 50 years | 59 (32.2%) | 89.0 |
| Total | 183 (100.0%) | 156.0 |
Fertility by Age by Marriage Status in Schuyler
53.6% of women with births (183) in Schuyler are married. The highest percentage of unmarried women with births falls into 20 to 34 years age bracket with 68.5% of them unmarried at the time of birth, while the lowest percentage of unmarried women with births belong to 35 to 50 years age bracket with 0.0% of them unmarried.
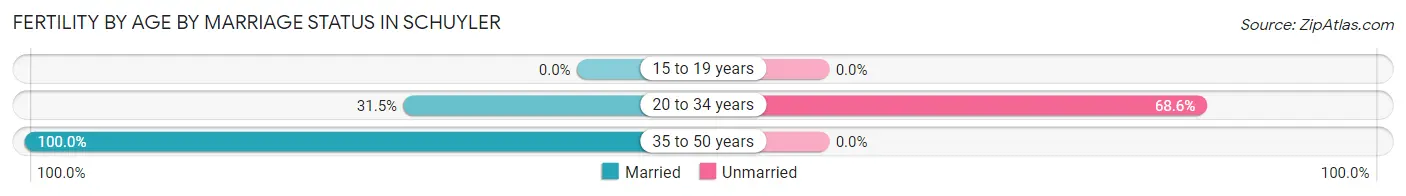
| Age Bracket | Married | Unmarried |
| 15 to 19 years | 0 (0.0%) | 0 (0.0%) |
| 20 to 34 years | 39 (31.5%) | 85 (68.5%) |
| 35 to 50 years | 59 (100.0%) | 0 (0.0%) |
| Total | 98 (53.5%) | 85 (46.5%) |
Fertility by Education in Schuyler
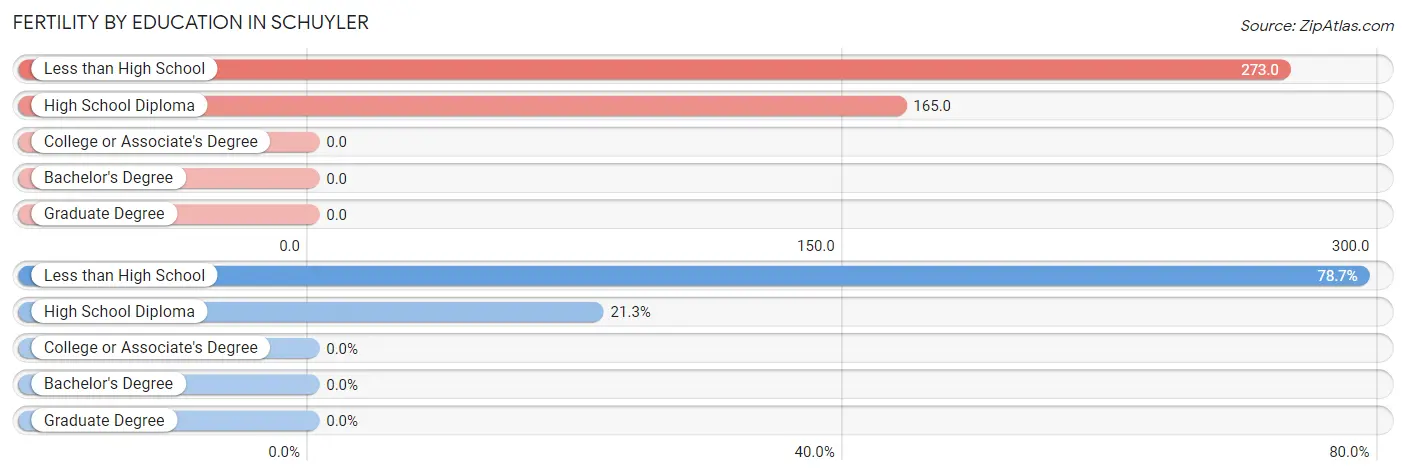
| Educational Attainment | Women with Births | Births / 1,000 Women |
| Less than High School | 144 (78.7%) | 273.0 |
| High School Diploma | 39 (21.3%) | 165.0 |
| College or Associate's Degree | 0 (0.0%) | 0.0 |
| Bachelor's Degree | 0 (0.0%) | 0.0 |
| Graduate Degree | 0 (0.0%) | 0.0 |
| Total | 183 (100.0%) | 156.0 |
Fertility by Education by Marriage Status in Schuyler
46.5% of women with births in Schuyler are unmarried. Women with the educational attainment of high school diploma are most likely to be married with 100.0% of them married at childbirth, while women with the educational attainment of less than high school are least likely to be married with 59.0% of them unmarried at childbirth.
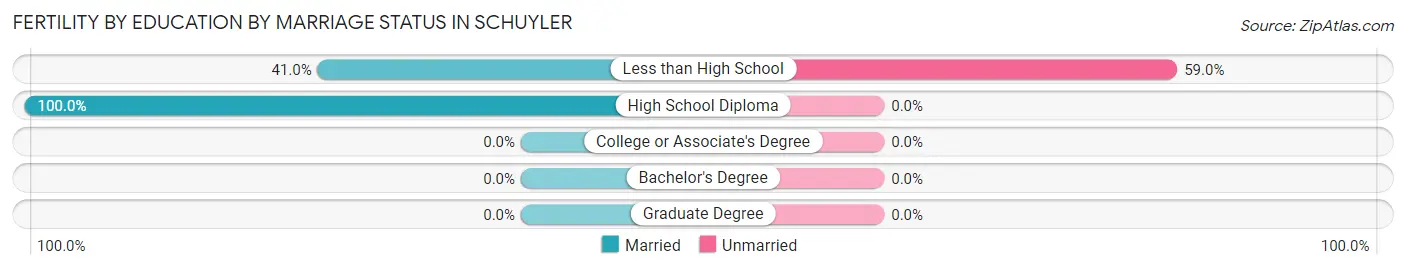
| Educational Attainment | Married | Unmarried |
| Less than High School | 59 (41.0%) | 85 (59.0%) |
| High School Diploma | 39 (100.0%) | 0 (0.0%) |
| College or Associate's Degree | 0 (0.0%) | 0 (0.0%) |
| Bachelor's Degree | 0 (0.0%) | 0 (0.0%) |
| Graduate Degree | 0 (0.0%) | 0 (0.0%) |
| Total | 98 (53.5%) | 85 (46.5%) |
Employment Characteristics in Schuyler
Employment by Class of Employer in Schuyler
Among the 3,262 employed individuals in Schuyler, private company employees (2,651 | 81.3%), federal government employees (257 | 7.9%), and local government employees (162 | 5.0%) make up the most common classes of employment.
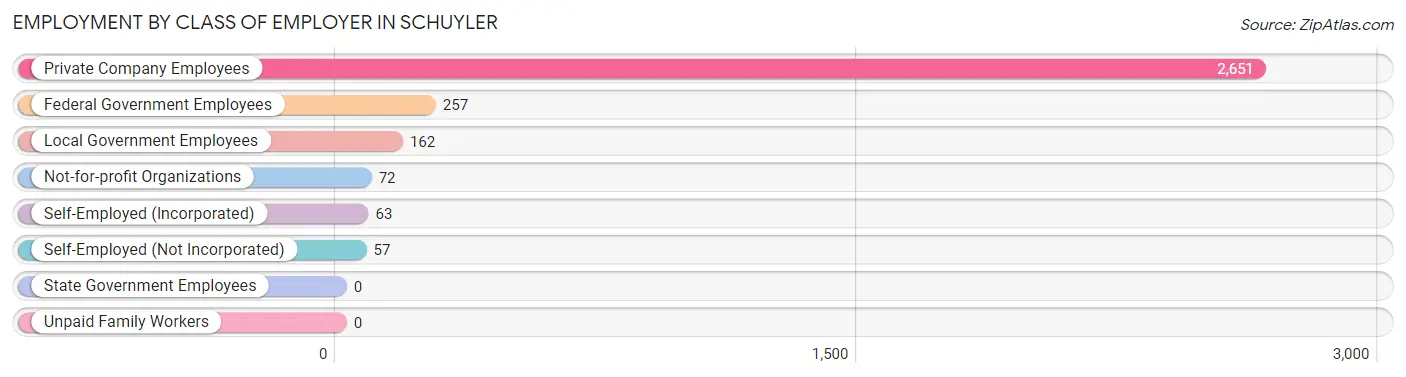
| Employer Class | # Employees | % Employees |
| Private Company Employees | 2,651 | 81.3% |
| Self-Employed (Incorporated) | 63 | 1.9% |
| Self-Employed (Not Incorporated) | 57 | 1.8% |
| Not-for-profit Organizations | 72 | 2.2% |
| Local Government Employees | 162 | 5.0% |
| State Government Employees | 0 | 0.0% |
| Federal Government Employees | 257 | 7.9% |
| Unpaid Family Workers | 0 | 0.0% |
| Total | 3,262 | 100.0% |
Employment Status by Age in Schuyler
According to the labor force statistics for Schuyler, out of the total population over 16 years of age (4,535), 74.7% or 3,388 individuals are in the labor force, with 2.0% or 68 of them unemployed. The age group with the highest labor force participation rate is 20 to 24 years, with 100.0% or 371 individuals in the labor force. Within the labor force, the 55 to 59 years age range has the highest percentage of unemployed individuals, with 12.6% or 45 of them being unemployed.
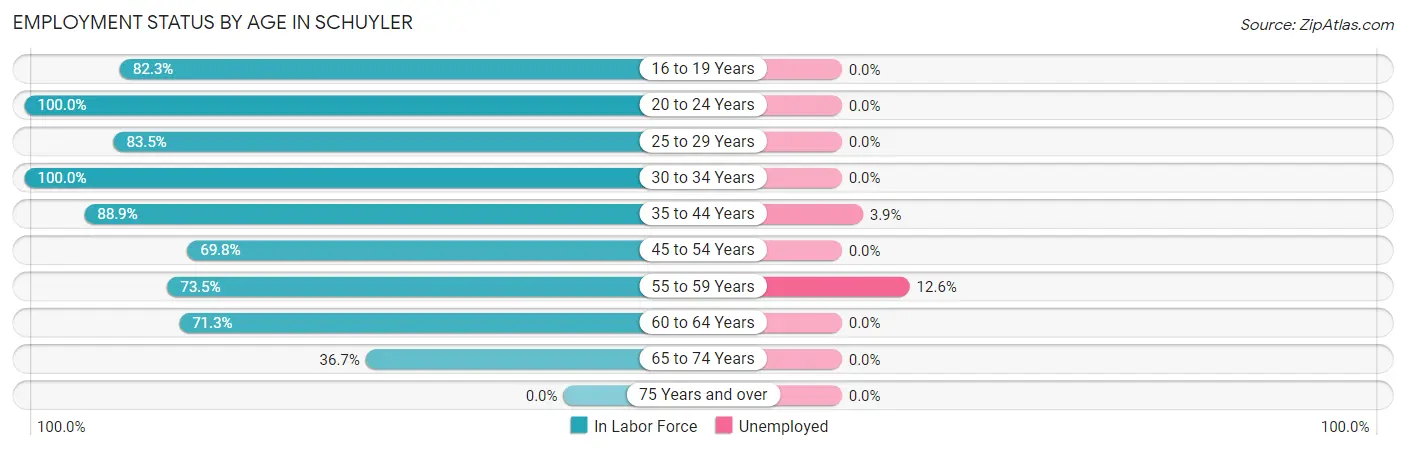
| Age Bracket | In Labor Force | Unemployed |
| 16 to 19 Years | 325 (82.3%) | 0 (0.0%) |
| 20 to 24 Years | 371 (100.0%) | 0 (0.0%) |
| 25 to 29 Years | 309 (83.5%) | 0 (0.0%) |
| 30 to 34 Years | 315 (100.0%) | 0 (0.0%) |
| 35 to 44 Years | 518 (88.9%) | 20 (3.9%) |
| 45 to 54 Years | 836 (69.8%) | 0 (0.0%) |
| 55 to 59 Years | 358 (73.5%) | 45 (12.6%) |
| 60 to 64 Years | 199 (71.3%) | 0 (0.0%) |
| 65 to 74 Years | 157 (36.7%) | 0 (0.0%) |
| 75 Years and over | 0 (0.0%) | 0 (0.0%) |
| Total | 3,388 (74.7%) | 68 (2.0%) |
Employment Status by Educational Attainment in Schuyler
According to labor force statistics for Schuyler, 78.4% of individuals (2,533) out of the total population between 25 and 64 years of age (3,231) are in the labor force, with 2.6% or 66 of them being unemployed. The group with the highest labor force participation rate are those with the educational attainment of college / associate degree, with 99.4% or 780 individuals in the labor force. Within the labor force, individuals with less than high school education have the highest percentage of unemployment, with 6.3% or 65 of them being unemployed.
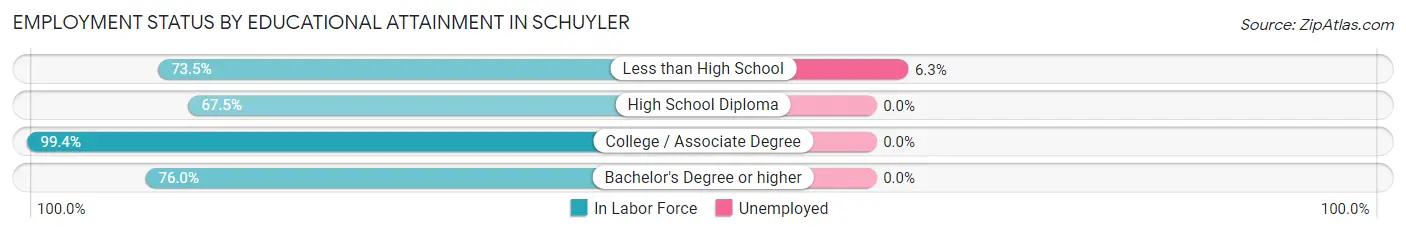
| Educational Attainment | In Labor Force | Unemployed |
| Less than High School | 1,033 (73.5%) | 89 (6.3%) |
| High School Diploma | 562 (67.5%) | 0 (0.0%) |
| College / Associate Degree | 780 (99.4%) | 0 (0.0%) |
| Bachelor's Degree or higher | 158 (76.0%) | 0 (0.0%) |
| Total | 2,533 (78.4%) | 84 (2.6%) |
Employment Occupations by Sex in Schuyler
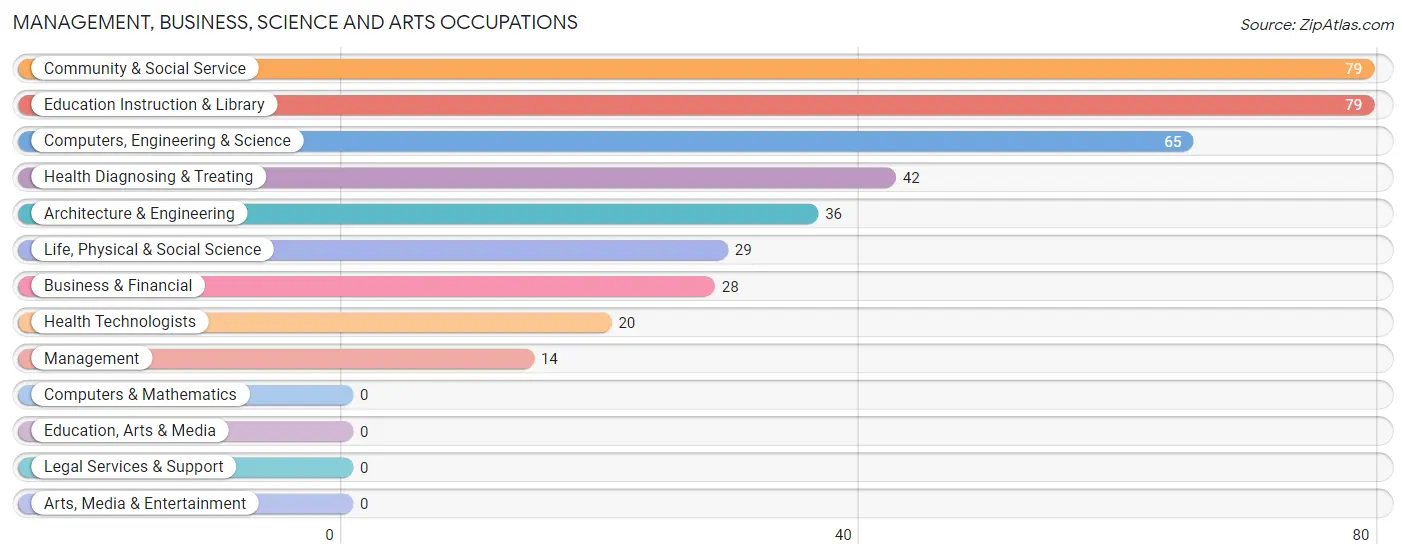
Management, Business, Science and Arts Occupations
The most common Management, Business, Science and Arts occupations in Schuyler are Community & Social Service (79 | 2.4%), Education Instruction & Library (79 | 2.4%), Computers, Engineering & Science (65 | 2.0%), Health Diagnosing & Treating (42 | 1.3%), and Architecture & Engineering (36 | 1.1%).
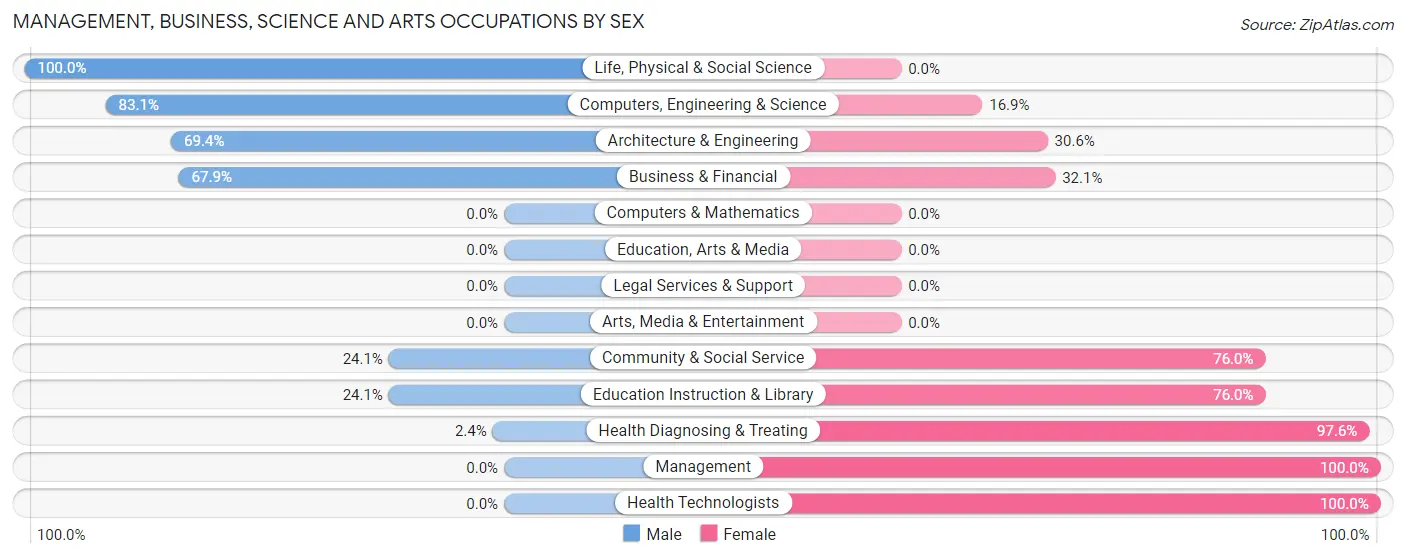
Management, Business, Science and Arts Occupations by Sex
Within the Management, Business, Science and Arts occupations in Schuyler, the most male-oriented occupations are Life, Physical & Social Science (100.0%), Computers, Engineering & Science (83.1%), and Architecture & Engineering (69.4%), while the most female-oriented occupations are Management (100.0%), Health Technologists (100.0%), and Health Diagnosing & Treating (97.6%).
| Occupation | Male | Female |
| Management | 0 (0.0%) | 14 (100.0%) |
| Business & Financial | 19 (67.9%) | 9 (32.1%) |
| Computers, Engineering & Science | 54 (83.1%) | 11 (16.9%) |
| Computers & Mathematics | 0 (0.0%) | 0 (0.0%) |
| Architecture & Engineering | 25 (69.4%) | 11 (30.6%) |
| Life, Physical & Social Science | 29 (100.0%) | 0 (0.0%) |
| Community & Social Service | 19 (24.0%) | 60 (75.9%) |
| Education, Arts & Media | 0 (0.0%) | 0 (0.0%) |
| Legal Services & Support | 0 (0.0%) | 0 (0.0%) |
| Education Instruction & Library | 19 (24.0%) | 60 (75.9%) |
| Arts, Media & Entertainment | 0 (0.0%) | 0 (0.0%) |
| Health Diagnosing & Treating | 1 (2.4%) | 41 (97.6%) |
| Health Technologists | 0 (0.0%) | 20 (100.0%) |
| Total (Category) | 93 (40.8%) | 135 (59.2%) |
| Total (Overall) | 1,997 (61.8%) | 1,236 (38.2%) |
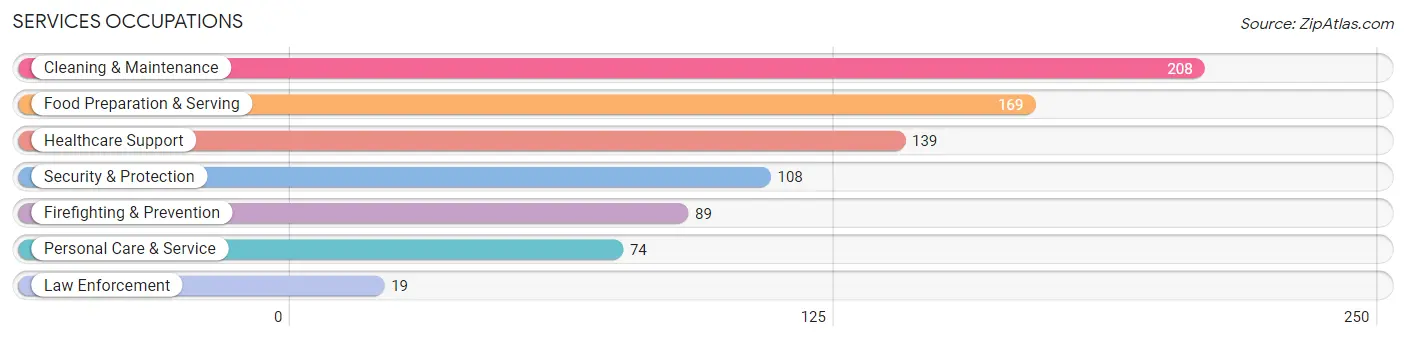
Services Occupations
The most common Services occupations in Schuyler are Cleaning & Maintenance (208 | 6.4%), Food Preparation & Serving (169 | 5.2%), Healthcare Support (139 | 4.3%), Security & Protection (108 | 3.3%), and Firefighting & Prevention (89 | 2.8%).
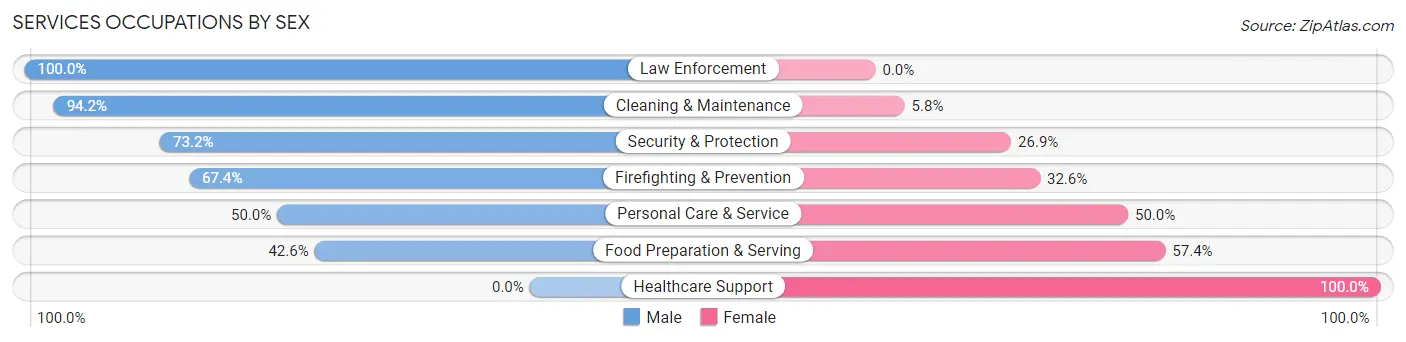
Services Occupations by Sex
Within the Services occupations in Schuyler, the most male-oriented occupations are Law Enforcement (100.0%), Cleaning & Maintenance (94.2%), and Security & Protection (73.2%), while the most female-oriented occupations are Healthcare Support (100.0%), Food Preparation & Serving (57.4%), and Personal Care & Service (50.0%).
| Occupation | Male | Female |
| Healthcare Support | 0 (0.0%) | 139 (100.0%) |
| Security & Protection | 79 (73.2%) | 29 (26.9%) |
| Firefighting & Prevention | 60 (67.4%) | 29 (32.6%) |
| Law Enforcement | 19 (100.0%) | 0 (0.0%) |
| Food Preparation & Serving | 72 (42.6%) | 97 (57.4%) |
| Cleaning & Maintenance | 196 (94.2%) | 12 (5.8%) |
| Personal Care & Service | 37 (50.0%) | 37 (50.0%) |
| Total (Category) | 384 (55.0%) | 314 (45.0%) |
| Total (Overall) | 1,997 (61.8%) | 1,236 (38.2%) |
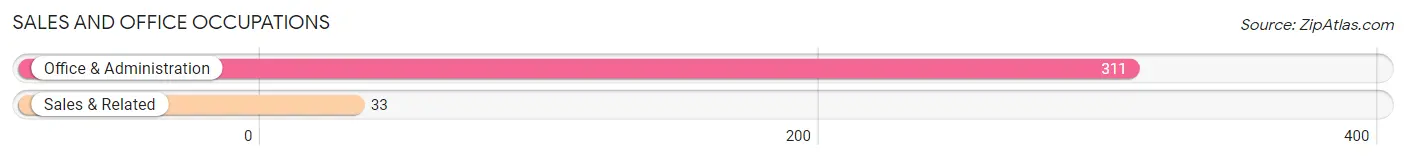
Sales and Office Occupations
The most common Sales and Office occupations in Schuyler are Office & Administration (311 | 9.6%), and Sales & Related (33 | 1.0%).
Sales and Office Occupations by Sex
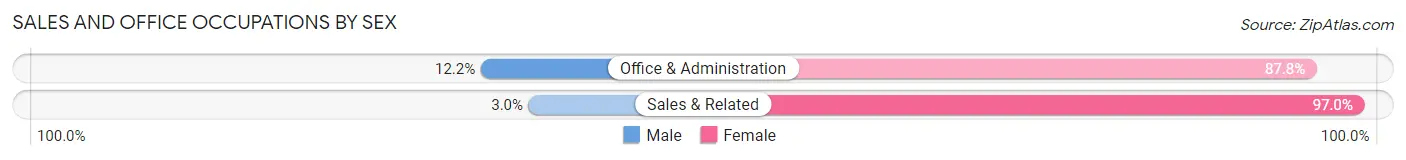
| Occupation | Male | Female |
| Sales & Related | 1 (3.0%) | 32 (97.0%) |
| Office & Administration | 38 (12.2%) | 273 (87.8%) |
| Total (Category) | 39 (11.3%) | 305 (88.7%) |
| Total (Overall) | 1,997 (61.8%) | 1,236 (38.2%) |
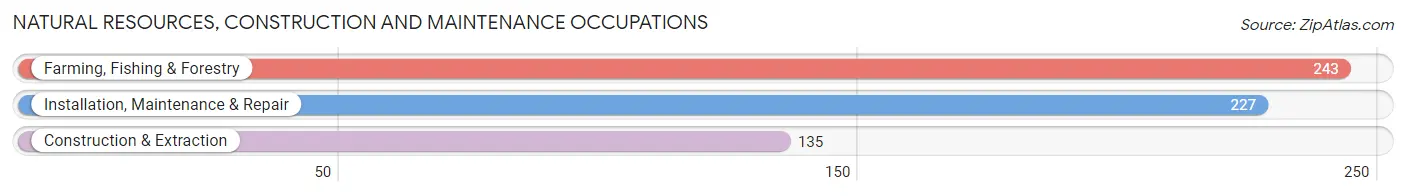
Natural Resources, Construction and Maintenance Occupations
The most common Natural Resources, Construction and Maintenance occupations in Schuyler are Farming, Fishing & Forestry (243 | 7.5%), Installation, Maintenance & Repair (227 | 7.0%), and Construction & Extraction (135 | 4.2%).
Natural Resources, Construction and Maintenance Occupations by Sex
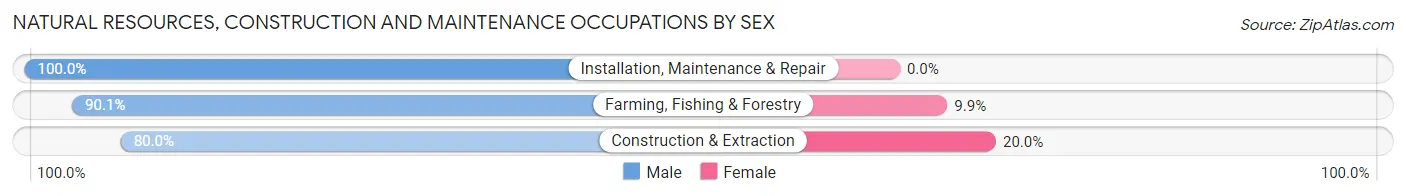
| Occupation | Male | Female |
| Farming, Fishing & Forestry | 219 (90.1%) | 24 (9.9%) |
| Construction & Extraction | 108 (80.0%) | 27 (20.0%) |
| Installation, Maintenance & Repair | 227 (100.0%) | 0 (0.0%) |
| Total (Category) | 554 (91.6%) | 51 (8.4%) |
| Total (Overall) | 1,997 (61.8%) | 1,236 (38.2%) |
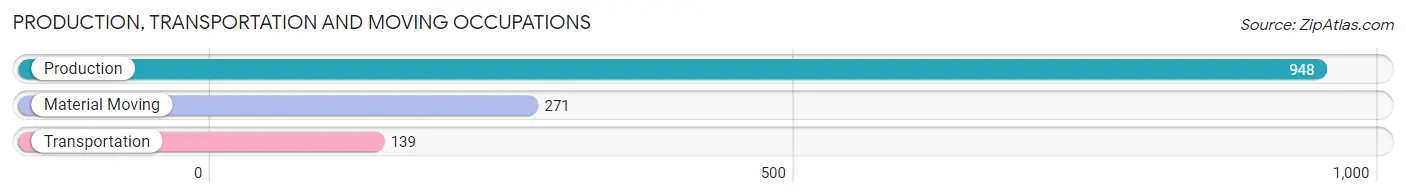
Production, Transportation and Moving Occupations
The most common Production, Transportation and Moving occupations in Schuyler are Production (948 | 29.3%), Material Moving (271 | 8.4%), and Transportation (139 | 4.3%).
Production, Transportation and Moving Occupations by Sex
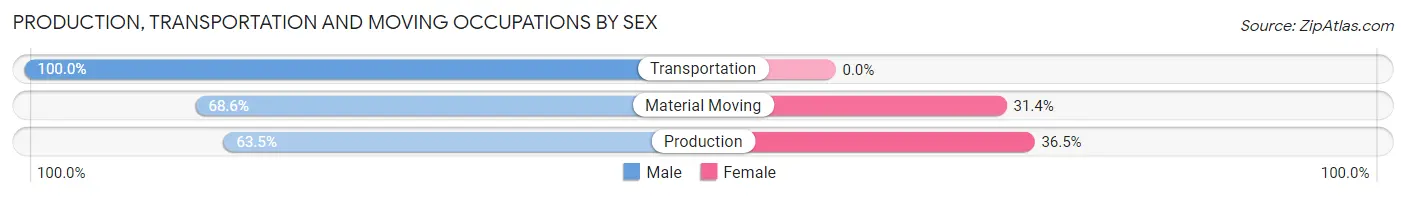
| Occupation | Male | Female |
| Production | 602 (63.5%) | 346 (36.5%) |
| Transportation | 139 (100.0%) | 0 (0.0%) |
| Material Moving | 186 (68.6%) | 85 (31.4%) |
| Total (Category) | 927 (68.3%) | 431 (31.7%) |
| Total (Overall) | 1,997 (61.8%) | 1,236 (38.2%) |
Employment Industries by Sex in Schuyler
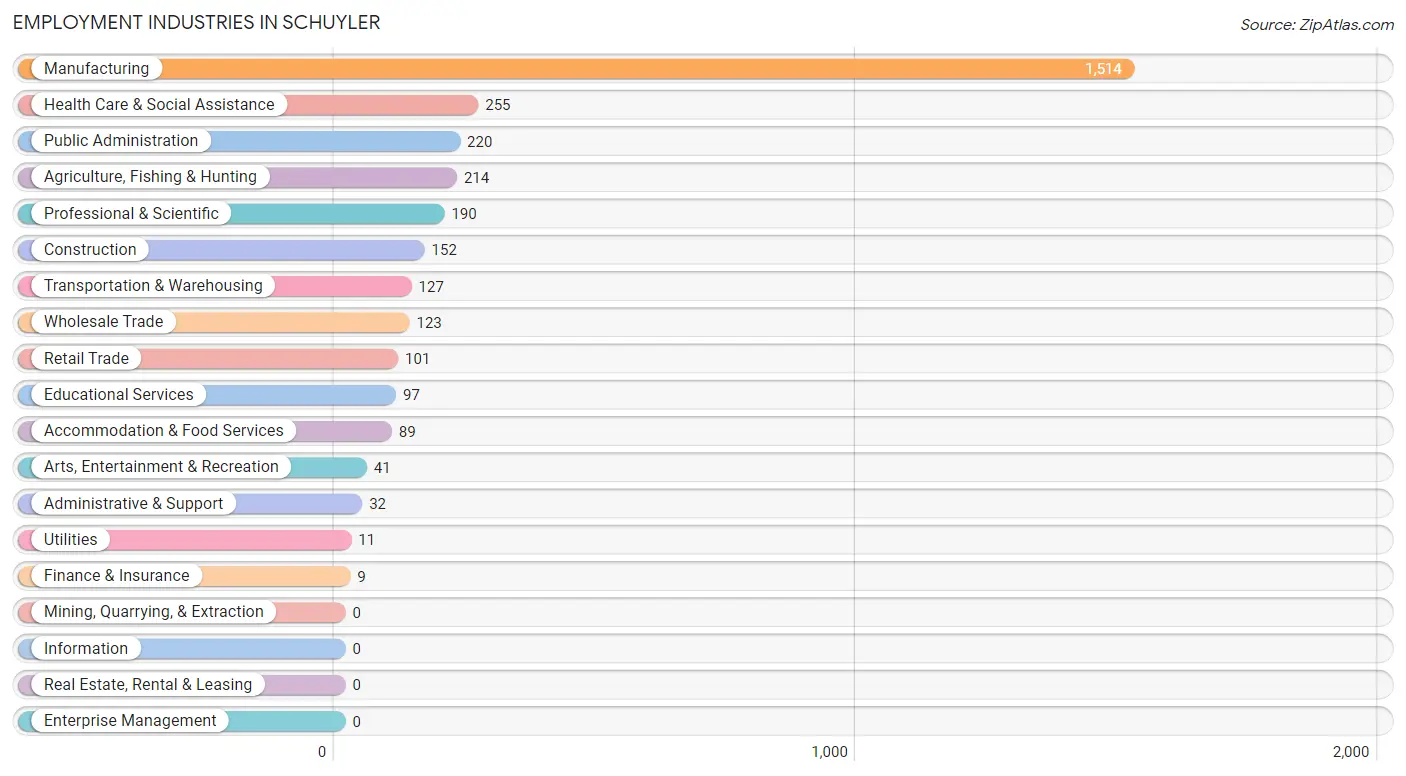
Employment Industries in Schuyler
The major employment industries in Schuyler include Manufacturing (1,514 | 46.8%), Health Care & Social Assistance (255 | 7.9%), Public Administration (220 | 6.8%), Agriculture, Fishing & Hunting (214 | 6.6%), and Professional & Scientific (190 | 5.9%).
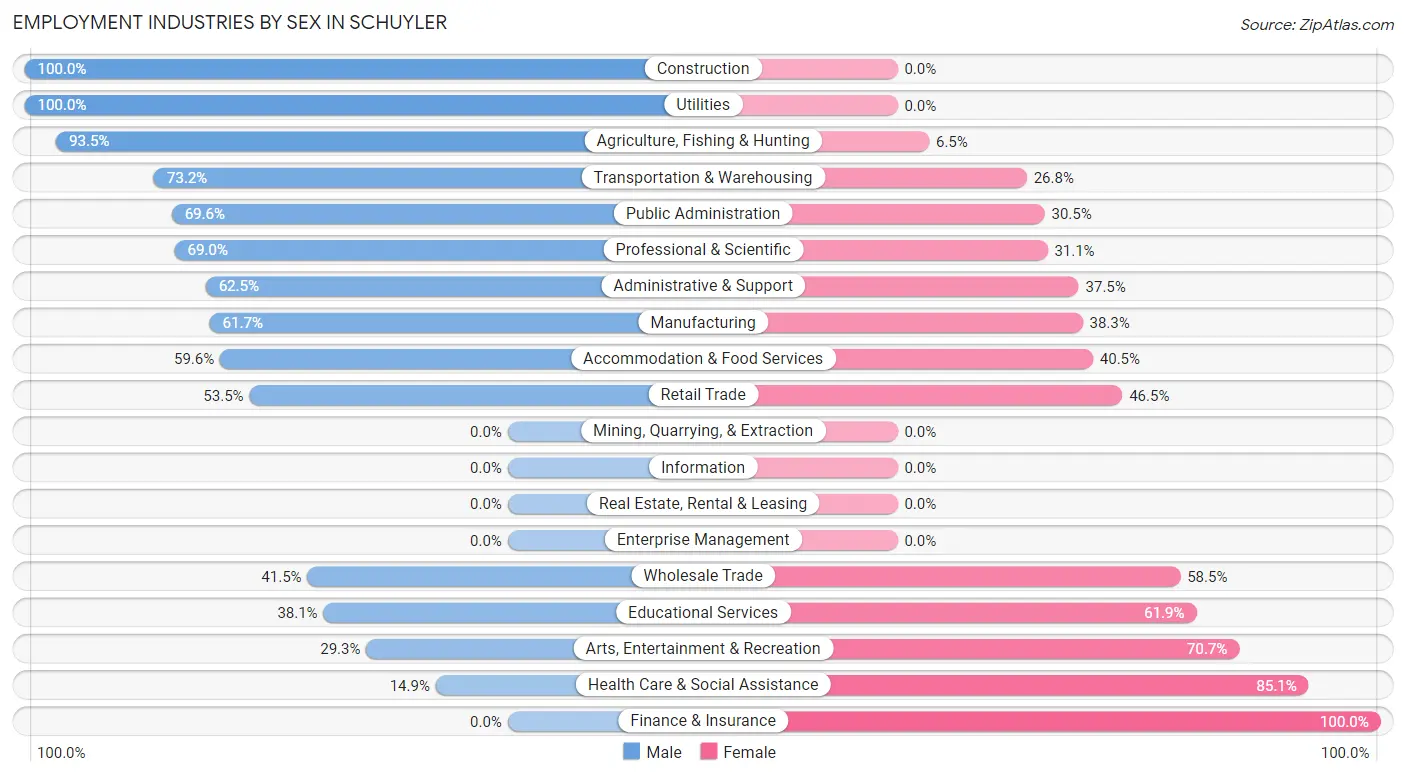
Employment Industries by Sex in Schuyler
The Schuyler industries that see more men than women are Construction (100.0%), Utilities (100.0%), and Agriculture, Fishing & Hunting (93.5%), whereas the industries that tend to have a higher number of women are Finance & Insurance (100.0%), Health Care & Social Assistance (85.1%), and Arts, Entertainment & Recreation (70.7%).
| Industry | Male | Female |
| Agriculture, Fishing & Hunting | 200 (93.5%) | 14 (6.5%) |
| Mining, Quarrying, & Extraction | 0 (0.0%) | 0 (0.0%) |
| Construction | 152 (100.0%) | 0 (0.0%) |
| Manufacturing | 934 (61.7%) | 580 (38.3%) |
| Wholesale Trade | 51 (41.5%) | 72 (58.5%) |
| Retail Trade | 54 (53.5%) | 47 (46.5%) |
| Transportation & Warehousing | 93 (73.2%) | 34 (26.8%) |
| Utilities | 11 (100.0%) | 0 (0.0%) |
| Information | 0 (0.0%) | 0 (0.0%) |
| Finance & Insurance | 0 (0.0%) | 9 (100.0%) |
| Real Estate, Rental & Leasing | 0 (0.0%) | 0 (0.0%) |
| Professional & Scientific | 131 (69.0%) | 59 (31.0%) |
| Enterprise Management | 0 (0.0%) | 0 (0.0%) |
| Administrative & Support | 20 (62.5%) | 12 (37.5%) |
| Educational Services | 37 (38.1%) | 60 (61.9%) |
| Health Care & Social Assistance | 38 (14.9%) | 217 (85.1%) |
| Arts, Entertainment & Recreation | 12 (29.3%) | 29 (70.7%) |
| Accommodation & Food Services | 53 (59.6%) | 36 (40.5%) |
| Public Administration | 153 (69.6%) | 67 (30.4%) |
| Total | 1,997 (61.8%) | 1,236 (38.2%) |
Education in Schuyler
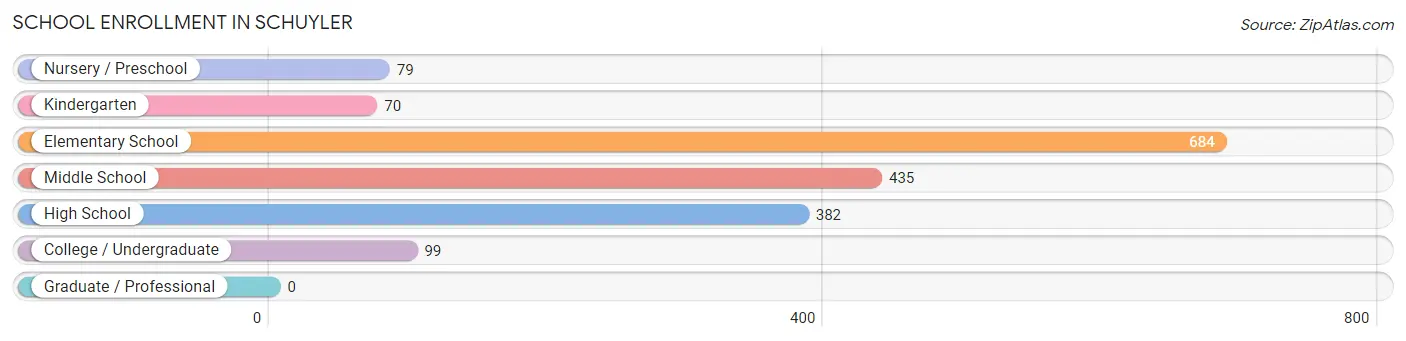
School Enrollment in Schuyler
The most common levels of schooling among the 1,749 students in Schuyler are elementary school (684 | 39.1%), middle school (435 | 24.9%), and high school (382 | 21.8%).
| School Level | # Students | % Students |
| Nursery / Preschool | 79 | 4.5% |
| Kindergarten | 70 | 4.0% |
| Elementary School | 684 | 39.1% |
| Middle School | 435 | 24.9% |
| High School | 382 | 21.8% |
| College / Undergraduate | 99 | 5.7% |
| Graduate / Professional | 0 | 0.0% |
| Total | 1,749 | 100.0% |
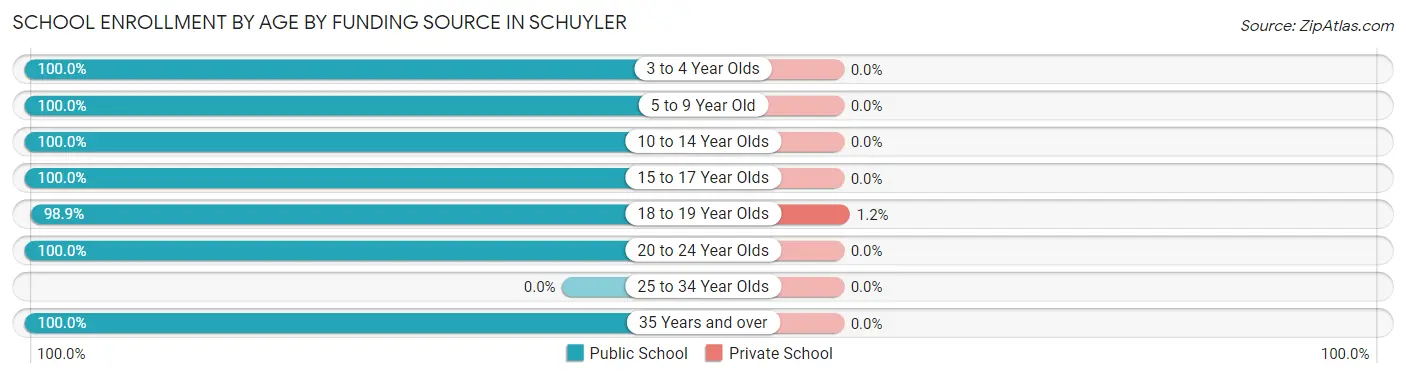
School Enrollment by Age by Funding Source in Schuyler
Out of a total of 1,749 students who are enrolled in schools in Schuyler, 2 (0.1%) attend a private institution, while the remaining 1,747 (99.9%) are enrolled in public schools. The age group of 18 to 19 year olds has the highest likelihood of being enrolled in private schools, with 1 (1.1% in the age bracket) enrolled. Conversely, the age group of 3 to 4 year olds has the lowest likelihood of being enrolled in a private school, with 89 (100.0% in the age bracket) attending a public institution.
| Age Bracket | Public School | Private School |
| 3 to 4 Year Olds | 89 (100.0%) | 0 (0.0%) |
| 5 to 9 Year Old | 555 (100.0%) | 0 (0.0%) |
| 10 to 14 Year Olds | 674 (100.0%) | 0 (0.0%) |
| 15 to 17 Year Olds | 257 (100.0%) | 0 (0.0%) |
| 18 to 19 Year Olds | 86 (98.9%) | 1 (1.1%) |
| 20 to 24 Year Olds | 67 (100.0%) | 0 (0.0%) |
| 25 to 34 Year Olds | 0 (0.0%) | 0 (0.0%) |
| 35 Years and over | 20 (100.0%) | 0 (0.0%) |
| Total | 1,747 (99.9%) | 2 (0.1%) |
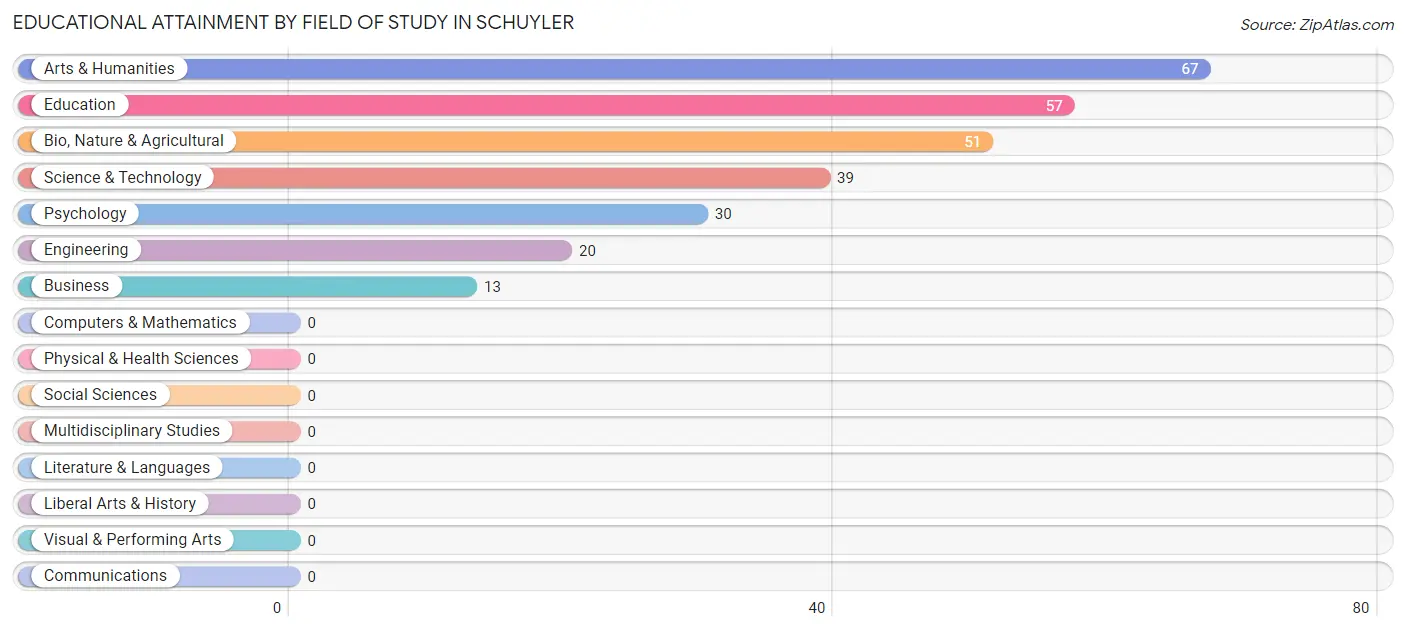
Educational Attainment by Field of Study in Schuyler
Arts & humanities (67 | 24.2%), education (57 | 20.6%), bio, nature & agricultural (51 | 18.4%), science & technology (39 | 14.1%), and psychology (30 | 10.8%) are the most common fields of study among 277 individuals in Schuyler who have obtained a bachelor's degree or higher.
| Field of Study | # Graduates | % Graduates |
| Computers & Mathematics | 0 | 0.0% |
| Bio, Nature & Agricultural | 51 | 18.4% |
| Physical & Health Sciences | 0 | 0.0% |
| Psychology | 30 | 10.8% |
| Social Sciences | 0 | 0.0% |
| Engineering | 20 | 7.2% |
| Multidisciplinary Studies | 0 | 0.0% |
| Science & Technology | 39 | 14.1% |
| Business | 13 | 4.7% |
| Education | 57 | 20.6% |
| Literature & Languages | 0 | 0.0% |
| Liberal Arts & History | 0 | 0.0% |
| Visual & Performing Arts | 0 | 0.0% |
| Communications | 0 | 0.0% |
| Arts & Humanities | 67 | 24.2% |
| Total | 277 | 100.0% |
Transportation & Commute in Schuyler
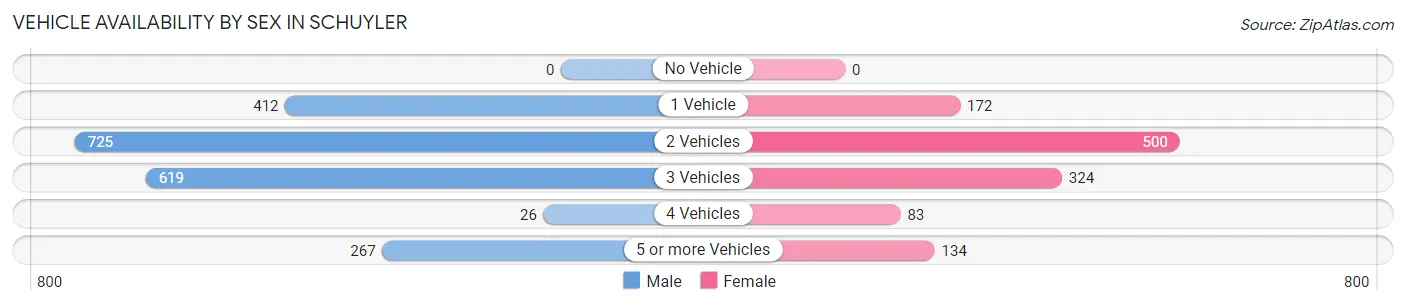
Vehicle Availability by Sex in Schuyler
The most prevalent vehicle ownership categories in Schuyler are males with 2 vehicles (725, accounting for 35.4%) and females with 2 vehicles (500, making up 59.8%).
| Vehicles Available | Male | Female |
| No Vehicle | 0 (0.0%) | 0 (0.0%) |
| 1 Vehicle | 412 (20.1%) | 172 (14.2%) |
| 2 Vehicles | 725 (35.4%) | 500 (41.2%) |
| 3 Vehicles | 619 (30.2%) | 324 (26.7%) |
| 4 Vehicles | 26 (1.3%) | 83 (6.8%) |
| 5 or more Vehicles | 267 (13.0%) | 134 (11.1%) |
| Total | 2,049 (100.0%) | 1,213 (100.0%) |
Commute Time in Schuyler
The most frequently occuring commute durations in Schuyler are 5 to 9 minutes (703 commuters, 21.8%), 20 to 24 minutes (661 commuters, 20.5%), and 10 to 14 minutes (549 commuters, 17.0%).
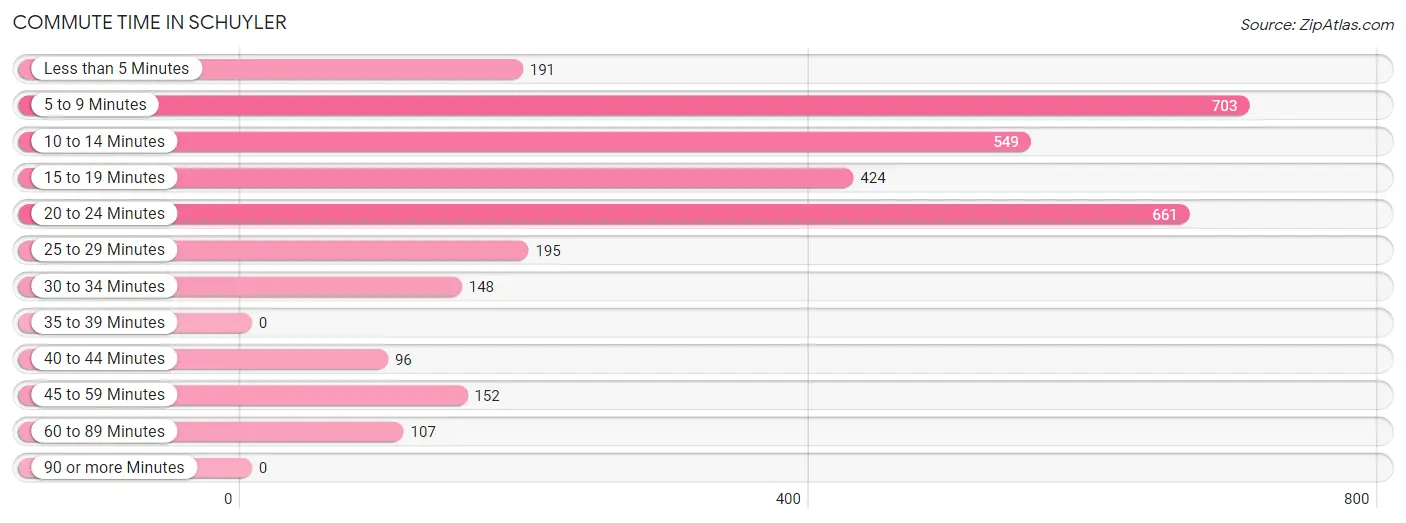
| Commute Time | # Commuters | % Commuters |
| Less than 5 Minutes | 191 | 5.9% |
| 5 to 9 Minutes | 703 | 21.8% |
| 10 to 14 Minutes | 549 | 17.0% |
| 15 to 19 Minutes | 424 | 13.1% |
| 20 to 24 Minutes | 661 | 20.5% |
| 25 to 29 Minutes | 195 | 6.0% |
| 30 to 34 Minutes | 148 | 4.6% |
| 35 to 39 Minutes | 0 | 0.0% |
| 40 to 44 Minutes | 96 | 3.0% |
| 45 to 59 Minutes | 152 | 4.7% |
| 60 to 89 Minutes | 107 | 3.3% |
| 90 or more Minutes | 0 | 0.0% |
Commute Time by Sex in Schuyler
The most common commute times in Schuyler are 5 to 9 minutes (460 commuters, 22.9%) for males and 20 to 24 minutes (353 commuters, 29.1%) for females.
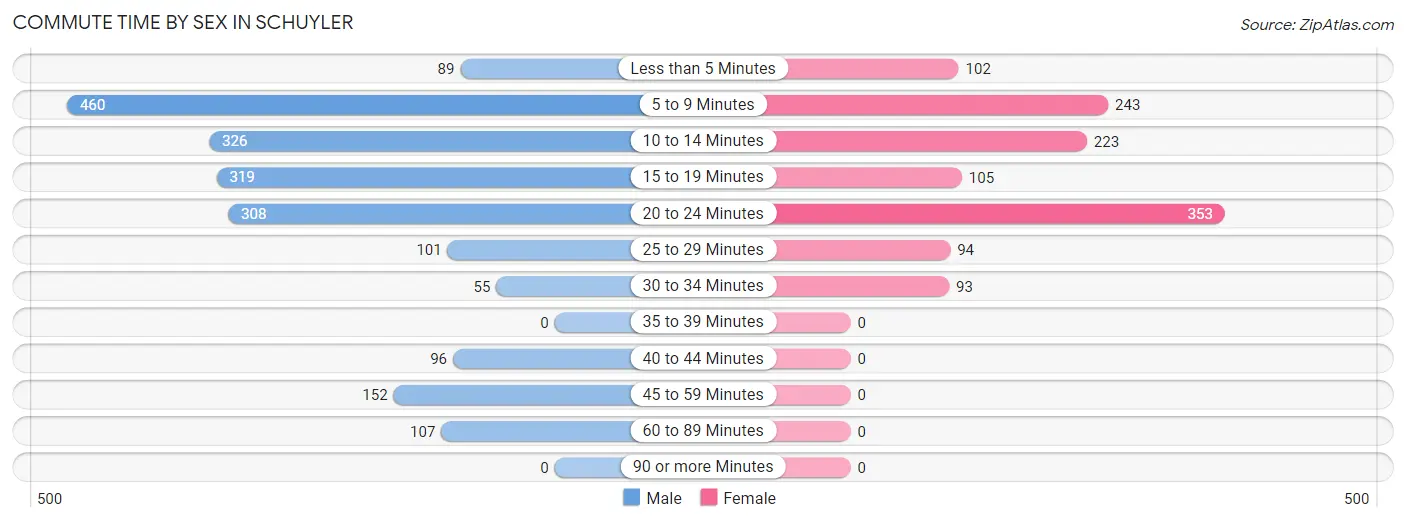
| Commute Time | Male | Female |
| Less than 5 Minutes | 89 (4.4%) | 102 (8.4%) |
| 5 to 9 Minutes | 460 (22.9%) | 243 (20.0%) |
| 10 to 14 Minutes | 326 (16.2%) | 223 (18.4%) |
| 15 to 19 Minutes | 319 (15.9%) | 105 (8.7%) |
| 20 to 24 Minutes | 308 (15.3%) | 353 (29.1%) |
| 25 to 29 Minutes | 101 (5.0%) | 94 (7.7%) |
| 30 to 34 Minutes | 55 (2.7%) | 93 (7.7%) |
| 35 to 39 Minutes | 0 (0.0%) | 0 (0.0%) |
| 40 to 44 Minutes | 96 (4.8%) | 0 (0.0%) |
| 45 to 59 Minutes | 152 (7.5%) | 0 (0.0%) |
| 60 to 89 Minutes | 107 (5.3%) | 0 (0.0%) |
| 90 or more Minutes | 0 (0.0%) | 0 (0.0%) |
Time of Departure to Work by Sex in Schuyler
The most frequent times of departure to work in Schuyler are 12:00 PM to 3:59 PM (556, 27.6%) for males and 7:30 AM to 7:59 AM (228, 18.8%) for females.
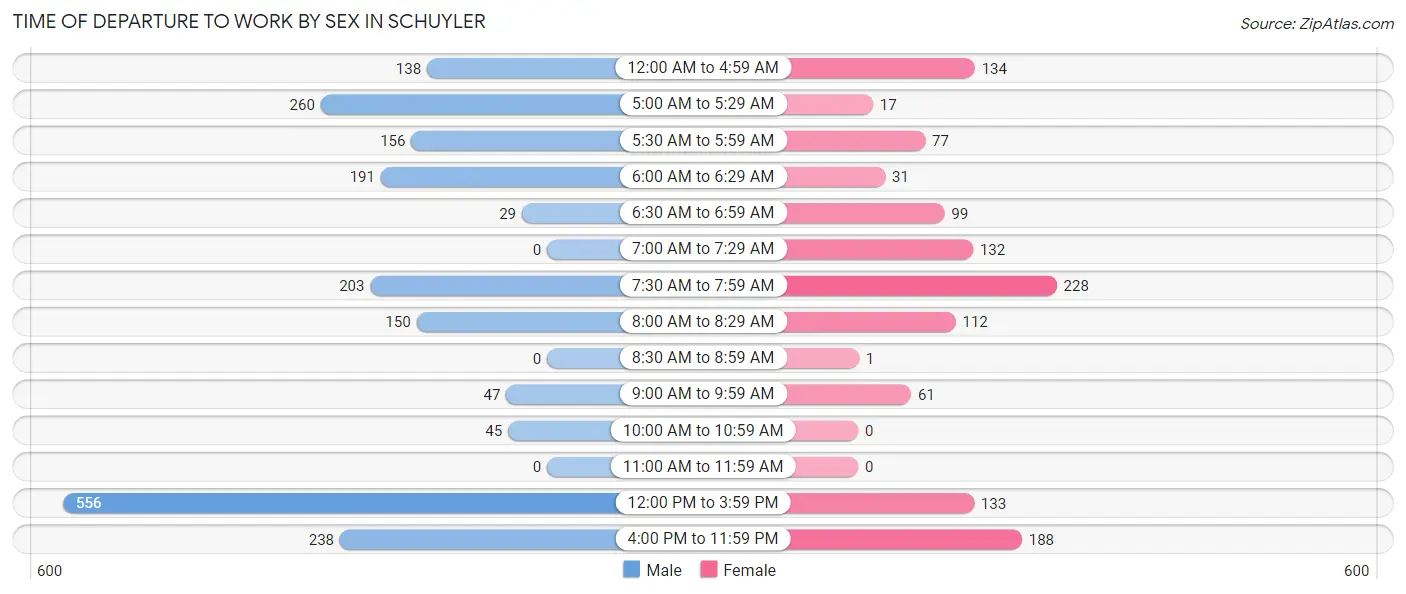
| Time of Departure | Male | Female |
| 12:00 AM to 4:59 AM | 138 (6.9%) | 134 (11.1%) |
| 5:00 AM to 5:29 AM | 260 (12.9%) | 17 (1.4%) |
| 5:30 AM to 5:59 AM | 156 (7.7%) | 77 (6.4%) |
| 6:00 AM to 6:29 AM | 191 (9.5%) | 31 (2.6%) |
| 6:30 AM to 6:59 AM | 29 (1.4%) | 99 (8.2%) |
| 7:00 AM to 7:29 AM | 0 (0.0%) | 132 (10.9%) |
| 7:30 AM to 7:59 AM | 203 (10.1%) | 228 (18.8%) |
| 8:00 AM to 8:29 AM | 150 (7.4%) | 112 (9.2%) |
| 8:30 AM to 8:59 AM | 0 (0.0%) | 1 (0.1%) |
| 9:00 AM to 9:59 AM | 47 (2.3%) | 61 (5.0%) |
| 10:00 AM to 10:59 AM | 45 (2.2%) | 0 (0.0%) |
| 11:00 AM to 11:59 AM | 0 (0.0%) | 0 (0.0%) |
| 12:00 PM to 3:59 PM | 556 (27.6%) | 133 (11.0%) |
| 4:00 PM to 11:59 PM | 238 (11.8%) | 188 (15.5%) |
| Total | 2,013 (100.0%) | 1,213 (100.0%) |
Housing Occupancy in Schuyler
Occupancy by Ownership in Schuyler
Of the total 1,990 dwellings in Schuyler, owner-occupied units account for 1,537 (77.2%), while renter-occupied units make up 453 (22.8%).
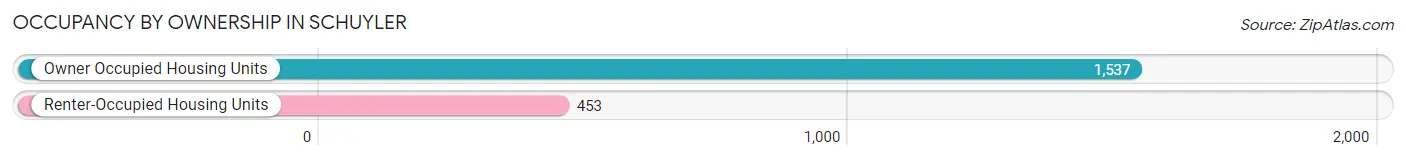
| Occupancy | # Housing Units | % Housing Units |
| Owner Occupied Housing Units | 1,537 | 77.2% |
| Renter-Occupied Housing Units | 453 | 22.8% |
| Total Occupied Housing Units | 1,990 | 100.0% |
Occupancy by Household Size in Schuyler
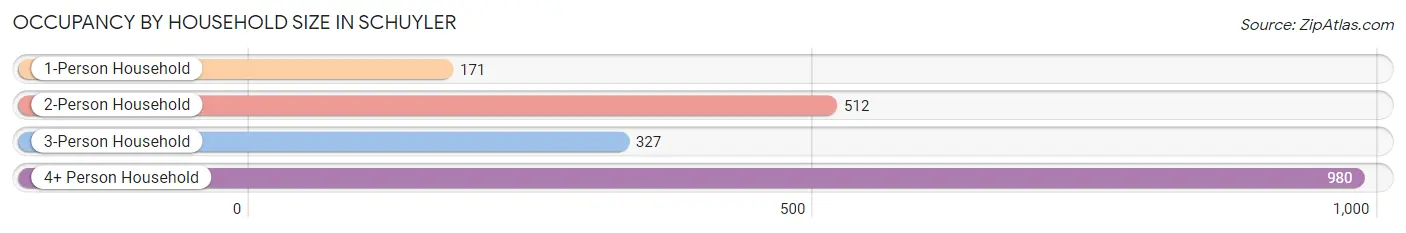
| Household Size | # Housing Units | % Housing Units |
| 1-Person Household | 171 | 8.6% |
| 2-Person Household | 512 | 25.7% |
| 3-Person Household | 327 | 16.4% |
| 4+ Person Household | 980 | 49.2% |
| Total Housing Units | 1,990 | 100.0% |
Occupancy by Ownership by Household Size in Schuyler
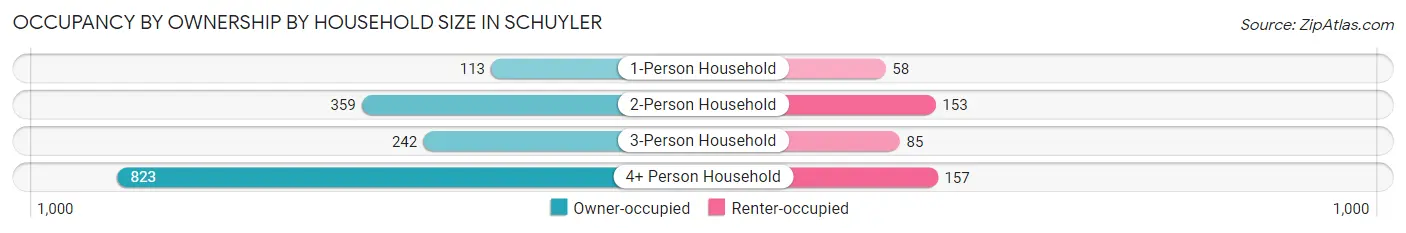
| Household Size | Owner-occupied | Renter-occupied |
| 1-Person Household | 113 (66.1%) | 58 (33.9%) |
| 2-Person Household | 359 (70.1%) | 153 (29.9%) |
| 3-Person Household | 242 (74.0%) | 85 (26.0%) |
| 4+ Person Household | 823 (84.0%) | 157 (16.0%) |
| Total Housing Units | 1,537 (77.2%) | 453 (22.8%) |
Occupancy by Educational Attainment in Schuyler
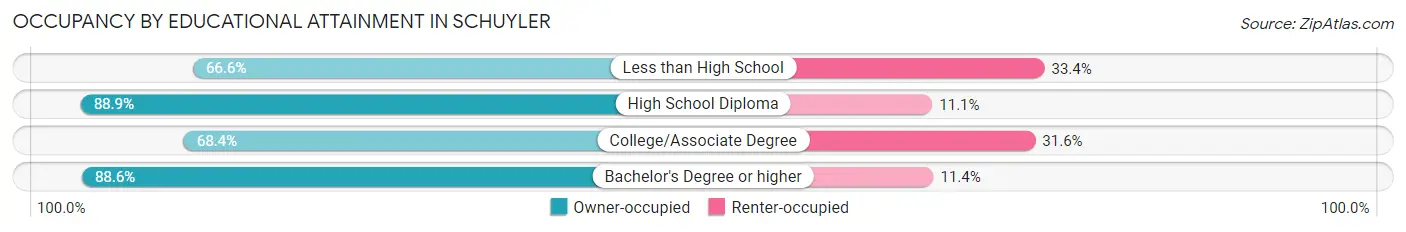
| Household Size | Owner-occupied | Renter-occupied |
| Less than High School | 391 (66.6%) | 196 (33.4%) |
| High School Diploma | 662 (88.9%) | 83 (11.1%) |
| College/Associate Degree | 336 (68.4%) | 155 (31.6%) |
| Bachelor's Degree or higher | 148 (88.6%) | 19 (11.4%) |
Occupancy by Age of Householder in Schuyler
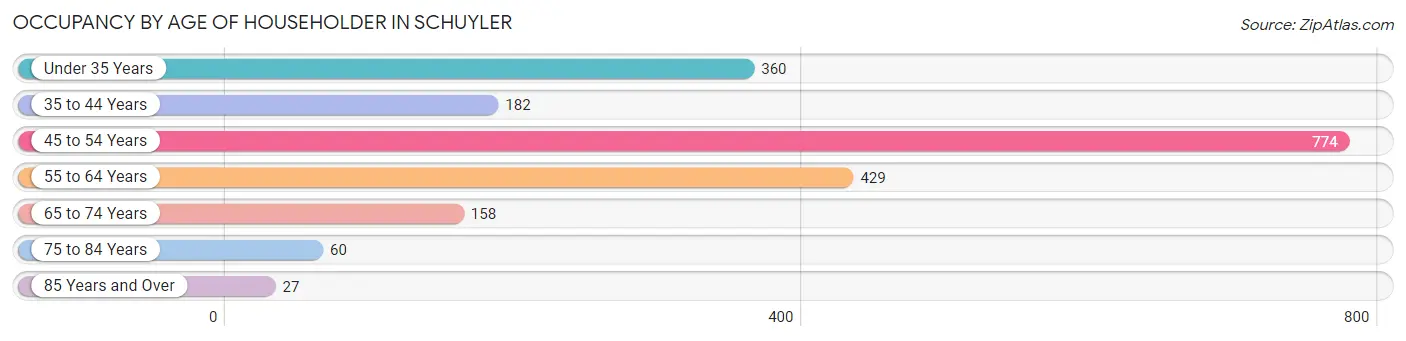
| Age Bracket | # Households | % Households |
| Under 35 Years | 360 | 18.1% |
| 35 to 44 Years | 182 | 9.1% |
| 45 to 54 Years | 774 | 38.9% |
| 55 to 64 Years | 429 | 21.6% |
| 65 to 74 Years | 158 | 7.9% |
| 75 to 84 Years | 60 | 3.0% |
| 85 Years and Over | 27 | 1.4% |
| Total | 1,990 | 100.0% |
Housing Finances in Schuyler
Median Income by Occupancy in Schuyler
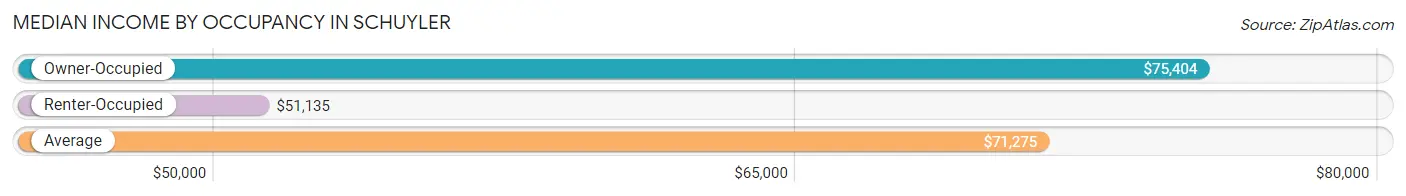
| Occupancy Type | # Households | Median Income |
| Owner-Occupied | 1,537 (77.2%) | $75,404 |
| Renter-Occupied | 453 (22.8%) | $51,135 |
| Average | 1,990 (100.0%) | $71,275 |
Occupancy by Householder Income Bracket in Schuyler
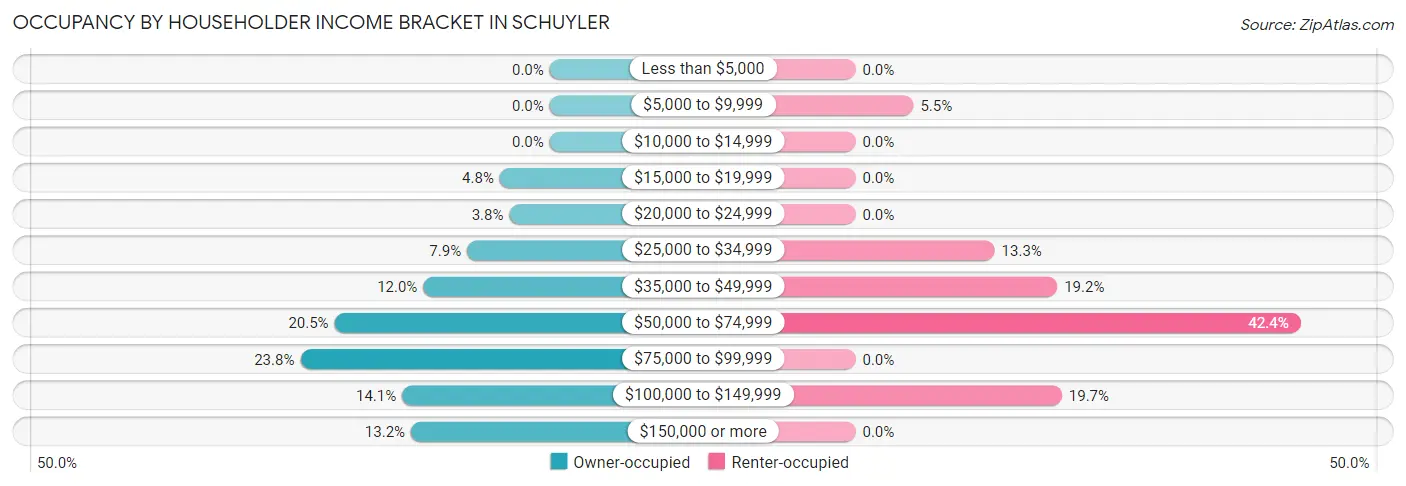
| Income Bracket | Owner-occupied | Renter-occupied |
| Less than $5,000 | 0 (0.0%) | 0 (0.0%) |
| $5,000 to $9,999 | 0 (0.0%) | 25 (5.5%) |
| $10,000 to $14,999 | 0 (0.0%) | 0 (0.0%) |
| $15,000 to $19,999 | 73 (4.8%) | 0 (0.0%) |
| $20,000 to $24,999 | 59 (3.8%) | 0 (0.0%) |
| $25,000 to $34,999 | 121 (7.9%) | 60 (13.3%) |
| $35,000 to $49,999 | 185 (12.0%) | 87 (19.2%) |
| $50,000 to $74,999 | 315 (20.5%) | 192 (42.4%) |
| $75,000 to $99,999 | 365 (23.7%) | 0 (0.0%) |
| $100,000 to $149,999 | 216 (14.1%) | 89 (19.7%) |
| $150,000 or more | 203 (13.2%) | 0 (0.0%) |
| Total | 1,537 (100.0%) | 453 (100.0%) |
Monthly Housing Cost Tiers in Schuyler
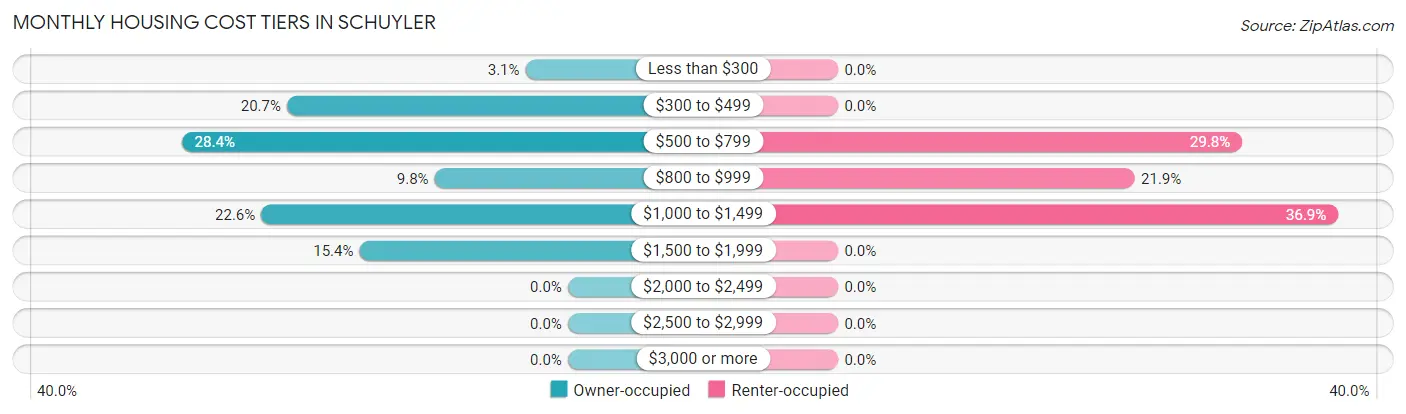
| Monthly Cost | Owner-occupied | Renter-occupied |
| Less than $300 | 48 (3.1%) | 0 (0.0%) |
| $300 to $499 | 318 (20.7%) | 0 (0.0%) |
| $500 to $799 | 437 (28.4%) | 135 (29.8%) |
| $800 to $999 | 151 (9.8%) | 99 (21.8%) |
| $1,000 to $1,499 | 347 (22.6%) | 167 (36.9%) |
| $1,500 to $1,999 | 236 (15.3%) | 0 (0.0%) |
| $2,000 to $2,499 | 0 (0.0%) | 0 (0.0%) |
| $2,500 to $2,999 | 0 (0.0%) | 0 (0.0%) |
| $3,000 or more | 0 (0.0%) | 0 (0.0%) |
| Total | 1,537 (100.0%) | 453 (100.0%) |
Physical Housing Characteristics in Schuyler
Housing Structures in Schuyler
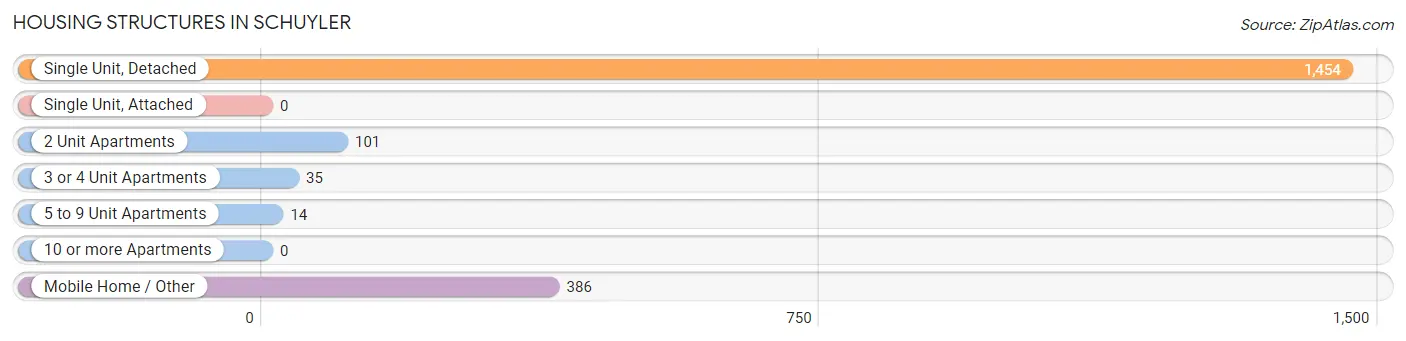
| Structure Type | # Housing Units | % Housing Units |
| Single Unit, Detached | 1,454 | 73.1% |
| Single Unit, Attached | 0 | 0.0% |
| 2 Unit Apartments | 101 | 5.1% |
| 3 or 4 Unit Apartments | 35 | 1.8% |
| 5 to 9 Unit Apartments | 14 | 0.7% |
| 10 or more Apartments | 0 | 0.0% |
| Mobile Home / Other | 386 | 19.4% |
| Total | 1,990 | 100.0% |
Housing Structures by Occupancy in Schuyler
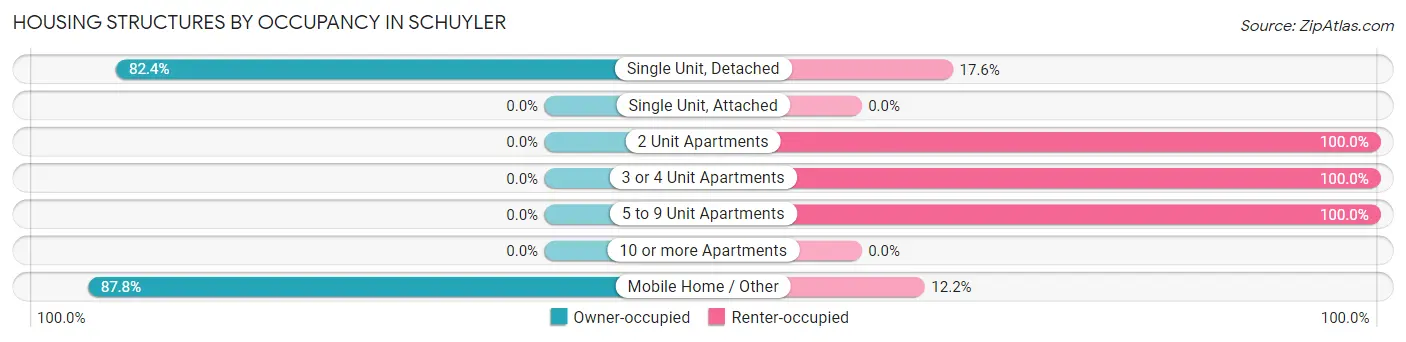
| Structure Type | Owner-occupied | Renter-occupied |
| Single Unit, Detached | 1,198 (82.4%) | 256 (17.6%) |
| Single Unit, Attached | 0 (0.0%) | 0 (0.0%) |
| 2 Unit Apartments | 0 (0.0%) | 101 (100.0%) |
| 3 or 4 Unit Apartments | 0 (0.0%) | 35 (100.0%) |
| 5 to 9 Unit Apartments | 0 (0.0%) | 14 (100.0%) |
| 10 or more Apartments | 0 (0.0%) | 0 (0.0%) |
| Mobile Home / Other | 339 (87.8%) | 47 (12.2%) |
| Total | 1,537 (77.2%) | 453 (22.8%) |
Housing Structures by Number of Rooms in Schuyler
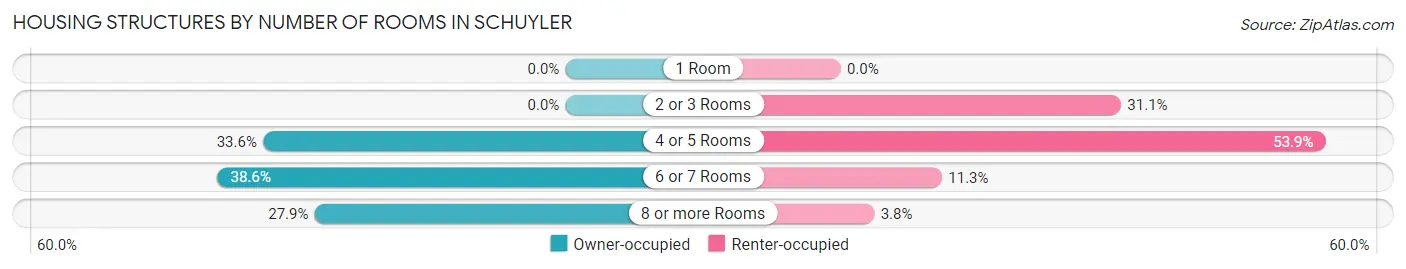
| Number of Rooms | Owner-occupied | Renter-occupied |
| 1 Room | 0 (0.0%) | 0 (0.0%) |
| 2 or 3 Rooms | 0 (0.0%) | 141 (31.1%) |
| 4 or 5 Rooms | 516 (33.6%) | 244 (53.9%) |
| 6 or 7 Rooms | 593 (38.6%) | 51 (11.3%) |
| 8 or more Rooms | 428 (27.9%) | 17 (3.7%) |
| Total | 1,537 (100.0%) | 453 (100.0%) |
Housing Structure by Heating Type in Schuyler
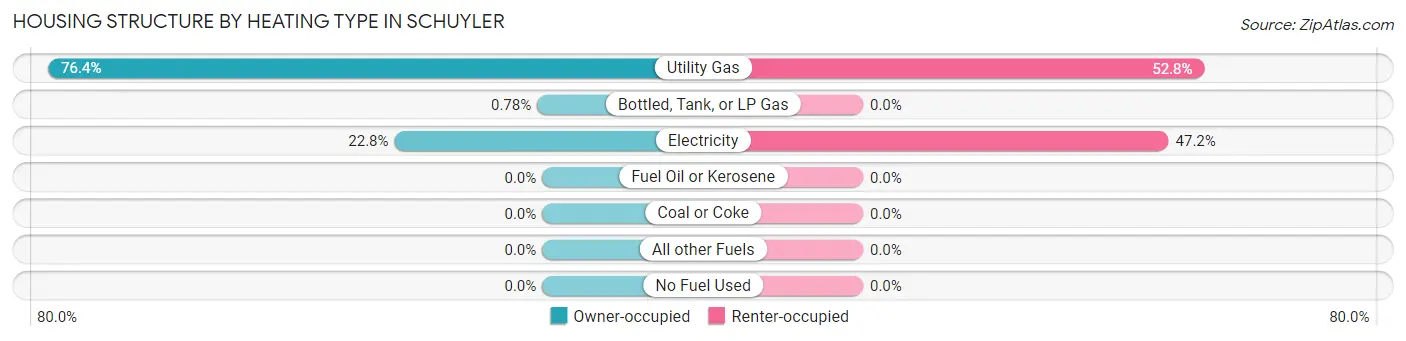
| Heating Type | Owner-occupied | Renter-occupied |
| Utility Gas | 1,174 (76.4%) | 239 (52.8%) |
| Bottled, Tank, or LP Gas | 12 (0.8%) | 0 (0.0%) |
| Electricity | 351 (22.8%) | 214 (47.2%) |
| Fuel Oil or Kerosene | 0 (0.0%) | 0 (0.0%) |
| Coal or Coke | 0 (0.0%) | 0 (0.0%) |
| All other Fuels | 0 (0.0%) | 0 (0.0%) |
| No Fuel Used | 0 (0.0%) | 0 (0.0%) |
| Total | 1,537 (100.0%) | 453 (100.0%) |
Household Vehicle Usage in Schuyler
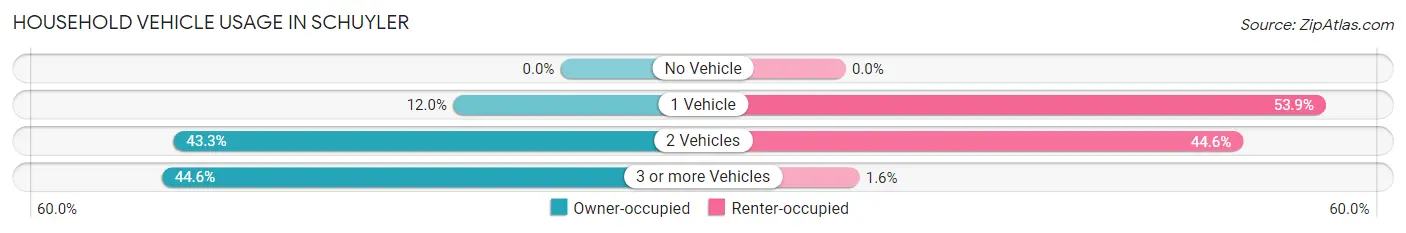
| Vehicles per Household | Owner-occupied | Renter-occupied |
| No Vehicle | 0 (0.0%) | 0 (0.0%) |
| 1 Vehicle | 185 (12.0%) | 244 (53.9%) |
| 2 Vehicles | 666 (43.3%) | 202 (44.6%) |
| 3 or more Vehicles | 686 (44.6%) | 7 (1.5%) |
| Total | 1,537 (100.0%) | 453 (100.0%) |
Real Estate & Mortgages in Schuyler
Real Estate and Mortgage Overview in Schuyler
| Characteristic | Without Mortgage | With Mortgage |
| Housing Units | 868 | 669 |
| Median Property Value | $92,600 | $114,100 |
| Median Household Income | $71,175 | $160 |
| Monthly Housing Costs | $525 | $0 |
| Real Estate Taxes | $1,580 | $45 |
Property Value by Mortgage Status in Schuyler
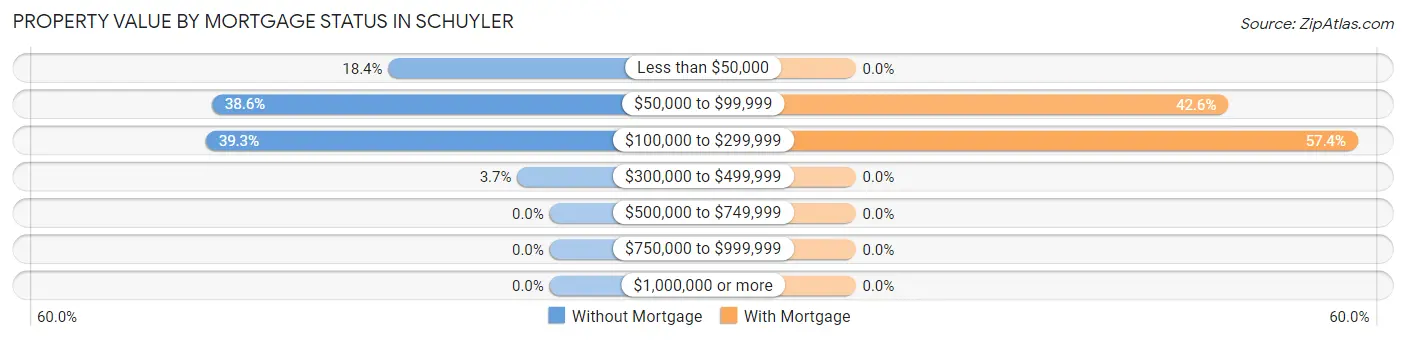
| Property Value | Without Mortgage | With Mortgage |
| Less than $50,000 | 160 (18.4%) | 0 (0.0%) |
| $50,000 to $99,999 | 335 (38.6%) | 285 (42.6%) |
| $100,000 to $299,999 | 341 (39.3%) | 384 (57.4%) |
| $300,000 to $499,999 | 32 (3.7%) | 0 (0.0%) |
| $500,000 to $749,999 | 0 (0.0%) | 0 (0.0%) |
| $750,000 to $999,999 | 0 (0.0%) | 0 (0.0%) |
| $1,000,000 or more | 0 (0.0%) | 0 (0.0%) |
| Total | 868 (100.0%) | 669 (100.0%) |
Household Income by Mortgage Status in Schuyler
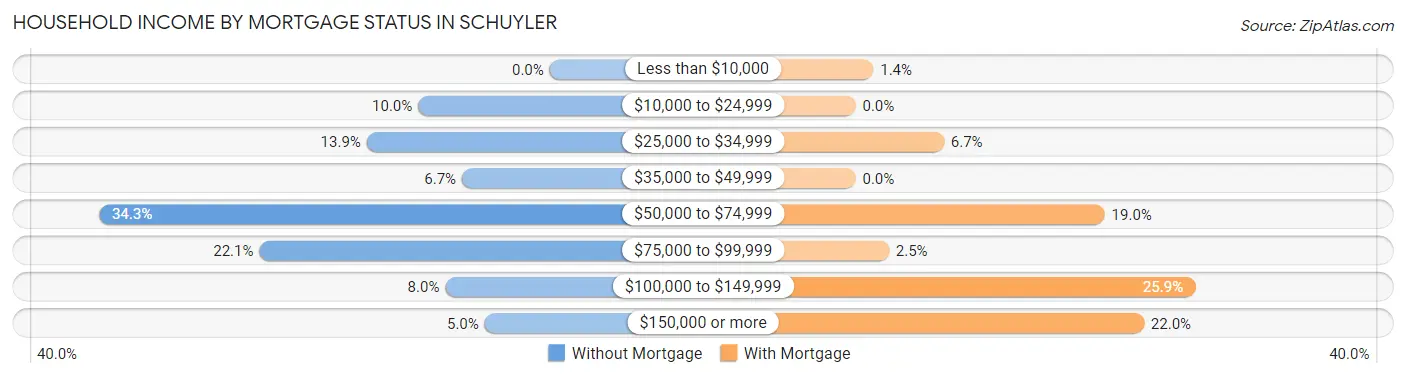
| Household Income | Without Mortgage | With Mortgage |
| Less than $10,000 | 0 (0.0%) | 9 (1.3%) |
| $10,000 to $24,999 | 87 (10.0%) | 0 (0.0%) |
| $25,000 to $34,999 | 121 (13.9%) | 45 (6.7%) |
| $35,000 to $49,999 | 58 (6.7%) | 0 (0.0%) |
| $50,000 to $74,999 | 298 (34.3%) | 127 (19.0%) |
| $75,000 to $99,999 | 192 (22.1%) | 17 (2.5%) |
| $100,000 to $149,999 | 69 (8.0%) | 173 (25.9%) |
| $150,000 or more | 43 (5.0%) | 147 (22.0%) |
| Total | 868 (100.0%) | 669 (100.0%) |
Property Value to Household Income Ratio in Schuyler
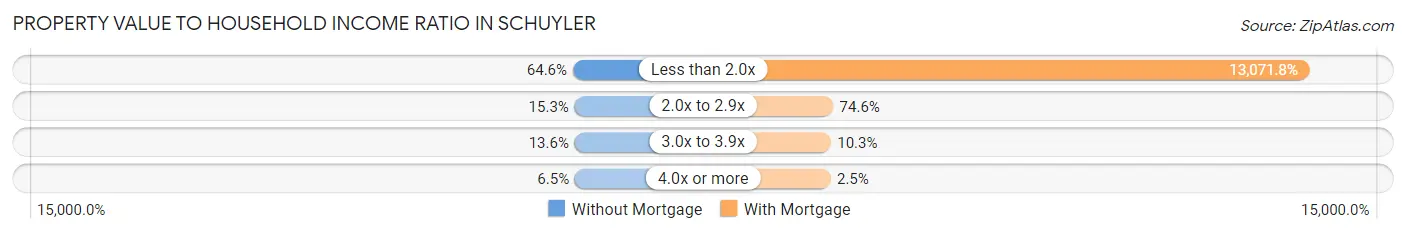
| Value-to-Income Ratio | Without Mortgage | With Mortgage |
| Less than 2.0x | 561 (64.6%) | 87,450 (13,071.8%) |
| 2.0x to 2.9x | 133 (15.3%) | 499 (74.6%) |
| 3.0x to 3.9x | 118 (13.6%) | 69 (10.3%) |
| 4.0x or more | 56 (6.5%) | 17 (2.5%) |
| Total | 868 (100.0%) | 669 (100.0%) |
Real Estate Taxes by Mortgage Status in Schuyler
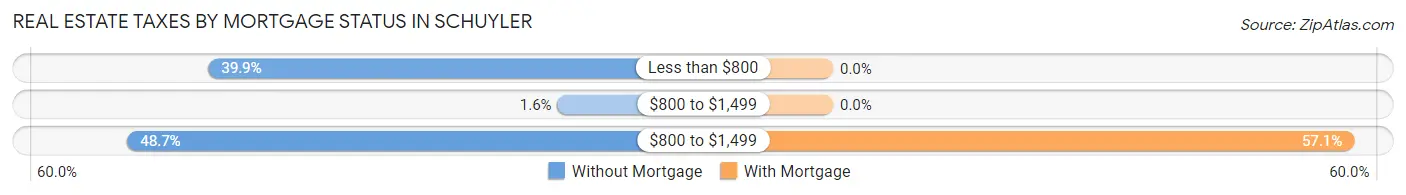
| Property Taxes | Without Mortgage | With Mortgage |
| Less than $800 | 346 (39.9%) | 0 (0.0%) |
| $800 to $1,499 | 14 (1.6%) | 0 (0.0%) |
| $800 to $1,499 | 423 (48.7%) | 382 (57.1%) |
| Total | 868 (100.0%) | 669 (100.0%) |
Health & Disability in Schuyler
Health Insurance Coverage by Age in Schuyler
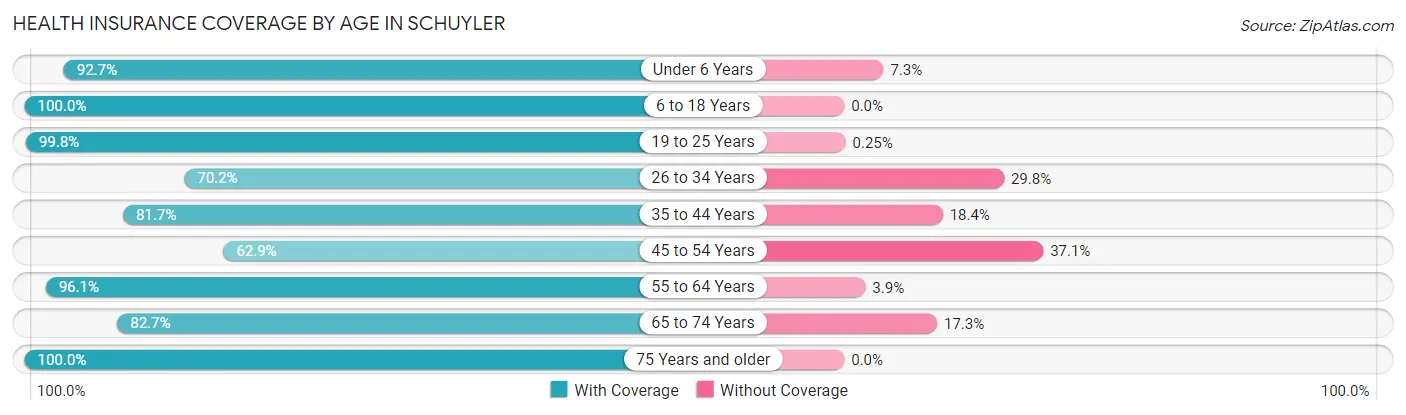
| Age Bracket | With Coverage | Without Coverage |
| Under 6 Years | 685 (92.7%) | 54 (7.3%) |
| 6 to 18 Years | 1,524 (100.0%) | 0 (0.0%) |
| 19 to 25 Years | 394 (99.8%) | 1 (0.3%) |
| 26 to 34 Years | 481 (70.2%) | 204 (29.8%) |
| 35 to 44 Years | 476 (81.7%) | 107 (18.3%) |
| 45 to 54 Years | 753 (62.9%) | 444 (37.1%) |
| 55 to 64 Years | 731 (96.1%) | 30 (3.9%) |
| 65 to 74 Years | 354 (82.7%) | 74 (17.3%) |
| 75 Years and older | 87 (100.0%) | 0 (0.0%) |
| Total | 5,485 (85.7%) | 914 (14.3%) |
Health Insurance Coverage by Citizenship Status in Schuyler
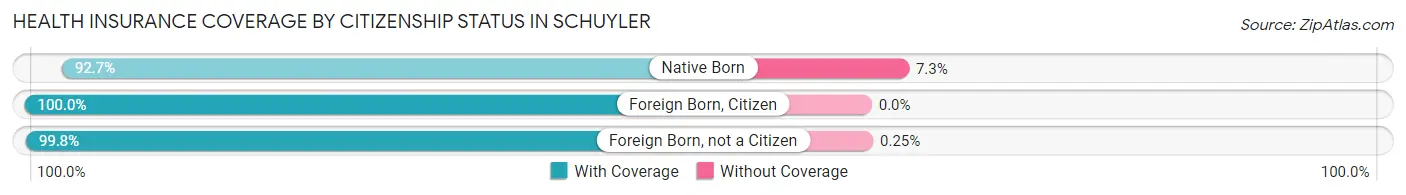
| Citizenship Status | With Coverage | Without Coverage |
| Native Born | 685 (92.7%) | 54 (7.3%) |
| Foreign Born, Citizen | 1,524 (100.0%) | 0 (0.0%) |
| Foreign Born, not a Citizen | 394 (99.8%) | 1 (0.3%) |
Health Insurance Coverage by Household Income in Schuyler
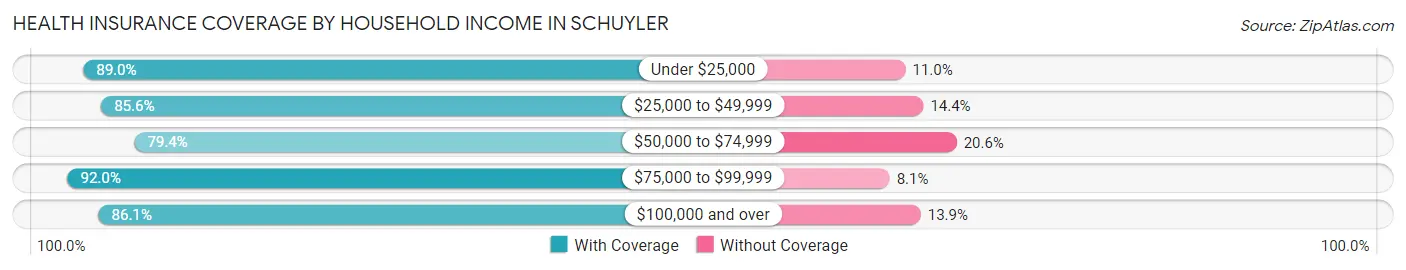
| Household Income | With Coverage | Without Coverage |
| Under $25,000 | 178 (89.0%) | 22 (11.0%) |
| $25,000 to $49,999 | 1,217 (85.6%) | 204 (14.4%) |
| $50,000 to $74,999 | 1,111 (79.4%) | 288 (20.6%) |
| $75,000 to $99,999 | 1,085 (91.9%) | 95 (8.1%) |
| $100,000 and over | 1,894 (86.1%) | 305 (13.9%) |
Public vs Private Health Insurance Coverage by Age in Schuyler
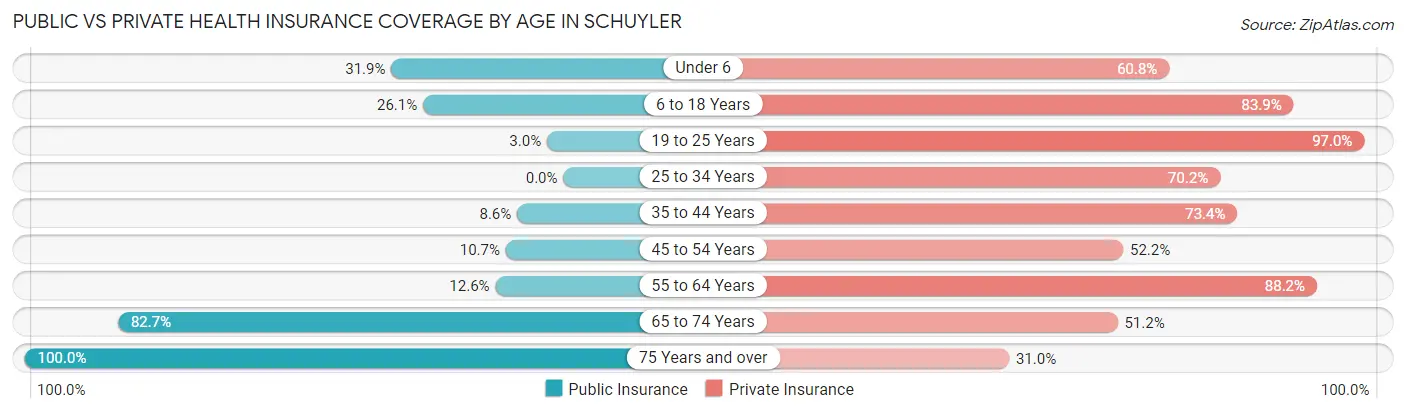
| Age Bracket | Public Insurance | Private Insurance |
| Under 6 | 236 (31.9%) | 449 (60.8%) |
| 6 to 18 Years | 397 (26.1%) | 1,278 (83.9%) |
| 19 to 25 Years | 12 (3.0%) | 383 (97.0%) |
| 25 to 34 Years | 0 (0.0%) | 481 (70.2%) |
| 35 to 44 Years | 50 (8.6%) | 428 (73.4%) |
| 45 to 54 Years | 128 (10.7%) | 625 (52.2%) |
| 55 to 64 Years | 96 (12.6%) | 671 (88.2%) |
| 65 to 74 Years | 354 (82.7%) | 219 (51.2%) |
| 75 Years and over | 87 (100.0%) | 27 (31.0%) |
| Total | 1,360 (21.2%) | 4,561 (71.3%) |
Disability Status by Sex by Age in Schuyler
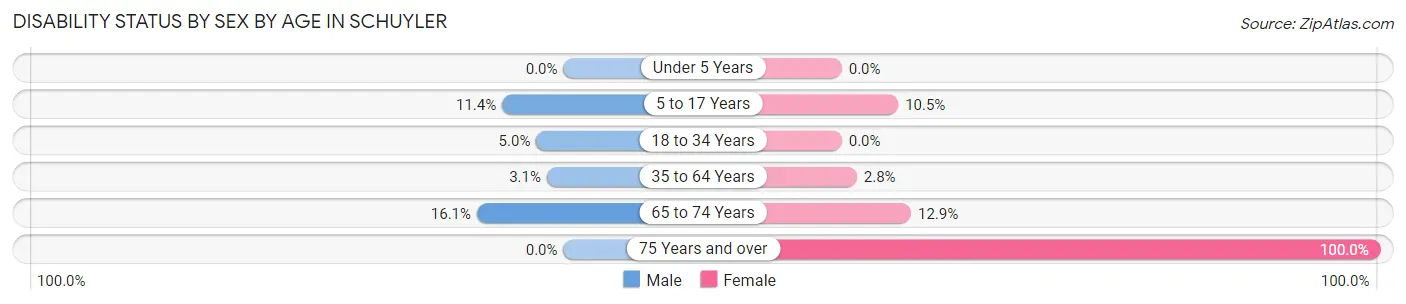
| Age Bracket | Male | Female |
| Under 5 Years | 0 (0.0%) | 0 (0.0%) |
| 5 to 17 Years | 94 (11.4%) | 74 (10.5%) |
| 18 to 34 Years | 34 (5.0%) | 0 (0.0%) |
| 35 to 64 Years | 44 (3.1%) | 31 (2.8%) |
| 65 to 74 Years | 40 (16.1%) | 23 (12.9%) |
| 75 Years and over | 0 (0.0%) | 27 (100.0%) |
Disability Class by Sex by Age in Schuyler
Disability Class: Hearing Difficulty
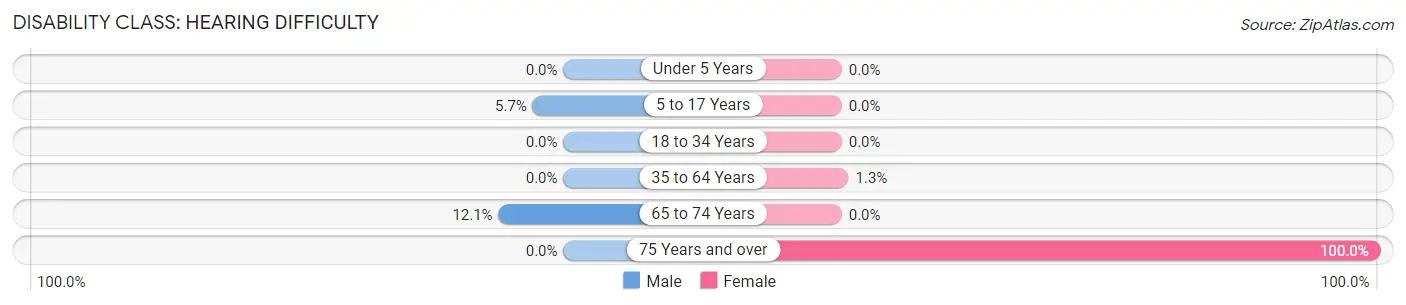
| Age Bracket | Male | Female |
| Under 5 Years | 0 (0.0%) | 0 (0.0%) |
| 5 to 17 Years | 47 (5.7%) | 0 (0.0%) |
| 18 to 34 Years | 0 (0.0%) | 0 (0.0%) |
| 35 to 64 Years | 0 (0.0%) | 14 (1.3%) |
| 65 to 74 Years | 30 (12.0%) | 0 (0.0%) |
| 75 Years and over | 0 (0.0%) | 27 (100.0%) |
Disability Class: Vision Difficulty
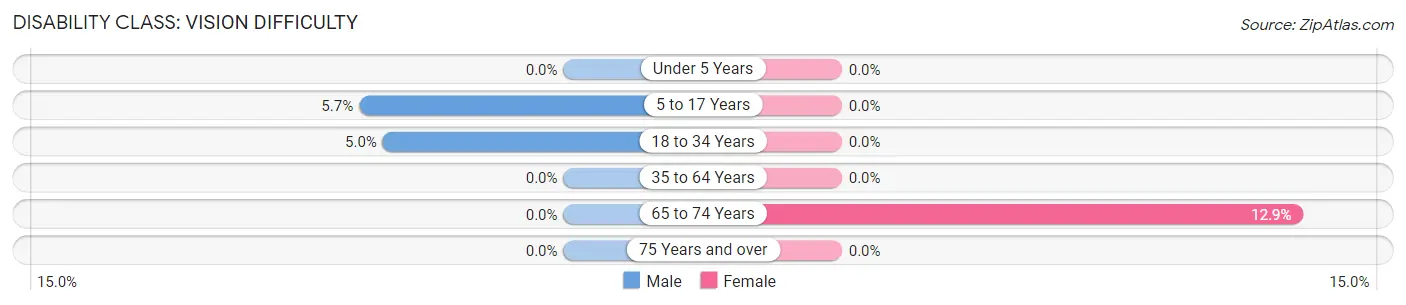
| Age Bracket | Male | Female |
| Under 5 Years | 0 (0.0%) | 0 (0.0%) |
| 5 to 17 Years | 47 (5.7%) | 0 (0.0%) |
| 18 to 34 Years | 34 (5.0%) | 0 (0.0%) |
| 35 to 64 Years | 0 (0.0%) | 0 (0.0%) |
| 65 to 74 Years | 0 (0.0%) | 23 (12.9%) |
| 75 Years and over | 0 (0.0%) | 0 (0.0%) |
Disability Class: Cognitive Difficulty
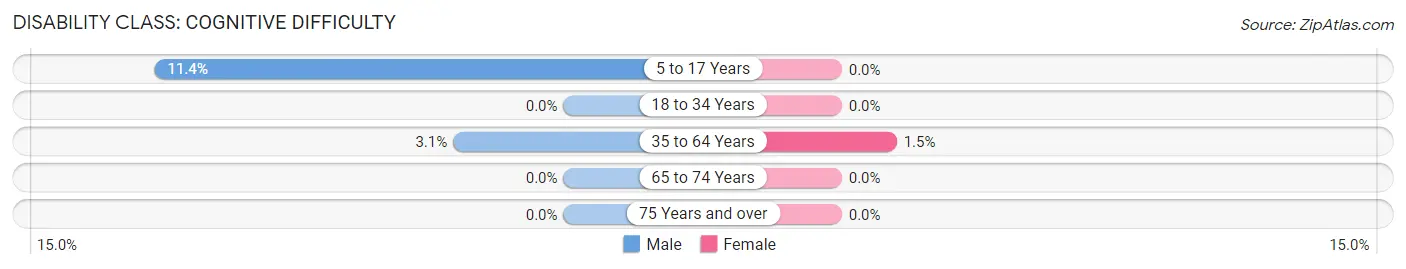
| Age Bracket | Male | Female |
| 5 to 17 Years | 94 (11.4%) | 0 (0.0%) |
| 18 to 34 Years | 0 (0.0%) | 0 (0.0%) |
| 35 to 64 Years | 44 (3.1%) | 17 (1.5%) |
| 65 to 74 Years | 0 (0.0%) | 0 (0.0%) |
| 75 Years and over | 0 (0.0%) | 0 (0.0%) |
Disability Class: Ambulatory Difficulty
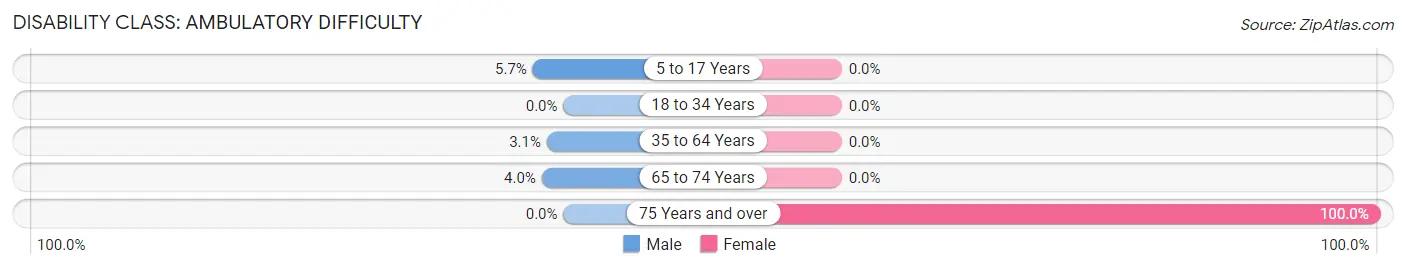
| Age Bracket | Male | Female |
| 5 to 17 Years | 47 (5.7%) | 0 (0.0%) |
| 18 to 34 Years | 0 (0.0%) | 0 (0.0%) |
| 35 to 64 Years | 44 (3.1%) | 0 (0.0%) |
| 65 to 74 Years | 10 (4.0%) | 0 (0.0%) |
| 75 Years and over | 0 (0.0%) | 27 (100.0%) |
Disability Class: Self-Care Difficulty
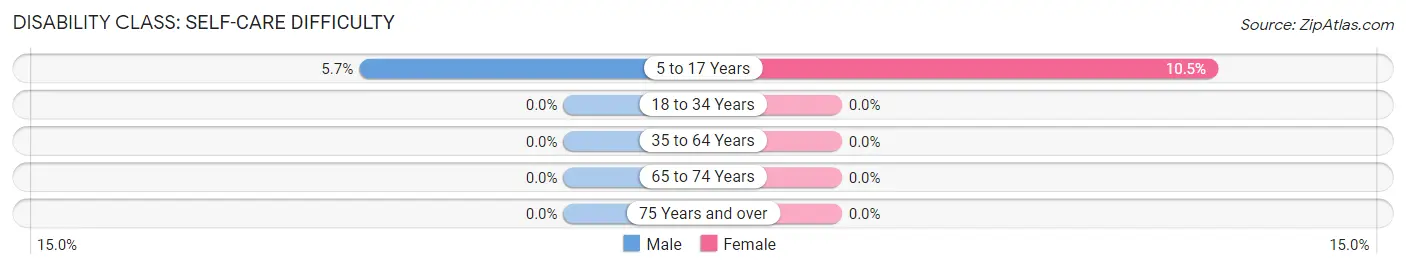
| Age Bracket | Male | Female |
| 5 to 17 Years | 47 (5.7%) | 74 (10.5%) |
| 18 to 34 Years | 0 (0.0%) | 0 (0.0%) |
| 35 to 64 Years | 0 (0.0%) | 0 (0.0%) |
| 65 to 74 Years | 0 (0.0%) | 0 (0.0%) |
| 75 Years and over | 0 (0.0%) | 0 (0.0%) |
Technology Access in Schuyler
Computing Device Access in Schuyler
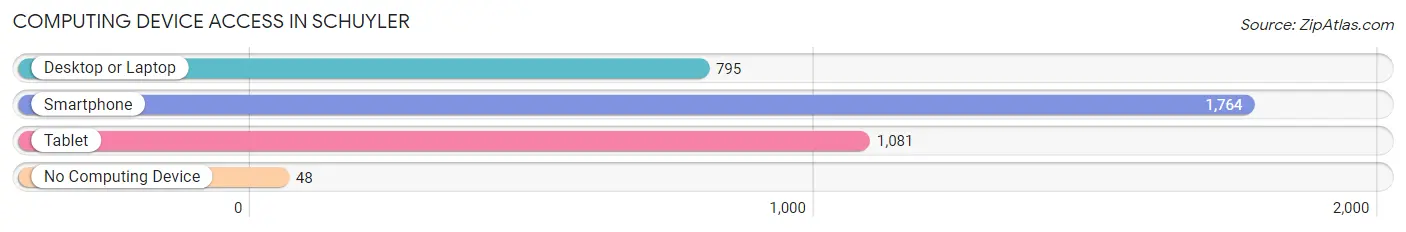
| Device Type | # Households | % Households |
| Desktop or Laptop | 795 | 40.0% |
| Smartphone | 1,764 | 88.6% |
| Tablet | 1,081 | 54.3% |
| No Computing Device | 48 | 2.4% |
| Total | 1,990 | 100.0% |
Internet Access in Schuyler
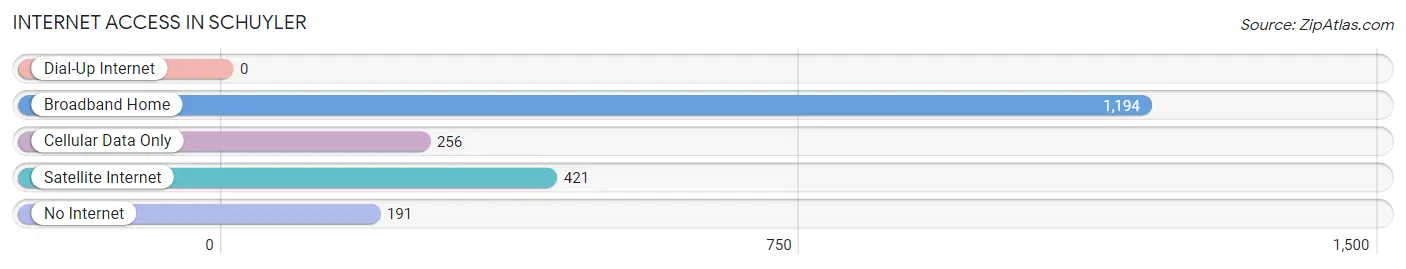
| Internet Type | # Households | % Households |
| Dial-Up Internet | 0 | 0.0% |
| Broadband Home | 1,194 | 60.0% |
| Cellular Data Only | 256 | 12.9% |
| Satellite Internet | 421 | 21.2% |
| No Internet | 191 | 9.6% |
| Total | 1,990 | 100.0% |
Schuyler Summary
Schuyler, Nebraska is a city located in Colfax County in the northeastern part of the state. It is situated along the Platte River, and is part of the Omaha-Council Bluffs metropolitan area. The city has a population of approximately 6,000 people, and is the county seat of Colfax County.
History
Schuyler was founded in 1856 by a group of German immigrants led by John Schuyler, who had come to the area from Pennsylvania. The city was originally named Schuyler City, but was later changed to Schuyler. The city was incorporated in 1873, and has since grown to become the largest city in Colfax County.
Geography
Schuyler is located in the northeastern part of Nebraska, along the Platte River. It is situated at an elevation of 1,717 feet (524 m) above sea level. The city covers an area of 4.2 square miles (10.8 km2), and is located approximately 40 miles (64 km) northwest of Omaha.
Economy
Schuyler’s economy is largely based on agriculture and manufacturing. The city is home to several large agricultural companies, including Cargill, Inc., and Tyson Foods. The city also has a number of manufacturing companies, including Schuyler Manufacturing, which produces agricultural equipment, and Schuyler Plastics, which produces plastic products.
Demographics
As of the 2010 census, Schuyler had a population of 6,211 people. The racial makeup of the city was 79.2% White, 0.7% African American, 0.3% Native American, 0.7% Asian, 0.1% Pacific Islander, 16.2% from other races, and 2.9% from two or more races. Hispanic or Latino of any race were 33.2% of the population.
The median income for a household in Schuyler was $37,917, and the median income for a family was $45,938. The per capita income for the city was $17,845. About 16.2% of families and 19.2% of the population were below the poverty line, including 25.2% of those under age 18 and 11.2% of those age 65 or over.
Schuyler is a diverse city with a rich history and a vibrant economy. The city is home to a number of large agricultural and manufacturing companies, and has a population that is diverse in terms of race and ethnicity. The city is also home to a number of parks and recreational facilities, making it an attractive place to live and work.
Common Questions
What is Per Capita Income in Schuyler?
Per Capita income in Schuyler is $25,687.
What is the Median Family Income in Schuyler?
Median Family Income in Schuyler is $71,231.
What is the Median Household income in Schuyler?
Median Household Income in Schuyler is $71,275.
What is Income or Wage Gap in Schuyler?
Income or Wage Gap in Schuyler is 5.4%.
Women in Schuyler earn 94.6 cents for every dollar earned by a man.
What is Inequality or Gini Index in Schuyler?
Inequality or Gini Index in Schuyler is 0.37.
What is the Total Population of Schuyler?
Total Population of Schuyler is 6,516.
What is the Total Male Population of Schuyler?
Total Male Population of Schuyler is 3,638.
What is the Total Female Population of Schuyler?
Total Female Population of Schuyler is 2,878.
What is the Ratio of Males per 100 Females in Schuyler?
There are 126.41 Males per 100 Females in Schuyler.
What is the Ratio of Females per 100 Males in Schuyler?
There are 79.11 Females per 100 Males in Schuyler.
What is the Median Population Age in Schuyler?
Median Population Age in Schuyler is 33.5 Years.
What is the Average Family Size in Schuyler
Average Family Size in Schuyler is 3.4 People.
What is the Average Household Size in Schuyler
Average Household Size in Schuyler is 3.3 People.
How Large is the Labor Force in Schuyler?
There are 3,388 People in the Labor Forcein in Schuyler.
What is the Percentage of People in the Labor Force in Schuyler?
74.7% of People are in the Labor Force in Schuyler.
What is the Unemployment Rate in Schuyler?
Unemployment Rate in Schuyler is 2.0%.